1. Introduction
1.1. Material Resource Use
The extraction, processing, and use of raw materials for the provision of products, services, and infrastructures lead to environmental impacts on the input and output side of the technosphere [
1]. Due to global economic growth and a rising world population, the demand for raw materials is expected to increase in the future [
2]. The decoupling of socio-economic development from resource use is widely regarded as a prerequisite to reach the Sustainable Development Goals (SDGs), in particular SDG 8 and SDG 12, and to effectively approach the climate targets [
3]. Towards this end, resource and climate footprints across scales are important indicators for monitoring and policy design [
4]. European and national initiatives, such as The European Green Deal [
5] or the German Resource Efficiency Programme [
6], have formulated measures to design the production, use, and recycling of products towards a more circular economy to minimize the use of primary raw materials extracted from the environment.
Three material input flows are important for assessing the material use for products and services, each measured according to the intended service per functional unit (FU). First, the flow of used abiotic and biotic materials in production is assessed. In life cycle assessment (LCA), the amount of materials are determined during the life cycle inventory (LCI) phase, e.g., the amount of copper or sawnwood used in production. Second, the input flow of abiotic and biotic raw materials, e.g., the amount of copper ore or roundwood, which is processed to provide the abiotic and biotic materials for production, is assessed. Third, the flow of primary materials, which are taken from the abiotic material resources, e.g., a copper ore deposit, or from the biotic material resources, e.g., a tree population in a forest, is assessed.
The extent of the total extraction of primary materials determines the loss of local in situ ecosystem services and life-supporting functions [
7,
8,
9,
10,
11]. After extraction, the primary material is separated into a used and unused part. The used part comprises the raw materials, which have an economic value. The unused part of the extracted primary materials has no economic value and is deposited within nature, e.g., overburden from copper mining or cut tree branches from logging. The deposition of the unused extraction changes the state and the condition of the affected natural systems, such as soil, water, and air [
12,
13,
14,
15]. Extraction and deposition transform the affected natural ecosystems and lead to direct and indirect environmental impacts such as landscape changes, destruction of vegetation, disturbance of the local hydrological state, and biodiversity losses [
16,
17,
18,
19,
20,
21].
The effects of abiotic primary materials’ extraction during mining may have a limited horizontal extension, although the transformations are quite profound in the vertical dimension. The effects of biotic extraction, in particular by agriculture and forestry, are less ‘deep’ but more extended in the horizontal dimension. Especially, the cultivated landscape remains significantly changed (standing biomass, carbon content of soils, water-holding capacity of soils, erosion, evapotranspiration, groundwater level, biodiversity, etc.) compared to the natural situation without human activities.
1.2. Assessing Material Resource Use in LCA
For many years, there has been an intensive discussion in LCA about which areas of protection (AoP) should be assessed [
22]. While there is a broad consensus on the consideration of human health and natural ecosystems as AoP, the questions if and why resources should be considered as an AoP are controversially discussed [
23,
24,
25].
The following lines of argumentation have been pursued: (A) Resources are worth protecting per se because every extraction process of a resource is associated with potentially risky impacts on natural systems; (B) because the increased use of resources reduces the quality of the existing supply, so that their future extraction is associated with increased environmental impacts; (C) because of the consequences of temporal or permanent loss of the functional values of a resource, caused by its use in production; and (D) because current resource use should not restrict the use for the benefit of future generations [
26,
27,
28,
29,
30,
31,
32,
33,
34].
Depending on the argument raised, different approaches, target questions, and indicators have emerged for operationalizing the impact assessment of resource use. In LCA, impact indicators can be defined along the complete cause-effect chain from environmental pressures and change in the state of the relevant environmental up to the final damage to the AoP. Endpoint indicators are provided by a damage approach at the level of AoP. All other indicators that are measured along the cause-effect chain and represent environmental pressures are referred to as midpoint indicators [
35,
36].
Although elementary flows are essential elements for the calculation of indicators in LCA [
37], there are many shortcomings in flow clarity, consistency, and extensibility [
38]. While elemental flows related to abiotic materials, also referred to as “resources, in ground”, are already widely considered in LCA databases, elemental flows related to biotic materials are rarely available. Ecoinvent considers, e.g., roundwood as an elementary flow from forestry but no flows from agriculture or fisheries [
39].
1.3. Product Material Footprint
The product material footprint (PMF) was defined to estimate the impacts on natural systems caused by primary material extraction and the subsequent impacts caused by the use of raw materials for products, infrastructures, and services. The PMF indicates the quantities of abiotic and biotic primary materials that are extracted from nature, the lithosphere, and the biosphere, or moved within it by technological means. The material use is measured throughout the complete life cycle per FU. The central element of the characterization model is the extraction, separation, and deposition of primary materials [
27]. As the PMF should account for the use of all abiotic and biotic material resources, all material flows are considered that are linked to the extraction of primary materials by the help of technology. Water and air are not accounted for in the PMF as they are not considered material flows.
The primary materials are the basis for the raw materials, which provide materials for production and consumption. Therefore, two indicators are applied to determine the magnitude of the environmental impacts of material resource use, which are the total material requirement (TMR) and the raw material input (RMI). Both indicators are derived from economy-wide material flow accounting (ewMFA) [
40]. The TMR assesses the quantities of primary abiotic and biotic material extracted from the material resources and the RMI assesses the quantities of raw materials used in the economy [
41,
42]. Thus, TMR and RMI are turnover-based environmental impact indicators and midpoint indicators in the sense of LCA. For both indicators, at least the abiotic and biotic material parts should be calculated separately.
The TMR
biotic measures the total amount of biotic primary material required over the complete life cycle for the provision of the FU, as the sum of all extracted biotic primary materials by agriculture, forestry, and fisheries:
Only a part of the harvested or caught primary biotic materials, measured by the TMR biotic, is used in production and consumption. The part of the biotic primary materials, with no economic value, e.g., husk, tree branches, or bycatch, is separated from the used extraction and deposited within the environment as unused extraction.
The used part of the primary biotic materials includes the biotic raw materials, which enter the economy, e.g., crops, fodder crops or grazed biomass, roundwood, or fish, to be further processed as biotic materials for production and consumption, such as grains, sawnwood, or fish filet. Therefore, the RMI
biotic measures the total amount of biotic raw materials required over the complete life cycle for the provision of the FU, as the sum of all biotic raw materials sold by agriculture, forestry, and fisheries:
In LCA, the indicators are calculated based on characterization factors (CFs). The CF TMR derived for the determination of the TMR represents the allocated amount of primary materials extracted for the provision of 1 kg of used material. The characterization factor CF RMI derived for the determination of the RMI represents the allocated amount of raw materials for the provision of 1 kg of used material.
The TMR measures the total amount of primary materials (used and unused) extracted along the complete life cycle per FU. The mass turnover of primary material extraction determines the magnitude of local to regional changes in the natural environment. The RMI measures the used part of the primary materials, i.e., the input of abiotic and biotic raw materials for products, infrastructures, and services along the complete life cycle per FU. The mass input of raw material determines the amount of waste and emissions that will be generated elsewhere along the production–consumption–recycling–disposal chain and the associated bundle of environmental impacts on air, water, and soil.
So far, the PMF has been developed as an input-oriented life cycle impact assessment (LCIA) method to measure the RMI
abiotic and TMR
abiotic. For the implementation with the ecoinvent database, the values of the CF
RMI abiotic and CF
TMR abiotic are assigned to the elementary flows from “resources, in ground”. The ecoinvent database (version 3.5) has 143 elementary flows “resource, in ground”, covering 78 different abiotic materials [
27].
Another indicator was proposed to determine the life-cycle-wide raw material input, namely the cumulative raw material demand (CRD) as the ‘total of primary raw materials including energy raw materials used for the manufacture and transport of a product along the value chain’ by the association of German engineers [
43] (p. 5). Thus, the definition does not seem to fundamentally differ from that of the RMI. However, the current version of the guideline excludes ‘agriculturally/horticulturally grown/cultivated or cultivated biotic raw materials’ [
43] (p. 5), which means that, especially, the biotic parts of RMI and CRD differ greatly in their results.
The aim of this research is to set up a framework for the assessment of the biotic part of the PMF. This is the first comprehensive analysis comparing different material input indicators in terms of their interpretation and practicality for the life-cycle-wide assessment of biotic material resource use. The indicator concepts of TMR, RMI, and CRD are compared by defining the system boundaries to determine the biotic parts CRD biotic, RMI biotic, and TMR biotic. The application of the indicators is tested by means of a case study from agriculture. Forestry and fisheries are basically considered in the defined conceptual approaches. A simple LCA study is conducted by setting up a process model for the production of wheat bread. An extended version of the LCIA method PMF is applied, which considers not only the use of abiotic but also biotic material resources. The calculation uses the software openLCA with the ecoinvent database to compare the indicator results.
This research helps to discuss and answer the following research questions:
How do the three indicators CRD, RMI, and TMR differ with regard to their specific target questions and system boundaries?
Which input flows should be taken into account and which could be neglected?
Which of the three indicators CRD, RMI, and TMR is best suited for calculating the material footprint considering the biotic materials in life-cycle-wide analyses?
2. Materials and Methods
2.1. Measuring Biotic Material Use
The PMF should measure (1) the amount of extracted abiotic and biotic primary materials that is taken from the abiotic and biotic material resources and (2) the part of the extracted material that is separated and transferred into the technosphere as abiotic and biotic raw material. The biotic material resources are all living organisms in nature, e.g., plants, trees, and wild fish, or living organisms cultivated or bred by humans. The primary biotic material is extracted by harvesting, logging, or catching to provide biotic raw material. In addition, the biomass that is disturbed by humans, e.g., clearing by slash and burn, should also be taken into account.
Biotic material resource use covers the extraction of biotic primary materials from natural and cultivated areas. In agriculture, this includes all crops, including harvest residues, and all biomass harvested in the form of plants, including fungi, and the fodder eaten by farm animals [
44]. In the forestry sector, the total production of roundwood, which is divided into coniferous and non-coniferous wood, including the woody forest residues that remain in the forest, is accounted for. In the fisheries sector, this includes all plants harvested and animals caught in open water and fish farms, including the bycatch [
45].
Regardless of whether biotic material resources are naturally occurring or cultivated, the extraction of biotic primary materials, the deposition of the unused extraction, and the production and processing of biotic raw materials are associated with the accumulation of environmental pressures and should be considered in LCIA.
2.2. System Boundary Options
To delineate an appropriate system boundary, the question has to be answered whether the PMF should only comprise biomass extraction from the wilderness or also account for primary biotic materials from cultivated biotic material resources, i.e., biomass cultivated by agriculture on open fields. Today, most of the biomass production for food and materials takes place on cultivated cropland, pastures, or managed forest land. There are two major options:
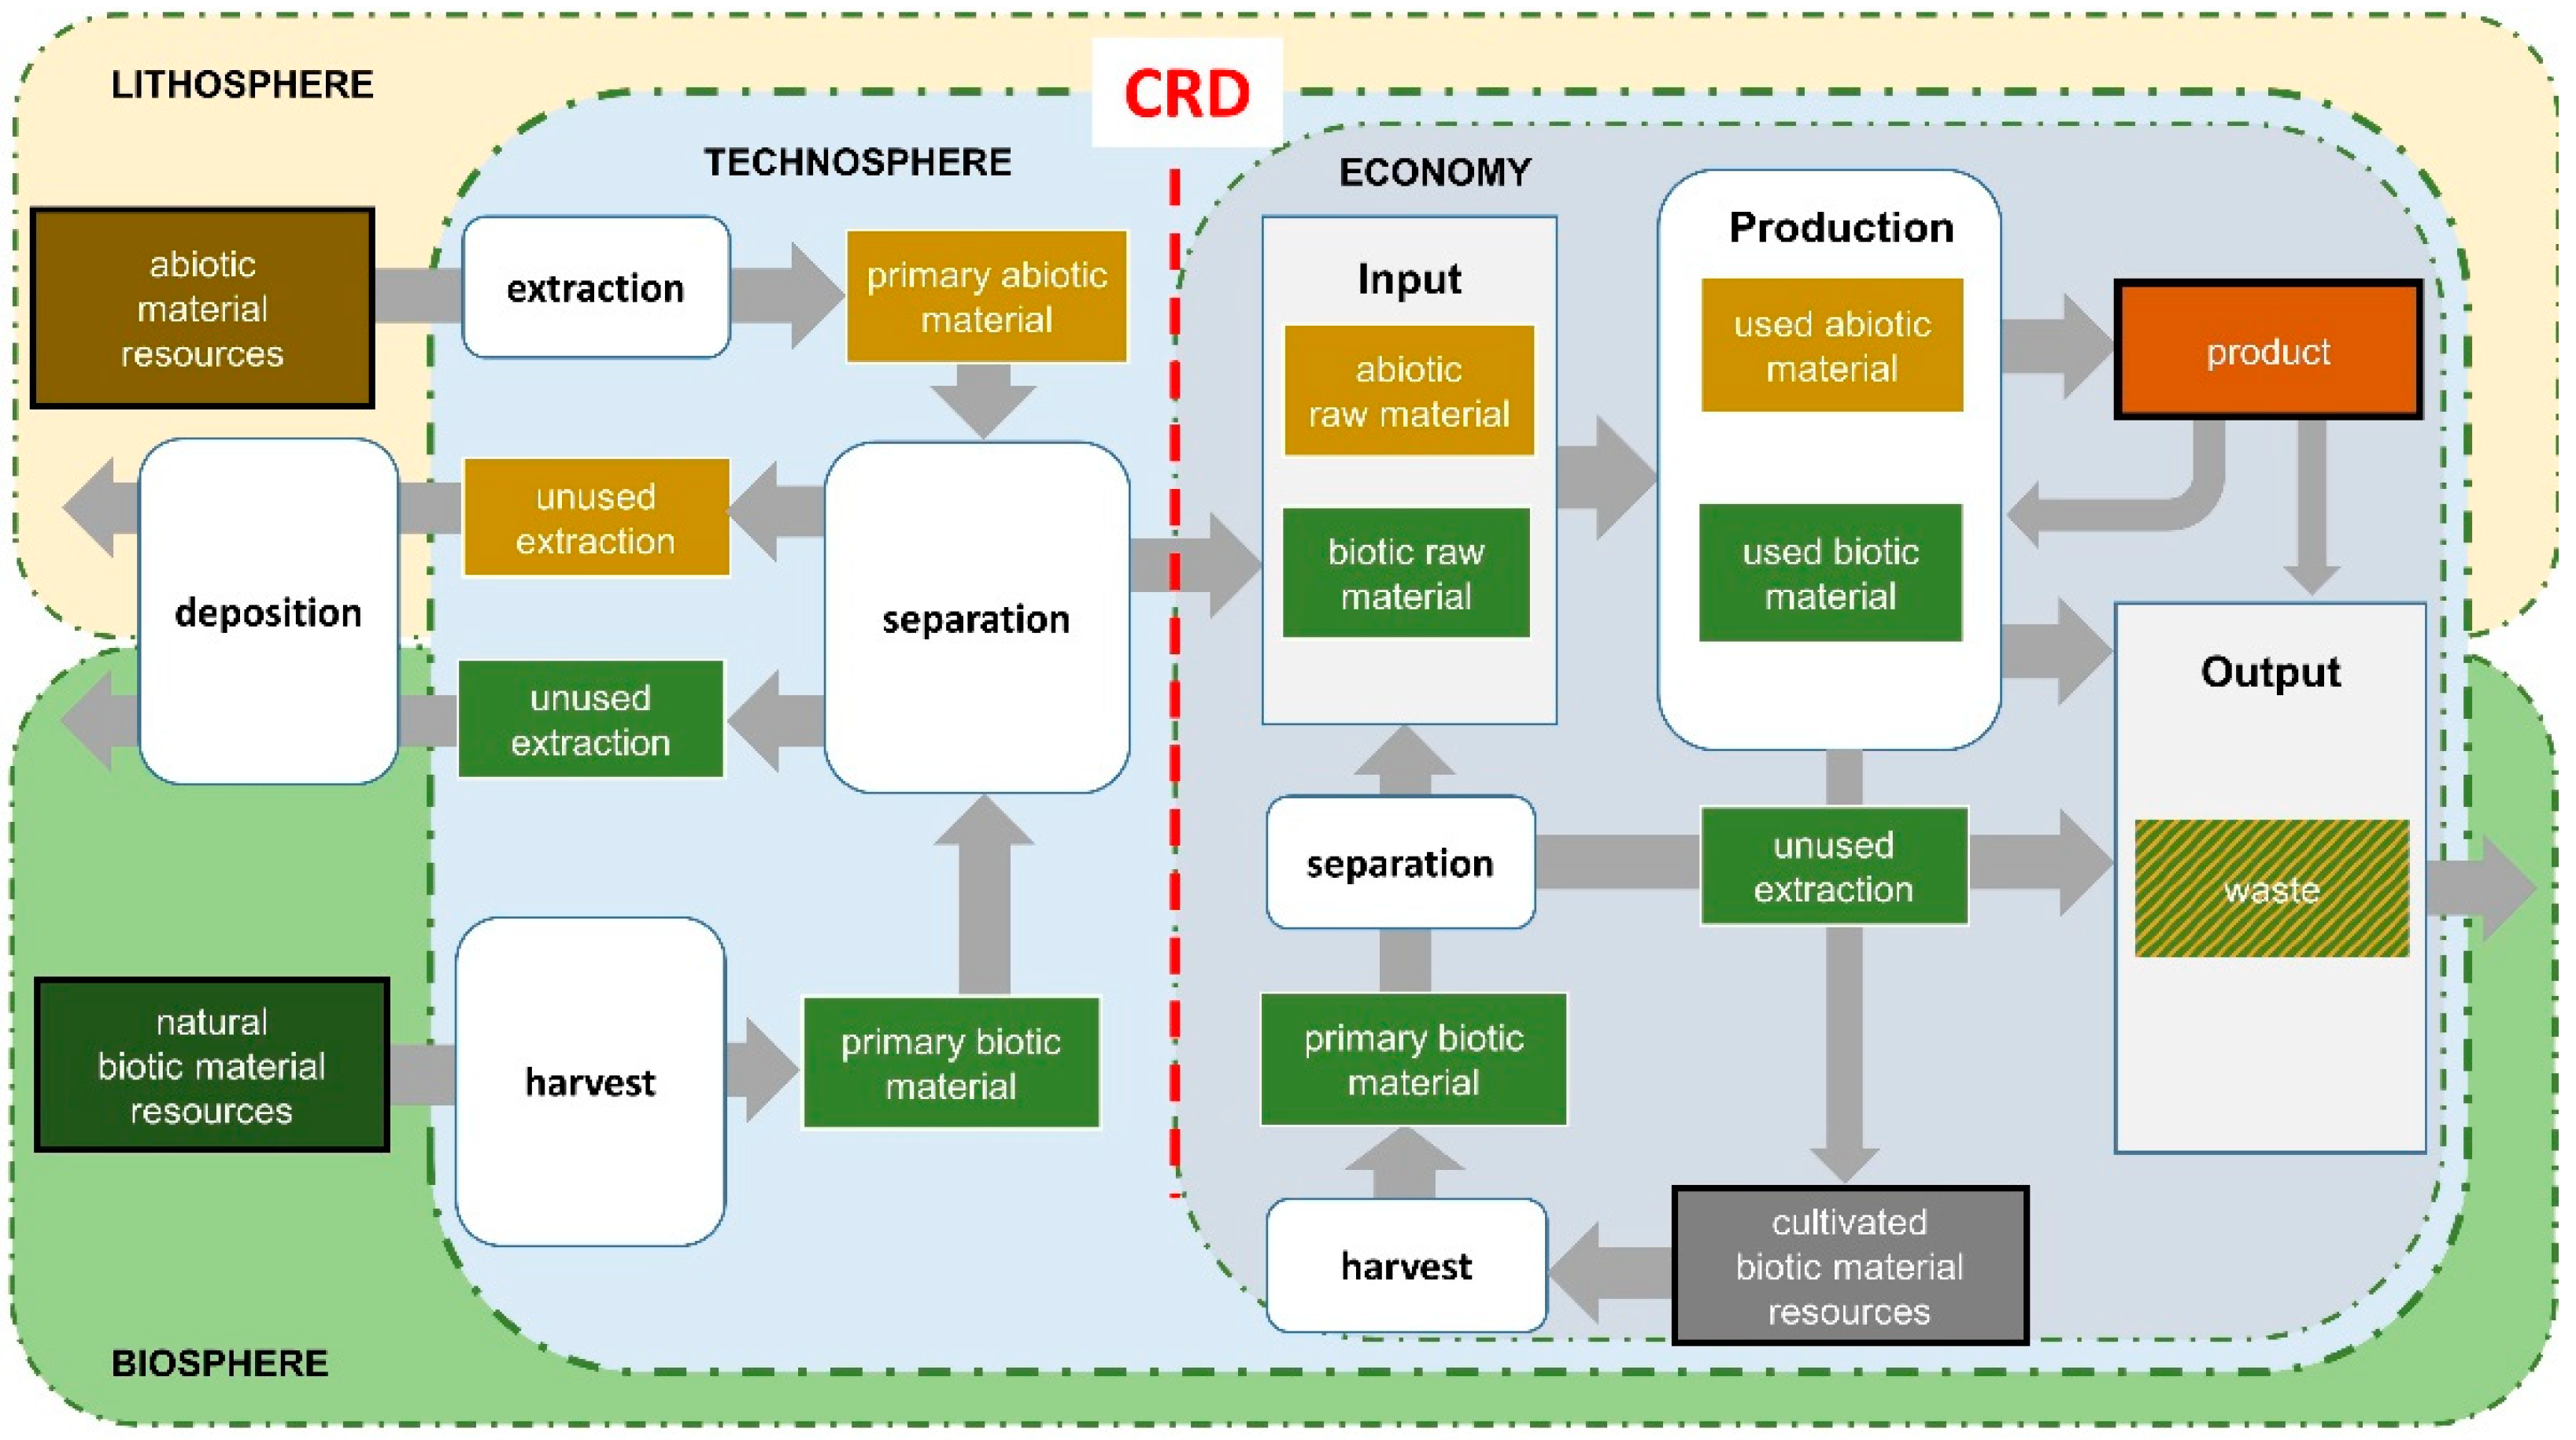
First option: The cultivated biotic resources are considered part of the economy (
Figure 1).
In this case, the input flows of the biotic raw materials, harvested from the cultivated biotic material resources (grey box), do not cross the system boundary between nature and the economy or technosphere and, therefore, are not accounted for. Only the primary abiotic materials extracted for the used abiotic materials, e.g., for fertilizer or fuels, and the biotic raw material, extracted from the natural biotic material resources (green box), would be calculated. This would argue for the use of the CRD as an indicator.
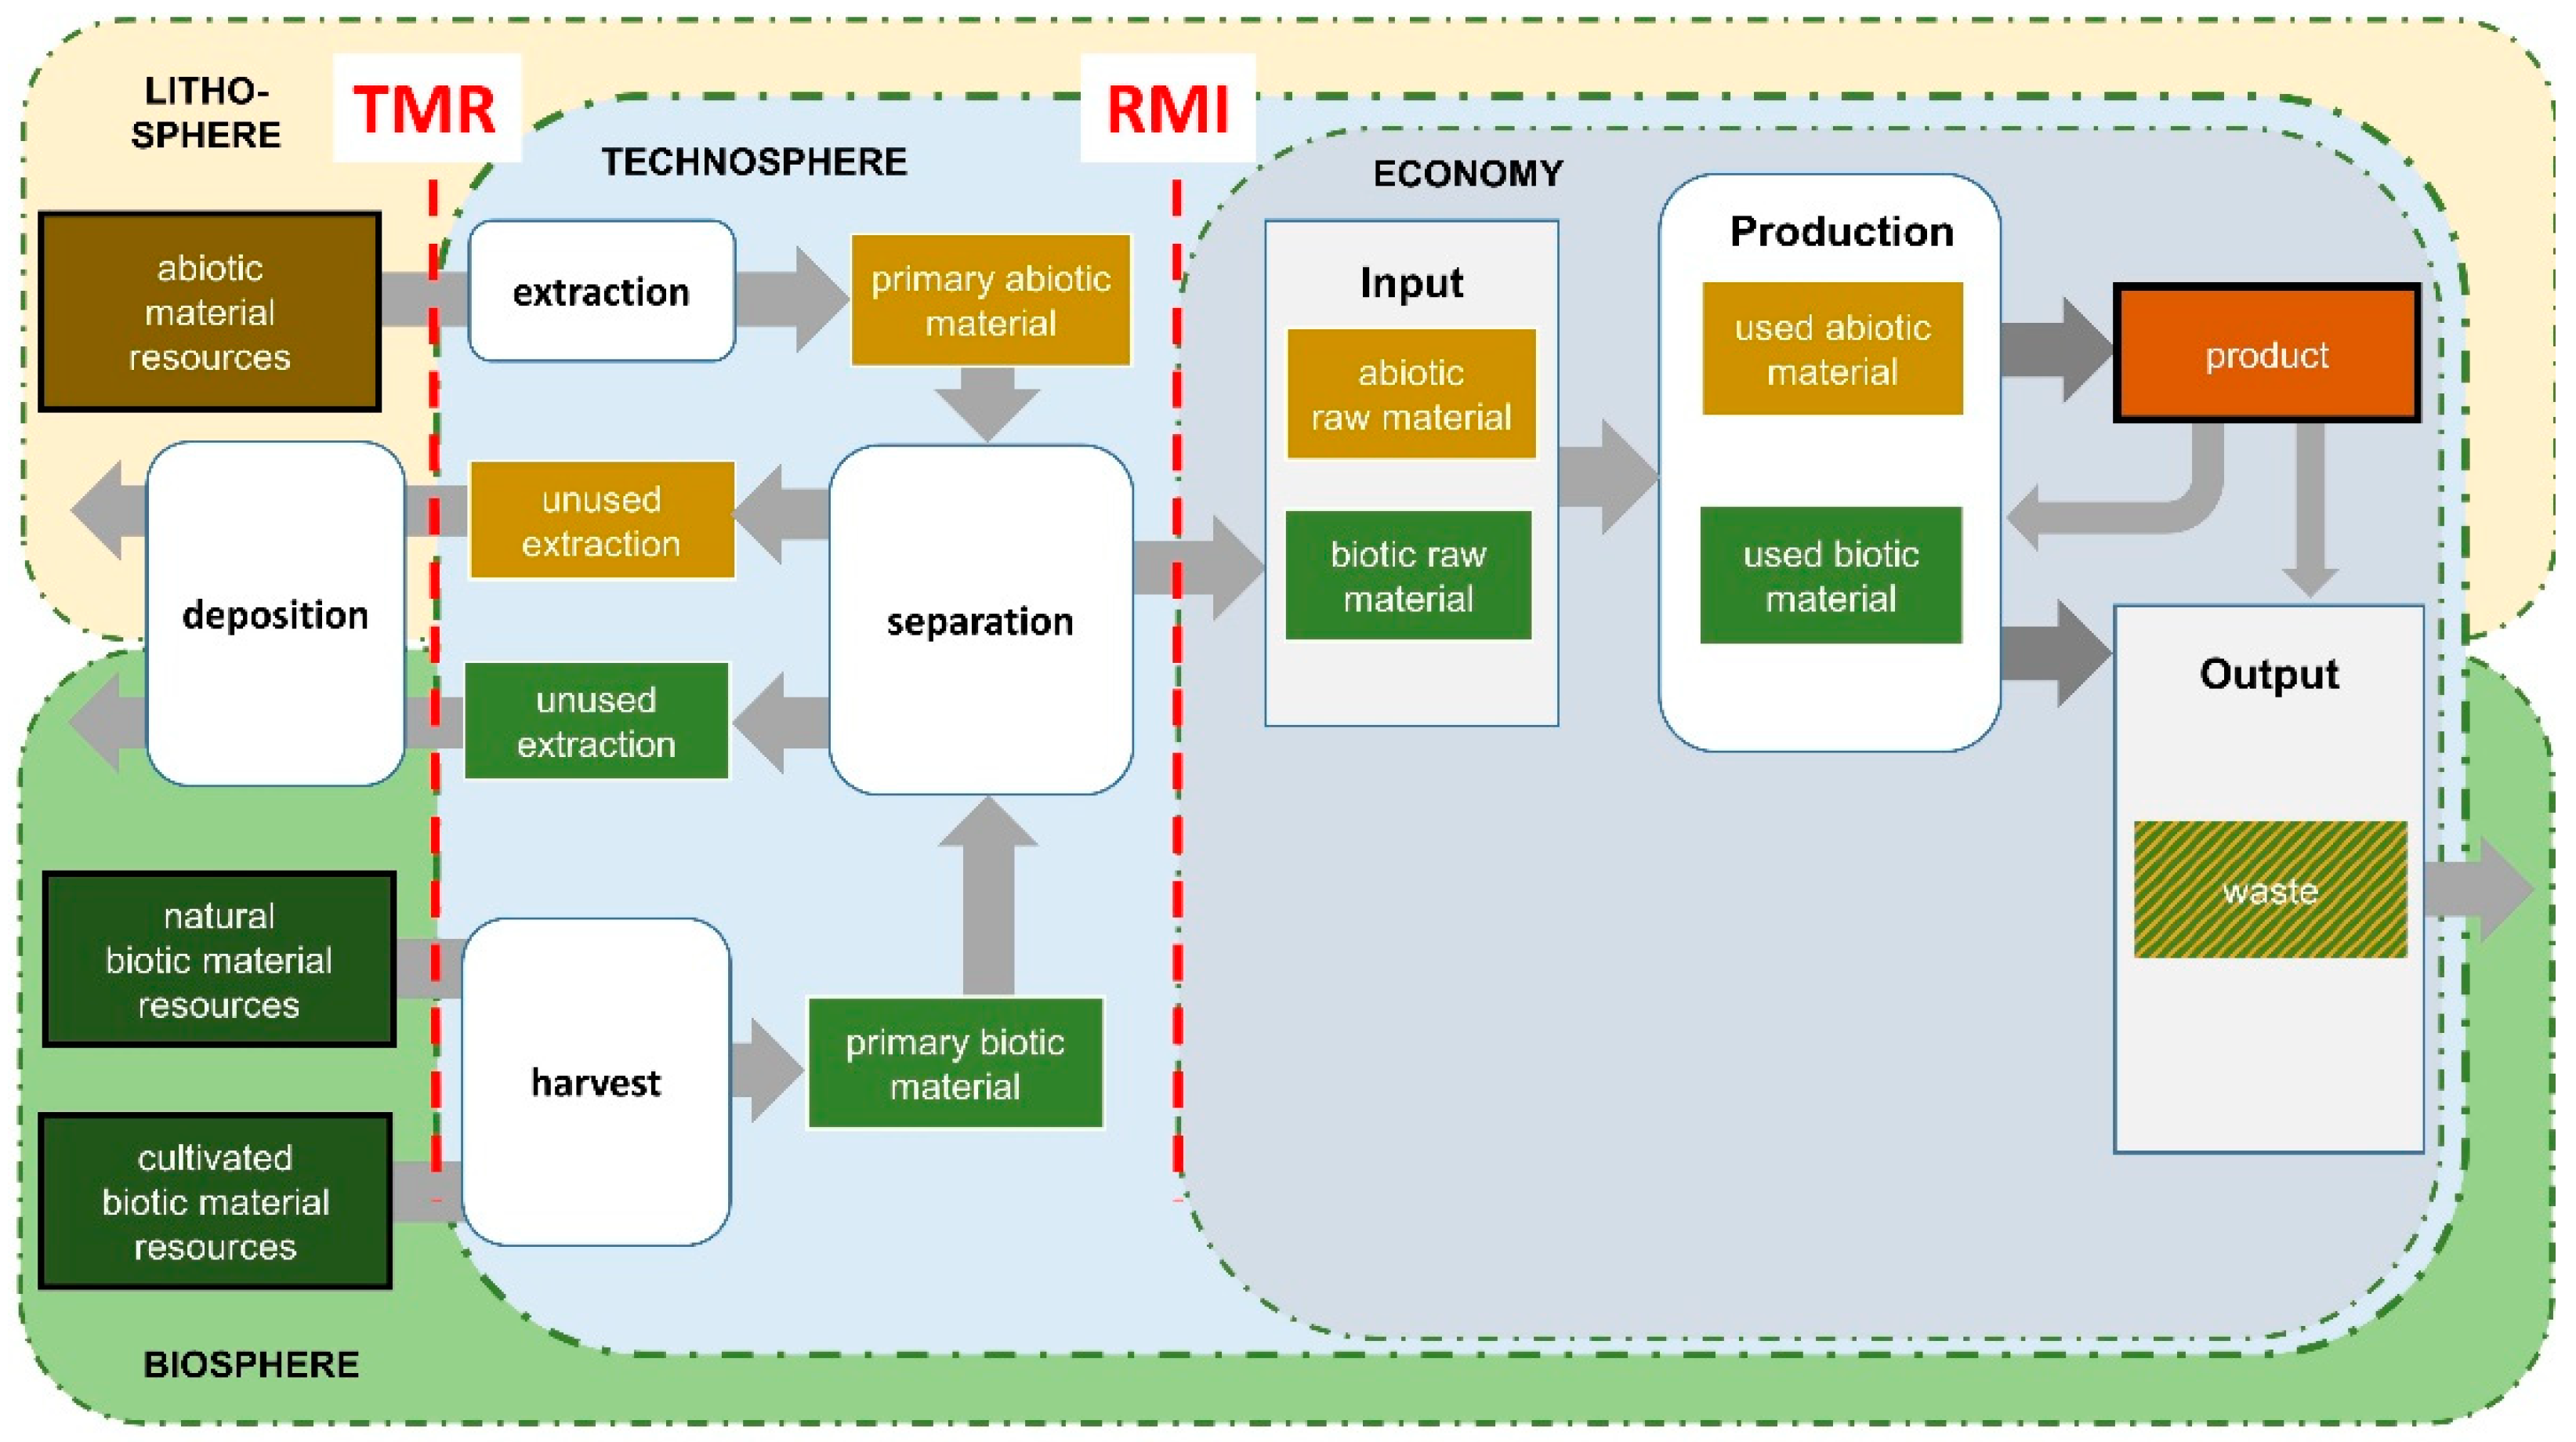
Second option: All biotic material resources are part of the biosphere and shall be accounted for (
Figure 2).
In this case, the input flows of all primary biotic material, harvested from the natural and cultivated biotic material resources, do cross the system boundary between nature and the technosphere. After separation, the input flows of biotic raw material enter the economy. This would argue for the use of the TMR and RMI as indicators.
The cultivation of biotic material resources involves both natural and technological processes. The harvest (i) competes with the production and use of biomass in natural ecosystems; (ii) represents an important part of nature-based productivity, which is appropriated by humans; (iii) is limited in capacity, to a significant extent, by natural growth factors, which makes it a limited resource; and (iv) is associated with a significant amount of residues as unused extraction, which have to be included in the overall assessment.
The ewMFA applies the so-called harvest approach by considering all harvested and captured biotic resources [
40]. In agriculture, the amount of plant biomass harvested for food and animal feed production and for material and energy use is counted. It includes the harvested biomass itself and all residues that are not further processed. In field cultivation, these harvest residues can include straw (from wheat, barley, rice, etc.) or stalks (maize, soya). Other harvest residues are, for example, tree cuttings from fruit tree plantations or the stalk structure in wine growing. In forestry, the amount of primary biotic material includes the harvested roundwood and, if applicable, the dug-up stump as biotic raw material and the harvest residues, i.e., branches, leaves, and, if applicable, bark, as unused extraction. In fisheries, the amount of biotic primary material includes the plants harvested (e.g., algae), the animals caught (e.g., fish, crabs, mussels, etc.), and the animals and plants that were not the target of the catch (bycatch) as unused extraction.
The cultivation of biotic material resources in open fields in agriculture requires soil cultivation and preparation, seed production, sowing and fertilization, and, increasingly, artificial irrigation [
46]. The processes that serve to remove the biomass from the field then include harvesting, although weeding can also fall in this category if the weeds are removed mechanically [
47]. Depending on the type of cultivation, these processes can widely differ. For example, conventional farming uses fertilization with phosphorus and nitrogen fertilizers, whereas in organic farming, green manuring with nitrogen-fixing plants such as leguminosae can be applied [
48,
49,
50].
Therefore, the different processes have to be examined more closely when considering products from conventional and organic farming in the material footprint to identify the strengths and weaknesses of both approaches, including the assessment of biotic material use. Since conventional agriculture still dominates [
50], it is considered in the case study applied for the comparison of the indicators TMR, RMI, and CRD.
2.3. Process Model of Wheat Bread Production
The comparison of the concepts of the indicators CRD, RMI, and TMR was conducted using an LCA study of wheat bread production. In addition to the agricultural processes of wheat production, other processes are required as bread production also depends on industrial processes such as fertilizer, salt, or energy production. The goal and scope of the LCA is the assessment of the material inputs based on the production of 1 kg of wheat bread (cradle-to-gate). The process chain includes four processes: (1) wheat production, including harvest; (2) flour production; (3) bread dough production; and (4) wheat bread production (
Table 1).
The process model is set up with data sets and background data from the ecoinvent database (version 3.5). The first process is modeled using the ecoinvent dataset ’wheat production, wheat grain, DE’, representing the production of wheat grains in Germany with a moisture content of 14.5%. The process considers an input of 0.024 kg wheat grains as seeds for the production of 1 kg wheat grains. The yield refers to the years 2000 to 2004 in Saxony-Anhalt (Germany). In this dataset, all agricultural processes that are necessary for the production of wheat are represented. The necessary infrastructure such as machinery and halls are also included.
The second process is modeled as ‘flour production’ of type 550 flour. The input is 1.089 kg wheat grains, and the grinding degree is 67.5%. The required energy of 0.055 kWh is provided based on the German electrical energy mix (ecoinvent dataset, reference year 2012).
The third process is modeled as ‘dough production’. A simple bread recipe is assumed, where only 0.735 kg wheat flour, 0.022 kg salt, 0.030 kg yeast, 0.023 kg sugar, and 0.440 kg water are used as ingredients for 1.250 kg of wheat bread dough. The production of salt, sugar, yeast, and water is also modeled based on the ecoinvent datasets.
The fourth process is modeled as ‘bread production’. A baking loss of 20% is assumed, meaning that 0.250 kg mass of the bread dough is lost as water vapor. The required energy of 1.3 kWh is provided based on the German electrical energy mix (ecoinvent dataset, reference year 2012).
2.4. Calculation of Material Input Indicators and Characterization Factors
The calculation of RMI
biotic and TMR
biotic follows the approach described for the abiotic part of the PMF. If only wheat is considered, the used biomass is calculated as:
where the RMI
biotic is the biotic raw material input measured in kg biotic raw material per FU, CF
RMI, wheat grains is the characterization factor raw material input of wheat grains measured in kg biotic raw material per kg wheat grains, and m
wheat grains is the mass of wheat grains measured in kg per FU. The total amount of harvested biomass is calculated as
The CF
TMR, wheat grains can be calculated by the CF
RMI, wheat grains and the unused extraction coefficient coeff
unused extraction, representing the mass ratio of the unused to the used extraction:
where the TMR
biotic, wheat is the biotic total material requirement measured in kg biotic primary material per FU, CF
TMR, wheat grains is the characterization factor of the total primary material requirement of wheat grains measured in kg biotic primary material per kg wheat grains, and m
wheat grains is the mass of wheat grains measured in kg per FU.
The unused extraction from agriculture can be divided into two categories: First, the parts of the plant, which are deliberately retained on the field, and second, the parts of the plant that are lost due to the applied harvest method. The second category can be disregarded if the amounts are insignificantly small due to the use of modern harvesting machines [
45].
The ecoinvent processes for crop production consider main products (wheat grains), co-products (harvested straw), and crop residues. The ecoinvent process ’wheat production, wheat grain, DE’ delivers 12,467 kg used extraction, 7567 kg wheat grains (main product), and 4900 kg straw (co-product) per hectare. The production is associated with 7600 kg of unused extraction, comprising 5000 kg of remaining straw and chaff and 2600 kg of stubbles and roots.
By considering economic allocation, 92.5% for wheat grains and 7.5% for straw, the allocated mass of used extraction for the production of wheat grains is 11,532 kg. The process considers a moisture content of 14.5% of harvested biomass. These data result in a CF RMI, wheat grains of 1.52 kg biotic raw material input per kg wheat grain, a coeff unused extraction of 0.61, and a CF TMR, wheat grains of 2.45 kg biotic primary materials per kg wheat grain.
The calculation based on LCIA is challenging, as most LCA databases do not yet specify any or only a few elementary flows for biotic raw materials. In the ecoinvent database, only wood is considered as a biotic elementary flow. Therefore, a new elementary flow ‘wheat grains’ with the reference unit mass is added for the calculation of the RMI biotic.
For the calculation of the CRD biotic, only those flows of biomass should be considered that are taken directly from the natural environment and have grown without human intervention. If the wheat grains and wheat seeds are considered to be products of the economy, they are not accounted for in the calculation of the CRD biotic.
It should be noted that the case study results only consider the use of wheat as an example. To determine the complete biotic part of the material footprint, all biomass inputs from agriculture, forestry, and fisheries have to be considered across the life cycle, which requires the calculation of the corresponding CFs for all biotic materials.
3. Results
First, the system diagrams for wheat bread production are shown with the system boundaries to measure the abiotic and biotic material input using the indicators CRD, RMI, and TMR. Second, the direct and indirect input flows of wheat bread production are presented. Finally, the indicator results for wheat bread production, calculated by the extended impact assessment method PMF, are compared.
3.1. System Diagrams for Wheat Bread Production
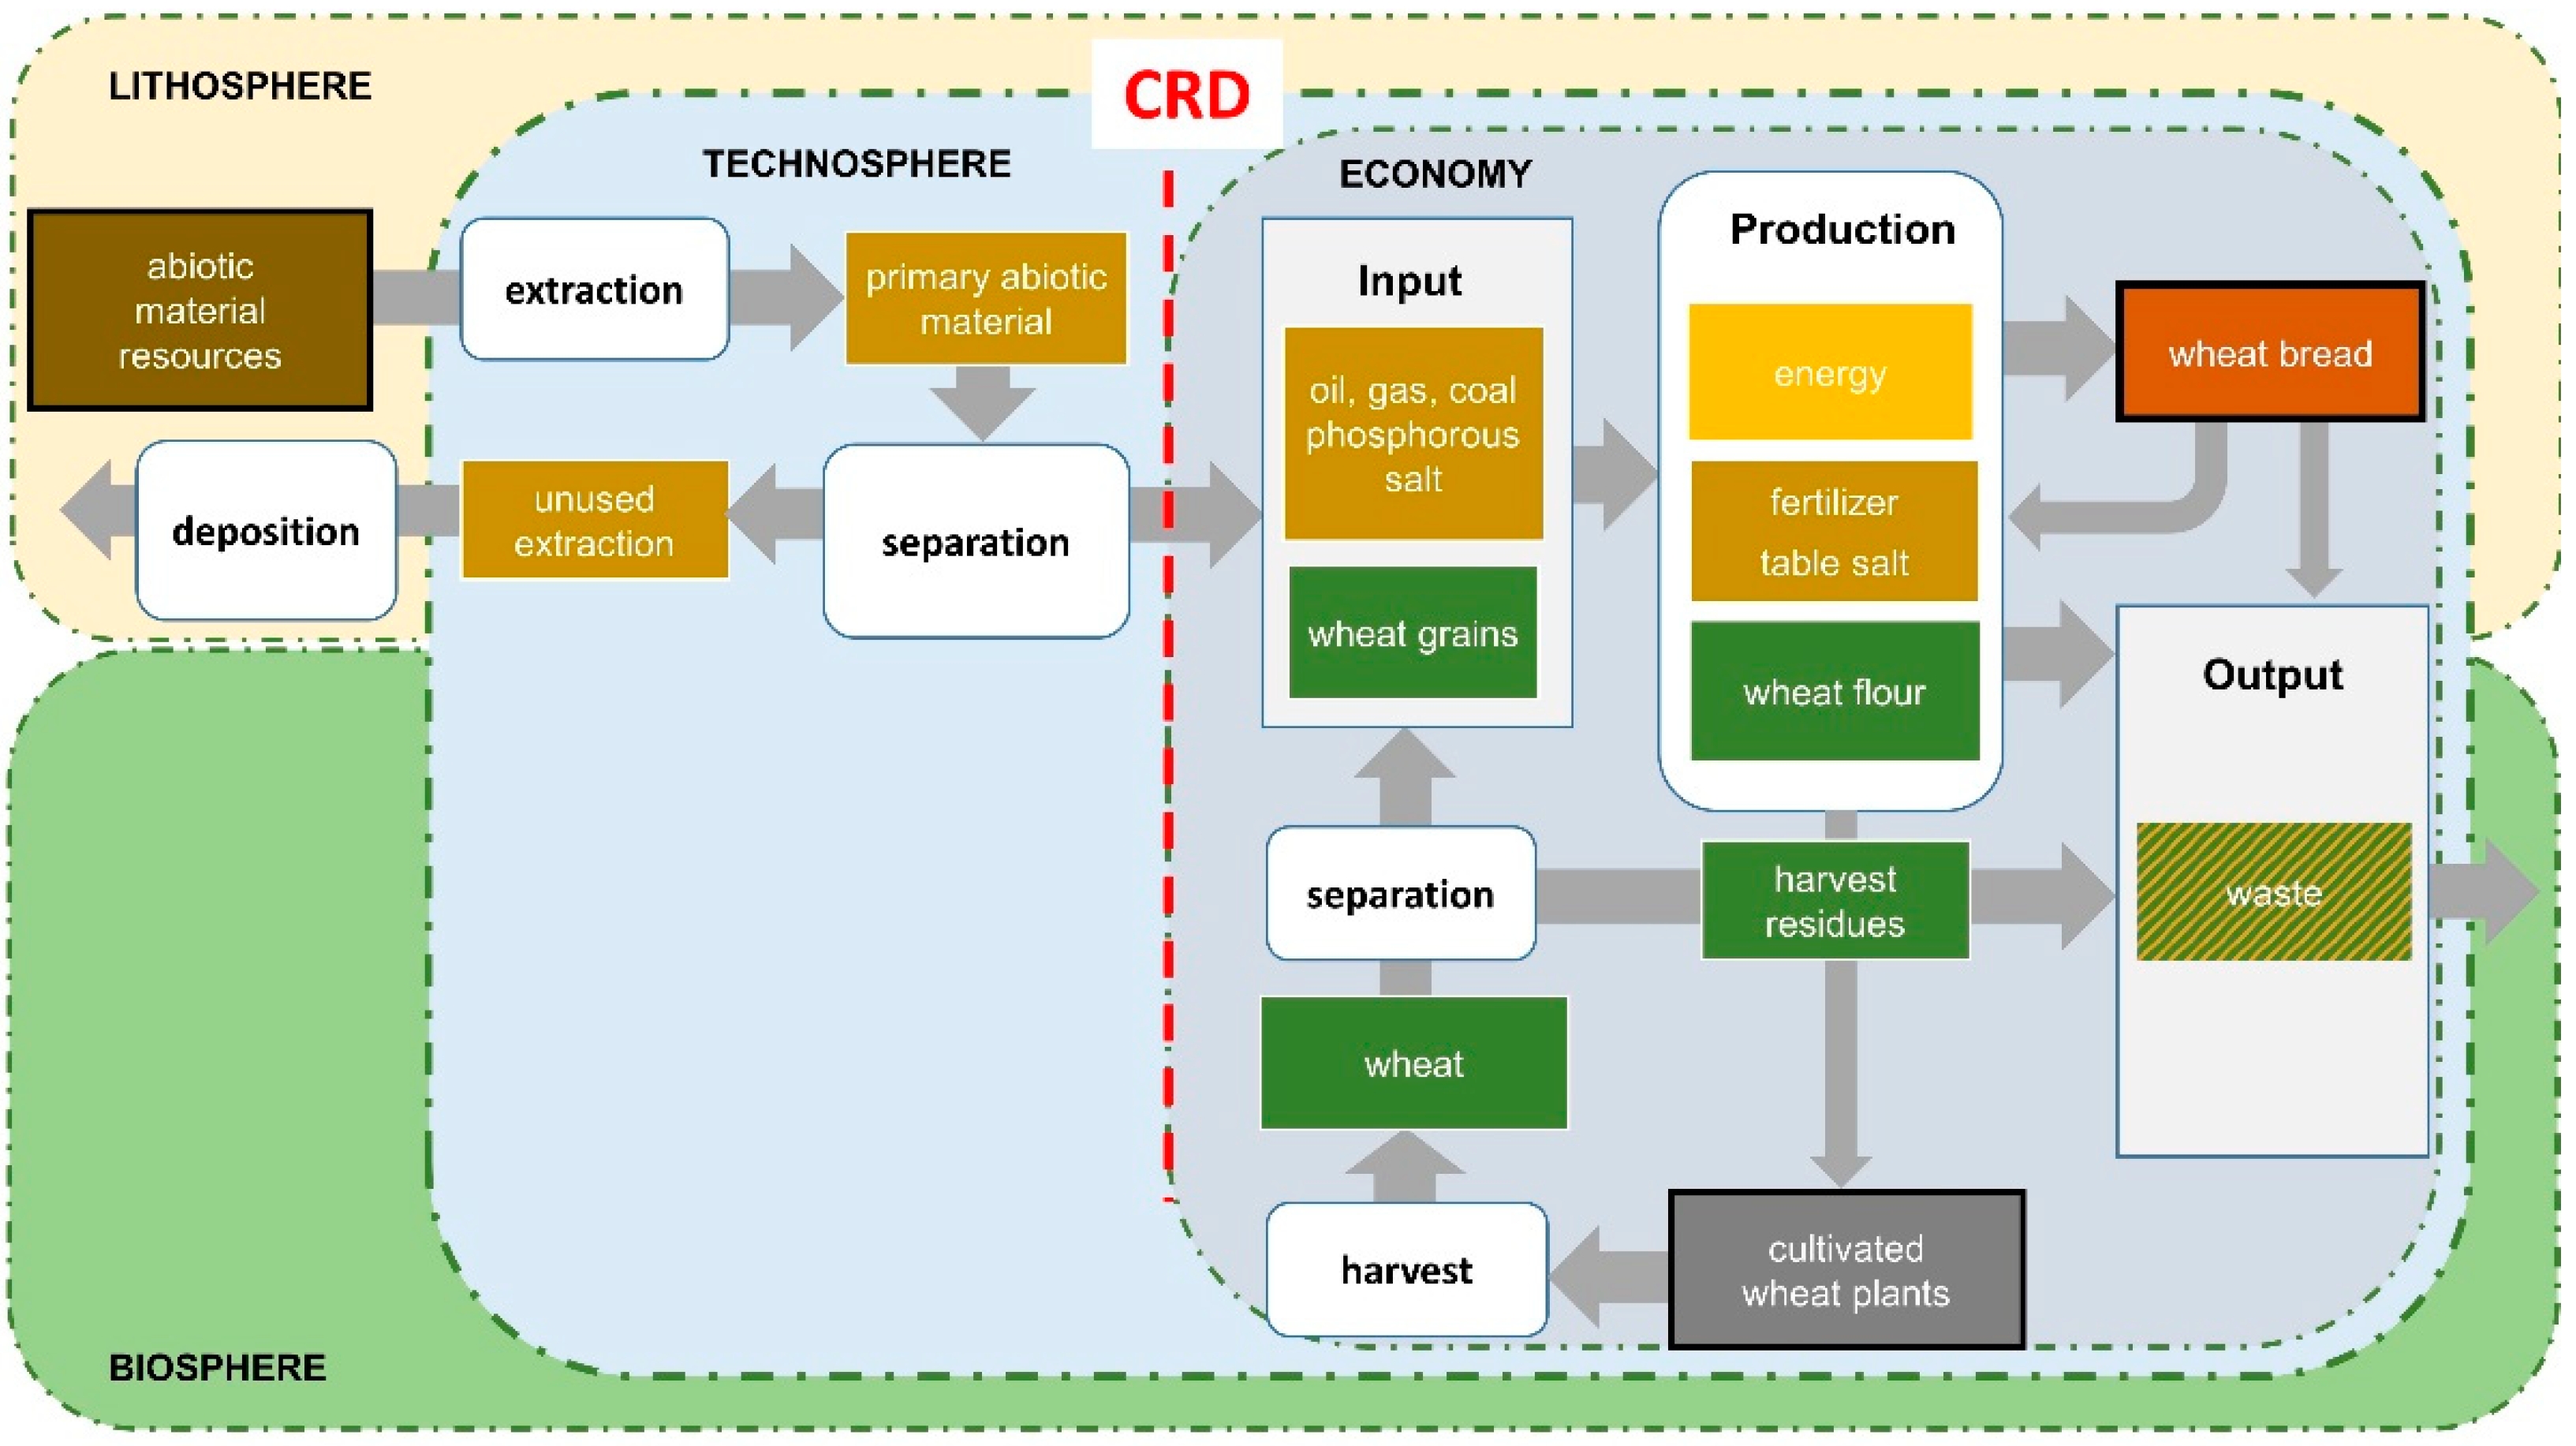
The concept of CRD considers agricultural production, in this case the cultivated wheat plants, as part of the economy (
Figure 3).
According to this understanding, all agricultural processes are economically driven, and the open fields of wheat production are considered to be within the economy. Consequently, only abiotic raw materials enter the economy and are accounted for by the CRD, i.e., the inputs of abiotic raw materials, such as crude oil for the diesel of tractors, phosphorus for fertilizer, and salt as bread ingredients. Although wheat bread production requires the inputs of biotic raw materials such as wheat grains for flour production, neither the harvested wheat nor the wheat grains are counted because the cultivation of wheat plants is considered part of the economy.
There are input flows from the atmosphere, such as CO
2 for biomass growth and N
2 for fertilizer production [
51]. In addition, H
2O is taken up by plants from the soil, and there may be further inputs from the hydrosphere, such as water for irrigation, which are not shown in the system diagram. These inputs are required for wheat bread production but are not material input categories in the definition of the CRD and, therefore, are not counted. The question arises of whether this indicator is incomplete, since the biomass itself is not counted nor are important input flows from the natural environment required for its growth.
In contrast, the concept of RMI and TMR considers the agricultural production, in this case the cultivated wheat plants, as part of the biosphere (
Figure 4). The rationale is that without natural processes in the soil and the atmosphere, determining rainfall, soil moisture, and nutrient availability, and natural side vegetation, mitigating soil erosion and hosting pollinators, etc., agriculture in the open field would hardly be possible.
After harvest, the used and unused parts of the wheat plant are separated. The harvested wheat is transferred into the economy and further processed as wheat grains and straw. The harvest residues, including unused straw and roots, remain on the field and support biomass regrowth.
According to the definition of the TMR, the total amount of harvested wheat, including the harvest residues, has to be counted as TMR biotic. The argument behind this is that the total extraction determines the degree of human influence on the soil and landscape and reflects the pressure on the natural systems due to the extraction of plant biomass (otherwise, the primary production would be used within natural ecosystems).
The TMR abiotic accounts for the amount of extracted abiotic primary materials for the provision of the abiotic raw materials required for the production of wheat bread.
Based on the definition of TMR, the total extraction of primary materials is accounted for. While the system boundary for the TMR is based on the demarcation of the natural environment (bio-geo-sphere) and the technosphere (also called the anthroposphere), the system boundary for the RMI is delineated by the distinction between the economy and the non-economic world.
According to the definition of the RMI, the total amount of raw materials as input into the economy is accounted for. Therefore, the total amount of wheat grains is counted, which are the wheat grains that are used for flour production and the wheat grains that are used as seeds for wheat production.
As per its definition, the RMI biotic does not account for the unused extraction remaining on the field. If, however, straw is removed from the field and used, e.g., for animal bedding, it has to be considered as a co-product and has to be counted as raw materials as well. The RMI abiotic accounts for the abiotic raw materials, i.e., crude oil or coal for energy production, mined phosphorus for fertilizer, and mined salt as a bread dough ingredient.
The aim of setting up the system diagrams of the different systems was to depict the main input flows for bread production and compare them in terms of their consideration by the examined indicators CRD, RMI, and TMR. An overview of all input flows directly and indirectly considered by the studied indicators is rather revealing (
Table 2).
Upstream flows from the atmosphere or the hydrosphere to the production chain that are taken up by the extracted or used materials are not accounted for by any of the indicators. Nevertheless, the CO2 that was taken up during the growth of the plant biomass accounted for is indirectly considered in the wheat grains by RMI and the whole wheat plant, including the roots, by TMR. The same applies for the activated N2, which became part of the protein content of the wheat grains and the whole wheat plant.
Regarding water, it is the complement to CO
2 required in the process of photosynthesis, so that at least a (small) part of the water consumed by plant growth is considered by RMI
biotic. As plants transpire much more water than the amount they take up for photosynthesis, this portion is rather negligible. To account for the water footprint, an extra analysis of the water scarcity footprint is advisable [
52]. Altogether, the CRD seems to be rather narrowly defined while RMI and TMR account for a broader profile of biotic input categories.
3.2. Material Footprint of Wheat Bread Production
The calculation results of the abiotic and biotic parts of the compared indicators CRD, RMI, and TMR for the production of 1 kg of wheat bread are shown in
Figure 5.
The CRD sums up to 1.71 kg raw material per kg wheat bread. According to its definition, only abiotic but not biotic raw materials are counted as inputs for wheat bread production. As a result, the CRD biotic is zero and the total CRD is equal to the RMI abiotic. The RMI biotic results in 1.70 kg biotic raw materials per kg wheat bread, accounting for 50% of the total RMI. The largest share, amounting to 1.66 kg, is assigned to the wheat grains and the remaining 0.04 kg to the wheat seed. The TMR biotic results in 2.74 kg biotic primary materials per kg wheat bread, accounting for around 52% of the total TMR. The actual values of RMI biotic and TMR biotic are higher because the biotic raw materials for sugar and yeast production were not calculated in this example.
It can, therefore, be stated that if the PMF only accounts for abiotic materials, an essential part of the material input is missing, and the assessment seems rather incomplete. This is particularly relevant for production systems where the input of biotic raw materials plays a major role. As the CRD per definition does not consider inputs from cultivated biotic material resources, it provides the same information as the RMI abiotic if no inputs from natural biotic resources are considered. As a result, the CRD conveys insufficient information on used and unused biomass extraction for product LCA.
4. Discussion
The material footprint is an important indicator for the environmental assessment of products and services. The results show that the CRD, RMI, and TMR could be calculated as life-cycle-wide indicators for the impact assessment method PMF, but the application of the indicators for biotic materials leads to different results and answers different target questions associated with different system boundaries.
The system boundary used to measure the TMR, the demarcation between nature and the human system, is in line with the general definition of the system boundary in the sense of the LCA. The system boundary used to measure the CRD and RMI is defined economically. It is, therefore, located within the human system, on the demarcation between the technosphere and economy. According to the definition of the CRD, the cultivated biotic material resources are within the economy and part of the human system, in contrast to the RMI. If the product system only requires input from cultivated biotic material resources, the CRD
biotic is zero as it does not measure the biotic inputs of the related agricultural processes, although they represent by far the highest share of biomass production. Therefore, an assessment of the environmental pressures associated with the production and harvest of biomass based on the CRD, as it has been defined so far, is basically insufficient and this indicator might not allow a meaningful evaluation of the environmental impacts based on material resource use. Additionally, the definition of the CRD
biotic might be misleading as it is often not clearly defined which biotic raw materials are related to cultivated and which are related to natural areas [
43].
With the application of the TMR and RMI based on the harvest approach, the natural biotic material resources and the cultivated biotic material resources are located within nature, quite at the boundary with the human system. As the RMI accounts for the part of the extracted primary materials that is separated and transferred into the economy, the position of the system boundary for the RMI is identical to that of the CRD. However, in contrast to the CRD biotic, the RMI biotic accounts for the total amount of utilized biomass extracted from nature and harvested from agriculture. Thus, the RMI biotic answers the question: what amount of biotic raw materials are life-cycle-wide processed to comprise the FU? This serves as a proxy indicator for the related environmental impacts along the production chain.
The biomass flows accounted for by RMI
biotic can also be consistently linked to the gross input of the anthropogenic stock of materials, in particular, to the carbon-containing portion that is practiced in economy-wide material flow accounting [
51].
Additionally, the total amount of extracted biomass, including timber and caught fish, should be measured, as it is an intervention in the natural ecosystems. For this purpose, the system boundary used to measure the CRD and RMI is shifted from the economy to the demarcation between nature and the technosphere. As a result, the TMR biotic answers the question: which amount of biotic primary materials are life-cycle-wide taken from the biotic material resources for the provision of the FU? Thus, the TMR biotic can be interpreted as a proxy indicator for the magnitude of environmental impacts associated with the total turnover of utilized and non-utilized biomass, including the subsequent deposition of the extracted residues within the biosphere.
As the RMI and TMR have been designed to account for the flows of materials, they should further focus on raw materials and primary materials and not on water or air inputs for which separate direct or indirect indicators are available. Nevertheless, the extracted raw materials can have a different water content, whether it is lignite or hard coal, or wood or grass eaten by animals. A part of the water often evaporates after extraction, for instance, when cut timber is being stored or grass being dried for hay.
Harvested biomass is mostly calculated as fresh matter but still has a non-negligible moisture content even after drying. The characterization model for the RMI
biotic could consider the fresh and the dry matter of the biomass, but the application of a standardized water content is advisable to provide comparable data. In ewMFA, harvested biomass accounts for its actual fresh weight while a water content of 15% is assumed for fodder crops and grazed biomass [
53,
54]. A similar approach could be taken in the PMF.
In analogy to the calculation of the abiotic part of the PMF, the CF RMI biotic is used to calculate the CF TMR biotic by taking into account the mass ratio of unused to used extraction represented by the coeff unused extraction. For the CF calculation, the applied definition of co-products and harvest residues and the allocation approach is of great importance. As shown, the production of wheat grains (main product) is associated with used straw (co-product) and with remaining straw and roots as harvest residues, which has to be taken into account.
Another option to calculate the RMI
biotic or TMR
biotic is to estimate the total amount of biomass produced from their carbon content and the amount of CO
2 taken up by plants [
55]. As CO
2 is considered as an elementary flow in most LCA databases, the creation of new elementary flows is not necessary. The applied CF should consider the amount of biomass that is produced by the absorption of one kilogram CO
2 by taking into account the average carbon content of the plant. Based on the ratio of the atomic weight of CO
2 and carbon, 3.67 kg of CO
2 has to be absorbed for the production of 1 kg of carbon. If the carbon content of wheat is assumed to be 50%, 1 kg of CO
2 has to be absorbed for the production of 0.545 kg of wheat. This simplified approach accounts only for the net uptake of CO
2 and neglects that the gross input of CO
2 by plants is larger due to losses by respiration. Moreover, the content of the minerals in the plant material is neglected by this approach, and the remaining water content.
The example of wheat bread production shows that system analysis provides a good framework for the assessment of production processes using biotic materials. The system diagrams should also be applicable to the products of forestry and fisheries, but they are still simplified representations. For example, the issue of co-products, e.g., straw, of additional material inputs, such as sugar and yeast, and water is not addressed in the system diagrams while it is generally considered in the LCA process model and calculation. When calculating the indicators for wood-based products, it is often necessary to calculate the volumes of timber harvest in tons considering the appropriate density values [
56].
In general, the analytical framework outlined in this article, the applicability and interpretation of the three indicators and the advantageousness of RMI biotic and TMR biotic should pertain for all biotic material resources used for products and services. For some categories such as fish from the oceans, additional research might be required, for instance, to quantify the unused extraction associated with ground dredging. When plants are cultivated in glasshouses, the procedure proposed here would imply not to account for that biomass in any of the three indicators, as CRD excludes this from the beginning and RMI biotic and TMR biotic rely on inputs from the open field. Nevertheless, it could be recommended to report on the greenhouse-based biomass used in a system studied for additional information, e.g., in the inventory.
5. Conclusions
The most meaningful indicator among CRD, RMI, and TMR in terms of the material footprint depends on the target question that should be answered. The material footprint estimates the risk of potential environmental impacts associated with the magnitude of abiotic and biotic material extraction from the bio-geosphere or the non-economy world, respectively.
The CRD is not able to fully assess the material use as for the CRD biotic, a large share of biotic raw materials is excluded according to the definition. The RMI biotic and the TMR biotic are well suited for calculating the material footprint of biotic materials in life-cycle-wide analyses while answering complementary target questions. Both indicators are turnover-based input indicators for the related environmental pressures and ecosystem damage potential. The RMI biotic is related to the production activities using biotic raw materials in the economy and the TMR biotic is related to the intervention in nature, including cultivation, harvest, separation, and deposition. There is a certain risk of double counting, as additional nutrients such as phosphate and potassium, which are part of the biomass, are already counted in RMI abiotic and TMR abiotic, but this might be negligible in terms of the quantity.
RMI
biotic and TMR
biotic could also be used for absolute sustainability assessments [
57]. The RMI
biotic could be used, e.g., to assess the primary timber biomass used for wooden products related to the net annual increment (NAI) of forests in the spatial scope area of the analysis. The NAI measures the regrowth of forests in terms of the timber harvest potential; for agricultural harvests, the total agricultural production could be used as a proxy reference [
58]. The TMR
biotic could be related to the actual net primary production (NPP) or the hypothetical natural net primary production in the area corresponding to the spatial scope of the analysis [
59]. For the CRD, such assessments would not be possible in a sensible manner.
For policy-making, the material footprint is also of great importance, e.g., regarding the SDGs, especially SDG 8 and SDG 12 [
60]. As the RMI and TMR could play a more important role as indicators for the material footprint in the future, a more detailed data and calculation basis for RMI
biotic and TMR
biotic has to be developed.


