Article

The Key to Sustainable Economic Development: A Triple Bottom Line Approach

1
REMIT—Research on Economics, Management and Information Technologies, University Portucalense, R. Dr. António Bernardino de Almeida 541, 4200-072 Porto, Portugal
2
Miguel Torga Institute of Higher Education, NECE-UBI—Research Unit in Business Sciences, University of Beira Interior, Estrada do Sineiro, s/n, 6200-209 Covilhã, Portugal
*
Author to whom correspondence should be addressed.
Resources 2022, 11(5), 46; https://doi.org/10.3390/resources11050046
Submission received: 30 March 2022 / Revised: 3 May 2022 / Accepted: 6 May 2022 / Published: 10 May 2022

Abstract

:
Concerns about improving social, environmental, and economic living standards are the basis of the triple bottom line (TBL) link to economic development (ED). Aware of the importance of studying their relationship, this article analysed the influence of TBL on ED. A quantitative methodology was used. The sample comprised a panel of data from 2006 to 2019 for OECD (Organisation for Economic Co-operation and Development) countries. Five multiple linear regression models were estimated by the generalised method of moments. The results of this study revealed that the social dimension of TBL boosts ED, the environmental dimension of TBL slows down ED, and the economic dimension of TBL contains conflicting synergies in ED. The Human Development Index (HDI) should now include indicators of environmental wellbeing. Governments should adopt policies to improve social wellbeing to boost ED, work to coordinate the objectives of environmental protection and ED, and combat vulnerabilities arising from public debt. As one of the first studies to assess the influence of TBL on ED at the country level, the present findings contribute to the reflection about the influence of TBL on a country’s ED and strengthens the discussion around the influence of different dimensions of TBL.

1. Introduction

The global COVID-19 pandemic, in addition to political and economic uncertainty, has brought social and economic costs that will be felt in the coming years [1]. It also brought fluctuation in the prices of natural resources commodities [2]. Price instability, limited availability of natural resources, and the pandemic have caused many countries to face an energy crisis [3]. This has made it even more evident that the development of sustainable initiatives is vital for sustainable economic development [4]. Thus, it is extremely important to understand the role that sustainability plays in economic development (ED).
This study assumes that sustainability must be perceived according to the triple bottom line (TBL) construct. TBL, outlined by Elkington in 1996, assumes that value creation results from three dimensions, social, environmental, and economic, which must be accounted for [5,6,7]. It has at its core the support and management of activities that privilege development [8]. It has gained traction at all levels of government and in business [9]. Economic development (ED) is created by the process of creative destruction [10] and translates into an organic system of successive qualitative changes [11]. It is responsible for sustainable development, at country level, in the long term [12]. It is also at the country level that there is an obligation of harmony in the management of resources, be they social, environmental, or economic [13,14]. These are concepts that share particularities in their very nature. With the aim of improving understanding and effective action in relation to sustainable development, the United Nations announced the 2030 Agenda of Sustainable Development Goals [15]. The integrative nature of these objectives revealed the need to study the relationship between the adopted actions and the results obtained [16]. Therefore, it is essential to monitor and evaluate the sustainable development of countries [13]. Furthermore, the development of TBL has highlighted the need for studies that approach it in a more holistic way [7,17,18,19]. However, despite recognising the importance of TBL in ED, it has been given little attention in this scientific field [17].
To fill this gap, this study analysed the influence of TBL on ED, in the timeframe from 2006 to 2019, in the 38 countries of the Organisation for Economic Co-operation and Development (OECD). A quantitative methodology was used. After the statistical analysis of the variables, the hypotheses were tested through the estimation of five multiple linear regressions, using the generalised method of moments (GMM). No evidence was found of any previous study that considered an analysis encompassing the influence of TBL, specifically involving the integration of their social, environmental, and economic dimensions, as well as the categories that constitute them, on ED. Although there have been some studies on the link between TBL and ED, there is still no study ascertaining the influence of TBL on ED in OECD countries. In fact, when focusing on articles that consider TBL and ED at the country level, only a cross-country comparison [13] and an assessment of the sustainable performance of each country [14] were found. Extant research has made it possible to adopt a research model that allows a new understanding of the actions that influence economic development. This study adds new perspectives to previous discussions. It identifies the social dimension of TBL as a driver of ED, the environmental dimension of TBL as an element that slows down ED, and the economic dimension of TBL as having conflicting synergies in ED.
The structure of this study is as follows: after this introduction, where the general objective is presented, there follows a literature review that encapsulates the hypothesis development. This is followed by a description of the methodology, data, and variables. Then, the results obtained are presented and discussed, after which the conclusions, limitations of the study, and future lines of research are presented.

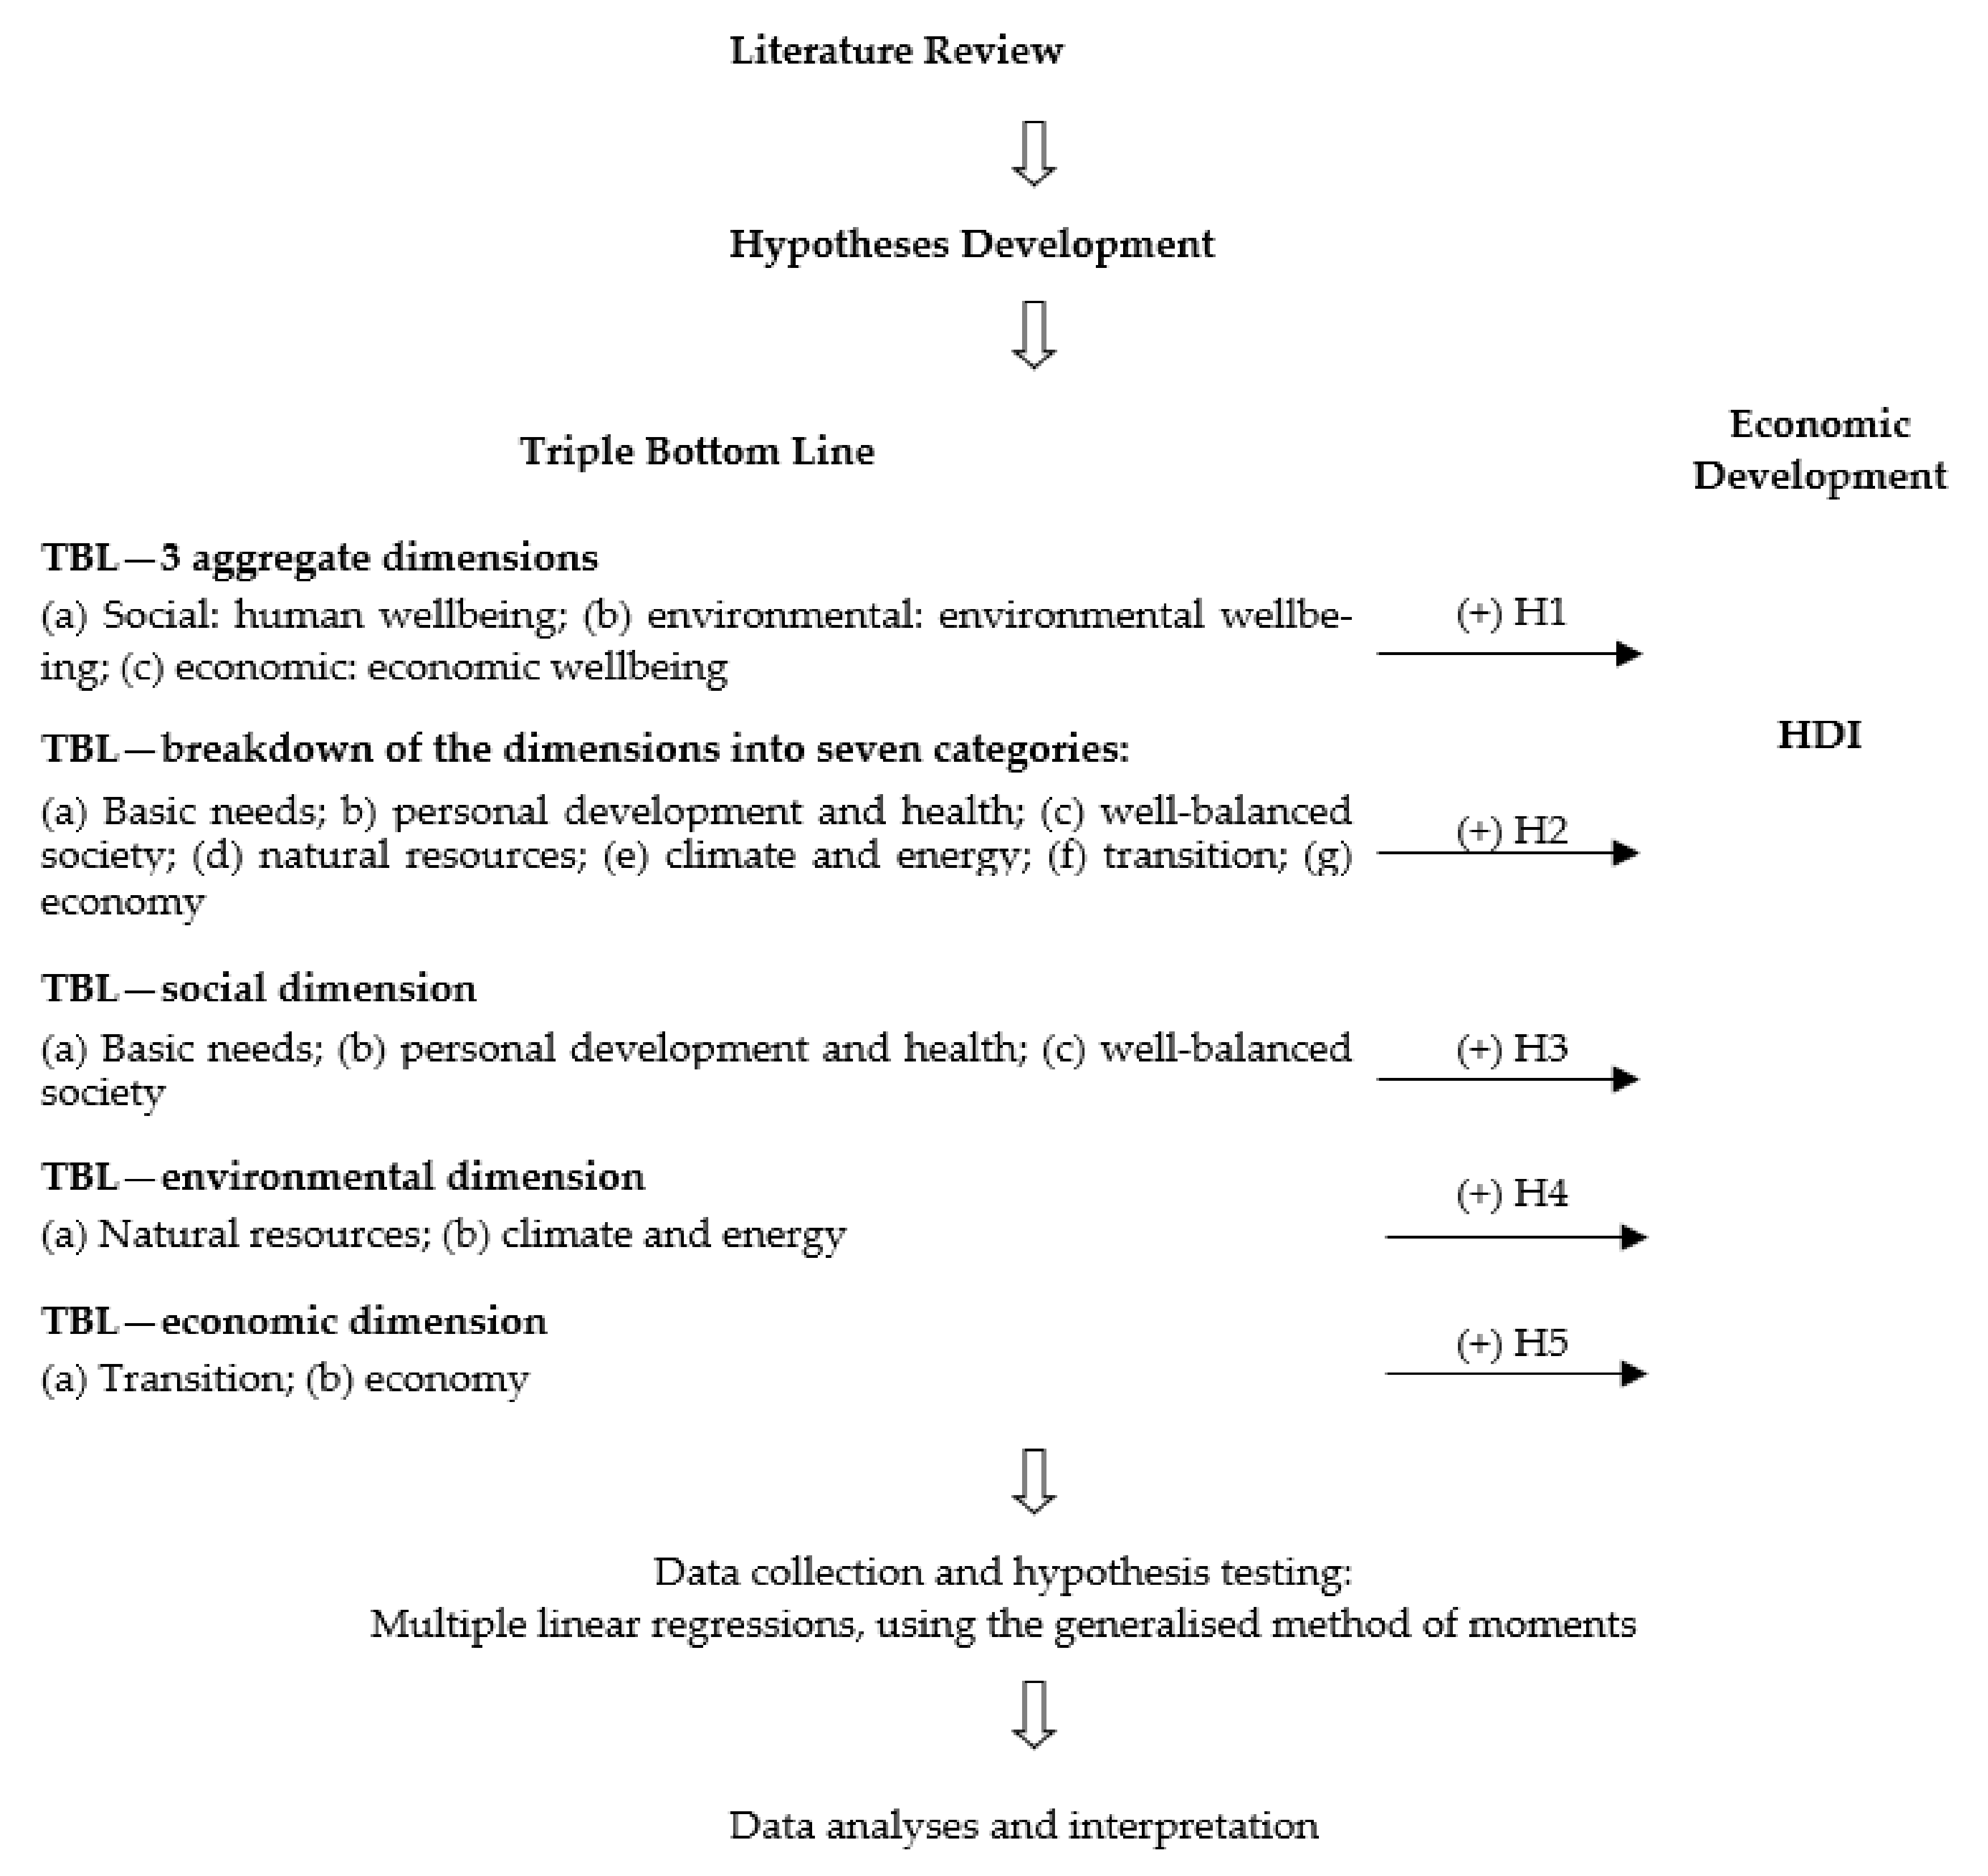
2. Literature Review and Hypotheses Development

2.1. Economic Development

For Schumpeter [10], the process of creative destruction, the result of disruptive innovations, is responsible for the creation of ED. ED is an organic process represented by a qualitative change in constant evolution [11]. Despite the wide acceptance of the term economic development, there is intense discussion about its definition [20] and its objectives [21]. According to Lele [22], ED can be seen as a method that seeks change and its definitions relate to both the targets of that procedure and the expedients that seek to achieve those targets. For Lee [20], ED is about the process of gradual mutation of an economy. Long-term theories of ED have the agglomeration of human capital and population growth as the central forces on which it is based [23]. For the endogenous growth theory, ED has its centre in the productive capacity and the application of knowledge, by large firms, with the possibility of investing in human capital and research [24].
The vision of Seers [25] should also be mentioned, who sees development as the elimination or reduction of inequality, unemployment, and poverty. According to Owens [26], development happens when there is a development of people and not a development of things. Daly [27] started from the dictionary meaning of development, expanding or realising potentialities with a view to an improvement of the condition, describing the development as a qualitative improvement or an unveiling of potentialities.
ED’s mission relates to the long-term achievement of sustainable development in the countries’ life model [12]. ED has in the financial sector one of its drivers [28]. It is a system that integrates resources, leads to urbanisation, and carries with it consequences for public health [29]. It drives the process of industrialisation [30] and, in several studies, it has been suggested that it is not always on a sustainable path [31]. It is supported by micro-enterprises [32], is impacted by cultural characteristics [33], and is stimulated by financial inclusion [34]. Furthermore, the way a community understands and masters production techniques, especially in relation to the most relevant markets, can be perceived as ED [35].
There is a long-standing concern among economists about the different factors that can impact the direction of a country’s ED [36]. For [17], when studying the differences between ED and economic growth, ED was usually referred to as a change in the economy that aids economic growth or qualitatively improves the social conjecture, which results from economic activity, whereas economic growth was mentioned as a change in the size of the economy. Not infrequently, economic progress is gored by the lack of action and agreement about the measures required [12].
The thinking that ED policies endanger environmental sustainability began in the 20th century and led to the adoption by the United Nations of the concept of sustainable development [37]. This concept has two cores: meeting the needs of society, particularly the poorest, and the difficulties posed to the environment by society’s behaviour and technological progress [38]. No definition of development gathers the consensus of all people since development is intimately linked to human wellbeing, and this is a concept that includes multiple dimensions subject to undeniable trade-offs [39]. Thus, the ideological choice of this study must be clarified, and it is related to the notion of development adopted by the United Nations. In other words, ED brings together the concern with increasing income to meet basic needs, eradicating poverty, and preserving the environment. It should be considered to constitute three dimensions: the economic, the social, and the environmental.

Human Development Index (HDI)

Several ways of measuring the level of ED have been elected such as through GDP per capita [40], using a ratio of a country’s GDP (China) to global GDP [41], and considering the Genuine Progress Indicator or the Index of Sustainable Economic Welfare [42]. Among the composite indicators of socioeconomic development, the HDI is the most commonly employed [43].
The United Nations Development Programme developed the HDI, a development measurement tool that considers economic and social advances [44]. Mahbub ul Haq was the Pakistani economist who led the team that invented it and presented it in 1990 in the first Human Development Report [45]. Born out of the desire that policy focus should be on people and not on national economic accounting, the core of countries’ development, the HDI aims to estimate the progress of nations, considering not only economic expansion but also important social outcomes [46]. Thanks to its multidimensional nature, it measures the development of nations along several lines [47]. It is calculated as the geometric mean of standardised indicators representing each of the key dimensions of human development: a healthy and long life, access to knowledge, and an adequate standard of living [46,47]. Table 1 details the dimensions, indicators, and sources of HDI data, adapted from UNDP TN [48].
Togtokh [49] believed in the merits of HDI when it comes to development and quality of life. However, he also reminded us that there is a presumption of the limitlessness of natural resources and that not enough attention is paid to the changes that are caused to the planet by development. However, the HDI is an inclusive metric of the basic life factors seen as an explanatory indicator of the ED [50,51].
It can translate the level of quality of life [52,53] and reflect it better than GDP [54]. In addition to this, it has been instrumental in spreading the discussion of ED beyond the purely monetary scope [55].

2.2. Triple Bottom Line

The concept of TBL, designed by Elkington, emerged in 1996; it sees companies or organisations as value creators in multiple dimensions that must be accounted for [5]. It has, at its core, supported and operationalised the implementation of sustainable development [8]. TBL is also presented as the three Ps: profit, planet, and people [56]. It consists of three dimensions: economic, environmental, and social [57]. That is, to the traditional economic results, the environmental and social dimensions have been added to calculate the business performance in its sustainable interpretation [58]. It is the fruit of the growing awareness of the problematic that involves sustainability and to which the World Commission on Environment and Development of the United Nations Organisation contributed substantially when it published in 1987 the report “Our Common Future”, known as the Brundtland report [59]. The TBL was legitimised by incorporating into its measures the concerns with the future of people (inside and outside the organisations) and the planet [60]. It suggests that companies’ involvement in socially and environmentally responsible conduct is necessary and can result in financial gains [61]. Financial gains can also result from activities at the intersection of companies’ economic, environmental, and social performance, synonymous with competitive advantage and long-term economic returns [62]. Being usually well received, the TBL framework is useful for finding answers for organisations seeking a path towards sustainability [63].
To measure TBL, the Sustainable Society Index (SSI) was used. Since 2006, the Sustainable Society Foundation of the Netherlands has developed the SSI [64]. Since 2018, the responsibility for editing the SSI has been passed on to the Technische Hochschule Köln [65]. It is a composite index covering the three main domains of sustainability [66]. Its component indicators are 21, assessed on a scale of 0–10 and a biannual basis [67]. They measure the distance to full sustainability for each indicator representing the three categories of environmental/ecological aspects, quality of life, and resource depletion [68]. The differential weighting of the indicators has no scientific basis; thus, there is equality in their consideration when aggregating them across the three dimensions [69]. Following the advice of the Joint Research Centre of the European Commission, the SSI is not a single overall index as the three dimensions are not aggregated [69]. In a simple and transparent way, the SSI integrates the most important aspects of sustainability [70]. Compared with other indices, the SSI considers a larger number of basic indicators and components of sustainable development; its data cover many countries and are readily available [64]. In addition to measuring the level of sustainability, the SSI monitors progress towards sustainability [71].
At the country level, the need for the existence of a concordance between the administration of social, environmental, and economic resources can be identified [13,14]. Thus, it may be asked whether the different dimensions of TBL influence the countries’ ED in a positive way; the following hypotheses were formulated:
H1. 
The (a) social, (b) environmental, and (c) economic dimensions of TBL, when aggregated, have a positive influence on economic development in OECD countries.
H2. 
The categories (a) basic needs, (b) personal development and health, (c) balanced society, (d) natural resources, (e) climate and energy, (f) energy transition, and (g) economy, when aggregated with all other categories representing the three dimensions of the TBL, have a positive influence on the economic development of OECD countries.

2.2.1. Social Dimension

The social dimension refers to the social elements of the community and employees who are the recipients of the outcome of the business exercise [72]. It translates into an ethical standard of behaviour for the longevity of humanity [73]. Social sustainability works especially with human beings and social capital orientation, aggregating civil and human rights, community and social responsibility, safety and health requirements, employment, and public perceptions [8,74]. Standard of living, human capital, equality, living standards, and prosperity can be included in social indicators, although these have a subjective genesis [75]. For Schönborn et al. [72], it is acceptable to assume that social sustainability can be mirrored in a corporate culture characterised by primary values and assumptions that are underpinned by the idea, scope, and principles of social sustainability. When thinking about corporate culture, it should be kept in mind the seed for reflection left by Zott [76], who sees the business model as a set of interdependent activities that exceed both the company’s focus and its limits, enabling stakeholders to create and appropriate part of the company’s intrinsic value [76]. The need to measure and compare social value creation [77] and the pursuit of ways and models of social value creation have already been germinated in several studies [78,79,80,81]. However, there remains a lack of studies that expand the range of measurements and assess the impact of social value [81,82,83,84]. In this context, the following hypothesis was formulated:
H3. 
The categories (a) basic needs, (b) personal development and health, (c) balanced society, of the social dimension of TBL have a positive influence on economic development in OECD countries.

2.2.2. Environmental Dimension

In turn, the environmental dimension seeks that the global systems that support life be secured indefinitely [85]. It embraces the management of limited biophysical resources by managing them and seeking their reduction in processing [86]. The view that environmental sustainability is a constraint on the economic strength of business and a luxury has changed [87]. The aim of this concept is the simultaneous achievement of economic development and environmental sustainability [88]. The link between corporate and environmental performance is impacted by the heterogeneity of organisations’ ability to manage the various aspects of their operations [89]. It should be noted that environmental performance has consequences for the stakeholders involved in the company’s operations [90]. Market players create pressure for companies to operate in an environmentally conscious way [89]. As consumers become more aware, the pressure for organisations to change their value creation process increases [91]. Multinationals are at the top of the competitive and social pressures to adopt environmental and sustainable strategies [92]. Environmental associations and governments are increasingly highlighting all problems linked to the environment [93]. Humanity’s survival is directly linked to the achievement of environmental sustainability, which is one of the most pressing concerns all over the planet [86]. In this way, the following hypothesis was formulated:
H4. 
The categories (a) natural resources and (b) climate and energy of the environmental dimension of TBL have a positive influence on economic development.

2.2.3. The Economic Dimension

The economic dimension concerns the outcome of the company’s business performance in the economic system [5]. It is truly fixed in the culture of companies as profit is the main objective of their activities [94]. It is commonly accepted that economic sustainability is ethically based on the search for justice in the forum of human–nature relations in a perspective of an uncertain and long-term future [90]. The organisation’s growth is linked to the growth of the economy by the economic line and the quality of its contribution in its support [95]. In other words, this dimension focuses on the economic values made available by organisations to the environment in order to provide prosperity and support for future generations [95]. Thus, the economic dimension is one of the subsystems of sustainability that facilitate survival and evolution towards the future [96]. In several contexts, it is given more importance [97,98] because it translates more directly to the interests of companies [99]. It is a vital element of their existence [100], while the other two dimensions (social and environmental) reflect the actions of the company towards third parties [101]. However, little information is available on the economic sustainability of the economy [96]. Knowing that economic growth can have adverse effects on society [102], it is imperative to understand whether the influence of the economic dimension of TBL on countries’ ED is positive.
H5. 
Categories (a) energy transition and (b) economy of the economic dimension of TBL have a positive influence on economic development.
Figure 1 shows the research model and the hypotheses formulated.

3. Materials and Methods

3.1. Sample

Starting from the main objective of analysing the influence of TBL on countries’ ED, a sample of 38 OECD countries and the period from 2006 to 2019 were considered.
HDI data were collected from the United Nations Development Programme [103] and SSI data from the Technische Hochschule Köln [65]. HDI was used as a proxy for ED, which was previously used as the dependent variable by authors Hussain and Dey [104] and Zelenkov and Lashkevich [105]. The three dimensions (human wellbeing, environmental wellbeing, and economic wellbeing) and the seven categories (basic needs, personal development and health, well-balanced society, natural resources, climate and energy, transition, and economy) of the SSI represented the TBL and were the independent variables. These SSI variables as measures of TBL were used by authors Larson [69] and Rodríguez-Rosa et al. [106]. Table 2 contains a description of the dependent and independent variables.

3.2. Methods

As the sample involved panel data, a quantitative methodology was used, as described by Jain and Nagpal [107] and Mance and Kruni [108]. Firstly, a statistical analysis of the dependent and independent variables was conducted. Then, the formulated hypotheses were tested through the estimation of five multiple linear regressions, using the generalised method of moments (GMM). GMM was proposed by Arellano and Bond [109] and later developed by Arellano and Bover [110] and Blundell and Bond [111]; allows obtaining efficient estimates. This method is extensively used when dynamic panels constitute the sample because it is asymptotically normal and consistent over large samples, demanding no specification of the distribution of error terms [112,113]. It also allows dealing with autocorrelation problems typical of this type of sample, as well as with the potential presence of endogeneity and heteroskedasticity [114,115,116,117,118,119]. In addition to providing information about the dynamic behaviour of an individual, it increases the accuracy of estimates [120,121,122].
The estimated models were assumed to be based on Equation (1).
Y i t = β 1 Y i t 1 + β 2 Z i t + μ i t + e i t ,
where Y i t is the HDI as a measure of economic development, Y i t 1 is the lagged HDI variable for the country i in the period t 1 , Z denotes the 10 independent variables concerning the three dimensions and the seven categories of the SSI, μ represents the unobserved effects at the country level, and e is the error term.

4. Results

Table 3 contains the statistical description of the dependent and independent variables. The sample consisted of 304 observations from 2006 to 2019.
The minimum value of the dependent variable HDI was 0.70 in Colombia in 2006, while the maximum value was 0.96 in Norway in 2019; the mean was 0.88 and the median was 0.90. The low value of the standard deviation of 0.054 makes it evident that a large number of the countries in the sample were clustered around the mean.
Regarding the independent variables, and considering the dimensions of the SSI, it was observed that the HuW had its highest value in Finland, i.e., 9.10, and its lowest value in Colombia, i.e., 5.57; its average was 8.06. EnW had its highest value in Costa Rica in 2014, its lowest in South Korea in 2019, and an average of 3.68. Lastly, EcW had its highest value in Switzerland in 2018, its lowest value in Greece in 2016, and an average of 5.90. Concerning the categories, BN had the maximum value of 10, which was achieved by 27 countries in the different years, while the lowest value of 8.55 was achieved in Colombia in 2006; its average was 9.86. In PD & H, the highest value of 9.50 was found in Iceland in 2019, the lowest value of 6.79 was found in Turkey in 2006, and the average was 8.30. For WS, the highest value of 8.34 was encountered in Finland in 2006, the lowest value of 2.74 was also found in 2006 but in Colombia, and the average was 6.43. NR presented the highest value of 8.80 in New Zealand in 2018, the lowest value of 1.80 in 2019 in Norway, and an average of 5.40.
Regarding C & E, the highest value was seen in 2014 in Costa Rica with 6.62, the lowest was seen in 2006 in Luxembourg, and the average was 2.89. Tr had its highest value of 9.51 in Sweden in 2016, its lowest value in Colombia in 2019, and an average of 6.6. Lastly, Ec had its highest value of 8.69 in Norway, its lowest value in Greece in 2018, and an average of 5.67.
The formulated hypotheses were tested in the Eviews10 software (from IHS Markit, Irvine, United States of America) and five multiple linear regression models were estimated (Table 4). Model 1 considers the three dimensions of SSI aggregated, while model 2 considers the disaggregation of the three dimensions of TBL into seven categories of SSI (three of the social dimension, two of the environmental dimension, and two of the economic dimension). Model 3 is made up of the three categories that make up the social dimension of SSI; model 4 is made up of the two categories that make up the environmental dimension of SSI; model 5 is made up of the two categories that make up the economic dimension of SSI.
In model 1, the influence of the social, environmental, and economic dimensions on the HDI when aggregated was analysed. It can be concluded that only the social dimension had a positive economic influence on HDI in OECD countries. The results showed a significant and positive influence of human wellbeing on HDI (β = 0.043). On the other hand, the relationship between HDI and environmental wellbeing was significant and negative (β = −0.016). Lastly, the relationship between economic wellbeing and HDI was not significant. Thus, Hypothesis H1a was confirmed, but Hypotheses H1b and H1c were rejected.
Turning to the categories that make up each of the three dimensions of the TBL, model 2 was used to analyse the breakdown of the dimensions into seven categories. It was found that the categories that concern the social and economic dimensions had a positive influence on HDI, while those that represent the environmental dimension did not have a positive influence on HDI. That is, the basic needs variable had a positive influence on HDI (β = 0.056); the personal development and health variable also had a positive influence on HDI (β = 0.066); lastly, the well-balanced society variable also had a positive influence on HDI (β = 0.005). Thus, Hypotheses H2a, H2b, and H2c were accepted. Regarding the variables of the environmental dimension, the variables of natural resources and climate and energy had a negative influence on HDI (β = −0.002 and β = −0.010, respectively). Thus, Hypotheses H2d and H2e were rejected. Lastly, regarding the variables representing the economic dimension, the transition variable had a β of 0.002, and the economy variable had a β of 0.002. That is, they had a positive influence on HDI, leading to the acceptance of Hypotheses H2f and H2g.
According to model 3, where only the aggregation of the categories that represent the social dimension of TBL was considered, it was found that they had a positive influence on HDI. That is, the variable basic needs had β = 0.080, the variable personal development and health had β = 0.057, and the variable well-balanced society had β = 0.008, leading to the acceptance of Hypotheses H3a, H3b, and H3c.
In turn, in model 4, which only considers the aggregation of the categories that translate the TBL’s environmental dimension, the variables did not have a positive influence on the HDI. That is, for the variable natural resources, β = −0.011 was found, whereas, for the variable climate and energy, β = −0.019 was found. Thus, Hypotheses H4a and H4b were rejected.
Lastly, in model 5, which observes the behaviour of the categories representing the economic dimension when aggregated, the variable transition had a positive influence on HDI (β = 0.010), whereas the economy variable was not statistically significant. Therefore, hypothesis H5a was accepted, but H5b was rejected. Table 5 presents a summary of the results.

5. Discussion

Human wellbeing encompasses categories that consider the satisfaction of the population’s basic needs, personal development, and the health and balance of society. Therefore, it is easy to understand that this dimension has a positive influence on HDI, as found in the study, as activities that provide the attainment of satisfaction of these categories are themselves drivers of economic development. Statements from studies prior to this stated that food insecurity is higher in low-income countries [123,124]. Cultural characteristics have the power to affect ED through the activity of institutions [33]. Moreover, the integration of girls into education [125], female empowerment [126], and education [127] have a positive outcome on the generation of ED. Health efforts also promote a healthy and productive population [128].
Environmental wellbeing consists of two categories, natural resources and climate and energy. Environmental protection has been perceived as an obstacle to ED [129], which is not a consensual idea [130]. The results indicate no positive effect on HDI when environmental wellbeing increases. This finding is in line with the study of Lai et al. [131], in which ED suffered negative effects from environmental protection. Furthermore, Peng et al. [130] concluded that environmental protection could slow down ED in the short run. However, there is a growing awareness on the part of governments that ED can be negatively affected by climate change [132].
The effect of economic wellbeing on HDI was not statistically significant, which may be explained by the conflict that its indicators carry and that translate into the conflicts between economic growth and economic development. The economic dimension denotes the concern with profit to the detriment of environmental and social concerns [101]. When analysed, it can be seen that it represents growth measures whose nature is quantitative and that it does not translate the level of the quality of life in society [102]. Furthermore, the improvement of economic indicators is not achieved without costs to the environment [133]. There are a series of problems resulting from economic growth [134].
Turning to the categories that make up each of the SSI dimensions, these categories were analysed in different models. Starting with the categories that make up human wellbeing (basic needs, personal development and health, and a well-balanced society), through this study, it was found that their influence on ED was positive. This was the case whether they were analysed together with the other SSI categories (model 2) or when they were chosen as the elements that make up model 3, reflecting the social dimension of TBL. Thus, the basic needs category, encompassing the indicators of sufficient food, sufficient to drink, and safe sanitation, had a positive influence on the ED. The possibility of access to safe water provides enormous opportunities for ED [135]. Safe sanitation is elementary for ED, and its implementation is a good investment [136,137]. The personal development and health category had similar behaviour, influencing ED positively in both models. This category was composed of the indicator’s education, healthy life, and gender equality, and it had a positive influence on ED. In fact, the results reinforce the results of Pan [138], stating that ED can be stimulated by the government through the expansion of its investment in education. Education is a basic condition for rapid ED [139]. An increase in life expectancy brings a higher return [140,141,142]. ED can be promoted by gender equality, and accounting for its multiple dimensions is vital for ED [143]. The well-balanced society category aggregated income distribution, population growth, and good governance indicators. It also had a positive influence on ED in both models, corroborating previous findings. In line with these reflections are those of Tian and Li [144], who considered income distribution as a crucial element that influences welfare and social stability, as well as of Dutt and Tsetlin [145], who saw high degrees of inequality as having a corrosive influence on ED. The population growth indicator reflected that for resources, nature, and food supply, a decrease in population would be positive. Its positive influence on ED is in line with the claims of Bloom et al. [142], who argued that a decrease in the number of children leads to an increase in income in the short and long term, and Baldanzi [146], according to whom a lower rate of population growth is related to faster economic growth. There is also empirical evidence that the quality of political institutions highlights ED [147] and promotes it [148].
Attention is now given to the categories that make up environmental wellbeing. Here again, they were analysed from two perspectives: together with all other SSI categories (model 2) and as representatives of the environmental dimension of TBL (model 4). These categories were as follows: natural resources (with the indicators biodiversity, renewable water resources and consumption) and climate and energy (energy use, energy savings, greenhouse gases, and renewable energy). The results of these categories had a negative influence on ED. Natural capital puts pressure on human capital and reduces the speed of ED [139]. Lai et al. [131] concluded that ED suffers negative effects from environmental protection, and Duan et al. [149] assumed that protected environmental areas have a negative effect on income and increase inequality.
Lastly, the economic wellbeing dimension encompassed two categories: transition and economy. Model 2 encompassed a study considering all categories and their positive influence on ED. In the model in which they were considered isolated and as representatives of the economic part of the TBL (model 5), the transition category had a positive influence, while the economy category is not statistically significant. The transition category consisted of the indicators organic farming and genuine savings. Earlier evidence that organic farming may constitute an opportunity for ED was found [150], and its adoption is subject to monetary considerations [151]. On a national level, genuine savings represents a key indicator for ED [152,153], and, when underpinned by environmental quality and natural capital assets, it results in increased wealth [154]. In certain circumstances, it precedes economic growth [155]. The economy category considered in model 2 had a positive influence on ED; however, when considered in model 5, it was not statistically significant. Bear in mind that this dimension mirrors the indicators GDP, employment, and public debt; thus, it is easy to agree with Schumpeter’s view that finance has great importance for ED and improves economic efficiency [156], and that, in relation to employment, when there is a qualitative increase in the production of employment, economic complexity also increases and the countries which achieve this have a favourable ED [35]. In relation to public debt, there is a discussion about whether or not it is an obstacle to economic development since it may limit or condition the actions of governments, because, when public debt is high, it constitutes a restriction to economic development [157].
Reflections of Zapf [158] should also be considered because, although this study was longitudinal, it could be assumed that a link between the ED and the variables adopted as representatives of the TBL may exist. In this case, it is possible that ED itself influences the behaviour of the TBL dimensions and the studied categories. In addition to this, there may be other variables that can influence the dependent and independent variables, which will produce a relationship between them.

6. Conclusions

The TBL approach is central to the progress of ED, and little attention has been paid to it [17]. This study aimed to analyse the influence of the triple bottom line (TBL) on economic development (ED). It can be concluded that the social dimension of the TBL has a positive influence on ED, the environmental dimension has a negative influence on ED, and the economic dimension of the TBL, not having a positive influence on ED in all the analysed aspects, is a translator of conflicting synergies.
It should be noted that the fact that the model not only represents the aggregated dimensions of the TBL, but also the aggregation of the categories that were elected as constituents of the TBL, as well as the individual consideration of each of the dimensions, allowed the conclusions to be supported by more detailed reflections. This allowed for a better translation of the spirit of the hypotheses made.
This study considered HDI as a proxy for ED, and this indicator encapsulated some limitations that were reinforced by the results. It becomes even more evident the need for theoretical reflection to consider the inclusion in the HDI of indicators that translate the environmental dimension into the ED. The biocapacity of forests, cropland, grazing land and fisheries, and carbon emissions [159], CO2 emissions per capita [43,160,161], or CO2 emissions and material footprint [46] could be some examples of indicators.
Despite the contributions of this study, it is not without limitations. It is possible that a reversed causation problem exists and that unobserved factors that simultaneously affect TBL and ED were not considered. In future studies, this causal relationship between TBL and ED should be further investigated. The use of SSI to measure TBL and of HDI to measure ED instead of other variables may have biased the results. Additionally, the choices made when performing the econometric techniques may have influenced the results, as suggested by Dogan and Turkekul [162].
To broaden the understanding of the influences of TBL in ED, future research should take a three-pronged direction. That is, in order to seek avenues that solidify the driving role of the social dimension of TBL in ED, the factors that influence social sustainability should be investigated. Bearing in mind that the planet’s finite natural resources are the glue that binds societies and generations, the role of the environmental dimension of TBL needs further exploration to assess the conditions that affect environmental sustainability. Lastly, it should be noted that it is vital to clarify the direction of the forces that drive the economic dimension of TBL. Therefore, further analyses need to be carried out to explain the drivers of economic sustainability.

6.1. Managerial Implications

This study contributes to the understanding of the influence that TBL and each of its dimensions exert on ED. This urgent and necessary understanding contributes to the alignment of measures that must be taken so that sustainable development goals are achieved. It should be noted that supporting the progress of the social dimension of TBL is not only a guarantee of a qualitative improvement in the lives of populations but also a driver of ED. Thus, governments should consider investments in projects that increase the level of human wellbeing as a way of stimulating ED. Policies are also needed to improve coordination between environmental protection and ED objectives so that conflicting synergies between these two forces can converge and improve the ED framework. Governments should also assess and address vulnerabilities arising from high public debt to increase their capacity to implement policies that foster ED.

6.2. Practical/Social Implications

This study highlighted the need for the academy to contribute to the reflection on the best paths to take towards an ED that must be sustainable, and that represents not only a struggle for survival, but also the concerns of social, environmental, and economic justice. It strengthens the link between TBL and ED by showing the need for the evolution of TBL to this academic field.
TBL aims to create a sustainable base (social, environmental, and economic) that can be enjoyed fairly. It is on the basis of this foundation that an ED that focuses more on the general wellbeing of populations than on the mere sum of advances in economic growth can be created. It is, therefore, imperative to expand the study of TBL to include ED, to which this analysis contributes, reducing the scarcity of studies that relate these two themes. It also reduces the lack of studies considering TBL and ED at the country level. Furthermore, the investigation of the influences of the TBL dimensions on ED adds new perspectives to earlier discussions. It also identifies the social dimension as inciting ED, the environmental dimension as decelerating ED, and the economic dimension as encompassing conflicting synergies in ED.

Author Contributions

Conceptualisation, E.N.; methodology, E.N.; formal analysis, E.N.; investigation, E.N.; writing—original draft preparation, E.N.; writing—review and editing, S.G. and J.M.L.; supervision, S.G. and J.M.L. All authors have read and agreed to the published version of the manuscript.

Funding

The NECE-UBI, Research Centre for Business Sciences, and this work are funded by the FCT—Fundação para a Ciência e a Tecnologia, IP, project UIDB/04630/2020.

Institutional Review Board Statement

Not applicable.

Informed Consent Statement

Not applicable.

Data Availability Statement

Publicly available datasets were analysed in this study. Human Development Reports. Available online: https://hdr.undp.org/en/content/human-development-index-hdi (accessed on 4 February 2022). Sustainable Society Index. Available online: https://ssi.wi.th-koeln.de/historical_data.html (accessed on 4 February 2022).

Conflicts of Interest

The authors declare no conflict of interest.

References

  1. Cooke, F.L.; Dickmann, M.; Parry, E. Building sustainable societies through human-centred human resource management: Emerging issues and research opportunities. Int. J. Hum. Resour. Manag. 2022, 33, 1–15. [Google Scholar] [CrossRef]
  2. Liu, W.; Chen, X. Natural resources commodity prices volatility and economic uncertainty: Evaluating the role of oil and gas rents in COVID-19. Resour. Policy 2022, 76, 102581. [Google Scholar] [CrossRef]
  3. Chofreh, A.G.; Goni, F.A.; Klemeš, J.J.; Seyed Moosavi, S.M.; Davoudi, M.; Zeinalnezhad, M. Covid-19 shock: Development of strategic management framework for global energy. Renew. Sustain. Energy Rev. 2021, 139, 110643. [Google Scholar] [CrossRef]
  4. Polcyn, J.; Us, Y.; Lyulyov, O.; Pimonenko, T.; Kwilinski, A. Factors influencing the renewable energy consumption in selected european countries. Energies 2022, 15, 108. [Google Scholar] [CrossRef]
  5. Elkington, J. Governance for sustainability. Corp. Gov. Int. Rev. 2006, 14, 522–529. [Google Scholar] [CrossRef]
  6. Farooq, Q.; Fu, P.H.; Liu, X.; Hao, Y.H. Basics of macro to microlevel corporate social responsibility and advancement in triple bottom line theory. Corp. Soc. Responsib. Environ. Manag. 2021, 28, 969–979. [Google Scholar] [CrossRef]
  7. Solaimani, S.; Sedighi, M. Toward a holistic view on lean sustainable construction: A literature review. J. Clean. Prod. 2020, 248, 119213. [Google Scholar] [CrossRef]
  8. Ranjbari, M.; Shams Esfandabadi, Z.; Zanetti, M.C.; Scagnelli, S.D.; Siebers, P.O.; Aghbashlo, M.; Peng, W.; Quatraro, F.; Tabatabaei, M. Three pillars of sustainability in the wake of COVID-19: A systematic review and future research agenda for sustainable development. J. Clean. Prod. 2021, 297, 126660. [Google Scholar] [CrossRef]
  9. Lederwasch, A.; Mukheibir, P. The triple bottom line and progress toward ecological sustainable development: Australia’s coal mining industry as a case study. Resources 2013, 2, 26–38. [Google Scholar] [CrossRef] [Green Version]
  10. Schumpeter, J. The Theory of Economic Development; Harvard University Press: Cambridge, UK, 1934. [Google Scholar]
  11. Schumpeter, J. Capitalism, Socialism and Democracy; Harper & Brothers Publishers: New York, NY, USA, 1947. [Google Scholar]
  12. Porter, M.E. Location, competition, and economic development: Local clusters in a global economy. Econ. Dev. Q. 2000, 14, 15–34. [Google Scholar] [CrossRef]
  13. Ahmad, N.; Derrible, S.; Managi, S. A network-based frequency analysis of Inclusive Wealth to track sustainable development in world countries. J. Environ. Manag. 2018, 218, 348–354. [Google Scholar] [CrossRef] [PubMed] [Green Version]
  14. Manzhynski, S.; Figge, F.; Hassel, L. Sustainable Value creation of nine countries of the Baltic region. Value, changes and drivers. J. Clean. Prod. 2015, 108, 637–646. [Google Scholar] [CrossRef]
  15. Tseng, M.L.; Chang, C.H.; Lin, C.W.R.; Wu, K.J.; Chen, Q.; Xia, L.; Xue, B. Future trends and guidance for the triple bottom line and sustainability: A data driven bibliometric analysis. Environ. Sci. Pollut. Res. 2020, 27, 33543–33567. [Google Scholar] [CrossRef] [PubMed]
  16. Collste, D.; Pedercini, M.; Cornell, S.E. Policy coherence to achieve the SDGs: Using integrated simulation models to assess effective policies. Sustain. Sci. 2017, 12, 921–931. [Google Scholar] [CrossRef] [PubMed]
  17. Hammer, J.; Pivo, G. The Triple Bottom Line and Sustainable Economic Development Theory and Practice. Econ. Dev. Q. 2017, 31, 25–36. [Google Scholar] [CrossRef] [Green Version]
  18. Isil, O.; Hernke, M.T. The Triple Bottom Line: A Critical Review from a Transdisciplinary Perspective. Bus. Strateg. Environ. 2017, 26, 1235–1251. [Google Scholar] [CrossRef]
  19. Walker, K.; Yu, X.; Zhang, Z. All for one or all for three: Empirical evidence of paradox theory in the triple-bottom-line. J. Clean. Prod. 2020, 275, 122881. [Google Scholar] [CrossRef]
  20. Lee, Y.S. New general theory of economic development: Innovative growth and distribution. Rev. Dev. Econ. 2020, 24, 402–423. [Google Scholar] [CrossRef]
  21. Montenegro, A. Income, Equality, and Economic Development. Soc. Sci. Q. 2021, 102, 508–522. [Google Scholar] [CrossRef]
  22. Lele, S.M. Sustainable Development: A Critical Review. World Dev. 1991, 19, 607–621. [Google Scholar] [CrossRef]
  23. Silva, M.; Klasen, S. Gender inequality as a barrier to economic growth: A review of the theoretical literature. Rev. Econ. Househ. 2021, 19, 581–614. [Google Scholar] [CrossRef]
  24. Iftikhar, M.N.; Justice, J.B.; Audretsch, D.B. The knowledge spillover theory of entrepreneurship: An Asian perspective. Small Bus. Econ. 2022, 1–26. [Google Scholar] [CrossRef]
  25. Seers, D. The Meaning of Development; IDS Communication 44; IDS: Brighton, UK, 1969. [Google Scholar]
  26. Owens, E. The Future of Freedom in the Developing World: Economic Development as Political Reform; Pergamon Press: New York, NY, USA, 1987. [Google Scholar]
  27. Daly, H.E. Toward some operational principles of sustainable development. Ecol. Econ. 1990, 2, 1–6. [Google Scholar] [CrossRef]
  28. Habib, R.; Afzal, M.T. Sections-based bibliographic coupling for research paper recommendation. Scientometrics 2019, 119, 643–656. [Google Scholar] [CrossRef]
  29. Fan, Y.; Fang, M.; Zhang, X.; Yu, Y.D. Will the economic growth benefit public health? Health vulnerability, urbanization and COVID-19 in the USA. Ann. Reg. Sci. 2022, 1–19. [Google Scholar] [CrossRef] [PubMed]
  30. Usman, M.; Balsalobre-lorente, D. Environmental concern in the era of industrialization: Can financial development, renewable energy and natural resources alleviate some load? Energy Policy 2022, 162, 112780. [Google Scholar] [CrossRef]
  31. Umurzakov, U.; Tosheva, S.; Salahodjaev, R. Tourism and Sustainable Economic Development: Evidence from Belt and Road Countries. J. Knowl. Econ. 2022, 1–14. [Google Scholar] [CrossRef]
  32. Contreras, S.A. One size does not fit all: Evaluating the impact of microenterprise measurement on policy evaluation. Ann. Reg. Sci. 2022, 1–27. [Google Scholar] [CrossRef]
  33. Tabellini, G. Culture and institutions: Economic development in the regions of europe. J. Eur. Econ. Assoc. 2010, 8, 677–716. [Google Scholar] [CrossRef]
  34. Liu, F.; Walheer, B. Financial inclusion, financial technology, and economic development: A composite index approach. Empir. Econ. 2022, 1–31. [Google Scholar] [CrossRef]
  35. Gala, P.; Camargo, J.; Magacho, G.; Rocha, I. Sophisticated jobs matter for economic complexity: An empirical analysis based on input-output matrices and employment data. Struct. Change Econ. Dyn. 2018, 45, 1–8. [Google Scholar] [CrossRef]
  36. Bonneau, D.D.; Hall, J.C.; Zhou, Y. Institutional implant and economic stagnation: A counterfactual study of Somalia. Public Choice 2022, 190, 486–503. [Google Scholar] [CrossRef]
  37. Rodríguez-Antón, J.M.; Rubio-Andrada, L.; Celemín-Pedroche, M.S.; Ruíz-Peñalver, S.M. From the circular economy to the sustainable development goals in the European Union: An empirical comparison. Int. Environ. Agreem. Polit. Law Econ. 2022, 22, 67–95. [Google Scholar] [CrossRef]
  38. Ferro, C.; Padin, C.; Hogevold, N.; Svensson, G.; Varela, J.C.S. Validating and expanding a framework of a triple bottom line dominant logic for business sustainability through time and across contexts. J. Bus. Ind. Mark. 2019, 34, 95–116. [Google Scholar] [CrossRef]
  39. De Janvry, A.; Sadoulet, E. Development Economics: Theory and Practice; Taylor and Francis: New York, NY, USA, 2016. [Google Scholar]
  40. Yang, X.; He, L.; Xia, Y.; Chen, Y. Effect of government subsidies on renewable energy investments: The threshold effect. Energy Policy 2019, 132, 156–166. [Google Scholar] [CrossRef]
  41. Qian, X.; Huang, L.; Wang, X.; Wang, S. Detecting pivotal countries of China’s OFDI in the “Belt and Road” initiative: The perspective of similarity of doing business. Int. Rev. Econ. Financ. 2022, 77, 296–311. [Google Scholar] [CrossRef]
  42. Kubiszewski, I.; Costanza, R.; Franco, C.; Lawn, P.; Talberth, J.; Jackson, T.; Aylmer, C. Beyond GDP: Measuring and achieving global genuine progress. Ecol. Econ. 2013, 93, 57–68. [Google Scholar] [CrossRef] [Green Version]
  43. Biggeri, M.; Mauro, V. Towards a more ‘Sustainable’ Human Development Index: Integrating the environment and freedom. Ecol. Indic. 2018, 91, 220–231. [Google Scholar] [CrossRef]
  44. UNDP. Human Development Report 1990; Oxford University Press: New York, NY, USA, 1990; Available online: http://hdr.undp.org/en/reports/global/hdr2010/ (accessed on 4 February 2022).
  45. Klugman, J.; Rodriguez, F.; Choi, H.J. The HDI 2010: New controversies, old critiques. J. Econ. Inequal. 2011, 9, 249–288. [Google Scholar] [CrossRef]
  46. Hickel, J. The sustainable development index: Measuring the ecological efficiency of human development in the anthropocene. Ecol. Econ. 2020, 167, 106331. [Google Scholar] [CrossRef]
  47. Medda, T.; Palmisano, F.; Sacchi, A. Informal we stand? The role of social progress around the world. Int. Rev. Econ. Financ. 2022, 78, 660–675. [Google Scholar] [CrossRef]
  48. TN. 2020 Human Development Report Technical Notes. 2020. Available online: http://hdr.undp.org/sites/default/files/hdr2020_technical_notes.pdf (accessed on 4 February 2022).
  49. Togtokh, C. Time to stop celebrating the polluters. Nature 2011, 479, 269. [Google Scholar] [CrossRef] [PubMed]
  50. Banday, U.J.; Kocoglu, M. Modelling Simultaneous Relationships Between Human Development, Energy, and Environment: Fresh Evidence from Panel Quantile Regression. J. Knowl. Econ. 2022, 1–23. [Google Scholar] [CrossRef]
  51. Saba, C.S.; Ngepah, N. Nexus between Defence Spending, Economic Growth and Development: Evidence from a Disaggregated Panel Data Analysis. Econ. Change Restruct. 2022, 55, 109–151. [Google Scholar] [CrossRef]
  52. Silveira, N.J.C.; Ferraz, D.; Polloni-Silva, E.; De Mello, D.S.; Falguera, F.P.S.; Moralles, H.F. Modeling the building blocks of country-level absorptive capacity: Comparing developed and emergent economies. Bull. Econ. Res. 2021, 1–42. [Google Scholar] [CrossRef]
  53. Ivanova, E.; Masarova, J. Performance evaluation of the Visegrad Group countries. Econ. Res.—Ekon. Istraživanja 2018, 31, 270–289. [Google Scholar] [CrossRef] [Green Version]
  54. Bojanic, A.N.; Collins, L.P.A. Differential Effects of Decentralization on Income Inequality: Evidence from Developed and Developing Countries. Empir. Econ. 2021, 60, 1969–2004. [Google Scholar] [CrossRef]
  55. Rende, S.; Donduran, M. Neighborhoods in Development: Human Development Index and Self-organizing Maps. Soc. Indic. Res. 2013, 110, 721–734. [Google Scholar] [CrossRef]
  56. He, Q.; Gallear, D.; Ghobadian, A.; Ramanathan, R. Managing knowledge in supply chains: A catalyst to triple bottom line sustainability. Prod. Plan. Control 2019, 30, 448–463. [Google Scholar] [CrossRef]
  57. Wu, J.G. Landscape sustainability science: Ecosystem services and human well-being in changing landscapes. Landsc. Ecol. 2013, 28, 999–1023. [Google Scholar] [CrossRef]
  58. Hourneaux, F., Jr.; da Silva Gabriel, M.L.; Gallardo-Vázquez, D.A. Triple bottom line and sustainable performance measurement in industrial companies. Rev. Gestão 2018, 25, 413–429. [Google Scholar] [CrossRef] [Green Version]
  59. Holden, E.; Linnerud, K.; Banister, D. Sustainable development: Our Common Future revisited. Glob. Environ. Chang. Policy Dimens. 2014, 26, 130–139. [Google Scholar] [CrossRef] [Green Version]
  60. Kleindorfer, P.R.; Singhal, K.; Van Wassenhove, L.N. Sustainable Operations Management. Prod. Oper. Manag. 2005, 14, 482–492. [Google Scholar] [CrossRef]
  61. Gimenez, C.; Sierra, V.; Rodon, J. Sustainable operations: Their impact on the triple bottom line. Intern. J. Prod. Econ. 2012, 140, 149–159. [Google Scholar] [CrossRef]
  62. Carter, C.R.; Rogers, D.S. A framework of sustainable supply chain management: Moving toward new theory. Int. J. Phys. Distrib. Logist. Manag. 2008, 38, 360–387. [Google Scholar] [CrossRef]
  63. Yun, G.; Yalcin, M.G.; Hales, D.N.; Kwon, H.Y. Interactions in sustainable supply chain management: A framework review. Int. J. Logist. Manag. 2019, 30, 140–173. [Google Scholar] [CrossRef] [Green Version]
  64. Gonzalez-Cabezas, D.; Zaror, C.; Herrera, M.A. Comparative assessment of sustainable development in South American countries on the basis of the Sustainable Society Index. Int. J. Sustain. Dev. World Ecol. 2019, 26, 90–98. [Google Scholar] [CrossRef]
  65. Technische Hochschule Köln. Sustainable Society Index. 2022. Available online: https://ssi.wi.th-koeln.de/historical_data.html (accessed on 4 February 2022).
  66. Van de Kerk, G.; Manuel, A.R. A comprehensive index for a sustainable society: The SSI—the Sustainable Society Index. Ecol. Econ. 2008, 66, 228–242. [Google Scholar] [CrossRef]
  67. Phillips, J. An initial study of the dynamic influences and interactions upon levels of sustainability at the global spatial scale. Anthr. Rev. 2021, 1–43. [Google Scholar] [CrossRef]
  68. Kovacs, E.; Hoaghia, M.A.; Senila, L.; Scurtu, D.A.; Dumitras, D.E.; Roman, C. Sustainability Problematization and Modeling Opportunities. Sustainability 2020, 12, 10046. [Google Scholar] [CrossRef]
  69. Larson, P.D. Relationships between logistics performance and aspects of sustainability: A cross-country analysis. Sustainability 2021, 13, 623. [Google Scholar] [CrossRef]
  70. Tang, J.; Zhu, H.L.; Liu, Z.; Jia, F.; Zheng, X.X. Urban Sustainability Evaluation under the Modified TOPSIS Based on Grey Relational Analysis. Int. J. Environ. Res. Public Health 2019, 16, 256. [Google Scholar] [CrossRef] [PubMed] [Green Version]
  71. Ding, Y.; Fu, Y.; Lai, K.K.; John Leung, W.K. Using Ranked Weights and Acceptability Analysis to Construct Composite Indicators: A Case Study of Regional Sustainable Society Index. Soc. Indic. Res. 2018, 139, 871–885. [Google Scholar] [CrossRef]
  72. Schönborn, G.; Berlin, C.; Pinzone, M.; Hanisch, C.; Georgoulias, K.; Lanz, M. Why social sustainability counts: The impact of corporate social sustainability culture on financial success. Sustain. Prod. Consum. 2019, 17, 1–10. [Google Scholar] [CrossRef]
  73. Munny, A.A.; Ali, S.M.; Kabir, G.; Moktadir, M.A.; Rahman, T.; Mahtab, Z. Enablers of social sustainability in the supply chain: An example of footwear industry from an emerging economy. Sustain. Prod. Consum. 2019, 20, 230–242. [Google Scholar] [CrossRef]
  74. Cooper, J.; Stamford, L.; Azapagic, A. Social sustainability assessment of shale gas in the UK. Sustain. Prod. Consum. 2018, 14, 1–20. [Google Scholar] [CrossRef] [Green Version]
  75. Usmani, M.S.; Wang, J.L.; Ahmad, N.; Ullah, Z.; Iqbal, M.; Ismail, M. Establishing a corporate social responsibility implementation model for promoting sustainability in the food sector: A hybrid approach of expert mining and ISM-MICMAC. Environ. Sci. Pollut. Res. 2021, 29, 8851–8872. [Google Scholar] [CrossRef]
  76. Zott, C.; Amit, R. Business model design: An activity system perspective. Long Range Plann. 2010, 43, 216–226. [Google Scholar] [CrossRef]
  77. Kroeger, A.; Weber, C. Developing a conceptual framework for comparing social value creation. Acad. Manag. Rev. 2014, 39, 513–540. [Google Scholar] [CrossRef]
  78. Pearce, J.A.; Doh, J.P. The high impact of collaborative social initiatives. MIT Sloan Manag. Rev. 2005, 46, 30. [Google Scholar]
  79. Chell, E. Social enterprise and entrepreneurship: Towards a convergent theory of the entrepreneurial process. Int. Small Bus. J. 2007, 25, 5–26. [Google Scholar] [CrossRef]
  80. Foster, W.; Bradach, J. Should nonprofits seek profits? Harv. Bus. Rev. 2005, 83, 92–100. [Google Scholar] [PubMed]
  81. Narangajavana, Y.; Gonzalez-Cruz, T.; Garrigos-Simon, F.J.; Cruz-Ros, S. Measuring social entrepreneurship and social value with leakage. Definition, analysis and policies for the hospitality industry. Int. Entrep. Manag. J. 2016, 12, 911–934. [Google Scholar] [CrossRef] [Green Version]
  82. Mair, J.; Martí, I. Social entrepreneurship research: A source of explanation, prediction, and delight. J. World Bus. 2006, 41, 36–44. [Google Scholar] [CrossRef]
  83. Murphy, P.J.; Coombes, S.M. A model of social entrepreneurial discovery. J. Bus. Ethics 2009, 87, 325–336. [Google Scholar] [CrossRef]
  84. Certo, S.T.; Miller, T. Social entrepreneurship: Key issues and concepts. Bus. Horiz. 2008, 51, 267–271. [Google Scholar] [CrossRef]
  85. Goodland, R. The concept of environmental sustainability. Annu. Rev. Ecol. Syst. 1995, 26, 1–24. [Google Scholar] [CrossRef]
  86. Roy, S.; Das, M.; Ali, S.M.; Raihan, A.S.; Paul, S.K.; Kabir, G. Evaluating strategies for environmental sustainability in a supply chain of an emerging economy. J. Clean. Prod. 2020, 262, 121389. [Google Scholar] [CrossRef]
  87. Goerner, S.J.; Lietaer, B.; Ulanowicz, R.E. Quantifying economic sustainability: Implications for free-enterprise theory, policy and practice. Ecol. Econ. 2009, 69, 76–81. [Google Scholar] [CrossRef]
  88. Tachega, M.A.; Yao, X.; Liu, Y.; Ahmed, D.; Ackaah, W.; Gabir, M.; Gyimah, J. Income Heterogeneity and the Environmental Kuznets Curve Turning Points: Evidence from Africa. Sustainability 2021, 13, 5634. [Google Scholar] [CrossRef]
  89. Rahnnan, M.; Aziz, S.; Hughes, M. The product-market performance benefits of environmental policy: Why customer awareness and firm innovativeness matter. Bus. Strateg. Environ. 2020, 29, 2001–2018. [Google Scholar] [CrossRef]
  90. Mofidi Chelan, M.; Alijanpour, A.; Barani, H.; Motamedi, J.; Azadi, H.; van Passel, S. Economic sustainability assessment in semi-steppe rangelands. Sci. Total Environ. 2018, 637, 112–119. [Google Scholar] [CrossRef] [PubMed]
  91. Dwivedi, A.; Paul, S.K. A framework for digital supply chains in the era of circular economy: Implications on environmental sustainability. Bus. Strateg. Environ. 2022, 1–26. [Google Scholar] [CrossRef]
  92. Bouguerra, A.; Hughes, M.; Cakir, M.S.; Tatoglu, E. Linking Entrepreneurial Orientation to Environmental Collaboration: A Stakeholder Theory and Evidence from Multinational Companies in an Emerging Market. Br. J. Manag. 2022, 1–25. [Google Scholar] [CrossRef]
  93. Zhang, X.; Hou, W. The impacts of e-tailer’s private label on the sales mode selection: From the perspectives of economic and environmental sustainability. Eur. J. Oper. Res. 2022, 296, 601–614. [Google Scholar] [CrossRef]
  94. Arya, P.; Srivastava, M.K.; Jaiswal, M.P. Modelling environmental and economic sustainability of logistics. Asia-Pacific J. Reg. Sci. 2020, 12, 73–94. [Google Scholar] [CrossRef]
  95. Alhaddi, H. Triple Bottom Line and Sustainability: A Literature Review. Bus. Manag. Stud. 2015, 1, 6. [Google Scholar] [CrossRef]
  96. Spangenberg, J.H. Economic sustainability of the economy: Concepts and indicators. Int. J. Sustain. Dev. 2005, 8, 47–64. [Google Scholar] [CrossRef]
  97. Lindahl, K.B.; Sténs, A.; Sandström, C.; Johansson, J.; Lidskog, R.; Ranius, T.; Roberge, J.M. The Swedish forestry model: More of everything? For. Policy Econ. 2017, 77, 44–55. [Google Scholar] [CrossRef] [Green Version]
  98. Brozzi, R.; Forti, D.; Rauch, E.; Matt, D.T. The Advantages of Industry 4.0 Applications for Sustainability: Results from a Sample of Manufacturing Companies. Sustainability 2020, 12, 3647. [Google Scholar] [CrossRef]
  99. Davis-Sramek, B.; Thomas, R.W.; Fugate, B.S. Integrating Behavioral Decision Theory and Sustainable Supply Chain Management: Prioritizing Economic, Environmental, and Social Dimensions in Carrier Selection. J. Bus. Logist. 2018, 39, 87–100. [Google Scholar] [CrossRef]
  100. Markley, M.J.; Davis, L. Exploring future competitive advantage through sustainable supply chains. Int. J. Phys. Distrib. Logist. Manag. 2007, 37, 763–774. [Google Scholar] [CrossRef]
  101. Busse, C. Doing Well by Doing Good? The Self-interest of Buying Firms and Sustainable Supply Chain Management. J. Supply Chain Manag. 2016, 52, 28–47. [Google Scholar] [CrossRef]
  102. Abad-Segura, E.; González-Zamar, M.D. Sustainable economic development in higher education institutions: A global analysis within the SDGs framework. J. Clean. Prod. 2021, 294, 126133. [Google Scholar] [CrossRef]
  103. United Nations Development Programe. Human Development Report. 2022. Available online: https://hdr.undp.org/en/content/human-development-index-hdi (accessed on 4 February 2022).
  104. Hussain, A.; Dey, S. Revisiting environmental Kuznets curve with HDI: New evidence from cross-country panel data. J. Environ. Econ. Policy 2021, 10, 324–342. [Google Scholar] [CrossRef]
  105. Zelenkov, Y.A.; Lashkevich, E.V. Fuzzy regression model of the impact of technology on living standards. Bus. Inform. 2020, 14, 67–81. [Google Scholar] [CrossRef]
  106. Rodríguez-Rosa, M.; Gallego-bravoÁlvarez, I.; Vicente-Galindo, M.P.; Galindo-Villardón, M.P. Are Social, Economic and Environmental Well-Being Equally Important in all Countries Around the World? A Study by Income Levels. Soc. Indic. Res. 2017, 131, 543–565. [Google Scholar] [CrossRef]
  107. Jain, M.; Nagpal, A. Relationship Between Environmental Sustainability and Human Development Index: A Case of Selected South Asian Nations. Vision 2019, 23, 125–133. [Google Scholar] [CrossRef]
  108. Mance, D.; Kruni, K. Protecting Species by Promoting Protected Areas and Human Development—A Panel Analysis. Sustainability 2021, 13, 11970. [Google Scholar] [CrossRef]
  109. Arellano, M.; Bond, S. Some tests of specification for panel data: Monte-carlo evidence and an application to employment equations. Rev. Econ. Stud. 1991, 58, 277–297. [Google Scholar] [CrossRef] [Green Version]
  110. Arellano, M.; Bover, O. Another look at the instrumental variable estimation of error-components models. J. Econom. 1995, 68, 29–51. [Google Scholar] [CrossRef] [Green Version]
  111. Blundell, R.; Bond, S. Initial conditions and moment restrictions in dynamic panel data models. J. Econom. 1998, 87, 115–143. [Google Scholar] [CrossRef] [Green Version]
  112. Greene, W.H. Econometric Analysis, 8th ed.; Pearson-Prentice Hall: Hoboken, NJ, USA, 2020. [Google Scholar]
  113. Hall, A.R. Generalized Method of Moments. In A Companion to Theoretical Econometrics; Blackwell Publishing Ltd: Malden, MA, USA, 2007; pp. 230–255. [Google Scholar]
  114. Kasman, S.; Kasman, A. Bank competition, concentration and financial stability in the Turkish banking industry. Econ. Syst. 2015, 39, 502–517. [Google Scholar] [CrossRef]
  115. Berger, A.N.; Klapper, L.F.; Turk-Ariss, R. Bank Competition and Financial Stability. J. Financ. Serv. Res. 2009, 35, 99–118. [Google Scholar] [CrossRef]
  116. Fu, X.Q.; Lin, Y.J.; Molyneux, P. Bank competition and financial stability in Asia Pacific. J. Bank. Financ. 2014, 38, 64–77. [Google Scholar] [CrossRef]
  117. Tabak, B.M.; Fazio, D.M.; Cajueiro, D.O. The relationship between banking market competition and risk-taking: Do size and capitalization matter? J. Bank. Financ. 2012, 36, 3366–3381. [Google Scholar] [CrossRef]
  118. Chortareas, G.E.; Garza-Garcia, J.G.; Girardone, C. Competition, efficiency and interest rate margins in Latin American banking. Int. Rev. Econ. Financ. 2012, 24, 93–103. [Google Scholar] [CrossRef]
  119. Kasman, A.; Carvallo, O. Financial stability, competition and efficiency in latin american and caribbean banking. J. Appl. Econ. 2014, 17, 301–324. [Google Scholar] [CrossRef]
  120. Din, S.U.; Khan, M.Y.; Khan, M.J.; Nilofar, M. Nexus Between Sustainable Development, Adjusted Net Saving, Economic Growth, and Financial Development in South Asian Emerging Economies. J. Knowl. Econ. 2021, 1–14. [Google Scholar] [CrossRef]
  121. Wang, Q.J.; Feng, G.F.; Chen, Y.E.; Wen, J.; Chang, C.P. The impacts of government ideology on innovation: What are the main implications? Res. Policy 2019, 48, 1232–1247. [Google Scholar] [CrossRef]
  122. Naresh, G.; Vasudevan, G.; Mahalakshmi, S.; Thiyagarajan, S. Spillover effect of US dollar on the stock indices of BRICS. Res. Int. Bus. Financ. 2018, 44, 359–368. [Google Scholar] [CrossRef]
  123. Smith, M.D.; Rabbitt, M.P.; Coleman-Jensen, A. Who are the World’s Food Insecure? New Evidence from the Food and Agriculture Organization’s Food Insecurity Experience Scale. World Dev. 2017, 93, 402–412. [Google Scholar] [CrossRef] [Green Version]
  124. Dudek, H. Households’ food insecurity in the V4 countries: Microeconometric analysis. Amfiteatru Econ. 2019, 21, 377–392. [Google Scholar] [CrossRef]
  125. Sommer, J.M.; Fallon, K.M. The pathway to improving human and economic development: Girls’ secondary education, governance, and education expenditures. Soc. Forces 2020, 99, 205–229. [Google Scholar] [CrossRef]
  126. Wyndow, P.; Li, J.; Mattes, E. Female Empowerment as a Core Driver of Democratic Development: A Dynamic Panel Model from 1980 to 2005. World Dev. 2013, 52, 34–54. [Google Scholar] [CrossRef]
  127. Cui, Y.; Martins, P.S. What drives social returns to education? A meta-analysis. World Dev. 2021, 148, 105651. [Google Scholar] [CrossRef]
  128. Gupta, S.; Verhoeven, M.; Tiongson, E.R. The effectiveness of government spending on education and health care in developing and transition economies. Eur. J. Polit. Econ. 2002, 18, 717–737. [Google Scholar] [CrossRef]
  129. Wang, Q.; Zhao, Z.; Shen, N.; Liu, T. Have Chinese cities achieved the win-win between environmental protection and economic development? from the perspective of environmental efficiency. Ecol. Indic. 2015, 51, 151–158. [Google Scholar] [CrossRef]
  130. Peng, B.; Sheng, X.; Wei, G. Does environmental protection promote economic development? From the perspective of coupling coordination between environmental protection and economic development. Environ. Sci. Pollut. Res. 2020, 27, 39135–39148. [Google Scholar] [CrossRef]
  131. Lai, Z.Z.; Ge, D.M.; Xia, H.B.; Yue, Y.L.; Wang, Z. Coupling coordination between environment, economy and tourism: A case study of China. PLoS ONE 2020, 15, e0228426. [Google Scholar] [CrossRef] [Green Version]
  132. Carraro, C. Climate change: Scenarios, impacts, policy, and development opportunities. Agric. Econ. 2016, 47, 149–157. [Google Scholar] [CrossRef]
  133. Charfeddine, L.; Mrabet, Z. The impact of economic development and social-political factors on ecological footprint: A panel data analysis for 15 MENA countries. Renew. Sustain. Energy Rev. 2017, 76, 138–154. [Google Scholar] [CrossRef]
  134. Brueckner, M.; Lederman, D. Inequality and economic growth: The role of initial income. J. Econ. Growth 2018, 23, 341–366. [Google Scholar] [CrossRef] [Green Version]
  135. Wydra, K.; Becker, P.; Aulich, H.K.; Wydra, P.; Becker, H.A. Sustainable solutions for solar energy driven drinking water supply for rural settings in Sub-Saharan Africa: A case study of Nigeria. J. Photonics Energy 2019, 9, 043106. [Google Scholar] [CrossRef] [Green Version]
  136. Hutton, G.; Patil, S.; Kumar, A.; Osbert, N.; Odhiambo, F. Comparison of the costs and benefits of the Clean India Mission. World Dev. 2020, 134, 105052. [Google Scholar] [CrossRef]
  137. Van Minh, H.; Hung, N.V. Economic Aspects of Sanitation in Developing Countries Environ. Health Insights 2011, 5, 63–70. [Google Scholar] [CrossRef]
  138. Pan, L. The impacts of education investment on skilled–unskilled wage inequality and economic development in developing countries. Econ. Model. 2014, 39, 174–181. [Google Scholar] [CrossRef]
  139. Gylfason, T. Natural resources, education, and economic development. Eur. Econ. Rev. 2001, 45, 847–859. [Google Scholar] [CrossRef]
  140. Kalemli-ozcan, S. A stochastic model of mortality, fertility, and human capital investment. J. Dev. Econ. 2003, 70, 103–118. [Google Scholar] [CrossRef]
  141. Turan, B. Life expectancy and economic development: Evidence from microdata. Rev. Dev. Econ. 2020, 24, 949–972. [Google Scholar] [CrossRef]
  142. Bloom, D.E.; Khoury, A.; Kufenko, V.; Prettner, K. Spurring Economic Growth through Human Development: Research Results and Guidance for Policymakers. Popul. Dev. Rev. 2021, 47, 377–409. [Google Scholar] [CrossRef]
  143. Perrin, F. Can the historical gender gap index deepen our understanding of economic development? J. Demogr. Econ. 2021, 1–39. [Google Scholar] [CrossRef]
  144. Tian, G.; Li, J. How Does Infrastructure Construction Affect Economic Development along the “Belt and Road”: By Promoting Growth or Improving Distribution? Emerg. Mark. Financ. Trade 2019, 55, 3332–3348. [Google Scholar] [CrossRef]
  145. Dutt, P.; Tsetlin, I. Income distribution and economic development: Insights from machine learning. Econ. Polit. 2021, 33, 1–36. [Google Scholar] [CrossRef]
  146. Baldanzi, A.; Bucci, A.; Prettner, K. Children’s health, human capital accumulation, and r&d-based economic growth. Macroecon. Dyn. 2021, 25, 651–668. [Google Scholar] [CrossRef] [Green Version]
  147. Holmberg, S.; Rothstein, B.; Nasiritousi, N. Quality of government: What you get. Annu. Rev. Polit. Sci. 2009, 12, 135–161. [Google Scholar] [CrossRef] [Green Version]
  148. Bergh, A. What are the Policy Lessons from Sweden? On the Rise, Fall and Revival of a Capitalist Welfare State. New Polit. Econ. 2014, 19, 662–694. [Google Scholar] [CrossRef]
  149. Duan, W.; Hogarth, N.J.; Shen, J.Y. Impacts of Protected Areas on Income Inequality: Evidence from the Giant Panda Biosphere Reserves in Sichuan Province, China. J. For. Econ. 2021, 36, 27–51. [Google Scholar] [CrossRef]
  150. Qiao, Y.H.; Halberg, N.; Vaheesan, S.; Scott, S. Assessing the social and economic benefits of organic and fair trade tea production for small-scale farmers in Asia: A comparative case study of China and Sri Lanka. Renew. Agric. Food Syst. 2016, 31, 246–257. [Google Scholar] [CrossRef]
  151. Mzoughi, N. Farmers adoption of integrated crop protection and organic farming: Do moral and social concerns matter? Ecol. Econ. 2011, 70, 1536–1545. [Google Scholar] [CrossRef]
  152. McGrath, L.; Hynes, S.; McHale, J. The Air we Breathe: Estimates of Air Pollution Extended Genuine Savings for Europe. Rev. Income Wealth 2022, 68, 161–188. [Google Scholar] [CrossRef]
  153. Hanley, N.; Dupuy, L.; McLaughlin, E. Genuine savings and sustainability. J. Econ. Surv. 2015, 29, 779–806. [Google Scholar] [CrossRef] [Green Version]
  154. Banerjee, O.; Cicowiez, M.; Vargas, R.; Obstd, C.; Cala, J.R.; Alvarez-Espinosa, A.C.; Melo, S.; Riveros, L.; Romero, G.; Meneses, D.S. Gross domestic product alone provides misleading policy guidance for post-conflict land use trajectories in Colombia. Ecol. Econ. 2021, 182, 106929. [Google Scholar] [CrossRef]
  155. Lindmark, M.; Acar, S. Sustainability in the making? A historical estimate of Swedish sustainable and unsustainable development 1850–2000. Ecol. Econ. 2013, 86, 176–187. [Google Scholar] [CrossRef]
  156. King, R.G.; Levine, R. Finance and growth: Schumpeter might be right. Q. J. Econ. 1993, 108, 717–737. [Google Scholar] [CrossRef]
  157. Awdeh, A.; Hamadi, H. Factors hindering economic development: Evidence from the MENA countries. Int. J. Emerg. Mark. 2019, 14, 281–299. [Google Scholar] [CrossRef]
  158. Zapf, D.; Dormann, C.; Frese, M. Longitudinal studies in organizational stress research: A review of the literature with reference to methodological issues. J. Occup. Health Psychol. 1996, 1, 145–169. [Google Scholar] [CrossRef]
  159. Ture, C. A methodology to analyse the relations of ecological footprint corresponding with human development index: Eco-sustainable human development index. Int. J. Sustain. Dev. World Ecol. 2013, 20, 9–19. [Google Scholar] [CrossRef]
  160. Ray, M. Redefining the Human Development Index to Account for Sustainability. Atl. Econ. J. 2014, 42, 305–312. [Google Scholar] [CrossRef]
  161. Bravo, G. The human sustainable development index: The 2014 update. Ecol. Indic. 2015, 50, 258–259. [Google Scholar] [CrossRef]
  162. Dogan, E.; Turkekul, B. CO2 emissions, real output, energy consumption, trade, urbanization and financial development: Testing the EKC hypothesis for the USA. Environ. Sci. Pollut. Res. 2016, 23, 1203–1213. [Google Scholar] [CrossRef] [PubMed]
Figure 1. Research model and the hypotheses formulated.
Resources 11 00046 g001
Table 1. HDI dimensions, indicators, and data sources.
Human Development Index
Dimension
index
Life expectancy
index
Education indexGNI index
IndicatorsLife expectancy at birthExpected years of schoolingMean years of schoolingGNI per capita (PPP $)
DimensionsLong and healthy lifeKnowledgeA decent standard of living
Data sourcesUnited Nations
Department of
Economic and
Social Affairs.
United Nations Educational, Scientific and Cultural Organisation Institute for Statistics; ICF Macro Demographic and Health Surveys; United Nations Children’s Fund Multiple Indicator Cluster Surveys; OECDUnited Nations Educational, Scientific and Cultural Organisation Institute for Statistics; Barro and Lee; ICF Macro Demographic and Health Surveys; UNICEF Multiple Indicator Cluster Surveys; OECDWorld Bank; International Monetary Fund; United Nations Statistics Division
Source: Own elaboration based on UNDP TN [48].
Table 2. Description of variables.
Acronyms Variables Data Sources
Dependent
HDI Human Development IndexUnited Nations Development Programme
Independents
SSI DimensionsSSI CategoriesSSI Indicators
HuW1. Human wellbeing
BN 1. Basic needs1. Sufficient foodFood and Agriculture Organisation
2. Sufficient to drinkFood and Agriculture Organisation
3. Safe sanitationFood and Agriculture Organisation
PD & H2. Personal development and health4. EducationUnited Nations Educational, Scientific and Cultural Organisation
5. Healthy lifeWorld Health Organisation
6. Gender equalityWorld Economic Forum
WS3. Well-balanced society7. Income distributionWorld Bank
8. Population growthWorld Bank
9. Good governanceWorld Bank
EnW2. Environmental
wellbeing
NR 4. Natural resources10. BiodiversityWorld Bank
11. Renewable water resourcesFood and Agriculture Organisation
12. ConsumptionGlobal Footprint Network
C & E5. Climate and energy13. Energy useKNOEMA Corporation
14. Energy savingsKNOEMA Corporation
15. Greenhouse gasesInternational Energy Agency
16. Renewable energyWorld Bank
EcW3. Economic wellbeing
Tr 6. Transition17. Organic farmingResearch Institute of Organic Agriculture
18. Genuine savingsWorld Bank
Ec 7. Economy19. GDPWorld Bank
20. EmploymentWorld Bank
21. Public debtInternational Monetary Fund—World Economic Outlook
Source: Based on information taken from Technische Hochschule Köln [65] and the United Nations Development Programme [103].
Table 3. Statistical description of the variables for all OECD economies.
MeanMedianMax.Min.Std. Dev.
Dependent VariableHDI0.880.900.960.700.054
Independent VariablesHuW8.068.289.105.570.770
EnW3.683.607.211.701.036
EcW5.905.988.702.511.487
BN9.869.9610.008.550.259
PD & H8.308.319.506.790.478
WS6.436.908.342.741.398
NR5.405.298.801.801.297
C & E2.892.676.621.001.211
Tr6.646.899.512.401.972
Ec5.675.738.692.001.789
Table 4. Results of panel generalised method of moments dependent.
Model 1
Aggregate
Dimensions
Model 2
Aggregate
Categories
Model 3
Social
Dimension
Model 4
Environmental
Dimension
Model 5
Economic
Dimension
HuW0.043 (0.003) ***
EnW−0.016 (0.002) ***
EcW0.002 (0.001)
BN 0.057 (0.006) ***0.080 (0.000) ***
PD & H 0.066 (0.004) ***0.057 (0.000) ***
WS 0.005 (0.001) ***0.008 (0.000) ***
NR −0.002 (0.001) * −0.011 (0.002) ***
C & E −0.010 (0.001) *** −0.020 (0.002) ***
Tr 0.002 (0.001) ** 0.010 (0.001) ***
Ec 0.002 (0.001) *** 0.002 (0.002)
Observations:304
Note: *** p < 0.01; ** p < 0.05; * p < 0.10; standard errors are shown in parentheses; total panel (balanced) observations: 304.
Table 5. Summary of results.
Model 1
Aggregate
Dimensions
Model 2
Aggregate
Categories
Model 3
Social
Dimension
Model 4
Environmental Dimension
Model 5
Economic
Dimension
H1a Accepted
H1b Rejected
H1c Rejected
H2a AcceptedH3a Accepted
H2b AcceptedH3b Accepted
H2c AcceptedH3c Accepted
H2d Rejected H4a Rejected
H2e Rejected H4b Rejected
H2f Accepted H5a Accepted
H2g Accepted H5b Rejected
Publisher’s Note: MDPI stays neutral with regard to jurisdictional claims in published maps and institutional affiliations.

