Article

Evaluating the Downstream Development Strategy of Oil Companies: The Case of Rosneft

1
Department of Economics, Organization and Management, Saint Petersburg Mining University, 2, 21st Line, 199106 Saint Petersburg, Russia
2
International Institute for Applied Systems Analysis (IIASA), Schlossplatz 1, A-2361 Laxenburg, Austria
*
Author to whom correspondence should be addressed.
Resources 2022, 11(1), 4; https://doi.org/10.3390/resources11010004
Submission received: 20 September 2021 / Revised: 27 November 2021 / Accepted: 4 January 2022 / Published: 7 January 2022
(This article belongs to the Special Issue Resources in Smart Factory in Industry 4.0 Conditions)

Abstract

:
The relevance of this study is due to the low rate of development of the downstream sectors of Russian oil companies. Against a background of the sale of significant volumes of oil and gas raw materials, Russia lags behind world leaders in the production and consumption of petrochemical and chemical products, with their share in the gross domestic product of the country being only 1.1%. Connected to this is the issue of substantiating strategies of development for the downstream sectors of Russian oil companies, which requires detailed research. In this light, it is necessary to take into account current trends in the worldwide demand on petroleum products and also the opportunities and competitive advantages of Russian oil and gas companies in the creation and development of refineries with a consideration of modern technological, environmental, social and market criteria. The paper tests hypotheses about modernisation as a process of increasing efficiency in the development of the industry as a whole. The results of the study show that the planned pace of development in the industry by means of modernisation proves to be insufficient and requires additional investments in innovative development and new construction. The value of the research lies in the modelling of modernisation strategy options by the example of a large oil company, the estimation of results by the criteria of world average indices of technological efficiency of production and the analysis of these results by state indicators of branch development. The theoretical significance of the research lies in the possibility of using this research approach as an analogue.

1. Introduction

The modern Russian market for petrochemical and chemical products is gradually developing and increasing production volumes; new production capacities and new technologies are appearing all the time [1]. However, in Russia, the problem of refinery modernisation, which is necessary due to the high level of depreciation of refinery fixed assets and the poor quality of finished products, remains at the forefront.
According to experts, the problem of modernisation is related to tax manoeuvres on the part of the state [2,3,4], which have led to the slowdown and postponement of investment in this sector. According to the Ministry of Energy, when compared to 2014, in 2020, the number of investments in the downstream projects of Russian oil companies decreased from RUB 250 billion to RUB 150 billion per year. Only 38% of the modernisation programme has been fulfilled (only 29 plants were actually launched against a plan of 78 upgraded units) [4].
The industry is facing challenging tasks in the continuous upgrading of oil refining capacities for the purpose of improving the quality characteristics of the technological process and the products produced, challenges such as oil refining depth and light oil product yield [5,6,7]. Besides, in Russia, there are a number of performance indicators which should also be taken into account when developing strategies and assessing efficiency of the implementation of such strategies. These include: the growing importance of the chemical and petrochemical industry in the Russian economy and the development of related industries; an increase in the consumption of chemical and petrochemical products to the level of industrialized countries; the creation of high-productive jobs; and the transition to the innovation and investment model of development by increasing the depth of processing.
The aim of the paper is to evaluate the downstream development strategy of oil companies and to test the following hypotheses:
Hypothesis 1 (H1). 
The modernisation of the refinery complex is sufficient to achieve world average process quality.
Hypothesis 2 (H2). 
Refinery modernisation is sufficient to achieve the industry’s growth targets.
The main objectives of the study are:
  • to create predictive models of refinery development strategy based on data from a large Russian company;
  • to evaluate modernisation strategies for balancing a product line with different margins;
  • to analyse the level of attainment of world average product quality and industry forecasts.
The object of the study is the largest Russian oil company—PJSC Rosneft Oil Company, which includes 13 refineries (38% of all Russian refineries), with a total production capacity of about 30% of the annual volume of oil refined in the country [8,9]. In our opinion, it is a sufficiently large company to test the hypotheses put forward.
The contribution of the authors is that they have created predictive models of the two strategies based on the minimum to maximum capacity range of the company’s refinery modernisation process, carried out a comparative analysis of these models and assessed their effectiveness against the target indicators of industry development at the national level.
The section “Literature Review” considers the current theoretical approaches and basic components of strategy formation that were used as a basis for this case study. The section provides an overview of the characteristic factors that determine the formation of the strategies of oil companies in downstream sectors in Russia and throughout the world. It provides forecasts of industry development at state level, which serve as the criteria for evaluating the proposed strategies in this article.
The “Methods and Materials” section outlines the stages of the study, identifies sources of information and provides a brief description of the subject matter.
The results section gives a detailed description of the two refinery modernisation strategies, from minimum to maximum capacity range, the structure of the marketable products, and a qualitative analysis of the strategies and their cost-effectiveness.
The “Discussion” section presents an analysis of the results in the form of a comparison of the options according to economic criteria and indicators of the state plan for the development of the sector. The limitations of this study are highlighted.

2. Literature Review

2.1. Theoretical Basis for the Formation of the Strategy

In this paper, strategy is understood as a combination of planned actions and decisions to adapt the firm to new situations, new opportunities for gaining competitive advantage and new threats to the weakening of its competitive position.
Making strategic choices means linking a company’s existing competitive strengths to its business decisions in a coherent plan.
Corporate strategy, also known as “portfolio strategy”, is the strategy responsible for the main direction of a company’s development, namely the development of its main activities (mining, production, sales). This strategy is the most generalized, since it covers the company as a whole, and that is why strategic decisions at this level are the most serious and complicated to make. Also, at this level, the company’s goals, its future growth, and prospective activities are defined. For these purposes, the company invests in development.
At the corporate level, the following decisions can be made: the allocation of resources between business units on the basis of comparative strategic analysis; decisions to diversify production in order to increase the company’s competitiveness; decisions to merge, acquire, enter into one or another integration structures; changes in the structure of the enterprise; and other global decisions affecting the company’s activities [10].
Business strategy, or business unit strategy, aims to develop the company’s competitive advantage in the long term. It includes a plan of how many products will be produced, what market segment they will be aimed at, what pricing and sales policies will be in place and how these will differ from those of competitors. Where a company is engaged in a single line of business, the business strategy may be the same as the corporate strategy. Most oil companies are vertically integrated oil companies (VICs) with many activities, and their strategies are therefore large, cross-business unit plans.
The main objective of functional strategies is to increase the effectiveness of functional departments within the corporate strategy. An example of a functional strategy might be to reduce staff turnover in the human resources department or to look for opportunities to increase output by upgrading a manufacturing strategy.
For a company to work harmoniously, strategies at all levels must be coherent, not contradictory and lead to the development of all parts of the company.
Vaughan Evans [11] defines strategy development as the following: a set of actions for goal setting, market supply and demand analysis; the assessment of current competitors; the development of business strategy integrated into corporate strategy; and risk assessment. This is the definition we follow in this paper.
The ability to outperform competitors is largely determined by the flexibility and efficiency of the process of obtaining and analysing information on all the significant changes that occur in the external and internal environment of the company, as well as how they are reflected in the company’s strategy. Working out and controlling the realization of a company’s development strategy requires the creation of adequate informational and analytical support, which allow for to the formalisation of the company’s strategic goals and their achievement by means of a system of indicators which reflect the chosen strategy, the coordination of strategic indicators and the determination of their target values.
Corporate strategy determines the direction of business development in the markets through managerial decisions regarding investment in innovation, diversification, vertical integration and acquisitions. Business strategy includes the development of a competitive strategy that provides a blueprint for business development in a particular industry to achieve the organisation’s competitive advantage [12]. A.A. Thompson, Jr. and A.J. Strickland define strategy “as a comprehensive management plan to strengthen a company’s market position and ensure coordination of efforts, customer attraction and satisfaction, competitive success and achievement of global objectives” [13].
In this paper, the benefit–cost method, which evaluates added economic value as an indicator of strategic development, is used as a method for evaluating the effectiveness of a project.

2.2. Analysis of Modern Problems in the Downstream Sector in the Russian Federation

In Russia, the refining and petrochemical industry is currently witnessing a positive development trend: new facilities and refineries are being built, existing refineries are being actively upgraded and high-efficiency installations are being introduced to enable companies to produce more profitable products.
There are currently around 200 mini refineries operating in Russia. Typically, these mini refineries produce in the proportions shown in Figure 1.
Low-quality products produced by mini refineries are mixed with products from major Russian refineries in the domestic market, leading to a distortion of the country’s refining and petrochemical statistics.
There are currently 32 major vertically integrated refineries in Russia, with a total refining capacity of 284.1 million tonnes of oil per year [9] (Table 1).
Other refineries listed in Table 1 are Yaiskiy Refinery, Ilskiy Refinery, Krasnodar Refinery, LLC SIBUR Tobolsk, TAIF-NK, Orsknefteorgsintez and Novoshakhtinskiy Refinery.
The average refining depth at Russian refineries is 83.4%, while in the USA this indicator varies from 90 to 95%, and at the most powerful refinery it is 98%. In European countries, the average refining depth is 85–90%, and in OPEC member countries it is 85% [15]. The average yield of light products in the RF is 69%. This figure is increasing every year, which is due to the refinery modernisation programme.
According to the programme, up to 127 secondary refining units are to be modernised at Russian vertically integrated refineries by 2027. According to the Russian Ministry of Energy [15], this programme will improve refinery quality indicators, such as oil refining depth, light product yield and the Nelson index, to European levels (Figure 2, Figure 3 and Figure 4).
The petrochemical, oil and gas, and chemical industries are growing in Russia but have a very small share of the Russian economy; their share is roughly equal to 1.1% of the country’s gross domestic product (GDP) [16], while in other industrialised countries the figure is up to 9% (Figure 5).
Russia lags behind the world leaders in the production and consumption of petrochemicals and chemicals. This is mainly due to the fact that more raw materials go directly for sale than for processing. For example, in gas chemistry, only 12% of gas is sent for processing, while in the USA, 70% of raw materials are processed [17]. If we compare petrochemical production in the Russian Federation with that in Japan, it is possible to draw conclusions about the low levels of technology development in Russia and low demand for domestic products. This is confirmed by the index of petrochemical production per employee, which is seven times lower in Russia than in Japan [18].
For example, in Germany, the level of consumption of chemical and petrochemical products specifically is more than nine times higher than in Russia [19]. Despite the fact that the domestic market of the PRC lags far behind the markets of developed countries in its development, Russia lags behind the PRC in this indicator [20].
Despite the availability of basic raw materials such as natural gas, naphtha and liquefied hydrocarbon gases, Russia’s chemical complex is predominantly represented by production in low value-added industries [21]. For example, in 2019, Russia ranked second in the world in terms of oil and natural gas production, while in terms of basic polymers production, it ranked only in the second ten largest producing countries [16].
Both the low demand for the products of the chemical complex in the domestic market, and the export-oriented supply of basic raw materials, lie behind the strong dependence of the Russian economy as a whole, and the chemical complex in particular, on the world economic situation. For example, in the crisis years of 2008–2009, chemical production in Russia fell by 5.4%; at the same time, in China, the growth rate of production in the chemical complex in the same period was 9–11% [16,20].
A large proportion of petrochemical end-products are based on seven primary products: ethylene, propylene, aromatic hydrocarbons (benzene, toluene, xylene), ammonia and methanol [20].
According to the IEA, there are two projected scenarios for the petrochemical industry: the Reference Technology Scenario and the Clean Technology Scenario (CTS). The difference between the Clean Technology Scenario and the Reference Technology Scenario is the additional limitations, the most significant of which is the reduction of CO2 emissions by 45% by 2050 as compared to the current level [8]. In the Reference Technology Scenario, the demand for primary products will increase by around 30% by 2030 and almost 60% by 2050 compared to 2017, bringing the production of primary products closer to 1 billion tonnes by 2050 [22] (Figure 6).
The largest absolute increase in production will be in the Asia-Pacific Region (APR), with the production of ethylene, propylene and aromatics increasing by more than two thirds by 2050.
Methanol production will see the fastest growth, increasing by more than 50% by 2030 and nearly doubling by 2050 compared to 2017. Almost two-thirds of the growth in methanol production will come from the APR [22].
Ammonia production will increase by 15% by 2030 and 30% by 2050 compared with 2017. Africa and the Middle East will see the fastest growth in production: in both regions, ammonia production will nearly double by 2050 [22]. The increase in ammonia production will mainly be driven by rising demand for nitrogen fertilizers in developing countries.
The main feedstocks for the Russian petrochemical industry are naphtha and liquefied petroleum gases (LPG), each consuming about 4–5 million tonnes. Ethane is also used, at around 0.5 million tonnes. There are no problems in terms of the provision of raw materials in petrochemistry: only about 15% of naphtha and 30–35% of LPG produced in the country are used for the needs of the branch [22]. Thus, the Available capacity to produce raw materials allows for an increase in processing in petrochemistry.
Even with modernisation programmes and the introduction of new high-tech secondary refining units, Russian refineries will not come close to global refinery performance by 2030. Table 2 shows the main problems in the Russian oil refining industry.
Table 2 shows that there are many problems in the refining sector that can be solved by a large amount of investment in the industry, with a large amount of time needed for modernisation.

2.3. An Overview of the Strategies and Priorities of Russian Refining Companies

The largest vertically integrated oil companies in Russia are Rosneft, Lukoil, Gazprom Neft, Bashneft, Surgutneftegaz and Tatneft (Figure 7). Independent oil companies (IOCs), independent refineries and mini refineries account for the rest.
Many of Russia’s vertically integrated oil companies have long-term targets for the refining sector; data for the largest companies is shown in Table 3.
Thus, it can be concluded that developing a long-term strategy in the refining sector is a very difficult task. It is hampered by many factors [26,27,28], such as: competition, demand, political relations, level of technical equipment, availability of interchangeable technologies, environmental damage and other factors.
However, in 2014, the Strategy for the Development of the Chemical and Petrochemical Complex for the period up to 2030 (hereinafter referred to as the Strategy) was developed [16]. It was amended and clarified in 2016. The Strategy applies to the chemical and petrochemical industries in Russia. The chemical industry includes the production of basic chemicals (mineral fertilizers, soda ash, caustic soda, other chemicals), painting materials, chemical fibres and threads, plastic products, other chemicals, including special chemicals, as well as tyres and rubber products. The petrochemicals industry includes high-tonnage plastics, rubbers and organic synthesis products.
A number of quantitative indicators have been selected to assess the effectiveness of the implementation of the objectives of this Strategy (Table 4).
The main targets of the Russian petrochemical and chemical products market relate to development: increased production and use of products, the development of new production capacities and the adoption of new technologies.

3. Materials and Methods

The materials of scientific monographs and articles of Russian and foreign scientists devoted to theoretical and practical issues concerning the development of strategies of oil and gas companies were used in the research process. The materials of Russian and international scientific conferences on these topics were also used.
The object of this study is Rosneft. This company is Russia’s number one oil producer and refiner, and it is currently the largest vertically integrated oil company in the Russian Federation. Rosneft’s assets include 13 refineries, which supply fuel and energy to much of the country [29]. The company also owns foreign oil production and refining assets.
The research method is a combination of methods and techniques of analysis and the assessment of opportunities to develop strategies for the downstream sectors of oil companies, including the example of PJSC Rosneft Oil Company. In addition, the study used the research methods of desk research on the current state of the problem (the collection, analysis and processing of secondary information) and system, comparative and cause-and-effect analysis, which was used to establish structural links between the elements of the system under study and to further identify the most significant aspects and factors of the problem under study.
The research methodology is based on the steps of the Cost–Benefit Analysis (CBA) analytical method.
The Rosneft projects under consideration are large-scale, with specific features, including production technology, sales markets, geographical and climatic factors, and the multiple overlapping interests of major market players, government regulators, investors and local communities. Therefore, the chosen method to evaluate this type of project needs to take into account the widest range of performance indicators. Since investment appraisal methodologies based on net project cost are limited in their analysis of additional influencing factors, CBA should be used, as it fully incorporates several sequential methods to measure benefits and costs and determine the viability of projects. CBA has scientific and practical values and, based on the completeness and quality of the information used, can be used optionally, for example, by excluding (adding to) methods for decision-making.
Benefits and costs in a CBA are expressed in monetary terms and adjusted for the time value of money; all benefit and cost flows over time are expressed on a common basis in terms of their net present value, whether or not they are incurred at different times. Other related methods include risk-benefit analysis, economic impact analysis, fiscal impact analysis and social return on investment analysis [30].
The main stages of the research methodology are [30]:
1. Project objectives definition. The definition of objectives is the starting point for the analysis and, depending on the formulated objective, allows for the selection of the depth of the analysis and the set of indicators. The aims are to evaluate the development strategies of the downstream sector of the oil company, to identify the pace of development of the company, to compare the rate of growth of the company with the required indicators for development in the industry as a whole and to take into account the company’s market share and its possible contribution to the government’s development strategy.
2. Project identification and prioritisation. Project identification and prioritisation involves defining the institutional, financial and organizational framework of a project, guided by the categories of “quantity” and “quality”. Above all, the identification should define specific objectives and mechanisms to achieve the above objectives.
The study describes the characteristics of strategies in the refining segment of large Russian oil refining companies. Industry development criteria are put forward as institutional categories:
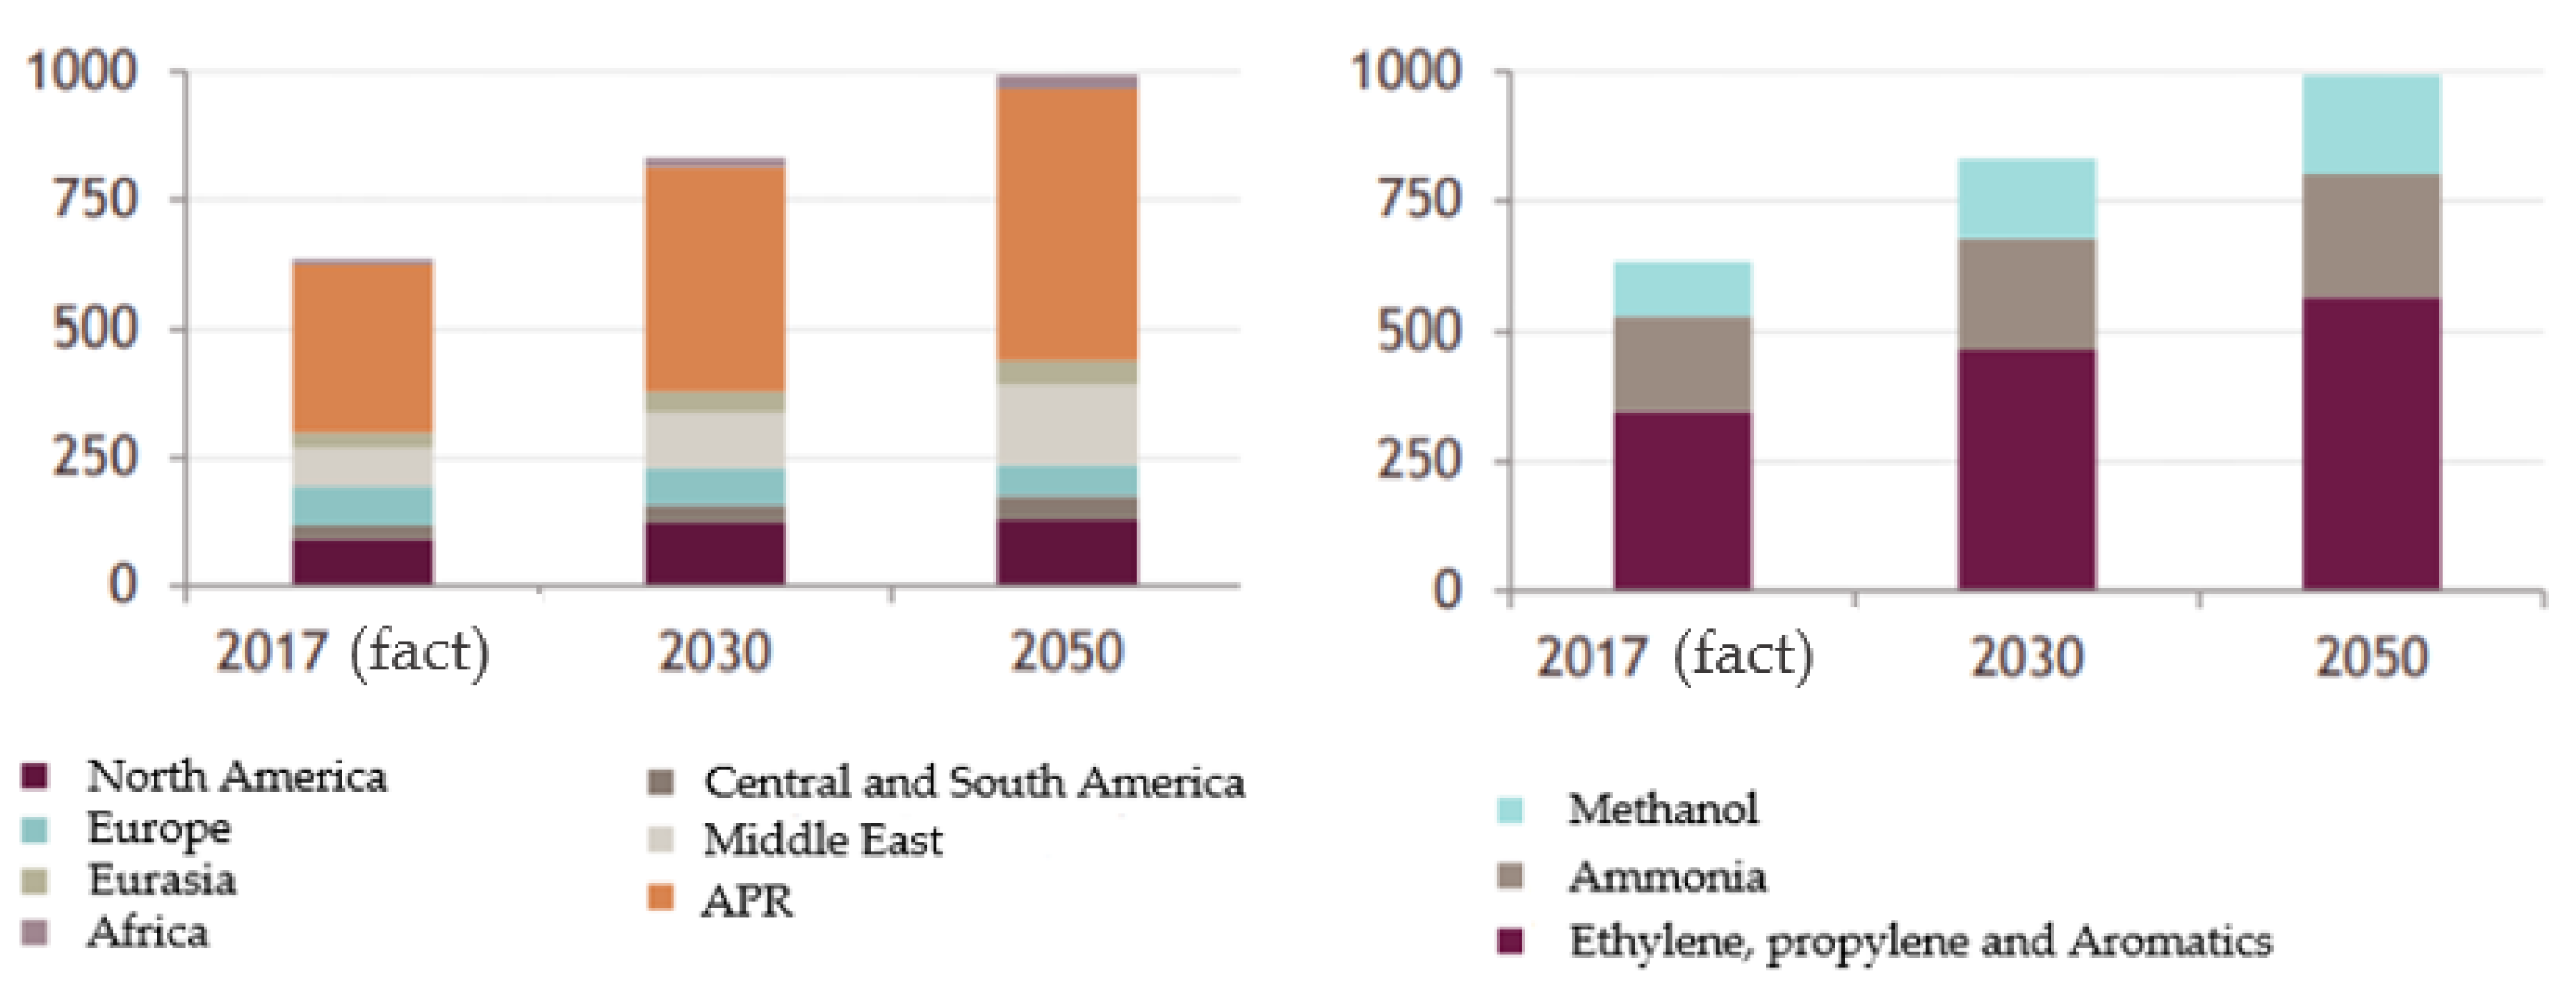
  • the increased consumption of chemicals and petrochemicals to the level of industrialised countries;
  • the creation of highly productive jobs;
  • the transition to an innovative and investment-driven development model by increasing the depth of processing.
3. Project feasibility and option analysis. The feasibility analysis includes a marketing review, the engineering and organisational objectives of the projects and the selection of alternatives. The article provides a marketing analysis that focuses on the IEA forecasts of petrochemical industry development scenarios: the Reference Technology Scenario (Reference Technology Scenario) and the Clean Technology Scenario (CTS). It also provides an analysis of the refining industry in the Russian Federation, in the course of which the main problems are identified, the most significant of which is the obsolescence of refining capacities, and also technical and economic analysis of Rosneft’s operations.
4. Project economic impacts analysis. The economic analysis considers the impact of the project on the main groups of users and project participants, including direct and indirect effects. The project economic impacts analysis shows the correspondence between the targets of the Chemical and Petrochemical Complex Development Strategy for the period until 2030 and the rate of increase in the company’s refining capacities. It shows the growing importance of the chemical and petrochemical industry in the Russian economy and the development of related industries.
5. Project investment analysis. The analysis of investment efficiency is carried out in respect to the main options for project implementation, taking into account the time value of investment, current costs and revenues of the project (time value of money). If the project shows negative results, the conditions for its implementation must be revised. The study evaluates the economics of the implementation of the strategies and selects the most effective strategy. Based on the evaluation, two strategies are selected for the development of the downstream sector of Rosneft, taking into account the need for higher value-added products. The product line of Rosneft’s refining unit was analysed for six refineries that require further upgrading.
6. Multicriteria analysis. Multicriteria analysis reveals the effects of all factors that cannot be accounted for in financial and economic analysis, including environmental effects. The study presents an aggregated estimate of the environmental effects of emission reductions.
7. Project risks and sensitivity analysis. The sensitivity assessment of a project characterises the extent to which the project is resilient to the impact of various risk and uncertainty factors and changes in the main project control parameters, which are manifested in the possibility of deviations from the predicted results.
The study used publicly Available company data; production capacity, refining depth and product types were taken from annual reports and sustainability reports. To determine the order of capital expenditure for the refineries, peer facilities were selected or calculations were made using the direct calculation method.
Strategy No. 1 and Strategy No. 2 are two combinations of refining capacity and corresponding product mix. Both strategies satisfy the company’s 2022 strategic goal to increase output to 40.3 mn t for diesel, 18.9 mn t for gasoline and 5.1 mn t for paraffin. According to the new Rosneft-2022 strategy, the company’s goal is to increase the production of marketable products (Figure 8).
However, the first strategy involves upgrading three refineries, while the other variant involves upgrading six facilities and, accordingly, increasing capital expenditures and the technical and economic performance of the project. Therefore, the main objective of the study is to assess the economics of the strategies and analyse the results not only against the company’s efficiency criteria, but also against the state programme for the downstream sector of oil companies.
At the present moment, Rosneft [31] receives most of its profit from the sale of crude oil (the ratio of the share of oil sales to the share of oil products sales is 60.3/39.7%), which is not efficient for the development of the refining company [32]. With the implementation of one of the strategies, it is possible to increase the share of sales of petroleum products of a higher quality than is currently produced.

4. Results

4.1. Economic Evaluation of the Strategy No. 1

Strategy No. 1 represents the construction of a delayed coking unit (DCU) at the Kuibyshev refinery, the construction of a vacuum gasoil (VGO) hydrocracking unit at the Achinsk refinery and the construction of a diesel hydrotreating complex at the Tuapse refinery [33].
It also involves the construction of a 2 million tonne per year (6000 tonnes per day) heavy oil residue refining facility at the Kuibyshev refinery.
The objectives of this project are:
  • increasing production efficiency and strengthening the position of the Kuibyshev Refinery (Rosneft);
  • a reduction in the production of fuel oil and an increase in the production of light products (including Euro-5 motor fuels).
The following challenges are identified:
  • increasing the refining depth to 75% by processing heavy residues;
  • increased production of high-margin products.
The project is in line with the strategy of the Refining Block (updated as part of the Rosneft-2022 Strategy), which aims to increase the depth of oil refining, including through the implementation of heavy oil residue processing projects [34].
The profitable part of the project is formed by increasing the depth of refining and increasing the output of light products [35,36]. There will be a decrease in the production of fuel oil and tar but an increase in the production of coke. The volume of fuel oil production will decrease by 95%.
The cost of the construction of the DCU will be around RUB 30 billion [33], including:
  • design and survey work—RUB 1.5 billion;
  • licence—about 30 million roubles;
  • equipment—RUB 15 billion;
  • construction and installation work—RUB 12 billion;
  • railway tracks—RUB 50 million;
  • other costs.
In addition to coke, the DCU produces the following products: coking gases (used as process fuel), gasoline and coconut distillates (fuel, raw material for cracking).
The project was based on the example of the construction of the DCU unit at Bashneft-UNPZ.
The results of the DCU project are shown in Table 5. The project is planned to be operational by 2027 and will generate revenues of 8.304 billion roubles.
The inflation projection data for calculating future cash flows is taken from the Ministry of Economic Development’s report on the long-term inflation and deflator indices forecast to 2030 [37].
Construction of a 2 million tonne VGO hydrocracking unit at the Achinsk refinery. The cost of this construction will cost about 92.8 billion roubles. The project is based on the example of the construction of a VGO hydrocracking unit at the Volgograd Refinery.
The construction of this unit will help to achieve the following results: an increase in the production of diesel fuel of the fifth ecological class by 1 million tons, the production of components of motor gasoline by 340 thousand tons per year and liquefied gases by 57 thousand tons. The complex will also include units for the production of hydrogen and elemental sulphur [38,39,40]. In the future, the products produced will be in demand in the Altai Territory, and it is also possible to sell the goods abroad due to its proximity with, for example, China, Kazakhstan and Mongolia.
The hydrocracking process feedstocks will be straight-run gas oils, vacuum gas oils, catalytic gas oils, coking gas oils, visbreaking gas oil and deasphaltisate. Since refineries have primary and secondary refining processes, the products obtained will depend on the feedstock loaded [41,42,43,44,45,46,47,48,49].
The purpose of building this unit at the Achinsk refinery is to increase the refining depth to 80%, thereby increasing the yield of higher-value products.
The results of the VGO hydrocracking unit project are shown in Table 5. This project is planned to be commissioned by 2029, with an increase in revenues from the project of 6.64 billion roubles.
A diesel hydrotreatment complex with a 4 million tonne unit capacity is planned for construction at the Tuapse refinery. This RUB 16 billion project was implemented at the Omsk Refinery, and the facility will produce 3.84 million tonnes of Euro-4 and Euro-5 diesel fuel. The unit produces a high-quality product with a minimum content of sulphur compounds.
The results of the diesel fuel hydrotreater project are shown in Table 5. This project is planned to be commissioned by 2029, with an increase in revenues from the project of 7.741 billion roubles. Construction will take 2–3 years and the commissioning date is 2024–2025.
The aggregate total for Strategy No. 1 is shown in Table 5 and Figure 9.

4.2. Economic Evaluation of Strategy No. 2

Strategy No. 2 represents the construction of units at the Kuibyshev refinery, Achinsk refinery and Tuapse refinery (presented in Strategy No. 1), as well as the construction of VGO hydrocracking units at the Komsomolsk refinery, Ryazan refinery and Novokuibyshevsk refinery [46].
The Komsomolsk refinery plans to commission a VGO hydrocracking complex with an annual capacity of 2 million tonnes. The Novokuibyshevsk refinery and the Ryazan refinery also have targets aimed at achieving a similar volume. Thus, the cost of the three refineries will be approximately 92.8 billion roubles each. The construction of the hydrocracking unit at the Novo-Kuybyshev refinery will cost about 22.5 billion roubles. The implementation of VGO hydrocracking is expected to increase the output of diesel fuel of the fifth ecological class by 1 mln tons, the output of automobile gasoline components by 340,000 tons per year, and of liquefied gases by 57,000 tons. The hydrocracking unit will increase the depth of refining at the refinery by 20%, and, in combination with a catalytic cracking unit, it will increase the total refining depth at the refinery to 95–97% [47]. Such a result is achievable at the Ryazan refinery, as the plant already has a catalytic cracking unit.
The construction of the DCU unit will reduce fuel oil and tar production by 95% and increase the production of low-sulphur coke.
The results of Strategy No. 2 are presented in Table 6 and Figure 10.

4.3. Comparison of Strategy No. 1 and Strategy No. 2

Table 7 presents a comparative analysis of the two strategies developed.
An analysis of the strategies developed shows that:
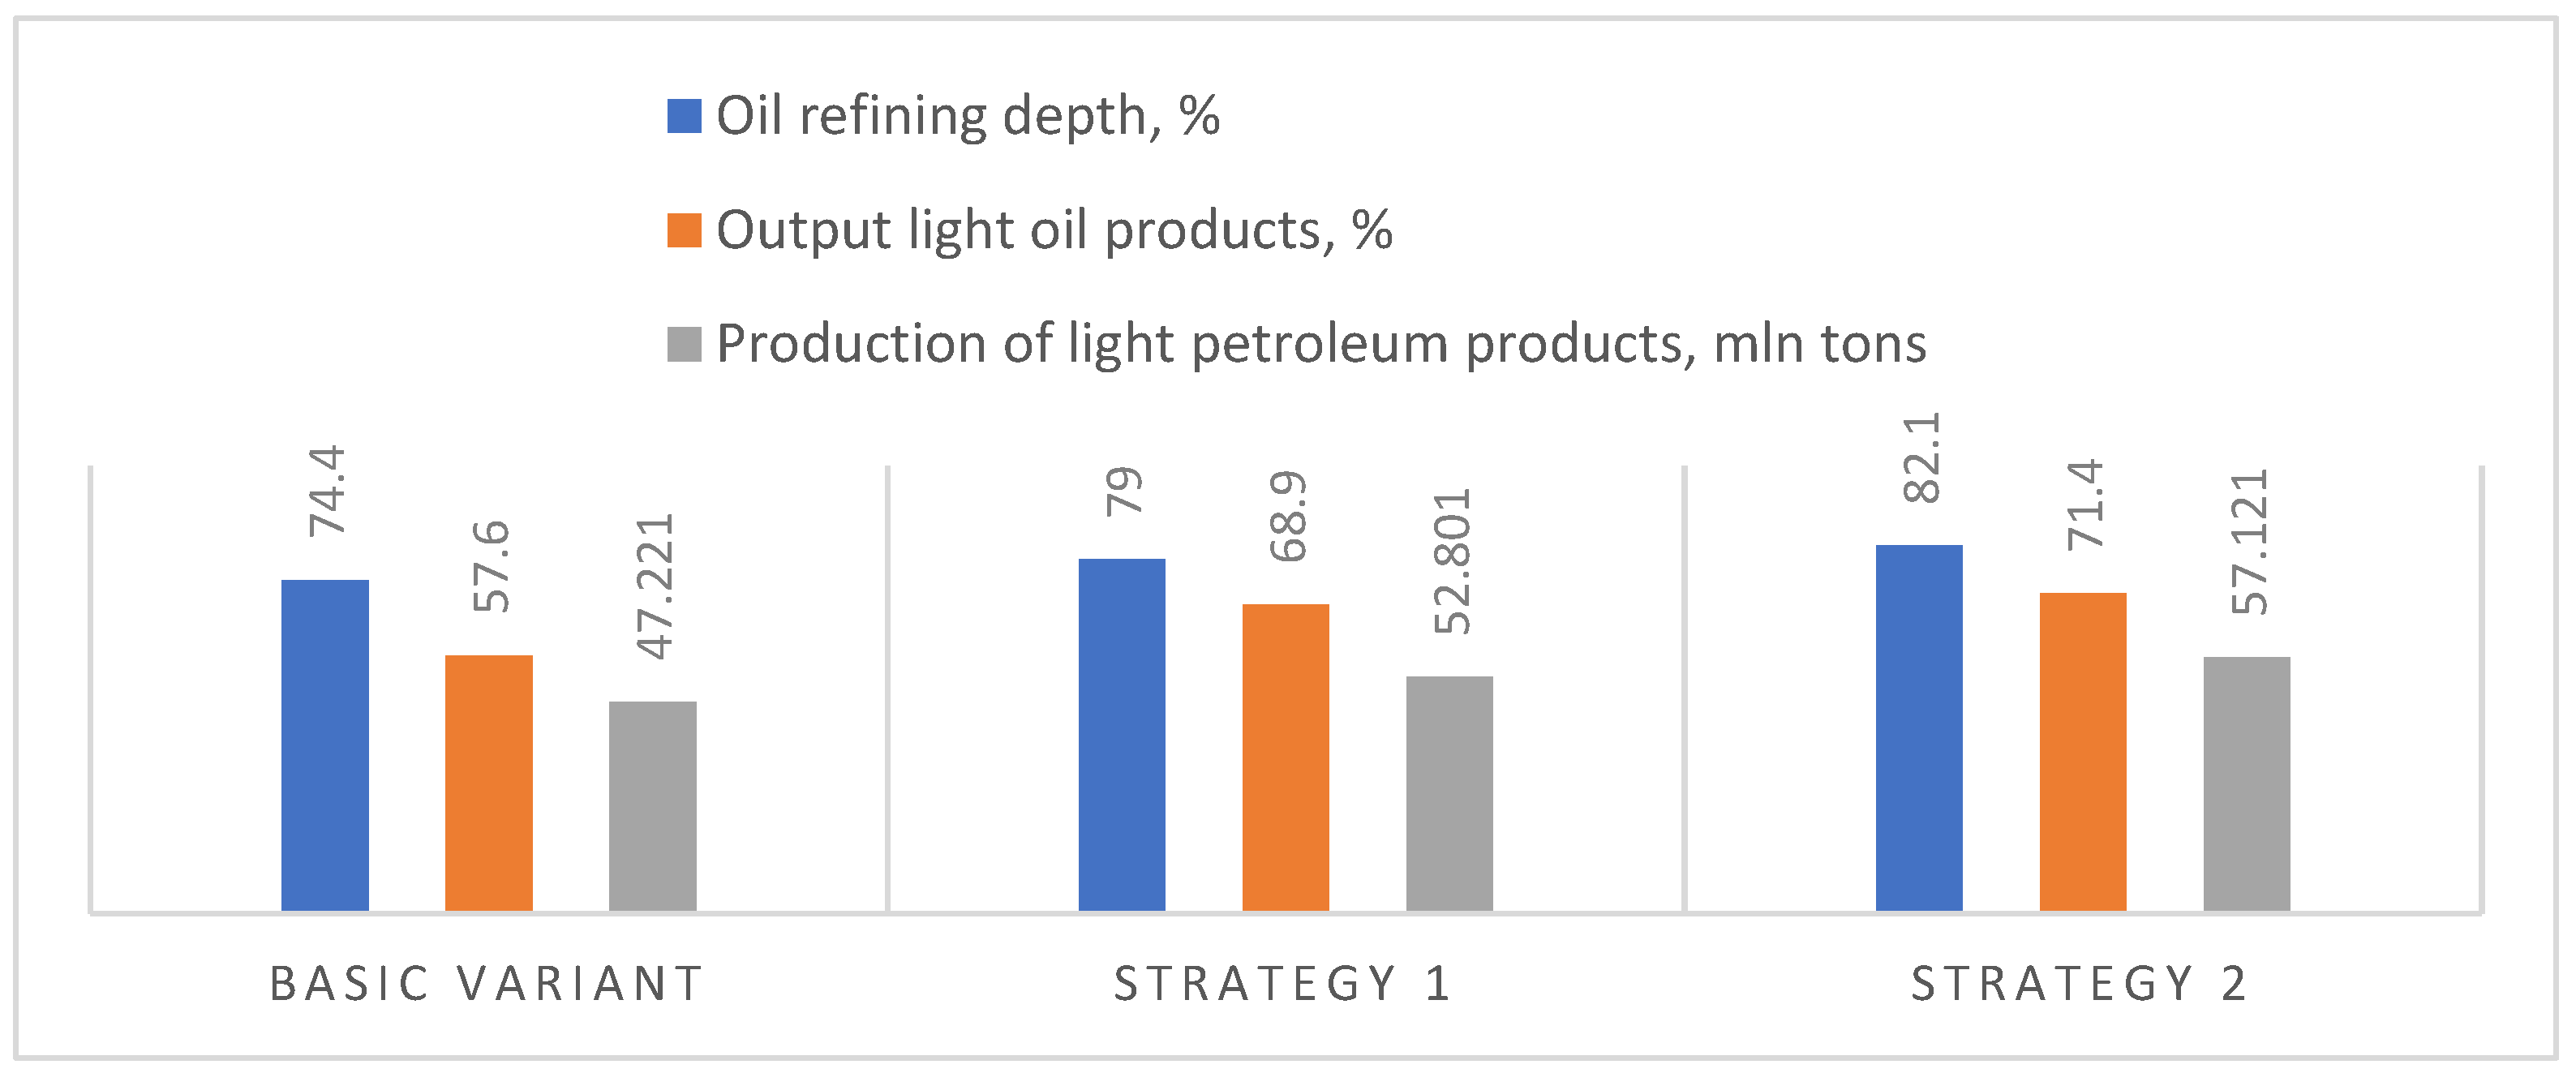
  • Strategy No. 1 will increase the company’s revenue in the refining sector to 66.604 billion roubles, which is 22.687 billion roubles more than in the base case (or 152%). Also, on the technical side, the average refining depth at Rosneft’s refinery group will increase to 79% (from 74%), which will improve marginal yield and reduce fuel oil output by 90.6%. The investment of Strategy No. 1 will be approximately RUB 138.8 billion, with a payback period of 6 years;
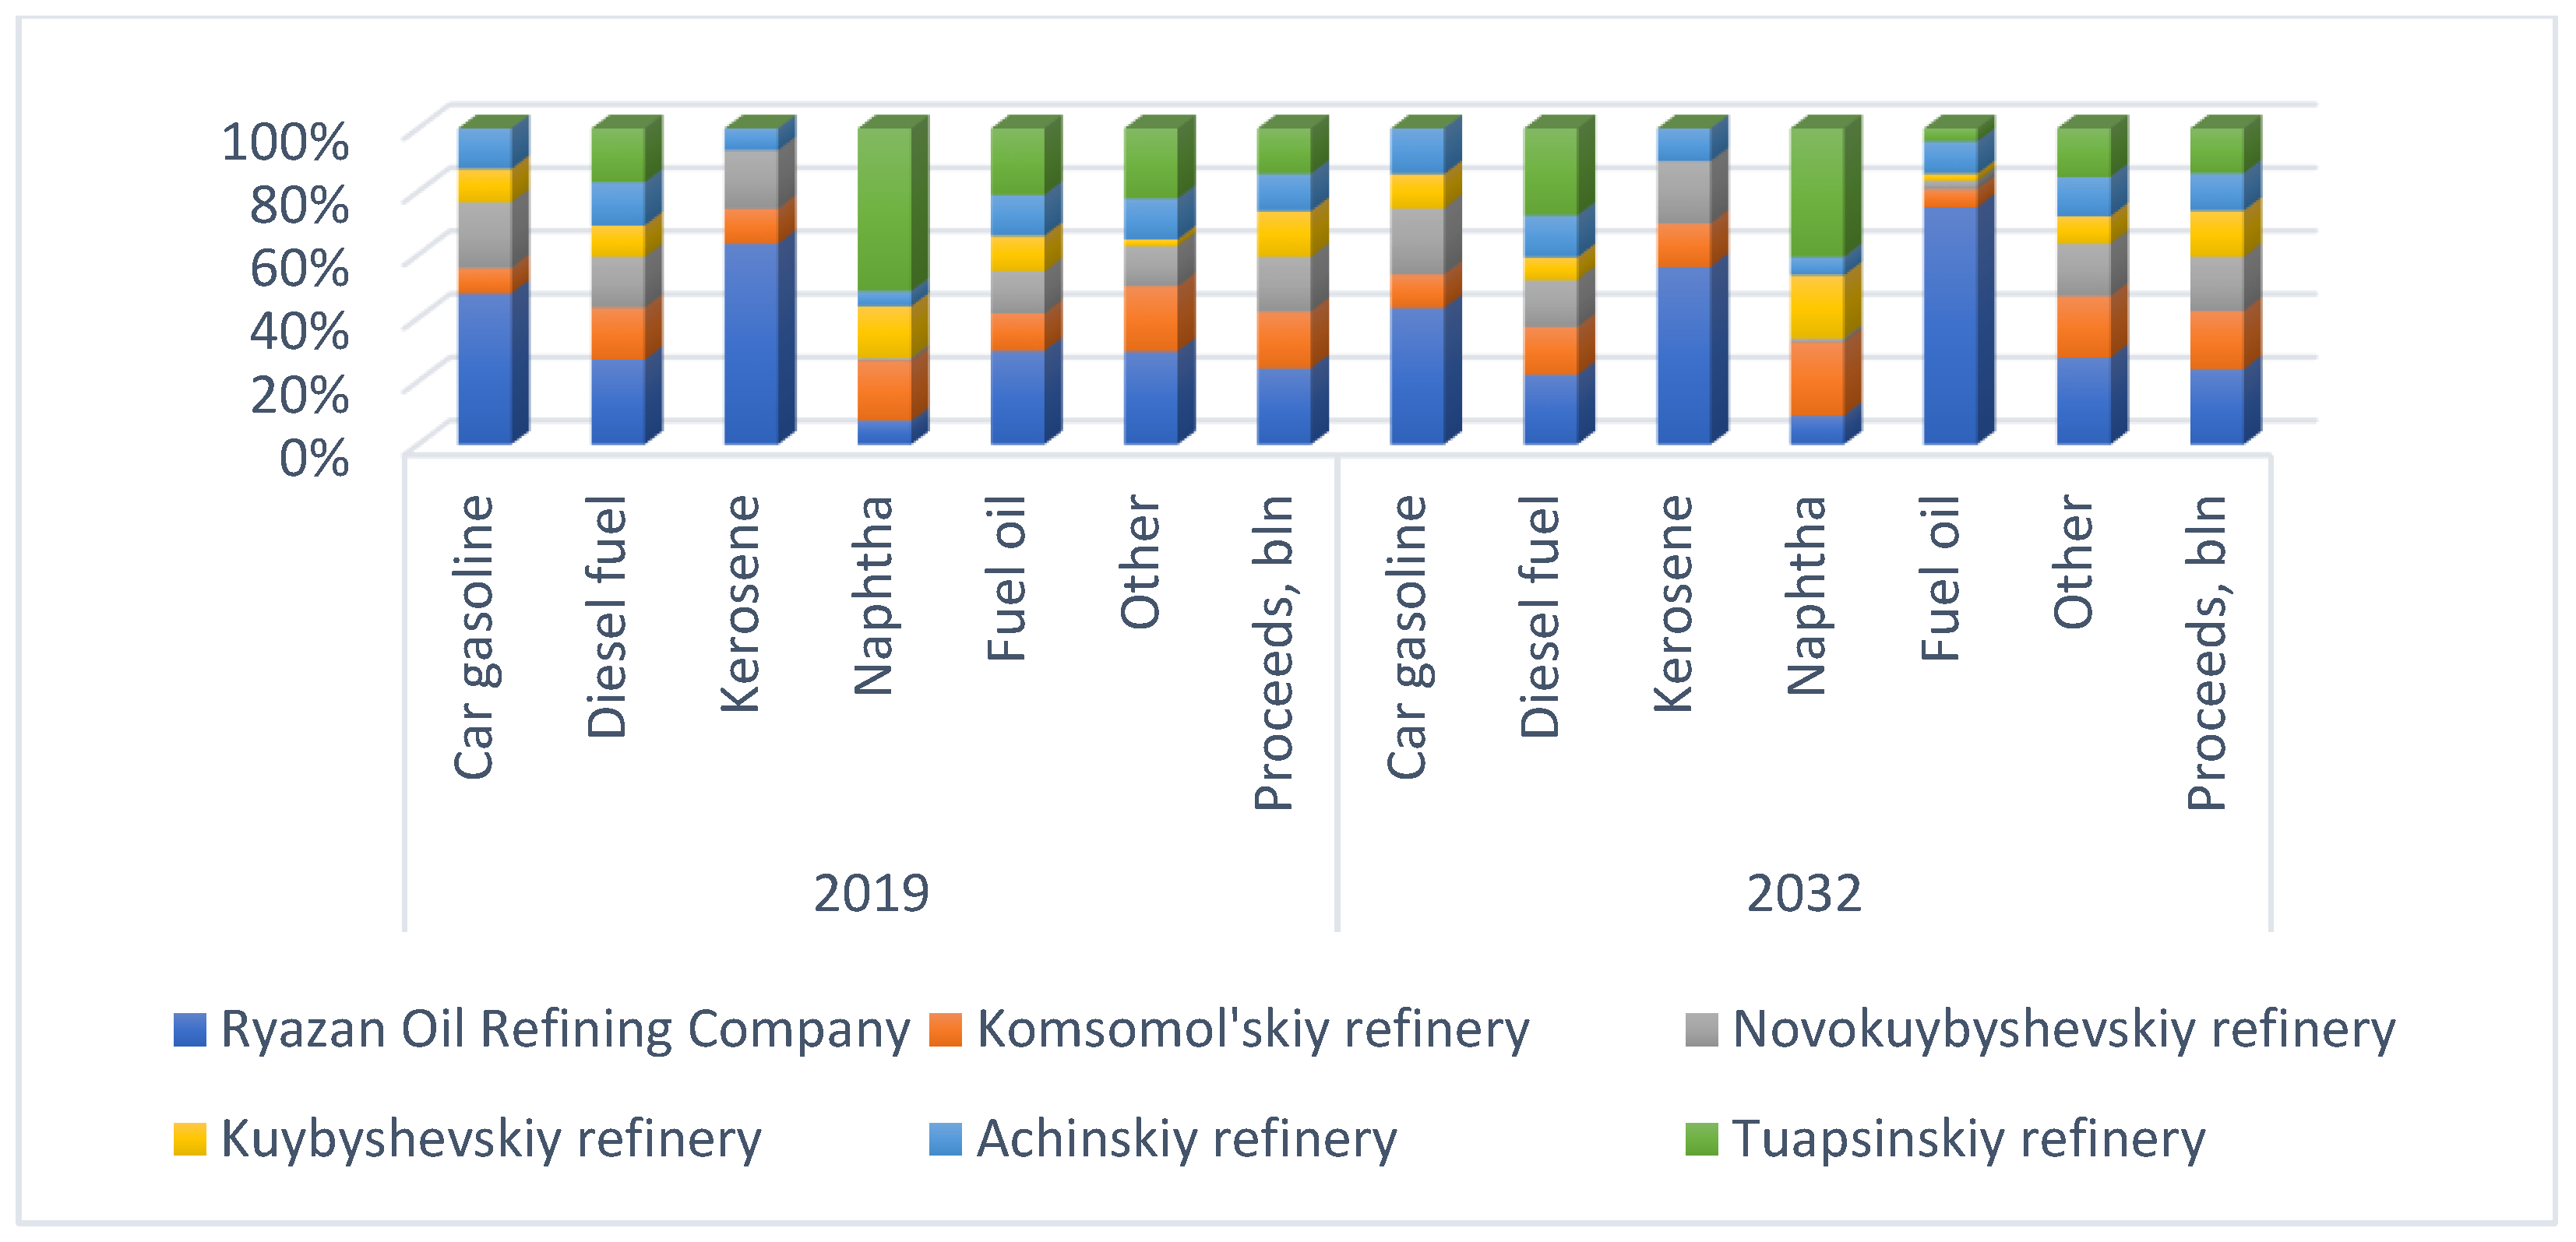
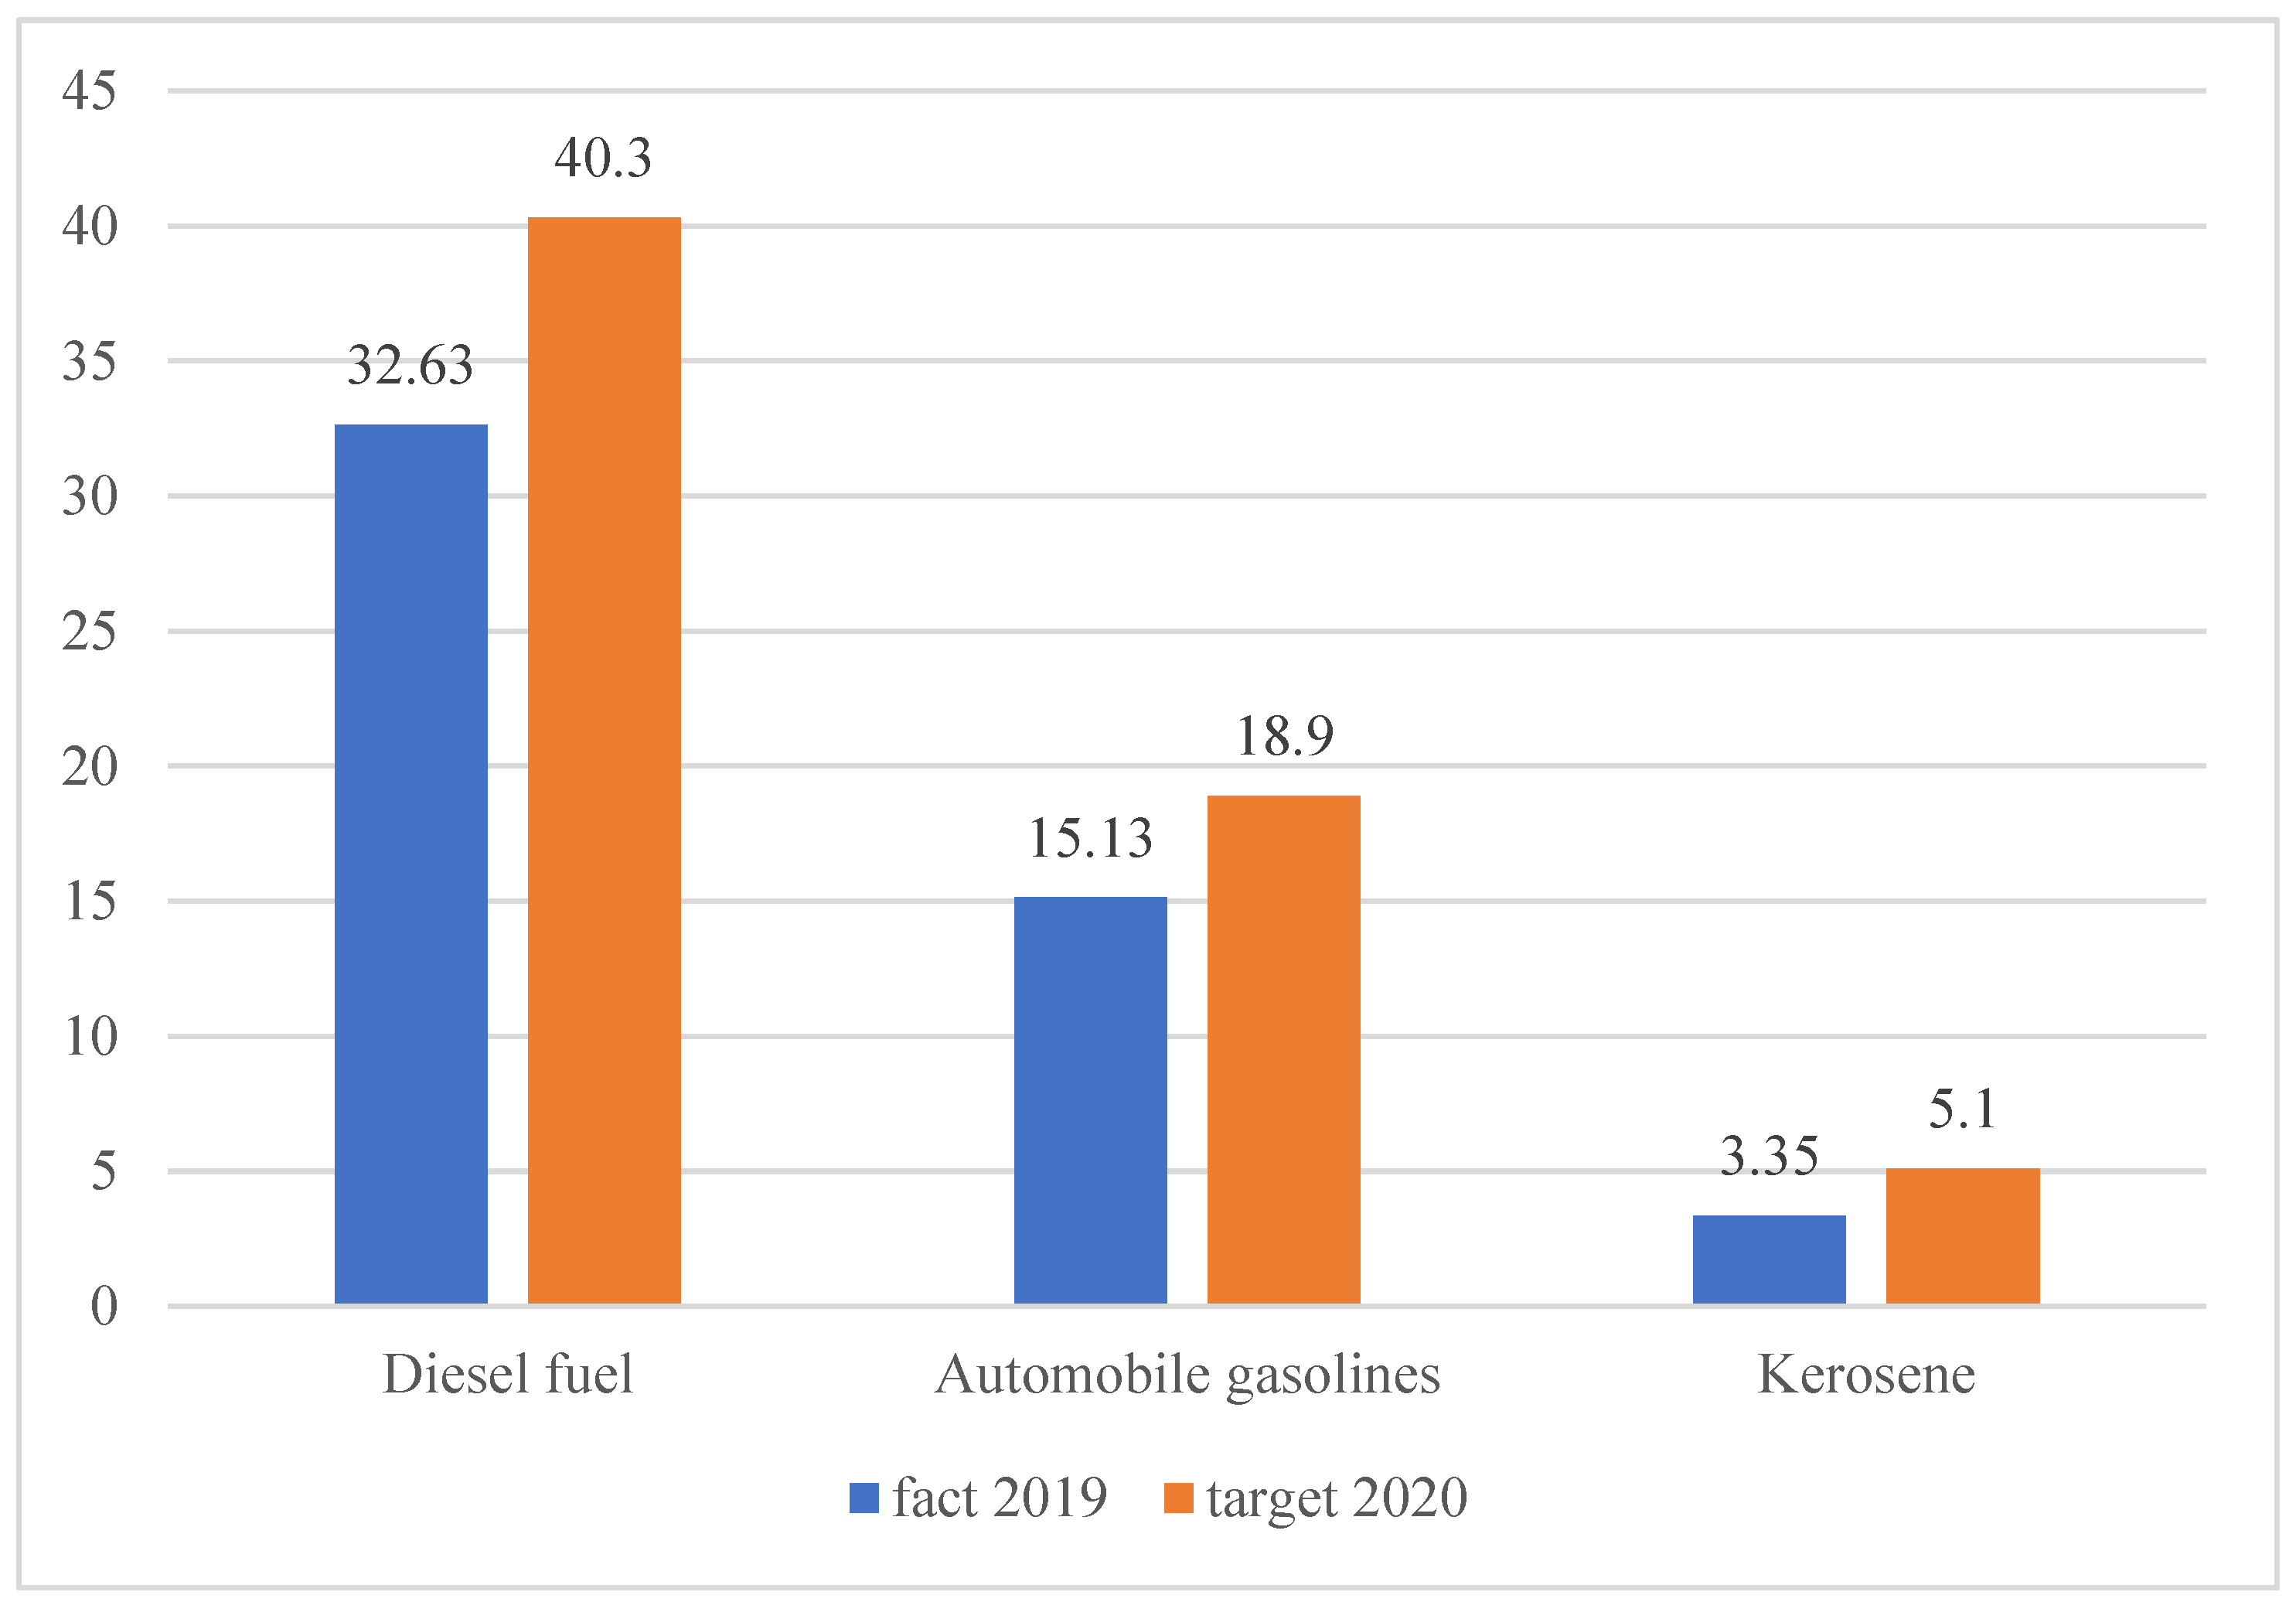
  • Strategy No. 2 will increase revenues to RUB 163.694 billion across the six refineries, which is RUB 55.6 billion more than in the base case (or 152%). The depth of refining at the Ryazan refinery will increase from 72.4% to 95%, at the Komsomolsk refinery from 75.9% to 88%, and at the Novokuibyshevsk refinery from 74.2% to 87%. Thus, the average depth of refining at Rosneft will increase from 74.4% to 82.1%, which will increase marginal yield and reduce fuel oil output by 84.5%. The investment of Strategy No. 2 will be approximately RUB 439.7 billion, with a payback period of 6 years. Strategy No. 2 will exceed the company’s 2022 target by increasing diesel output to 41.319 million tonnes (against a target of 40.3 million tonnes), diesel being a product that meets quality standards and can be exported abroad.

5. Discussion

The results of the evaluation of the strategy options prove the effectiveness of the company’s refinery modernisation projects in terms of performance:
  • the depth of processing—by reducing primary processing residues, reducing the share of products used for process purposes, reducing emissions into the atmosphere and lowering energy consumption;
  • the percentage of light products output—due to a reduction in the production of fuel oil and other dark products;
  • the percentage of renovation of the refinery’s fixed assets.
The depth of processing increases by 4.6 points for Strategy No. 1 and by 7.7% for Strategy No. 2, with a rate of 82.1% in line with the world average. The light products yield increases by 11.3% and 13.8% in Strategies No. 1 and No. 2, respectively (Figure 11).
Refinery modernisation projects allow for high process quality, increased refining depth and light product yields, all of which support hypothesis H 1: “Refinery modernisation is a sufficient condition to achieve process quality and world average product quality”.
As mentioned in the “Introduction” section, the main criteria for evaluating the second hypothesis could be as follows: an increase in the significance of the chemical and petrochemical industry in the Russian economy and the development of related sectors; an increase in the consumption of chemical and petrochemical products to the level of industrialized countries; the creation of highly productive jobs; the transition to an innovation and investment model of development by increasing the depth of processing.
It should be noted that the strategies ensure the economic efficiency of the company’s operations, which will be achieved through a balanced product mix of different margins that will increase the share of clean oil products. Figure 10 shows that the yield of light products will increase by 10%, while fuel oil and naphtha will decrease (Table 8).
In addition to the economic effect, other types of effects, such as environmental, budgetary and social, should also be noted. The implementation of these strategies will have positive environmental effects in the form of increased refining depth, especially in light of the need to meet the requirements of the Paris Agreement to reduce CO2 emissions into the atmosphere. As a result of increasing the depth of oil refining according to the considered strategies emissions to the atmosphere of greenhouse gases in the process of such refining will be reduced [48]. In addition, improving the quality of the produced petroleum products will reduce greenhouse gas emissions from fuel combustion products [49]. Due to the increase of Rosneft’s revenues and profits, a budgetary effect in the form of an increase in tax revenues to the state budget and local budgets of the subjects of the Russian Federation is possible.
With all the positive factors of the modernisation process, it should be admitted that the pace of this process is slow and insufficient to achieve growth and development in the Russian economy of the chemical and petrochemical industry, as well as related industries, in the nearest decade. It is necessary to mention that at present the share of proceeds from oil refining in Rosneft is only 45%, the rest (up to 90%) is sold in raw form for export [31]. This fact illustrates the lost opportunities relating to the development of allied industries, the employment of the population inside the country, the creation of high-performance workplaces and lost profits from production of products with high added value.
The process of modernisation with imported equipment does not contribute to the development of our own innovative base of oil refining. In our opinion, to increase the share of downstream production in the output structure of the chemical complex (in physical terms), reduce the share of imports in the structure of consumption of downstream products and to increase the share of exports in the output structure of the chemical complex, it is necessary to plan, first of all, the construction of new refineries.
Therefore, it must be concluded that hypothesis H 2, which posits that “modernisation of the refining complex is a sufficient condition for achieving the forecast indicators of industry development”, is not supported.
The value of this study lies in the following: the modelling of options for modernisation strategies using the example of a major oil company, the assessment of the results according to the criteria of global industry average indicators of technological efficiency of production and the analysis of these results by state indicators of industry development. The theoretical significance of the study lies in the possibility of using this research approach as an analogue. The practical significance of the study lies in the fact that the results of the study can be used by Russian oil refining companies to develop strategies to improve the efficiency of their operations.
It should be noted that this study has a number of limitations:
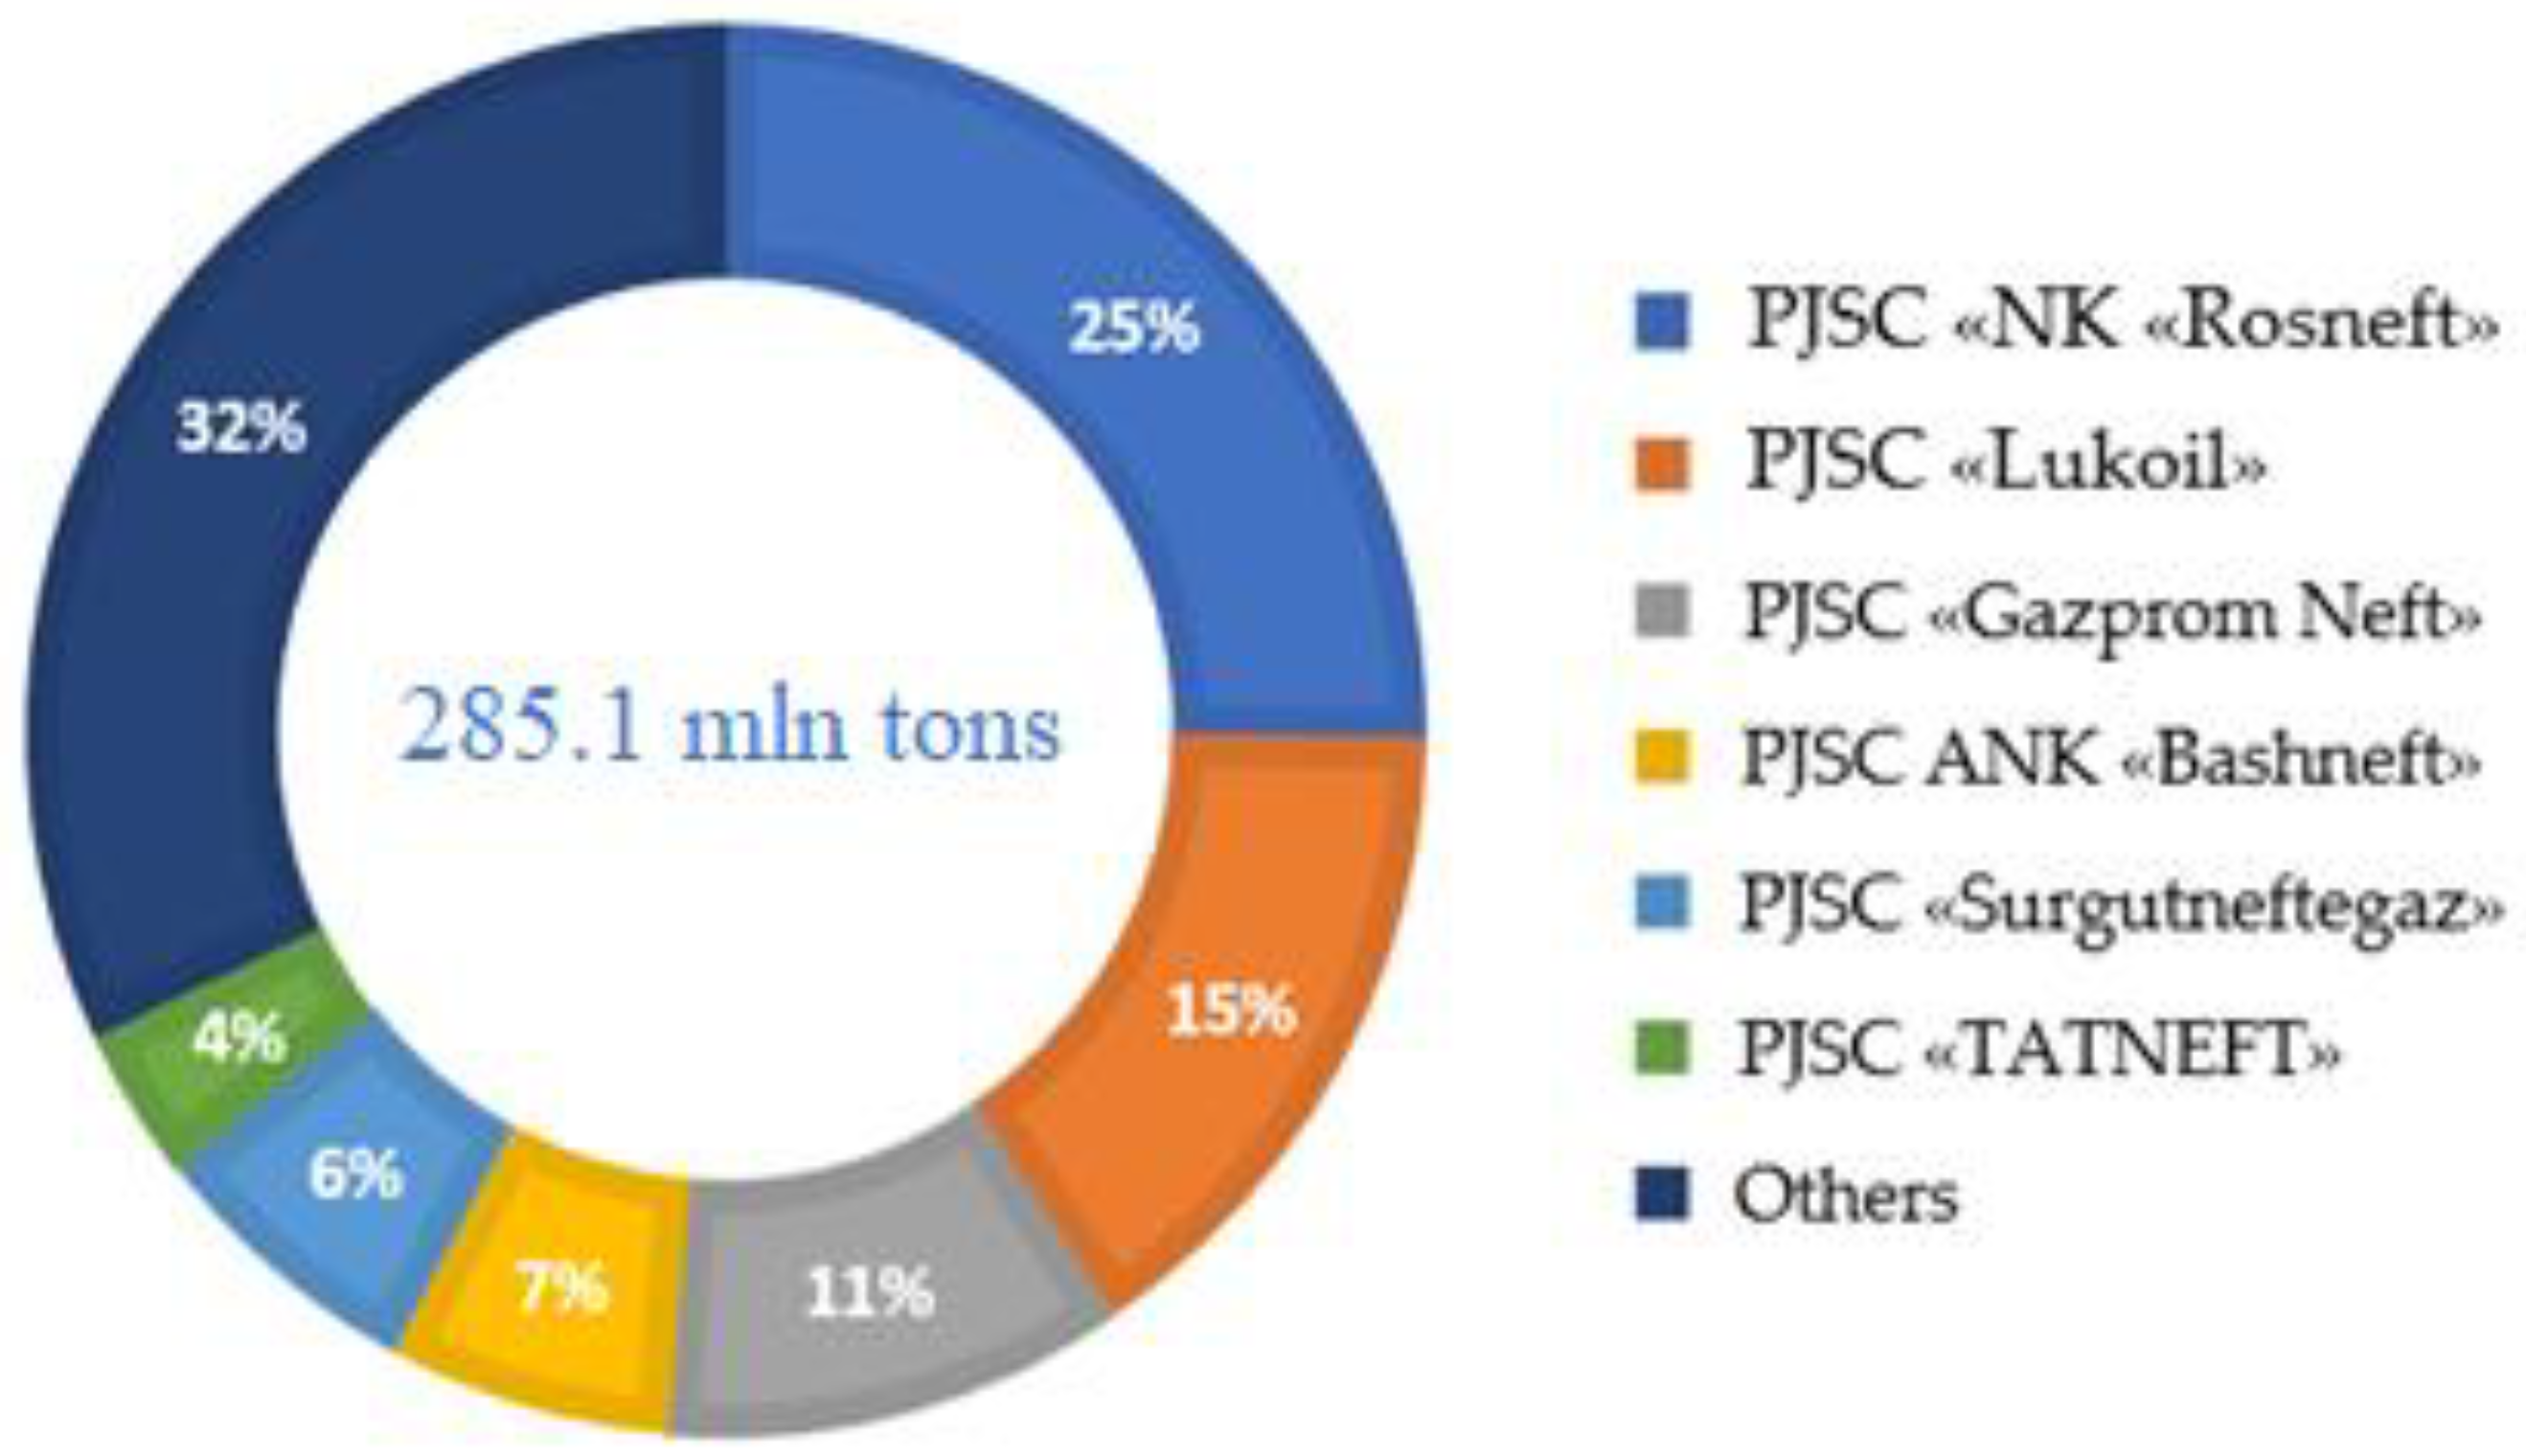
  • the study considers the example of one Russian company, the PJSC Rosneft Oil Company, which has 30% of the Russian oil products market;
  • the study is limited to an analysis of two possible strategies for upgrading Rosneft’s refining capacity;
  • the assessment of project efficiency is presented by indicators of NPV, profitability index and payback period, without taking into account the analysis of project sensitivity to the impact of various risk and uncertainty factors or changes in the main project control parameters, which can significantly change the results in cases of sharp volatility in product prices, growth (reduction) of demand for products and changes in macroeconomic parameters such as credit rates, export duties, introduction of sanctions on hydrocarbon emissions, etc.
The results of this study will be used in further research by the authors to carry out benchmarking analysis of the strategies of Russian and foreign oil companies in order to form recommendations for improving the strategic planning process in the Russian oil sector. In future studies, the authors may develop more strategies, considering geographical and product diversification in these strategies.

6. Conclusions

A study of the refining industry in the Russian Federation, in particular its downstream sector, has been carried out.
By conducting the study, the following results were obtained:
  • An analysis of the existing problems of the downstream sector in the Russian Federation that influence the development of strategic decisions by Russian vertically integrated oil companies has been carried out. The authors show that the main problems in the development of the Russian downstream sector are of a technological nature and that in order to solve them, oil producers must include in their strategies large investments for the purpose of expanding existing facilities in the downstream sector. In order to increase the pace of development of the Russian downstream sector, Russian oil producers should correlate their strategic goals with the strategic objectives set out in the Strategy for the Development of the Chemical and Petrochemical Complex for the period up to 2030;
  • The authors conducted an analysis of Rosneft’s operations, which revealed a discrepancy between those operation and the strategic objectives of the downstream sector; the company derives more than half of its profits from the sale of crude oil. As a result of this analysis, the need to develop strategies to improve the efficiency of Rosneft’s operations has been identified;
  • To achieve the objectives, the authors formulated two strategies for the development of Rosneft’s downstream sector and assessed their cost-effectiveness. The assessment showed that the implementation of measures under Strategy No. 2 may result in higher rates of growth in the depth of oil refining, production and yield of light petroleum products;
  • The authors conclude that the investments made by oil producing companies in upgrading the existing refining facilities can provide solutions to the problem of improving product quality: namely, increasing the depth of oil refining and raising the Nelson Index to European levels. However, as proved by the authors, these strategic decisions cannot ensure the achievement of indicators of industrial development, such as a reduction in the share of imports and an increase in the share of exports of chemical products. In order to achieve these indicators, the strategic objectives of oil producing companies should be to expand existing oil refining capacities and to build new refineries.
The results of this research can be used by Russian vertically integrated oil companies to form the development strategies of the companies and their oil refining capacities in particular. In addition, the results obtained can be used by government agencies, such as the Ministry of Energy of the Russian Federation and the Ministry of Economic Development of the Russian Federation, to improve the decision-making process within the strategic management of Russian oil and gas companies, as well as to develop strategic development programmes for various sectors of the economy.

Author Contributions

Conceptualization, O.M.; methodology, O.M., A.T., Y.V. and A.P.; writing—original draft preparation, O.M., A.T., A.P. and N.K.; writing—review and editing, O.M., A.T. All authors have read and agreed to the published version of the manuscript.

Funding

This research received no external funding.

Institutional Review Board Statement

Not applicable.

Informed Consent Statement

Not applicable.

Data Availability Statement

Not applicable.

Conflicts of Interest

The authors declare no conflict of interest.

References

  1. Shestakova, I.G. To the question of the limits of progress: Is singularity possible? Vestn. Saint Petersbg. Univ. Philos. Confl. Stud. 2018, 34, 391–401. [Google Scholar] [CrossRef]
  2. Pashkevich, N.V.; Tarabarinova, T.A.; Golovina, E.I. Problems of reflecting information on subsoil assets in International Financial Reporting Standards. Acad. Strateg. Manag. J. 2018, 17, 1–9. [Google Scholar]
  3. Dmitrieva, D.M.; Romasheva, N.V. Sustainable development of oil and gas potential of the Arctic and its shelf zone: The role of innovations. J. Mar. Sci. Eng. 2020, 8, 1003. [Google Scholar] [CrossRef]
  4. Information and Analytical Agency Central Dispatch Office of the Fuel and Energy Complex “Petrochemical Projects”. 20 March 2019. Available online: http://www.cdu.ru/tek_russia/Articles/2/558/ (accessed on 2 August 2021). (In Russian).
  5. Litvinenko, V.S.; Tsvetkov, P.S.; Molodtsov, K.V. The social and market mechanism of sustainable development of public companies in the mineral resource sector. Eurasian Min. 2020, 2020, 36–41. [Google Scholar] [CrossRef]
  6. Nedosekin, A.O.; Rejshahrit, E.I.; Kozlovskiy, A.N. Strategic approach to assessing economic sustainability objects of mineral resources sector of Russia. J. Min. Inst. 2019, 237, 354–360. (In Russian) [Google Scholar] [CrossRef]
  7. Rejshahrit, E.I. Features of energy efficiency management in refineries. J. Min. Inst. 2016, 219, 490–497. (In Russian) [Google Scholar]
  8. Electronic National Industry Journal “Oil and Gas Vertical”. Available online: http://www.ngv.ru/magazines/article/rossiyskaya-neftepererabotka-na-sovremennom-etape-razvitiya/?sphrase_id=3128172 (accessed on 2 August 2021). (In Russian).
  9. Electronic Magazine Neftegaz.ru “Refinery (Refinery)”. 10 September 2018. Available online: https://neftegaz.ru/tech-library/pererabotka-nefti-i-gaza/142499-neftepererabatyvayushchiy-zavod-npz/ (accessed on 2 August 2021). (In Russian).
  10. Jenster, P.; Hussey, D. Analysis of a Company’s Strengths and Weaknesses: Identifying Strategic Opportunities; Translated from English; Publishing House Williams: Moscow, Russia, 2003; 368p. (In Russian) [Google Scholar]
  11. Evans, V. Key Strategic Tools. 88 Tools Every Manager Should Know; Publishing House Binom. Knowledge Lab: Moscow, Russia, 2021; 456p. (In Russian) [Google Scholar]
  12. Feigelman, N.V. Analytical substantiation of the company’s strategic development. Bull. Educ. Consort. Cent. Russ. Univ. Ser. Econ. Manag. 2017, 9, 69–71. [Google Scholar]
  13. Thompson, A.A., Jr.; Strickland, A.J., II. Strategic Management. Concepts and Situations for Analysis; Publishing House Williams: Moscow, Russia, 2007; 928p. (In Russian) [Google Scholar]
  14. Khanilo, D.A. Analysis of the current state and problems of functioning of enterprises of oil refining and petrochemical complex at the present stage. Young Sci. 2019, 35, 49–53. (In Russian) [Google Scholar]
  15. Energy Strategy of the Russian Federation to 2035. Available online: https://minenergo.gov.ru/node/1026 (accessed on 2 August 2021). (In Russian)
  16. Order No. 651/172 of 8 April 2014 “On Approval of the Strategy for the Development of the Chemical and Petrochemical Complex for the Period Up to 2030”. Available online: http://docs.cntd.ru/document/420245722 (accessed on 2 August 2021). (In Russian).
  17. Information and Analysis Agency of the Central Dispatch Office of the Fuel and Energy Complex “The US Oil and Refining Industry”. 15 April 2020. Available online: https://www.cdu.ru/tek_russia/articles/1/736/ (accessed on 2 August 2021). (In Russian).
  18. Information and Analytical Agency of the Central Dispatch Directorate of the Fuel and Energy Complex “Russian-Japanese Cooperation in the Fuel and Energy Sector”. 20 May 2020. Available online: https://www.cdu.ru/tek_russia/articles/1/750/?PAGEN_1=8 (accessed on 2 August 2021). (In Russian).
  19. Information and Analysis Agency Central Dispatch Office of the Fuel and Energy Complex “Oil and Refining Industry in Germany”. 17 July 2020. Available online: https://www.cdu.ru/tek_russia/articles/1/773/?PAGEN_1=2 (accessed on 2 August 2021). (In Russian).
  20. Information and Analysis Agency Central Dispatch Administration of the Fuel and Energy Complex “Oil and Refining Industry of China”. 30 March 2020. Available online: https://www.cdu.ru/tek_russia/articles/1/725/?PAGEN_1=2 (accessed on 2 August 2021). (In Russian).
  21. RiaRating Analytical Bulletin. “Chemical Production: Trends and Forecasts”. Issue No. 23, Results of January–June 2016. Available online: http://vid1.rian.ru/ig/ratings/chemistry_sample.pdf (accessed on 2 August 2021). (In Russian).
  22. Analytical Centre under the Government of the Russian Federation. Available online: https://ac.gov.ru/files/publication/a/19119.pdf (accessed on 2 August 2021). (In Russian)
  23. PJSC Gazprom Neft Annual Report 2019. Available online: https://ir.gazprom-neft.ru/reports-and-results/annual-reports/ (accessed on 2 August 2021). (In Russian).
  24. Annual Report PJSC “Surgutneftegas” for 2019. Available online: https://www.surgutneftegas.ru/investors/reporting/godovye-otchety/ (accessed on 2 August 2021). (In Russian).
  25. Annual Report of PJSC TATNEFT for 2019. Available online: https://www.tatneft.ru/storage/block_editor/files/ff073d3c825320e4709391e336c0ec350e599b49.pdf (accessed on 2 August 2021). (In Russian).
  26. Ponomarenko, T.; Nevskaya, M.; Marinina, O. An assessment of the applicability of sustainability measurement tools to resource-based economies of the commonwealth of independent states. Sustainability 2020, 12, 5582. [Google Scholar] [CrossRef]
  27. Vasilenko, N.; Khaykin, M.; Kirsanova, N.; Lapinskas, A.; Makhova, L. Issues for development of economic system for subsurface resource management in Russia through lens of economic process servitization. Int. J. Energy Econ. Policy 2020, 10, 44–48. [Google Scholar] [CrossRef]
  28. Kirsanova, N.Y.; Lenkovets, O.M. Influence of railroad industry on social and economic development of Russia. In Proceedings of the 19th International Multidisciplinary Scientific Geoconference, Sofia, Bulgaria, 28 June–7 July 2019; pp. 421–428. [Google Scholar] [CrossRef]
  29. Annual Reports of Rosneft for 2014–2019. Available online: https://www.rosneft.ru/Investors/statements_and_presentations/annual_reports/ (accessed on 2 August 2021). (In Russian).
  30. Guide to Cost-Benefit Analysis of Investment Projects. 1997. Available online: https://ec.europa.eu/regional_policy/sources/docgener/guides/cost/guide02_en.pdf (accessed on 19 September 2021).
  31. Annual Report of PJSC Rosneft for 2019. Available online: https://www.rosneft.ru/upload/site1/document_file/a_report_2019.pdf (accessed on 2 August 2021). (In Russian).
  32. Author’s Team of the Gubkin Russian State University of Oil and Gas under the Supervision of Ph.D.; Bagdasarov, L.N. Popular Oil Refining; Publisher LLC TsSP Platform: Moscow, Russia, 2017; 111p. (In Russian) [Google Scholar]
  33. LUKOIL Completes Refinery Upgrade with Launch of VGO Hydrocracking Complex. Available online: https://arsenalgroup.ru/news/1795 (accessed on 19 September 2021). (In Russian).
  34. Neftegaz.ru Electronic Magazine “Heavy Oil Residues”. 17 May 2017. Available online: https://neftegaz.ru/tech-library/pererabotka-nefti-i-gaza/142379-tyazhelye-neftyanye-ostatki/ (accessed on 2 August 2021). (In Russian).
  35. Tokareva, N.A. Analysis of the cost of firm’s capital (on the example of JSC “GAZPROM CENTREENERGOGAZ”). Soc. State Pers. Youth Entrep. Behav. Econ. 2020, 248–258. (In Russian) [Google Scholar]
  36. Shigaev, A.I. Ensuring long-term profitability of enterprises on the basis of development strategy. Econ. Anal. Theory Pract. 2008, 9, 42–53. (In Russian) [Google Scholar]
  37. Report on the Long-Term Forecast of Deflator Indices and Inflation up to 2030 by the Ministry of Economic Development of the Russian Federation. Available online: http://economy.gov.ru/minec/resources/6abc9b804897c56b89d4fb74abf22fc8/pokaz.xls (accessed on 2 August 2021). (In Russian)
  38. Kuzhaeva, A.; Dzhevaga, N. Particulars of oil structural organization. ARPN J. Eng. Appl. Sci. 2017, 12, 4157–4166. [Google Scholar]
  39. Kondrasheva, N.; Eremeeva, A.; Nelkenbaum, K.; Baulin, O.A.; Dubovikov, O.A. Development of environmentally friendly diesel fuel. Pet. Sci. Technol. 2019, 37, 1478–1484. [Google Scholar] [CrossRef]
  40. Eremeeva, A.; Kondrasheva, N.; Nelkenbaum, K. Studying the possibility of improving the properties of environmentally friendly diesel fuels. In Scientific and Practical Studies of Raw Material Issues; CRC Press: Boca Raton, FL, USA, 2020; Volume 2019, pp. 108–113. [Google Scholar]
  41. Krivtsova, K.B.; Krivtsov, E.B.; Golovko, A.K. Removal of sulfur compounds from diesel fractions by combination of oxidation and extraction. Proc. Tomsk Polytech. Univ. 2011, 3, 116–120. (In Russian) [Google Scholar]
  42. Zhang, M.; Qin, B.; Zhang, W.; Zheng, J.; Ma, J.; Du, Y.; Li, R. Hydrocracking of Light Diesel Oil over Catalysts with Industrially Modified Y Zeolites. Catalysts 2020, 10, 815. [Google Scholar] [CrossRef]
  43. Zhang, X.; Wang, Q.; Qin, W.; Guo, L. Sustainable Policy Evaluation of Vehicle Exhaust Control—Empirical Data from China’s Air Pollution Control. Sustainability 2020, 12, 125. [Google Scholar] [CrossRef] [Green Version]
  44. Taburchinov, R.I.; Belonogov, M.V.; Egorov, R.I. Effect of the Addition of Petrochemicals onto the Atomization and Ignition of the Coal-Water Slurry Prepared from the Wastes. Appl. Sci. 2020, 10, 8574. [Google Scholar] [CrossRef]
  45. Kuskov, V.B.; Lvov, V.V.; Yushina, T.I. Increasing the recovery ratio of iron ores in the course of preparation and processing. CIS Iron Steel Rev. 2021, 21, 4–8. [Google Scholar] [CrossRef]
  46. Rosneft Has Planned the Construction of Four VGO Hydrocrackers at Its Refineries in Russia. Available online: https://oilandgasrefining.ru/news/rosneft-zaplanirovala-stroitelstvo-chetyreh-gidrokrekingov-vgo-na-npz-v-rossii/ (accessed on 2 August 2021). (In Russian).
  47. Handbook of OOO NPP Neftechim/Hydrocracking of Heavy Residues. Available online: https://nefthim.ru/spravochnik/gidrokreking-tjazhelyh-ostatkov (accessed on 2 August 2021). (In Russian).
  48. Vasilev, Y.; Cherepovitsyn, A.; Tsvetkova, A.; Komendantova, N. Promoting Public Awareness of Carbon Capture and Storage Technologies in the Russian Federation: A System of Educational Activities. Energies 2021, 14, 1408. [Google Scholar] [CrossRef]
  49. Kutuzova, M. Sea Fever. Sulphur is Squeezed out of Marine Fuel. Kommersant Newspaper “Oil and Gas”. 24 December 2019, Volume 37, p. 2. Available online: https://www.kommersant.ru/doc/4205188 (accessed on 2 August 2021). (In Russian).
Figure 1. The product structure of mini refineries [14].
Resources 11 00004 g001
Figure 2. Forecast of light petroleum product yield development in the Russian Federation, % [15].
Resources 11 00004 g002
Figure 3. Forecast of primary refining depth in the Russian Federation, % [15].
Resources 11 00004 g003
Figure 4. Nelson index growth projection for the Russian Federation, points [15].
Resources 11 00004 g004
Figure 5. Share of the petrochemical complex in countries’ GDP, % [17].
Resources 11 00004 g005
Figure 6. Regional and product mix of global primary petrochemicals production, 2017, 2030 and 2050, million tonnes [22].
Resources 11 00004 g006
Figure 7. The structure of Russia’s refining industry in 2019 [8].
Resources 11 00004 g007
Figure 8. Ratio of actual and planned output of marketable products of Rosneft, mn tones. Source: compiled by the authors according to [31].
Resources 11 00004 g008
Figure 9. Results of the implementation of Strategy No. 1. Source: compiled by the authors based on data [33].
Resources 11 00004 g009
Figure 10. Results of the implementation of Strategy No. 2. Source: compiled by the authors based on data [46].
Resources 11 00004 g010
Figure 11. Scenarios for Rosneft’s development strategy, with a focus on refining and petrochemicals. Source: compiled by the authors.
Resources 11 00004 g011
Table 1. Structure of oil refining in the Russian Federation.
CompanyNumber of Refineries
Belonging to the Company
Rosneft (including Bashneft refineries)12
PJSC Lukoil4
PJSC Gazprom3
New Stream Group3
PJSC Gazprom Neft2
PJSC NGK Slavneft2
OJSC Surgutneftegas1
Other refineries5
Source: designed by authors using [9].
Table 2. Main problems of the refining industry in the Russian Federation.
ProblemCharacteristicPossible Solutions
Ageing capacityA large number of Russia’s refineries were built in the 1940s and 1960s; buildings, facilities, technology and equipment are obsolete.Construction of new refineries/total replacement of equipment and refining technology/construction of new facilities
Low processing depthAt present, refining depth in the Russian Federation is on average 10% less than at US refineries. A large number of remnants after primary processing is used for technological needs.Allocate investments to modernise equipment to reduce atmospheric emissions and energy consumption
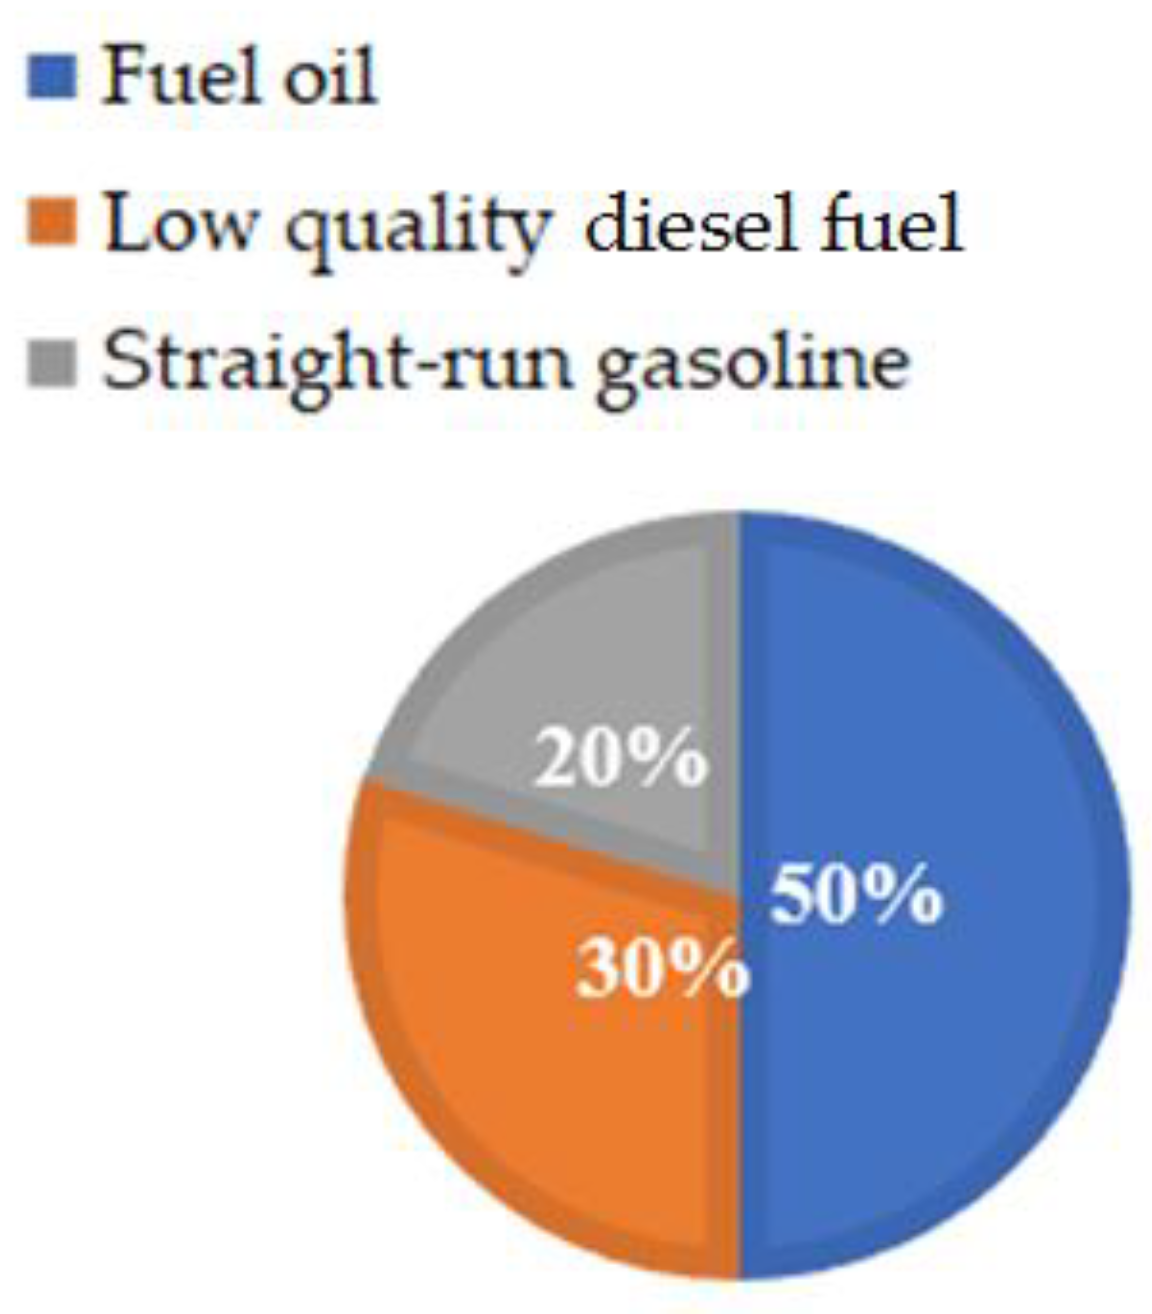
Low percentage of light products outputThe ratio of light to dark petroleum products in the Russian Federation is 69%, which indicates the production of a large amount of cheap and unpreventable product. Consequently, the country is missing out on the profits that could have been made by selling quality gasoline at new standards.Reduction in production of fuel oil and other dark oil products/continuation of equipment modernisation
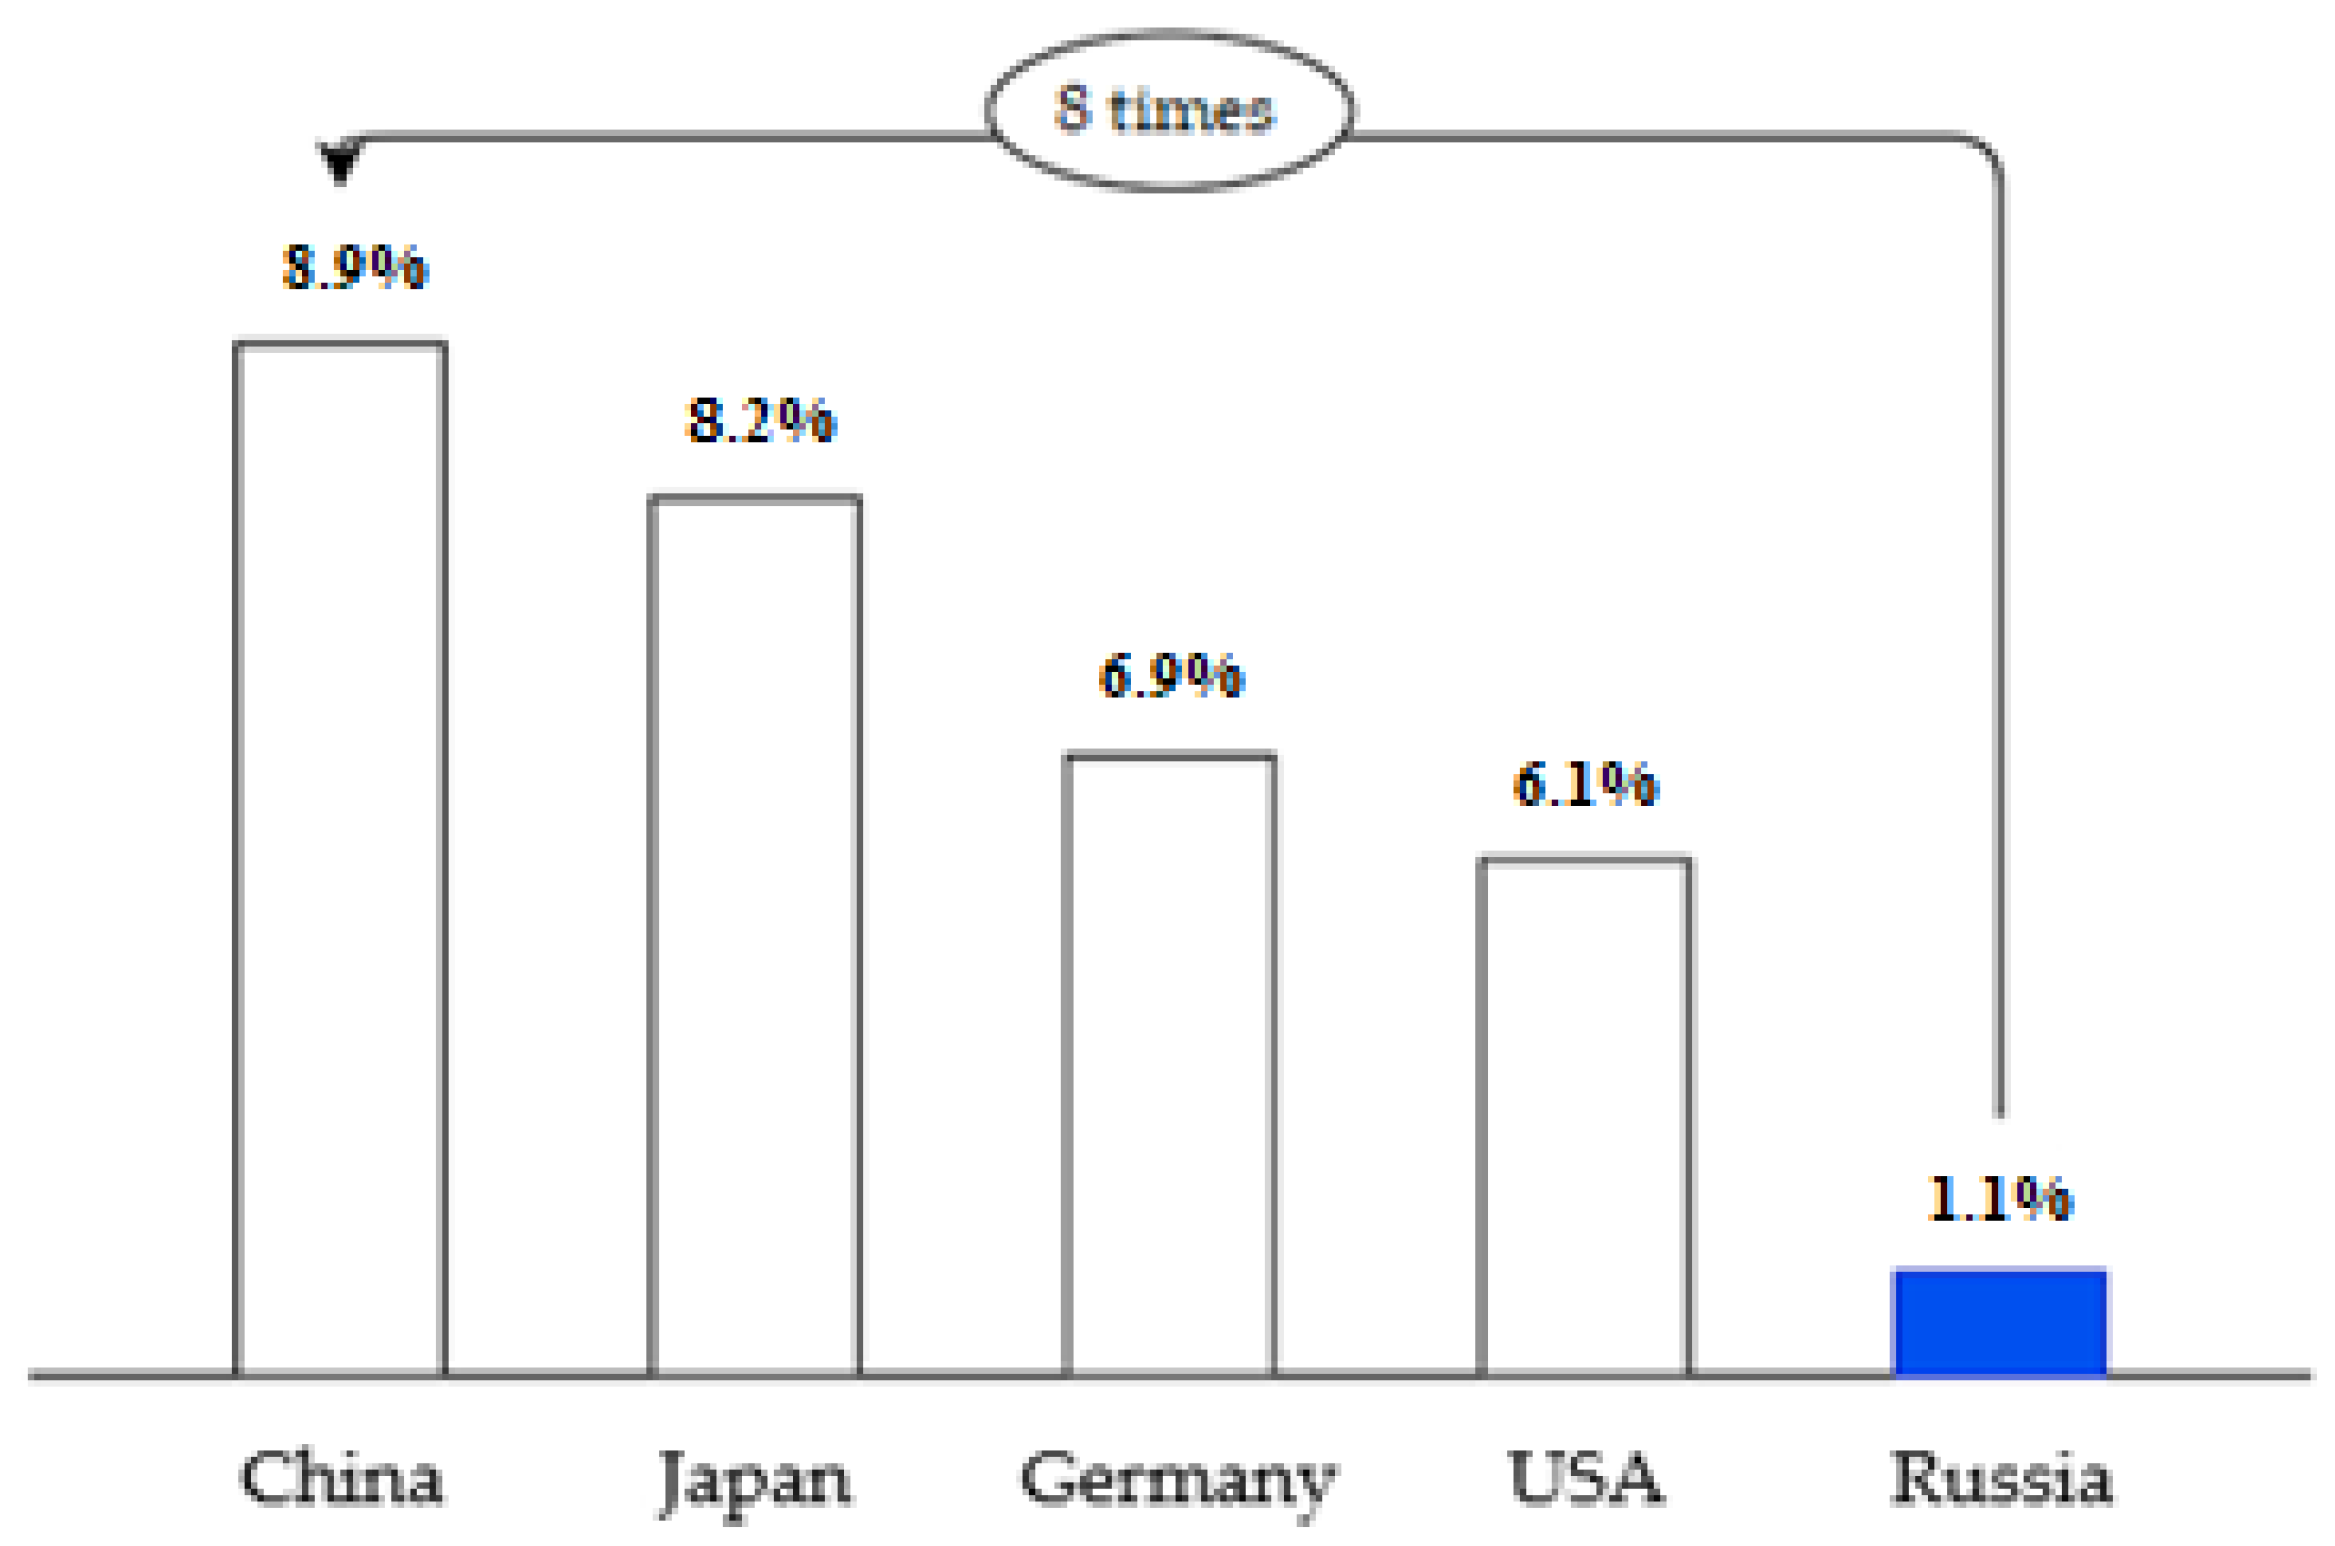
Low level of the Nelson IndexThe current average Nelson index in the RF is 4–5 points, while in European countries it is 8–10 points and in the USA it is 10–12 points. This value of the index indicates the technical “simplicity” of refineries in the Russian Federation. Many Russian refineries have a low number of high-tech recycling units.Expansion of the technical scheme of refineries, modernisation of production, introduction of newer and more technologically advanced units/allocation of research and development investments to reduce Russia’s dependence on foreign technology
Lack of catalysatorsDue to the sanctions, some suppliers have stopped supplying catalysts for the production of petroleum products, which has had an impact on the quality of the products produced.The construction of a modern high-tech catalyst production complex is underway at Gazprom Neft-Omsk Refinery, and a heavy oil hydro-conversion unit using nanoscale catalyst systems is being designed at TANECO. These projects will reduce Russia’s dependence on catalyst supplies from abroad.
Low-quality petroleum productsTaken together, the above-mentioned problems result in a drop in the quality of petroleum products, which does not meet the quality standards of many countries, making Russian products uncompetitive abroad.As a result of addressing the above issues, there will be an increase in the level of product quality.
Source: designed by authors using [8,15,16].
Table 3. Characteristics of strategies in the refining sector of major Russian refiners.
OrganisationCharacteristics of the Strategy
Gazprom oil [23]Plans for 2025:
to increase oil refining to 40.0 million tonnes;
to increase refining depth to 99%;
to increase the output of light petroleum products to 80%;
that the total investment in the development of the Omsk Refinery and Moscow Refinery by 2025 exceeds RUB 550 billion;
the development and modernisation of the NIS project; expected investments through 2025 are €1.4 billion.
Surgutneftegas [24]Priority areas:
the optimisation of existing production, improvement of efficiency of refining processes by implementing projects for modernisation and reconstructing existing production facilities;
to reduce the production volume of low-margin products, increasing the oil refining depth and the share of light petroleum products;
to produce a wide range of products in accordance with market requirements.
Tatneft [25]Strategic objectives 2030:
to increase oil refining capacity to 15.7 million tonnes per year;
a refining depth of 99%;
a light products output of 89%;
to increase the output of premium products;
the optimisation of sales logistics;
the optimal balance of oil and petroleum product sales.
Source: designed by authors using [23,24,25].
Table 4. Relevance of objectives and targets for the implementation of the Strategy.
TargetIndicator
The growing importance of the chemical and petrochemical industry in the Russian economy and the development of related industries1. Increase the volume of own-produced goods, works and services rendered by own efforts by 2.8 times in 2030 as compared to 2012, which will amount to 6552 billion roubles in this year’s prices.
2. Increase the share of the chemical complex in Russia’s GDP by 2030 to 2.1% (instead of 1.1% in 2012).
3. Maintain annual investments in the development of the chemical complex in the order of 271 bln roubles (2020–2030).
Increased consumption of chemicals and petrochemicals to the level of industrialised countries4. Increase the consumption of the most important products by 2030:
mineral fertilisers—from 39.2 to 55.7 kg/ha;
chemical fibres and yarns—from 2.4 to 8.5 kg/person;
paints and varnishes—from 10.4 to 25.7 kg/person;
plastic products—from 32.3 to 89.8 kg/person;
passenger cars and light trucks—from 356.6 to 604.4 tyres/person; truck tyres—from 52.6 to 81.8 tyres/person; agricultural and industrial tyres—from 11.9 to 15.3 tyres/person.
Creating high-capacity jobs5. Increase labour productivity in the chemical complex of the Russian Federation from 4.0 to 21.1 million roubles/person.
6. Ensure an annual increase in high-productive jobs of 90% over the previous year
Transition to an innovative and investment-driven development model by increasing the depth of processing7. Increase the production of essential products and quality socially oriented products and meet the growing needs of the domestic market for chemicals and new materials, and also expand the range of products.
8. Increase exports during Phase I of the Strategy (2014–2016) by 18% and by 2030 by 3.0 times compared to 2012.
9. Implement effective import substitution and reduce the dependence of the domestic market on the influence of foreign companies, thereby ensuring economic security.
10. Promote the development of technological transport infrastructure to increase the volume and safety of chemical and petrochemical cargo transportation.
11. Promote regional development, formation of interconnected regional production complexes (petrochemical clusters and chemical industrial parks).
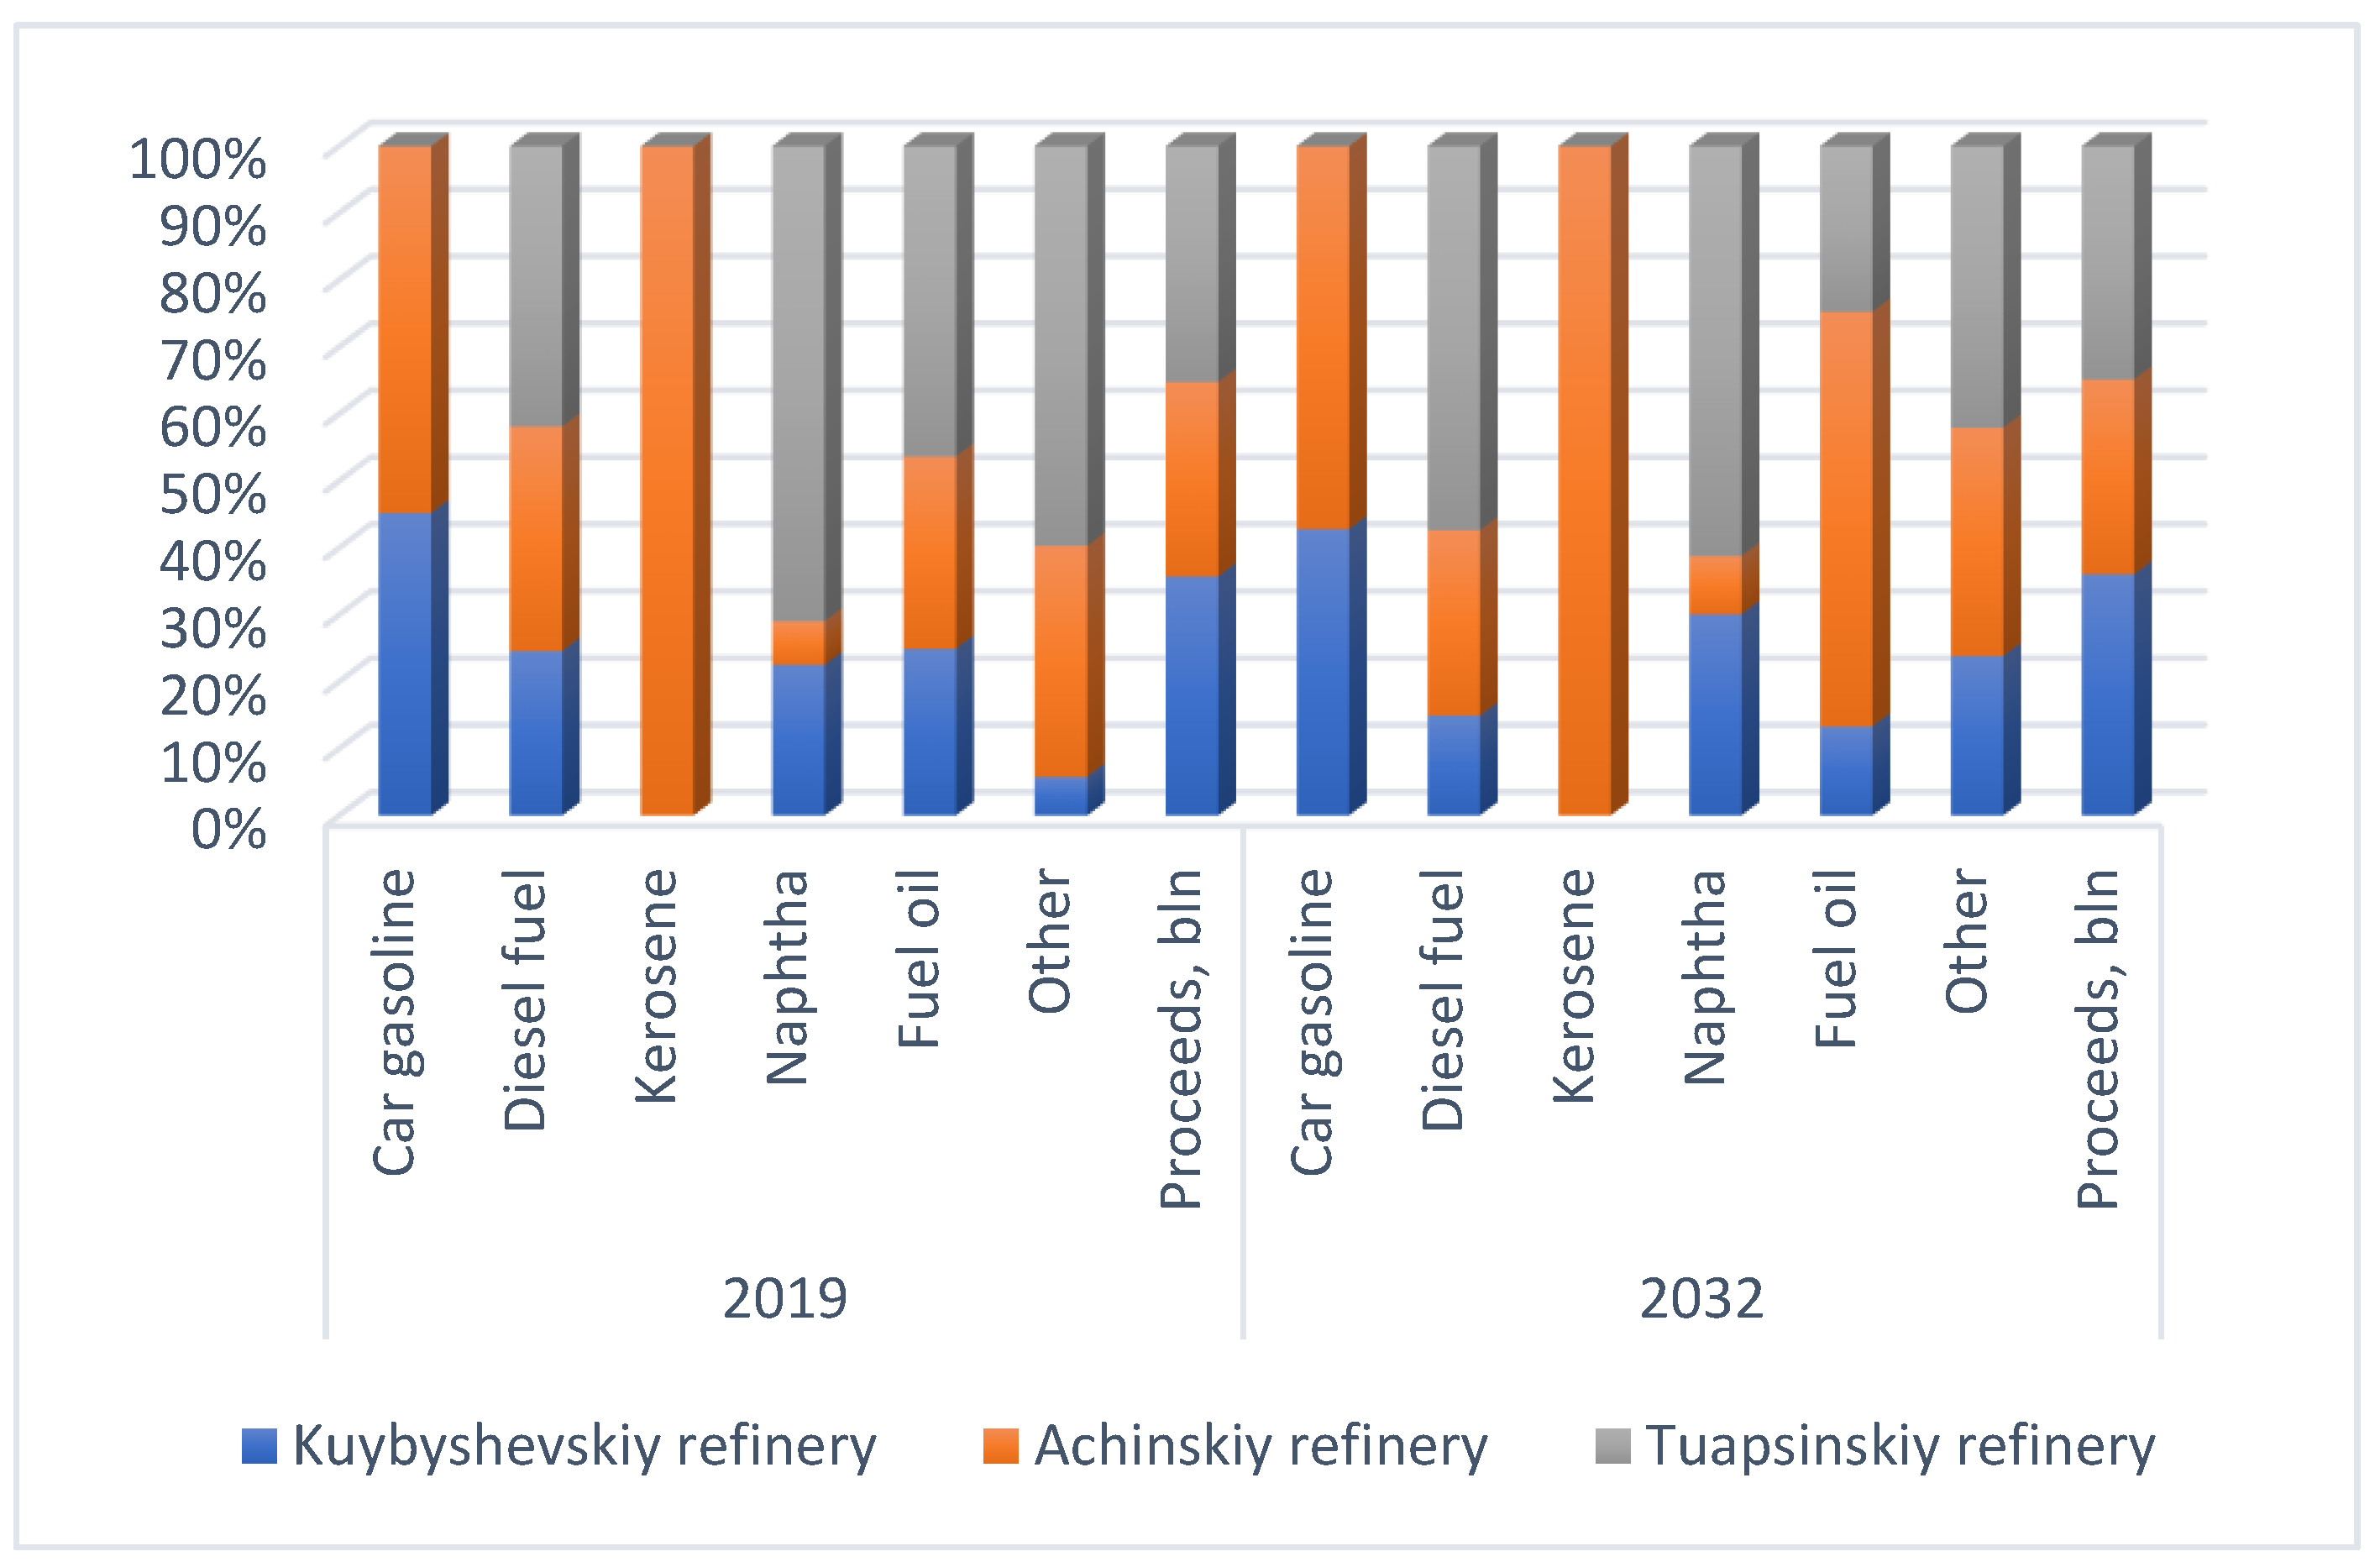
Source: developed by authors according to [16].
Table 5. Results of the implementation of Strategy No. 1.
Product,
Thousand Tonnes
Refinery
Kuibyshev
Refinery
Achinsk
Refinery
Tuapse
Refinery
2019
Motor gasoline746905-
Diesel fuel158421612702
Paraffin-118-
Nafta5371561695
Fuel oil162818763030
Other1458671501
Revenue, RUB bln15.68112.75315.483
2032
Motor gasoline930.61245-
Diesel fuel170031616542
Paraffin-218-
Nafta5371561095
Fuel oil81.4379151.5
Other6459241139.5
Revenue, RUB billion23.98619.39323.225
Source: compiled by the authors based on data [33].
Table 6. Results of the implementation of Strategy No. 2.
Product,
Thousand Tonnes
Refinery
Ryazan NPKKomsomolsk
Refinery
Novokuibyshevsk
Refinery
Kuibyshev
Refinery
Achinsk
Refinery
Tuapse
Refinery
2022
Motor gasoline33745661465746905-
Diesel fuel424726092534158421612702
Paraffin1085189317-118-
Nafta247626305371561695
Fuel oil426817091911162818763030
Other198613898541458671501
Revenue, RUB billion26.0419.39318.62715.68112.75315.483
2032
Motor gasoline37149061805930.61245-
Diesel fuel524736093534170031616542
Paraffin1185289417-218-
Nafta247626305371561095
Fuel oil277121295.5581.4379151.5
Other204314461229,456459241139.5
Revenue, RUB billion39.0630.089527.940523.98619.39323.225
Source: compiled by the authors based on data [46].
Table 7. Scenarios for Rosneft’s development strategy, with a focus on refining and petrochemicals.
IndicatorsBase Case
(BV)
Strategy No. 1Deviation (+-) from BV, %Strategy No. 2Deviation (+-) from BV, %
Depth of refining, %74.479.0+6.282.1+10.4
Light petroleum product yield, %57.668.9+19.671.4+24.0
Production of light petroleum products, million tonnes47.22152.801+11.857.121+21.0
Costs, RUB billion-138.8-439.7-
Source: compiled by the authors.
Table 8. Refined petroleum products, dynamics by option, thousand tonnes.
ProductBase CaseStrategy No. 1Strategy No. 2
Motor gasoline13,955+525+1204
Diesel fuel30,754+14,956+7956
Paraffin2512+100+400
Nafta5222−600−600
Fuel oil21,407−5922−10,922
Other12,792+196+685
Source: compiled by the authors.
Publisher’s Note: MDPI stays neutral with regard to jurisdictional claims in published maps and institutional affiliations.

