Article

Micro and Macroelements in Honey and Atmospheric Pollution (NW and Central Poland)

by
Małgorzata Gałczyńska
1,*,
Renata Gamrat
2,
Mateusz Bosiacki
3,
Zofia Sotek
4,
Małgorzata Stasińska
4 and
Ireneusz Ochmian
5
1
Department of Bioengineering, West Pomeranian University of Technology in Szczecin, Słowackiego 17 Street, PL-71-434 Szczecin, Poland
2
Department of Environmental Management, West Pomeranian University of Technology in Szczecin, Słowackiego 17 Street, PL-71-434 Szczecin, Poland
3
Department of Functional Diagnostics and Physical Medicine, Pomeranian Medical University in Szczecin, Żołnierska 54 Street, PL-71-210 Szczecin, Poland
4
Institute of Marine and Environmental Sciences, University of Szczecin, Adama Mickiewicza 16 Street, PL-70-383 Szczecin, Poland
5
Department of Horticulture, West Pomeranian University of Technology in Szczecin, Słowackiego 17 Street, PL-71-434 Szczecin, Poland
*
Author to whom correspondence should be addressed.
Resources 2021, 10(8), 86; https://doi.org/10.3390/resources10080086
Submission received: 1 July 2021 / Revised: 5 August 2021 / Accepted: 19 August 2021 / Published: 22 August 2021

Abstract

:
Urban vegetation is generally exposed to high levels of air pollution in airborne particles, with the greatest exposure in the EU being seen in Poland. With the continuing growth of urban populations, there is a need to confirm whether honey produced from urban areas is of similar high quality to that from rural areas. A total of 27 honey samples were collected from urban and rural apiaries and tested for the concentrations of 19 elements by ICP-OES. The results were compared with data on honey produced in old and new EU countries (metadata). Our evaluation used a novel approach to determine threshold values in the identification of the bioproduct contamination index. The analysed urban honey samples demonstrated higher concentrations of K, Sr, Ba, Ni, and Co, and lower levels of Mn and B than rural honey samples. Contamination by PM10 particles and the toxic elements contained in them proved to be a poor predictor of the content of these elements in honey, in contrast to the effect of atmospheric pollution measured during firework shows, which demonstrated higher concentrations of Ba, Pb, Ca, Cu, and Mg. The non-carcinogenic risk assessment indicated that the analysed honey samples are of good quality and are comparable or of even better quality than honey products from other EU countries.

1. Introduction

The production of natural food products, such as those produced by bees, is strongly influenced by local vegetation and animal resources. Out of numerous apiculture products, honey is by far the most popular. As a bioproduct, it is a valuable nutrient produced from plant nectar and the secretions of live plant parts and insects. Its quality is determined by a complex mixture of carbohydrates, proteins, enzymes, as well as micro- and macroelements [1,2]. Due to its complex chemical composition, honey is a common dietary element, where it is a source of energy and plays a role in the formation and regulation of essential nutrients needed for the proper development and functioning of the human organism. The substances contained in honey have a stimulating effect on the immune system and metabolism, prevent damage to some organs, and can even minimise the side effects of chemotherapy [3,4,5]. However, their medicinal properties are not yet fully understood; for example, studies suggest honey may be used in the glycaemia treatment of diabetic patients to increase the efficacy and safety of herbal medicines or improve resistance against COVID-19 [6,7,8].
Greater awareness of environmental pollution brings forth the need for the proper management of plant and animal resources. Regardless of their particular characteristics, bees are inextricably linked with the environment that forms bee pastures; furthermore, as their flight radius typically extends only as far as 1.5 km from the hive, the concentration of pollutants in their bodies and in apiculture products is strongly determined by local pollution levels. Therefore, their concentrations in honey can be used as indicators of environmental pollution with heavy metals (HMs), xenobiotics, and radioactive substances [9,10,11,12]. Otherwise, the quality of honey depends on the region of its origin, i.e., the climatic conditions, plant resources, soil composition, water and air quality, as well as storage conditions [13,14,15]. Honey may contain non-biodegradable toxic elements originating from agricultural and industrial activities, coal combustion, deposition of atmospheric pollutants due to melting of the snow cover, combustion of municipal waste, and microplastic [16].
A significant source of pollution is the transport sector, whose influence is primarily determined by the number and age of motor vehicles, road surface conditions, and traffic organisation [17]. One of the key constituents of air pollution is particulate matter (PM), which is present in more than 80% of urban areas [18]. Coarse grain size particulate matter (PM10) consists primarily of particles originating from the earth’s crust; therefore, it is enriched with Al, Ca, Fe, and Si oxides and numerous HMs. In contrast, fine-grained PM2.5 consists mainly of nitrates, sulphates, inorganic and organic C compounds, as well as HMs.
As contaminated honey may pose a risk for human health, in particular with respect to small children, it is crucial to identify locations in which the concentration of harmful elements significantly exceeds acceptable standards and determine the potential access of living organisms [11]. Of particular concern are As (metalloid), and HMs such as Cd, Cr, Ni, and Pb, as these are known to demonstrate a range of harmful effects, including carcinogenic properties [19]. Long-term consumption of food contaminated with metals such as Cd and Pb can lead to various complications such as kidney or liver damage, bone demineralisation, cardiovascular diseases, disorders of the nervous and immune system, and hyperglycaemia [3,15].
Until recently, pure and uncontaminated honey was associated with rural areas only. Nowadays, however, apiaries are more frequently being established on the roofs of tall buildings, and apiculture in rural areas is becoming increasingly popular or profitable [20,21,22]. Urban bee pastures typically demonstrate more diverse plant resources, and the resulting honey is believed to have a more full-bodied taste. In addition, in the contrast to rural honey products, city honey products should not contain pesticides [23,24,25].
However, studies suggest that honey produced in anthropogenic regions is at an increased risk of contamination with metals [15,26,27,28,29]; in particular, it was assumed that honey products from apiaries located in urban agglomerations with high PM10 concentrations demonstrate greater concentrations of metals than those produced in rural apiaries. The aim of the present study was therefore to determine the micro- and macroelements (MMs) quality of honey originating from the northwestern and central parts of Poland, including HMs, and compare the findings with those of honey products from other EU countries. In addition, the quality of urban honey was compared with that of rural honey from the immediate area. It was also investigated whether PM10 air pollution, documented by monitoring studies considered a predictor of HM level, is indeed reflected in the elemental composition of the analysed honey samples.

2. Materials and Methods

2.1. Study Areas

The analysis was conducted on honey samples obtained from three cities and rural areas in their immediate vicinity. The samples were obtained directly from honey products intended for sale, which were produced in six apiaries managed by five apiarists. Three cities with different physical and chemical parameters, viz. Warsaw, Szczecin, and Gorzów Wielkopolski (Gorzów Wlkp.), were chosen as areas constituting the bee pasture. The main factor of selection was the size of the city. The residence area in Warsaw was 200 km2 greater than in Szczecin, which was, in turn, similarly larger than Gorzów Wlkp. This factor, when analysed jointly with the number of residents, may affect the diversity of atmospheric air pollution. Similarly, the highest level of industrialisation and degree of traffic system development was identified in Warsaw, followed by Szczecin and Gorzów Wlkp. (Table 1).
Atmospheric pollution with PM10 was assessed, as was the presence of As, Cd, Ni, and Pb. The factors were classified in terms of the protection of human health [30,31,32]. In 2018, the measuring points in Szczecin and Gorzów Wlkp. were found to demonstrate class A with respect to PM10 concentration, i.e., the 24 h and mean annual levels of PM10 concentration did not exceed recommended values. In contrast, high values of PM10 concentration were recorded in Warsaw resulting in a classification of class C. In all the rest of the analysed cities, the concentrations of As, Cd, Ni, and Pb in PM10 were classified as class A (Table 1).
The rural apiaries were located (natural and cultivated plant species) in Celinów, Kobylanka, and Chwalęcice, each of which is found within 20 km from the borders of Warsaw, Szczecin, and Gorzów Wlkp., respectively.

2.2. Contamination of Air (PM and HMs)

Considering the element cycle in the environment and identified adverse effects of air pollutants on human health and ecosystem status, air quality assessments are conducted annually; these tests are particularly focused on PM2.5 and PM10 particulate matter levels, as well as the As, Cd, Ni and Pb levels in the latter. The quality of honey is particularly determined by levels of particulate matter, and its associated HMs, originating from low emission sources [26,33]. Such particulate matter is more dangerous than that originating from industrial sources, which are equipped with efficient filtering systems. Poland demonstrates higher levels of particulate pollution than other EU countries, including its neighbours (Table 2) [34].

2.3. Honey Samples

The biological material was obtained in 2019 directly from 27 locations of six apiaries during veterinary inspections. The material was taken from randomly—selected glass jars (from Robinia pseudoacacia L., Tilia sp., Brassica napus L. var. napus, honeydew, and multiflower), intended for sale. Each sample weighed 80 g and was collected into clean plastic containers. In total, 27 honey samples were taken (one for each location); these were labelled as follows: sites 1–4 from Szczecin (veterinary identification number (PLW) 32625251); sites 5–7 from Kobylanka village (PLW 321442179); sites 8–9 from Gorzów Wlkp.; site 10 from Chwalęcice village (PLW 08015686); sites 15–26 from Warsaw (PLW 146552210); sites 11–14 and 27 from Celinów village (PLW 14125614) (Figure 1).

2.4. Selected Predictors of Climatic Conditions

Out of the analysed urban agglomerations, in the vegetation period of 2019, the highest temperature values were recorded in Gorzów Wlkp. (Table S1, in Supplementary Materials). However, in all locations, thermal conditions allowed for bee foraging as the temperature values were higher than 12 °C. All cities included in the analysis demonstrated comparable mean monthly precipitation values in the period April–August (from 54 to 56 mm), with the lowest values recorded in April. On rainy days, bees flight and, consequently, bee foraging ceases due to disruption of sensory signals and activation of mechanic and energetic limitations [35]. In the analysed period, i.e., April–August 2019, meteorological conditions were favourable for the development of bee pastures (Table S1).

2.5. Chemical Studies of Elements

All samples were stored at room temperature until processed. The analysis was performed using inductively—coupled plasma optical emission spectrometry (ICP-OES, ICAP 7400 Duo, Thermo Scientific, Waltham, MA, USA) equipped with a concentric nebuliser and cyclonic spray chamber to determine their manganese, zinc, copper, iron, strontium, sodium, potassium, lead, chromium, boron, phosphorus, magnesium, calcium, barium, sulphur, nickel, cobalt, cadmium, arsenic content. Analysis was performed in radial and axial modes.
The samples were mineralised using microwave digestion system MARS 5, CEM. The weight of the sample for research was at least 0.5 g. The samples were transferred to clean polypropylene tubes. Then, 2 mL of 65% HNO3 (Suprapur, Merck, Darmstadt, Germany) was added to each vial, and each sample was allowed 30 min pre-reaction time in the clean hood. After completion of the pre-reaction time, 1 mL of non-stabilised 30% H2O2 solution (Suprapur, Merck) was added to each vial. Once the addition of all reagents was complete, the samples were placed in special Teflon vessels and heated in microwaved digestion system for 35 min at 180 °C (15 min ramp to 180 °C and maintained at 180 °C for 20 min). At the end of digestion, all samples were removed from the microwave and allowed to cool to room temperature. In the clean hood, samples were transferred to acid-washed 15 mL polypropylene sample tubes. A further 10-fold dilution was performed prior to ICP-OES measurement. The samples were spiked with an internal standard to provide a final concentration of 0.5 mg/L yttrium, 1 mL of 1% Triton (Triton X-100, Sigma-Aldrich, Merck, Darmstadt, Germany), and diluted to the final volume of 10 mL with 0.075% nitric acid (Suprapur, Merck). Samples were stored in a monitored refrigerator at a nominal temperature of 8 °C until analysis.
Blank samples were prepared by adding concentrated nitric acid to tubes without sample and subsequently diluted in the same manner described above.
Multielement calibration standards (ICP multi-element standard solution IV, ICP Sulphur standard, Merck and Phosphorus ICP Standard (AccuStandard, Inc. New Haven, CT, USA) were prepared with different concentrations of inorganic elements in the same manner as in blanks and samples. Deionised water (Direct Q UV, Millipore, approximately 18.0 MΩ) was used for the preparation of all solutions.
Samples of reference material (NIST SRM 1486 Bone Meal) were prepared in the same manner as samples.
The wavelengths (nm) were Ca 315.887, Mn 257.610, K 766.490, Zn 202.548, Cu 224.700, Fe 238.204, Na 589.592, Pb 220.353, Cr 205.560, B 249.773, Sr 421.552, P 178.284, Mg 280.270, Ba 233.527, S 180.731, Ni 221.647, Co 238.892, Cd 214.438, As 189.042.

2.6. Dataset on MMs Concentration in Honey Samples from EU Countries (Metadata)

The threshold values of low and high MMs concentrations in honey samples from EU countries were determined based on data from 57 scientific articles (Table S2). The reported data were from the period 1993–2020, and these were acquired from both old and new EU countries. Regarding the numbers of publications used to construct the dataset on MMs concentration in honey samples, the most among the old EU countries were obtained for Spain (11 published articles), France and Italy (5 each), Greece and Germany (4 each), Ireland (3), Portugal (2), and Austria and Finland (1 each) (metadata), while among the new EU countries, the most were obtained for Poland (10), Hungary (6), Bulgaria and Croatia (5 each), The Czech Republic and Romania (4 each), Slovenia (3), Lithuania (2), Latvia, and Malta and Slovakia (1 each).
Of the 18 MMs discussed in the analysed literature, 12 were present in all analysed honey samples from NW and central Poland, and these were selected for analysis. In total, 1243 studies had been performed on the levels of these elements within the EU (Figure S1). In the analysed period, more studies on honey were conducted in the new EU countries (n = 842) than in those of the old EU (n = 401). The most frequently analysed elements were K and Zn, followed by Mg and Ca, and Cu and Fe. In contrast, the least commonly analysed were Sr, B, P, and S.
The mean concentrations of MMs and standard deviation in honey samples are given in Figure S2. Other descriptive statistics are presented in Table 3 (see Section 2.9. Honey Contamination Ratio). For the purposes of the comparative analysis, the threshold values of a given element in honey were adopted based on the determined quartile I and III values provided in the EU country dataset.

2.7. Statistical Analysis

Descriptive statistics (mean, min., max., standard deviation, median, quartile I, and III) were calculated for the obtained MM concentrations in the analysed honey samples. The distribution of data was assessed with the use of Shapiro–Wilk test. As the distribution was not normal, the data were then further analysed using the non-parametric Mann–Whitney U test and the Kruskal–Wallis test.

2.8. Non-Carcinogenic Risk Assessment

The non-carcinogenic risk associated with ingestion of the MMs at the content found in honey was estimated using the following equation [28]:
THQi = EDI RfD
where THQi is the target hazard quotient of each MMs.
The estimated daily intake (EDI) was calculated by the following equation [28]:
EDI = C   ×   IR × EF × ED BW × AT
where
  • C: the concentration of MMs in honey was according to mg/kg dry weight (DW). Hence, their unit was converted to mg/kg-wet weight via the following equation:
    WW = DW × 100 % M /   100
    where
  • WW: concentration according to wet weight; DW: concentration according to dry weight and % moisture (M) is content in honey, i.e., 17.9% [28].
  • IR: ingestion rate of honey is 0.575 g/350 d (day) for Poland but 0.671 kg/350 d for EU countries [36,37];
  • EF: exposure frequency is 350 days/year;
  • ED: exposure duration is 6 years for children and 30 years for adults;
  • BW: body weight is 15 kg for children and 70 kg for adults;
  • AT (days), mean lifetime: AT for estimation non-carcinogenic risk in the children and adults is 2190 and 10,950 days, respectively.
EDI μg/(kg·d), intake MMs per kilogram BW, and RfD mg/(kg·d). Oral reference dose (RfD) for Mn, Fe, Cu, Zn, Sr is 0.14, 0.7, 0.04, 0.3, and 0.6 mg/(kg·d), respectively [38].
In order to consider the risk of MM accumulation, the total target hazard quotient (TTHQ) was calculated using the following equation [28]:
TTHQ = k = 1 n TTHQk
where TTHQk is the non-carcinogenic risk of each used MM.

2.9. Honey Contamination Ratio

The honey contamination ratio (HCR) has been developed to assess MM contamination in terrestrial environments through the use of honey as a bioindicator. This calculation method was adapted from HCI, developed for honeybees by Goretti et al. [11]. HCR is calculated based on a combination of HCRhigh and HCRlow; this value allows the level of MM contamination level in honey to be compared with the content of elements in honey samples identified in EU countries and has the following attributes:
  • H, a high contamination level when HCRhigh is positive;
  • L, a low contamination level when HCRlow is negative;
  • I, an intermediate contamination level when HCRhigh is negative and HCRlow is positive.
HCRhigh and HCRlow are calculated using the following equation:
HCRlow = log(Cmean, PS/Cquartile I)
HCRhigh = log(Cmean, PS/Cquartile III)
where Cmean, PS/Cquartile is the ratio between the mean MMs concentration in honey, and the I and III quartile MM concentration in honey from values of quartile (Table 3).
Table 3. Values of I and III quartiles and mean MM concentration (mg/kg WW) in honey samples from EU countries (calculated using metadata references from Table S2).
MMsMnZnCuFeSrMgCaKNaBPS
Mean2.633.730.997.600.8156.42108.62888.2142.917.6349.9629.39
I quartile0.531.530.282.200.2110.4028.20150.3012.104.5527.8014.00
III quartile3.204.331.2710.401.3554.15133.001421.0047.127.8066.1041.88

3. Results

Considerable variation in MM concentration was observed between the analysed samples. The Shapiro–Wilk test indicated that the metals concentrations did not demonstrate a normal distribution. Therefore, the urban and rural honey samples were compared using the Mann–Whitney U test. Significantly higher concentrations of Mn and B were identified in urban honey samples than rural honey samples. In turn, the results of the Kruskal–Wallis test indicated that the concentrations of Cu, Fe, Ca, Na, and Sr in honey samples varied according to the location of origin.

3.1. MMs Bioaccumulation in the Analysed Honey Samples

The MMs investigation involved 27 sites in the NW and central parts of Poland. The data are presented in Table 4 and Table S3.
The analysed honey samples were characterised by low concentrations of Pb, Cr, Ba, Ni, and Co, with the identified values being below the limit of detection (LOD) in many samples. As the concentrations of Cd and As were below LOD (0.001 and 0.008 mg/kg WW, respectively) in all tested honey samples, their values are not shown. Hence, only low levels of contamination by these metals were noted. However, Pb was determined in honey samples obtained from 18 sites—namely, Ni in eight sites; Cr in six sites, Ba in six sites; Co in three sites (Figure 2). The presence of Co was found only in honey samples from Warsaw, which were dominated by Pb and Cr.

3.2. Honey Contamination Ratio (HCR) Analysis

To compare the levels of MM contamination of the tested honey samples from NW and central Poland with those from other EU countries, HCR was calculated and interpreted for the 12 MMs present in all analysed samples.
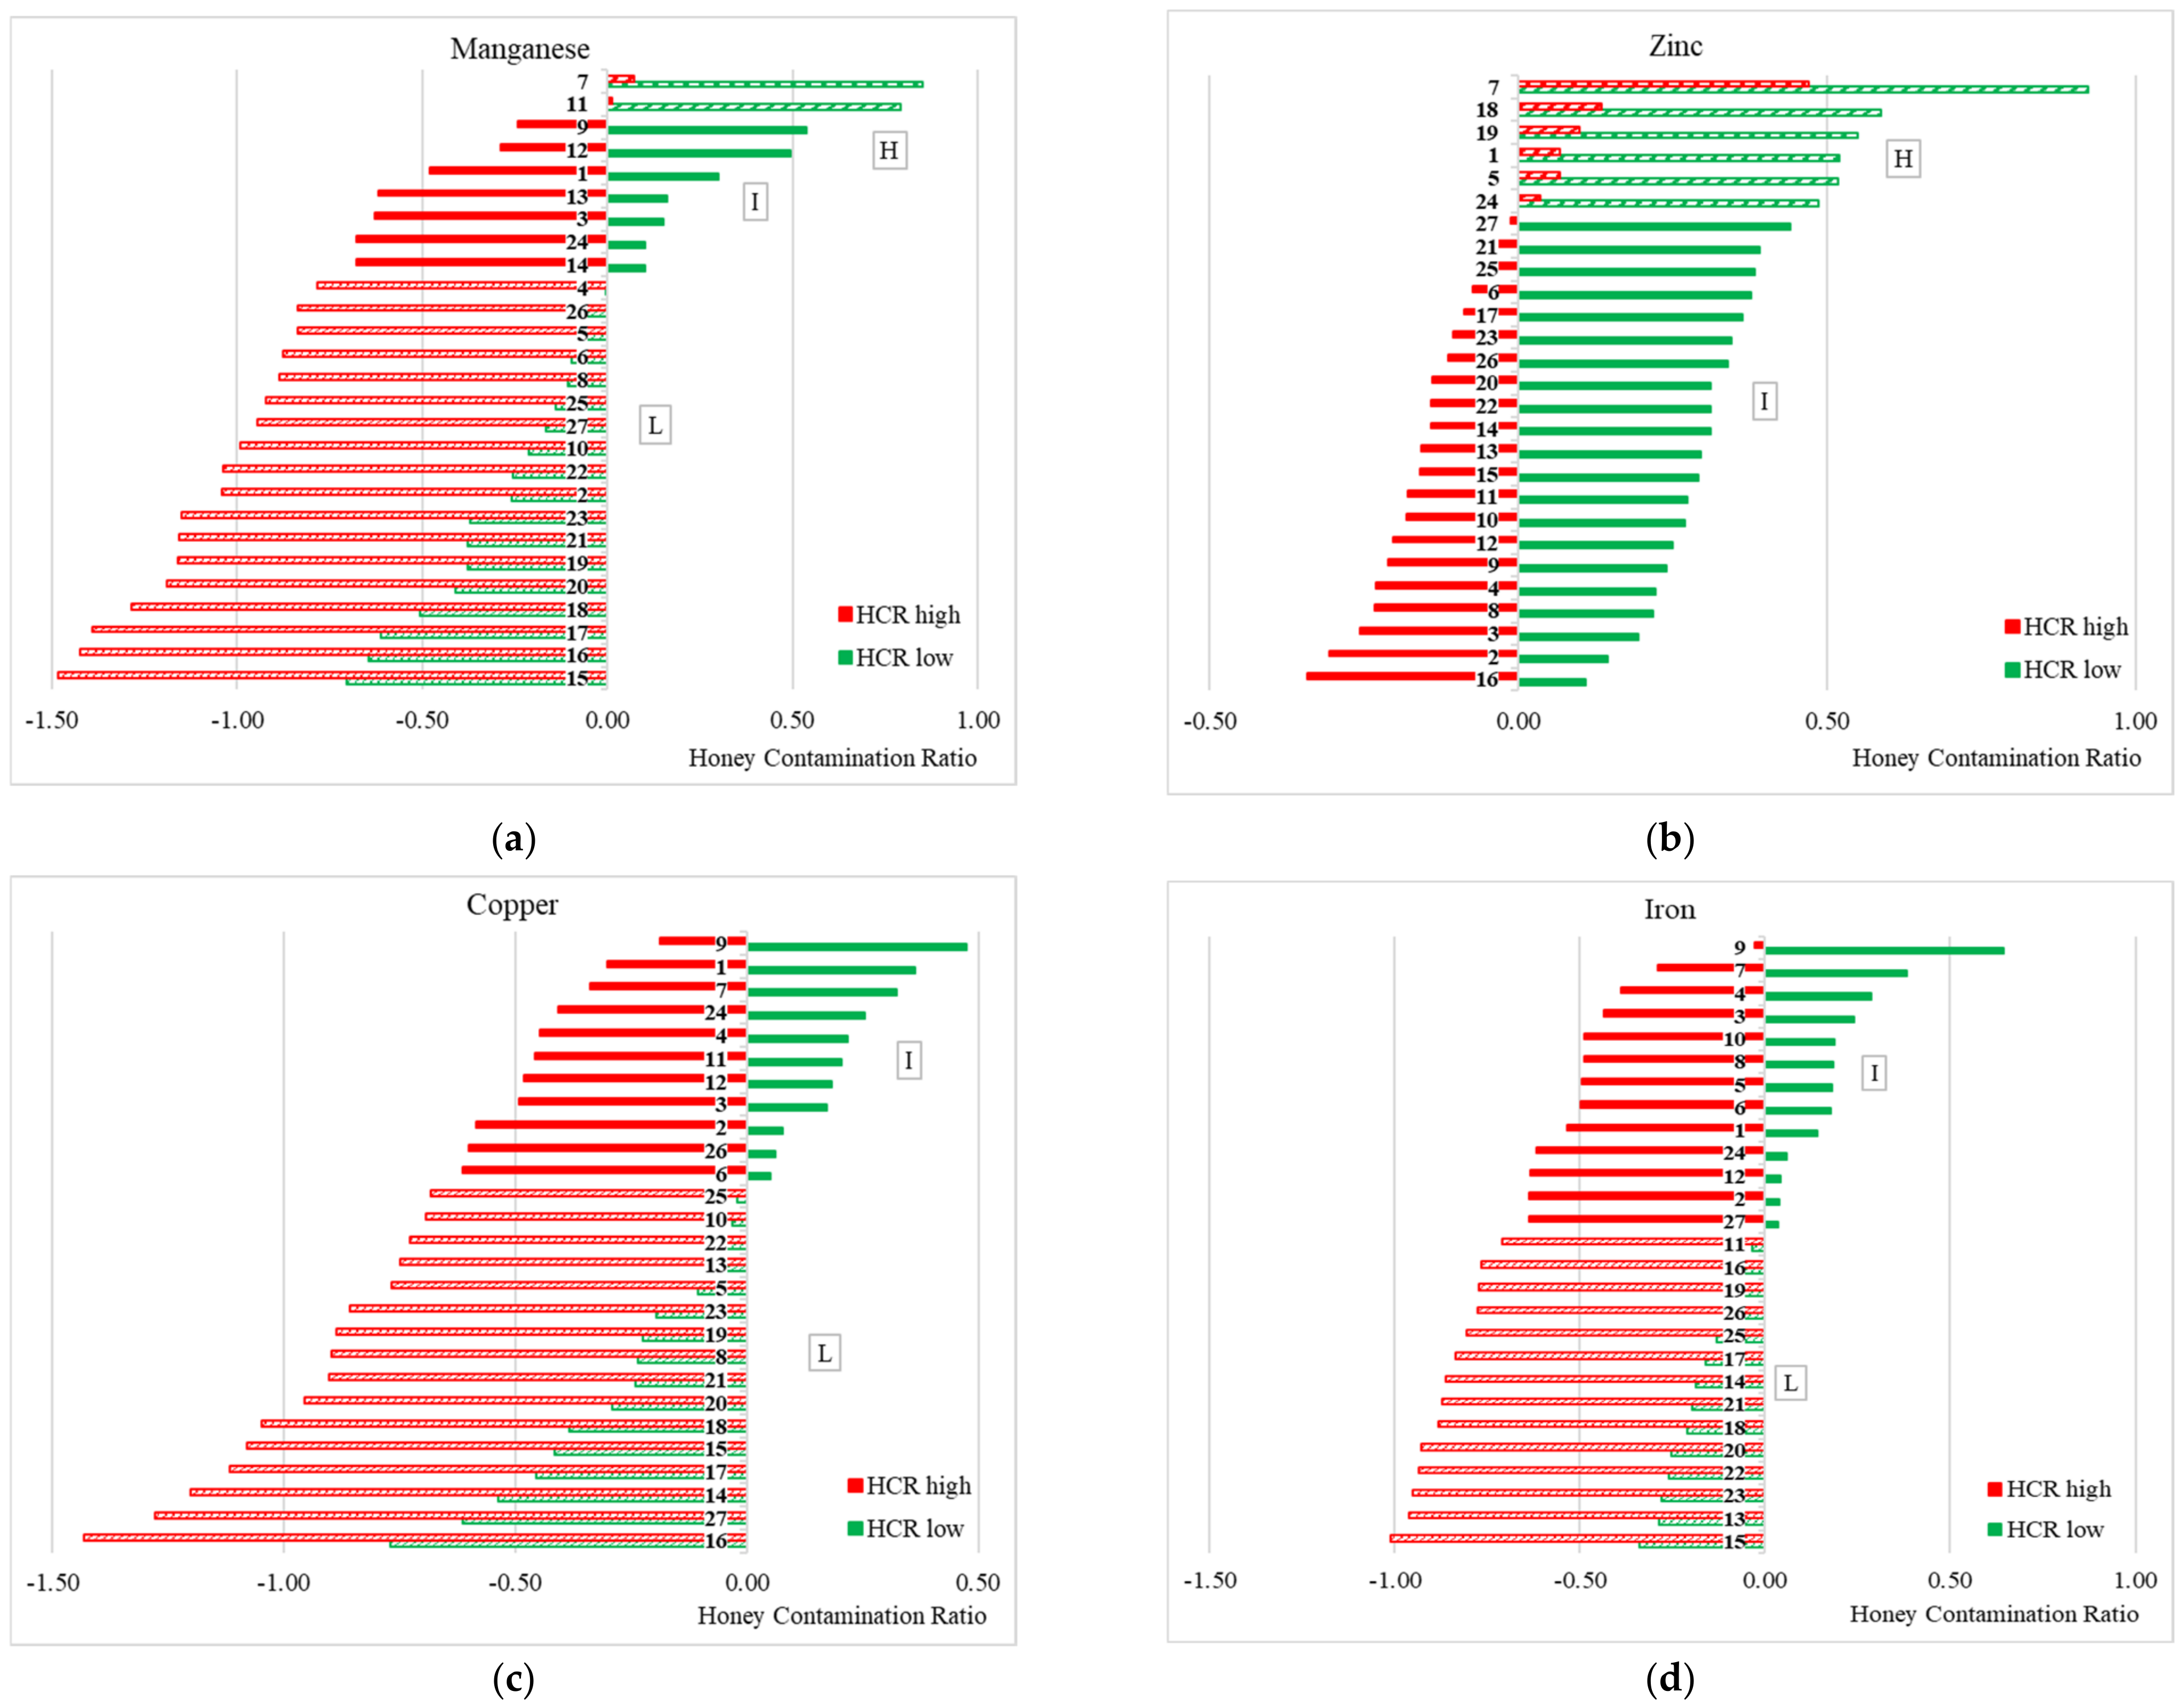
The HCR analysis of Mn revealed a low level of contamination at 18 sites (67% of all sites), intermediate at 7 (26%), and high at the remaining 2 sites (7%) (Figure 3a). The highest number of honey samples with low Mn contamination were those from Warsaw; however, 92% of all samples from Warsaw showed low levels of Mn. The highest values were identified only in urban honey samples. The Zn HCR analysis revealed intermediate contamination at 21 sites (78%) and high at the remaining 6 sites (22%) (Figure 3b). Despite the generally high contamination of Zn in the analysed samples, only 25% of honey samples from Warsaw were classified as belonging to the high contamination group, similar to honey from Szczecin and its vicinity.
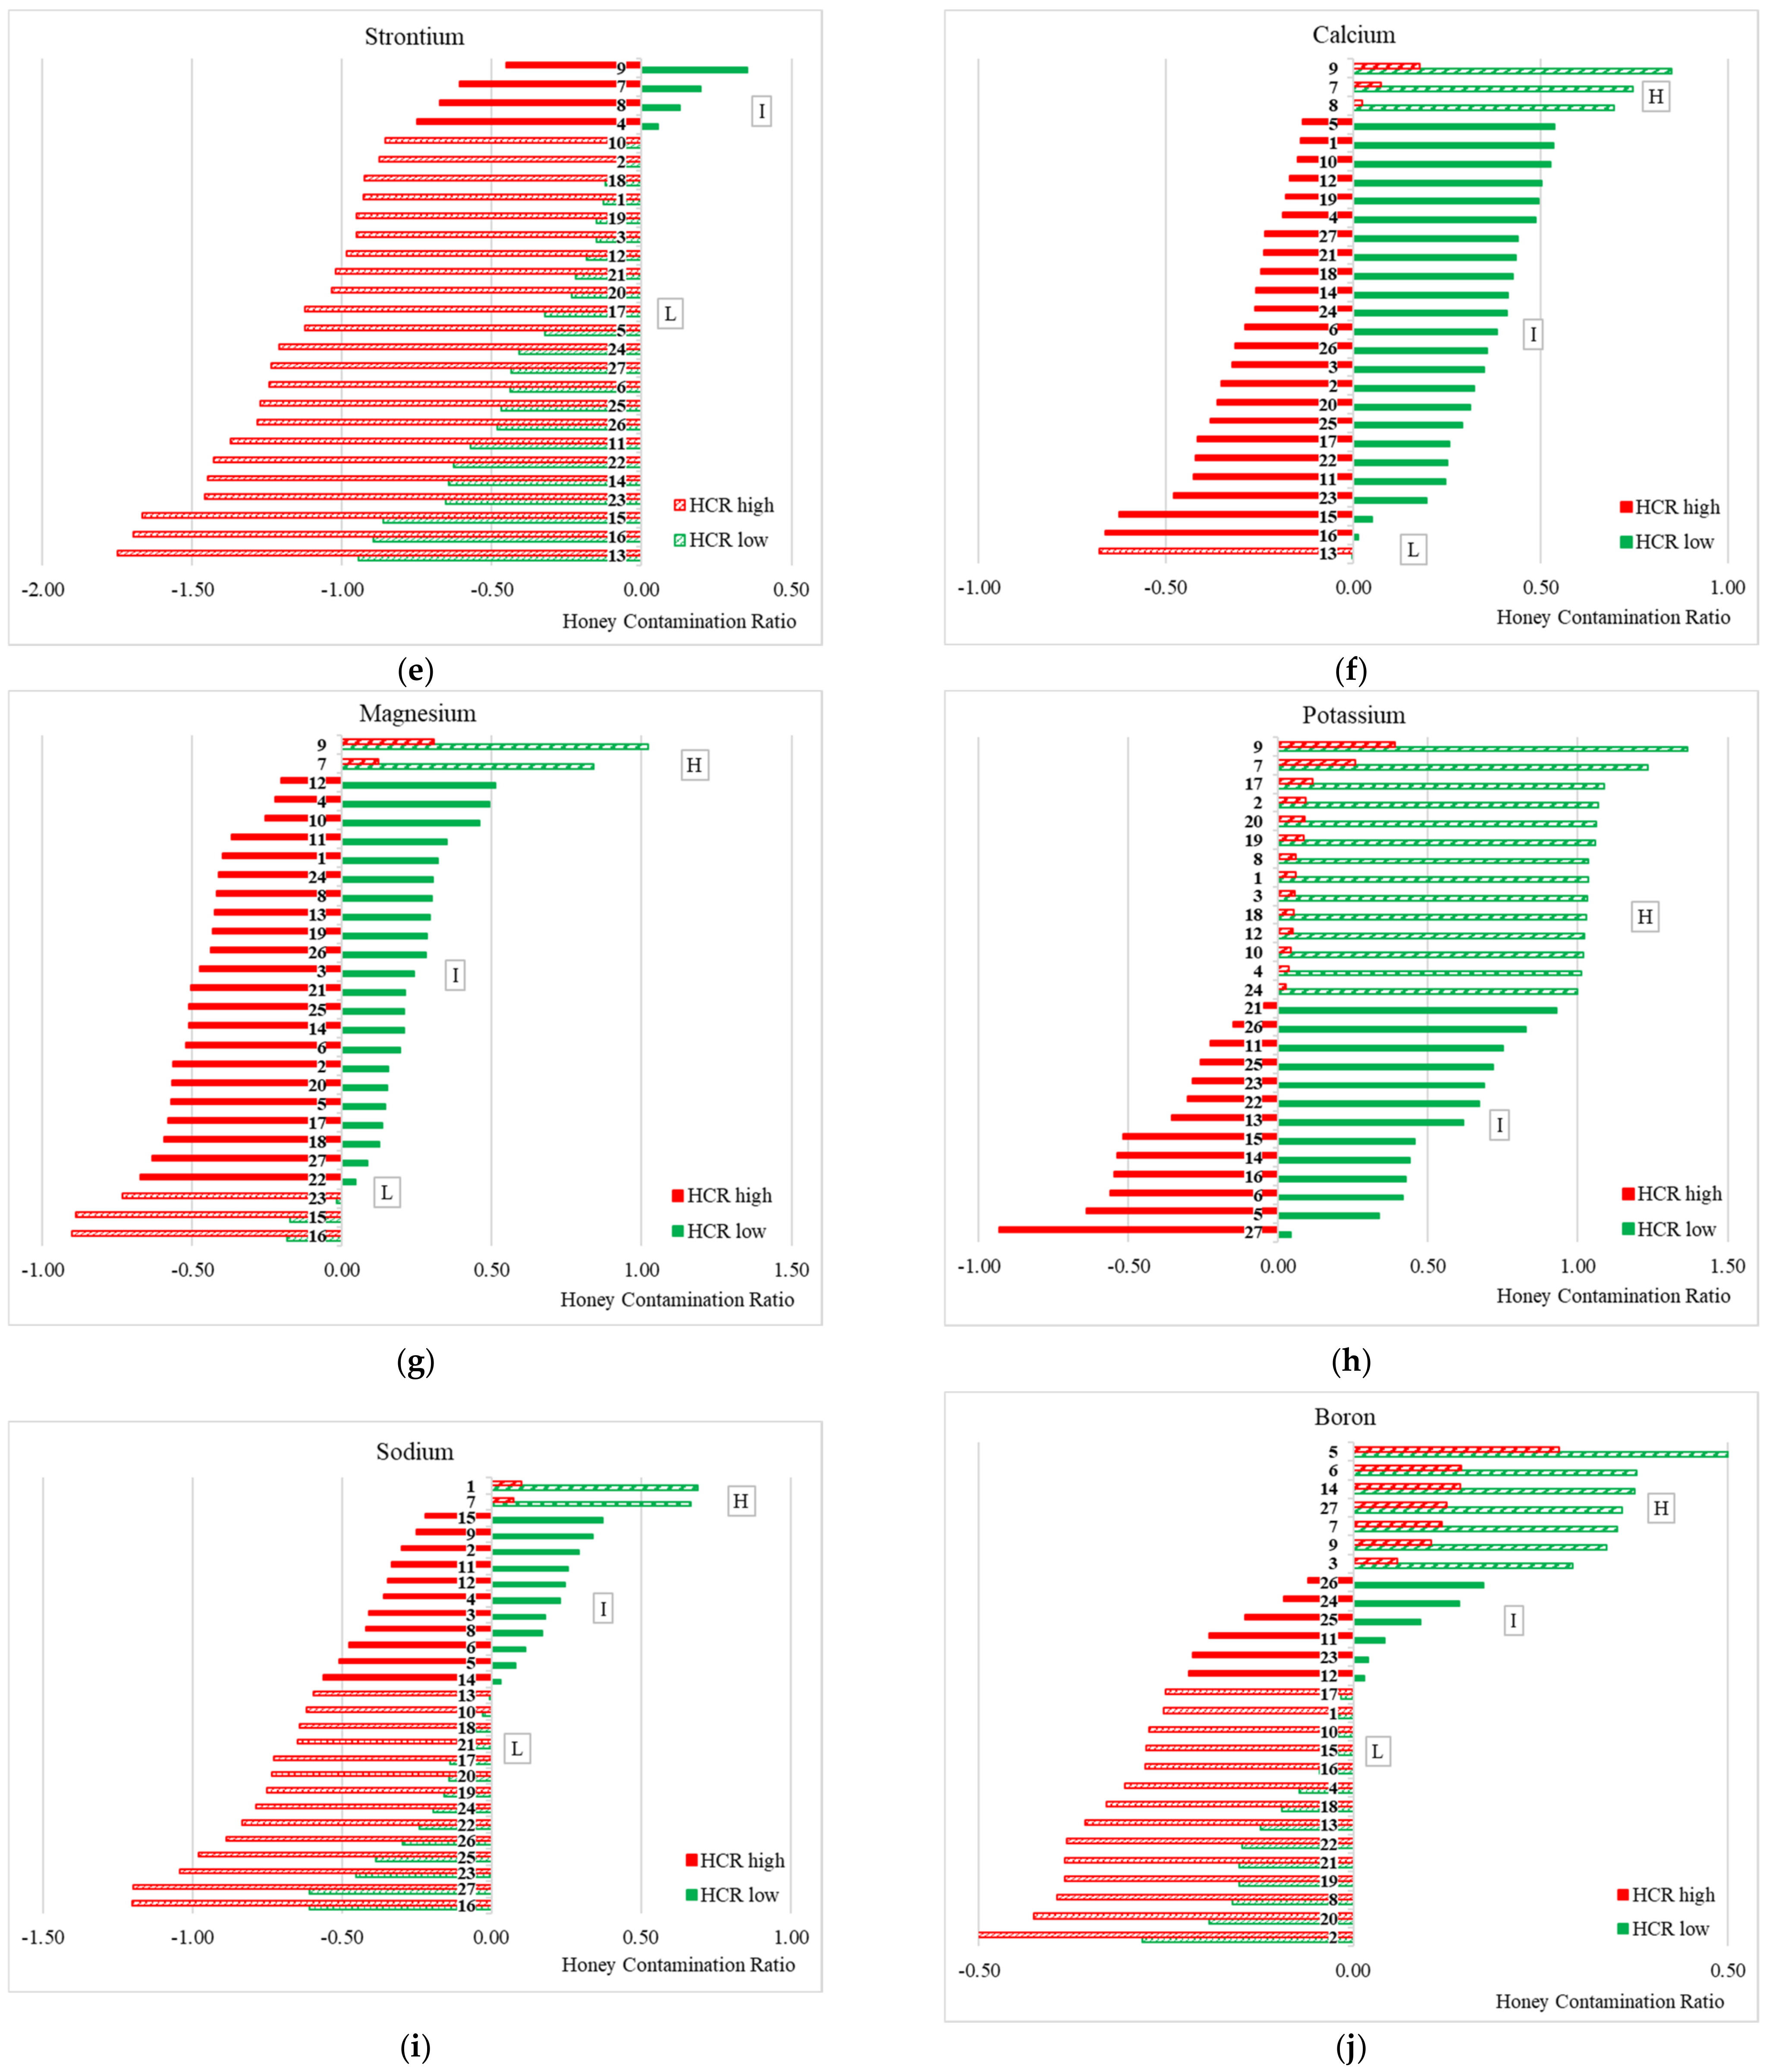
Copper HCR analysis revealed a low level of contamination at the remaining 16 sites (59%) and intermediate at 11 sites (41%) (Figure 3c). Finally, Fe demonstrated low contamination at 14 sites (52%) and intermediate at 13 sites (48%) (Figure 3d). Regarding Cu and Fe, low concentrations were determined mainly in the Warsaw honey samples. Strontium demonstrated a level of low contamination at 23 sites (85%), including all those from Warsaw, and an intermediate level at four sites (15%) (Figure 3e).
Magnesium contamination was low at 3 sites (11%), intermediate at 22 sites (82%), and high at the remaining 2 sites (7%) (Figure 3f). Low Mg contamination levels were identified only in honey samples from Warsaw; however, as much as 75% of the samples from this city demonstrated intermediate values. High HCR values were recorded in both rural and urban honey samples from NW Poland. HCR demonstrated low calcium contamination at 1 site (4%), intermediate at 23 sites (85%), including all honey samples from Warsaw, and high at the remaining 3 sites (11%) (Figure 3g). Potassium demonstrated intermediate contamination at 13 sites (48%) and high contamination at the remaining 14 sites (52%) (Figure 3h). Nearly all honey samples from NW Poland and less than a half from Warsaw demonstrated high levels of contamination with K. Low levels of sodium contamination were found at 14 sites (52%), intermediate at 11 sites (41%), and high at the remaining 2 sites (7%) (Figure 3i); interestingly, as much as 92% of results showing low contamination with Na concerned the honey samples from Warsaw. High values of Na were identified only in the sample from Szczecin and its rural vicinity.
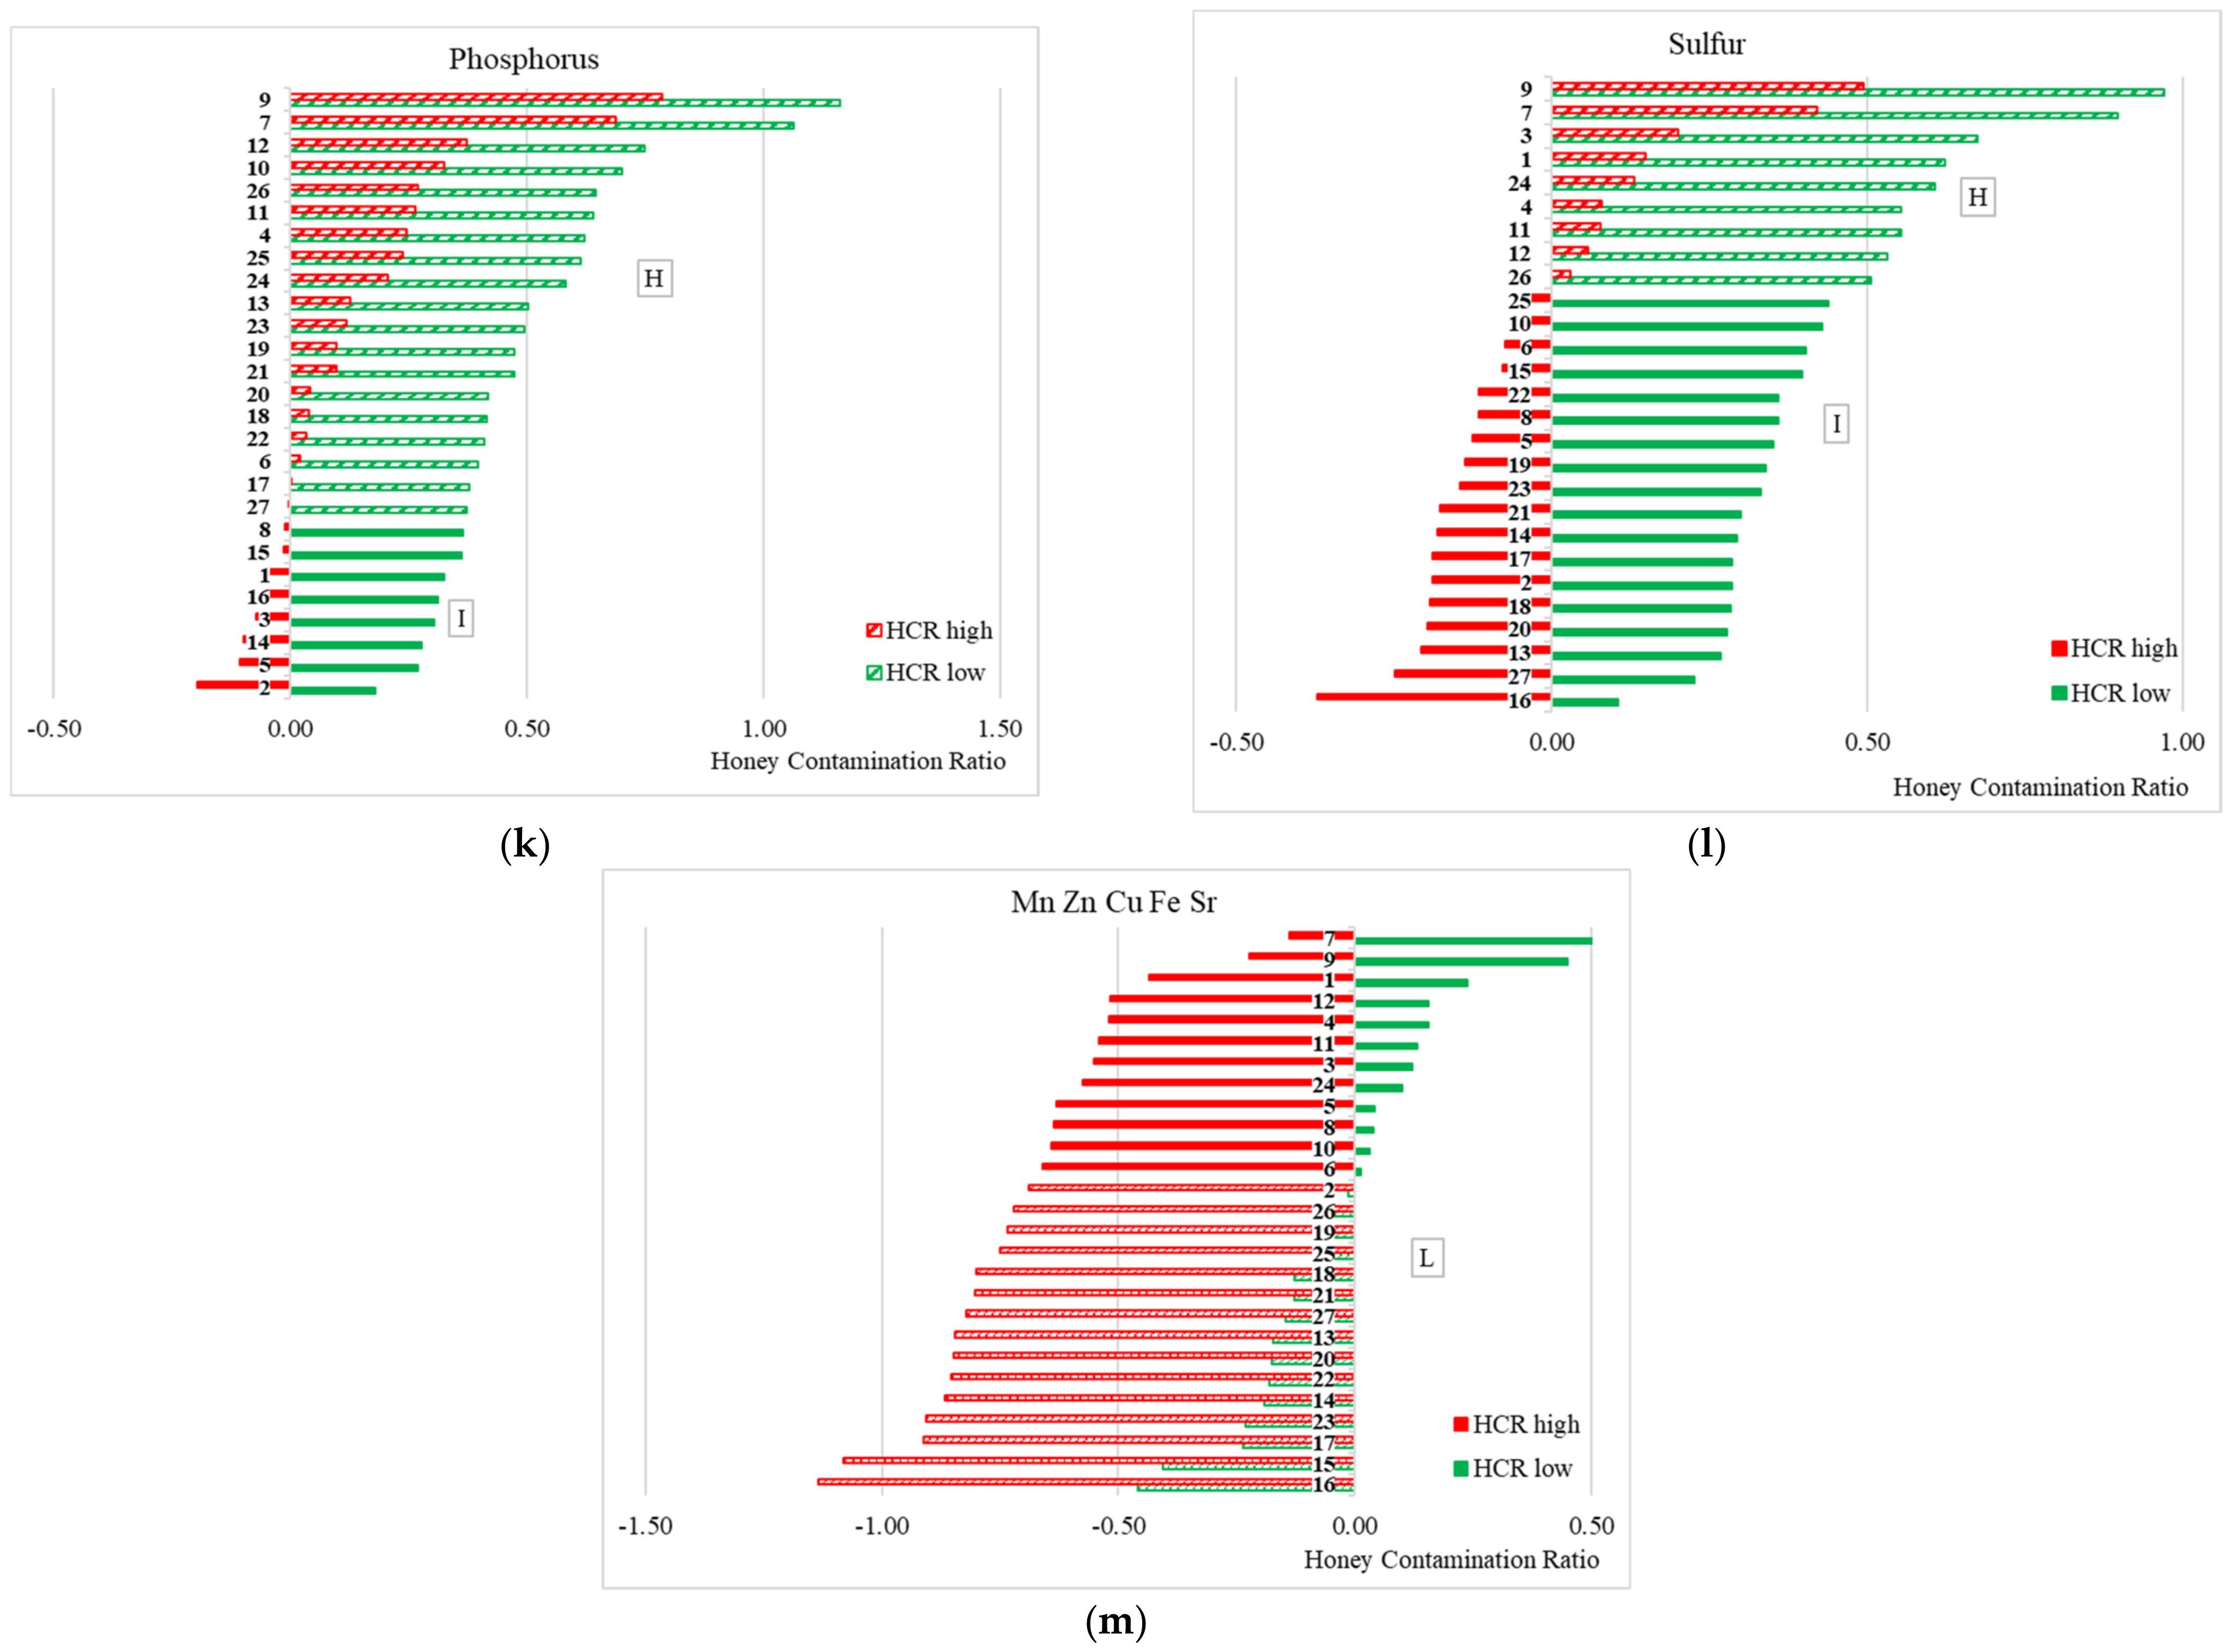
Boron contamination was low at 14 sites (52%), intermediate at 6 sites (22%), and high at the remaining 7 sites (26%) (Figure 3j). High concentrations of B were identified predominantly in rural honey samples. In turn, approximately two-thirds of the honey samples from Warsaw showed low contamination. Phosphorus contamination was intermediate at 8 sites (30%) and high at the remaining 19 sites (70%) (Figure 3k). A considerable majority of urban honey samples (78%), as well as those from Warsaw (83%), demonstrated high P contamination. In addition, sulphur contamination was intermediate at 18 sites (67%) and high at 9 sites (33%) (Figure 3l). High S contamination was identified in both rural and urban honey samples, though only in 17% of the honey samples from Warsaw.
Finally, further insight could be provided by the mean HCR value of five MMs: Mn, Zn, Cu, Fe, and Sr (Figure 3m). Low contamination was detected at 15 sites (56%) and intermediate contamination at 12 sites (44%). Low contamination was observed in 92% of samples from Warsaw honey samples. Intermediate contamination was identified in almost all honey samples from NW Poland.

4. Discussion

4.1. Atmospheric Pollution with Particulate Matter and Their Constituent As, Pb, Ni, Cd in the Analysed Agglomerations

While 19 elements were analysed in the tested honey samples, only 17 were at detectable levels. In addition, Pb, Cr, Ba, Ni, and Co were absent in many samples. Fortunately, As and Cd, which are considered toxic, were not detected in any of the honey samples. Other researchers have also noted a diversified mineral composition in honey. For example, Karabagias et al. [39] report the absence of Ag, Cd, Co, Cr, Hg, Tl, Be from tested honey samples.
The main sources of atmospheric pollution in the EU are industrial plants, power stations, heat and power stations, municipal boiler houses, privately owned furnaces, means of transport, fertilisers, and plant protection products. Generally, the emission of PM10 in the EU was found to have decreased by 29%, and in PM2.5, by 32% in the period 2000–2018 [40,41].
Poland demonstrates higher levels of PM pollution than its neighbouring EU countries (Table 2), with almost double the value, compared to Germany. In contrast, the Czech Republic, Slovakia, and Lithuania demonstrate more comparable levels of PM pollution, amounting to 75% of that recorded in Poland. Recently (2016 and 2017), the mean total PM emission in Poland comprised 96% stationary sources and only 4% from mobile sources [42].
Out of the three analysed agglomerations, Warsaw, the capital, was predictably characterised by the highest level of atmospheric pollution, with a mean annual PM10 concentration of 34 mg/m3 and a PM2.5 level of 22.3 mg/m3 (Table 1). Compared to Warsow, Szczecin demonstrated 73% PM10 and 87% PM2.5, while Gorzów Wlkp. demonstrated 75% PM10 and 76% PM2.5.
The levels of air pollution were compared between the Polish cities (Warsaw, Szczecin, Gorzów Wlkp.), and three selected EU cities with different mean annual air temperatures—Vienna, Brno, and Göttingen. Among these, Brno demonstrated the highest PM level, followed by Vienna, the capital of Austria, and then Göttingen (Table S4). The high level of PM pollution recorded in Brno may result from the use of low-quality fuel in households; for example, the mean % contribution of wood combustion in households to total PM10 pollution was 5.1–6.7% in Vienna (Austria) and 59% in southern Germany [43]. A higher level of PM pollution was observed in Warsaw than in Vienna; this may be due to fact that the mean annual air temperature was 2.2 °C lower in Warsaw (Table S1) than in Vienna, which translated into greater demands for heating purposes in Warsaw [43].
In Vienna, the greatest issue is the presence of PM pollution related to tire and brake pads abrasion [41,44]. Finally, the mean PM10 level in the three cities is approximately 24% lower than in the studied Polish cities, while the PM2.5 is approximately 30% lower (Table 1 and Table S4). These differences may be due to the type of energy sources used by the power sector: in Poland, electricity production and the energy sector are generally based on the combustion of hard coal [41]; therefore, the presence of HMs in PM10 was expected. Despite this, our findings indicate the studied elements are only present at low concentrations in the PM and are often below admissible levels. Even though the Warsaw honey samples demonstrated the highest concentrations of PMs among the Polish samples, their constituent toxic elements (As, Pb, Ni, Cd) were found in small quantities (Table 1). The same PM concentrations of Pb and Cd were found in all analysed cities in Poland; however, the concentration of PM10 As found in Gorzów Wlkp. was almost two times that of Warsaw and 40% higher than in Szczecin. A similar relationship was observed for Ni: its concentration was approximately two times higher in Gorzów Wlkp. than in the other two cities. Additionally, the relationship between PM concentration and their constituent toxic elements (Table S4) was also tested in Vienna, Brno, and Göttingen. In Vienna, PM pollution was accompanied by a low level of toxic HMs with two times lower concentrations of As and Ni and five times lower levels of Pb, compared to Warsow, and similar concentrations of Cd. Interestingly, Gorzów Wlkp. Demonstrated twice the mean level of As, Pb, Ni, Cd emission due to PM pollution as Göttingen. This was most likely connected with metal emission due to the combustion of hard coal and other materials for electricity production and household heating. Brno also demonstrated similar concentrations of As, Cd, and Ni in PM as Szczecin, Poland; however, the Pb concentration was almost three times higher.

4.2. Comparative Assessment of MM Concentrations in Rural and Urban Honeys from NW and Central Poland

Karabagias et al. [14] report that the mineral composition of honey can vary significantly depending on the region of its origin. This was also observed between urban and rural honey samples in the present research, as well as between the locations of the studied apiaries.
Being characterised by the highest level of atmospheric pollution (Table 1) and knowing that air pollution is considerably greater in large agglomerations than in smaller cities, it was assumed that the honey samples from the Warsaw area will be of inferior quality. Due to MM uptake from the soil in urban areas polluted with PM, melliferous plants tend to demonstrate higher concentrations of these elements in their pollen, nectar, and honeydew [33]. However, these elements are generally present in lower concentrations of honey than in the material from which honey is made. This is mainly because bees act as a biofilter, retaining most of the elements in their organisms [11]. Despite the observed anthropogenic transformations of urban soils in Warsaw, Szczecin, and Gorzów Wlkp., and their resulting pollution with HMs [45,46], these metals were not found in higher concentrations in urban honey samples than in rural honey samples (Table 5). Moreover, urban honey samples were characterised by significantly lower concentrations of Mn and B.
In rural areas, atmospheric pollution with PM, and consequently with HMs, is mainly connected with agricultural activities, and to a lesser degree with fuel combustion for household heating purposes. Statistical data indicates that over 96% of arable land in Poland is characterised by natural or only slightly elevated metalloid and HM concentrations. As a consequence, these soils can be classified as soils of high quality, enabling melliferous plants to produce material for pure honey samples, i.e., those not contaminated with HMs [42]. This was reflected in our obtained results regarding metal concentrations in urban honey samples (Table 5).
Regarding mean MM concentrations, higher values of Zn, Ca, Mg, Na and P were recorded in rural honey samples, as compared with urban honey samples (Table 5). This could be indirectly due to fertilisation of arable land, particularly regarding the elements P, Ca, and Na. Conversely, previous studies have reported higher concentrations of Zn in urban honey samples than in rural honey samples [47]. In the present study, only Ba and K demonstrated higher levels in urban honey samples (Table 5); interestingly, higher levels of Ba were found in honey from Gorzów Wlkp., compared with Szczecin (Table S5). This could result from pollution caused by a fireworks display held in Gorzów Wlkp., which is in line with the literature on the subject [48,49,50,51]. In addition, the honey from Gorzów Wlkp. was characterised by a higher concentration of Ca, Cu, Mg, K, Fe, Mn, Cr, B, Sr, P, and S than that determined in honey samples from Szczecin. Pongpiachan et al. [48] report that in addition to Ba, Pb is also a possible indicator of air pollution due to fireworks displays. Furthermore, Pb/Ca, Pb/Al, Pb/Mg, and Pb/Cu ratios can pinpoint emissions from firework displays; however, the only possible indicator was found to be the Pb/Mg ratio identified in the honey from Gorzów Wlkp. (Table S5): a similar value, i.e., greater than one, was noted previously in PM10 following fireworks display in Bangkok [48]. Nevertheless, since the Pb/K, Pb/Cr, and Pb/P ratios were found to be higher in the honey samples from Gorzów Wlkp. than in those from Szczecin, these three binary diagnostic indicators may well be potential indicators of firework displays, particularly in NW Poland.

4.3. The Assessment of MMs Concentration in Honey Samples from NW and Central Poland and Other EU Countries

The mineral composition of honey samples can be a source of information about their place of origin. These characteristics can be considered valuable for consumers as it marks the uniqueness of the honey [14,39].
The level of environmental pollution with HMs in Poland is varied, and due to the high degree of industrialisation and denser population, the highest values are recorded in the southern part of the country [40]. This area is also characterised by the highest emissions of PM10 and PM2.5. Therefore, the analysed honey samples demonstrated lower concentrations of some metals, occasionally several times lower, than those indicated in honey samples from the south of Poland; for example, Ni, Pb, Fe, Zn, and Cd levels were significantly higher in honey from the Małopolskie voivodship [52], and Ni, Fe, Cu and Cr in the Świętokrzyskie voivodship [53]. Similar relationships have been noted by studies concerning the industrialised Śląsk region in the southwest, though not for all the metals in question [53].
The honey samples from the countries neighbouring Poland, such as Germany [13] and The Czech Republic [54], characterised by lower emission of particulate matter (Table 2), were demonstrated comparable or had lower concentrations of Zn and Cu than in the analysed honey samples. However, Lithuanian honey was found to have higher concentrations of these elements, despite having a lower PM10 level than in Poland [28,55]; similarly, Slovakian honey demonstrated higher concentrations of Cu and Mn [54,56].
The HCR analysis found that HM concentrations (Mn, Zn, Cu, Fe, and Sr) in the analysed honey samples were generally lower or comparable to those in honey samples from other EU countries (Figure 3a–e). While the statistical data show that particulate matter pollution in Poland is higher than in other EU countries (Table 2), no clear relationship has been observed between PM concentration and HM concentration in honey. In Poland and the neighbouring countries, PM10 pollution level proves to be a poor predictor of honey contamination with HMs.
Of the metalloid and HMs present in PM10, As, Cd, Ni, and Pb are particularly toxic and can disturb various processes in the human body [57,58,59]. Fortunately, in the analysed honey samples, the concentrations of As and Cd were below LOD. The three Polish cities tested in the present study demonstrate similar mean annual Pb concentrations in PM10 (Table 1). Even though Pb was present mainly in honey samples from Warsaw and Szczecin, and their respective rural areas, the highest concentration was found in Gorzów Wlkp. (Figure 2). Murashova et al. [60] indicated that Pb concentration in plant pollen may be influenced by distance from the motorway. Accordingly, it was assumed that greater concentrations will be found in honey samples from apiaries located in close vicinity to major transport lines characterised by high traffic volume (Figure 2).
In the case of Ni, the highest mean annual concentration in PM10 was identified in Gorzów Wlkp., followed by Warsaw and Szczecin (Table 1), yet similarly to Pb, this was not reflected in its concentration in the analysed honey samples. The higher levels of Ni were recorded mainly in honey samples from Szczecin and its vicinity, as well as Gorzów Wlkp., whereas the concentration was below the detection limit in those for Warsaw (Figure 2). The low concentration levels of Ni in the analysed honey samples showed no effect on their quality since the toxicity of Ni at low concentrations is debatable [61,62]. Apart from Ni, it was found that Cr, Co, and Ba were also present at low concentrations in the analysed honey samples (Figure 2). The presence of Cr and Co was recorded in just a few honey samples, predominantly rural honey samples (near Warsaw). These elements have a positive effect on the human body only at low concentrations in food [63,64]. In contrast, Ba, similarly to As, is an element particularly toxic for children and pregnant women and found at higher levels in smokers [65]. It was identified in six honey samples, mainly from NW Poland. The highest concentrations were found in the products from Gorzów Wlkp. which, as has already been mentioned, could be connected with the fireworks display held in close vicinity to the apiaries. All analysed toxic elements, i.e., As, Cd, Pb, and Cr, were found to be considerably below the permitted concentration levels (0.24; 0.12; 0.50; 0.14 mg/kg, respectively) according to the norm in Poland [66]. Thus, both rural and urban honey samples from NW and central Poland appear to be of high quality.
In small quantities, Cu, Sr, Mn, Fe, and Zn are vital elements for the correct functioning of the human body [67,68,69,70,71]. Excessive quantities may cause poisoning, whereas deficiency contributes to the development of numerous diseases [57,72,73]. Most of the analysed honey samples were characterised by low HCR levels with respect to these elements (Figure 3m); however, the honey samples from Warsaw were predominant in this group. This parameter was at an intermediate level in other honey samples. This indicates that the analysed honey samples were safe for consumers.
The elements Na, Ca, Mg, K, S, P, and B are metals indispensable for the correct functioning of all physiological systems in the human body [74,75,76,77,78,79]. Their presence in the diet in excess or deficient quantities can lead to chronic diseases [80,81,82,83]. In the present study, most honey samples were found to have intermediate HCR levels of Mg and Ca, with only a small number demonstrating higher values. In addition, the samples demonstrated a favourable HCR value for K concentration in comparison with honey samples from other EU countries, which was high or intermediate in almost half of the samples. This element is particularly important for the elderly as it is easily leached from the body. Shortages of K are frequently reported, especially in the cases of coexisting impaired kidney function—the organ responsible for regulating the level of potassium in the body [84]. It has previously been found that K and Ba were the predominant ingredients of particulate matter emission from any type of pyrotechnic product [51]. While the analysed honey samples generally demonstrated low HCR values with respect to Na (except in two cases), the best levels were observed in honey samples from Warsaw. Compared to S or P, it was found that B demonstrated greater variability regarding its HCR values; however, the HCR level was mostly low. The therapeutic value of B was demonstrated by Sogut et al. [85] in a study on alcohol syndrome. High HCR values for P were observed in around two-thirds of the samples; its presence in blood should be monitored in people who are overweight or eat irregularly [86]. In turn, intermediate HCR values for S were found in more than two-thirds of the samples, with high values observed in the remaining samples; this element is crucial for untrained yet physically active people, especially those on a vegetarian diet [77].

4.4. Non-Carcinogenic Risk Assessment of the Studied Honey Samples Given the Different Consumption Levels in Poland and Other EU Countries

In Mediterranean countries, it is assumed that the daily consumption of honey is approximately 30 g [87]. Therefore, in the human diet, honey contributes to the supply of many elements, such as 0.22% Ca, 1.56% Cu, 0.59% Fe, 0.33% Mg, 3.45% Mn, and 0.30% Zn. Other eating habits in European countries (0.7 kg per year) indicate that consumption of honey products represents a significantly lower coverage of the demand for elements. Due to the higher concentration of B and Mn in honey products from rural apiaries, it appears that rural honey products seem to be more valuable in terms of the amount of supplied nutrients (Table 5).
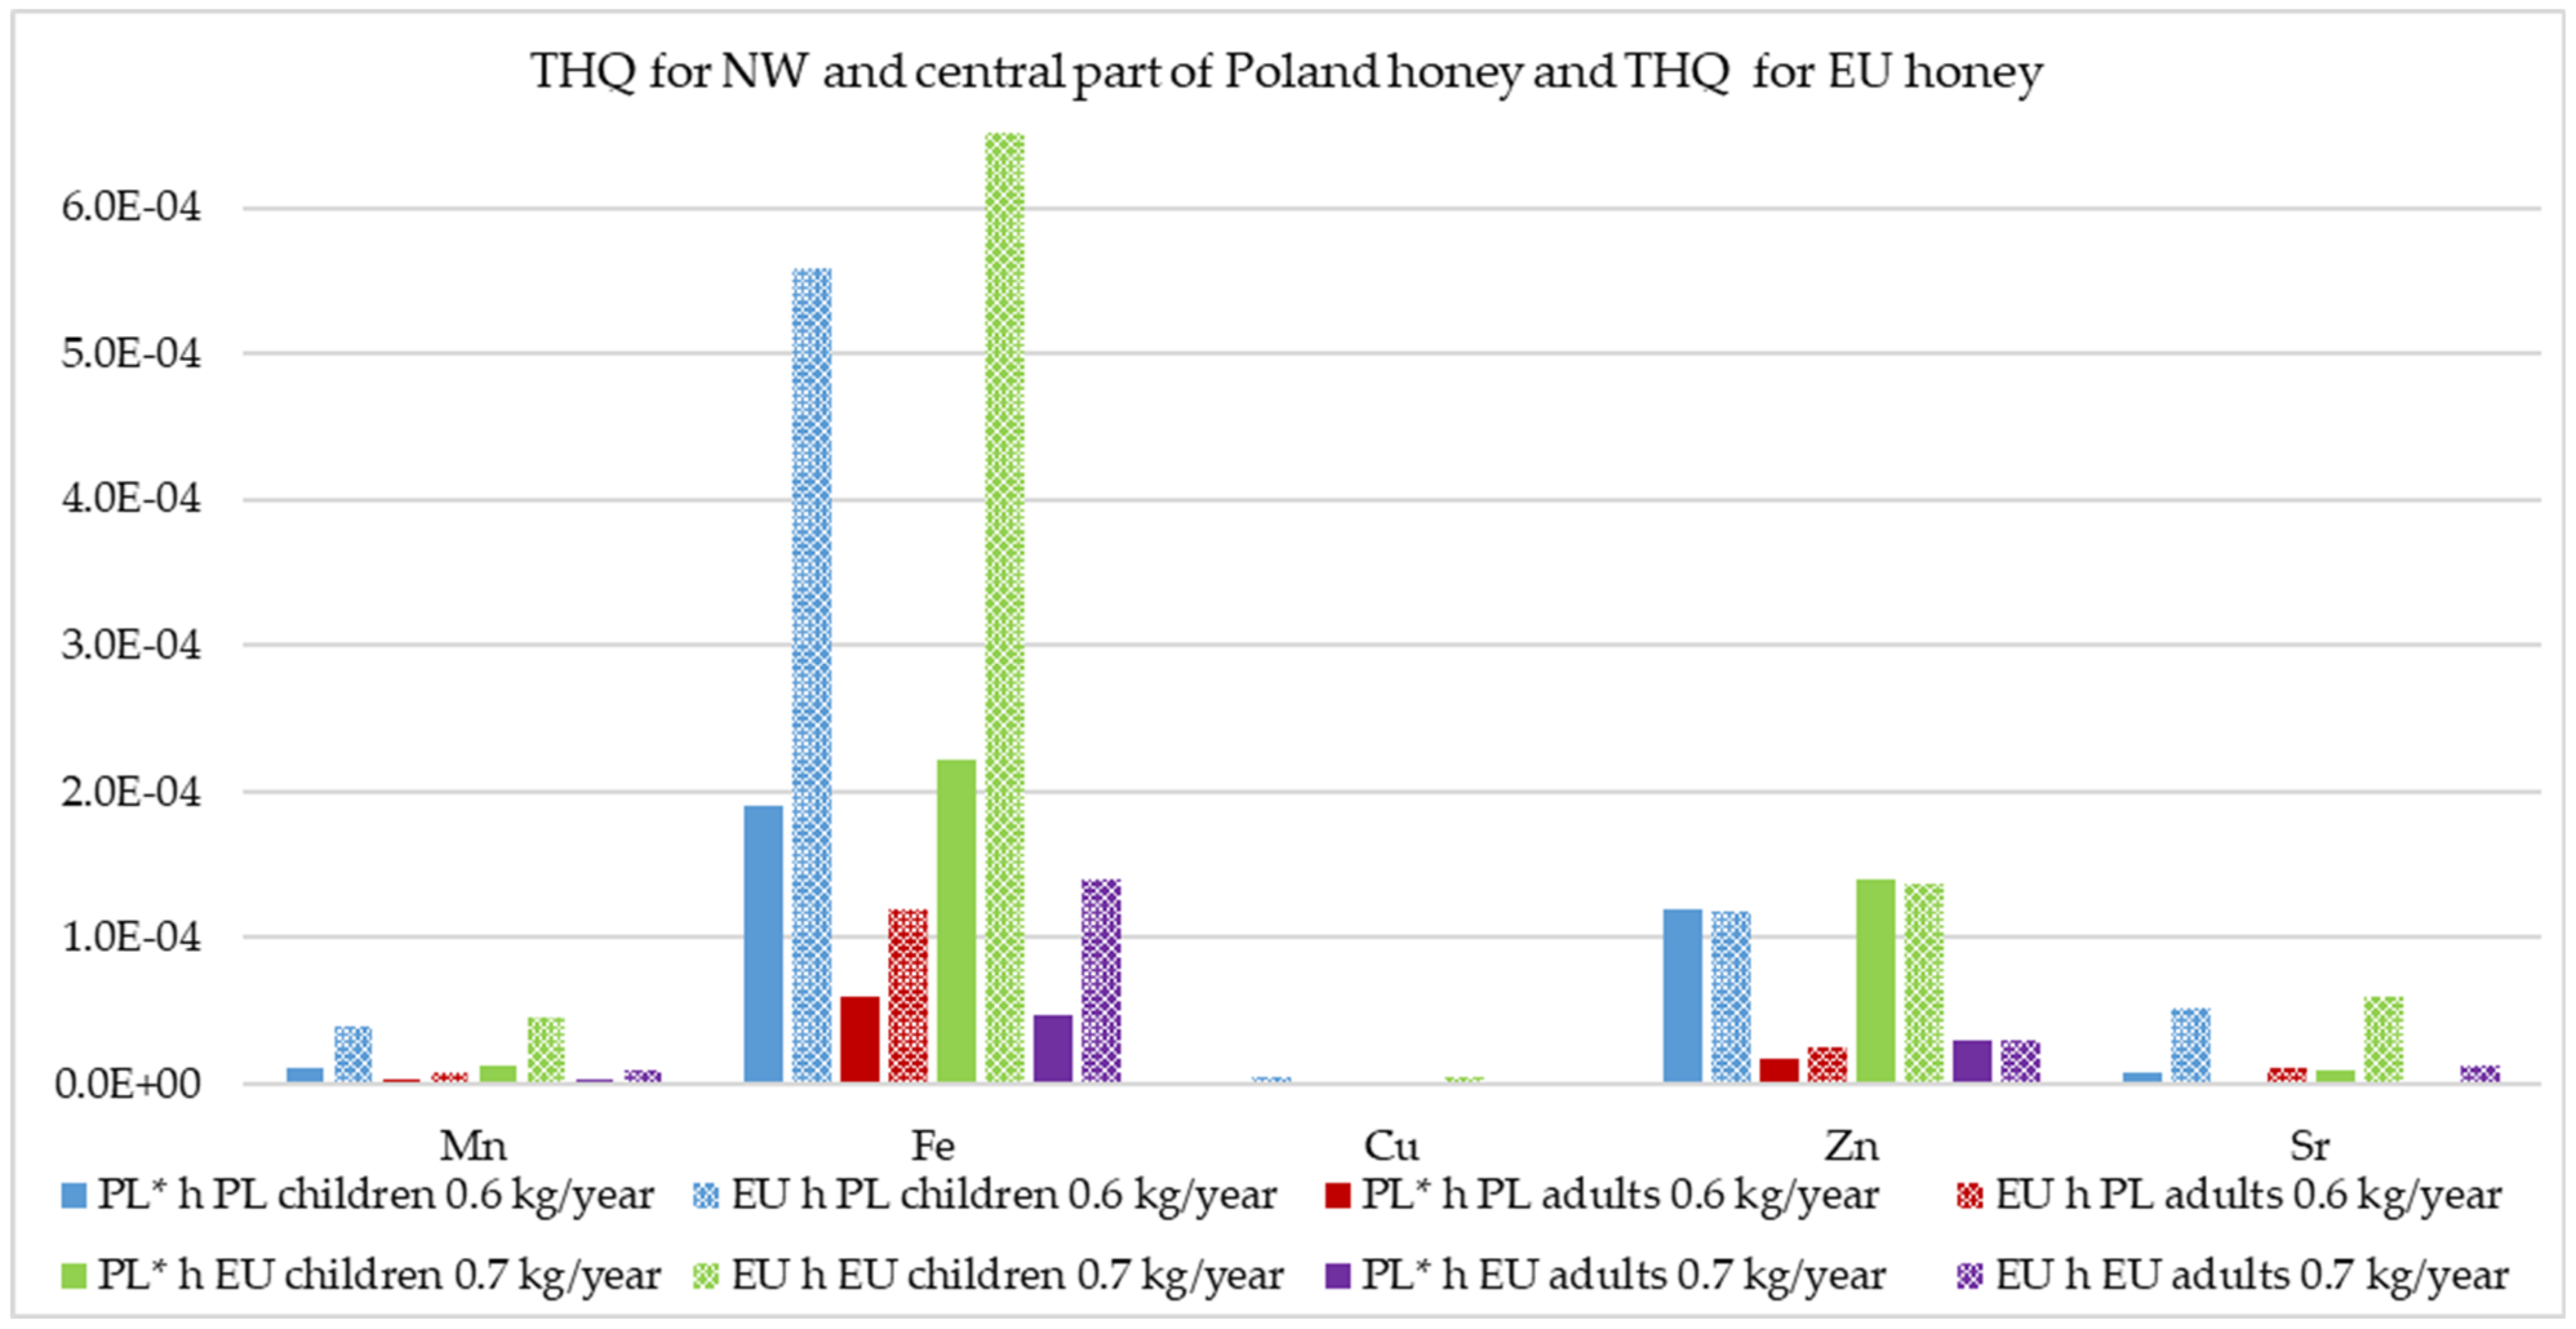
For the purpose of calculating THQ, out of 12 MMs present in all of the honey samples under analysis, 5 HMs were selected—Mn, Fe, Cu, Zn, and Sr. All five can have negative effects on human health when consumed at high concentrations. Regardless of the mean level of honey consumption in Poland (0.6 kg/year) and in EU countries (0.7 kg/year) [36,37], the calculated target non-carcinogenic risk factor for individual HMs of honey samples from NW and central Poland or from EU countries was lower than 1. Therefore, there are no expected negative health effects due to consumption for either adults or children (Figure 4). Similarly, honey samples from Poland and other EU countries were found not to have negative effects on consumer health in meta-analyses by Fakhri et al. [28] and by Pipoyan et al. [15].
The intake of a given element due to honey consumption was calculated by multiplying the mean concentration per unit of analysed honey (Table 4) or EU honey (Table 3) by the mean level of consumption in Poland or EU countries. The results indicate that the consumers (both children and adults) of honey from NW and central Poland ingested a comparable amount of Zn (2.19 mg Zn/year) as EU consumers (2.15 mg Zn/year) at a dose of honey 0.6 or 0.7 kg/year, respectively. Honey is not a major dietary component and only partially covers the requirement for these elements. Nevertheless, it is crucial to determine whether the ratio between the elements present in honey facilitates proper absorption. Given the recommended daily allowance (RDA) with respect to Zn (≈10 mg Zn/day) [88], the analysed honey samples only cover 0.61‰ of requirements. Moreover, the honey samples provided significantly less Fe (1.4 mg Fe/year) than those from other EU countries (4.0 mg Fe/year). Fe concentration in the studied honey samples constituted, on average, only 0.42‰ of the requirements for men (RDA = 10 mg) and only 0.24‰ for women (RDA = 18 mg). Excess Fe supply may result in disorders of Zn absorption. Studies show that when the Fe/Zn mass ratio in the diet was 1:1, a slight inhibition of Zn absorption was observed. When the said ratio rose to 2:1 or 3:1, Zn absorption was markedly inhibited [88]. The ratio in the studied Polish honey samples was found to be ≈0.7, indicating no inhibition of Zn absorption; however, in the honey samples from the other EU countries, this ratio was ≈2.0, indicating inferior health quality due to reduced Zn absorption.
The concentration of selected HMs identified in the studied honey samples was lower than data obtained for other regions of the country (Table S6). The same relationship is indicated by Fakhri et al. [28] using the data from Poland based on Fe (5.225 mg/kg DW) and Mn (4.958 mg/kg DW). These differences may indicate that highly urbanised areas have negative effects on the quality of honey produced therein. Although Poland demonstrates higher levels of particulate matter pollution compared to other EU countries (Table 2), this was not generally reflected in terms of Fe and Mn concentration in the analysed honey samples (Table S6).
The TTHQ analysis of honey samples from NW and central Poland and from other EU countries found them to be perfectly safe for the health of young and adult consumers, regardless of the level of consumption (Figure 5). The TTHQ values for adult consumers of the analysed honey samples from NW and central Poland, assuming a consumption level of 0.6 and 0.7 kg/year, ranged from 8.2E−05 to 9.5E−05, respectively. However, for adult consumers of EU honey products, assuming the same consumption levels, the TTHQ ranged from 1.7E−04 to 1.9E−04. According to Fakhri et al. [28], the lowest value was associated with the consumption of Lithuanian honey products (6.17E−05) and the highest for Bulgarian honey products (7.23E−03); the TTHQ results for adult consumers of the tested Polish honey products lie within this range. In the case of children, assuming consumption of 0.6 and 0.7 kg/year, TTHQ values associated with consumption of honey from NW and central Poland were 3.8E−04 and 4.4E−04, respectively (Figure 5). In turn, the TTHQ value for children consuming honey products from EU countries, assuming the same level of consumption, ranged from 7.7E−04 to 9.0E−04. As in the case of adult consumers, Fakhri et al. [28] determined the lowest TTHQ values for children consuming honey products from Lithuania (2.88E−04) and the highest for those from Bulgaria (3.38E−02). Again, the TTHQ values for children were within the aforementioned range. Therefore, the studied honey samples do not appear to represent a health risk when consumed (non-carcinogenic: THQ and TTHQ < 1). Furthermore, consumption of EU honey at levels two times higher (annual consumption in Greece is 1.0 kg/year/consumer) [89] or even four times higher [90] did not cause negative health effects.

5. Conclusions

The present paper examines the concentrations of 19 MMs (micro- and macroelements) in honey products from NW and central Poland based on metadata for 12 MMs (Mn, Zn, Cu, Fe, Sr, Mg, Ca, K, Na, B, P, S) present in all analysed samples. The presence of PM10 and toxic elements proved to be a poor predictor of honey pollution with these elements. HCR analysis found that the level of Mn, Cu, Fe, and Sr in the analysed honey samples was generally lower or comparable with the data concerning other parts of Poland or EU countries. In turn, macroelements such as K, P, and S were identified at higher concentrations in the analysed honey samples than those from other EU countries.
Non-carcinogenic risk assessment found that consumption of the said honey products does not cause negative health effects for children or adults of the studies, even assuming the different consumption levels in Poland (0.6 kg/year) and in other EU countries (0.7 kg/year). However, the honey samples from the EU countries were found to have a higher Fe/Zn ratio (≈2.0), and thus reduced Zn absorption, indicating lower health quality. The analysis of MMs concentration in urban and rural honey products shows both to be of high health quality, despite differences in their mineral composition. It was found that firework displays may represent a potential source of heavy metal contamination of honey; however, the level of contamination can be estimated based on the binary indicators Pb/K, Pb/Cr, and Pb/P. The obtained results indicate that it is inadvisable to locate apiaries in close vicinity to areas with firework displays in urban agglomerations. Further research should focus on determining the optimum location of beehives with respect to the range of impact of heat and power stations, electricity production facilities, and major transport lines to ensure high quality of honey.

Supplementary Materials

The following are available online at https://www.mdpi.com/article/10.3390/resources10080086/s1, Table S1: Characteristics of the average values of selected indicators showing the climatic conditions of the studied cities in the vegetation season of 2019, Table S2: Data set of the concentration of MMs in honey samples from EU countries (metadata), Table S3: Honey MMs concentrations in the 27 sites, Table S4: Average annual values of dusts and their concentration of HMs in three selected EU countries (Vienna, Brno, Göttingen) with a similar number of inhabitants as in the analysed cities in Poland, Table S5: Firework emission trace based on the Pb/element ratio in the tested honey samples from Gorzów Wlkp. and Szczecin, Table S6: The rank order of HMs in honey samples from Poland and neighbouring countries from EU (mg/kg WW), Figure S1: A set of data on the concentration of MMs in honey samples originating from new and old EU countries, Figure S2: Mean concentration of MMs: macroelements (a) and microelements (b) in honey products originating from new and old EU countries.

Author Contributions

Conceptualisation, M.G.; methodology, M.G., R.G., and M.B.; formal analysis, M.B.; investigation, M.G., R.G., Z.S., and M.S.; resources, M.G. and R.G.; data curation, M.G., R.G., and M.B.; writing—original draft preparation, M.G., R.G., Z.S., and M.S.; writing—review and editing, M.G., R.G., Z.S., M.S., and I.O.; visualisation, M.G., R.G., Z.S., M.S., M.B., and I.O.; supervision M.G., R.G., Z.S., M.S., and M.B. All authors have read and agreed to the published version of the manuscript.

Funding

The field research in this study was supported by the West Pomeranian University of Technology in Szczecin under the UPB grant (Maintaining the Research Potential).

Institutional Review Board Statement

Not applicable.

Informed Consent Statement

Not applicable.

Data Availability Statement

The data presented in this study is available in the current paper and Supplementary Materials, raw data is available on request from the corresponding author.

Acknowledgments

The authors would like to express sincere thanks to apiarist Marek Pogorzelec for inspiring the research on rural and urban honey, and special thanks also to apiaries which provided honey products for the present analysis, free of charge, as well as the Department of Zoology and Apiculture, the West Pomeranian University of Technology in Szczecin; Apiculture Division of the Warsaw University of Life Sciences, SGGW; Apiculture Farms ‘Kondziołkowe pszczółki’ and ‘Apiflora’.

Conflicts of Interest

The authors declare no conflict of interest. The funders had no role in the design of the study; in the collection, analyses, or interpretation of data; in the writing of the manuscript, or in the decision to publish the results.

References

  1. Bogdanov, S.; Jurendic, T.; Sieber, R.; Gallmann, P. Honey for nutrition and health: A review. J. Am. Coll. Nutr. 2008, 27, 677–689. Available online: https://www.researchgate.net/publication/23803275 (accessed on 15 August 2020). [CrossRef]
  2. Dżugan, M.; Grabek-Lejko, D.; Swacha, S.; Tomczyk, M.; Kapusta, I. Physicochemical quality parameters, antibacterial properties and cellular antioxidant activity of Polish buckwheat honey. Food Biosci. 2020, 34, 100538. [Google Scholar] [CrossRef]
  3. Herawati, R.; Widiarko, O.P.; Permata, F.S. Preventive potency of sumbawa forest honey on rats exposed by lead acetate based on liver histopathology and AST-ALT level. J. Phys. Conf. Ser. 2020, 1430, 012030. [Google Scholar] [CrossRef]
  4. Mračević, S.Đ.; Krstić, M.; Lolić, A.; Ražić, S. Comparative study of the chemical composition and biological potential of honey from different regions of Serbia. Microchem. J. 2020, 152, 104420. [Google Scholar] [CrossRef]
  5. Smaropoulos, E.; Cremers, N.A.J. Treating severe wounds in pediatrics with medical grade honey: A case series. Clin. Case Rep. 2020, 8, 469–476. [Google Scholar] [CrossRef] [PubMed] [Green Version]
  6. Dai, Y.; Jin, R.; Verpoorte, R.; Lam, W.; Chengc, Y.-C.; Xiao, Y.; Xu, J.; Zhang, L.; Qin, X.-M.; Chen, S. Natural deep eutectic characteristics of honey improve the bioactivity and safety of traditional medicines. J. Ethnopharmacol. 2020, 250, 112460. [Google Scholar] [CrossRef] [PubMed]
  7. Zamanian, M.; Azizi-Soleiman, F. Honey and glycemic control: A systematic review. PharmaNutrition 2020, 11, 100–180. [Google Scholar] [CrossRef]
  8. El Sayed, S.M.; Almaramhy, H.H.; Aljehani, Y.T.; Okashah, A.M.; El-Anzi, M.E.; Al-Harbi, M.B.; El-Tahlawi, R.; Nabo, M.M.H.; Aboonq, M.S.; Hamouda, O.; et al. The evidenced-based Taib UVID nutritional treatment for minimizing COVID-19 fatalities and morbidity and eradicating COVID-19 pandemic: A novel approach for better outcomes (a treatment protocol). Am. J. Public Health 2020, 8, 54–60. [Google Scholar] [CrossRef]
  9. Bargańska, Ż.; Ślebioda, M.; Namieśnik, J. Honey bees and their products: Bioindicators of environmental contamination. Crit. Rev. Environ. Sci. Technol. 2016, 46, 235–248. [Google Scholar] [CrossRef]
  10. Matin, G.; Kargar, N.; Buyukisik, H.B. Biomonitoring of cadmium, lead, arsenic and mercury in industrial districts of Izmir, Turkey by using honey bees, propolis and pine tree leaves. Ecol. Eng. 2016, 90, 331–335. [Google Scholar] [CrossRef]
  11. Goretti, E.; Pallottini, M.; Rossi, R.; La Porta, G.; Gardi, T.; Cenci Goga, B.T.; Elia, A.C.; Galletti, M.; Moroni, B.; Petroselli, C.; et al. Heavy metal bioaccumulation in honey bee matrix, an indicator to assess the contamination level in terrestrial environments. Environ. Pollut. 2020, 256, 113388. [Google Scholar] [CrossRef]
  12. Hodel, K.V.S.; Machado, B.A.S.; Santos, N.R.; Costa, R.G.; Menezes-Filho, J.A.; Umsza-Guez, M.A. Metal content of nutritional and toxic value in different types of brazilian propolis. Sci. World J. 2020, 2020, 4395496. [Google Scholar] [CrossRef]
  13. Bibi, S.; Husain, S.Z.; Malik, R.N. Pollen analysis and heavy metals detection in honey samples from seven selected countries. Pak. J. Bot. 2008, 40, 507–516. [Google Scholar]
  14. Karabagias, I.K.; Louppis, A.P.; Kontakos, S.; Drouza, C.; Papastephanou, C. Characterization and botanical differentiation of monofloral and multifloral honeys produced in Cyprus, Greece, and Egypt using physicochemical parameter analysis and mineral content in conjunction with supervised statistical techniques. J. Anal. Methods Chem. 2018, 2018, 7698251. [Google Scholar] [CrossRef] [PubMed]
  15. Pipoyan, D.; Stepanyan, S.; Beglaryan, M.; Stepanyan, S.; Asmaryan, S.; Hovsepyan, A.; Merendino, N. Carcinogenic and non-carcinogenic risk assessment of trace elements and POPs in honey from Shirak and Syunik regions of Armenia. Chemosphere 2020, 239, 124809. [Google Scholar] [CrossRef]
  16. Kara, M. Assessment of sources and pollution state of trace and toxic elements in street dust in a metropolitan city. Environ. Geochem. Health 2020, 42, 3213–3229. [Google Scholar] [CrossRef] [PubMed]
  17. Loppi, S.; Corsini, A.; Paoli, L. Estimating environmental contamination and element deposition at an urban area of central Italy. Urban Sci. 2019, 3, 76. [Google Scholar] [CrossRef] [Green Version]
  18. Karagulian, F.; Belis, C.A.; Dora, C.F.C.; Prüss-Ustün, A.M.; Bonjour, S.; Adair-Rohani, H.; Amann, M. Contributions to cities’ ambient particulate matter (PM): A systematic review of local source contributions at global level. Atmos. Environ. 2015, 120, 475–483. [Google Scholar] [CrossRef]
  19. Kováčik, J.; Grúz, J.; Biba, O.; Hedbavny, J. Content of metals and metabolites in honey originated from the vicinity of industrial town Košice (eastern Slovakia). Environ. Sci. Pollut. Res. Int. 2016, 23, 4531–4540. [Google Scholar] [CrossRef]
  20. Geslin, B.; Gauzens, B.; Baude, M.; Dajoz, I.; Fontaine, C.; Henry, M.; Ropars, L.; Rollin, O.; Thébault, E.; Vereecken, N.J. Massively introduced managed species and their consequences for plant–pollinator interactions. Adv. Ecol. Res. 2017, 57, 1–53. [Google Scholar] [CrossRef]
  21. Stange, E.; Zulian, G.; Rusch, G.; Barton, D.; Nowell, M. Ecosystem services mapping for municipal policy: ESTIMAP and zoning for urban beekeeping. One Ecosyst. 2017, 2, e14014. [Google Scholar] [CrossRef] [Green Version]
  22. Sponsler, D.B.; Bratman, E.Z. Beekeeping in, of, or for the city? A socioecological perspective on urban apiculture. People Nat. 2021, 3, 550–559. [Google Scholar] [CrossRef]
  23. Lecocq, A.; Kryger, P.; Vejsnæs, F.; Bruun-Jensen, A. Weight watching and the effect of landscape on honeybee colony productivity: Investigating the value of colony weight monitoring for the beekeeping industry. PLoS ONE 2015, 10, e0132473. [Google Scholar] [CrossRef] [PubMed]
  24. Pouilloux, L. Urban Honey Beekeeping Using Hive-Pollen to Identify Urban Foraging Sites and Preferred Vegetation Communities in Japan. Master’s Thesis, Université de Liège, Liège, Belgium, 2019. Available online: http://hdl.handle.net/2268.2/7769 (accessed on 27 February 2020).
  25. Peterson Roest, B. Bees in the d: A message of conservation from an urban environment. Challenges 2019, 10, 19. [Google Scholar] [CrossRef] [Green Version]
  26. Madras-Majewska, B.; Jasiński, Z.; Zajdel, B.; Gąbka, J.; Ochnio, M.; Petryka, W.; Kamiński, Z.; Ścięgosz, J. Content of selected toxic elements in bee products. Breed Rev. 2014, 3, 49–51. Available online: http://ph.ptz.icm.edu.pl/wp-content/uploads/2016/12/23-Madras-Majewska.pdf (accessed on 24 April 2020). (In Polish).
  27. Solayman, M.; Islam, M.A.; Paul, S.; Ali, Y.; Khalil, M.I.; Alam, N.; Gan, S.H. Physicochemical properties, minerals, trace elements, and heavy metals in honey of different origins. Compr. Rev. Food Sci. Food Saf. 2016, 15, 219–233. [Google Scholar] [CrossRef]
  28. Fakhri, Y.; Abtah, M.; Atamaleki, A.; Raoofi, A.; Atabati, H.; Asadi, A.; Miri, A.; Shamloo, E.; Alinejad, A.; Keramati, H.; et al. The concentration of potentially toxic elements (PTEs) in honey: A global systematic review and meta-analysis and risk assessment. Trends Food Sci. Technol. 2019, 91, 498–506. [Google Scholar] [CrossRef]
  29. Bartha, S.; Taut, I.; Goji, G.; Vlad, J.A.; Dinulică, F. Heavy metal content in polyfloralhoney and potential health risk. a case study of Copșa Mică, Romania. Int. J. Environ. Res. Public Health 2020, 17, 1507. [Google Scholar] [CrossRef] [PubMed] [Green Version]
  30. Inspectorate of Environmental Protection (IEP). Annual Air Quality Assessment in the Mazowieckie Voivodeship, Voivodeship Report for 2018; Chief Inspectorate of Environmental Protection, Department of Monitoring and Information on Environment: Warsaw, Poland, 2019; pp. 1–166. Available online: http://powietrze.gios.gov.pl/pjp/publications/card/14050 (accessed on 15 April 2020). (In Polish)
  31. Inspectorate of Environmental Protection (IEP). Annual Air Quality Assessment in Lubuskie Voivodeship, Voivodeship Report for 2018; Chief Inspectorate of Environmental Protection, Department of Monitoring and Information on Environment: Zielona Góra, Poland, 2019; pp. 1–108. Available online: http://www.zgora.pios.gov.pl/wp-content/uploads/2019/05/RAPORT_OR_2018_LUBUSKIE-ostat.pdf (accessed on 8 June 2020). (In Polish)
  32. Inspectorate of Environmental Protection (IEP). Annual Air Quality Assessment in the West Pomeranian Voivodeship, Voivodeship Report for 2018; Chief Inspectorate of Environmental Protection, Department of Monitoring and Information on Environment: Szczecin, Poland, 2019; pp. 1–94. Available online: http://powietrze.gios.gov.pl/pjp/publications/card/14064 (accessed on 6 May 2020). (In Polish)
  33. Jabłoński, B.; Kołtowski, Z.; Marcinkowski, J.; Rybak-Chmielewska, H.; Szczęsna, T.; Warakomska, Z. The content of heavy metals [Pb, Cd, and Cu] in nectar, honey and pollen from plants growing along communication routes. Apic. Sci. Exerc. Books 1995, 39, 129–144. Available online: http://miesiecznik-pszczelarstwo.pl/pzn/sites/default/files/pzn1995_129-144_0.pdf (accessed on 28 September 2020). (In Polish).
  34. Sustainable Development in the European Union (SDEU). Monitoring Report on Progress towards the SDGs in an EU Context, 2019 ed.; Publications Office of the European Union: Luxembourg, 2019; pp. 1–372. Available online: https://ec.europa.eu/eurostat/documents/3217494/9940483/KS-02-19-165-EN-N.pdf/1965d8f5-4532-49f9-98ca-5334b0652820 (accessed on 10 April 2020). [CrossRef]
  35. Lawson, D.; Rands, S. The effects of rainfall on plant-pollinator interactions. Arthropod-Plant Interact. 2019, 13, 561–569. [Google Scholar] [CrossRef] [Green Version]
  36. Semkiw, P.; Skubida, P.; Jeziorski, K.; Pioś, A. Support for the Beekeeping Sector in Poland. The Apiculture Division in Puławy, 2018, 1–12. Available online: http://www.inhort.pl/files/program_wieloletni/PW_2015_2020_IO/spr_2018/Semkiw_2018_Sektor_pszczelarski_zadanie_4.3.pdf (accessed on 1 August 2020). (In Polish).
  37. Popp, J.; Kiss, A.; Oláh, J.; Máté, D.; Bai, A.; Lakner, Z. Network analysis for the improvement of food safety in the international honey. Amfiteatru Econ. 2018, 20, 84–98. [Google Scholar] [CrossRef]
  38. United State Environmental Protection Agency (USEPA). United Quantitative Risk Assessment Calculations. 2015. Available online: https://www.epa.gov/sites/production/files/2015-05/documents/13.pdf (accessed on 8 December 2019).
  39. Karabagias, I.K.; Louppis, A.P.; Karabournioti, S.; Kontakos, S.; Papastephanou, C.; Kontominas, M.G. Characterization and classification of commercial thyme honeys produced in specific Mediterranean countries according to geographical origin, us-ing physicochemical parameter values and mineral content in combination with chemometrics. Eur. Food Res. Technol. 2016, 243, 889–900. [Google Scholar] [CrossRef]
  40. European Environment Agency (EEA). Air Quality in Europe 2019, Report No 10/2019; European Environment Agency, Publications Office of the European Union: Luxembourg, 2019. [Google Scholar]
  41. European Environment Agency (EEA). Report European Union Emission Inventory Report 1990–2018 under the UNECE Convention on Long-Range Transboundary Air Pollution (LRTAP), No 05/2020; European Environment Agency, Publications Office of the European Union: Luxembourg, 2020. [Google Scholar]
  42. Central Statistical Office (CSO). Environment 2018: Warsaw; Central Statistical Office, Statistical Publishing Establishment: Warsaw, Poland, 2018.
  43. Cincinelli, A.; Guerranti, C.; Martellini, T.; Scodellini, R. Residential wood combustion and its impact on urban air quality in Europe. Curr. Opin. Environ. Sci. Health 2019, 8, 10–14. [Google Scholar] [CrossRef]
  44. REPORT REP-0641, Austria’s Informative Inventory Report (IIR) 2018, Submission Under the UNECE Convention on Long-Range Transboundary Air Pollution (LRTAP) and Directive (EU) 2016/2284 on the Reduction of National Emissions of Certain Atmospheric Pollutants: Vienna. Umweltbundesamt GmbH: Vienna, Austria, 2018; p. 485. ISBN 978-3-99004-459-9.
  45. Czarnowska, K.; Kozanecka, T. Soluble forms of heavy metals in anthropogenic soils of Warsaw area. Soil Sci. Ann. 2001, 52, 45–51. Available online: http://ssa.ptg.sggw.pl/files/artykuly/2001_52/2001_tom_52_nr_3-4/tom_52_nr_3-4_45-51.pdf (accessed on 19 June 2020). (In Polish).
  46. Niedźwiecki, E.; Protasowicki, M.; Wojcieszczuk, T.; Sammel, A.; Dembińska, K.; Jaruta, G. Morphological features and chemical composition of soils in northwestern part of Szczecin. Probl. J. Adv. Agric. Sci. 2009, 542, 797–808. (In Polish) [Google Scholar]
  47. Bilandžić, N.; Tlak-Gajger, I.; Kosanović, M.; Čalopek, B.; Sedak, M.; Kolanović, B.S.; Varenina, I.; Luburić, D.B.; Varga, I.; Đokić, M. Essential and toxic element concentrations in monofloral honeys from southern Croatia. Food Chem. 2017, 234, 245–253. [Google Scholar] [CrossRef]
  48. Pongpiachan, S.; Iijima, A.; Cao, J. Hazard Quotients, Hazard Indexes, and Cancer Risks of Toxic Metals in PM10 during Firework Displays. Atmosphere 2018, 9, 144. [Google Scholar] [CrossRef] [Green Version]
  49. Cui, L.; Wu, Z.; Han, P.; Taira, Y.; Wang, H.; Meng, Q.; Feng, Z.; Zhai, S.; Yu, J.; Zhu, W.; et al. Chemical content and source apportionment of 36 heavy metal analysis and health risk assessment in aerosol of Beijing. Environ. Sci. Pollut. Res. Int. 2019, 27, 7005–7014. [Google Scholar] [CrossRef] [PubMed]
  50. Liu, J.; Chen, Y.; Chao, S.; Cao, H.; Zhang, A. Levels and health risks of PM2.5-bound toxic metals from firework/firecracker burning during festival periods in response to management strategies. Ecotoxicol. Environ. Saf. 2019, 171, 406–413. [Google Scholar] [CrossRef]
  51. Hickey, C.; Gordon, C.; Galdanes, K.; Blaustein, M.; Horton, L.; Chillrud, S.; Ross, J.; Yinon, L.; Chen, L.C.; Gordon, T. Toxicity of particles emitted by fireworks. Part. Fibre Toxicol. 2020, 17, 17–28. [Google Scholar] [CrossRef]
  52. Formicki, G.; Greń, A.; Stawarz, R.; Zyśk, B.; Gał, A. Metal content in honey, propolis, wax, and bee pollen and implications for metal pollution monitoring. Pol. J. Environ. Stud. 2013, 22, 99–106. Available online: http://www.pjoes.com/Metal-Content-in-Honey-Propolis-Wax-r-nand-Bee-Pollen-and-Implications-for-Metal,88957,0,2.html (accessed on 2 February 2019).
  53. Madejczyk, M.; Baralkiewicz, D. Characterization of polish rape and honeydew honey according to their mineral contents using ICP-MS and F-Aas/AES. Anal. Chim. Acta 2008, 617, 11–18. [Google Scholar] [CrossRef] [PubMed]
  54. Pohl, P. Determination of metal content in honey by atomic absorption and emission spectrometry’s. Trends Anal. Chem. 2009, 28, 117–128. [Google Scholar] [CrossRef]
  55. Matusevicius, P.; Staniskiene, B.; Budreckiene, R. Metals and organochlorine compounds in Lithuanian honey. Pol. J. Food Nutr. Sci. 2010, 60, 159–163. [Google Scholar]
  56. Kacaniová, M.; Knazovicka, V.; Melich, M.; Fikselova, M.; Massanyi, P.; Stawarz, R.; Hascik, P.; Pechociak, T.; Kuczkowska, A.; Putała, A. Environmental concentration of selected elements and relation to physicochemical parameters in honey. J. Environ. Sci. Health Part A 2009, 44, 414–422. [Google Scholar] [CrossRef] [PubMed]
  57. Mishra, S.; Bharagava, R.N.; More, N.; Yadav, A.; Zainith, S.; Mani, S.; Chowdhary, P. Heavy metal contamination: An alarming threat to environment and human health. In Environmental Biotechnology: For Sustainable Future; Springer: Singapore, 2019; pp. 103–125. [Google Scholar] [CrossRef]
  58. Rahman, Z.; Singh, V.P. The relative impact of toxic heavy metals (THMs) (arsenic (As), cadmium (Cd), chromium (Cr)(VI), mercury (Hg), and lead (Pb)) on the total environment: An overview. Environ. Monit. Assess. 2019, 191, 1–21. [Google Scholar] [CrossRef]
  59. Agency for Toxic Substances and Disease Registry (ATSDR) 2015, Division of Toxicology and Human Health, ATSDR’s Substance Priority List. 2020. Available online: https://www.atsdr.cdc.gov/spl/index.html (accessed on 16 June 2020).
  60. Murashova, E.A.; Tunikov, G.M.; Nefedova, S.A.; Karelina, O.A.; Byshova, N.G.; Serebryakova, O.V. Major factors determining accumulation of toxic elements by bees and honey products. Int. Trans. J. Eng. Manag. Appl. Sci. Technol. 2020, 11, 3. [Google Scholar] [CrossRef]
  61. Zambelli, B.; Uversky, V.N.; Ciurli, S. Nickel impact on human health: An intrinsic disorder perspective. Biochim. Biophys. Acta Proteins Proteom. 2016, 1864, 1714–1731. [Google Scholar] [CrossRef]
  62. Maroney, M.J.; Ciurli, S. Bioinorganic chemistry of nickel. Inorganics 2019, 7, 131. [Google Scholar] [CrossRef] [Green Version]
  63. Leyssens, L.; Vinck, B.; Van Der Straeten, C.; Wuyts, F.; Mae, L. Cobalt toxicity in humans—A review of the potential sources and systemic health effects. Toxicology 2017, 387, 43–56. [Google Scholar] [CrossRef]
  64. Des Marais, T.L.; Costa, M. Mechanisms of chromium-induced toxicity. Curr. Opin. Toxicol. 2019, 14, 1–7. [Google Scholar] [CrossRef]
  65. Kravchenko, J.; Darrah, T.H.; Miller, R.K.; Lyerly, H.K.; Vengosh, A. A review of the health impacts of barium from natural and anthropogenic exposure. Environ. Geochem. Health 2014, 36, 797–814. [Google Scholar] [CrossRef]
  66. PN-88/A-77626. Bee Honey Polish Committee for Standardization, Measures and Quality; Wydawnictwa Normalizacyjne Alfa: Warsaw, Poland, 1988. [Google Scholar]
  67. Höllriegl, V.; München, H.Z. Strontium in the Environment and Possible Human Health Effects. In Encyclopedia of Environmental Health; Nriagu, J.O., Ed.; Elsevier: Amsterdam, The Netherlands, 2011; pp. 268–275. [Google Scholar] [CrossRef]
  68. Hassan, A.S.M.; El Rahman, T.A.A.; Eissa, A.A. A evaluation and comparison of some trace elements in bee honey from eleven countries. Egy. Sci. J. Pestic. 2015, 1, 39–44. [Google Scholar]
  69. Chen, P.; Bornhorst, J.; Aschner, M. Manganese Metabolism in Humans; University of Potsdam Mathematical and Natural Science Series—Bioscience: Potsdam, Germany, 2018; Volume 711, pp. 1655–1679. [Google Scholar] [CrossRef]
  70. Gaffney-Stomberg, E. The impact of trace minerals on bone metabolism. Biol. Trace Elem. Res. 2019, 188, 26–34. [Google Scholar] [CrossRef]
  71. Sousa, C.; Moutinho, C.; Vinha, A.F.; Matos, C. Trace minerals in human health: Iron, zinc, copper, manganese and fluorine. Int. J. Sci. Res. Methodol. 2019, 13, 57–80. Available online: http://ijsrm.humanjournals.com/wp-content/uploads/2019/10/5.Carla-Sousa-Carla-Moutinho-Ana-F.-Vinha-Carla-Matos.pdf (accessed on 19 August 2020).
  72. Jiménez, M.; Abradelo, C.; Román, J.S.; Rojo, L. Bibliographic review on the state of the art of strontium and zinc based regenerative therapies. Recent developments and clinical applications. J. Mater. Chem. B 2019, 7, 1974–1985. [Google Scholar] [CrossRef]
  73. Umair, M.; Alfadhel, M. Genetic disorders associated with metal metabolism. Cells 2019, 8, 1598. [Google Scholar] [CrossRef] [Green Version]
  74. Białek, M.; Czauderna, M.; Krajewska, K.A.; Przybylski, W. Selected physiological effects of boron compounds for animals and humans. A review. J. Anim. Feed Sci. 2019, 28, 307–320. [Google Scholar] [CrossRef]
  75. Dib-Hajj, S.D.; Waxman, S.G. Sodium channels in human pain disorders: Genetics and pharmacogenomics. Annu. Rev. Neurosci. 2019, 42, 87–106. [Google Scholar] [CrossRef]
  76. Dogan, M.F.; Yildiz, O.; Arslan, S.O.; Ulusoy, K.G. Potassium channels in vascular smooth muscle: A pathophysiological and pharmacological perspective. Fundam. Clin. Pharmacol. 2019, 33, 504–523. [Google Scholar] [CrossRef]
  77. Hewlings, S.; Kalman, D. Sulfur in human health. EC Nutr. 2019, 14, 785–791. Available online: https://www.researchgate.net/publication/335653705_Sulfur_and_Human_Health (accessed on 20 August 2020).
  78. Pasek, M. A role for phosphorus redox in emerging and modern biochemistry. Curr. Opin. Chem. Biol. 2019, 49, 53–58. [Google Scholar] [CrossRef]
  79. Smith, G.L.; Eisner, D.A. Calcium buffering in the heart in health and disease. Circulation 2019, 139, 2358–2371. [Google Scholar] [CrossRef]
  80. Borgi, L. Inclusion of phosphorus in the nutrition facts label. Clin. J. Am. Soc. Nephrol. 2018, 14, 139–140. [Google Scholar] [CrossRef] [PubMed] [Green Version]
  81. Khaliq, H.; Juming, Z.; Ke-Mei, P. The physiological role of boron on health. Biol. Trace Elem. Res. 2018, 186, 31–51. [Google Scholar] [CrossRef] [PubMed]
  82. Farapti, F.; Sulistyowati, M.; Artanti, K.D.; Setyaningtyas, S.W.; Sumarmi, S.; Mulyana, B. Highlighting of urinary sodium and potassium among indonesian schoolchildren aged 9–12  years: The contribution of school food. J. Nutr. Metab. 2019, 2019, 1028672. [Google Scholar] [CrossRef] [PubMed]
  83. Uwitonze, A.M.; Rahman, S.; Ojeh, N.; Grant, W.B.; Kaur, H.; Haq, A.; Razzaque, M.S. Oral manifestations of magnesium and vitamin D inadequacy. J. Steroid Biochem. Mol. Biol. 2020, 200, 105636. [Google Scholar] [CrossRef] [PubMed]
  84. Clase, C.M.; Carrero, J.-J.; Ellison, D.H.; Grams, M.E.; Hemmelgarn, B.R.; Jardine, M.J.; Kovesdy, C.P.; Kline, G.A.; Lindner, G.; Obrador, G.T.; et al. Potassium homeostasis and management of dyskalemia in kidney diseases: Conclusions from a kidney disease: Improving global outcomes (KDIGO) controversies conference. Kidney Int. 2020, 97, 42–46. [Google Scholar] [CrossRef] [PubMed] [Green Version]
  85. Sogut, I.; Oglakci, A.; Kartkaya, K.; Ol, K.K.; Sogut, M.S.; Kanbak, G.; Inal, M.E. Effect of boric acid on oxidative stress in rats with fetal alcohol syndrome. Exp. Ther. Med. 2014, 9, 1023–1027. [Google Scholar] [CrossRef] [PubMed]
  86. Saito, Y.; Sakuma, M.; Narishima, Y.; Yoshida, T.; Kumagai, H.; Arai, H. Habitual confectionery intake is associated with serum phosphorus levels: A cross-sectional study on healthy subjects. J. Med. Investig. 2019, 66, 134–140. [Google Scholar] [CrossRef] [Green Version]
  87. Karabagias, I.K.; Louppis, A.P.; Badeka, A.; Papastephanou, C.; Kontominas, M.G. Nutritional aspects and botanical origin recognition of Mediterranean honeys based on the “mineral imprint” with the application of supervised and non-supervised statistical techniques. Eur. Food Res. Technol. 2019, 245, 1939–1949. [Google Scholar] [CrossRef]
  88. Kuras, M.; Zielińska-Pisklak, M.; Perz, K.; Szeleszczuk, Ł. Iron and zinc—The main micronutrients necessary for the proper functioning of the body. Pharmacotherapy 2015, 25, 6–13. Available online: https://www.researchgate.net/publication/280598065_Zelazo_i_cynk-glowne_mikroelementy_niezbedne_do_prawidlowego_funkcjonowania_organizmu (accessed on 10 May 2020). (In Polish).
  89. Available online: www.statista.com (accessed on 17 April 2020).
  90. P8_TA. 0057 Prospects and challenges for the EU apiculture sector, 2018, European Parliament resolution of 1 March 2018 on prospects and challenges for the EU apiculture sector (2017/2115(INI)), (2019/C 129/05) C 129/30 EN. Off. J. Eur. Union 2019, C129, 30. Available online: https://www.europarl.europa.eu/doceo/document/TA-8-2018-0057_EN.pdf (accessed on 17 April 2020).
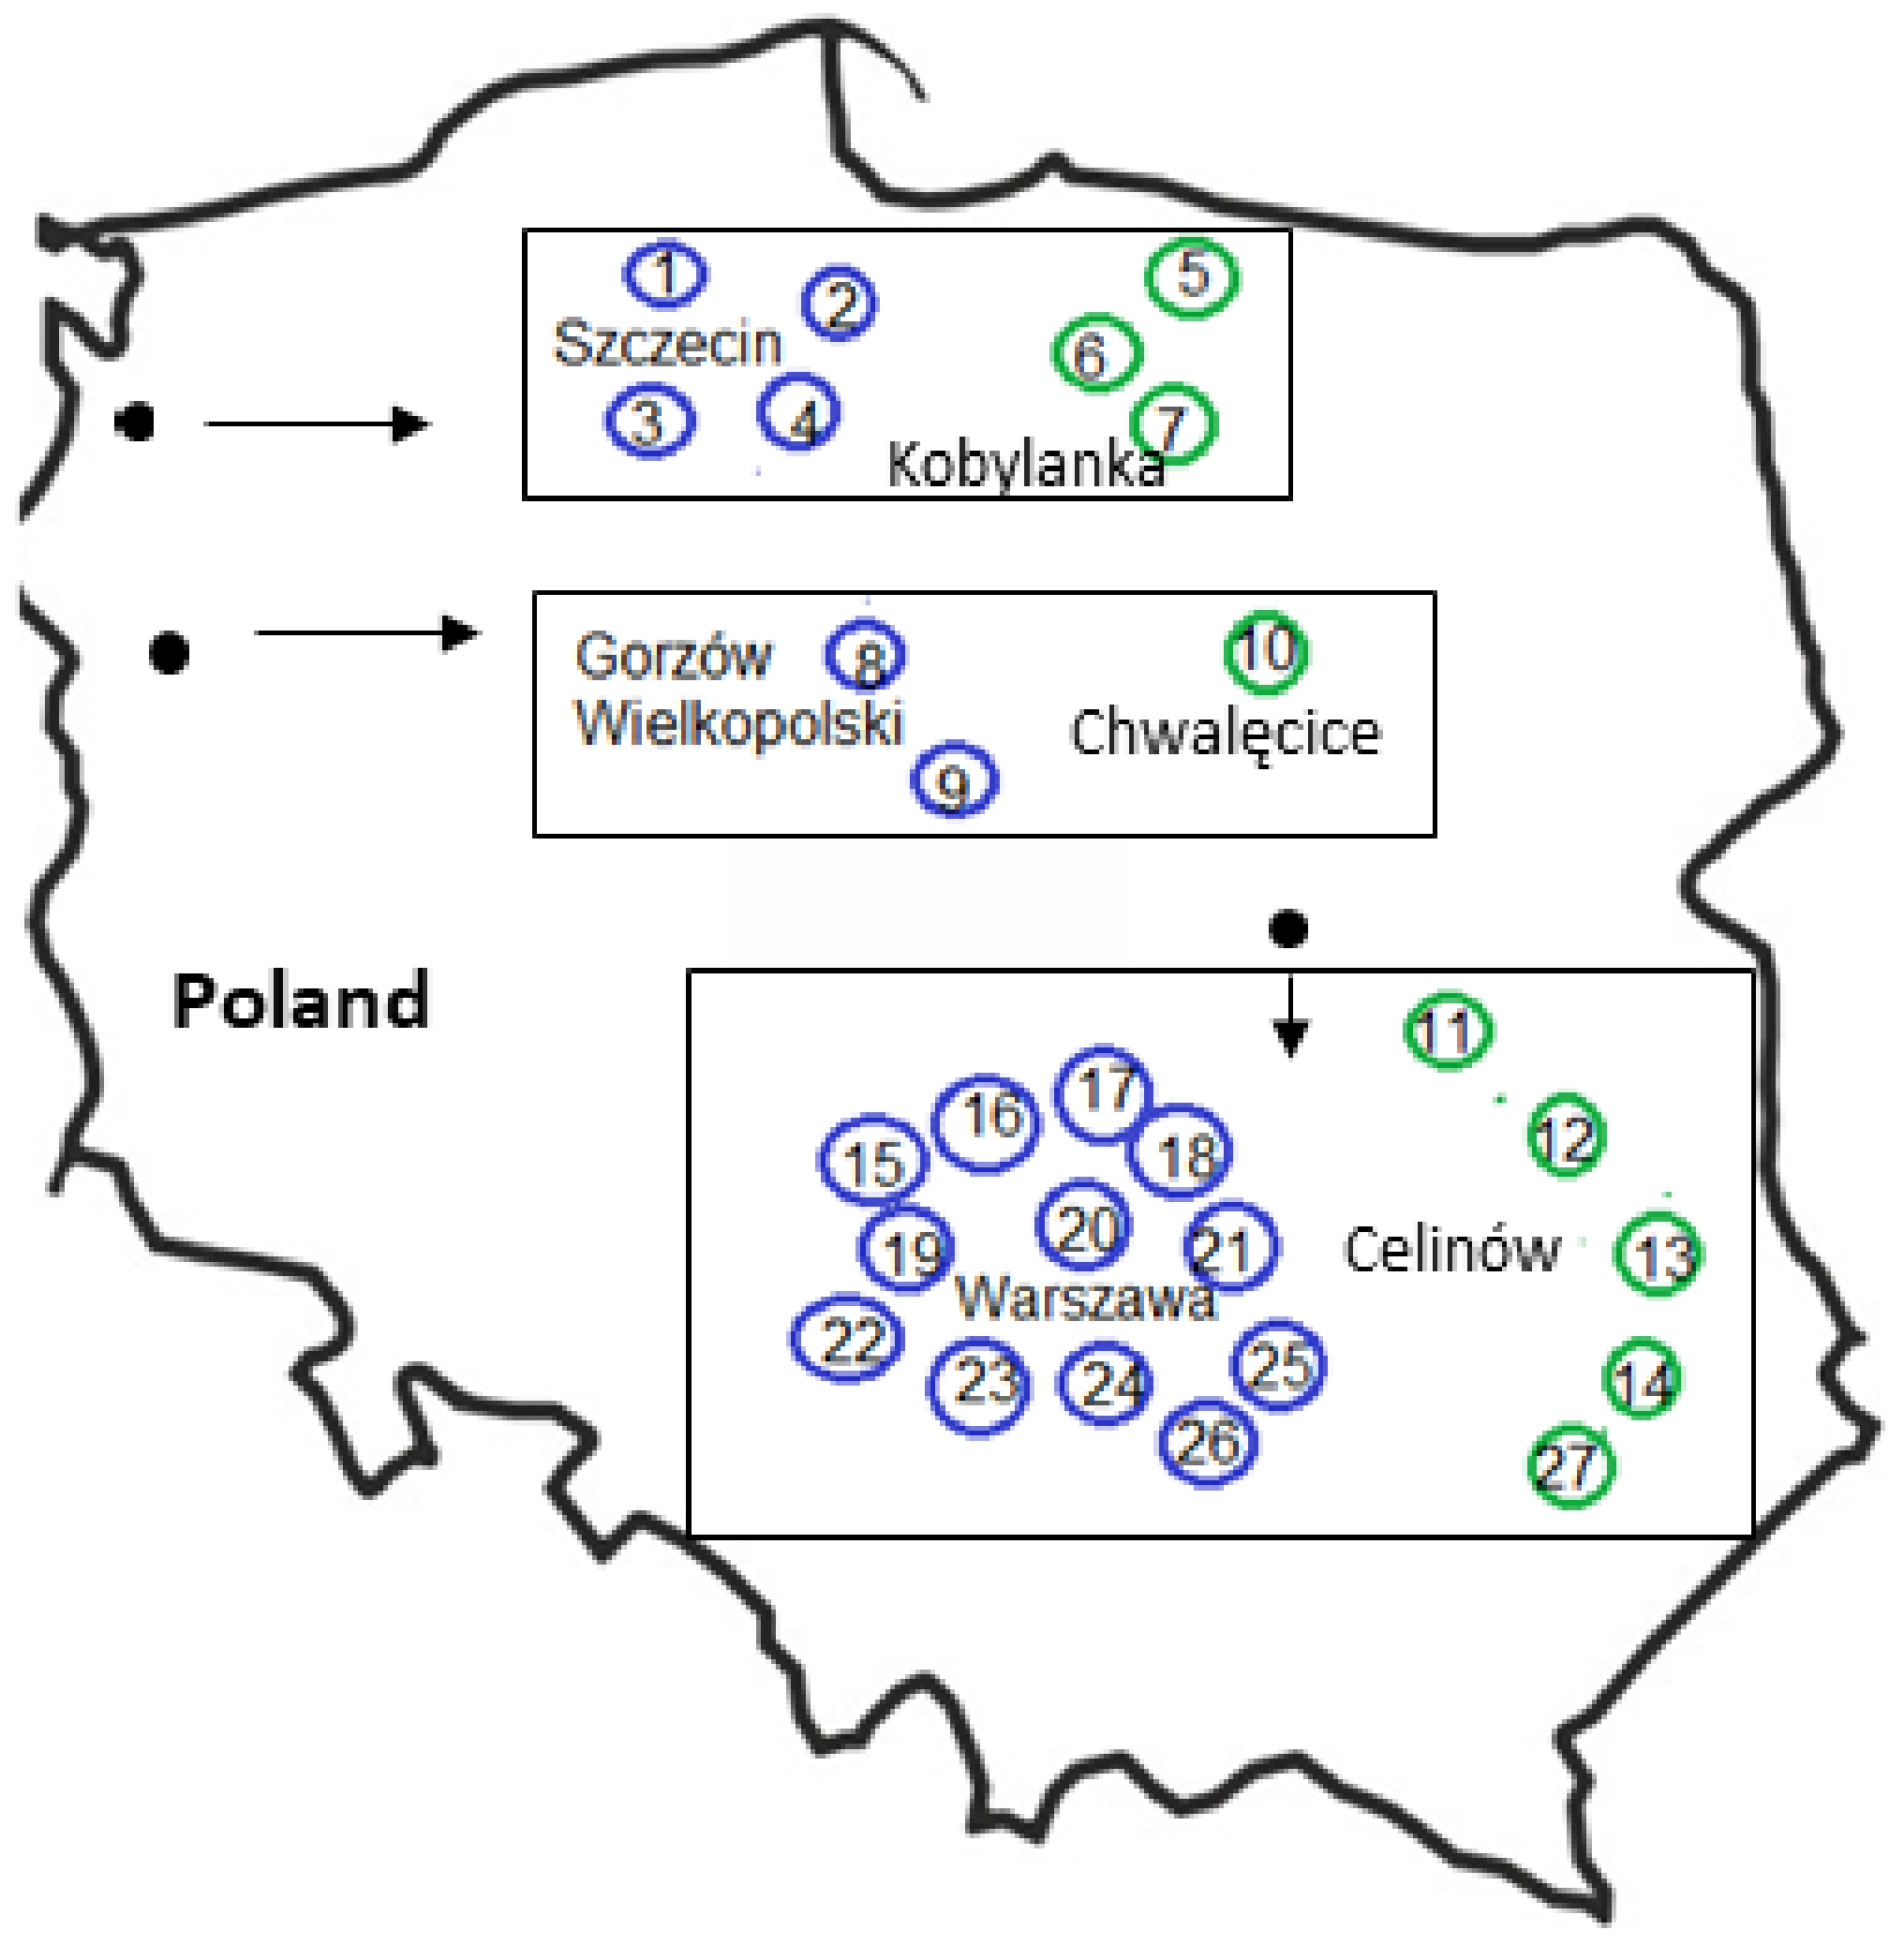
Figure 1. The location of cities and neighbouring rural areas in NW and central Poland (source: https://pl.wikipedia.org/wiki/Polska (accessed on 30 July 2021)).
Resources 10 00086 g001
Figure 2. Elements found to be of low concentrations (mg/kg WW) in the analysed honey samples (No of sites: 1, 2, etc.; explanatory notes as in Table 4; LOD (mg/kg WW): Pb 0.0055, Cr 0.0037, Ba 0.0095, Ni 0.0036, Co 0.004).
Resources 10 00086 g002
Figure 3. HCR low and HCR high values for Mn (a), Zn (b), Cu (c), Fe (d), Sr (e), Mg (f), Ca (g), K (h), Na (i), B (j), P (k), S (l), and mean Mn, Zn, Cu, Fe, Sr (m) in the 27 sampling sites in NW part and central of Poland: HCR low, green histogram; HCR high, red histogram. H, I, and L letters represent HCR values that indicate high (HCR high 1 > 0), intermediate (HCR high < 0 and HCR low > 0) and low (HCR low < 0) contamination condition, respectively; designation with completely filled bars—part I (intermediate), hatched bar—only in H part (high) or only in L part (low).
Resources 10 00086 g003aResources 10 00086 g003bResources 10 00086 g003c
Figure 4. THQ for honey samples from NW and central Poland and other EU countries at different mean consumption levels. PL* h—honey from Poland, EU h—honey from EU; * (NW and central part of Poland).
Resources 10 00086 g004
Figure 5. TTHQ for NW and central part of Poland and EU consumers of honey products: 1—children (0.6 kg/year); 2—adults (0.6 kg/year); 3—children (0.7 kg/year); 4—adults (0.7 kg/year).
Resources 10 00086 g005
Table 1. Characteristics of PM2.5 and PM10 particles in urban areas of the studied cities.
Features of CitiesCity
WarsawSzczecinGorzów Wlkp.
* PM10 dust average annual value [ug/m3]30; 30; 32; 4424; 24; 2624; 27
* PM2.5 dust average annual value [ug/m3]20; 21; 23; 2519; 2017
* Pb(PM10) average annual value [ng/m3]10; 101010; 10
* Ni(PM10) average annual value [ng/m3]0.6; 2.10.91.9; 2.7
* As(PM10) average annual value [ng/m3]0.6; 0.70.81.2; 1.1
* Cd(PM10) average annual value [ng/m3]0.3; 0.20.20.2; 0.2
Classes for the protection of healthCAA
Particulate pollutants emission from plants of significant nuisance to air quality [t/y]45629928
*: the number of presented results refers due to different numbers of measurement stations of air quality in individual cities in 2019.
Table 2. Exposure people to air pollution by particulate matter in Poland and in the neighbouring EU countries of Poland.
ContaminationState
PolandGermanyCzechSlovakiaLithuaniaEU
GPS Republic
PM10 dust [µg/m3]32.229.017.523.924.222.821.6
PM2.5 dust [µg/m3]23.820.712.718.417.5-14.1
G: values of general, PS: mean values of three cities (Table 1).
Table 4. MM concentrations in studied honey samples (mg/kg WW).
MMsMnZnCuFeSrMgCaKNaBPS
Mean 0.7343.800.2872.580.13223.377.0125516.435.90104.142.6
Median0.4163.140.2382.030.10116.972.6150111.984.3872.832.1
I quartile0.2232.720.1411.400.05714.251.06257.723.4264.127.1
III quartile0.7524.220.4203.330.16021.789.8162721.268.94116.450.1
S.D.0.9112.060.1931.800.10421.138.675913.863.2680.925.6
Min.0.1051.970.0471.010.0246.828.001662.982.3842.117.8
Max.3.76412.80.8269.730.477109.3200.2349059.3714.71405.1130.8
LOD (mg/kg WW): Mn 0.0027, Zn 0.0007, Cu 0.0069, Fe 0.0053, Sr 0.0058, Mg 0.0019, Ca 0.06, K 0.8601, Na 0.2647, B 0.0323, P 0.1010, S 0.0074.
Table 5. Mean concentrations of MMs (mg/kg WW) in honey samples from cities and nearby villages.
MMsKind of LocationMMsKind of Location
CityVillage CityVillage
Zn3.47 (n = 18)4.48 (n = 9)B4.71 (n = 18)8.26 (n = 9)
Cu0.29 (n = 18)0.29 (n = 9)P96.9 (n = 18)118.6 (n = 9)
Mn0.45 (n = 18)1.30 (n = 9)S42.2 (n = 18)43.3 (n = 9)
Fe2.50 (n = 18)2.75 (n = 9)Pb0.07 (n = 11)0.07 (n = 7)
Ca74.6 (n = 18)81.8 (n = 9)Cr0.03 (n = 5)0.03 (n = 1)
Mg21.6 (n = 18)26.6 (n = 9)Ba0.10 (n = 3)0.04 (n = 3)
K1411 (n = 18)942 (n = 9)Ni0.03 (n = 3)0.02 (n = 5)
Na15.3 (n = 18)18.7 (n = 9)Co0.03 (n = 3)below LOD
Sr0.14 (n = 18)0.12 (n = 9)As, Cdbelow LODbelow LOD
n: number of attempts, bold: the significant differences.
Publisher’s Note: MDPI stays neutral with regard to jurisdictional claims in published maps and institutional affiliations.