Abstract
Copper raw materials have not been identified as a critical raw material for the economy of the European Union (EU). Demand for metal for use within the EU is satisfied mainly by imports of raw materials in various processing stages and from recycling. Imports include not only copper concentrates, but also refined metals, alloys, and intermediate and finished products. In terms of EU imports, mining supplies represent a minor share of demand. It is likely that copper demand will grow in the coming decades and that global as well as European reserves of copper will be depleted more rapidly. For Europe, no complete and harmonised dataset presenting estimates of total EU copper resources and reserves exists, with the exception of the attempted Minerals4EU project. In colloquial language, many imprecise concepts aim at describing reality. Classic probability tools cannot be used to describe imperfect information. There are no sharp thresholds between the boundaries of many measurements; instead, smooth transitions are observed. This gradation between full and partial membership and non-membership is not included in classical set theory; thus, the capacity for describing such effects is provided by fuzzy set theory. An attempt is made in the present paper at a fuzzy description of the copper reserve base in the EU countries. The basic terminology of fuzzy sets is presented and useful logical operators are indicated. The copper reserve base in the EU countries was assessed in relation to world reserves and an appraisal of this base within these countries was carried out.
1. Introduction
Copper, known even to the most ancient civilisations, is characterised by a 10,000-year-old history. The oldest copper ornament, found in the modern territories of northern Iraq, dates back to around 8700 BC. Copper is one of the earliest metals and among those most widely used by humans. Its widespread use and practical application initiated the Chalcolithic era, the first metal era after the Stone Age. Evidence of copper smelting and recovery in different parts of the world through the processing of malachite and azurite dates back to 5000 BC. About 3000 BC, prehistoric people started to use bronze instead of stone to make weapons, tools, and jewellery. Copper and bronze artefacts were found in the ancient cities of Sumer, dating back to 3000 BC. Egyptian items made of copper and copper alloys containing tin are known from approximately the same period. Copper pipelines of a water supply system dating back to 5000 years ago were found in one of the Egyptian pyramids. It is believed that the Latin name cuprum originated from the island of Cyprus, where the Romans once extracted copper from rich mines. In ancient mythology and alchemy, this metal was associated with the protection of the goddesses Aphrodite, due to the radiant beauty of copper articles and the metal’s relationship with the island of Cyprus, which was considered sacred [1]. The copper mines Rio Tinto and Tharsis (Spain), as well as mines in Cyprus, in the Urals, and in Timna (Israel), are among the oldest mining relics, having operated at least a thousand years before Christ.
Copper, due to its main properties (as an excellent conductor of heat and electricity), is used primarily in electrical equipment such as wiring and motors. It is also important in plumbing and other industrial machinery. For most of these applications, copper is used in its pure form; however, copper alloys (bronze or brass) also possess a wide spectrum of applications in which increased levels of hardness are required. Copper sulphate is used widely as an agricultural poison and as an algicide in water purification, and other copper compounds are used in chemistry and medicine. Copper is an important raw material in the economies of many countries. Consumption of refined copper in the EU is quite important, accounting for around 13% of world consumption. Therefore, an attempt to assess the primary sources of copper potential in the EU countries appears justified.
Assessment of mineral resources/reserves, not only of copper deposits, is usually a practical task carried out by a competent geologist during the exploration work at various stages of geological mining project development. Aggregated, quantitative data related to the mineral resource base are usually published by:
- ✓
- Geological surveys of countries as a database (e.g., Mineral Commodity Summaries published by the US Geological Survey, Minerals Yearbook of Poland published by the Polish Geological Institute-National Research Institute and others);
- ✓
- Geological mining companies as a part of their annual reports [2,3];
- ✓
- Political and economic unions of countries (e.g., the European Union) as components of an availability study [4];
- ✓
- Non-profit organizations as scientific projects (e.g., Minerals4EU project).
Undiscovered resources of deposits are also objects of interest. In reference to the world’s copper deposits, such studies were prepared by the United States Geological Survey (USGS) [5] in relation to the national scale by Oszczepalski et al. [6]. In other terms, the assessment of the resource base is quite important in the context of resource efficiency [7,8,9,10].
All these assessments are based on quantitative manner, although it seems interesting to present these values using descriptive terminology, where the quantities are presented in an imprecise or fuzzy way.
Fuzzy categories exist in many issues of economic geology. The use of terms such as “large/small” deposit or “rich/poor” ore grade provides a common example of conversational language; any deposit parameters that are possible to quantify can be verbalised in a descriptive manner. Is a copper deposit containing at least 10 Mt of metal large? Or is 1.0% the cut-off grade for a rich deposit? Or perhaps it is another volume of resources or different grade? It may seem comical, but any attempt to establish a threshold is troublesome because the transformation of qualitative concepts into quantitative is not always straightforward.
The fuzzy approach to the assessment of mineral deposit parameters is not widely used, although such approximations have been made. The studies mentioned below do not strictly refer to the assessment of copper resources, but they are attempts to apply the fuzzy approach to the assessment of resources as such.
The cluster centre analysis proposed by Pham [11] exhibited a tendency towards reasoning about iron ore quality through fuzzy c-means clustering and a fuzzy interference system. Luo and Dimitrakopoulos [12] used fuzzy analysis in the assessment of quantitative mineral resources. Bárdossy and Fodor [13] indicated the usefulness of fuzzy approximation and Bayesian inference in evaluations of the resource base and the quality of bauxite deposits. The uncertainty on the overall mineral resources assessment of the Chilean porphyry copper deposit has been quantified in the paper by Emery et al. [14] using conditional simulations. Tutmez [15] presented a fuzzy method and fuzzy algorithms for a grade estimation based on theoretical and real studies on the Afsin-Elbistan lignite deposit. Tutmez et al. [16] developed ideas identifying the thickness of lignite coal beds using fuzzy assessment. The combined neuro-fuzzy method, based on radial basis neural network and interpolation, was presented by Tutmez [17]. A very similar, rule-based fuzzy inference mechanism was presented by Dag and Mert [18] used for the Kiziltas bauxite deposit reserve estimation. Taboada et al. [19] study described a method for estimating the reserves in an ornamental granite deposit in Spain, where the application of fuzzy kriging led to estimate the distribution of rock commercial qualities important for mining planning. Tahmasebi and Hezarkhani [20], in a case study of copper deposit, showed that the assessment of deposit parameters, for which the range of available data is incomplete and not fully reliable, can be performed using a neuro-fuzzy inference system. A similar adaptive neuro-fuzzy inference system was adapted by Elmas and Şahın [21] in their quality valorisation of barite ore. Muhammad and Glass [22] adapted a novel approach by taking into account spatial irregularity of mineralization patterns using the Gustafson–Kessel classification algorithm, where uncertainty was expressed in terms of fuzzy membership function. Incomplete information is taken into consideration in the paper by Li et al. [23]. A general model of mineral resource efficiency evaluation for a vanadium–titanium magnetite deposit was constructed using fuzzy-set linguistic terms and a modified TODIM (interactive and multicriteria decision making). Selected non-adjustable and adjustable s-norm and t-norm fuzzy operators were demonstrated in the work of Krzak and Panajew [24] and preliminarily tested on the example of the exploitation blocks in one of the copper mines belonging to KGHM Polish Copper S.A. Ozkan et al. [25] compared the conventional approach to the estimation of geostatistical mineral resources with an approximation based on a fuzzy logic model. A fuzzy logic-based resource classification method has been proposed as a tool to eliminate uncertainties in the resource classification procedure. An extension of work [13] is the article by Soltani-Mohammadi [26] where the tonnage-average grade model is uncertain as well as measurements or/and variogram model parameters. Therefore, use of the fuzzy tonnage-grade model instead of the crisp one is suggested.
Different fields of fuzzy systems application are mineral prospectivity mapping or assessment of mineral resources potential. Regarding copper deposits, the most recent papers worth mentioning are [27,28,29,30].
2. Materials and Methods
2.1. Ore Deposits and Copper Mining in Europe
Copper ore deposits include several types distinguished on the basis of the geological conditions of their occurrence or the mineralogical and petrographic characteristics of the ore. Hydrothermal deposits are most significant on a global scale, although magmatic and supergene deposits are locally important. The class of major deposits contains the following types [31]:
- ✓
- Porphyry;
- ✓
- Sediment-hosted (Kupferschiefer-type);
- ✓
- Red-bed;
- ✓
- Volcanogenic massive sulphide (VMS);
- ✓
- Magmatic sulphide deposits;
- ✓
- Sedimentary exhalative (SEDEX);
- ✓
- Epithermal;
- ✓
- Copper skarns (metasomatic);
- ✓
- Vein-style deposits (polymetallic veins);
- ✓
- Iron oxide copper-gold (IOCG);
- ✓
- Supergene.
The geographical distribution, geological conditions of occurrence, provenance, and mineral composition of the deposits make it possible to distinguish certain geological megastructures comprising vast copper-bearing provinces. The most famous are: the Pacific Ore Belt (Andean, North American Cordillera), Kazakhstan Altaids, Iberian Pyrite Belt, Kupferschiefer Province (Central Europe), Central African Copper Belt, Gawler Craton (Australia), and other lower-order metallogenic units. The global distribution of copper ore deposits is uneven. Among the continents, North and South America and Africa are richest. Europe has relatively large resources, although the prospects for further enlargement of the resource base are slight. The largest copper ore deposits in Europe are known from occurrences in the overlying Zechstein platform formations (Central Europe, Ural foreland) and in fold formations (copper-bearing pyrites in Spain and Portugal, copper-bearing pyrites of Caledonian orogens in Scandinavia, porphyry-type deposits in the Mediterranean belt of the Balkans). In European Union countries, copper ore deposits of economic importance have been identified in Poland, Sweden, Finland, Spain, Portugal, and Bulgaria. They include various types: sediment-hosted, porphyry, IOCG, and VMS.
Each type of deposit is characterized by individual qualitative and quantitative characteristics. Apart from geological features, deposits resources and ore quality are determined by economic factors and individual balance criteria. Grade tonnage of major copper deposits in the world by deposit type or source is illustrated in Figure 1.
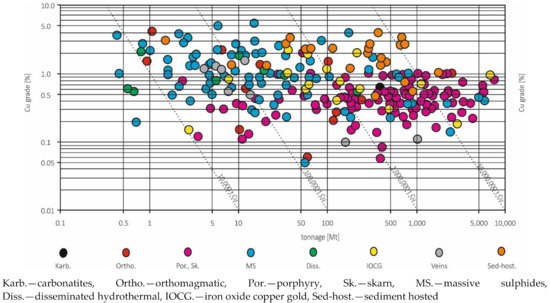
Figure 1.
Grade versus tonnage of major copper deposits, based on [32], simplified.
The copper first exploited by prehistoric humans was “native” copper [1]. Native copper deposits were readily available, and mining was essentially based on a collection of surface accumulations of copper between weathered or moraine deposits. Depletion of these deposits forced ancient miners to explore at greater depths. In the initial stages of the dynamic industrial development of Europe (at the turn of the nineteenth and twentieth centuries), copper mining was carried out only in a few countries, but with the passage of time it expanded to over a dozen and was exclusively limited to domestic extraction. Over time, shipments of imported copper, mainly from dependent territories, were important for meeting the demand and filling the capacity for copper smelting in the Old Continent. Official statistics on the mining production of copper ores have been kept since the beginning of the twentieth century [33]; however, the nature of metallurgical production publications makes it difficult to assess the amount of copper contained in mining ore. It must be remembered that the use of secondary copper raw materials was already common at the early stages of the development of copper metallurgy.
The European Union, established in the 1950s on the basis of the European Coal and Steel Community and the European Economic Community, initially provided a negligible amount of mining copper. Low levels of mining production were recorded in France, Germany, and Italy. With time, as the EU structures expanded, the addition of new countries, much richer in copper ore deposits, contributed to the increased importance of the EU in international markets, especially in Europe (see Table 1, Figure 2). The most significant additions have been those of Portugal and Spain (since January 1986), Finland and Sweden (since January 1995), Poland (since April 2004), and Bulgaria (since January 2007).

Table 1.
Mining copper production (in tons) in EU countries in selected years of the twentieth century [34,35,36].
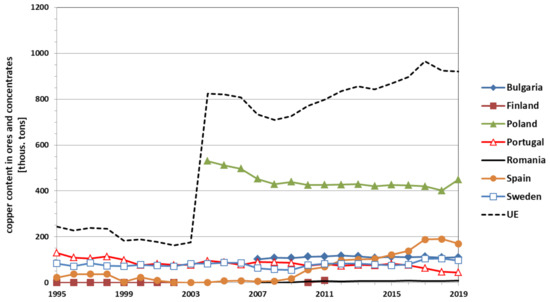
Figure 2.
Top copper mining producers in the EU in the years 1995–2019 [34,35,36].
2.2. Copper Resources and Reserves in the EU
No complete and harmonised dataset presents total estimates of EU copper resources and reserves. The Minerals4EU project is the only EU-level repository of some data for copper resources and reserves, but this information does not provide a complete picture for Europe. It includes estimates based on a variety of reporting codes used by different countries, and various types of non-comparable datasets. In addition, translation of Minerals4EU data through the application of the CRIRSCO template is not always possible, meaning that not all copper resource and reserve data on the national/regional level are consistent with the United Nations Framework Classification (UNFC) system [3]. Thus, a direct comparison of the resource base between EU countries is very difficult (see Table 2) (Minerals4EU, 2020, minerals4eu.eu).
Table 2.
Resources and reserves in the EU countries (minerals4eu.eu, [37]).
One significant copper producer and resource base holder in the EU, Bulgaria, is missing from Table 2. Bulgaria’s leading companies focused on copper ore mining and processing involves Assarel-Medet, Panagyurishte, Elatzite Med, and Chelopech Mining. The production of these firms serves as a basis for the development of non-ferrous metallurgy in the country. In the course of the Minerals4EU project, no questionnaires related to the copper reserve base were returned from Bulgaria; accordingly, there are no data regarding reserves. The total resources of Bulgaria’s largest deposits (Assarel, Orlovo Gnezdo, Prohorovo, Elatsite, Chelopech) equal approximately 820 Mt, with a weighted average grade of 0.37% Cu (usgs.gov; portergeo.com.au, [38]).
2.3. EU Copper Reserves in a Fuzzy Concept
Basic definitions in fuzzy set terminology include several concepts: linguistic variable, linguistic value, linguistic variable space, numerical variable space, fuzzy set, membership function, and degree of truth. A linguistic variable is one in which values are expressed as words or sentences in natural or constructed language. For example, in relation to the deposit description, this may include ore reserves and ore grade. The description in fuzzy nomenclature enables the use of a verbal characteristic, whereby a linguistic variable is assigned to descriptive linguistic values: large, medium, small, poor, rich, etc. A linguistic variable and value constitute a pair that forms the basis for fuzzy model description. The linguistic space of a variable is the set of all linguistic values used for its description; the numerical space of a variable is the set of all numerical values that can be assumed according to the realities and specifics of the modelled phenomenon. This imprecise description is implemented in terms of fuzzy sets with a membership function, where the terms “high”, “medium”, or “poor” are defined by quantities representing degree of truth, the so-called granules [39].
Assessment of primary copper resources in the EU countries is difficult, as many countries do not publish appropriate data. In Table 3, based on data in Table 2, copper reserves have been calculated on the basis of numerical specifications presented in terms of the JORC and NI 43–101 systems. The resources in Sweden reported in the FRB standard were not included in the calculations.
Table 3.
Copper reserves in the EU countries (bold) against the background of the richest countries in the world [40].
Apart from Poland, all of the above-mentioned EU countries have insignificant amounts, predominantly below 10 Mt, of copper reserves at their disposal. The arithmetic mean (40.7 Mt) of this selective population is strongly influenced by the extremely large quantity of the reserve base in Chile (200 Mt), which differs significantly from the other data. The median of the distribution (24.5 Mt), being independent of the extreme values, better describes the characteristics of the set of the reserves base.
The amounts of reserves for individual countries presented in the table, excluding estimation errors, are precisely defined; for example, the copper reserves of Poland amount to 23.1 Mt of metal. The presented amounts of copper reserves in various countries are specific values; it is not the fact of their estimation that is important here, but the attempt at their imprecise (descriptive) assessment. The median, as mentioned, is 24.5 Mt; thus, Poland’s copper reserves probably lie somewhere in the range of “average” resources. The descriptions “average”, “large”, and “small” represent degrees of truth for membership functions. Thanks to this qualitative assessment, it is known whether precisely defined reserves will be included in “average” or other sets. This rough descriptive information is referred to in the terminology of fuzzy sets as grains (granules) [39]. In order to enhance the precision of the assessment, the greater number is usually distinguished, and so in the analysed case the following scale of reserves can be proposed: very small, small, average, large, very large, and huge. In addition to the number of classes, it is also important to choose their width.
In fuzzy set theory, an element may belong to a set fully, partially, or not at all [41]. The degree of truth which defines the extent to which a given element belongs to fuzzy set A depends on the membership function (characteristic function). Taking into account the three cases of belonging, the following situations are possible:
- , the element is fully a member of fuzzy set A;
- , the element is not a member of fuzzy set A;
- , the element belongs only partially to fuzzy set A.
Construction of the membership function, in other words the appearance of a fuzzy set, is usually implemented in two ways: in the first, the shape of the fuzzy set is determined by an expert; in the second, it is created as a result of an approximation of a set of numerical values. To assess the volume of reserve bases in the EU countries, an approximation approach was considered and three classes were suggested. Within the reserve classes, resources were distinguished as small, medium, and large. The distinction of reserve classes was based on the percentiles 0.2, 0.5, and 0.8. The relevant membership function is illustrated in Figure 3, and the values of the function are shown in Table 4.
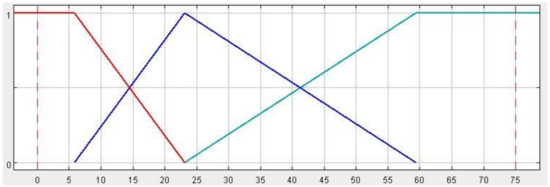
Figure 3.
Granules of copper reserve classes (abscissa axis in Mt) (FiS Pro 3.7 software plot).
Table 4.
Values of the membership function for the reserve base in the selected countries.
Some countries (e.g., Finland) are doubly qualified for the reserve classes, which is a consequence of difficulties in the unambiguous determination of sharp boundaries resulting from the conversion of a descriptive to a quantitative measure. The methodology of fuzzy sets uses the approximation that each set of reserves is, for example, small, but to a different degree of truth. For example, copper reserves in Finland are chiefly classified as small reserves, but also, to a lesser extent, as medium reserves. In relation to the most copper-rich countries in the world, the reserves in the EU countries are insignificant. When membership functions are defined in this way, only copper reserves in Poland are included in the average category.
Application of the fuzzy set approach makes it possible to consider other relationships that are impossible to speculate on in accordance with the principles of the classical set theory. It would appear interesting to describe the conjunctions of the sets “small AND medium copper reserves” (see Figure 4). Let A and B be fuzzy sets such that A,B ⊆ X; x is any element in the X universe (nonempty classical set). The intersection product of A and B is the fuzzy set A ∩ B, with the membership function defined as:
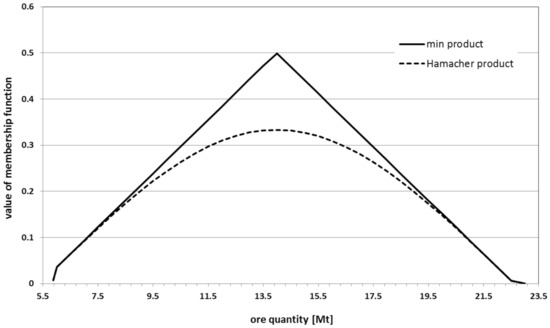
Figure 4.
Membership functions of the logical product “small AND medium copper reserves”.
It is worth adding here that the above set operation (min) does not always accurately reflect the intuitive properties of the performed operation. It seems appropriate to use an appropriate t-norm operator (intersection) of sets, e.g., the Hamacher product, defined as:
Copper reserves in the amount of 14.49 Mt are both small and medium, in equal proportions (equal to the value of the membership function).
In terms of reserves, the EU’s deposits are much smaller than the world’s largest deposits. The vast majority of EU deposits include marginal reserves of metal (see Figure 5); only two deposits include reserves exceeding 5 Mt of metal, the majority of them ranging from 250 to 1000 kt of metal. However, some deposits in the EU countries significantly exceed the quality parameters of global deposits, including all deposits mined underground in Poland (Głogów Głęboki Przemysłowy, Lubin-Małomice, Polkowice, Radwanice-Gaworzyce, Sieroszowice, Rudna), where the high metal content in the ore is forced by economics, and single deposits with very rich ore bodies in Portugal (Neves-Corvo) and Spain (Las Cruces).
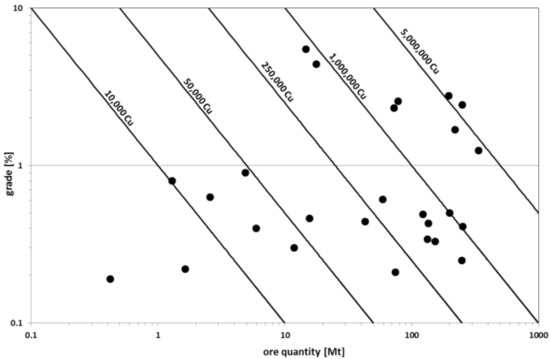
Figure 5.
Tonnage and copper grade characteristics of the EU’s largest deposits.
It is just as interesting to consider the EU deposit set in terms of fuzzy logic as it is to compare this set population with global potential. Both reserves and ore grade are diversified. The minimum value includes 0.42 Mt of reserves (Sahakoski in Finland, deposit with Ni-Co-Cu mineralisation) and 0.08% of copper content (Aitik in Sweden, polymetallic with dominant Zn-Ag-Pb mineralisation) and a maximum of 337 Mt of reserves (Lubin-Małomice in Poland) and 5.47% of copper content (Las Cruces in Spain). The arithmetic mean for the reserves is 101.37 Mt at 1.14% Cu. For the set encompassing all copper deposits in the EU countries, five classes of granules have been proposed (see Figure 6 and Figure 7) for both volume of reserves and ore grade. Limits of membership functions were determined by percentile values and covered the following categories (tonnage/grade, respectively):
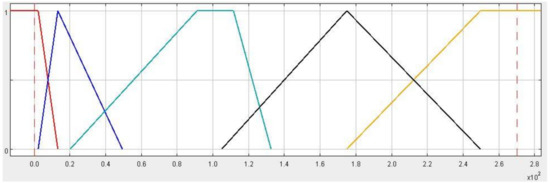
Figure 6.
Granules of the EU copper deposit reserve classes (abscissa axis in Mt) (FiS Pro 3.7 software plot).
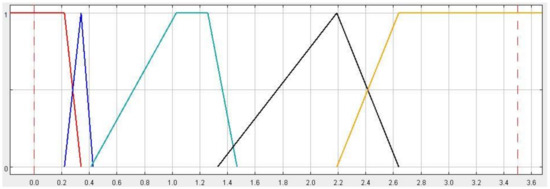
Figure 7.
Granules of the EU copper deposit grade classes (abscissa axis in %) (FiS Pro 3.7 software plot).
- ✓
- Very small/very low (semi-trapezoidal membership function, percentiles 0.1 and 0.25);
- ✓
- Small/low (triangular membership function, percentiles 0.1, 0.25, and 0.4);
- ✓
- Medium/medium (trapezoidal membership function, percentile 0.35, arithmetic mean ± 10%, percentile 0.65);
- ✓
- Large/high (triangular membership function, percentiles 0.6, 0.75, 0.9);
- ✓
- Very large/very high (semi-trapezoidal membership function, percentiles 0.75 and 0.9).
Another interesting aspect, similarly impossible to consider using classical logic sets, is the assessment of the extent to which a given deposit is both, for example, large or very large and simultaneously medium- or high-grade ore. The operators MAX and the algebraic sum are used for this purpose. Again, let A and B be fuzzy sets such that A,B ⊆ X; x is any element in the X universe. The union of A and B is the fuzzy set A ∪ B, with the membership function defined as:
while the algebraic sum is defined as:
The constraint “large or very large” is met by 11 of 27 analysed deposits (see Table 5), while the strength of the set with medium or high ore grade was determined by the condition of the volume of reserves. Only 6 of 11 deposits are of medium or high ore grade. The Sieroszowice deposit (qualified by its ore quality as a very high-grade deposit) and the Assarel, Prohorovo, Elatsite, and Kevitsa deposits with below-medium quality were not included in this category.
Table 5.
Values of membership functions and logical operators for sets “large OR very large reserve tonnage”, “medium OR high ore grade”, “large OR very large reserve tonnage AND medium OR high ore grade”.
The values of MIN operator and Hamacher product for sets of large or very large tonnage and simultaneously medium or high ore grade are presented in Table 6.
Table 6.
Values of logical operators for sets of “large OR very large reserve tonnage AND medium OR high ore grade”.
For the MIN operator, the final set of deposits that comply with requirements with the highest degree of truth includes the following deposits: Lubin-Małomice (100%), Głogów Głęboki (48.9%), Rudna (41.9%), Aljustrel (14.5%), Rio Tinto (12.9%), Orlovo Gnezdo (3.2%). The same hierarchy is represented by the Hamacher product, although with slightly different membership function values.
Use of the MIN operator may result in some loss of information, as this operator is not sensitive enough. Membership in the set “large OR very large reserves AND medium OR high ore grade” is determined by the lesser of the membership function and the ore grade (in the analysed case, the latter). Taking into account the slightly modified condition that the deposits of at least medium ore grade are crucial (in which case all high and very high ore grade deposits are certainly at least medium), the Sieroszowice deposit is added to the final set of results.
3. Discussion
The share of mining production of the EU countries in relation to total European production has increased in the last two decades from approximately 12.5 to almost 53.5%, and thus has increased more than fourfold. In relation to global copper mining production, the importance of the EU countries is slight. EU production, from a negligible 1.4% in 2001, has grown to slightly more than 5%, but certainly does not hold a leading position within the global supply structure.
The EU’s own mining production in meeting internal demand for raw copper is insufficient. Production of refined copper in EU countries, based on supplies from domestic mining production, increased from 16.4 to 33.7% in the period 1995–2018 (see Table 7). With the increase in its own sources in terms of smelters and refineries, the quota of production from secondary copper raw materials has been cut in half, from almost 61%, over the past two decades. Approximately 35–40% of copper concentrates come from outside the EU.
Table 7.
Comparison of refined copper production (in tons) and feed sources in the EU countries in 1995–2019, data according to [34].
To answer the question asked in the paper title, the resource base of primary copper raw materials, which is not particularly revealing, is small in the EU countries (Table 4). Its approximation in terms of fuzzy logic confirms its size. According to the classes taken into consideration, reserves in Portugal, Spain, Bulgaria and Sweden are definitely small. The membership function reaches the value 1, which means full membership, to the set “small reserves”. In relation to Finland, the membership function values are distributed between two classes—a small and a medium one. However, the degree indicating membership to the set of medium reserves is minor. Given this state of affairs, Poland, where the largest copper resources and reserves within EU countries are concentrated, plays a dominant role and its reserves base is fully included in the medium class. It does not mean now that the membership function objectively characterizes when reserves are either “small” or “medium”. Membership of a given reserve class to the specific set will depend on how the membership function is defined.
The total reserve base of the EU countries, 40.9 Mt of copper, would place the union in the medium and large reserves class with the membership function values of 0.510 (medium class) and 0.490 (large class), respectively. In descriptive terminology, this share appears to be at least average (medium), and reserves are more medium than large. This categorisation is confirmed by the actual figures in the reported statistics of geological surveys. No European Union countries are listed in the current statistics of the United States Geological Survey (USGS), which refer to the global copper resource base; however, until 2015, resources of Poland were included. The main countries with the largest metal reserves are listed in Table 8.
Table 8.
Copper reserves by country (Mt) [40,42,43,44,45,46].
The total reserve base of the EU countries, approximately 41 Mt of copper, improves the image and importance of the European community against the background of the global market, although this share constitutes less than 5% of global reserves. Assuming the hypothetical necessity for the EU to cover its demand for copper raw materials exclusively from its own primary sources (without secondary production), and given the current state of reserves and consumption (approximately 3.3 Mt/year), the static sufficiency would equate to approximately 12 years, which is neither a particularly optimistic result nor a cause for exaggerated fears. Coverage from the EU’s own primary supply of approximately one-third of the demand for copper raw materials sufficient for the production of refined copper is not a cause for concern; however, a much more significant cause for uncertainty is the concentration of production in only a few countries, with Poland playing the dominant role. The share of the EU’s own mining production fluctuates around 27% of its consumption level.
Apart from the reserves themselves, the quality of the mineral in the deposit is important from the operational point of view. A comparison of copper reserves and grades for the 10 largest developed deposits (active mines) in the world and the 10 largest underdeveloped deposits (projects scheduled for completion), on one hand, and copper deposits in the EU countries on the other, is presented in Figure 8.
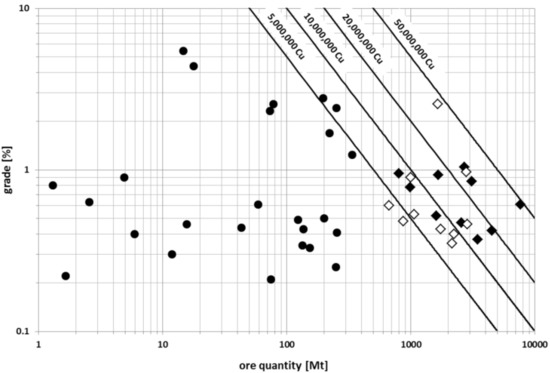
Figure 8.
Tonnage and copper grade relationships within the largest global copper deposits and within EU deposits (black dots—EU countries; black rhombs—global, developed; unfilled rhombs—global, under development).
Individual copper deposits in the EU countries are usually minor; even the largest deposits of tonnage reserves are small in comparison to those of the world as a whole. Deposits from the predominant group rarely exceed 5 Mt of metal, although the quality of the ore usually exceeds the standards of global giants. To a large extent, this is the result of the deposits exploited in Poland, where the underground extraction method requires much higher metal content than in the commonly used open-pit method.
Virtually, many phenomena are described in an imprecise and ambiguous way. Fuzzy logic is an attempt to describe reality in a way that imitates human reasoning. Intuitively, the terms “large/small resources” or “low/high grade” are devoid of precision. The main problem is to define the boundary between the concepts of large/small, high/low and other similar ones. Obviously, these boundaries are not gradual. Boundary in a fuzzy set theory is characterized by the membership function. Values of the membership function describing, for example, a volume of resources, may fulfil the claim of membership to a “large” or “small” resource class to a different degree. Such gradation: not included in the fuzzy set (no member), fully included (full member), partially included (fuzzy member), cannot be considered in the classical set theory. The proposed description of reality in a qualitative (descriptive) form using the fuzzy approach may be useful wherever a precise mathematical description is difficult to apply. What was previously a matter of intuition now is characterized mathematically by establishing boundaries and degrees of membership. It seems that there are many possibilities of various applications in geology and mining. The applied logical operators may be functional from the decision-making point of view, e.g., the qualification of copper deposits for development. Intersection (product) operators and logical unions enable a joint assessment of parameters, e.g., “large reserves” and/or “high ore grade”. The fuzzy analysis allows identifying the extent to which the given criteria are met. For example, the operator MIN is the most optimistic operator from the decision-making point of view, whereby the rules for assigning parameters to two (or more) classes of sets are less demanding and involve lower standards for the parameters. Contrastingly, the operator MAX is the least optimistic among other s-norm operators. In addition, practical hybrid (compensation) operators connect the AND operator more or less with the OR operator [47] according to the needs of the decision-maker.
Funding
This research was funded by AGH University of Science and Technology, Faculty of Geology, Geophysics and Environment Protection; subsidy number: 16.16.140.315.
Institutional Review Board Statement
Not applicable.
Informed Consent Statement
Not applicable.
Data Availability Statement
No new data were created or analyzed in this study. Data sharing is not applicable to this article.
Conflicts of Interest
The author declares no conflict of interest.
References
- Jovanović, B. The Origin of Copper Mining in Europe. Sci. Am. 1980, 242, 152–167. [Google Scholar] [CrossRef]
- AngloAmerican. Ore Reserves and Mineral Resources Report; AngloAmerican plc: London, UK, 2015; p. 56. [Google Scholar]
- Glencore. Resources & Reserves as at 31 December 2019; Glencore: Baar, Switzerland, 2020; p. 71. [Google Scholar]
- European Commission. Study on the Review of the List of Critical Raw Materials. Non-Critical Raw Materials Factsheets; European Commission: Brussels, Belgium, 2017; pp. 77–92. [Google Scholar]
- Hammarstrom, J.M.; Zientek, M.L.; Parks, H.L.; Dicken, C.L. U.S. Geological Survey Global Copper Mineral Resource Assessment Team. Assessment of Undiscovered Copper Resources of the World, 2015 (v1.1, 24 May 2019); 2018–5160; USGS: Washington, DC, USA, 2019; p. 644.
- Oszczepalski, S.; Speczik, S.; Małecka, K.; Chmielewski, A. Prospective copper resources in Poland. Gospodarka Surowcami Mineralnymi Miner. Resour. Manag. 2016, 32, 5–30. [Google Scholar] [CrossRef][Green Version]
- Reuter, M.A.; Kojo, I.V. Copper: A Key Enabler of Resource Efficiency. World Metall. Erzmetall 2014, 67, 46–53. [Google Scholar]
- Huysman, S.; Sala, S.; Mancini, L.; Ardente, F.; Alvarenga, R.A.; de Meester, S.; Mathieux, F.; Dewulf, J. Toward a systematized framework for resource efficiency indicators. Resour. Conserv. Recykling 2015, 95, 68–76. [Google Scholar] [CrossRef]
- Kitajima, T.; Sawanishi, H.; Taguchi, M.; Torihara, K.; Honma, O.; Mishima, N. A Proposal on a Resource Efficiency Index for EEE. Procedia CIRP 2015, 26, 607–611. [Google Scholar] [CrossRef]
- Spuerk, S.; Drobe, M.; Lottermoser, B.G. Evaluating resource efficiency at major copper mines. Miner. Eng. 2017, 107, 27–33. [Google Scholar] [CrossRef]
- Pham, T.D. Grade Estimation Using Fuzzy-Set Algorithms. Math. Geol. 1997, 29, 291–305. [Google Scholar] [CrossRef]
- Luo, X.; Dimitrakopoulos, R. Data-Driven Fuzzy Analysis in Quantitative Mineral Resource Assessment. Comput. Geosci. 2003, 29, 3–13. [Google Scholar] [CrossRef]
- Bárdossy, G.; Fodor, J. Assessment of the Completeness of Mineral Exploration by the Application of Fuzzy Arithmetic and Prior Information. Acta Polytech. Hung. 2005, 2, 15–31. [Google Scholar]
- Emery, X.; Ortiz, J.M.; Rodríguez, J.J. Quantifying uncertainty in mineral resources by use of classification schemes and conditional simulations. Math. Geol. 2006, 38, 445–464. [Google Scholar] [CrossRef]
- Tutmez, B. An uncertainty oriented fuzzy methodology for grade estimation. Comput. Geosci. 2007, 33, 280–288. [Google Scholar] [CrossRef]
- Tutmez, B.; Tercan, A.E.; Kaymak, U. Fuzzy Modelling for Reserve Estimation Based on Spatial Variability. Math. Geol. 2007, 39, 87–111. [Google Scholar] [CrossRef]
- Tutmez, B. Use of hybrid intelligent computing in mineral resources evaluation. Appl. Soft Comput. 2009, 9, 1023–1028. [Google Scholar] [CrossRef]
- Dag, A.; Mert, B.A. Evaluating Thickness of Bauxite Deposit Using Indicator Geostatistics and Fuzzy Estimation. Resour. Geol. 2009, 58, 188–195. [Google Scholar] [CrossRef]
- Taboada, J.; Rivas, T.; Saavedra, A.; Ordóñez, C.; Bastante, F.; Giráldez, E. Evaluation of the reserve of a granite deposit by fuzzy kriging. Eng. Geol. 2008, 99, 23–30. [Google Scholar] [CrossRef]
- Tahmasebi, P.; Hezarkhani, A. Application of Adaptive Neuro-Fuzzy Inference System for Grade Estimation; Case Study, Sarcheshmeh Porphyry Copper Deposit, Kerman, Iran. Aust. J. Basic Appl. Sci. 2010, 4, 408–420. [Google Scholar]
- Elmas, N.; Şahın, U. Computation of Grade Values of Sediment-Hosted Barite Deposits in Northeastern Isparta (Western Turkey). Turk. J. Earth Sci. 2013, 22, 1–13. [Google Scholar] [CrossRef]
- Muhammad, K.; Glass, H.J. Modelling short-scale variability and uncertainty during mineral resource estimation using a novel fuzzy estimation technique. Geostand. Geoanal. Res. 2011, 35, 369–385. [Google Scholar] [CrossRef]
- Li, P.; Chen, X.; Qu, X.; Xu, Q. The Evaluation of Mineral Resources Development Efficiency Based on Hesitant Fuzzy Linguistic Approach and Modified TODIM. Hindawi Math. Probl. Eng. 2018, 2018, 1808426. [Google Scholar] [CrossRef]
- Krzak, M.; Panajew, P. Qualitative description of metal ore deposits parameters based on selected fuzzy logic operators on the example of a KGHM Polish Copper, S.A. copper-silver mine. Arch. Min. Sci. 2019, 64, 261–277. [Google Scholar] [CrossRef]
- Ozkan, E.; Iphar, M.; Konuk, A. Fuzzy logic approach in resource classification. Int. J. Min. Reclam. Environ. 2019, 33, 183–205. [Google Scholar] [CrossRef]
- Soltani-Mohammadi, S.; Soltani, A.; Sohrabian, B. Fuzzy tonnage-average grade model based on extension principle. J. Min. Environ. 2019, 10, 659–666. [Google Scholar] [CrossRef]
- Zhang, N.; Zhou, K.; Du, X. Application of fuzzy logic and fuzzy AHP to mineral prospectivity mapping of porphyry and hydrothermal vein copper deposits in the Dananhu-Tousuquan island arc, Xinjiang, NW China. J. Afr. Earth Sci. 2017, 128, 94–96. [Google Scholar] [CrossRef]
- Pazand, K.; Hezarkhani, A. Predictive Cu porphyry potential mapping using fuzzy modelling in Ahar-Arasbaran zone, Iran. Geol. Ecol. Landsc. 2018, 2, 229–239. [Google Scholar] [CrossRef]
- Cui, C.-Q.; Wang, B.; Zhao, Y.-X.; Wang, Q.; Sun, Z.-M. China’s regional sustainability assessment on mineral resources: Results from an improved analytic hierarchy process-based normal cloud model. J. Clean. Prod. 2019, 210, 105–120. [Google Scholar] [CrossRef]
- Yon-Ho, K.; Kwang, U.C.; Ryong-Kil, R. Application of fuzzy logic and geometric average: A Cu sulfide deposits potential mapping case study from Kapsan Basin, DPR Korea. Ore Geol. Rev. 2019, 107, 239–247. [Google Scholar] [CrossRef]
- British Geological Survey. Copper Mineral Profile; Natural Environment Research Council: Nottingham, UK, 2007; p. 28. [Google Scholar]
- Rötzer, N.; Schmidt, M. Decreasing Metal Ore Grades—Is the Fear of Resource Depletion Justified? Resources 2018, 7, 88. [Google Scholar] [CrossRef]
- Julihn, C.E.; Meyer, H.M. Copper. In Minerals Yearbook 1932–1933; Kiessling, O.E., Ed.; United States Government Printing Office: Washington, DC, USA, 1933; pp. 27–52. [Google Scholar]
- World Bureau of Metal Statistics. World Metal Statistics, Yearbook 2020; World Bureau of Metal Statistics (WBMS): Herts, UK, 2020; pp. 24–36. [Google Scholar]
- European Commission. European Minerals Yearbook; Roskill Information Services Ltd.: London, UK, 1995; pp. 10–17. [Google Scholar]
- European Commission. European Minerals Yearbook, 2nd ed.; Bureau de Recherches Géologiques et Minières: Luxembourg, 1998; pp. 43–50. [Google Scholar]
- Polish Geological Institute—National Research Institute. Mineral Resources of Poland state as 31.12.2019; Polish Geological Institute—National Research Institute (PIG-PIB): Warsaw, Poland, 2020; pp. 57–59.
- CSA Global. Mineral Resource and Mineral Reserve Update; NI 43-101; CSA Global: Horsham, UK, 2020; pp. 92–128. [Google Scholar]
- Zadeh, L.A. Fuzzy sets and information granularity. In Advances in Fuzzy Systems-Applications and Theory, Fuzzy Sets, Fuzzy Logic and Fuzzy Systems; Klir, G.J., Yuan, B., Eds.; World Scientific: Singapore, 1996; Volume 6, pp. 433–448. [Google Scholar]
- Flanagan, D.M. Copper. In USGS Mineral Commodity Summaries; USGS Publ.: Washington, DC, USA, 2020; pp. 52–53. [Google Scholar]
- Zadeh, L. Fuzzy sets. Inf. Control 1965, 8, 338–353. [Google Scholar] [CrossRef]
- Edelstein, D.L. Copper. In USGS Mineral Commodity Summaries; USGS Publ.: Washington, DC, USA, 1996; pp. 50–51. [Google Scholar]
- Edelstein, D.L. Copper. In USGS Mineral Commodity Summaries; USGS Publ.: Washington, DC, USA, 2001; pp. 52–53. [Google Scholar]
- Edelstein, D.L. Copper. In USGS Mineral Commodity Summaries; USGS Publ.: Washington, DC, USA, 2006; pp. 56–57. [Google Scholar]
- Edelstein, D.L. Copper. In USGS Mineral Commodity Summaries; USGS Publ.: Washington, DC, USA, 2011; pp. 48–49. [Google Scholar]
- Brininstool, M. USGS Mineral Commodity Summaries; USGS Publ.: Washington, DC, USA, 2016; pp. 54–55.
- Zimmermann, H.-J.; Zysno, P. Latent connectives in human decision making. Fuzzy Sets Syst. 1980, 4, 37–51. [Google Scholar] [CrossRef]


Publisher’s Note: MDPI stays neutral with regard to jurisdictional claims in published maps and institutional affiliations. |
© 2021 by the author. Licensee MDPI, Basel, Switzerland. This article is an open access article distributed under the terms and conditions of the Creative Commons Attribution (CC BY) license (http://creativecommons.org/licenses/by/4.0/).