Article

The Impact of Metal Mining on Global Water Stress and Regional Carrying Capacities—A GIS-Based Water Impact Assessment

Environmental Science Center, University of Augsburg, Universitaetsstr. 1a, 86159 Augsburg, Germany
Resources 2021, 10(12), 120; https://doi.org/10.3390/resources10120120
Submission received: 23 September 2021 / Revised: 14 November 2021 / Accepted: 15 November 2021 / Published: 26 November 2021

Abstract

:
The consumption of freshwater in mining accounts for only a small proportion of the total water use at global and even national scales. However, at regional and local scales, mining may result in significant impacts on freshwater resources, particularly when water consumption surpasses the carrying capacities defined by the amount of available water and also considering environmental water requirements. By applying a geographic information system (GIS), a comprehensive water footprint accounting and water scarcity assessment of bauxite, cobalt, copper, iron, lead, manganese, molybdenum, nickel, uranium and zinc as well as gold, palladium, platinum and silver was conducted to quantify the influence of mining and refining of metal production on regional water availability and water stress. The observation includes the water consumption and impacts on water stress of almost 2800 mining operations at different production stages, e.g., preprocessed ore, concentrate and refined metal. Based on a brief study of mining activities in 147 major river basins, it can be indicated that mining’s contribution to regional water stress varies significantly in each basin. While in most regions mining predominantly results in very low water stress, not surpassing 0.1% of the basins’ available water, there are also exceptional cases where the natural water availability is completely exceeded by the freshwater consumption of the mining sector during the entire year. Thus, this GIS-based approach provides precise information to deepen the understanding of the global mining industry’s influence on regional carrying capacities and water stress.

1. Introduction

Driven by growing demand and technological development, the consumption of natural resources has been increasing significantly within recent decades and is still expected to grow in the future. In particular, high-technology applications require a large variety of minerals and metals, which in some cases are referred to as critical raw materials due to increasing concerns about their limited availability and potential supply shortages. Hence, primarily during the last two decades, criticality assessment methods have been developed and constantly evolved to screen mineral commodity markets in order to identify raw materials of concern [1,2]. However, the global expansion of resource extraction, particularly mining and refining of metals, is also characterized by environmental concerns as the mining and refining of technology-relevant metals have significant impacts on ecosystems. For instance, the construction and operation of mining facilities may lead to long-term impacts such as loss of vegetation and faunal habitats, modification of landforms, changes in soil profiles or modifications to surface and subsurface drainage [3]. As a consequence, the latest criticality assessment methods of raw materials have been extended by environmental criteria to determine the ecological impacts of mining activities as well [4]. Besides energy consumption and the release of greenhouse gas emissions, particularly addressing climate change effects, recent studies emphasized the impacts resulting from the water consumption of the mining industry. Water-related impacts of individual mining operations affecting hydrological systems adjacent to the excavation sites are especially of increasing concern as local freshwater sources are essential for providing considerable amounts of freshwater for both human purposes and environmental needs.
Ore mining and ore processing basically consume large quantities of water. For instance, mining operations require large pumping, treating, heating and cooling water systems, which are intense energy consumers as well [5]. On a global and even national scale, however, the consumption of freshwater for mining and refining activities accounts for a small portion of the overall water use. Even in relatively dry, mining-intensive countries such as Australia, Chile and South Africa, mine water consumption accounts for only 2–4.5% of national water demand [6,7]. However, on a local level, significant impacts on freshwater resources can be observed, notably affecting both the quantity and quality of freshwater availability within the entire mining area. For example, acid rock drainage, leaks from tailings, waste rock dumps or direct disposal of tailings into waterways may contaminate surface and groundwater bodies [8,9,10,11,12]. Due to the fact that the global mining industry is increasingly confronted with declining ore grades, the industry is forced to access deposits and ore bodies of lower quality, hence requiring larger volumes of water to be utilized per ton of metal produced [13,14]. As a consequence, mining-related water consumption can put severe strains on local water supplies by competing with other water consumers, especially in areas characterized by significant water scarcity. Furthermore, particularly due to climate change effects, many water-scarce areas as well as many mining operations in particular are expected to be confronted with increasing water stress conditions within the next two decades [15,16]. Consequently, the mining industry will have to address these challenges by intensifying water management activities, taking into account both mining-related water supply risks as well as water shortages affecting the entire mining area that may likely result in future water conflicts [17,18,19,20].
Owing to the fact that water is a substantial resource for mining operations [21], the mining sector is a large industrial water user that is growing rapidly all over the world. Although the usage of water in the mining industry shares many of the characteristics of other industrial water consumers, it has some distinctive features. For example, mining projects cannot freely choose where to operate since mining is limited to locations abundant in geologically concentrated minerals and ore bodies which are economically and technically feasible. Consequently, mining companies often operate in sensitive or challenging environments facing the full spectrum of ecological and hydrological contexts, e.g., in arid regions of central Australia or the Chilean Andes, the tropical and sub-tropical areas in Indonesia and the sub-arctic areas of Finland, Canada or Russia [15,22].
Therefore, in recent years intense research has been conducted to improve the detailed understanding of the complex interactions between the mining industry and its wide range of impacts on freshwater resources. Primarily within the last decade, great efforts have been made to quantify mining-related water use, mainly based on life cycle assessment (LCA) studies focusing on selected metals and minerals including different settings of usually applied mining and refining methods (cf. [23,24,25,26,27,28,29,30,31,32,33,34,35,36,37]). Data on mining-related inventories of water use provided by these studies are primarily based on case studies but are increasingly sourced from sustainability reports provided by mining companies as well. However, despite detailed case studies and growing data availability, robust information on specific water consumption in the extractive industry as well as a global overview of the intensity of the impacts of mining on regional environments and water resources in particular are still lacking.
With regard to this, the article addresses the following question: To what extent is the global mining industry exposed to water stress and what impact does industrial mining have on water resources at global and regional scales? It also takes into account mining’s influence on the carrying capacity of regional hydrological systems, which affects sufficient supply of freshwater at a local scale. However, limited water resources are also of rising concern to the mining industry as well, particularly as water shortages may potentially affect the production and supply of global raw material markets. This in turn leads to economic risks for global markets, whose demand for raw materials and mining commodities is constantly increasing. In conclusion, a deeper understanding of the complex interactions between natural resource extraction and potential water conflicts is of rising importance to both achieve secure supplies of raw materials to global and national markets as well as to establish sustainable management and development strategies in the mining industry.
With the example of 14 selected mineral commodities—namely bauxite, cobalt, copper, iron, lead, manganese, molybdenum, nickel, uranium and zinc and the precious metals gold, palladium, platinum and silver—a comprehensive water footprint assessment has been conducted in this survey by applying established methods of LCA and geographic information systems (GIS) to identify the water consumption of the global mining industry as well as the intensity and relevance of mining-related water stress at a regionally explicit level. Based on this approach (Figure 1 in Section 2.3), more precise information for decision makers in business and politics can be provided, thereby helping to understand the ‘water–resource nexus’ and the complex interactions between global raw materials markets and their impacts at the local level, especially affecting regional carrying capacities.

2. Materials and Methods

To gain deeper knowledge of how the global mining industry interacts with local water resources, a brief overview of the established water impact assessment methods being applied is given in this section. Particularly methods and indicators used for water stress and water scarcity determination, also referred to as ‘water footprint assessment’, are introduced. Furthermore, the GIS model provided for conducting a comprehensive water footprint assessment is introduced as well.

2.1. Water Footprint Assessment

In recent years, several assessment tools and water scarcity metrics have been developed and introduced to assess water consumption and the resultant impacts on water availability [38], whereof the most prominent will be introduced briefly in the following sections. The most widely used water assessment tool in research as well as in the industry is the ‘water footprint methodology’ applying the water scarcity metric ‘water stress index’. Even though different assessment approaches have been established under this terminology, the most important versions are those aligning with international standards of life cycle analysis, especially regarding ISO 14040 [39] and ISO 14046 [40]. ISO 14046 in particular addresses water impact assessment, providing information about principles, requirements and guidelines for conducting and reporting water footprint assessments of products, processes and organizations. These standards have been significantly influenced and improved by years of scientific debate. Methods for quantifying water consumption or water use as well as measuring water-specific impacts associated with agricultural and industrial production systems have especially been advanced notably over the past two decades, particularly by the introduction and development of the water footprint methodology.
For instance, John Anthony Allan initially introduced the concept of ‘embodied water’ and ‘virtual water’ in 1993 to describe the water consumption needed to produce goods and services (cf. [41,42]). These concepts were consequently advanced when Arjen Hoekstra in 2003 established the term ‘water footprint’, additionally taking into account the geographical and temporal characteristics of the virtual water use [34,43]. As a result, the methods and data sources available to perform water footprint assessments have been notably developed, particularly through standardization efforts by the Water Footprint Network [44,45]. All these continuous efforts finally resulted in standardized assessment methods such as ISO 14046 mentioned above.
Overall, profound improvements have been made in the development of various environmental as well as water impact assessment methods, even though the application of these methods has primarily been focused on understanding the environmental impacts resulting from water consumption in the production of water-intensive commodities from agriculture [34]. These efforts have provided a wide range of robust data concerning the quantification of water use in agricultural production at local and global scales as well as along agricultural supply chains. However, while studies on freshwater use and their impacts have primarily focused on agricultural production as the major water-consuming sector, water use in industrial production has gained momentum in recent years and has been discussed with more emphasis [46]. Thus, the assessment of industrial water consumption and its consequences is highly needed, particularly in the field of resource extraction, which is often conducted in regions characterized by water stress or even water scarcity. Unfortunately, only few studies have considered the interactions between the mining industry and water resources on a regional scale and upscaled these findings to a global level to provide further information on water use in the mining sector operating worldwide. However, as these interactions are often complex and site-specific, a combined understanding of the local water contexts of individual mining sites as well as the global perspective is required before associated risks can be adequately addressed [16].

2.2. Water Stress and Water Scarcity Determination

In the context of their socioeconomic development, many countries and regions are increasingly facing challenges related to water. Physical water shortages and water quality deterioration in particular are among the problems of growing concern and thus requiring further action to be addressed [47]. In general, probably the most widely used indicator measuring water stress and water scarcity is the ‘Falkenmark indicator’, introduced by Falkenmark et al. [48]. It is basically defined as ‘the fraction of the total annual runoff within a given area potentially available for human use, resulting in a certain volume of water available per person calculated in m3 per capita and year’ [49]. According to Falkenmark et al., a value of 1700 m3 per capita and year of renewable freshwater was originally proposed as the threshold for water scarcity—i.e., when approaching the threshold of 1700 m3 per capita and year, increasing water conflicts are to be expected, also defined as ‘water stress’. Consequently, increasing water stress usually leads to intensified competition for water amongst the users within in a particular region, also referred to as social or economically induced water stress [49,50,51].
Since the introduction of the Falkenmark indicator, a variety of additional indicators have been developed and proposed for characterizing water use impacts, particularly within the LCA framework, which is the most widely used approach to assess the environmental impacts of production systems. However, the water stress index (WSI) and the water scarcity index or water scarcity footprint (WSFP) are amongst the most prominent and well-established indicators. For example, water stress, which is introduced and applied in LCA as a water stress indicator, is commonly defined as the ratio of total annual water use (WU) in relation to hydrological water availability (WA). According to Vanham et al. [52], WA is usually measured as freshwater renewal rate or runoff, whereof a specific volume of water representing environmental water needs can be deducted occasionally. Particularly in the latter case, this proportion of water availability is commonly referred to as the environmental flow requirement (EFR) or environmental water requirement (EWR). WU is typically measured as either gross or net water abstraction from water sources. If water withdrawal is used as an indicator of WU (=gross water abstraction), the resultant WSI is termed the ‘withdrawal-to-availability ratio’ (WTA), whereas in the case that water consumption (also termed blue water footprint according to Hoekstra et al. [44,45]) is used as an indicator of WU (=net water abstraction), the resultant WSI is termed the ‘consumption-to-availability ratio’ (CTA) [47]. Depending on the calculation model and data availability, WSI, WU and WA are generally calculated on an annual or intra-annual basis, usually considering monthly periods. In conclusion, commonly used WSI indicators are calculated as WTA or CTA by the following equation:
WTA i / CTA i = j WU ij WA i
and when taking into account EWR, as follows:
WTA i   ( EWR ) / CTA i   ( EWR ) = j WU ij WA i   EWR i
WTA and CTA basically consist of a hydrological (WA) and a socioeconomic (WU) component, quantifying annual water availability (WAi) within a particular area or watershed, i, and water use for different users, j (WUij), from industry, energy supply, mining, agriculture and households for a particular watershed, i. Moreover, WTA and CTA are often demarcated by defined threshold levels. According to Falkenmark and Gunnar [53], Raskin et al. [54] and Rockström et al. [55], a defined spatial area, e.g., a country or watershed, is termed ‘severely water scarce’ and thus highly water-stressed if the ratio of annual withdrawal or consumption to annually available water in the given area exceeds 40%. If this ratio is within 20–40% the area is considered as ‘water scarce’, and with a ratio of 10–20% as ‘moderate water scarce’; if the ratio lies below 10% the area is described as ‘low water scarce’. A comparative review of Vanham et al. [52] showed that these threshold levels were also adopted by the UN report ‘Comprehensive assessment of the freshwater resources of the world’ [56] and are widely used in the literature (cf. [57,58,59,60,61,62]). In addition, the European Commission (EC) and the European Environmental Agency (EEA) also applied these threshold levels in their Water Exploitation Index (WEI) [63,64].
However, Pfister et al. [65] introduced and established the water stress index for water impact assessment in LCA by advancing the calculation of WSI. Ranging from 0 to 1, this modified WSI serves as a characterization factor to calculate the water scarcity index as a midpoint category entitled ‘water deprivation’. This also includes an impact factor termed ‘water scarcity footprint’ (WSFP), which is defined as WU multiplied by the WSI of a particular area, thus weighting water consumption with a region-specific water scarcity index [66].
Despite the fact that there has been criticism and debate about the strengths and weaknesses of the conceptualization of this type of impact category, e.g., by Hoekstra [67] and Pfister et al. [68], it is still the most widely established approach to assess water impacts within LCA [34]. Slightly modified conceptualizations and categories of water impact assessment, including WSI, have recently been applied by Gassert et al. [69], providing calculation data on WA, WU and WSI consisting of various indicators to describe water risks. However, contrary to Pfister et al., Gassert et al. termed WSI as Baseline Water Stress (BWS), measuring the ratio of total annual water withdrawal (WUwithdrawal) in relation to the average annual available water (WAmean(1950,2010)) using a long-term data series (1950–2010) to reduce the effect of multi-year climate cycles. Additionally, while Pfister et al. score WSI from 0 to 1, Gassert et al. score WSI between 0 and 5. For example, raw WSI values, r, were normalized using the following equation [69,70]:
WSI BWS = max   ( 0 , min ( 5 ,   ln ( r ) ln ( 0 , 1 ) ln ( 2 ) + 1 ) ) ,
Gassert et al. defined five WSIBWS categories between 0 and 5 (with ≤1 = lowest category with less than or equal to 10% of WTA or CTA and r ˃ 4 = highest category with higher than 80% of WTA or CTA) including the following threshold levels to determine WSIBWS:
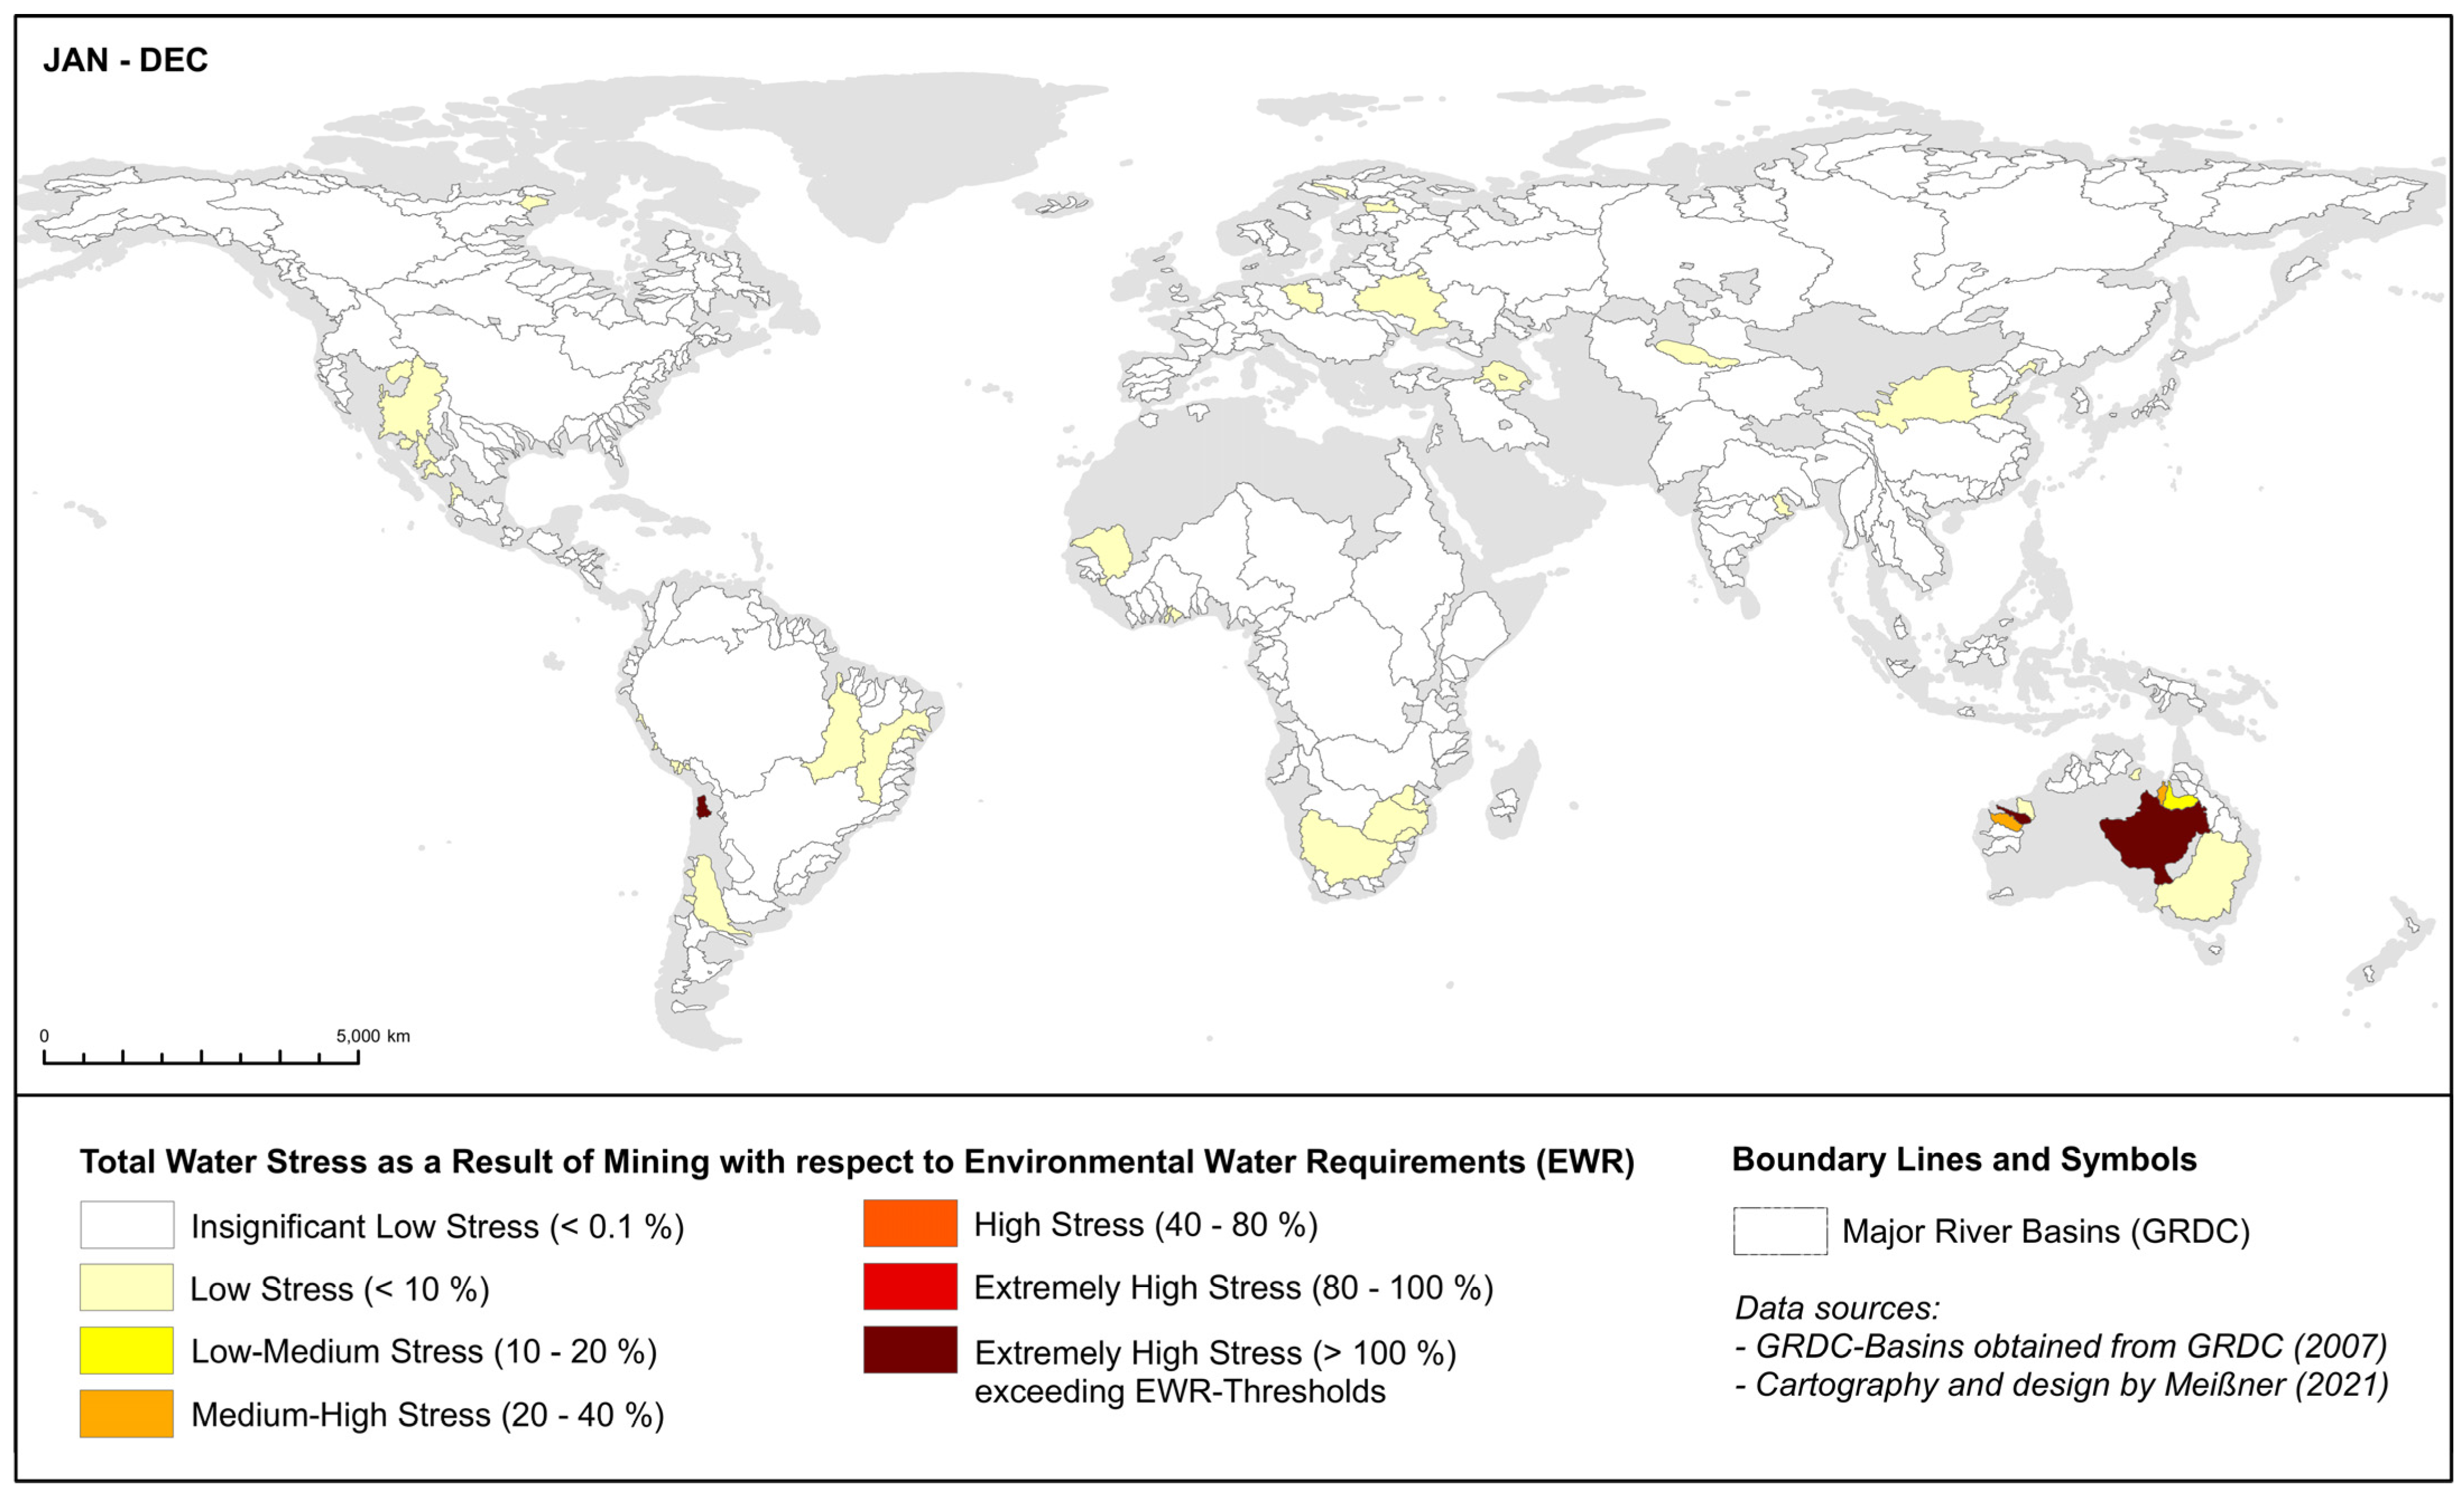
  • 0–1: ‘low’ water stress (<10%). The overall water consumption within a given area is lower than 10% of natural runoff. If taking into account EWR, runoff is defined as WA minus EWR, which is not or is slightly affected by water consumption.
  • 1–2: ‘low–medium’ water stress (10–20%). Total water consumption is rated between 10 and 20% of natural runoff minus EWR, which is affected moderately.
  • 2–3: ‘medium–high’ water stress (20–40%). Total water consumption is rated between 20 and 40% of natural runoff minus EWR, which is expected to be modified significantly.
  • 3–4: ‘high’ water stress (40–80%). Total water consumption is rated between 40 and 80% of natural runoff minus EWR, which is seriously affected and modified.
  • 4–5: ‘extremely high’ water stress (>80%). The basin’s overall water consumption exceeds 80% of natural runoff minus EWR, violating the environmental water needs in case of exceeding water availability by 100% (= EWR-related threshold). As many mining operations are located in remote areas which are arid but simultaneously characterized by low water use, thus having less competition amongst water users, these areas are not comparable to the regular definition of WSI. Nevertheless, mining operations have to be aware of localized impacts, particularly with respect to environmental water needs [71]. As a consequence, this category includes ‘arid and low water use’, differing from the established water stress definition but assuming that environmental water needs are violated regardless of the amount of water used.
In summary, Pfister et al. and Gassert et al. developed widely used and helpful approaches to address water-related challenges [65,69], but applied in different ways. While the concept of water stress by Pfister et al. is mainly used as a categorization factor in LCA to derive a water scarcity index, the concept by Gassert et al. is mainly developed as a standalone indicator used to meet the growing concerns from private and public sectors in addressing issues of water scarcity.
Since most water scarcity metrics that were initially developed mainly consider water quantities for socioeconomic purposes, only little attention has been given to the water needs of nature itself in the past, even though Sullivan [72] pointed out that depleted freshwater resources are directly linked to impacts on ecosystems and ecosystem degradation in particular. Any index used in water scarcity or water impact assessment should therefore include the condition of ecosystems and the thresholds to be taken into account to maintain sustainable levels of natural water availability [49]. Meanwhile, it is generally recognized that environmental water needs have to be included in water impact assessments in order to take account of sustainability requirements in water use, as it is recommended in SDG 6 and particularly in SDG 6.4.2 (level of water stress: freshwater withdrawal as a proportion of available freshwater resources) [73]. However, besides its relevance for sustaining a wide range of ecosystem services, EWR also has direct and indirect links to other specific SDGs, such as SDG 14, ‘life below water’, or SDG 15, ‘life on land’ [52]. Consequently, ERW has been increasingly included in water impact assessment.
A well-established approach to integrating environmental water needs in water impact assessment is the calculation of ‘the quality, quantity, and timing of water flows that are required to maintain the components, functions, processes, and resilience of aquatic ecosystems which provide goods and services to people’ [74] (p. 80), [75], usually defined as environmental water requirement (EWR) and environmental flow requirement (EFR). For instance, Smakhtin et al. initially developed a water stress indicator recognizing EWR (EFR) as an important parameter of available freshwater [76]. In this case, mean annual runoff (MAR) was used as a proxy for total water availability in a given area, and EWR (EFR) was expressed as a percentage of the long-term mean annual river runoff that should be reserved for environmental needs in this particular area or watershed [49]. Due to the variety and complexity of occurring ecosystems, even within small-scale watersheds, quantification of EWR is not uniform, as protectable aquatic ecosystems or ecosystem services depend on different amounts and qualities of freshwater. For advanced determination of EWR thresholds, particularly with regard to water impact assessment, several methods have been introduced and discussed (cf. [49,76,77,78,79,80]). Thus, there are different recommendations for EWS thresholds in the existing literature, varying considerably between authors and across river regimes [52]. For instance, Richter et al. [9] suggested an EWR of 80% of the monthly mean runoff as an obligatory standard, whereas Pastor et al. [78] proposed an EWR of between 25 and 46% of the mean annual runoff. Furthermore, many studies recommended river regimes as the appropriate scale of choice when it comes to quantification and determination of EWR levels [78], but globally uniform EWR recommendations at a spatially explicit level are still lacking.
However, Sood et al. calculated global EWR estimates for SDG target indicators, presenting continent-wide cumulative annual flow and groundwater abstraction to mean water runoff ratios (Table 1) [73].
According to the work of Sood et al. [73], globally, 63% of the natural flow needs to be maintained to protect ecosystems and eco-services. While South America and Africa are required to maintain more than 70% of the natural flow, in Australia and Oceania, where rivers are more degraded, 48.4 and 35.1% need to be maintained, respectively. Additionally, the percentage of annual groundwater abstraction on a global scale was estimated to be 1.6%. However, even if global estimates at the continental level are provided, EWR still has to be estimated for individual watersheds or watershed groups in order to consider comparable characteristics in terms of river regimes and environmental attributes. Especially with regard to mining, it is highly relevant to consider environmental water requirements at the watershed level, and particularly at the local level, as the lack of sustainable water management in mining operations can significantly alter local and even regional groundwater characteristics as well as the base flow characteristics of surface watercourses, especially in the case of large-scale mining projects.
For example, due to relatively constant mine-site water discharges, such as from mill operations, dewatering or the diversion of water from one watershed to another, river base flows within the mining area can be extended or elevated, possibly leading to disruption of the relationships between surface water and groundwater systems even though converting temporary water systems to perennial waters or vice versa. In particular, through the conversion of river systems from an ephemeral stream to a perennial stream, mainly caused by dewatering, mining operations can significantly affect the natural ecological systems that depend on seasonal flow variations. This might consequently result in reduced biodiversity of local as well as downstream aquatic systems [71]. As a consequence, considering EWR in water impact assessments in the mining industry is highly recommended. However, there are only very few harmonized spatial data on regional or grid-based EWRs available. As the emphasis of this article is on conducting a spatio-temporal analysis of the global water impact of mining on a regional scale, the EWR recommendations of Sood et al. [73] at the continental level are used as approximation values due to the fact that these recommendations directly align with the SDG framework.

2.3. Mining Data and System Boundaries Applied for a Water Impact Assessment

To conduct a regionalized water impact assessment of the global mining industry, a geographic information system (GIS) allowing data processing, statistical calculation and evaluation of mining activities as well as correlation of spatially explicit water characterization factors such as WSI at different spatial resolution scales was utilized. Figure 1 shows the layout and structure of the GIS model, including the data categories and impact factors applied.
Figure 1. Structure of the GIS model applied to conduct a regionalized water impact assessment of the global mining industry. (Geographical coordinates and production data were sourced from the SNL Metals & Mining Database (2019) [81]; Water Stress Index was calculated according to Gassert et al. (2014) [69]; projected water stress in IPCC-scenario RCP 8.5 SSP2 was obtained from Luck et al. (2015) [82]; seasonal water impact was conducted based on major river basin scale as defined by GRDC (2007) [83]; data on basin-related water availability was taken from Hoekstra and Mekonnen (2011) [84] and modified by environmental water requirements as proposed by Sood et al. (2017) [73].
Resources 10 00120 g001
The following datasets were implemented and correlated in the GIS model:
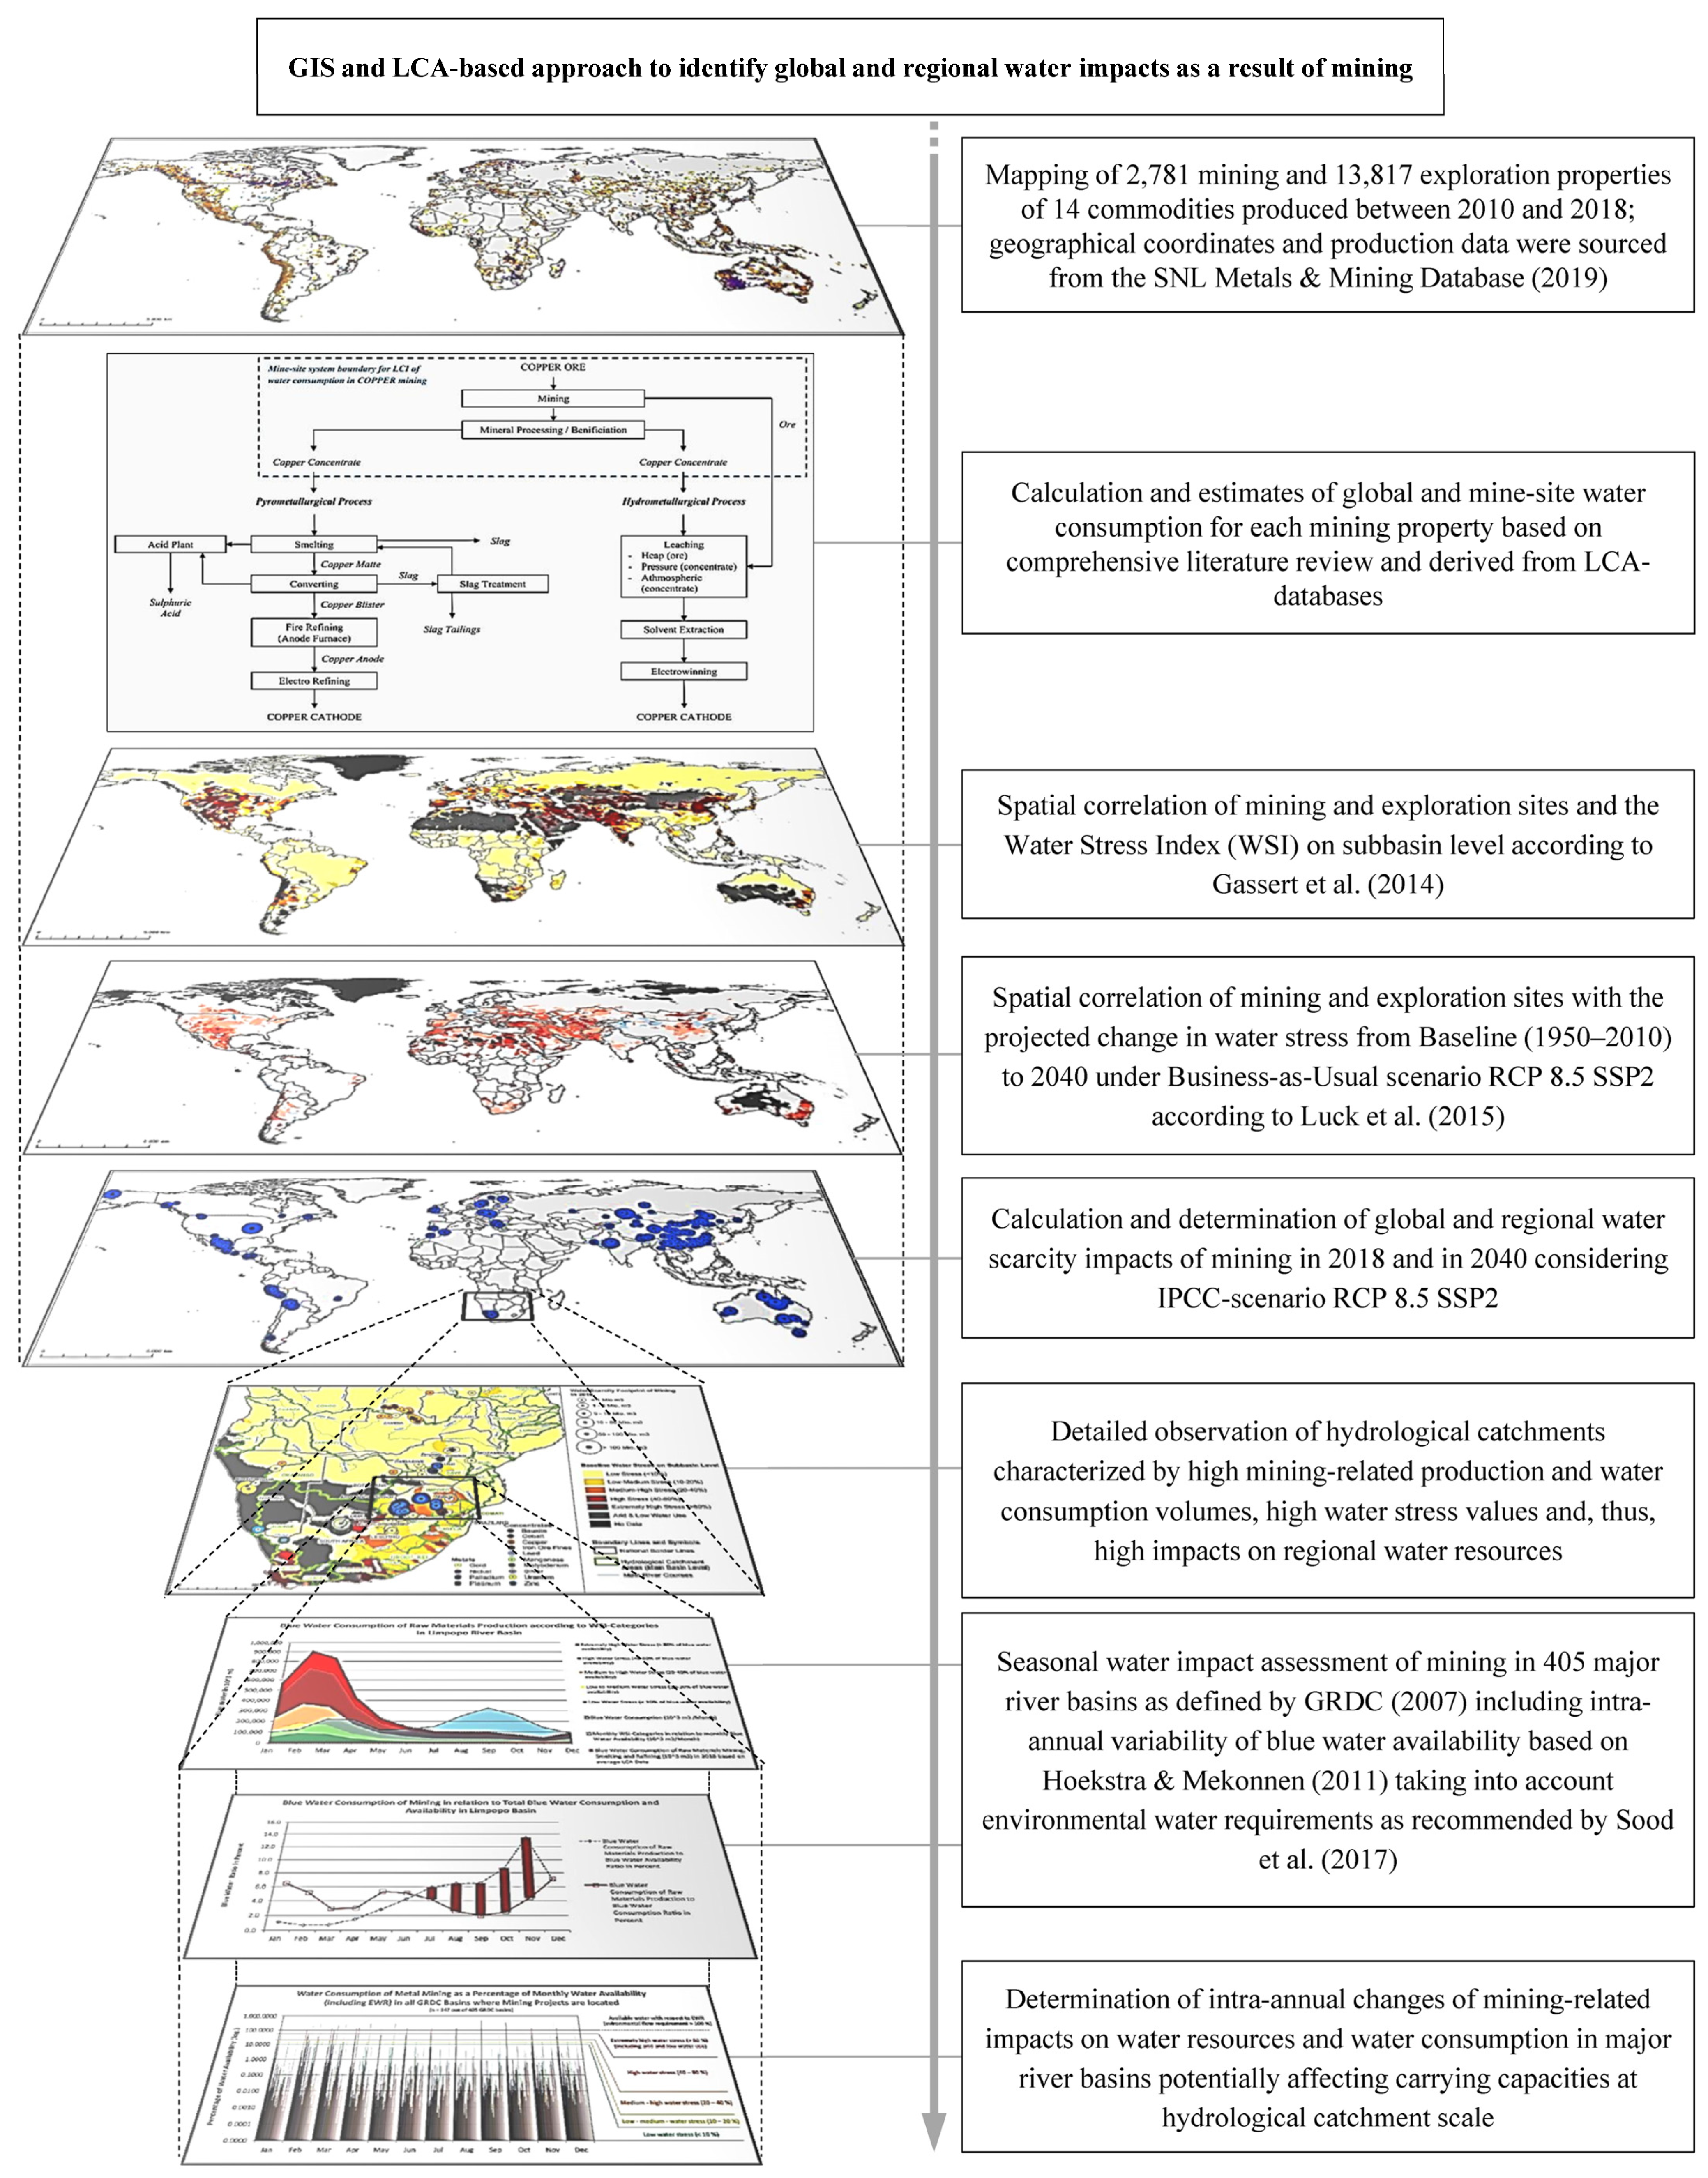
  • Geographic coordinates and individual mine-site production data of a time period between 2010 and 2018 for 2783 mining operations producing preprocessed ores or concentrates of bauxite, cobalt, copper, iron ore, lead, manganese, molybdenum, silver, U3O8 (uranium concentrate or yellow cake) and zinc as well as the refined metals gold, nickel, palladium and platinum. In addition, 13,817 exploration projects and 11,500 development projects of all 14 commodities were also considered.
  • Specific water consumption volumes per t mining commodity based on a comprehensive review of LCA databases as well as recent studies on water footprints in the mining sector (shown in Table 2 and Table 3) and annual water consumption volumes of each individual mining operation according to LCA calculations and mine-site production volumes.
  • Water stress index (WSI) at the sub-basin level according to Gassert et al. [69], obtained from the Aqueduct Project, and WSI at the major river basin level as defined by the Global Runoff Data Centre (GRDC) [83]. In total, water stress of approximately 25,000 basin units, representing ~15,000 sub-basins and 405 major river basins according to the GRDC, was implemented.
  • Mean annual and monthly water availability as well as total water consumption volumes of all water-consuming sectors at the sub-basin and major river basin levels (sourced from Gassert et al. [69] and Hoekstra and Mekonnen [84]).
  • Calculated water scarcity footprints (WSFPs) of each mining operation according to the definition of Pfister et al. [65] and Ridoutt and Pfister [66], aligning with the LCA framework.
  • Based on calculations by Luck et al. [82], estimated changes in water stress by 2030 and 2040 and projected water stress in 2030 and 2040 at the sub-basin level were implemented in the GIS considering three IPCC climate change scenarios (RCP4.5/SSP2, RCP8.5/SSP2 and RCP8.5/SSP3) to derive estimations of the water stress that mining operations may be confronted with in the next two decades.
In order to conduct a water impact assessment on different regional scales, spatial correlation of all datasets in the GIS is required. However, it has to be pointed out that, particularly in the case of using LCA data, the calculation of water use for water impact determination related to a particular mining location or region also has to distinguish between the different production techniques applied. Furthermore, depending on the geological setting of a deposit as well as the given ore grades jointly occurring in the metal-bearing rocks, mining operations usually produce several metal commodities simultaneously. Thus, the water consumption of a particular mining operation has to be determined according to all minerals involved at a particular mining place and along the entire production pathways and processing steps.
Despite these data-related challenges, the use of GIS allows the observation of mining-related water use and its impacts from different perspectives. For instance, from the perspective of a region in which mining activities are performed, it is rather of interest to assess water-related impacts resulting from the cumulative overall water consumption of all mining operations and mining commodities produced than assessing the water consumption resulting from the production of a single mining commodity. Hence, depending on the interest of choice, it might be useful to distinguish between the observation of environmental impacts caused by a single raw material—as usually conducted by raw material criticality assessments which primarily consider demand-side risks of raw materials markets—and impacts resulting from the mining operations within a particular region as a whole. The latter case in particular is mostly relevant for implementing environmental management and protection strategies, representing region-specific interests (=supply-side perspective) which are often neglected in traditional raw material criticality assessments.
In conclusion, when it comes to data quality and availability for water footprint accounting in the mining sector, most of the available LCA data are related to single raw material production, which has to be taken into account when conducting a water impact assessment of all mining activities located within a particular mining area and thus affecting the hydrological systems of an entire region. Therefore, in the water impact assessment conducted in this study, representing the perspective of a particular region or basin, all mining locations within the given region including all water consumptions of the mining commodities produced are summed and considered as region-specific cumulative water consumption.

2.4. Water Consumption in Mining and Refining of Metal Raw Materials

The first step towards calculating water demand in the mining sector is to develop a comprehensive and detailed understanding of a mine’s production system and also its key water flows. The extraction and treatment of mineral ores to manufacture metal concentrates is the primary step in the production chain of minerals and metals and is usually carried out at the mining location. Concentrates are saleable products of ore dressing, whereby valuable metals which are recovered through mining operations are separated from waste rock, enriched prior to transportation off a mine site and shipped to the markets. In many mining operations, ore is crushed and milled to recover valuable mineral components from the ore. Depending on the mineralogy of ores and the physical and chemical properties of the concerned minerals or metals, this processing step comprises many treatment methods, which all aim to extract a wide range of valuable materials from the ore. Enrichment techniques usually applied for this purpose are gravity concentration, magnetic concentration and, most commonly, froth flotation, which is usually the most water-intense processing step of a mining project in terms of water consumption [5].
Due to the fact that mining operations are essential for supplying raw materials to high-technology industries and, furthermore, are frequently located in areas characterized by limited water supply as well as increased risks of climate change effects [15], a growing number of studies on water consumption in the mining sector have been performed in recent years. However, the outcomes of the studies in terms of water consumption per commodity unit vary slightly and, in some cases, even significantly. This is mainly due to the individual definition of the mine-site system boundaries used but also due to the different mining technologies and water efficiencies applied at the mining sites which have been observed. This could also include different mine types (open cut or underground), ore mineralogy, mill configurations and designs (e.g., flotation or hydrometallurgical-based concentration methods), water qualities used, project ages, climate settings (arid, temperate, tropical), types of energy resources used and, finally, whether a smelter and refinery were also included in the operation observed [13,85]. These variations also have a significant influence on the amount of freshwater required for the production of mineral concentrates or refined metals. Thus, there is a wide range of water consumption values of the mineral commodities, both between and within commodity types [13]. However, these inventories at least provide increasingly precise estimations of the intensity of water consumption in particular production processes considering different production steps, such as mining, smelting and refining, as well as different production pathways, e.g., pyrometallurgical and hydrometallurgical processing types.
To conduct a water impact assessment of the mining industry, in this study, data on water consumption in ore mining and production of metal concentrates as well as refined metals were collected from numerous sources—primarily scientific publications and LCA databases providing several datasets for the selected metals and production stages. In addition, company websites and environmental reports were consulted to cross-check the water consumption values from the literature. However, the number of publications observing the water consumption of metal mining and refining is still very limited. A summary of the outcomes of the studies conducted by different authors is given in Table 2, showing the water consumption values for all selected commodities, including the main literature and data sources used. The dataset includes minimum and maximum ranges as well as the calculation of an average specific water consumption value per t metal-eq. contained in the correspondent concentrate or per refined metal. Based on the global production volumes (Table 3) and the specific mean water consumption values, the total global water consumption was derived for each metal and its concentrates.
Table 2. Summary of water consumption values in the mining and refining of selected metals based on a comparative literature review including LCA databases.
Processing Stage of the Mining CommodityMinimum Range
(in m3/t)
Maximum Range
(in m3/t)
Averaged Water Consumption
(in m3/t Metal Commodity)
Global Water Consumption
(in Mm3)
Reviewed Data Sources Providing LCA-Based Inventory Data on Specific Water Consumption Values per t Metal Commodity
Ore and Metal Concentrate
Bauxite
Preprocessed ore0.320–0.395 [27]0.447–0.578 [23,86,87]0.44788.9 1
(123.1 2)
International Aluminium Institute [23];
Gunson [27];
Frischknecht et al. (Ecoinvent, bauxite, at mine, GLO #1063) [86];
Buxmann et al. [87]
Cobalt
Concentrate40.72–
170.84 [88]–
258.00 [89]
364.00–(802.00) [27]208.40
(327.12)
24.5 1
(28.9 2)
Gunson [27];
Dai et al. [88];
Shahjadi et al. [89];
Copper
Concentrate9.673–10.446 [86,90];
28.000 [89];
36.100–37.594 [27,33,86,89,90];
40.000 [91]–42.403 [86]
67.081 [86,90];
70.400–99.550 [27,91]
43.235859.4 1
(885.9 2)
Gunson [27];
Northey et al. [33];
Frischknecht et al. (copper concentrate at beneficiation) [86];
Shahjadi et al. [89];
Fritsche [90];
Pena and Huijbregts (incl. SX-EW) [91]
Iron Ore
Fines0.210–0.874 [26,27,92,93] 1.519 [86]–
1.529 [90];
3.000 [93]
1.3711382.3 1
(1878.1 2)
Ferreira et al. [26];
Gunson [27];
Frischknecht et al. (Fe at beneficiation, GLO #1100) [86];
Fritsche [90];
Haque and Norgate [92];
Tost et al. [93]
Lead
Concentrate(0.528) [90]–
3.995 [27]
8.222 [89]–
8.485 [27]–
11.754 [86]
6.59719.9 1
(33.3 2)
Gunson [27];
Frischknecht et al. (lead concentrate at beneficiation, GLO #1104) [86];
Shahjadi et al. [89];
Fritsche [90]
Manganese
Concentrate1.390 [86]1.418 [90]1.40462.7 1
(85.9 2)
Frischknecht et al. (manganese concentrate at beneficiation, GLO #1110) [86];
Fritsche (2005) (manganese concentrate, GLO 2003–2004) [90]
Molybdenum
Concentrate52.2–209.6 [86]382.0 [27]–
490.5 [86]–
797.0 [27]
240.955.0 1
(78.5 2)
Gunson [27];
Frischknecht et al. (molybdenum concentrate, GLO #1117, RER #5858, RAS #5859) [86]
Ore and Metal Concentrate
Silver
Concentrate1621–1805 [27,89,90]3128 [27]171341.1 1
(44.6 2)
Gunson [27];
Shahjadi et al. [89];
Fritsche (Xtra-silver concentrate) [90]
Uranium
Concentrate (U3O8)46.20–100.00 [11,86,94];
505.00–2478 [11,27,90,94]
6000–8207 [11,86,94]274617.1 1
(17.1 2)
Mudd [11];
Gunson [27];
Frischknecht et al. (uranium oxide RNA #5988, RNA #5989) [86];
Fritsche (uranium oxide) [90];
Mudd et al. [94]
Zinc
Concentrate11.07 [89]–
13.10 [27]–
13.36 [86]
24.65 [27]11.93114.2 1
(154.5 2)
Gunson [27];
Frischknecht et al. (zinc concentrate at beneficiation, GLO #1157, SE #10099) [86];
Shahjadi et al. [89]
Refined Metal
Gold
Metal79,949–
152.630–
174.780–
190,558 [86]
259,290–
288,140 [95]; 309,110 [27]–
347,910 [86]; 392,686 [93]–
427,696 [90]; 453,305 [27]–
477,000 [96]
265,861712.79 1
(814.8 2)
Gunson [27];
Frischknecht et al. (gold at refinery #10110-14) [86];
Fritsche [90];
Tost et al. [93];
Norgate and Haque [95];
Mudd [96]
Nickel
Metal80.6 [86]–
107 [13]–
138.0 [27]
187.36–
193.0 [86]–
240.0 [27]–
258.2 [86]
193.8355.3 1
(441.4 2)
Mudd [13];
Gunson [27];
Frischknecht et al. (primary nickel, GLO #35, GLO #1121, ZA #1124, RU #1125) [86]
Palladium
Metal56,779–127,172
[27,86,90]
273,523–327,874 [86,90]210,71345.8 1
(46.3 2)
Gunson [27];
Frischknecht et al. (primary at refinery, ZA #1128, RU #1129) [86];
Fritsche (primary at refinery, ZA, RU) [90]
Platinum
Metal169,968–200,000 [27,86,90]406,998–487,876 [27,86,90]313,49667.3 1
(67.3 2)
Gunson [27];
Frischknecht et al. (primary at refinery, ZA #1134, RU #1135) [86];
Fritsche (primary at refinery, ZA, RU) [90]
1 The water consumption refers to the global production share considered in this study (see Table 3). 2 Estimated global water consumption assuming 100% of global production is taken into account.
Concerning the data used from the literature, Gunson [27] performed the most comprehensive survey on water withdrawal and consumption in the mining industry, representing 23 mineral and metal commodities in total. The author collected data from 65 mining companies, which reported water-related data for up to 155 mining sites in 2009. Further comprehensive studies on the water consumption of mining operations have been carried out by Northey et al. (cf. [14,16,33]), predominantly focusing on copper, gold, lead and zinc. Additionally, a recent study on water consumption in copper mining was conducted by Lutter and Giljum [28], who carried out a comprehensive data survey on Chilean copper production, collecting data on water consumption from 31 Chilean copper mines and also distinguishing between different types of water used. In addition, LCA databases, e.g., Ecoinvent [86] and PROBAS [90], also provided water consumption values for different mining and refining processes.
In this study, data on water consumption in bauxite and iron production were related to preprocessed ore, whereas water consumption in cobalt, copper, lead, manganese, molybdenum, silver, uranium and zinc production is related to metal concentrates which are commonly produced at the mining site. As mine-site metal production is usually reported as the metal contained in the concentrate produced, production and water consumption values for each metal are described as metal equivalents (metal-eq.) and water consumption per t metal-eq., respectively. As the metal contents in concentrates vary between metals depending on the ore grades and the processing techniques applied as well as the literature reviewed, a wide range of specific water consumption values and, therefore, a wide range of global water consumption volumes are reported in the present study. Nickel, however, is considered an outlier because in comparison to the preceding concentrates, there is lack of reliable LCA data on water consumption for producing nickel concentrates. Thus, water footprint accounting of nickel refers to refined ferronickel. By contrast to the concentrates mentioned above, precious metals such as gold, palladium and platinum are very frequently processed in smelters and refineries located adjacent to the mining site due to their comparatively high economic value, even in the case of low production volumes. Thus, in this study, water footprint accounting for gold, palladium and platinum includes the mining, smelting and refining of pure metals, assuming that the entire production process is located at one particular production site or is adjacent, located within a region characterized by similar water availability and water stress. However, silver was excluded from this rule and calculated as concentrate, as it is often mined in combination with lead and zinc, and thus, considerable amounts of silver are commonly refined from lead and zinc concentrates, which usually takes place at specific refining plants off-site from regular mining locations. Therefore, due to the unevenly defined system boundaries referring to different on-site production steps, comparison of water consumption between all metals considered is not reliable, except within ore categories, concentrates and refined metals.
In conclusion, it can be shown that there is significant variation in the results of almost every commodity between the different publications. In some cases, the variation of water consumption values reported can be within a factor of 5 to 10, e.g., for copper concentrate with a range of 9.7 to 99.6 m3 per t Cu-eq. in concentrates, or even within a factor of roughly 180, e.g., for uranium mining with a range from 46.2 to 8207.0 m3 per t U3O8. This variation is due to different mine types, ore types and given ore grades and thus the different processing pathways applied. Furthermore, different system boundaries were determined by the consulted studies, conducted for different mine sites and time periods. Some calculations are based on different definitions regarding the terms water withdrawal and water consumption. Additionally, some studies are based on individual mine-site surveys, while others cover a wide range of mine-site specific data derived from mining companies’ sustainability reports. Moreover, the challenge of the lacking coherence of mine water use in the literature and LCA databases is described in almost every study conducted, such the studies of Gunson (2013) [27], Northey et al. (2016) [14] and Tost et al. (2018) [93]. As a consequence, the comparison of data within the literature is very limited [97], particularly between all commodities observed.
Despite these given uncertainties, Table 2 shows that refined platinum (313,496 m3 per t), gold (265,861 m3 per t) and palladium (210,713 m3 per t) are characterized by the largest specific water consumption values per t on average and that there are significant variations in the calculation depending on the production pathways considered. In contrast to refined metal production, water consumption in the production of concentrates is comparatively low. For example, the production of cobalt concentrates accounts for 208.4 m3 per t, copper concentrates for 43.2 m3 per t and zinc concentrates for 11.9 m3 per t, whereas concentrates of manganese (1.40 m3 per t), iron ore fines (1.37 m3 per t) and bauxite (0.45 m3 per t) are characterized by the lowest water consumption per t. Compared to this, silver and uranium have very high water consumption per t concentrate, accounting for 1713 and 2746 m3, respectively. However, considering global production rates in 2018 (Table 3), iron ore fines (1382.3 Mm3), copper concentrate (859.4 Mm3) and gold (712.8 Mm3) represented the largest overall volumes of water consumption of the observed commodities. Additionally, based on the global production volumes, the overall water consumption estimated for all metals considered in this study was approximately 4000.14 Mm3 in 2018. To put these numbers into a global context, the Food and Agriculture Organization (FAO) and the World Water Assessment Programme (WWAP) estimated the global water withdrawal at 4000 Gm3 in 2014 and global water consumption at 1400 Gm3 [98]. These comparative numbers show that in absolute terms, and at the global level, the overall dimension of pressure put on water resources by mining is comparatively low. However, the local impacts on water resources will be increasing in the future, as the global demand for metals increases and geological accessibility as well as ore grades decline. Furthermore, it is expected that climate change will put additional pressure on local water resources [15]. Thereby, in the following section, the global and regional impacts of the water consumption in mining will be observed in detail.

3. Results

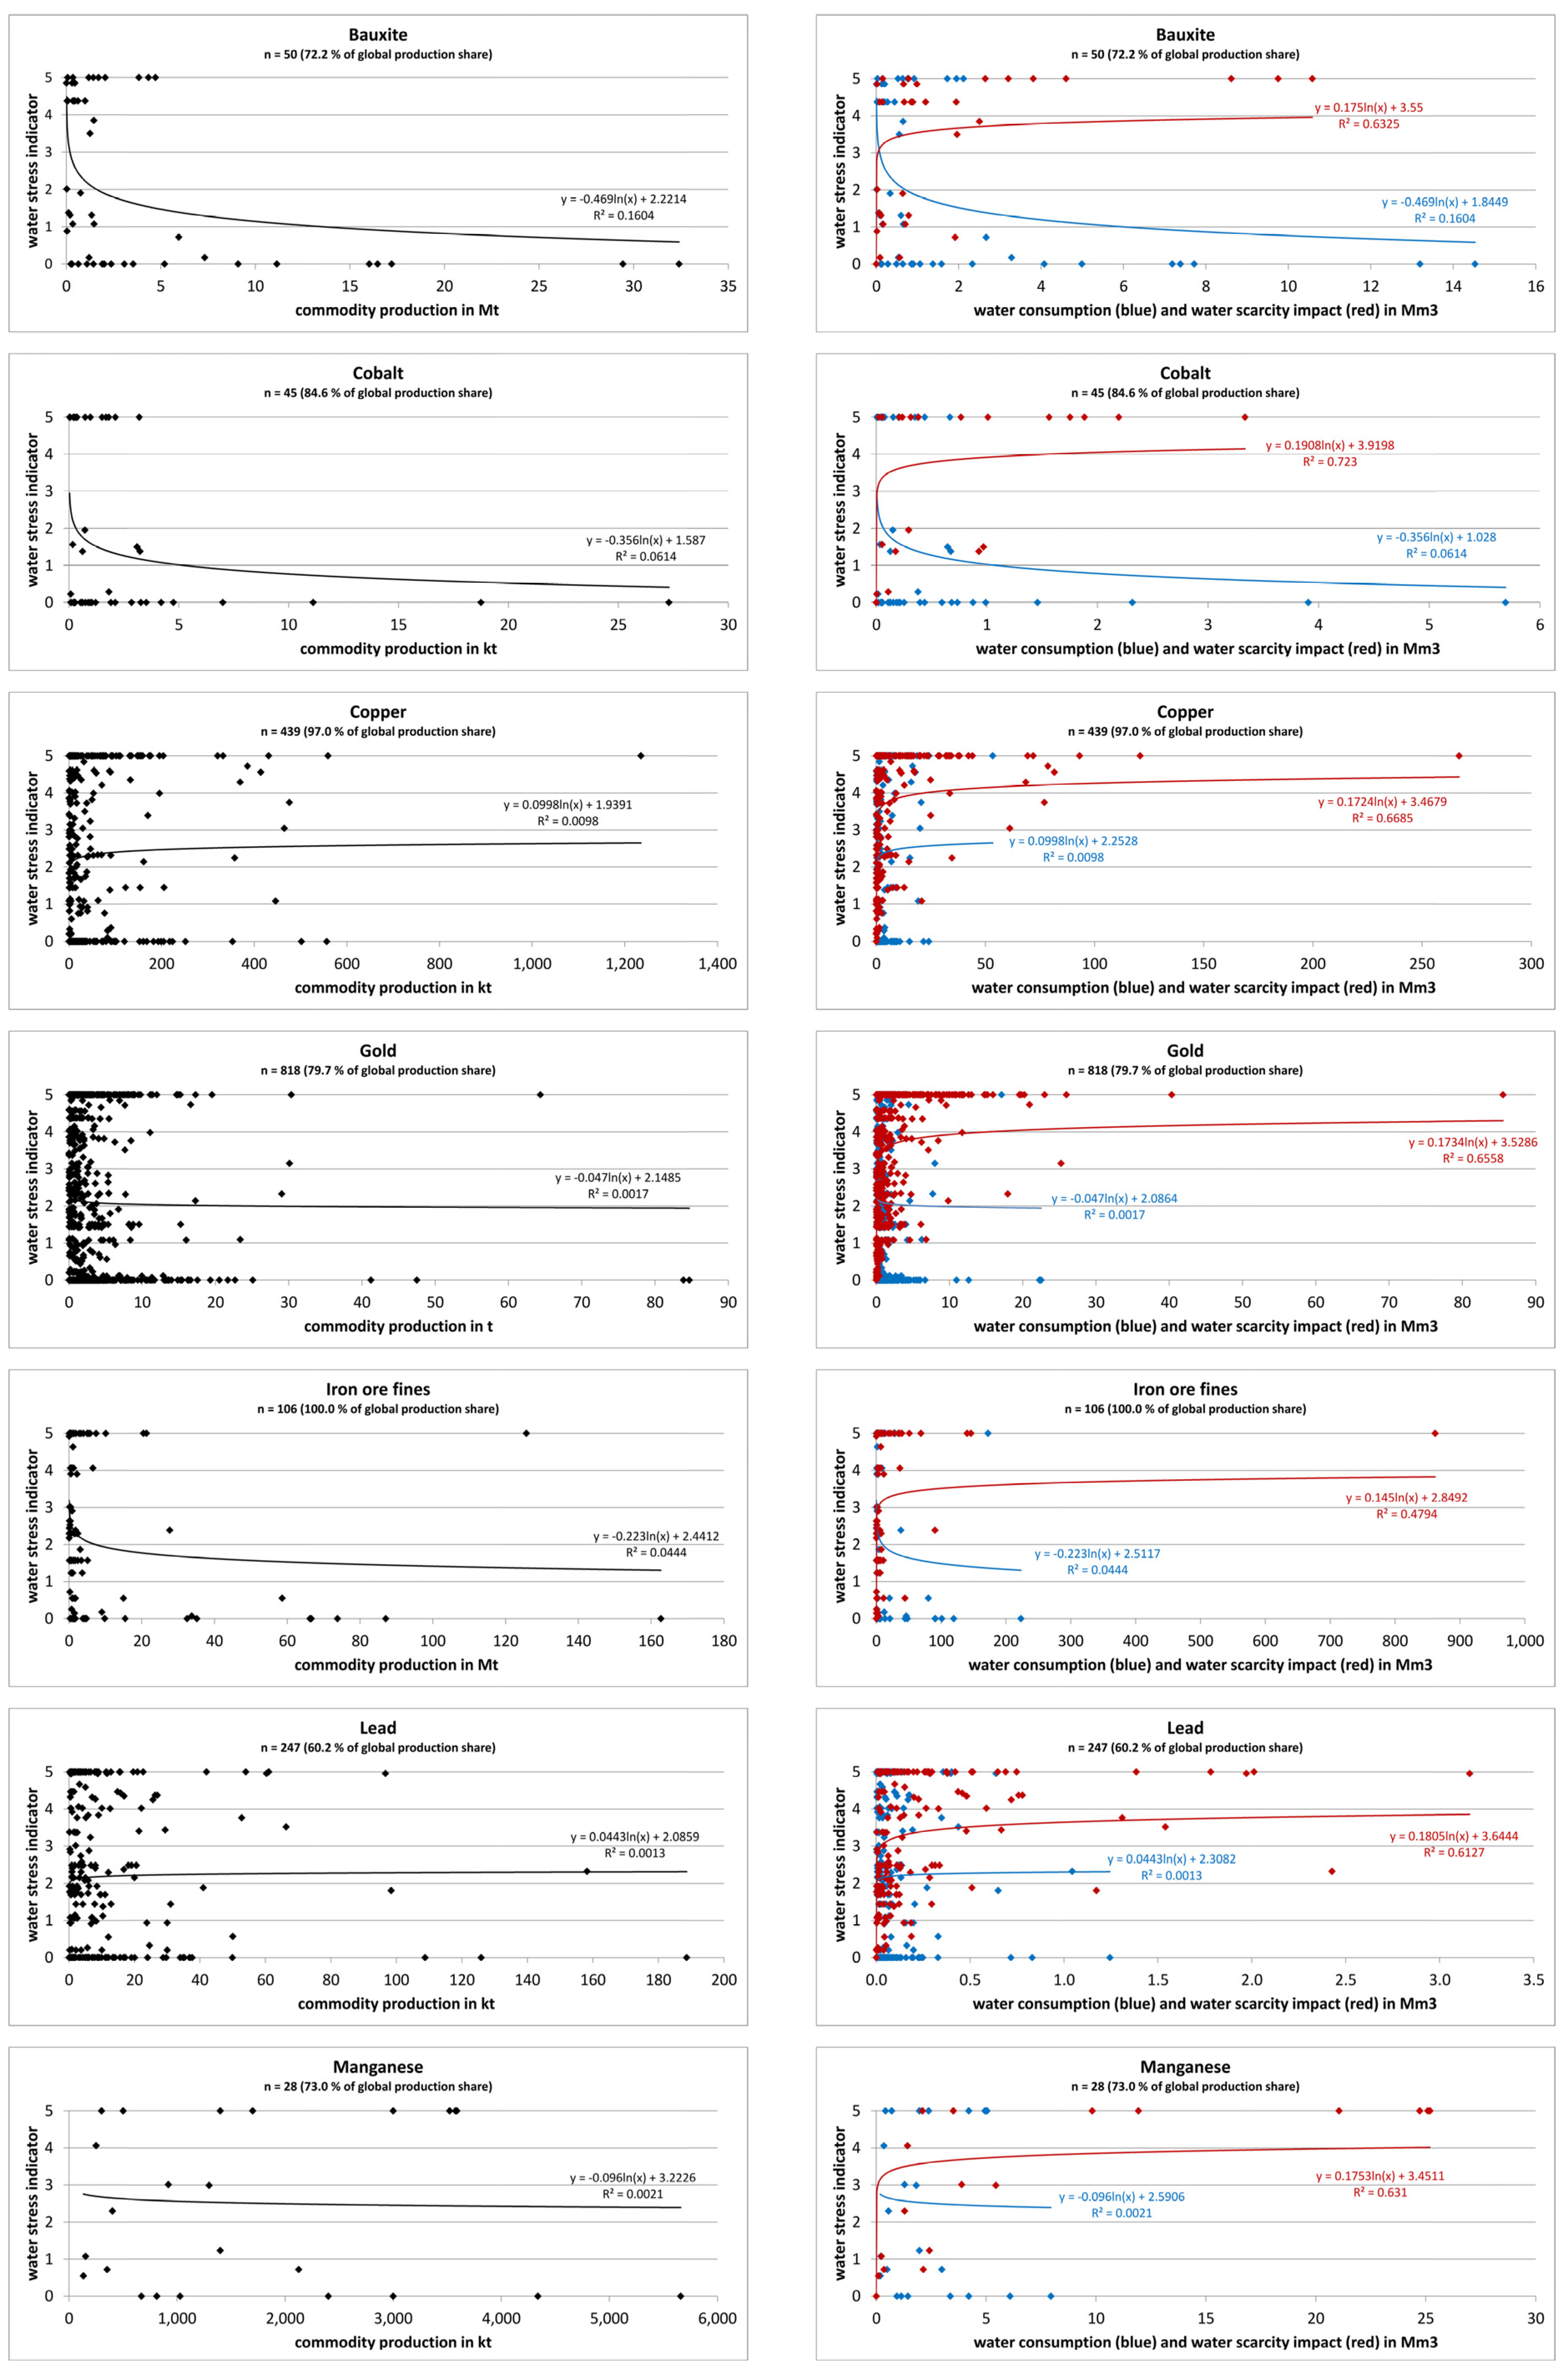
3.1. Mining-Related Water Stress and Global Water Scarcity Impact

To be able to conduct a precise water impact assessment of the global mining industry, particularly taking into account individual mining as well as hydrological specifications at a spatially explicit level, the exact geographical coordinates of all mining projects had to be identified first. In this study, coordinate data of individual deposits and mining sites for bauxite, cobalt, copper, gold, iron ore, manganese, molybdenum, nickel, palladium, platinum, silver, uranium and zinc were obtained from the SNL Metals & Mining Database [81]. Additionally, coordinates in terms of longitude and latitude data were reviewed and cross-checked from a range of further sources, including the mindat.org database of the Hudson Institute of Mineralogy [99], governmental geological authorities such as the United States Geological Survey (USGS) [100], the British Geological Survey (BGS) [101] and the geoscience portal of the Australian Geoscience Information Network (AUSGIN) of the Australian government [102] as well as the scientific literature and company-based technical, environmental and sustainability reports. Based on this review, Figure 2 shows the spatial location of all mining sites considered in this study which produced at least one of the selected commodities in 2018. Furthermore, the locations of all mining sites are shown in relation to the sub-basin water stress as calculated and published by Gassert et al. (2014) [69].
Depending on the particular mining commodity, the total production volume of all mining operations considered represented at least 60 to 100% of the global production volume (Table 3). Overall, in addition to 2783 mining operations, 13,817 exploration sites and 11,500 mining development projects were identified and considered in this GIS-based survey. However, depending on the type of ore, which may contain several elements mined simultaneously, in certain cases, there are partial overlaps of production coordinates due to co-production of by-products. For example, molybdenum, zinc, gold and silver are often mined as by-products in copper production; lead and silver are typically produced jointly within the zinc mining process and gold, cobalt and platinum group metals (PGMs) are frequently produced as co-elements of nickel mining, etc.
Every production site usually represents several processing stages, including ore mining, beneficiation and enrichment, finally providing metal concentrates with 30–40% of metal content that are transported or shipped to adjacent smelters or refineries. In exceptional cases, such as for precious metal mining, there are usually on-site smelters and refineries included, producing refined metals nearby the mining operation with high purity levels. Based on the combination of mining coordinates and LCA studies providing water consumption calculations of commonly applied mining and processing technologies, impacts on water resources can be assessed in GIS for each commodity as ore, concentrate and refined metal at different spatial scales: mine sites at the local level as well as at regional, national and even global levels.
Thus, GIS-based water impact assessment allows the precise location of particular production processes along the mining and refining pathway and therefore the determination of individual water stress profiles for each individual commodity, showing the water-specific conditions under which mineral extraction and processing take place. The overall results of this assessment are comparatively illustrated in Figure 3, showing the commodity-wise WSI determination of each mining operation regarding commodity production in t metal-eq., water consumption and the resultant water scarcity impact in m3. The commodity profiles clearly show that in the case of each commodity, mining locations are operating under a wide range of different water stress conditions, ranging from ‘low’ (0–1) to ‘extremely high’ water stress, including ‘arid areas characterized by low water use’ (4–5). Furthermore, it is indicated that in some cases, the WSI profile varies significantly between small-, medium- and large-scale production mining properties.
For example, bauxite is predominantly mined under ‘low’ water stress from mines with an annual production output of more than 5 Mt, whereas the locations of mining operations with an annual production of lower than 5 Mt are spread over all WSI categories and therefore represent a higher water scarcity footprint (WSFP) on average than larger production facilities. Thus, the overall water scarcity impact of bauxite mining is clearly driven by mining operations producing less than 5 Mt under higher water stress conditions, which is very similar to cobalt and iron ore mining. In the case of palladium, mining sites with an annual production of lower than 10 t are mostly operating under ‘high’ water stress conditions due to mining projects being predominantly located in South Africa, whereas mining sites with more than 10 t of production output per year are mainly situated in Russian Siberia and are thus characterized by ‘low–medium’ water stress. Uranium mining, by contrast, is mainly performed in Kazakhstan under ‘extremely high’ water stress, resulting in comparatively high overall water scarcity effects as well as a high mine-site WSFP on average. In addition, on closer inspection, the production profiles and water scarcity profiles of platinum, palladium, cobalt, iron ore and uranium are significantly influenced by the water stress of only a few geographic regions hosting large production capacities which are of global relevance and characterized by major market shares. For instance, 68.6% of global platinum production in 2018 was supplied by South Africa, of which 99.4% was conducted in the Limpopo River Basin characterized by ‘high’ to ‘extremely high’ water stress.
The same effect can be depicted for palladium, 36.9% of the global production of which was also located in Limpopo River Basin. Additional 38.2% of palladium was produced at two mining sites adjacent to Norilsk in Yenisei Basin, Russia, although operating under ‘low’ water stress conditions. Thus, in terms of physical water scarcity, neglecting wastewater issues and other environmental or sustainability aspects, palladium mined in northern Siberia accounts for a significantly lower water scarcity impact than palladium mined in South Africa. Another mining commodity predominantly influenced by the water stress of one specific river basin is cobalt, 60.5% of the global production of which is situated in the southeast of DR Congo, in the Congo Basin. Further examples to be mentioned are iron ore and uranium. The production of iron ore fines in particular is significantly influenced by the water situation in the northern area of western Australia, hosting 60.2% of global production altogether, as well as Brazil, which supplied another 27.3% of global iron ore fine production in 2018. Furthermore, 41.3% of uranium mining was situated in the Issyk-Kul Basin and Aral Drainage, primarily located in the territory of Kazakhstan and Kyrgyzstan characterized by ‘high’ and ‘extremely high’ water stress. In contrast, gold and silver are mined all over the world in low volumes per mining site and are therefore globally allocated homogeneously over numerous areas characterized by a wide range of different water stress intensities.
Overall, Table 3 summarizes the comparative results of the commodity-wise water scarcity impacts as provided in Figure 3. It is indicated that the largest water scarcity impacts are related to copper, iron ore and gold. For instance, the global cumulative WSFP of these three commodities together accounted for 69.7% and 5536 Mm3 in 2018. The WSFP of all 14 commodities considered accounted for almost 7950 Mm3 in total.
Table 3. Global production volumes, number of mining properties, global water consumption and overall water scarcity footprint per commodity considered in this survey.
Mining CommodityGlobal Production in 2018 (in t)
(Except Bauxite in 2016)
(Source:
SNL [81])
Global Production Share
(in Percent) (According to USGS [103])
Number of Mining Sites Considered
(Source:
SNL [81])
Averaged Water Consumption Factor
(in m3/t)
Global Water Consumption in 2018
(in Mm3)
Global WSFP
(in Mm3)
(=Water Consumption Multiplied with Regional WSI)
Mine-Site ØWSFP
(in Mm3)
(=Global WSFP Divided by Number of Mining Properties)
Preprocessed Ores
Bauxite198,374,45472.2500.44788.9461.181.25
Iron ore1,008,099,67873.61061.3711382.301889.5217.83
Concentrates
Cobalt117,332 *79.345208.424.4516.250.36
Copper19,876,739 *97.043943.235859.382325.355.30
Lead3,020,613 *60.22476.59719.9339.640.16
Manganese44,637,552 *73.0281.40462.67149.885.92
Molybdenum228,207 *70.062240.954.98192.783.11
Silver23,986.37 *92.1487171341.0897.640.20
Uranium62,236.74 *100.0502746170.91617.0212.34
Zinc9,574,839 *73.926611.93114.22233.930.89
Refined Metals
Gold2,681.0579.7818265,861712.791320.981.61
Nickel1,833,46780.7102193.8355.32720.277.28
Palladium217.5198.940210,71345.8377.891.95
Platinum214.81100.043313,49667.34202.564.94
Summary
Total1,285,852,217.48 2783 4000.147944.89
* The production numbers indicate the metal-eq. contained in the concentrates.

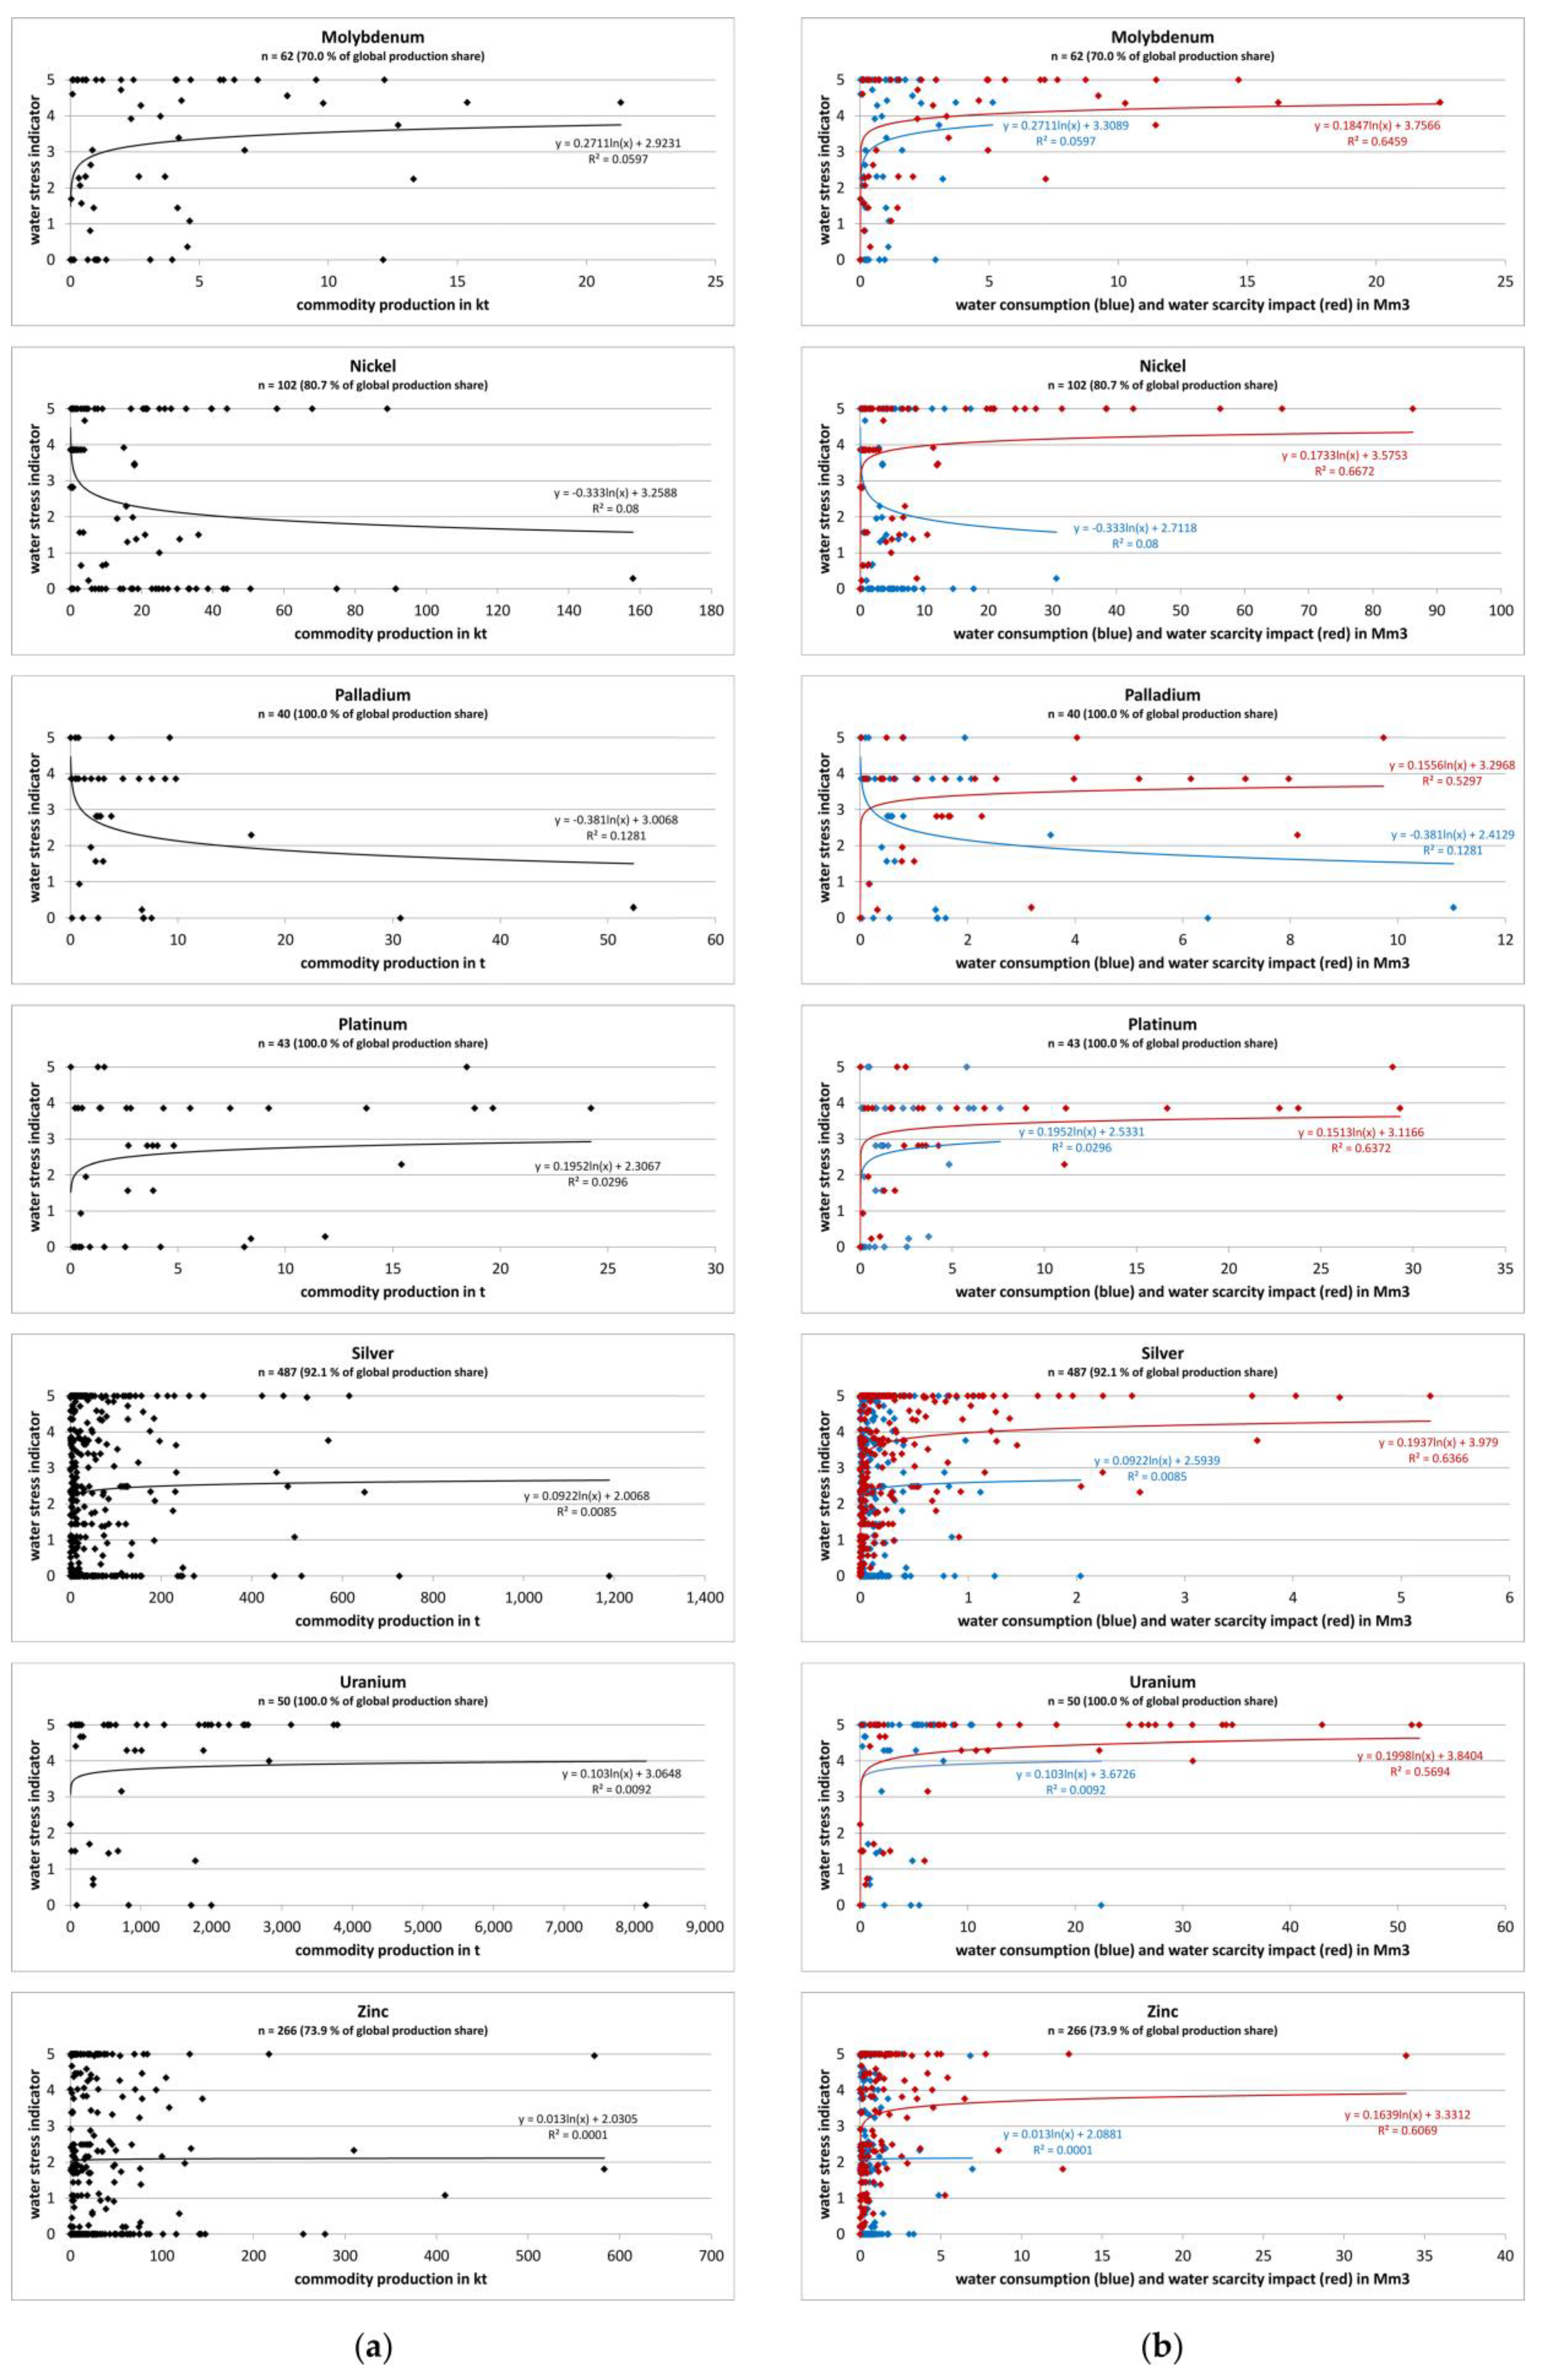
3.2. Mining’s Influence on Regional Water Stress and Carrying Capacities

Due to the fact that production capacities in the case of certain mining commodities of global relevance are highly concentrated in few regions, e.g., cobalt, platinum, palladium, iron ore and uranium, the global water scarcity impact of these commodities is significantly influenced by the water stress conditions of the corresponding mining regions. Regarding these circumstances, and as the global demand for mining commodities is expected to grow in the future, this may also lead to increasing environmental impacts within the regions where mining is predominantly occurring. Hence, the question arises as to what impact industrial mining has on water resources on a regional scale taking into account mining’s influence on the carrying capacity of regional hydrological systems to provide sufficient freshwater at regional and even local levels. To find an adequate answer to this question, a water impact assessment at the river basin level was conducted considering intra-annual changes in water demand and water availability affected by all mining activities operating in the particular basin.
Depending on economic structures and existing water-using sectors, the water consumption in every region varies in amount and over time, e.g., by seasonal irrigation activities in water-intensive agricultural landscapes or intense water use in heavily industrialized and thus energy-consumptive areas, affecting the availability and quality of region-specific water resources in different ways. Particularly in mining-intense regions, large-scale mining operations may also contribute different proportions of the overall water consumption in the given area, finally resulting in impacts on freshwater quantity and quality of aquifers, groundwater or river flow levels. As the water impact assessment of this survey focused on the influence of water use in the extractive industry on hydrological systems, this observation primarily addresses impacts at the watershed level, providing natural water resources for a wide range of different water-using sectors in the particular catchment.
Based on the relation between water availability and water use, each basin is characterized by individual water stress levels and volumes of metal mining directly affecting the basin’s water sources and therefore competing with other water-consuming sectors, including environmental water requirements. This so-called watershed-specific impact assessment was conducted at the major river basin level as defined by the Global Runoff Data Centre (GRDC), providing GIS-based hydrological data for 405 major river basins and 687 associated river systems in total [83]. Hereafter the major river basins observed are termed ‘GRDC-basins‘. The GRDC-basins were implemented in the GIS model; correlated with mining coordinates, including mine-site data of commodity production, LCA-based water consumption data and water scarcity footprints for each mining property; and finally summed for each watershed.
Figure 4 shows the results of the basin-related observation. While Figure 4a illustrates the global coverage of all the GRDC-basins considered in this study, Figure 4b,c visualize the total water consumption of all mining activities considered in this study as well as the resulting water scarcity impacts according to each GRDC-basin.
According to Figure 4a, GRDC-basins cover approximately 65% of the global land area only; wide land surfaces are not included, such as Antarctica, Greenland and large areas of northern Canada. Mostly desert regions are also excluded, such as large areas of the Saharan desert, the Arabian Peninsula, the Afghan and Iranian deserts, the Gobi Desert in Asia, the Mojave Desert in North America and Australian deserts. Also excluded are areas of Oceania, the Indonesian archipelago and many minor fractions of land, often along the coasts, which are not part of major river basins. This also includes artificial land, which is mostly relevant to the Asian region. Due to these limitations, numerous mining areas are located outside officially defined GRDC-basins and were not considered in this regional assessment.
However, regarding all 14 commodities observed in this study, 1783 mining sites were identified in total, located in 147 out of 405 catchment areas and representing roughly two-thirds of all mining operations included in this survey, with a production volume of approximately 1.374 bn t of metal-eq. in 2018. All 147 GRDC-basins with mining activities were subjected to a brief analysis to determine the extent to which mining contributes to regional water stress. Overall, some basins are significantly characterized by a high concentration of mining activities simultaneously combined with high overall water consumption (Figure 4b) and low water availability, therefore leading to high annual mean water stress values and high physical water scarcity magnitudes (Figure 4c).
In addition to Figure 4, Table 4 presents the basins with the highest annual water consumption levels observed in the mining sector as well as the resultant water scarcity effects. The basins with the highest global water consumption in the mining sector are mainly subject to large-scale iron ore mining, particularly Fortescue River (Australia), Tocantins (Brazil), Ashburton River (Australia) and Sao Francisco (Brazil), followed by Orange (South Africa), Amazonas (Brazil), Limpopo (South Africa), Loa (Chile) and others, where water consumption is predominantly driven by copper and gold mining. However, the total water scarcity impact resulted from mining-related water consumptions highly depends on the basin’s overall water stress intensity—e.g., in the case of basins with lower water consumption for mining, such as Ob Basin, Colorado River or Huang He (Yellow River), the highest water scarcity effects can be observed due to the high water stress occurring in the respective basins. By contrast, Fortescue River Basin in Australia or Tocantins Basin in Brazil, both characterized by the highest water consumption rates in the mining industry, are only slightly affected by mining-related water scarcity impacts. This is due to the low average water stress conditions in the basins as well as partly being classified as ‘arid with low water use’. Particularly in the case of higher water stress intensities, the ‘water consumption/water scarcity impact ratio’ is a meaningful indicator showing the magnitude of the water scarcity intensity resulting from a given volume of water used in a particular basin. According to this, the highest water scarcity effects were documented for Issyk-Kul Basin with a ‘water consumption/water scarcity impact ratio’ of 1:5, followed by Ashburton (~1:5), Huang He (1:4.7) and Colorado River Basin (1:4.4) which were characterized by high water stress intensities.
However, as water availability and water demand can significantly vary between basins and over the year, it may also be important to consider the intra-annual variability of water stress as well as water scarcity impacts caused by mining activities. By conducting a water stress assessment regarding the seasonal variability of both natural water supplies and water consumption, it could be shown that numerous basins are affected by mining-related water stress for limited time periods over the year. In order to quantify mining’s contribution to the water stress of each individual major river basin, particularly taking into account intra-annual variability, the cumulative water consumption of all mining activities was compared to the monthly water stress of each basin. As industrial, large-scale mining commonly takes place under continuous operation, 24 h a day, 7 days per week [3], it was assumed that there is constant mining and commodity production throughout the entire year without being affected by significant interruptions of the operations. To conduct a monthly based water impact assessment at the basin level, runoff data were taken from Hoekstra and Mekonnen [84], who obtained basin-specific runoff data from the Composite Runoff Database (based on Fekete et al. [104]) referring to the average over the time period of 1996–2005. Furthermore, as proposed by Sood et al. [73], the water availability of each basin was calculated as the natural runoff minus the environmental flow requirements (EWRs). According to Vanham et al. [52], the consideration of region-specific EWRs is highly recommended in order to align water scarcity assessments with the framework of water-related sustainability goal SDG 6. In conclusion, this regional water impact assessment comprises several aspects, including seasonal variability of water availability and water consumption, particularly water consumption in the mining sector, taking into account the volumes of freshwater needed to sustain basin-related ecosystems and eco-services. By considering EWRs it is thus assumed that the amount of water available in a particular basin can be fully used without affecting the environmental integrity of ecosystems. This EWR-specific water availability is also determined as the ‘economic carrying capacity’ of water resources of each basin. Hence, in the case of the water consumption exceeding the water availability and the regional ‘economic carrying capacity’, it has to be assumed that there is significant pressure on regional ecosystems.
The results of this intra-annual water impact assessment are illustrated in Figure 5 and Figure 6, showing the basin-wise cumulative water consumption of all mining operations on a monthly basis in relation to regional water availability, taking into account EWRs. Based on the relation between water availability and water use in the mining sector, the mining-related intra-annual water stress levels within all 147 GRDC-basins were calculated.
As a result, it could be validated that water stress caused by mining is predominantly limited to ‘low’ water stress over the year in many of the catchments, not surpassing 10% of the basins’ available water used in total. In most cases, mining had only an insignificant influence on the basins’ overall water stress, accounting for less than 0.1% of the total water consumption. However, there were also exceptional cases where the environmental flow requirements were completely surpassed by the consumption of freshwater by the mining industry during the entire year. This was the case when water consumption exceeded 100% of the available water. Thus, in some basins, mining was the overall dominant water user, mostly due to large-scale mining projects significantly influencing the regional water availability. However, this situation also offers notable potential to reduce water stress in the entire basin by improving water use efficiency, implementing further water management measures or increasing use of seawater and recycled mine waters at one particular mining location.
According to this intra-annual and watershed-specific water impact assessment, the following basins are amongst the river systems characterized by the highest mining-related water impacts in terms of water scarcity effects and water stress, surpassing the EWR thresholds which indicate the amount of water required to maintain the basin-specific ecosystems:
  • Loa Basin (Figure 4a, basin no. 319), located in the northern part of the Antofagasta region in Chile, is one of the world’s leading copper-mining areas, hosting 7.9% of global copper and 8.2% of global molybdenum production (according to production in 2018). Mining alone is the main driving factor causing the ‘extremely high’ water stress due to exceeding the available water limits during the entire year as a result of hyper-arid conditions simultaneously paired with the highest rates of water consumption in the mining sector. Owing to the fact that copper mining is ranked as one of the largest water-consuming sectors in the global mining industry, many large-scale production capacities are primarily located in Chile, therefore resulting in intense water scarcity impacts in the Chilean Loa Basin. As a consequence, the total annual water scarcity impact caused by mining operations in Loa Basin accounts for 368.17 Mm3, of which 338.3 Mm3 is associated with copper mining, which represents 14.5% of the global copper-related water scarcity effect. Another large water scarcity impact of 22.5 Mm3 results from molybdenum mining, which is often jointly performed with copper production.
  • Similar to Loa Basin, the Pilbara region in northwestern Australia is also characterized by high water scarcity impacts due to large-scale mining under arid conditions. Pilbara comprises three river basins, namely De Grey River (Figure 4a, basin no. 321), Fortescue (basin no. 323) and Ashburton (basin no. 327), altogether providing 53.3% of the global iron ore fine supply—i.e., the overall results in Pilbara are significantly influenced by iron ore mining. However, the percentage of water consumption for mining in Pilbara varies significantly between the basins. For instance, while mining’s influence on the basin’s water stress in De Grey River is basically low (usually below 10% of the basin’s total water consumption per month), its contribution to the overall water stress in Ashburton is slightly above 10% in the period from January to March but exceeds the EWR limits significantly from September to October, thus causing a range of ‘low–medium’ to ‘extremely high’ water stress throughout the year. By contrast, in Fortescue River Basin, mining alone is responsible for the ‘extremely high’ water stress during most of the year, particularly surpassing EWR thresholds from April to December. Overall, as the production of iron ore fines is responsible for the largest global water consumption amongst all mining commodities observed in this study, Pilbara is, after Loa Basin, the most prominent area affected by high mining-related water stress as well as a water scarcity impact accounting for 1039.91 Mm3 in total. This represents roughly 55% of the global water scarcity effect resulting from iron ore mining, particularly regarding iron ore fines.
  • Orange Basin (Figure 4a, basin no. 326) and Limpopo Basin (basin no. 320) are further prominent examples of river catchments affected by high water stress and water scarcity effects caused by the mining industry. Both basins are located in South Africa, covering areas of the Republic of South Africa, Lesotho, Namibia, Botswana, Zimbabwe and Mozambique. While Limpopo Basin supplied 68.3% (146.7 t) of global platinum and 36.9% (80.3 t) of palladium production in 2018, mining operations situated in Orange Basin contributed to 4.3% (114.4 t) of global gold production, which is the largest gold production capacity in the basins observed. However, even relatively low quantities of metal production for gold or platinum group metals, for example, may cause high water stress and water scarcity impacts, particularly due to the relatively high specific water demand per t refined metal. Consequently, both basins are highly influenced by water consumption for the precious metals mining and refining industry. Overall, this mining sector is mostly responsible for ‘low’ water stress in both basins, primarily averaging between 5 and 9% from June and December and peaking at 13.5% in November, which is classified as ‘low–medium’ water stress. Besides gold and PGM production, mining of copper, iron ore and manganese also has a significant influence on the hydrological system of both basins. Manganese production in Orange Basin represents 35.6% of global manganese production, resulting in a global water scarcity footprint (WSFP) of 74.4% for manganese mining. While the total WSFP of mining in Orange Basin is 270 Mm3, the annual mining-related WSFP in Limpopo Basin is estimated to be 256 Mm3, mainly caused by the mining and refining of platinum group metals. For instance, palladium production in Limpopo accounts for 72.6% of the global palladium WSFP and platinum production accounts for approximately 81% of the global platinum WSFP.
Besides Loa, Pilbara, Orange and Limpopo, other basins have to be mentioned due to the significant water scarcity impacts from mining. Firstly, the transboundary Issyk-Kul Basin (Figure 4, basin no. 392) shared by Kazakhstan and Kyrgyzstan holds a water scarcity impact of 255.89 Mm3, which results predominantly from the production of uranium concentrate (U3O8), contributing to 40.3% of the global uranium WSFP. Secondly, in China’s Huang He Basin (Yellow River, basin no. 149), mining-related water scarcity effects account for 200.82 Mm3, mainly caused by lead, molybdenum and nickel production. Thirdly, Colorado River Basin (basin no. 138) and Great Salt Lake Basin (basin no. 401), both situated in the southwest of the United States, are also characterized by high mining-related WSFPs of 192.46 and 59.31 Mm3, respectively. Both basins hold roughly 5.4% of global copper and 9.5% of global molybdenum mining production. Ob Basin is also considered a catchment with high water scarcity effects of mining, accounting for 131.99 Mm3, mainly as it contributes to 3.4% of global bauxite mining as well as 4.7% of zinc and 5.4% of lead mining. However, mining’s influence on water stress in Ob Basin accounts for less than 0.1%, which is almost negligible compared to other water-consuming sectors in the basin. Finally, Dnieper Basin is also ranked amongst the basins with the highest mining-related WSFPs at 114.75 Mm3, with mining-induced ‘low’ water stress.
In addition to all the basins mentioned above, characterized by high water consumption in the mining industry, Eyre Lake Basin in Australia (basin no. 394) is an exceptional case with a moderate water scarcity impact accounting for 29.4 Mm3 in total. However, due to the fact that the basin’s climate is predominantly classified as arid to hyper-arid, mining is responsible for ‘extremely high’ water stress, exceeding EWR thresholds during the entire year.
Overall, the brief examinations of the selected basins clearly showed the wide range of region-specific influences under which water is used and consumed in the mining sector and its respective influence on water availability and water stress on both a monthly and an annual basis. It was also shown that in the case of high water availability, high water scarcity impacts of mining do not necessarily result in high water stress levels significantly affecting regional carrying capacities. However, in some basins mining is clearly the dominant factor in regional water consumption during the entire year, thus highly influencing local water stress conditions.

4. Discussion and Conclusions

The methodological approach provided in this article, combining a geographical information system (GIS) with LCA-based water use inventories and finally providing information about water stress and the water scarcity effects of the mining industry, not only enables conducting water impact assessments at the explicit regional level but also provides a comprehensive view on how mining activities are distributed all over the world in relation to regional water stress contexts. Consequently, this provides an advanced understanding of the complexity and wide range of water footprints occurring in the mining industry.
The results of this approach may also support decision making in both integrated water resource management processes at a regional level and raw materials criticality assessments at a global level, taking into account environmental risks caused by metal production. Raw materials criticality assessments primarily observe supply risks and environmental impacts as a result of a single raw material production; however, this GIS-based approach also provides data on cumulative water impacts caused by the production of multiple mining commodities at a particular place or region. Owing to the fact that numerous mining projects jointly produce various metals and their concentrates simultaneously, cumulative assessment considering all commodities produced at a particular mining location and within the entire basin should be the standard to cover the entire range of impacts instead of assessing the impacts of individual commodities separately—particularly with respect to SDG 6.4 [52], which recommends a comprehensive water impact assessment at the catchment level. As risk analyses have been carried out exclusively from the raw material point of view thus far, future impact assessments should also be carried out from the perspective of the region in which the entire production and the associated environmental impacts occur. This approach increasingly reflects the circumstances under which raw materials are produced, providing important information to address region-specific challenges to overcome in order to advance the mining sector towards sustainable supply of natural resources, particularly with respect to local environmental water requirements. Consequently, this transdisciplinary approach helps to significantly specify and improve the criticality assessment of raw materials with respect to water-related risks. In terms of future development, this approach could also be further expanded by increasing the scope by incorporating additional environmental impact categories, particularly those related to the SDG framework. Broadening this scope of sustainability assessment is necessary to gain a more holistic view of the complexity and wide range of impacts related to global mining and raw materials supply in general.
Despite the promising outcomes of this GIS-based approach, there are notable limits that were also identified in this study, particularly in relation to the quality and availability of water-specific LCA inventory data as well as the representativeness of the WSI characterization factor used in the GIS. These limitations have to be considered for future research on water footprints in the mining sector. The most relevant is the fact that the number of publications observing the water consumption of metal mining is still very limited, and the available LCA data show significant variability for individual mining operations and processing methods throughout the entire literature reviewed. This variation is due to the different mine types, ore types and given mineral grades and thus the different processing pathways applied to produce mining commodities. In addition, the LCA data provided by established LCA databases, e.g., Ecoinvent [86] and PROBAS [90], are not up to date consistently over all datasets. For example, some of the data records still refer to a time period before 2000 and are thus increasingly outdated or particularly addressing traditional mining and refining methods only, almost neglecting the latest developments in mining technology. Furthermore, depending on the geological setting of mining locations, different extraction methods are applied, e.g., leaching methods, or combined and modified as mining projects move from open pit to underground mining as a result of declining ore grades in the minerals mined. Correspondingly, each extraction technique is characterized by a wide range of water consumption volumes, which is not fully covered by LCA data. Furthermore, different system boundaries were determined by the consulted studies, conducted for different mine sites and time periods. As a consequence, the comparison of data within the literature was very limited, particularly between all commodities observed. As the water impact assessment of this survey is related to different processing stages of the particular commodities, such as preprocessed ore, concentrates or refined metals, even in this study comparison of the results of each commodity is only useful to a limited extent. Moreover, there is notable variability and substantial uncertainty inherent in the existing inventory data for mining commodities, particularly with regard to the origin of the water sources obtained for individual mining operations, and the shares of reused mine water are mostly unknown or neglected. Additionally, water treatment and desalination were not considered but play an important role in mining’s current and future water supply. These measures in the field of water management might also help to reduce pressures on local water sources and thus minimize mining’s influence on local water conflicts. However, these efforts are not measured as part of many LCA studies and inventory datasets, thus making interpretation of the water stress resulting from mining extremely difficult.
Besides LCA-related limits, there are also challenges and restrictions to be mentioned concerning the WSI characterization factor as well as the EWR thresholds applied in the GIS. Even though EWR was considered in the water impact assessment, only average EWR values at the continental level were used in the GIS model. Thus, while working on a global scale with such a complex issue, numerous assumptions in defining the EWR values for both river water and groundwater had to be made. Based on these limitations, there is an urgent need for catchment-specific EWR quantifications because there are manifold ecological differences to be observed across a continent-wide area which are not representative for each particular mining location. Consequently, more recent, detailed and locally sourced data on water availability, water demand and environmental water requirements would be helpful to assess water-related risks more accurately. Finally, depending on the commodities observed, all the mining locations taken into account represent a range of approximately 60–100% of the global production volumes. Thus, uncertainty still remains with regard to the water impact intensities of mining locations which were neglected in this study.
However, as the findings of this study notably advance the understanding of the relationship between the increasing global demand of mining commodities and simultaneously rising water shortages on a regional scale, this GIS-based assessment approach does not aim to replace detailed water impact assessment at the local level. It is, rather, intended to enhance global impact assessments increasingly based on data derived from explicit locations where mining and metal production sites are situated. Hence, to understand the complex and individual interactions between mining and other water-consuming sectors, further case studies are needed to complement both the quantitative and qualitative aspects of water-related impacts as a result of a global mining industry that is still expected to grow in the future.

Supplementary Materials

The following are available online at https://www.mdpi.com/article/10.3390/resources10120120/s1; Figure S2a–n: Locations of mining properties of all 14 individual mining commodities in relation to water stress at sub-basin level; Figure S6a–m: World maps of monthly basin-related water stress as a result of mining. Tables S1 and S2 in the calculation spreadsheet: Commodity-wise data on annual production, water consumption and water scarcity impact related to each mining operation (data for Figure 2a–c, Figure S2a–n, and Figure 3a,b); Table S3 in the calculation spreadsheet: Commodity-wise data on annual production, water consumption and water scarcity impact related to GRDC-basins (data for Figure 4a–c, Figure 5, Figure 6, Figure S6a–m and Table 4). In addition, Figure 1, Figure 2, Figure 3, Figure 4, Figure 5 and Figure 6 are included in the Supplementary Materials as high-resolution pdf files as well.

Funding

The APC was funded by the Environmental Science Center at the University of Augsburg and the license fee of SNL Metals & Mining Database was funded by the Chair of Resource Strategy at the University of Augsburg. Apart from this, the research received no external funding.

Institutional Review Board Statement

Not applicable.

Informed Consent Statement

Not applicable.

Data Availability Statement

The data presented in this study were predominantly obtained from publicly available literature sources and databases. The respective references are mentioned in the article. The only exceptions are selected datasets from the fee-based “SNL Metals & Mining database” (geographic coordinates and mine-site production volumes of all mining operations considered) and “Ecoinvent database” (commodity-specific water consumption values). The particular datasets are not publicly available due to the terms of use given by the publishers.

Conflicts of Interest

The author declares no conflict of interest.

Abbreviations

BWSBaseline water stress
CTAConsumption-to-availability ratio
EFREnvironmental flow requirement
EWREnvironmental water requirement
GISGeographic information system
GRDCGlobal Runoff Data Centre
ISOInternational Organization for Standardization
LCALife cycle assessment
MARMean annual runoff
RCPRepresentative concentration pathway
SDGSustainable development goal
SSPShared socioeconomic pathway
WAWater availability
WSWater stress
WSFPWater scarcity footprint
WSIWater stress index
WTAWithdrawal-to-availability ratio
WUWater use

References

  1. Helbig, C.; Bruckler, M.; Thorenz, A.; Tuma, A. An Overview of Indicator Choice and Normalization in Raw Material Supply Risk Assessments. Resources 2021, 10, 79. [Google Scholar] [CrossRef]
  2. Sonderegger, T.; Berger, M.; Alvarenga, R.; Bach, V.; Cimprich, A.; Dewulf, J.; Frischknecht, R.; Guinée, J.; Helbig, C.; Huppertz, T.; et al. Mineral resources in life cycle impact assessment—Part I: A critical review of existing methods. Int. J. Life Cycle Assess. 2020, 25, 784–797. [Google Scholar] [CrossRef]
  3. Spitz, K.; Trudinger, J. Mining and the Environment. From Ore to Metal; CRC Press Taylor & Francis Group: London, UK, 2009. [Google Scholar]
  4. Schrijvers, D.; Hool, A.; Blengini, G.A.; Chen, W.-Q.; Dewulf, J.; Eggert, R.; van Ellen, L.; Gauss, R.; Goddin, J.; Habib, K.; et al. A review of methods and data to determine raw material criticality. Resour. Conserv. Recycl. 2020, 155, 104617. [Google Scholar] [CrossRef]
  5. Gunson, A.J.; Klein, B.; Veiga, M.; Dunbar, S. Reducing mine water requirements. J. Clean. Prod. 2012, 21, 71–82. [Google Scholar] [CrossRef]
  6. Brown, E. Water for a sustainable minerals industry—A review. In Proceedings of the Water in Mining 2003, Brisbane, Australia, 13–15 October 2003; The Australasian Institute of Mining and Metallurgy (AusIMM): Brisbane, Australia, 2003. [Google Scholar]
  7. Bangerter, P.; Dixon, R.; Villegas, M. Improving overall usage of water in mining-A sustainable development approach. In Proceedings of the 2nd International Congress on Water Management in the Mining Industry, Water in Mining, Antofagasta, Chile, 2–4 June 2010; Wiertz, J., Ed.; p. 403. [Google Scholar]
  8. Nedved, M.; Jansz, J. Waste water pollution control in the Australian mining industry. J. Clean. Prod. 2006, 14, 1118–1120. [Google Scholar] [CrossRef]
  9. Akcil, A.; Koldas, S. Acid mine drainage (AMD): Causes, treatment and case studies. J. Clean. Prod. 2006, 14, 1139–1145. [Google Scholar] [CrossRef]
  10. Cohen, R. Use of microbes for cost reduction of metal removal from metals and mining industry waste streams. J. Clean. Prod. 2006, 14, 1146–1157. [Google Scholar] [CrossRef]
  11. Santana, C.S.; Montalván, D.M.; Vinnícius, O.; Francisco, H.C.S.; Fermin, H.M.L.; Raildo, G.V.; de Jesus, M. Assessment of water resources pollution associated with mining activity in a semi-arid region. J. Environ. Manag. 2020, 273, 111148. [Google Scholar] [CrossRef]
  12. Ugya, A.; Ajibade, F.; Ajibade, T. Water pollution resulting from mining activity: An overview. In Proceedings of the 2018 Annual Conference of the School of Engineering & Engineering Technology, The Federal University of Technology (FUTA), Akure, Nigeria, 17–19 July 2018; Available online: https://www.researchgate.net/publication/326925600_Water_Pollution_Resulting_From_Mining_Activity_An_Overview (accessed on 6 November 2021).
  13. Mudd, G.M. Sustainability Reporting and Water Resources: A Preliminary Assessment of Embodied Water and Sustainable Mining. Mine Water Environ. 2008, 27, 136–144. [Google Scholar] [CrossRef]
  14. Northey, S.A.; Mudd, G.M.; Saarivuori, E.; Wessman-Jääskeläinen, H.; Haque, N. Water footprinting and mining: Where are the limitations and opportunities? J. Clean. Prod. 2016, 135, 1098–1116. [Google Scholar] [CrossRef]
  15. Meißner, S. Global Metal Mining and Physical Water Stress–Water Impact Assessment of the Mining Industry within the Raw Materials Criticality Methodology. Habilitation-Thesis, University of Augsburg, Augsburg, Germany, 20 June 2021. [Google Scholar]
  16. Northey, S.A.; Mudd, G.M.; Werner, T.T.; Jowitt, S.M.; Haque, N.; Yellishetty, M.; Weng, Z. The exposure of global base metal resources to water criticality, scarcity and climate change. Glob. Environ. Chang. 2017, 44, 109–124. [Google Scholar] [CrossRef]
  17. International Council on Mining & Metals (ICMM) (Ed.) Where and How does Mining Take Place? London, UK. 2019. Available online: https://www.icmm.com/en-gb/metals-and-minerals/producing-metals/where-and-how-does-mining-take-place (accessed on 20 December 2019).
  18. Gilsbach, L.; Schütte, P.; Franken, G. Applying water risk assessment methods in mining: Current challenges and opportunities. Water Resour. Ind. 2019, 22, 100118. [Google Scholar] [CrossRef]
  19. Kinnunen, P.; Obenaus-Emler, R.; Raatikainen, J.; Guignot, S.; Guimerà, G.; Ciroth, A.; Heiskanen, K. Review of closed water loops with ore sorting and tailings valorisation for a more sustainable mining industry. J. Clean. Prod. 2021, 278, 123237. [Google Scholar] [CrossRef]
  20. Masood, N.; Hudson-Edwards, K.; Farooqi, A. True cost of coal: Coal mining industry and its associated environmental impacts on water resource development. J. Sustain. Min. 2020, 19, 135–149. [Google Scholar] [CrossRef]
  21. Miller, K.D.; Bentley, M.J.; Joseph, N.; Linden, R.K.G.; Larison, C.; Kienzle, B.A.; Katz, L.E.; Wilson, A.M.; Cox, J.T.; Kurup, P.; et al. Mine Water Use, Treatment, and Reuse in the United States: A Look at Current Industry Practices and Select Case Studies. ACS ES&T Eng. 2021. [Google Scholar] [CrossRef]
  22. Le, T.M.K.; Miettinen, H.; Bomberg, M.; Schreithofer, N.; Dahl, O. Challenges in the Assessment of Mining Process Water Quality. Minerals 2020, 10, 940. [Google Scholar] [CrossRef]
  23. International Aluminium Institute (IAI). Life Cycle Inventory Data and Environmental Metrics for the Primary Aluminium Industry, 2015 Data; International Aluminium Institute: London, UK, 2017. [Google Scholar]
  24. Cote, C.; Moran, C.; Cummings, J.; Ringwood, K. Developing a water accounting framework for the Australian minerals industry. Min. Technol. 2009, 118, 162–176. [Google Scholar] [CrossRef]
  25. Cote, C.; Moran, C.; Hedemann, C.; Koch, C. Systems modelling for effective mine water management. Environ. Model. Softw. 2010, 25, 1664–1671. [Google Scholar] [CrossRef]
  26. Ferreira, H.; Leite, M.G.P. A Life Cycle Assessment study of iron ore mining. J. Clean. Prod. 2015, 108, 1081–1091. [Google Scholar] [CrossRef]
  27. Gunson, A.J. Quantifying, Reducing and Improving Mine Water Use. Ph.D. Thesis, University of British Columbia, Vancouver, BC, Canada, 2013. [Google Scholar] [CrossRef]
  28. Lutter, S.; Giljum, S. Copper Production in Chile Requires 500 Million Cubic Metres of Water. An Assessment of the Water Use by Chile’s Copper Mining Industry; FINEPRINT Brief No. 9; Vienna University of Economics and Business: Vienna, Austria, 2019; Available online: https://www.fineprint.global/publications/briefs/chile-copper-water/ (accessed on 26 October 2020).
  29. Mudd, G.M. An analysis of historic production trends in Australian base metal mining. Ore Geol. Rev. 2007, 32, 227–261. [Google Scholar] [CrossRef]
  30. Mudd, G.M. Gold mining in Australia: Linking historical trends and environmental and resource sustainability. Environ. Sci. Policy 2007, 10, 629–644. [Google Scholar] [CrossRef]
  31. Mudd, G.M. The Sustainability of Mining in Australia: Key Production Trends and Their Environmental Implications for the Future; Research Report No. RR5; Department of Civil Engineering, Monash University and Mineral Policy Institute: Clayton, Australia, 2009. [Google Scholar]
  32. Norgate, T.; Haque, N. Energy and greenhouse gas impacts of mining and mineral processing operations. J. Clean. Prod. 2010, 18, 266–274. [Google Scholar] [CrossRef]
  33. Northey, S.A.; Haque, N.; Mudd, G. Using sustainability reporting to assess the environmental footprint of copper mining. J. Clean. Prod. 2013, 40, 118–128. [Google Scholar] [CrossRef]
  34. Northey, S.A. Assessing Water Risks in the Mining Industry Using Life Cycle Assessment Based Approaches. Ph.D. Thesis, Monash University, Clayton, Australia, 2018. [Google Scholar]
  35. Northey, S.A.; Mudd, G.M.; Werner, T.T.; Haque, N.; Yellishetty, M. Sustainable water management and improved corporate reporting in mining. Water Resour. Ind. 2019, 21, 100104. [Google Scholar] [CrossRef]
  36. Suppen, N.; Carranza, M.; Huerta, M.; Hernández, M.A. Environmental management and life cycle approaches in the Mexican mining industry. J. Clean. Prod. 2006, 14, 1101–1115. [Google Scholar] [CrossRef]
  37. Worrall, R.; Neil, D.; Brereton, D.; Mulligan, D. Towards a sustainability criteria and indicators framework for legacy mine land. J. Clean. Prod. 2009, 17, 1426–1434. [Google Scholar] [CrossRef]
  38. Damkjaer, S.; Taylor, R. The measurement of water scarcity: Defining a meaningful indicator. Ambio 2017, 46, 513–531. [Google Scholar] [CrossRef] [Green Version]
  39. International Organization for Standardization (ISO). ISO 14040:2006. Environmental Management-Life Cycle Assessment—Principles and Framework; International Organization for Standardization (ISO): Geneva, Switzerland, 2006. [Google Scholar]
  40. International Organization for Standardization (ISO). ISO 14046:2014. Environmental Management-Water Footprint-Principles, Requirements and Guidelines; International Organization for Standardization (ISO): Geneva, Switzerland, 2014. [Google Scholar]
  41. Allan, J.A. Fortunately there are Substitutes for Water Otherwise our Hydro-political Futures would be Impossible, Priorities for Water Resources Allocation and Management. In Priorities for water resources allocation and management; ODA: London, UK, 1993; pp. 13–26. [Google Scholar]
  42. Allan, J.A. Overall Perspectives on Countries and Regions. In Water in the Arab World: Perspectives and Prognoses; Rogers, P., Lydon, P., Eds.; Harvard University Press: Cambridge, UK, 1994; pp. 65–100. [Google Scholar]
  43. Hoekstra, A.Y. (Ed.) Virtual Water Trade. In Proceedings of the International Expert Meeting on Virtual Water Trade; Value of Water Research Report Series No. 12; IHE Delft: Delft, The Netherlands, 2003. [Google Scholar]
  44. Hoekstra, A.Y.; Chapagain, A.K.; Aldaya, M.M.; Mekonnen, M.M. Water Footprint Manual, State of the Art 2009; Water Footprint Network, Earthscan: London, UK, 2009. [Google Scholar]
  45. Hoekstra, A.Y.; Chapagain, A.K.; Aldaya, M.M.; Mekonnen, M.M. The Water Footprint Assessment Manual: Setting the Global Standard; Water Footprint Network, Earthscan: London, UK, 2011. [Google Scholar]
  46. Pfister, S. Environmental Evaluation of Freshwater Consumption within the Framework of Life Cycle Assessment. Ph.D. Thesis, Diss. ETH no. 19490. ETH Zurich, Zurich, Switzerland, 2011. [Google Scholar] [CrossRef]
  47. Kasbohm, J.; Grothe, S.; Steingrube, W.; Lài, L.; Ngân, L.; Hồng, N.T.; Oanh, L.T.K.; Hương, N.Q. Integrated water resources management (iwrm)–An introduction. J. Geol. 2009, 33, 3–14. Available online: https://www.researchgate.net/publication/237062491 (accessed on 26 October 2020).
  48. Falkenmark, M.; Lundqvist, J.; Widstrand, C. Macro-scale water scarcity requires micro-scale approaches. Natl. Resour. Forum 1989, 13, 258–267. [Google Scholar] [CrossRef] [PubMed]
  49. Brown, A.; Matlock, M.D. A Review of Water Scarcity Indices and Methodologies; White Paper; Sustainability Consortium: Scottsdale, AZ, USA; Fayetteville, NC, USA; Den Haag, The Netherlands, 2011; Volume 106, Available online: https://www.sustainabilityconsortium.org/tsc-downloads/a-review-of-water-scarcity-indices-and-methodologies/ (accessed on 24 October 2020).
  50. Liu, J.; Yang, H.; Gosling, S.N.; Kummu, M.; Flörke, M.; Pfister, S.; Hanasaki, N.; Wada, Y.; Zhang, X.; Zheng, C. Water scarcity assessments in the past, present, and future. Earth’s Future 2017, 5, 545–559. [Google Scholar] [CrossRef]
  51. Rijsberman, F.R. Water scarcity: Fact or fiction? Agric. Water Manag. 2006, 80, 5–22. [Google Scholar] [CrossRef] [Green Version]
  52. Vanham, D.; Hoekstra, A.Y.; Wada, Y.; Bouraoui, F.; de Roo, A.; Mekonnen, M.; van de Bund, W.; Batelaan, O.; Pavelic, P.; Bastiaanssen, W.; et al. Physical water scarcity metrics for monitoring progress towards SDG target 6.4: An evaluation of indicator 6.4.2 “Level of water stress”. Sci. Total Environ. 2018, 613–614, 218–232. [Google Scholar] [CrossRef]
  53. Falkenmark, M.; Gunnar, L. How can we cope with the water resources situation by the year 2015? Ambio 1974, 3, 114–122. Available online: https://www.jstor.org/stable/4312063 (accessed on 26 October 2020).
  54. Raskin, P.; Gleick, P.; Kirshen, P.; Pontius, G.; Strzepek, K. Water Futures: Assessment of long-range patterns and problems. Comprehensive Assessment of the Freshwater Resources of the World; SEI report; Stockholm Environment Institute: Stockholm, Sweden, 1997. [Google Scholar]
  55. Rockström, J.; Falkenmark, M.; Karlberg, L.; Hoff, H.; Rost, S.; Gerten, D. Future water availability for global food production: The potential of green water for increasing resilience to global change. Water Resour. Res. 2009, 45, W00A12. [Google Scholar] [CrossRef] [Green Version]
  56. Swain, A.; Wallensteen, P. Comprehensive Assessment of the Freshwater Resources of the World, International Fresh Water Resources: Conflict or Cooperation? Stockholm Environment Institute: Stockholm, Sweden, 1997. [Google Scholar]
  57. Alcamo, J.; Henrich, T.; Rosch, T. World Water in 2025-Global Modelling and Scenario Analysis for the World Commission on Water for the 21st Century; Report A0002; Centre for Environmental System Research, University of Kassel: Kassel, Germany, 2000. [Google Scholar]
  58. Arnell, N.W. Climate change and global water resources. Glob. Environ. Chang. 1999, 9 (Suppl. 1), S31–S49. [Google Scholar] [CrossRef]
  59. Arnell, N.W. Climate change and global water resources: SRES emissions and socioeconomic scenarios. Glob. Environ. Chang. 2004, 14, 31–52. [Google Scholar] [CrossRef]
  60. Oki, T.; Agata, Y.; Kanae, S.; Saruhashi, T.; Yang, D.; Musiake, K. Global assessment of current water resources using total runoff integrating pathways. Hydrol. Sci. J. 2001, 46, 983–995. [Google Scholar] [CrossRef] [Green Version]
  61. Seckler, D.; Barker, R.; Amarasinghe, U. Water scarcity in the twenty-first century. Int. J. Water Resour. Dev. 1999, 15, 29–42. [Google Scholar] [CrossRef]
  62. Vörösmarty, C.J.; Green, P.; Salisbury, J.; Lammers, R.B. Global water resources: Vulnerability from climate change and population growth. Science 2000, 289, 284–288. [Google Scholar] [CrossRef] [PubMed] [Green Version]
  63. European Commission (EC). Ecological Flows in the Implementation of the Water Framework Directive; CIS Guidance Document n°31; European Commission, DG Environment: Bruxelles, Belgium, 2015. [Google Scholar] [CrossRef]
  64. European Environmental Agency (EEA). Water Exploitation Index. Available online: https://www.eea.europa.eu/data-and-maps/indicators/use-of-freshwater-resources-3/assessment-4 (accessed on 25 October 2020).
  65. Pfister, S.; Koehler, A.; Hellweg, S. Assessing the environmental impacts of freshwater consumption in LCA. Environ. Sci. Technol. 2009, 43, 4098–4104. [Google Scholar] [CrossRef] [PubMed] [Green Version]
  66. Ridoutt, B.G.; Pfister, S. A revised approach to water footprinting to make transparent the impacts of consumption and production on global freshwater scarcity. Glob. Environ. Chang. 2010, 20, 113–120. [Google Scholar] [CrossRef]
  67. Hoekstra, A.Y. A critique on the water-scarcity weighted water footprint in LCA. Ecol. Indic. 2016, 66, 564–573. [Google Scholar] [CrossRef] [Green Version]
  68. Pfister, S.; Boulay, A.-M.; Berger, M.; Hadjikakou, M.; Motoshita, M.; Hess, T.; Ridoutt, B.; Weinzettel, J.; Scherer, L.; Döll, P.; et al. Understanding the LCA and ISO water footprint: A response to Hoekstra (2016) “A critique on the water-scarcity weighted water footprint in LCA”. Ecol. Indic. 2017, 72, 352–359. [Google Scholar] [CrossRef]
  69. Gassert, F.; Luck, M.; Landis, M.; Reig, P.; Shiao, T. Aqueduct Global Maps 2.1: Constructing Decision-Relevant Global Water Risk Indicators; Working Paper; World Resources Institute: Washington, DC, USA, 2014; Available online: https://www.wri.org/research/aqueduct-global-maps-21-indicators (accessed on 23 September 2021).
  70. Gassert, F.; Reig, P.; Luo, T.; Maddocks, A. Aqueduct Country and River Basin Rankings: A Weighted Aggregation of Spatially Distinct Hydrological Indicators; Working paper; World Resources Institute: Washington, DC, USA, 2013; Available online: https://www.wri.org/research/aqueduct-country-and-river-basin-rankings (accessed on 23 September 2021).
  71. Commonwealth of Australia (CoA). Leading Practice Sustainable Development Program for the Mining Industry, Water Stewardship; Australian Government, Department of Industry, Science, Energy and Resources: Canberra, Australia, 2016. Available online: https://www.industry.gov.au/data-and-publications/leading-practice-handbook-water-stewardship (accessed on 23 September 2021).
  72. Sullivan, C. Calculating a Water Poverty Index. World Dev. 2002, 30, 1195–1210. [Google Scholar] [CrossRef]
  73. Sood, A.; Smakhtin, V.; Eriyagama, N.; Villholth, K.G.; Liyanage, N.; Wada, Y.; Ebrahim, G.; Dickens, C. Global Environmental Flow Information for the Sustainable Development Goals; IWMI Research Report 168; International Water Management Institute (IWMI): Colombo, Sri Lanka, 2017. [Google Scholar] [CrossRef] [Green Version]
  74. Zeiringer, B.; Seliger, C.; Greimel, F.; Schmutz, S. River Hydrology, Flow Alteration, and Environmental Flow. In Riverine Ecosysteme Management. Science for Governing towards a Sustainable Future; Aquatic Ecology Series; Schmutz, S., Sendizimir, J., Eds.; Springer: Cham, Germany, 2018; Volume 8, pp. 67–89. [Google Scholar] [CrossRef]
  75. Hirji, R.; Davis, R. Environmental Flows in Water Resources Policies, Plans, and Projects. Findings and Recommendations; World Bank: Washington, DC, USA, 2009. [Google Scholar] [CrossRef]
  76. Smakhtin, V.; Revenga, C.; Döll, P. Taking into Account Environmental Water Requirements in Global-Scale Water Resources Assessments; Comprehensive Assessment Research Report 2; Comprehensive Assessment Secretariat: Colombo, Sri Lanka, 2004. [Google Scholar]
  77. Falkenmark, M.; Berntell, A.; Jägerskog, A.; Lundqvist, J.; Matz, M.; Tropp, H. On the Verge of a New Water Scarcity: A Call for Good Governance and Human Ingenuity; SIWI Policy Brief; Stockholm International Water Institute (SIWI): Stockholm, Sweden, 2007. [Google Scholar]
  78. Pastor, A.V.; Ludwig, F.; Biemans, H.; Hoff, H.; Kabat, P. Accounting for environmental flow requirements in global water assessments. Hydrol. Earth Syst. Sci. 2014, 18, 5041–5059. [Google Scholar] [CrossRef] [Green Version]
  79. Richter, B.D.; Davis, M.M.; Apse, C.; Konrad, C. A presumptive standard for environmental flow protection. River Res. Appl. 2012, 28, 1312–1321. [Google Scholar] [CrossRef]
  80. Tharme, R.E. A global perspective on environmental flow assessment: Emerging trends in the development and application of environmental flow methodologies for rivers. River Res. Appl. 2003, 19, 397–441. [Google Scholar] [CrossRef]
  81. SNL Metals & Mining Database. Essential Mining Industry Data with Actionable Insights; S&P Global Market Intelligence (S&P): New York, NY, USA, 2019; Available online: https://www.spglobal.com/marketintelligence/en/solutions/metals-and-mining (accessed on 1 June 2019).
  82. Luck, M.; Landis, M.; Gassert, F. Aqueduct Water Stress Projections: Decadal Projections of Water Supply and Demand Using CMIP5 GCMs; Technical Note; World Resources Institute: Washington, DC, USA, 2015; Available online: https://www.wri.org/research/aqueduct-water-stress-projections-decadal-projections-water-supply-and-demand-using-cmip5 (accessed on 23 September 2021).
  83. Global Runoff Data Centre (GRDC). Major River Basins of the World/Global Runoff Data Centre; Federal Institute of Hydrology (BfG): Koblenz, Germany, 2007. Available online: https://www.bafg.de/GRDC/EN/02_srvcs/22_gslrs/221_MRB/riverbasins_node.html (accessed on 23 September 2021).
  84. Hoekstra, A.Y.; Mekonnen, M.M. Global Water Scarcity: Monthly Blue Water Footprint Compared to Blue Water Availability for the World’s Major River Basins; Value of Water Research Report Series No. 53; UNESCO-IHE: Delft, The Netherlands, 2011. [Google Scholar]
  85. Giurco, D.; Prior, T.; Mudd, G.; Mason, L.; Behrisch, J. Peak Minerals in Australia: A Review of Changing IMPACTS and Benefits; Prepared for CSIRO Minerals Down Under Flagship; Institute for Sustainable Futures (University of Technology, Sydney) and Department of Civil Engineering (Monash University): Sydney/Clayton, Australia, 2010. [Google Scholar]
  86. Frischknecht, R.; Jungbluth, N.; Althaus, H.-J.; Doka, G.; Dones, R.; Heck, T.; Hellweg, S.; Hischier, R.; Nemecek, T.; Rebitzer, G.; et al. The ecoinvent database: Overview and methodological framework. Int. J. Life Cycle Assess. 2005, 10, 3–9. [Google Scholar] [CrossRef]
  87. Buxmann, K.; Koehler, A.; Thylmann, D. Water scarcity footprint of primary aluminium. Int. J. Life Cycle Assess. 2016, 21, 1605–1615. [Google Scholar] [CrossRef] [Green Version]
  88. Dai, Q.; Kelly, J.C.; Elgowainy, A. Cobalt Life Cycle Analysis Update for the GREET Model; Argonne National Laboratory: Argonne, IL, USA, 2018. Available online: https://greet.es.anl.gov/publication-Li_battery_update_2017 (accessed on 25 October 2020).
  89. Shahjadi, H.F.; Nazmul Huda, M.A.; Parvez, M. Life cycle assessment of cobalt extraction process. J. Sustain. Min. 2019, 18, 150–161. [Google Scholar] [CrossRef]
  90. Fritsche, U. Process-oriented Basic Data for Environmental Management Instruments-www.probas.umweltbundesamt.de. Int. J. Life Cycle Assess. 2005, 10, 225. [Google Scholar] [CrossRef]
  91. Pena, C.; Huijbregts, M. The Blue Water Footprint of Primary Copper Production in Northern Chile. J. Ind. Ecol. 2013, 18, 49–58. [Google Scholar] [CrossRef]
  92. Haque, N.; Norgate, T. Life cycle assessment of iron ore mining and processing. In Iron Ore. Mineralogy, Processing and Environmental Sustainability; Lu, L., Ed.; Woodhead Publishing: Cambridge, UK, 2015; pp. 615–630. [Google Scholar] [CrossRef]
  93. Tost, M.; Bayer, B.; Hitch, M.; Lutter, S.; Moser, P.; Feiel, S. Metal Mining’s Environmental Pressures: A Review and Updated Estimates on CO2 Emissions, Water Use, and Land Requirements. Sustainability 2018, 10, 2881. [Google Scholar] [CrossRef] [Green Version]
  94. Mudd, G.M.; Diesendorf, M. Sustainability of Uranium Mining and Milling: Toward Quantifying Resources and Eco-Efficiency. Environ. Sci. Technol. 2008, 42, 2624–2630. [Google Scholar] [CrossRef]
  95. Norgate, T.; Haque, N. Using life cycle assessment to evaluate some environmental impacts of gold production. J. Clean. Prod. 2012, 29–30, 53–63. [Google Scholar] [CrossRef]
  96. Mudd, G.M. Resource Consumption Intensity and the Sustainability of Gold Mining. In Proceedings of the 2nd International Conference on Sustainability Engineering & Science, Auckland, New Zealand, 20–23 February 2007. [Google Scholar]
  97. Talbot, D.; Barbat, G. Water disclosure in the mining sector: An assessment of the credibility of sustainability reports. Corp. Soc. Responsib. Environ. Manag. 2020, 27, 1241–1251. [Google Scholar] [CrossRef]
  98. World Water Assessment Programme (WWAP). The United Nations World Water Development Report 2019: Leaving No One Behind; UNESCO: Paris, France, 2019. [Google Scholar]
  99. Mindat.org dba. Hudson Institute of Mineralogy, Ed.: Keswick, USA. 2019. Available online: https://www.mindat.org/ (accessed on 21 September 2021).
  100. United States Geological Survey (USGS). USGD, Ed.: Reston, USA. 2021. Available online: https://www.usgs.gov/ (accessed on 21 September 2021).
  101. British Geological Survey (BGS). BGS, Ed.: Nottingham, UK. 2021. Available online: https://www.bgs.ac.uk/ (accessed on 21 September 2021).
  102. Australian Geoscience Information Network (AUSGIN)-Geoscience Portal. Australian Government’s Department of Industry, Innovation and Science, Ed.: Canberra, Australia. 2021. Available online: https://portal.geoscience.gov.au/ (accessed on 21 September 2021).
  103. United States Geological Survey (USGS). Mineral Commodity Summaries 2020; U.S. Geological Survey: Reston, VA, USA, 2020. [CrossRef] [Green Version]
  104. Fekete, B.M.; Vörösmarty, C.J.; Grabs, W. High-resolution fields of global runoff combining observed river discharge and simulated water balances. Glob. Biogeochem. Cycles 2002, 16, 15/1–15/10. [Google Scholar] [CrossRef]
Figure 2. Locations of mining sites in 2018 in relation to water stress: (a) water stress at sub-basin level according to data sourced from Gassert et al. (2014) [69]; (b) mining locations of metal concentrates; (c) mining and production locations of refined metals, both related to water stress; mining and production coordinates were obtained from SNL Metals & Mining Database [81]. (Detailed maps of each individual commodity related to water stress are provided in the Supplementary Materials, see Figure S2a–n; GIS and mining data of Figure 2 and Figure S2a–n are also provided in the Supplementary Materials spreadsheet, see Table S1).
Resources 10 00120 g002
Figure 3. Commodity-wise comparison of mine-site water stress index (WSI) (a) in relation to the mine-site production volumes in 2018 and (b) in relation to water consumption and mine-site water scarcity footprint (WSFP). Production data was sourced from the SNL Metals & Mining Database [81]. Each mining site is classified according to water stress, the categorization of which is defined as follows: 0–1 = water stress < 10%; 1–2 = water stress 10–20%; 2–3 = water stress 20–40%; 3–4 = water stress 40–80%; 4–5 = water stress > 80%, including arid areas with low water use. If the production volumes and water consumption of a commodity are independent from water stress and thus more evenly scattered over all water stress categories, this is indicated by low r-squared values, as particularly exemplified by copper, gold, silver and zinc. As large water scarcity effects of mining usually occur in areas characterized by high water stress levels, the r-squared value of the water scarcity impact is typically high. Hence, the higher the production and respective water consumption are in high water stress areas, the higher the water scarcity impact will be, as particularly shown by cobalt, copper, gold and nickel. (Additional information and calculation data of Figure 3 are provided in the Supplementary Material spreadsheet, see Tables S1 and S2).
Resources 10 00120 g003aResources 10 00120 g003b
Figure 4. Total water consumption and water scarcity footprint as a result of mining according to major river basins as defined by the GRDC [83]: (a) global coverage of GRDC-basins; (b) total water consumption of mining; (c) total water scarcity footprint as a result of mining in each GRDC-river basin. (The description of the identification numbers of the GRDC catchment areas shown in Figure 4a as well as calculation data of Figure 4b,c is provided in the Supplementary Material spreadsheet, see Table S3).
Resources 10 00120 g004
Figure 5. Monthly water consumption of mining as a percentage of water availability in 147 major GRDC-basins hosting at least one mining operation of all mining projects considered in this survey (available water is defined as basin-specific runoff minus environmental water requirements); depending on the monthly proportion of available water consumed, mining results in intra-annually varying water stress levels. Water stress was determined by the proportion of water consumed in relation to the water available in the corresponding time period. (Calculation data of Figure 5 is provided in the Supplementary Materials spreadsheet, see Table S3).
Resources 10 00120 g005
Figure 6. Mean annual water stress in 147 GRDC-basins as a result of water consumption in mining. Water stress was determined by the proportion of the overall water consumed in mining within a basin in relation to basin-specific water availability. Water availability is defined as natural runoff minus environmental water requirement (EWR). Depending on the monthly proportion of available water consumed, mining results in intra-annually varying water stress levels; particularly in the case of the water consumption exceeding 100% of the regional water availability (referred to as regional EWR threshold or ‘economic carrying capacity’), mining significantly influences the carrying capacity of the corresponding basin within the given monthly time period. (GRDC-basins are obtained from GRDC [83]; a time series of detailed maps illustrating changes and intensity of monthly mining-induced water stress over the year is provided in the Supplementary Materials, see Figure S6a–m) calculation data of Figure 6 and Figure S6a–m is provided in the Supplementary Materials spreadsheet, see Table S3).
Resources 10 00120 g006
Table 1. EWR and sustainable groundwater abstraction on continent-level (data sourced from [73]).
Continental
Region
Annual Flow (km3a−1) and
Percentage of Natural Flow (%)
to Be Preserved as EWR
Sustainable Groundwater Abstraction (km3a−1) and Percentage of Natural Recharge (%)
Asia10,178.2 (57.0)110.3 (3.4)
North America3656.3 (55.2)30.3 (1.9)
Europe1489.7 (52.8)20.0 (1.7)
Africa5032.1 (70.2)14.3 (0.7)
South America11,242.9 (73.4)24.0 (0.6)
Oceania240.4 (35.1)2.6 (1.0)
Australia251.0 (48.4)1.9 (1.3)
Global32,090.6 (63.0)203.3 (1.6)
Table 4. GRDC-basins characterized by highest mining-related water consumption and water scarcity effects.
BasinBasin-IDWater
Consumption
(Mm3)
Water Scarcity Impact
(Mm3)
Water Consumption/Water Scarcity RatioMost Relevant Mining
Commodities
(in Terms of Production Volumes)
Fortescue River (Australia)No. 323522.7<1.0 1>500:1Iron ore
Tocantins (Brazil)No. 273259.9<1.0~260:1Iron ore
Ashburton River (Australia)No. 327208.01040.0~1:5Iron ore
Sao Francisco (Brazil)No. 290166.063.22.6:1Iron ore
Orange (South Africa)No. 32687.5270.61:3.1Gold, iron ore, manganese
Amazonas (Brazil)No. 25985.671.21:0.8Copper, gold, bauxite, zinc, silver
Limpopo (South Africa)No. 32076.8256.01:3.3Platinum, palladium, nickel, gold, copper
Loa (Chile)No. 31973.6270.61:3.7Copper, molybdenum, silver
Congo (Central Africa)No. 24369.1<1.0~70:1Copper, cobalt, gold
St. Lawrence (USA, Canada)No. 11762.5<1.0~100:1Nickel, cobalt, copper, gold
Zambezi (Central Africa)No. 29357.51.4~40:1Copper, nickel
Dnieper
(Ukraine, Belarus, Russia)
No. 9655.3114.81:2.1Iron ore
Issyk-Kul
(Kazakhstan, Kyrgyzstan)
No. 39251.2255.91:5Uranium
Ob (Russia)No. 2546.2132.01:2.9Gold, copper, zinc, iron ore, bauxite, lead, silver, uranium
Colorado River (USA, Mexico)No. 13843.9192.51:4.4Copper, molybdenum, gold
Huang He (Yellow River) (China)No. 14943.1200.81:4.7Nickel, molybdenum, gold, copper, zinc
1 Low water stress but classified as ‘arid and low water use’ according to Gassert et al. [69]. (Identification numbers of the GRDC catchment areas as well as basin-specific mining data, water consumption and water scarcity calculations are provided in the Supplementary Materials spreadsheet, see Table S3).
Publisher’s Note: MDPI stays neutral with regard to jurisdictional claims in published maps and institutional affiliations.

