
Multisided Platforms: Classification and Analysis


Abstract
:1. Introduction
- To show how to extend the Bass equation to MSPs with both same-side and cross-side network effects.
- To classify two-sided platforms according to same-side and cross-side network effects, and to develop a generic set of first-order differential equations for each class.
- To show mathematically that the initial growth of the platform may depend on the type of network effects in such a way that the market segments offered by the platform will not start growing unless there are some initial customers. This is often referred to as the “chicken and egg problem”. The strategic challenges are then (i) to identify whether this is the case for the platform and (ii) to determine how to persuade sufficient numbers of customers to start using the platform to reach a threshold at which the growth becomes self-sustained.
- To show that, even with an initial customer base, network effects may result in long latency periods until the market reaches a level at which the revenues from the platform become positive. Such behavior has been observed for, for example, Facebook [11]. This is also a strategic challenge because long latency may motivate the platform provider to terminate the service prematurely.
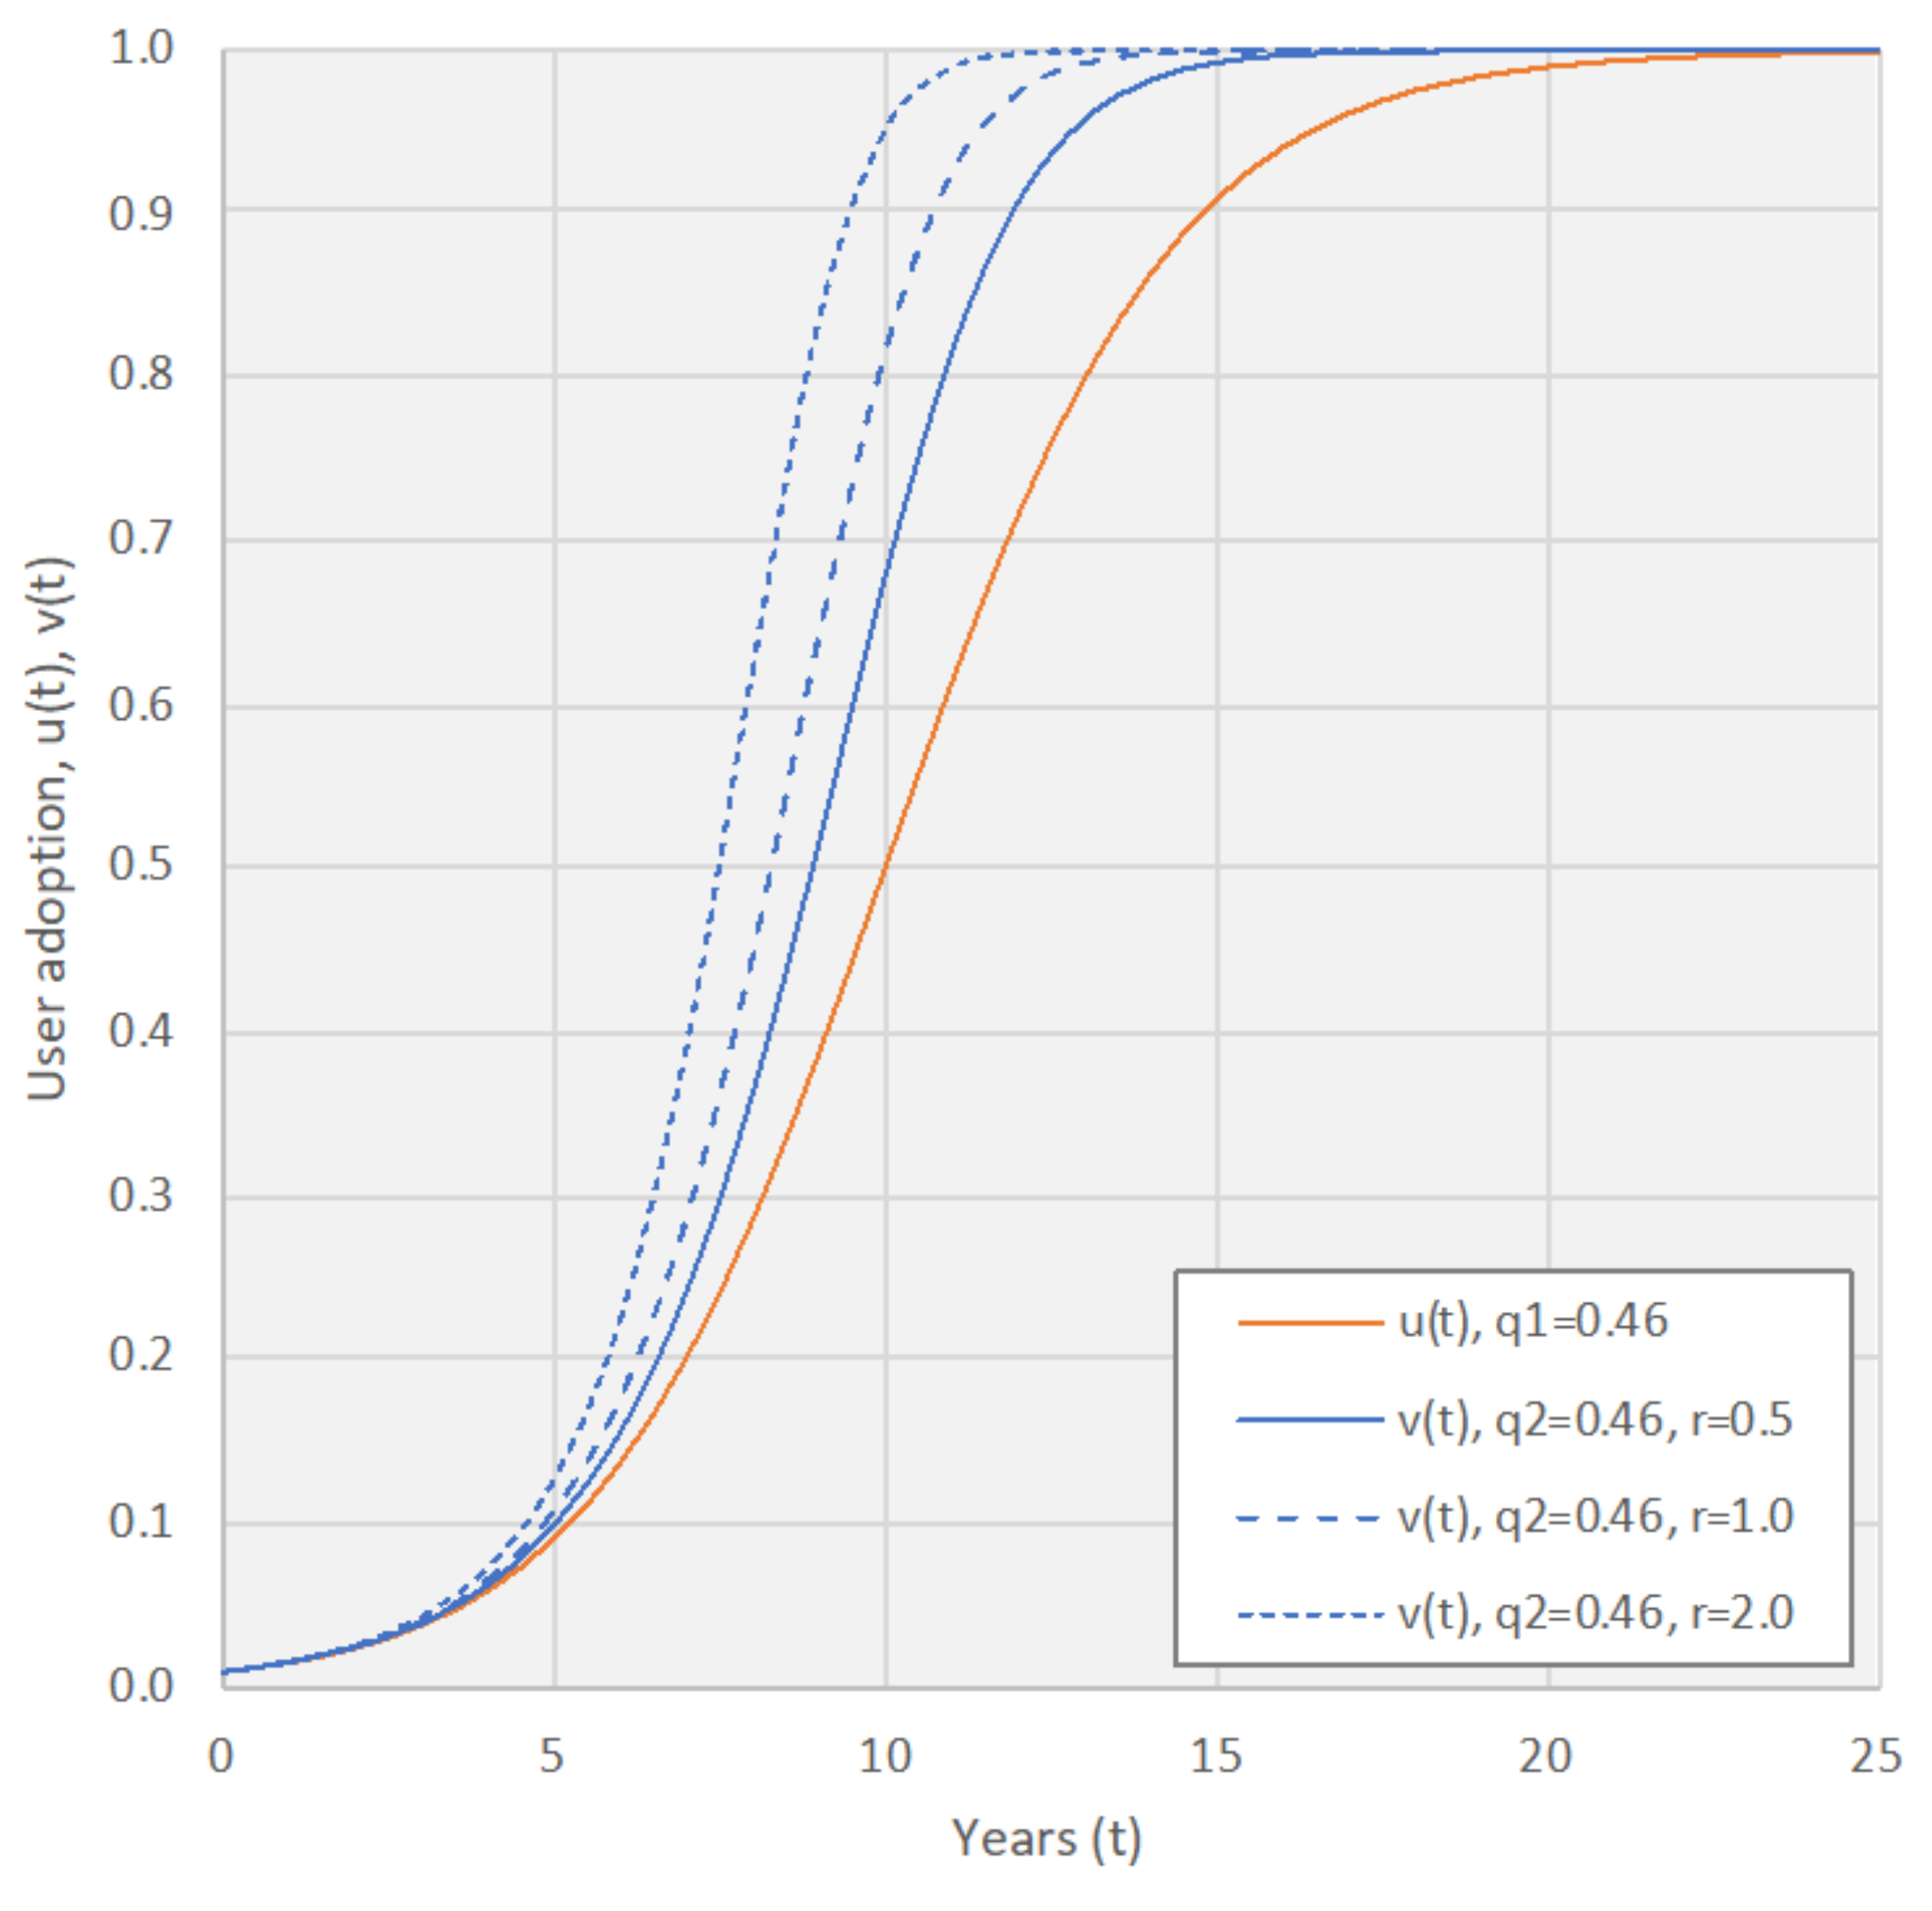
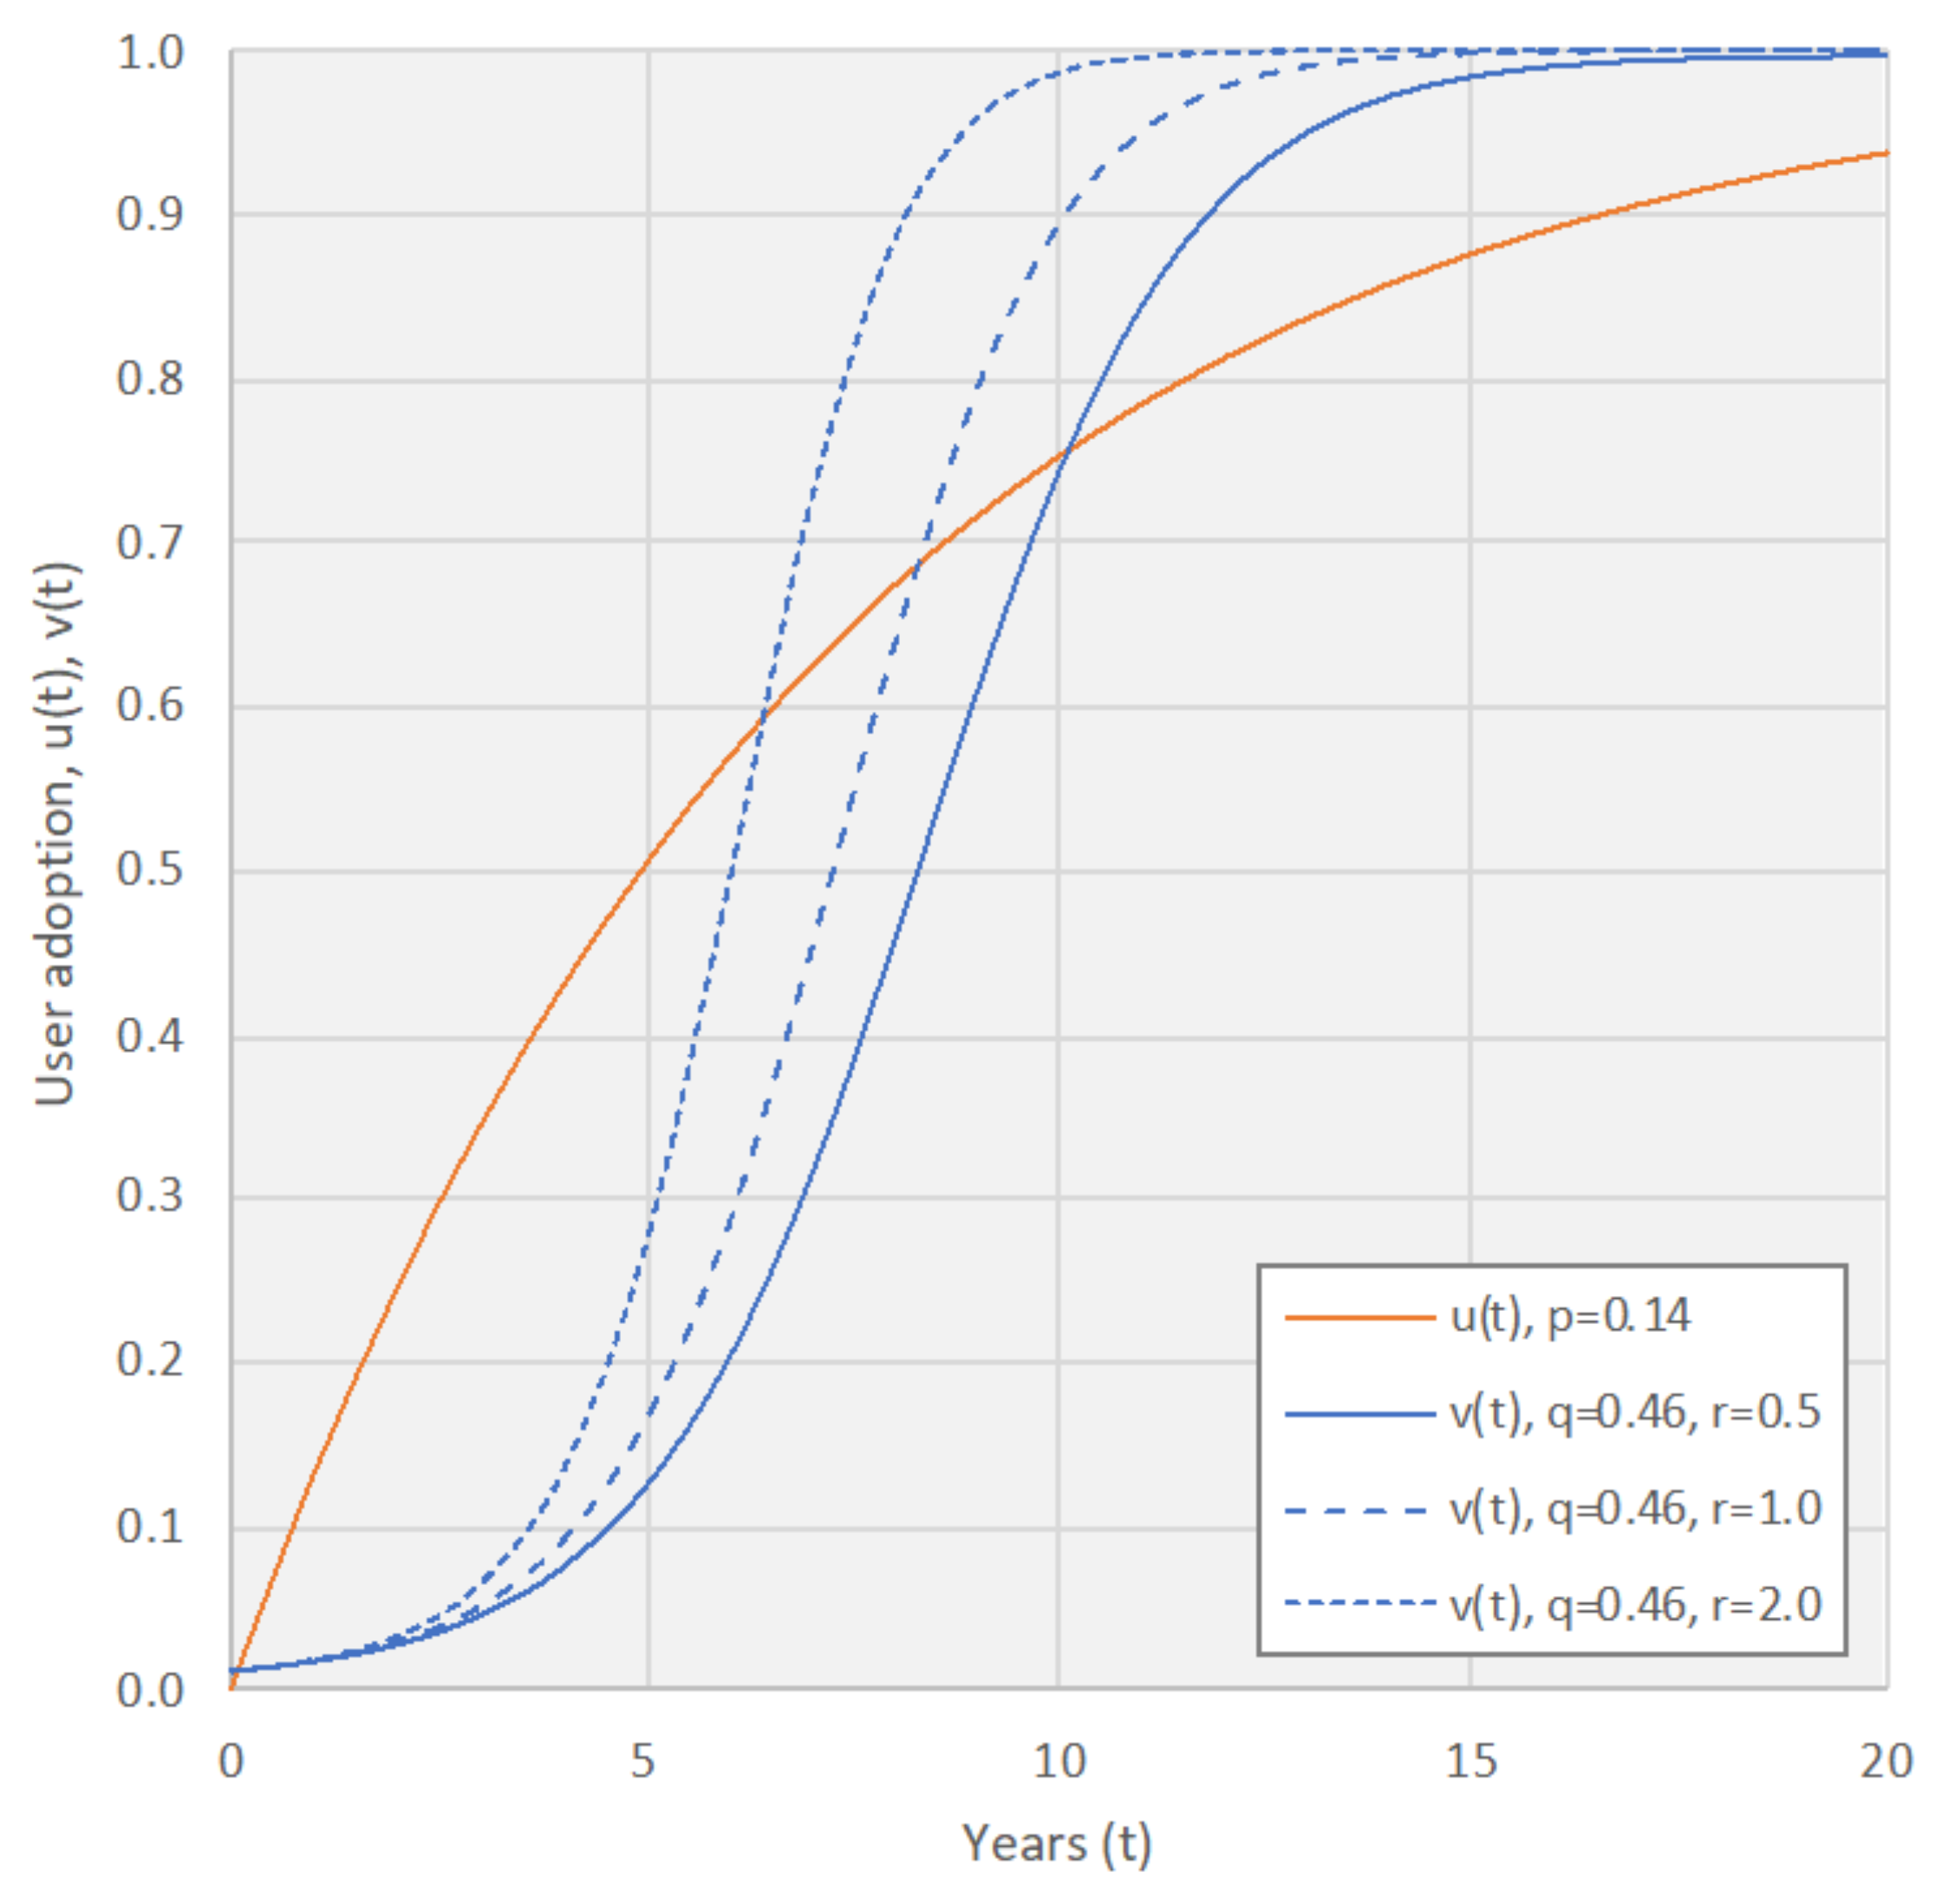
- To show that the market growth subject to strong network effects follows an S-curve shape, from slow initial growth (e.g., much slower than linear growth) to rapid growth after the market has exceeded a certain threshold.
2. Multisided Platforms
2.1. Background and Related Works
2.2. Market Feedback
2.3. Pricing
- All user groups pay for the services they receive, for example, sellers and buyers using eBay and property owners and renters on Airbnb.
- Some users of a user group may pay for the services they receive, and other users may receive downscaled services for free, while other user groups (e.g., advertisers) may pay for all services they receive (e.g., advertisements and marketing). Examples of businesses applying such payment methods are electronic newspapers and Spotify.
- One or several user groups receive the services for free while other user groups pay for the services (e.g., Facebook and Google Search).
2.4. Competition
2.5. Business Ecosystem
2.6. Market Regulations
3. A General Dynamic Model of MSPs
3.1. The Model
- Existence of innovators—or early adopters—joining the group independently of other users.
- Existence of imitators joining the group because other users have done so—same-side network effects.
- Existence of cross-side network effects causing users to join the group because other users have joined one or several other user groups.
3.2. The Feedback Function and Choice of Parameter Values
3.3. Combined Effect of Same-Side and Imitated Cross-Side Network Effects
4. Classification
- To identify whether the implementation is subject to strategic traps such as “chicken and egg” and long latency.
- To determine how each service of the platform is likely to evolve (following an S-curve or an exponential distribution).
- To use these observations to study the evolution of the money flow generated by the platform and future profit prospects.
5. Analysis
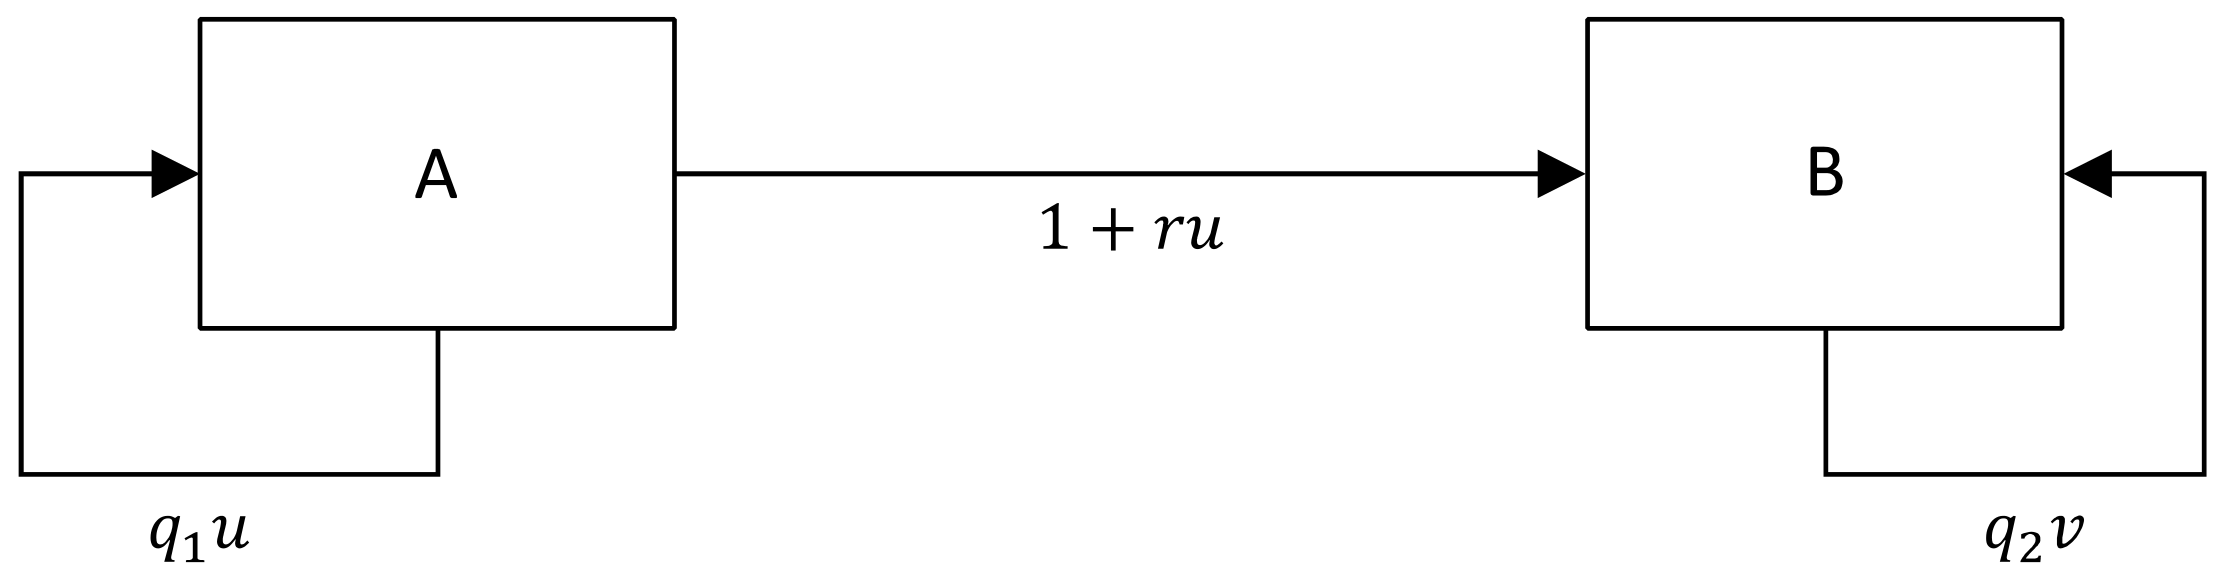
5.1. Same-Side Network Effects for Both User Groups and Cross-Side Network Effects between Both User Groups
- Guests benefit from hosts because of an increased number of potential accommodations.
- Hosts benefit from guests because of an increased number of potential customers.
- Guests benefit from other guests because of host reviews.
- Hosts benefit from other hosts because of guest reviews.
5.2. Same-Side Network Effects for Both User Groups and Cross-Side Network Effects from One User Group to the Other
- Drivers benefit from passengers because of an increased number of potential rides.
- Drivers benefit from other drivers because of passenger reviews.
- Passengers benefit from other passengers because of driver reviews.
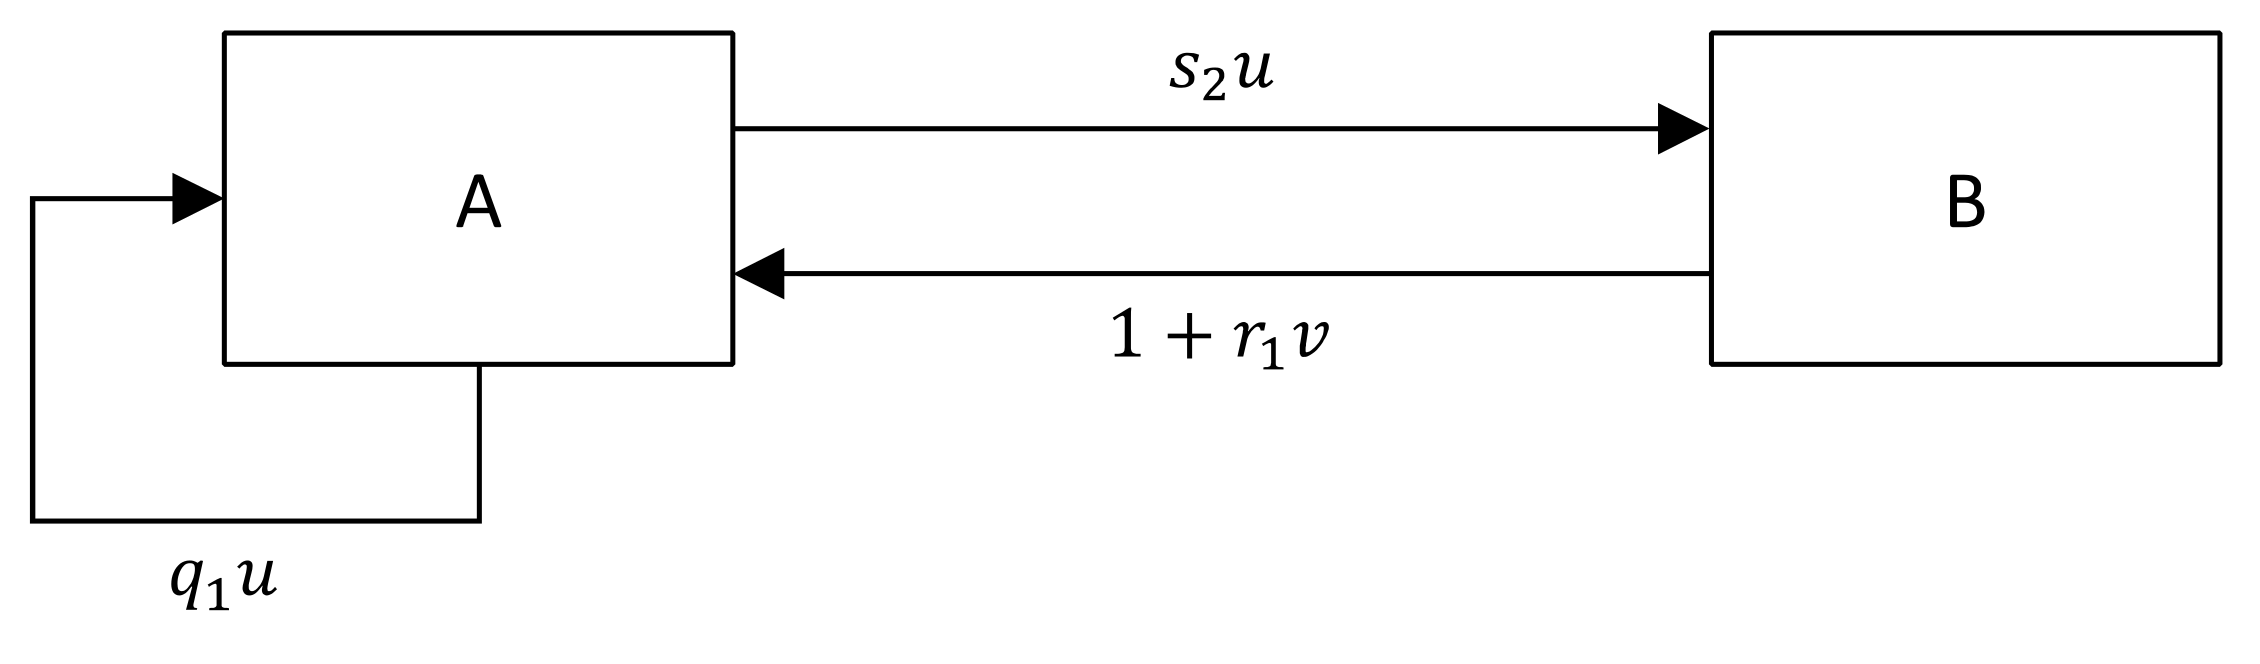
5.3. Same-Side Network Effects for One User Group and Cross-Side Network Effects between Both User Groups
- Users benefit from other users because of potential peer-to-peer money transfers.
- Users benefit from merchants because of the shopping availability of e-commerce sites.
- Merchants benefit from users because of increased potential sales.
5.4. Same-Side Network Effect for One User Group and Cross-Side Network Effect from That User Group to the Other
- Users benefit from other users because of increased communication opportunities.
- Advertisers benefit from users because of increased visibility for their ads.
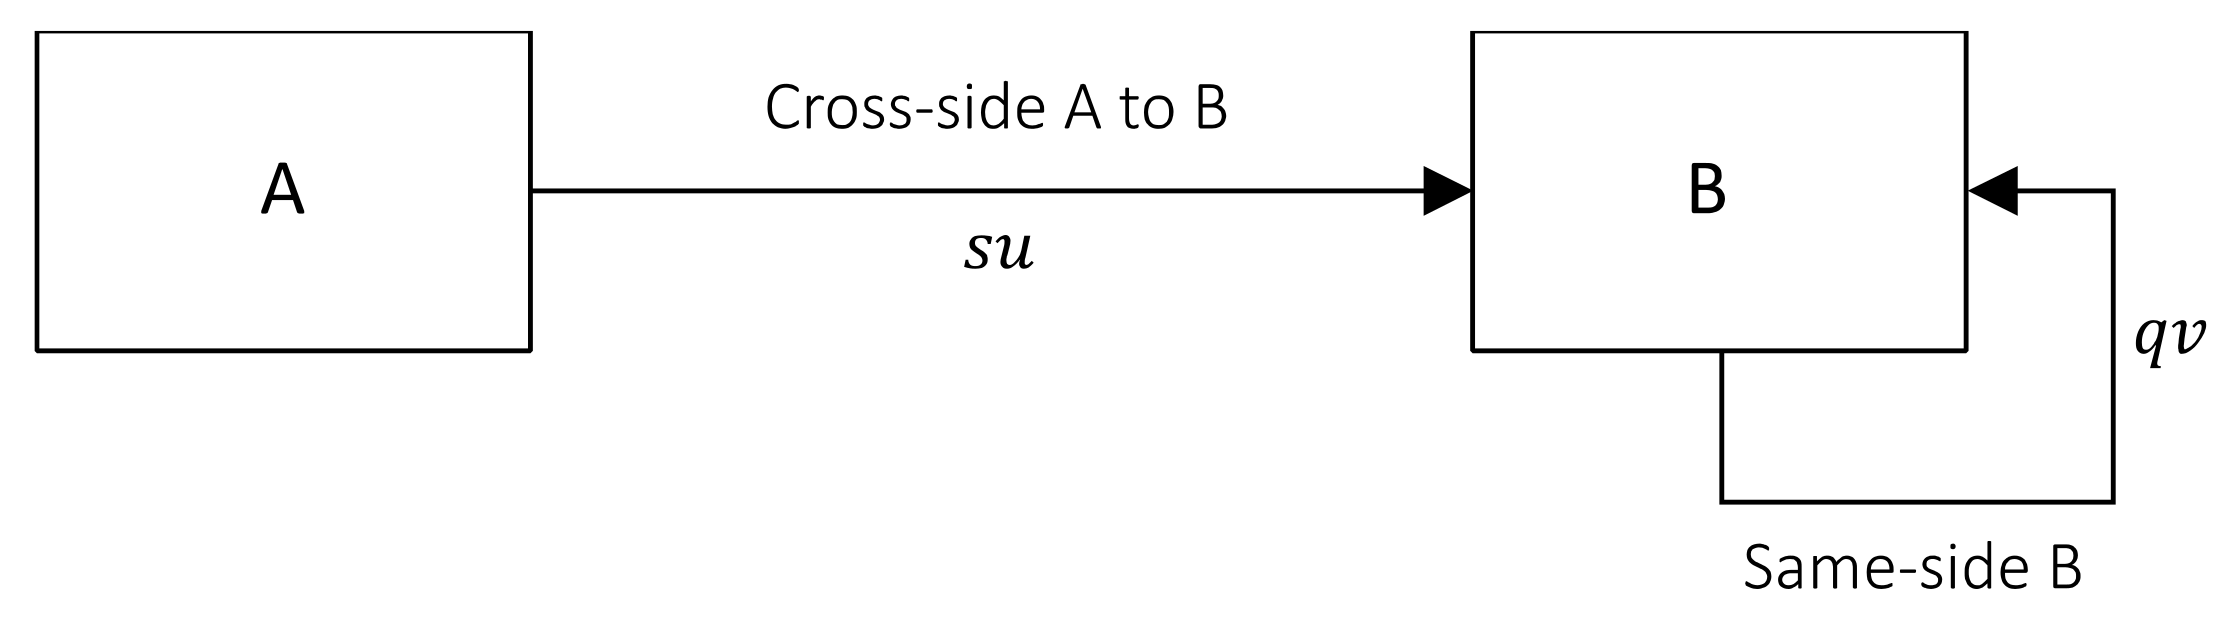
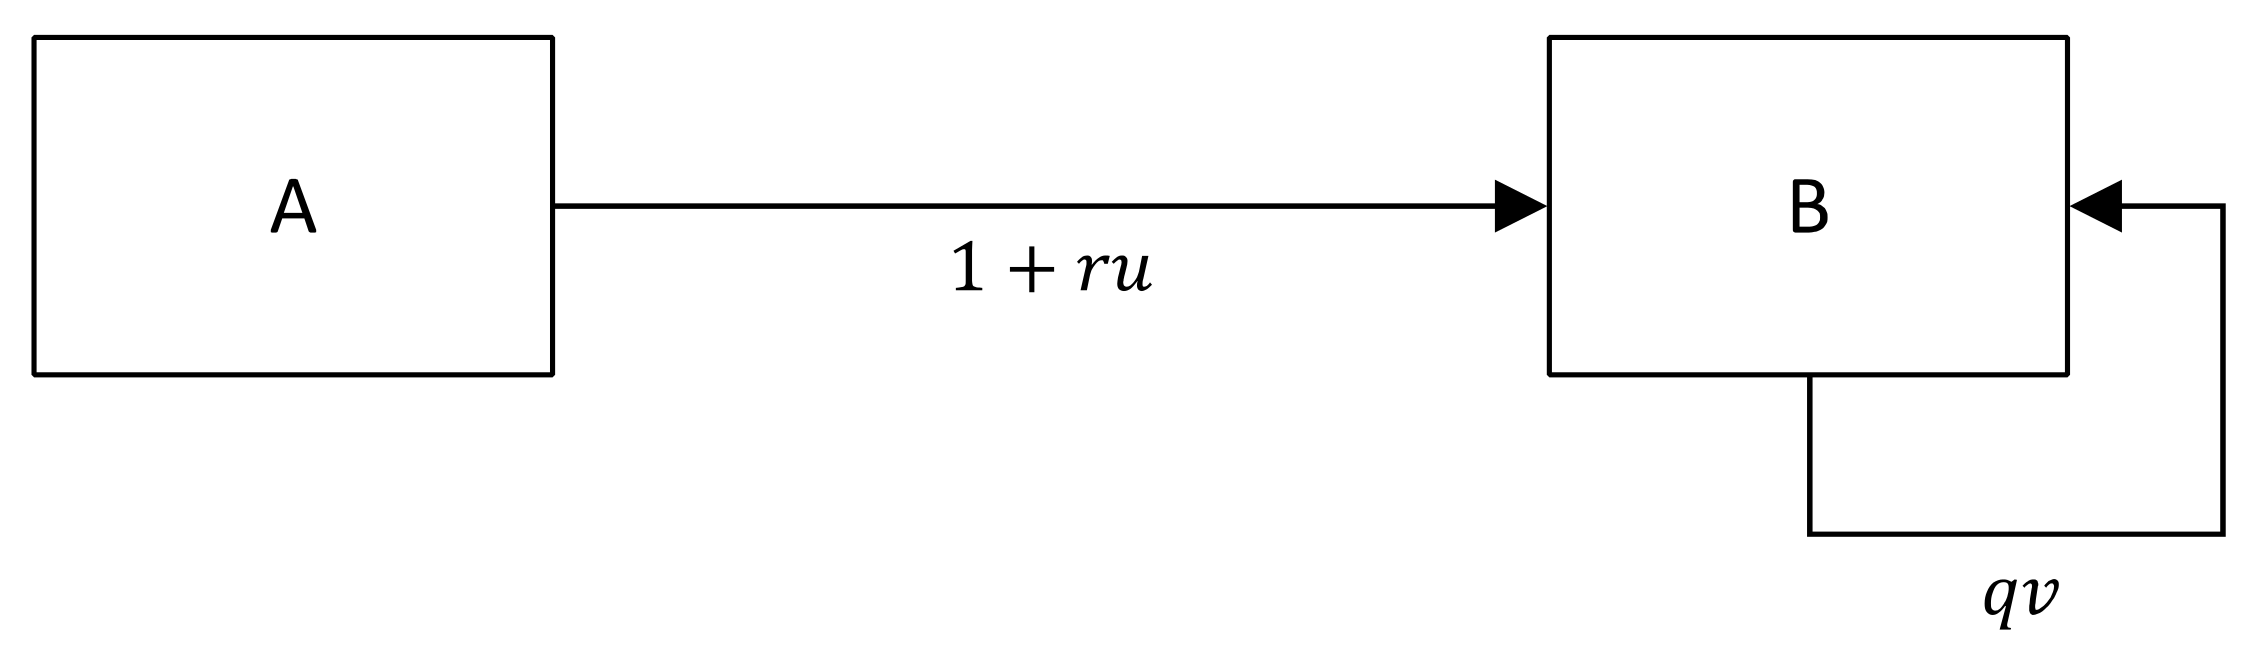
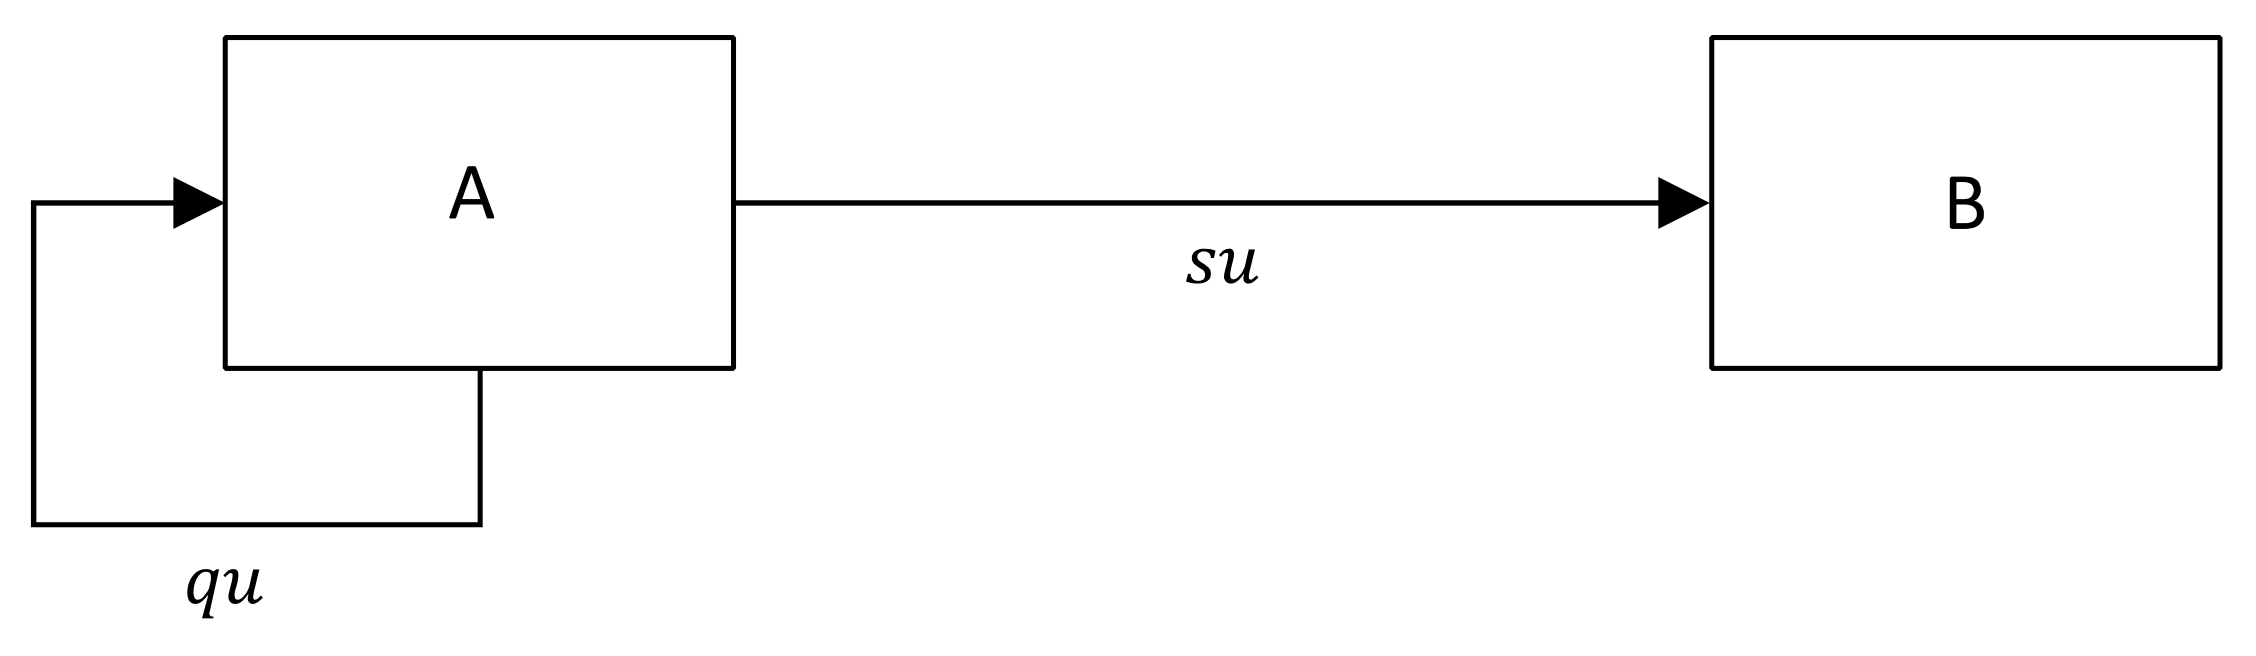
5.5. Same-Side Network Effects for One User Group and Cross-Side Network Effect from the Other User Group
- Restaurants benefit from reviews because of increased visibility.
- Reviewers benefit from other reviewers because of the restaurant reviews.
5.6. Cross-Side Network Effects between Both User Groups
- Buyers benefit from sellers because of increases in items listed for sale.
- Sellers benefit from buyers because of increased potential sales.
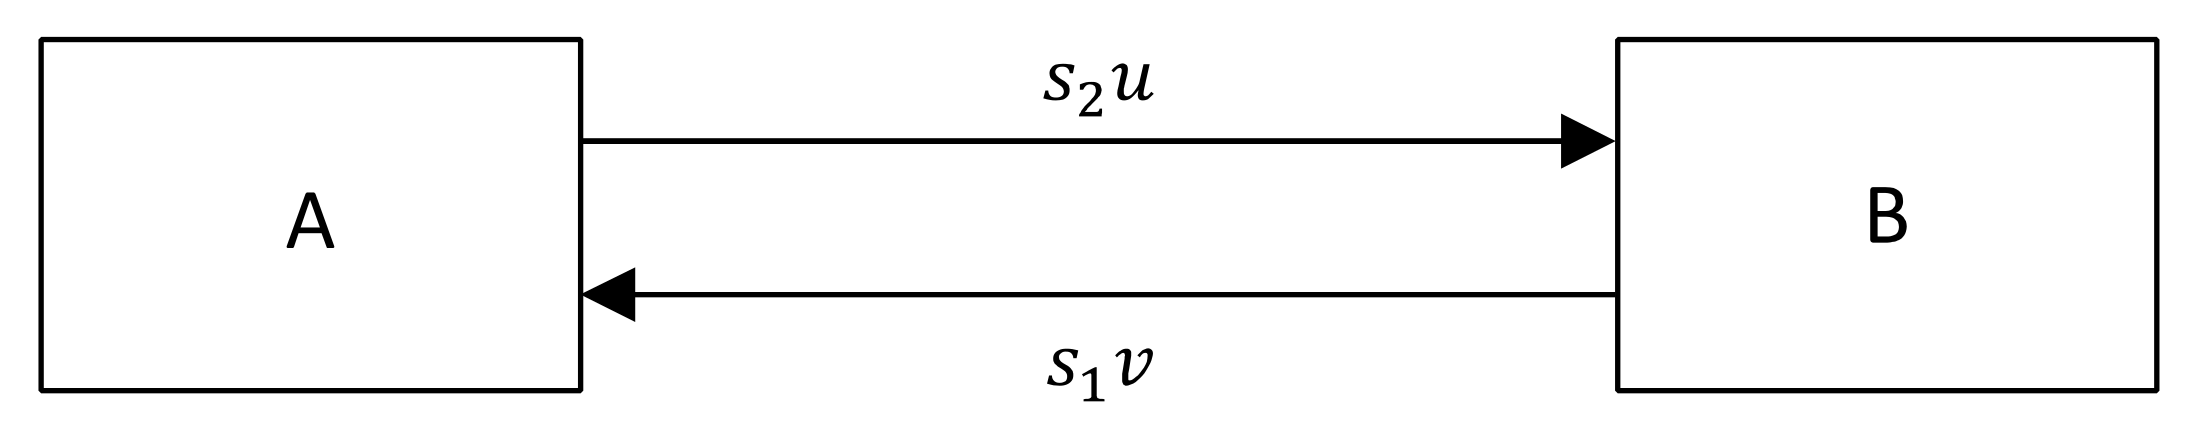
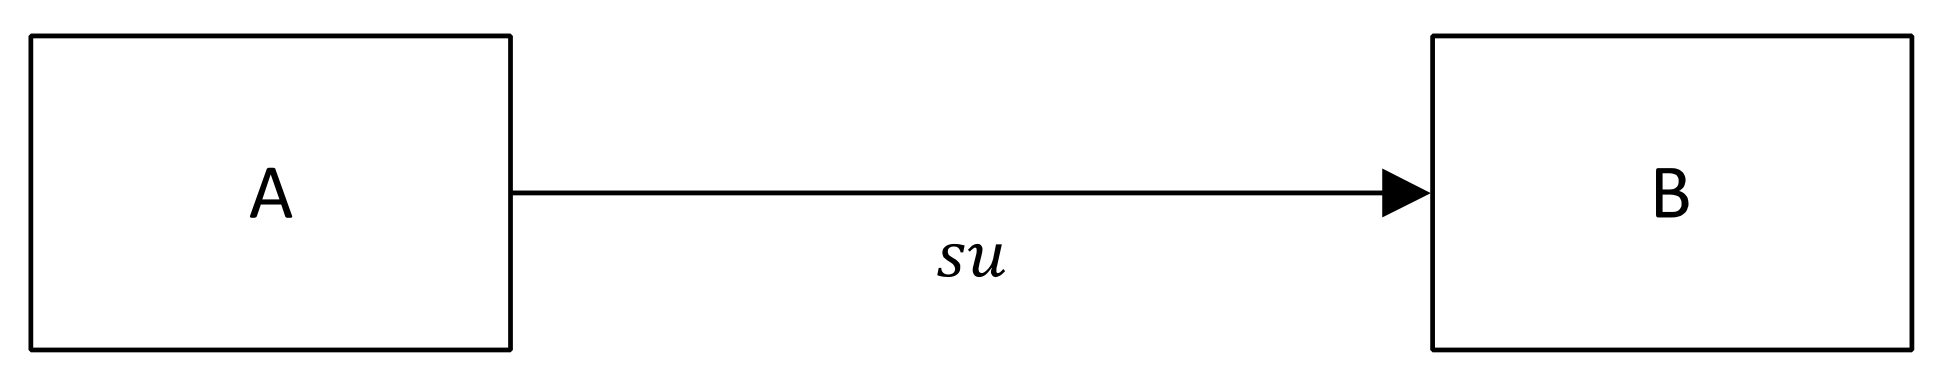
5.7. Cross-Side Network Effects from One User Group to the Other
6. Conclusions
Author Contributions
Funding
Institutional Review Board Statement
Informed Consent Statement
Data Availability Statement
Conflicts of Interest
References
- Temple, S. Inside the Mobile Revolution—Online Book. Available online: http://www.gsmhistory.com/inside-the-mobile-revolution/ (accessed on 25 October 2021).
- Strogatz, S.H. Nonlinear Dynamics and Chaos: With Applications to Physics, Biology, Chemistry, and Engineering; Perseus Books Publishing: Cambridge, MA, USA, 1994. [Google Scholar]
- Sanchez-Cartas, J.M.; Leon, G. Multi-Sided Platforms and Markets: A Literature Review; Universidad Politecnica Madrid: Madrid, Spain, 2018. [Google Scholar]
- Abdelkafi, N.; Raasch, C.; Roth, A.; Srinivasan, C. Multi-sided Platforms. Electron. Mark. 2019, 29, 553–559. [Google Scholar] [CrossRef]
- Caillaud, B.; Jullien, B. Chicken & egg: Competition among intermediating services. RAND J. Econ. 2003, 34, 309–328. [Google Scholar]
- Zhu, F.; Mitzenmacher, M. The Evaluation of Two-Sided Markets: A Dynamic Model. Technical Report TR-02-10; Harvard Computer Science Group: Cambridge, MA, USA, 2008. [Google Scholar]
- Cusumono, M.; Gawer, A.; Yoffie, D. The Business of Platforms: Strategy in the Age of Digital Competition; Harper Business: New York City, NY, USA, 2019. [Google Scholar]
- Bass, F.M. A New Product Growth Model for Consumer Durables. Manag. Sci. 1969, 15, 215–227. [Google Scholar] [CrossRef]
- Arthur, B.W.; Ermoliev, Y.M.; Kaniovski, Y.M. Strong laws for a path-dependent processes with applications. In Stochastic Optimization; Arkin, V.I., Shiraev, A., Wets, R., Eds.; Lecture notes in control and information sciences; Springer: Berlin/Heidelberg, Germany, 1986; Volume 81. [Google Scholar]
- Mahmoud, H.M. Polya Urn Models; Chapman and Hall/CRC: London, UK, 2008. [Google Scholar]
- Facebook’s Monthly Active Users. Statista. 2021. Available online: https://www.statista.com/chart/10047/facebooks-monthly-active-users/ (accessed on 25 October 2021).
- Hagiu, A.; Wright, J. Multi-Sided Platforms. Int. J. Ind. Organ. 2015, 43, 162–174. [Google Scholar] [CrossRef]
- Øverby, H.; Audestad, J.A. Digital Economics: How Information and Communication Technology is Shaping Markets, Businesses, and Innovation; CreateSpace Independent Publishing: Scotts Valley, CA, USA, 2018. [Google Scholar]
- Øverby, H.; Audestad, J.A. Introduction to Digital Economics: Foundations, Business Models and Case Studies; Springer: Berlin/Heidelberg, Germany, 2021. [Google Scholar]
- Stabell, C.B.; Fjeldstad, Ø.D. Configuring Value for Competitive Advantage: On Chains, Shops, and Networks. Strateg. Manag. J. 1998, 19, 413–437. [Google Scholar] [CrossRef]
- McAfee, A.; Brynjolfsson, E. Machine, Platform, Crowd: Harnessing Our Digital Future; W. W. Norton & Company: New York City, NY, USA, 2017. [Google Scholar]
- Ardolino, M.; Saccani, N.; Adrodegari, F.; Perona, M. A Business Model Framework to Characterize Digital Multisided Platforms. J. Open Bus. Technol. Mark. Complex. 2020, 6, 10. [Google Scholar] [CrossRef] [Green Version]
- Parker, G.G.; van Alstyne, M.W. Two-Sided Network Effects: A theory of Information Product Design. Manag. Sci. 2005, 51, 1494–1504. [Google Scholar] [CrossRef] [Green Version]
- International Telecommunication Union. Measuring Digital Development. Facts and Figures. 2021. Available online: https://www.itu.int/en/ITU-D/Statistics/Pages/facts/default.aspx (accessed on 7 September 2021).
- Korn, G.A.; Korn, T.M. Mathematical Handbook for Scientists and Engineers: Definitions, Theorems, and Formulas for Reference and Review; Dover: Minoela, NY, USA, 2000. [Google Scholar]
- Morecroft, J.D.W. Strategic Modelling and Business Dynamics: A Feedback Systems Approach; Wiley: Hoboken, NJ, USA, 2015. [Google Scholar]
- Railsback, S.T.; Grimm, V. Agent-Based and Individual-Based Modeling: A Practical Introduction; Princeton University Press: Princeton, NJ, USA, 2019. [Google Scholar]
- Øverby, H.; Biczók, G.; Audestad, J.A. Modeling Dynamic ICT Services Markets. In Proceedings of the World Telecommunications Congress (WTC), Miyazaki, Japan, 4–7 March 2012. [Google Scholar]


| MSP | Type of Business | User Groups | Platform Type |
|---|---|---|---|
| Social networking service | Users and advertisers | Digital | |
| Kickstarter | Crowdfunding | Borrowers and investors | Digital |
| MasterCard | Point-of-sale transactions | Merchants and cardholders | Digital |
| New York Times | Newspaper | Readers and advertisers | Digital |
| Airbnb | Sharing service | Hosts and guests | Tangible |
| eBay | Electronic marketplace | Sellers and buyers | Tangible |
| Uber | Sharing service | Drivers and passengers | Tangible |
| Parameter | Description | Initial Value |
|---|---|---|
| Relative number of users in user group A | - | |
| Relative number of users in user group B | - | |
| Initial relative number of users in group A and group B ) | 0.01 | |
| Threshold value for a sustainable market size | 0.1 | |
| Time to reach threshold value and i.e., and | - | |
| Coefficient of innovation | 0.14 | |
| Same-side coefficient of imitation | 0.46 | |
| Cross-side coefficient of imitation | 0.46 | |
| Cross-side coefficient of composite growth | 1.0 |
| Section | Model | Cross-Side Feedback | Example Service (User Groups) |
|---|---|---|---|
| Section 5.1 | 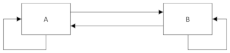 | Airbnb (guests and hosts) | |
| Section 5.2 | 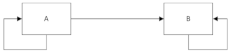 | Uber (drivers and passengers) | |
| Section 5.3 | 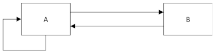 | PayPal (users and merchants) | |
| Section 5.4 |  | Facebook (users and advertisers) | |
| Section 5.5 |  | Yelp (restaurants and reviewers) | |
| Section 5.6 | 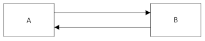 | eBay (buyers and sellers) | |
| Section 5.7 |  | Google Search (users and advertisers) |
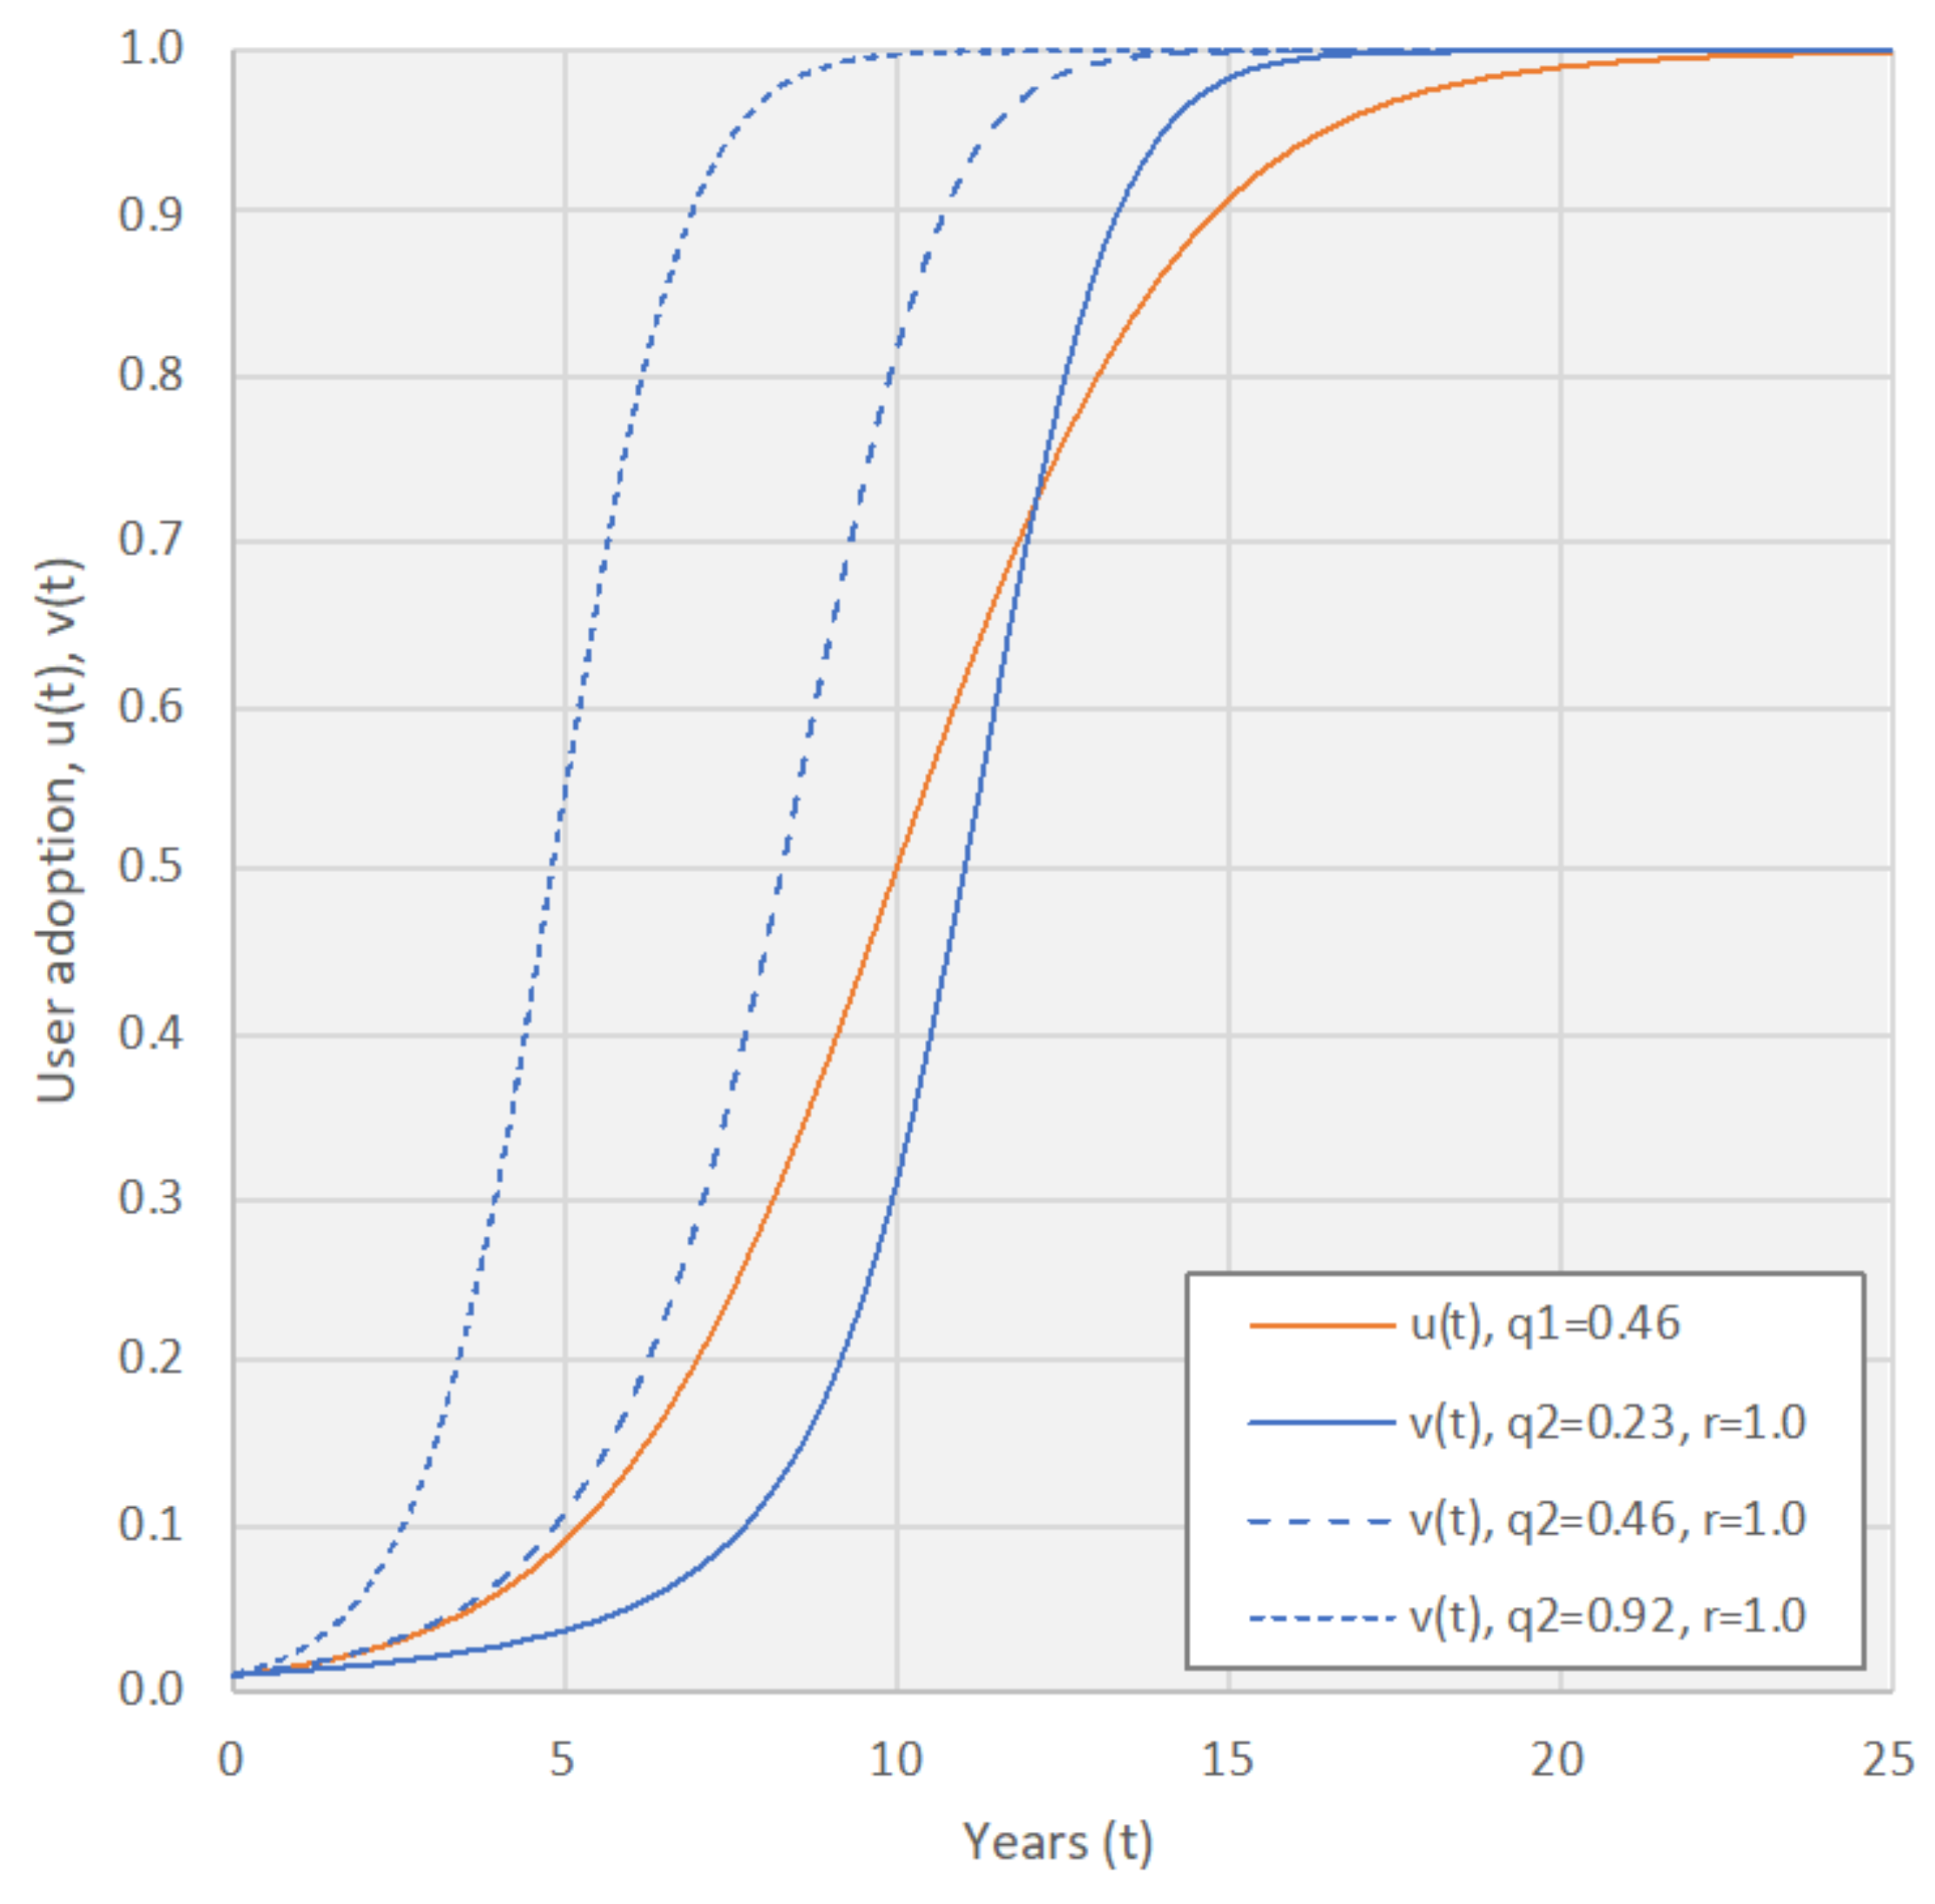
| s2 | 0.23 | 0.46 | 0.92 |
| tv | 6.4 | 5.0 | 3.7 |
Publisher’s Note: MDPI stays neutral with regard to jurisdictional claims in published maps and institutional affiliations. |
© 2021 by the authors. Licensee MDPI, Basel, Switzerland. This article is an open access article distributed under the terms and conditions of the Creative Commons Attribution (CC BY) license (https://creativecommons.org/licenses/by/4.0/).
Share and Cite
Øverby, H.; Audestad, J.A. Multisided Platforms: Classification and Analysis. Systems 2021, 9, 85. https://doi.org/10.3390/systems9040085
Øverby H, Audestad JA. Multisided Platforms: Classification and Analysis. Systems. 2021; 9(4):85. https://doi.org/10.3390/systems9040085
Chicago/Turabian StyleØverby, Harald, and Jan A. Audestad. 2021. "Multisided Platforms: Classification and Analysis" Systems 9, no. 4: 85. https://doi.org/10.3390/systems9040085
APA StyleØverby, H., & Audestad, J. A. (2021). Multisided Platforms: Classification and Analysis. Systems, 9(4), 85. https://doi.org/10.3390/systems9040085