Article

System-Theoretic Process Analysis (STPA) for Hazard Analysis in Complex Systems: The Case of “Demand-Side Management in a Smart Grid”

by
Stylianos Karatzas
* and
Athanasios Chassiakos
Civil Engineering Department, University of Patras, 265 04 Rio-Patras, Greece
*
Author to whom correspondence should be addressed.
Systems 2020, 8(3), 33; https://doi.org/10.3390/systems8030033
Submission received: 6 August 2020 / Revised: 7 September 2020 / Accepted: 10 September 2020 / Published: 18 September 2020
(This article belongs to the Section Complex Systems)

Abstract

:
Inelasticity of demand along with the distributed energy sources and energy market democratization pose significant challenges which have considerable negative impacts on overall grid balance. The need for increased capacity and flexibility in the era of energy market digitalization has introduced new requirements in the energy supply network which could not be satisfied without continuous and costly local power network upgrades. Additionally, with the emergence of Smart Homes (SHs) and Home Energy Management (HEM) systems for monitoring and operating household appliances, opportunities have arisen for automated Demand Response (DR). DR is exploited for the modification of the consumer energy demand, in response to the specific conditions within the electricity system (e.g., peak period network congestion). In order to optimally integrate DR in the broader Smart Grid (SG) system, modelling of the system parameters and safety analysis is required. In this paper, the implementation of STPA (System-Theoretic Process Analysis) structured method, as a relatively new hazard analysis technique for complex systems is presented and the feasibility of STPA implementation for loss prevention on a Demand Response system for home energy management, and within the complex SG context, is examined. The applied method delivers a mechanism useful in understanding where gaps in current operational risk structures may exist. The STPA findings in terms of loss scenarios can be used to generate a variety of safeguards to ensure secure operational control and in implementing targeted strategies through standard approaches of risk assessment.

1. Introduction

1.1. Background

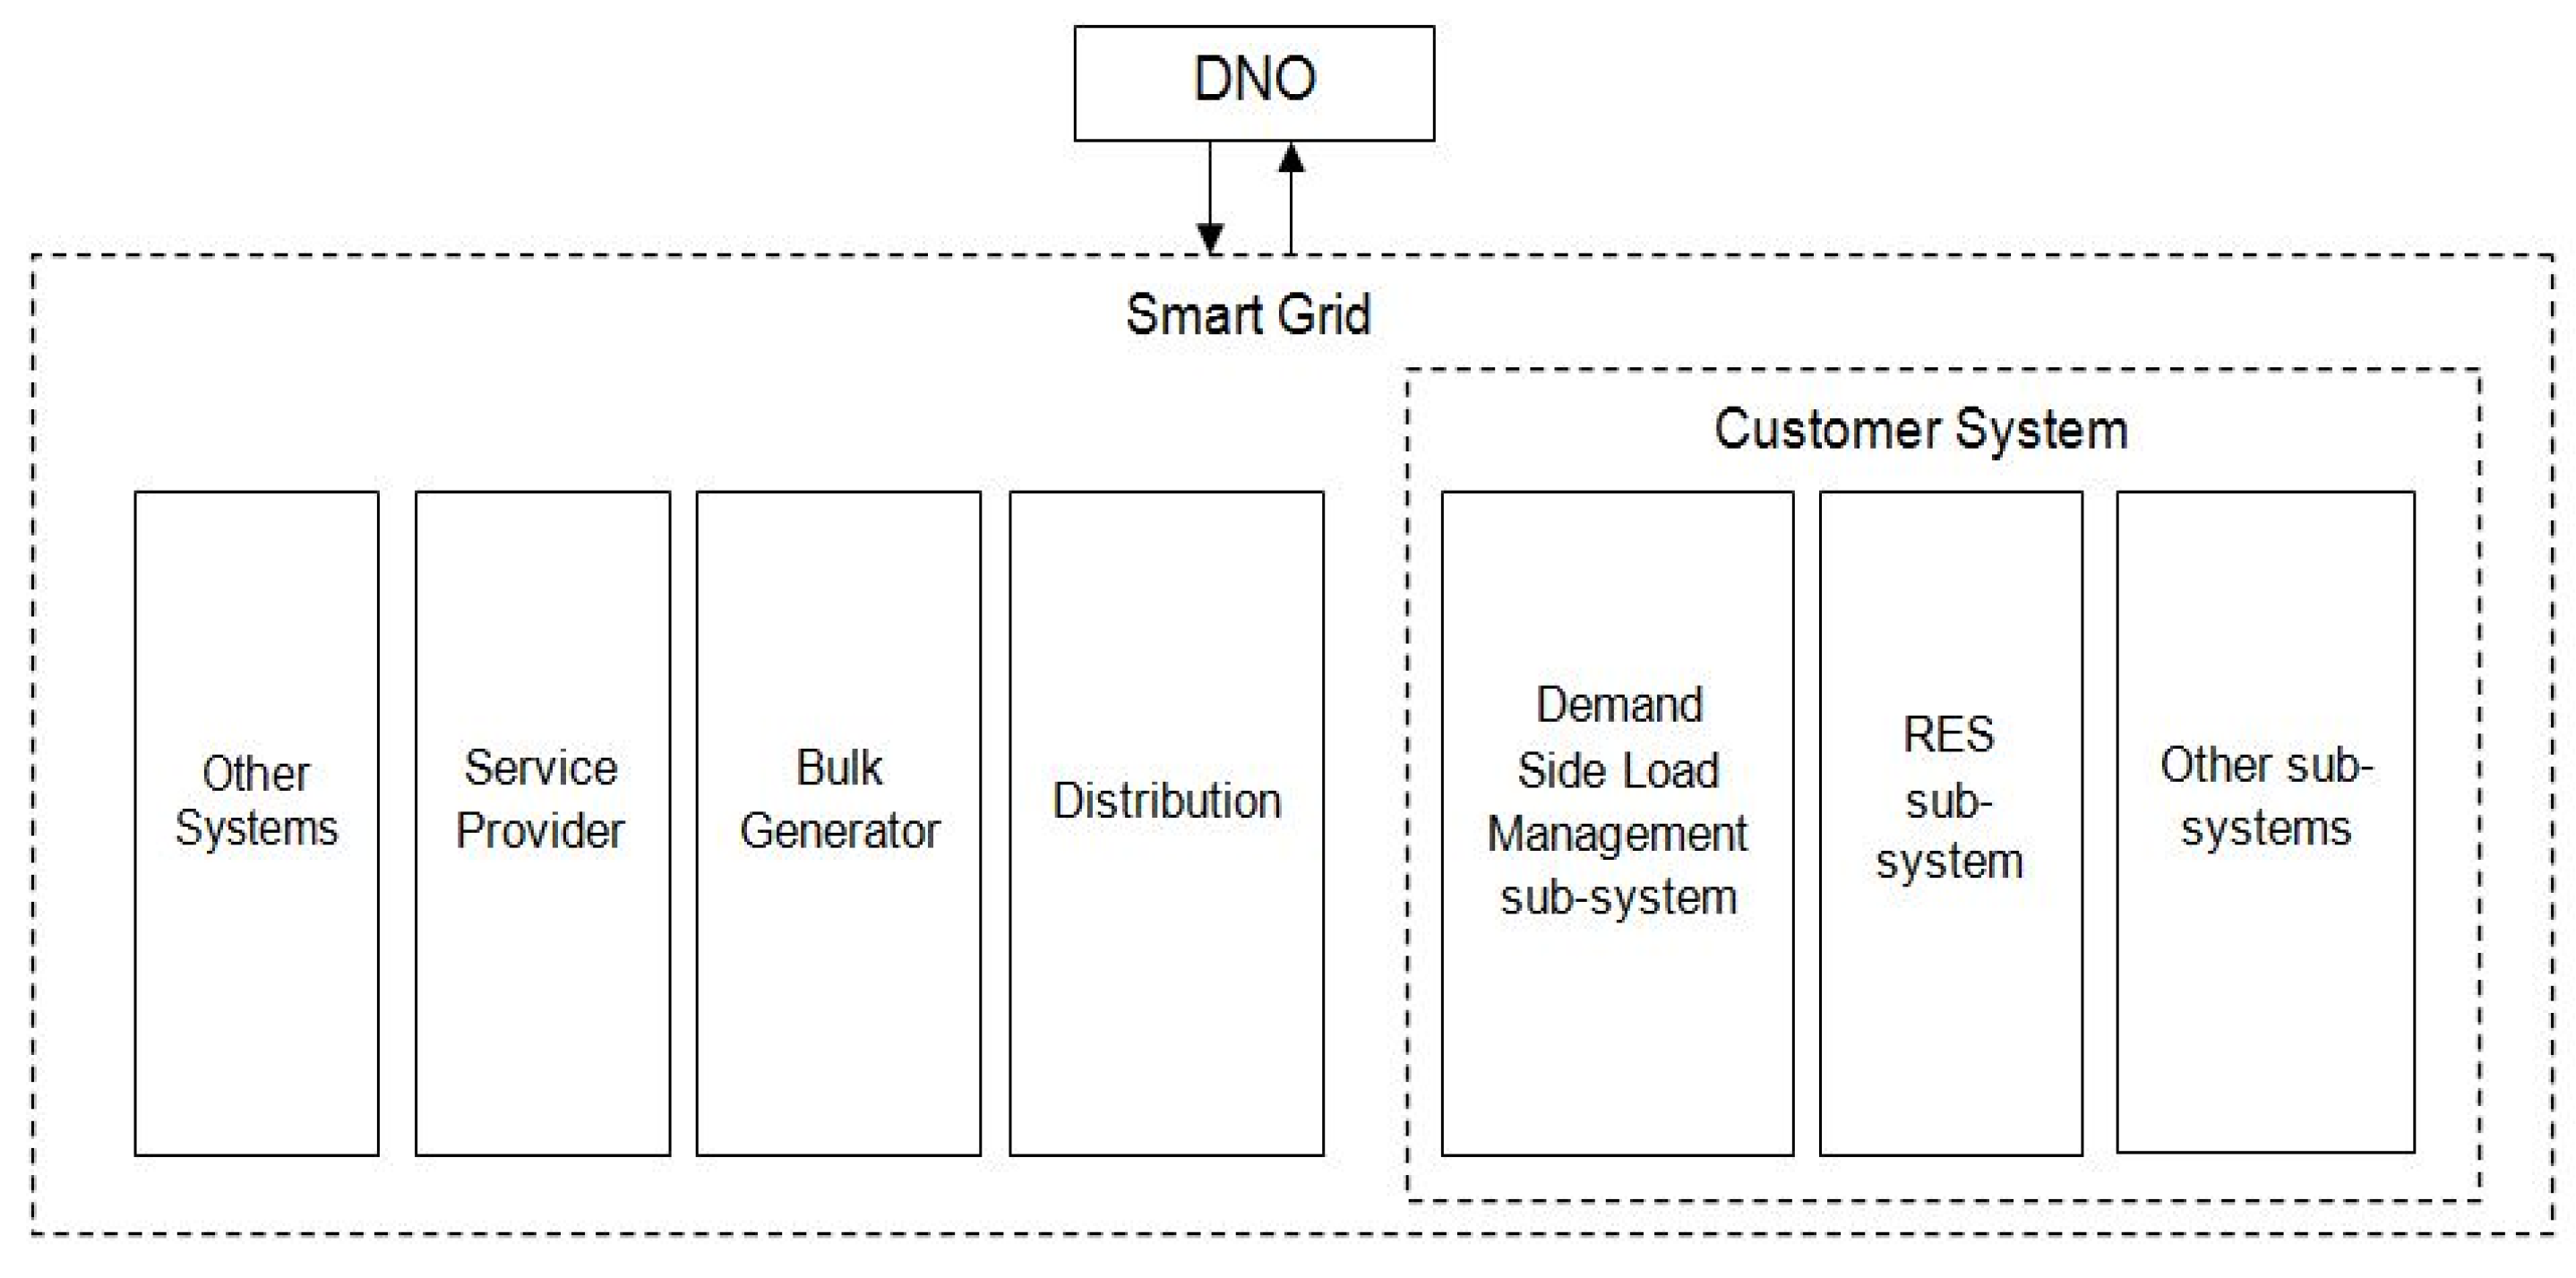
A smart grid is “an electricity network allowing devices to communicate between suppliers to consumers, allowing them to manage demand, protect the distribution network, save energy and reduce costs” [1]. The grid can be considered as a complex System of Systems (SoS) and in this regard, understanding and modelling of its different parts and their interrelation is required [2]. These interrelations need to consider technology energy distribution and supply as well as account for environmental friendliness and economic impacts. The National Institute of Standard & Technology identifies seven pillars within the Smartgrid system which are bulk generation, transmission, distribution, markets, operators, service provider, and customer [3]. The objectives of a Smartgrid are to provide operational and energy efficiency, customer satisfaction and emission reduction by incorporating advanced technology-based practices such as network optimization, preventive maintenance, reactive load control, dynamic pricing, demand-side management, and renewable energy sources integration.
The importance of risk analysis in smart grids mandates for a thorough presentation of risks and challenges. The focus of this research is on the analysis of risks that arise from the disperse operation of heterogeneous network elements in the synchronous grids on the customer side. The movement for smart homes is posing further challenges for network operation. The increasing requests for non-forecastable demand is leading to high levels of uncertainty that affect the smooth operation of the grid network, considering also that the overall design of the grids was performed based on the initial energy demand limits. The current power flow patterns in power lines are significantly modified from those considered in the original design or off-line analyses, resulting in grid congestion issues (voltage instability, lines overcapacity). Moreover, with the evolution of smart devices and electronics in the grid, the need for advanced supply quality and continuity is more essential than the past. The realization of the smart grid vision requires meeting the ever-increasing reliability challenge. Capacity expanding projects to achieve high reliability levels is a costly solution due to additional infrastructure investments. The potential to address the emerging risk situations by introducing distribution and feeder automation is limited [4]. As a result, it is necessary to incorporate system analysis in non-traditional ways to mitigate the increasing operational risk. The inclusion of additional variables into the energy ecosystem makes it imperative to consider a reliable risk management framework.
Based on the above considerations, this research focuses on electric consumption control from the customer-side and specifically in the residential sector. Under this scope, the topics of interest include:
  • Demand-side load management, forecasting, and peak-load saving
  • Smart metering
  • Smart appliance and home automation
Towards an approach for complex systems safe operation, system theory basics are defined. According to system theory, the system is treated as a whole, not as the sum of its parts. Relations and interactions among system components are considered and a primary concern is emergent properties, which are properties that are not in the summation of the individual components but “emerge” when the components interact, considering overall safety as an emergent property. In this direction, the relatively new Leveson’s Systems-Theoretic Accident Model and Processes (STAMP) and Systems Theoretic Process Analysis (STPA) model, endeavor to model the dynamics of complex sociotechnical systems.

1.2. Accident Models in Systems

Increasing complexity grids, consumers demand, and security requirements as well as sustainability concerns accentuate the need for reliable grids operation. Towards understanding the risks associated with the modernization of electricity networks in the era of smartgrids, a brief review of the most relevant risk management methodologies is presented. Nordgård et al. presented the different layers of risk assessment of the power distribution system, describing the different categories and their effects in terms of their attributes, type of impact, and methods of risk analysis [5]. The details of electricity network reliability theory are presented by Brown to identify the main component of the system and define several techniques on the way to model potential risks and hazards in the electricity network [6]. The identification of relevant to grid reliability metrics and indicators is performed with an on-practice evaluation reported by in [7]. A hands-on modelling to analyze the vulnerability of grids using Graph Models is performed by Holmgren in [8].
Qureshi applies hazard models to conceptualize accident specific characteristics by interrelating causes and effects and discover the reasons that accidents occur [9]. Several methods for risk analysis at the low level of a system exist. Failure Mode and Effects Analysis (FMEA) is a bottom-up method to identify potential failures and effects by all the parts in a system [10]. FMEA is limited to analyze one cause and effect relationship. Fault Tree Analysis (FTA) is a top-down hazard analysis approach, involving a multiple causes and effect structure [11]. Hazard and operability study (HAZOP) is a technique used both in the design phase of a system, identifying critical specification issues, and in operational phase, identifying scenarios that may result in operational malfunctions, and then their causes and consequences are identified and analyzed [12]. The sequential accident models or event-based models, such as Failure Modes and Effects Analysis, Event Tree Analysis, Fault Tree Analysis, can work adequately for simple systems but they cannot explain accidents from failures in complex ones [13]. Fleming et al. mention that traditional analysis methods (FMEA, FTA, etc.) cannot sufficiently identify software faults or the errors pertaining to dynamic behavior of the system [14,15]. On the other hand, sequential and epidemiological accident models (most notable is the “Swiss Cheese” model) developed in the 1980s and defined as high level flow-based models, investigate combinations of factors that may lead to accidents in complex systems, although without being able to deal with the system’s dynamic nature. Thus, a new category of systemic modelling has been developed to address the operation of a system as a whole instead of analyzing specific cause-effect interrelations and impacts. As systemic modelling approaches lying in this category, a hierarchical socio-technical framework developed by Rasmussen [16] and the Systems Theoretic Accident Modelling and Processes (STAMP) model attempt to handle the dynamics of complex socio-technical systems [17]. STAMP is defined as a novel system thinking for risk analysis which treats risk and accidents as a control rather than a failure problem. It integrates into safety analysis several causal factors such as software, human factors, organizational, and safety structure. System Theoretic Process Analysis (STPA) has been developed by Leveson to identify unsafe control actions and hazardous states that may lead to system losses/accidents and generating detailed safety requirements to prevent the occurrence of the identified hazardous scenarios [17]. STPA is a top-down process addressing system components interactions and hazards such as design errors, software, or component interaction failures. STPA can find more component interaction, software, and human hazards than traditional methods [14,15]. Several authors have evaluated and compared STPA to traditional methods, reporting the benefits from applying STPA on different types of complex systems [15,18,19,20,21].
STPA system safety analysis can be integrated into the entire system engineering process resulting in a significant decrease in the cost of engineering for safety as well as in effectiveness and fewer losses. It can also reduce rework, which reduces cost and schedule. Figure 1 shows a simplified version of the standard system engineering V-model. This figure is used to illustrate how to integrate STPA into the standard system engineering process. The potential roles for STPA are shown in red. STPA can be used throughout the standard system engineering process, starting in the earliest concept development stage and contribute to all the activities in system engineering [22].
The main goal of the current research is to present and describe the implementation of STPA in the case of a smartgrid safety analysis focusing on the Demand Response system of a Smart Home (SH) as a means to address electricity grid operation criticalities. Faulty feedback, incomplete or weak requirements, component malfunctions, and other factors that cause unsafe control actions and finally lead to accidents are identified which can serve as the baseline for the development of additional constraints and recommendations and the decision making enhancement.

2. Methods and Materials

This work uses process hazard analysis to examine the process risks within a smartgrid (SG), focusing on Smart homes (SHs) as crucial systems for Demand Response management (DRM). Analysis of process hazards is prevalent in many high-risk sectors and is a basic step in technical systems risk assessment [23]. Many of the existing techniques concentrate on isolated technical failures. They consequently fail to compressively define risks in complicated socio-technical systems [17] such as those typically engaged in smartgrids. In this research, STPA is utilized to examine the process risks engaged in Demand-Side Load management in a Smartgrid. For that reason, a brief description of the system is presented.

2.1. Demand Side Load Management System in Smart Homes (SHs)

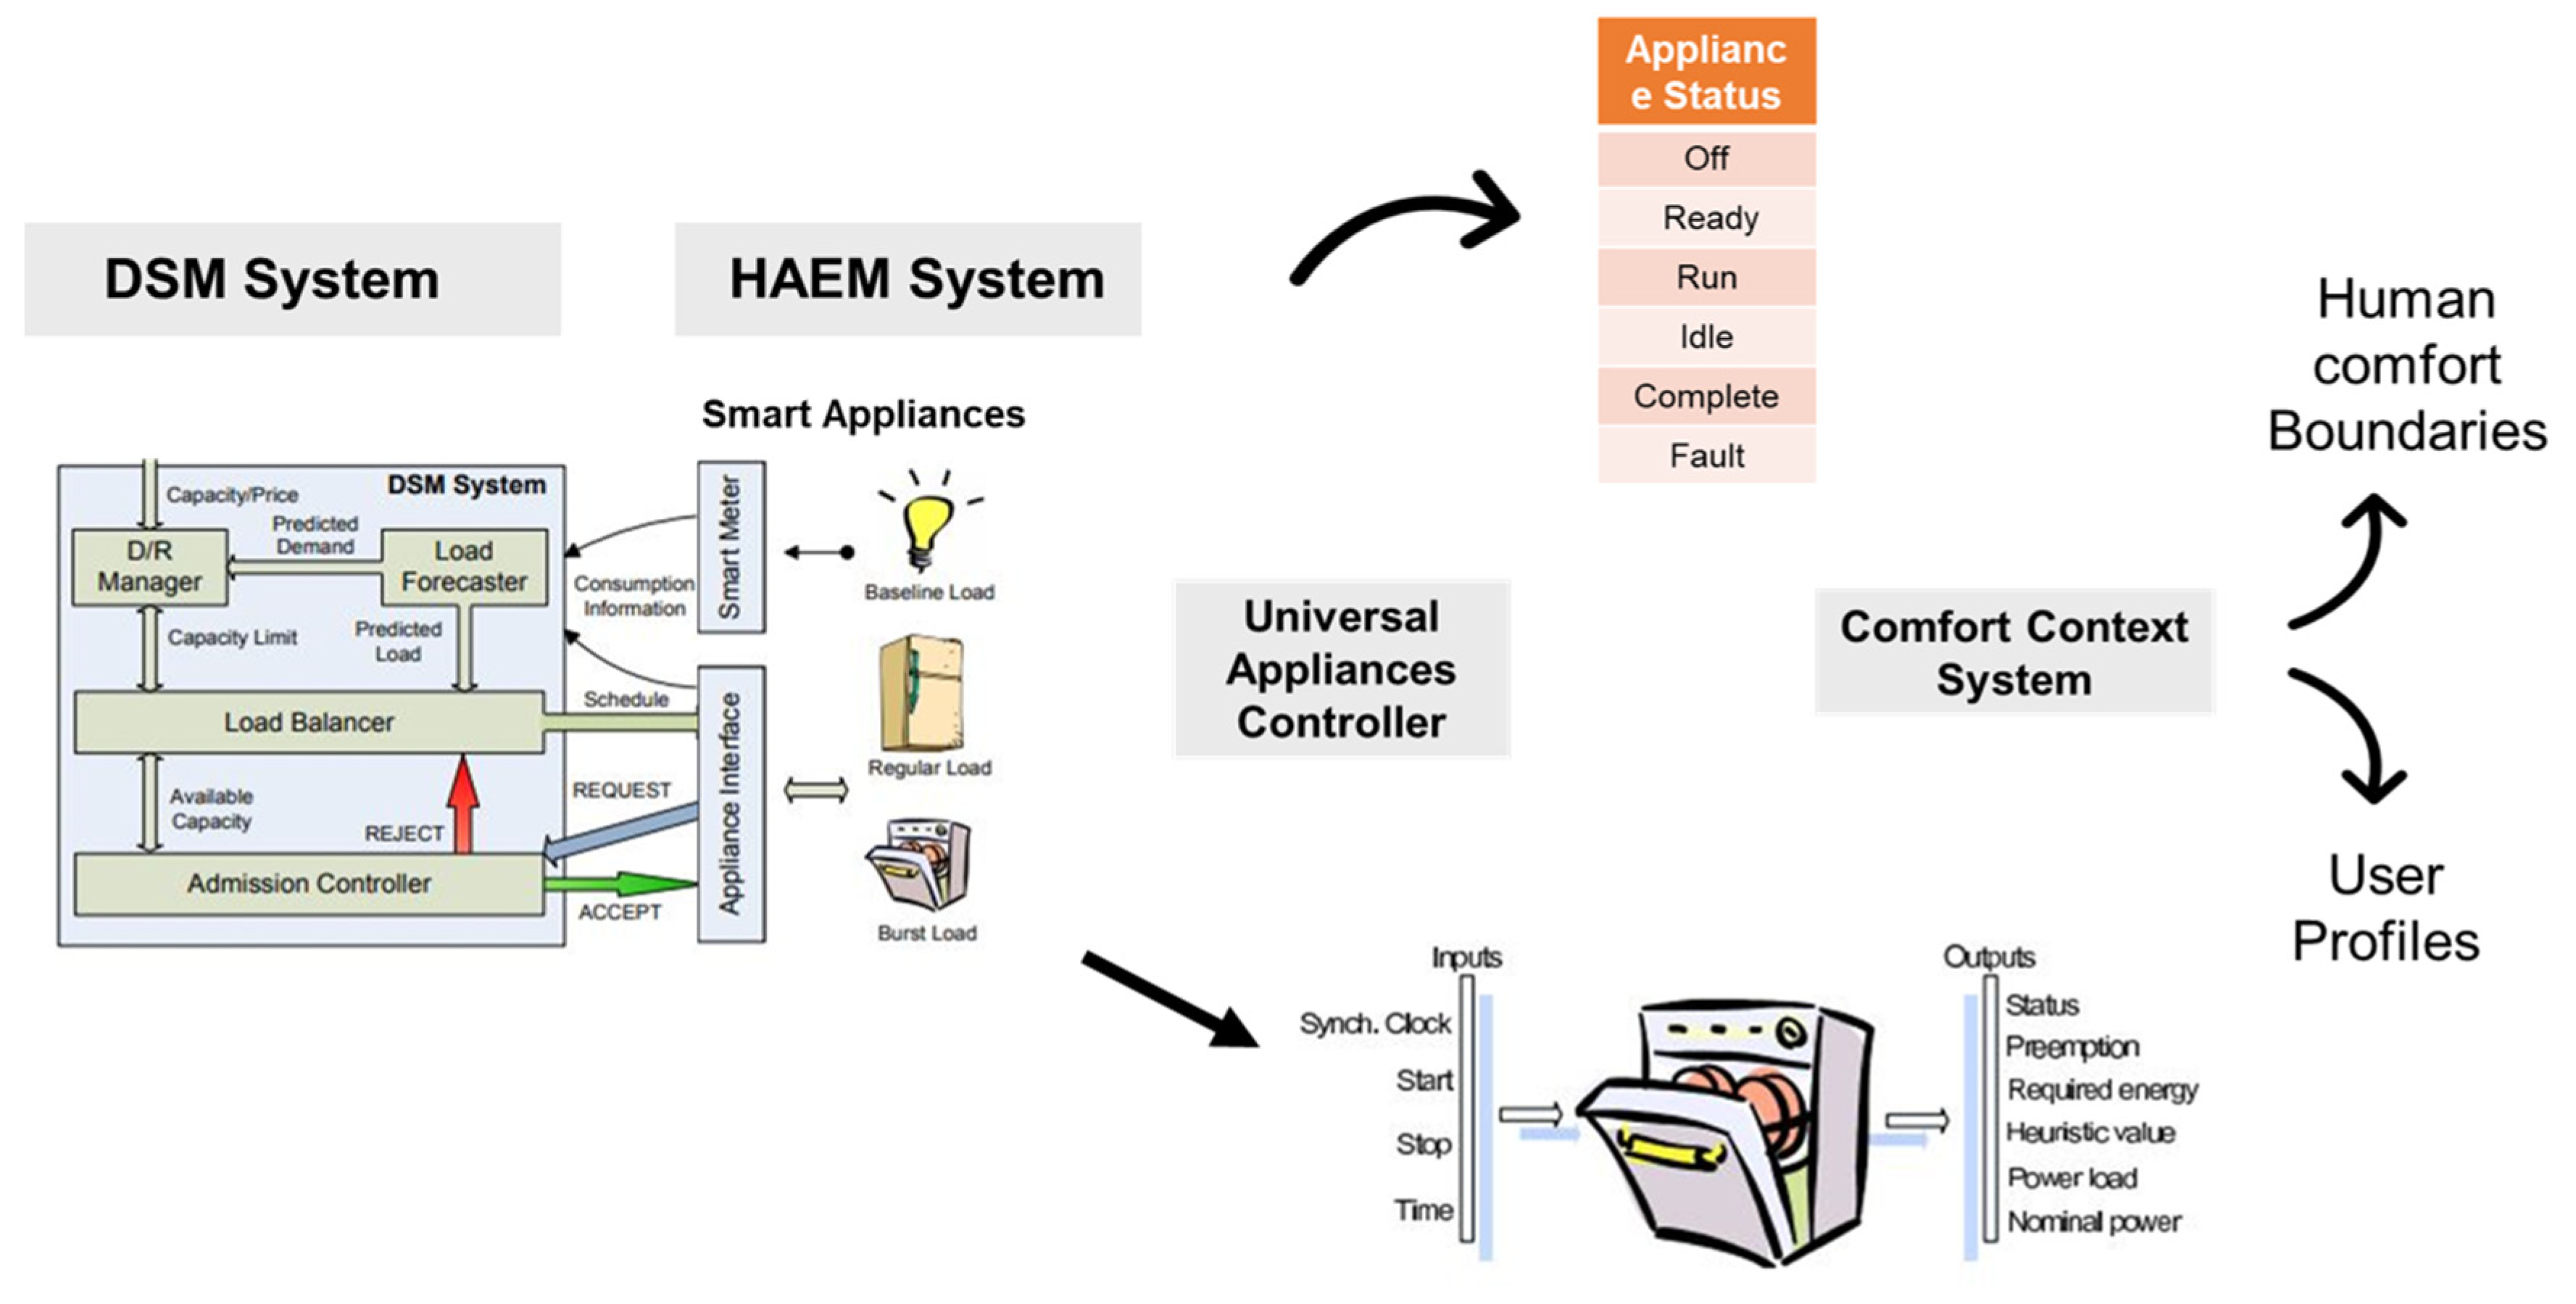
The aim of SHs based Demand response (DR) is to provide a flexible two-way energy feedback whilst (or shortly after) the consumption occurs [24]. It can manage consumption by applying load shift or shed strategies to relieve capacity during peak hours and when system reliability is threatened [4]. This section introduces the proposed architecture of the Demand Side Load Management system and describes the functionalities of each module (Figure 2).
(1)
Demand-Side Management-Management System (DSM-MS)
The Admission Control (AC) is the bottom layer of the DSM system which evaluates requests coming from appliances, makes decisions, and enforces authorization for appliances to operate (accepted request) or not operate (rejected requests). The rejected requests are directed to the load balancer module for further process.
The Load Balancer (LB) is the middle layer and performs an energy cost optimization task, considering a number of connected appliances within a physical area and a determined maximal energy usage at different times through a day. The outcome is a charging service schedule based on capacity, forecasts, and priorities information.
The Demand/Response Manager (DRM) is the first module of the upper layer which is responsible for the communication between DSM and the grid operator. DRM is deputed to balance demand from the user’s side and supply from the grid side, based on the DSM feedback information and the available grid capacity.
The Load Forecaster (LF) is the second module in the upper layer structure and provides the DRM and LB with load forecasts, which is crucial information for energy load balancing. For example, with the aid of load forecasts, it is possible to delay or hasten the appliance operation to avoid peak-load periods or to fill up consumption valleys in the grid.
(2)
Home Automated Energy Manager
A Universal Appliances Controller (UAC) controls appliance employing interfaces and retrieves information on the dwelling consumption through devices such as smart meters. Regarding the issue of communication with appliances, Nichols et al. have presented a universal appliance interface that enables to design a controller with different types of interfaces for a wide range of common use appliances [25]. This approach could be used in developing appliance adaptors for home energy management.
Smart Appliances (SA) in the proposed framework are represented by a finite state machine (FSM) model [26] and the status of an appliance may be Off, Run, Idle, Complete, or Fault. Household appliances are categorized in three general types: inelastic load appliances (i.e., lighting, TV, and PC) which have fixed predetermined energy consumption, elastic load appliances (i.e., pool pump and iron) which are schedulable, and elastic-curtailable load appliances (i.e., HVAC and water heaters) which has a constant operating status which may be interrupted [27].
Appliance interface (AI) is a programmable function interface which receives a trigger signal (Sych. Cloch, Start, and Stop) and outputting Status, Pre-emption, Heuristic value, required energy, Power Load, and Nominal Power. The enabling signals of the appliances are the switchings (on or off). Such a model can enhance on-line scheduling of appliances and its implementation is derived from real-time computing system techniques [28].
(3)
Comfort Context
This module is expected to satisfy user preferences through a preference-based behavioral model. Modern building controllers generally fail to adapt to the preferences of individual users; however, it is arguable in many cases that this may be more important than meeting a setpoint.

2.2. STPA Method

This work adopts System Theoretic Process Analysis (STPA) in which hazard is defined as “a system state or set of conditions that, together with a particular set of worst-case environmental conditions, will lead to an accident/loss” [29]. Hazards can emerge from the actions of different controllers in a system as well as the interaction of the different parts of the system. Through a sequence of control loops, the STPA methodology follows a top-down perspective of the dynamic interaction of the different system parts. A hierarchical control structure is developed which acts as a system model representation composed of a control loop assembly [30]. The STPA control loop’s generic format is shown in Figure 3.
Each control loop includes a controller responsible for initiating the control action, actuators for actualizing the control action, the controlled process, and the sensors responsible for delivering feedback back to the controller. Every control action initiated by a controller is based on the control algorithm. This algorithm functionalizes the controller’s decision-making process and the process models that represent the controller’s internal beliefs used to make decisions. Controllers as well as controlled processes can provide or get feedback from external components, as indicated by the arrows depicted in Figure 1.
For STPA, the loss represents any emergent system situation that must be avoided. The goal is to control and reduce or eliminate the hazards that are associated with those losses. The methodology consists of 4 steps [30].
1.
Define the purpose of analysis—system losses, system level hazards, and corresponding safety constraints are defined.
2.
Model of the control structure—a hierarchical control structure of the system is composed of a series of connected feedback and control loops.
3.
Identify unsafe control actions (UCAs)—these are the control actions which under worst-case circumstances will result in a hazard.
4.
Identify loss scenarios—these are the scenarios that result from the combination of several causal factors (CFs) that may lead to UCAs and potential loss.
The system hazards are obtained by evaluating how the system control decisions and actions can lead to situations that compromise the system’s specified security restrictions. The unsafe control activities (UCAs) occur from instances where control actions can possibly break safety constraints. The following four dialog boxes are used to guide the scenario identification process that can lead to UCAs: (a) control action not given, (b) control action given incorrectly, (c) control action given in the wrong timing (too early or too late) or in the wrong sequence, and (d) control action applied too long or stopped too soon. A-STPA [31], as an analysis support tool for the STPA-based hazard analysis, is used for the feasibility study. There are various other software tools that support risk analysis based on the STPA model, e.g., SafetyHAT modelling tool, developed by the US National Transportation Systems Center [32] and XSTAMPP [33]. A-STPA is preferred due to its simplicity and maturity in modeling and mapping the risk management diagrams as defined in the STPA methodology.

3. STPA Results

3.1. Purpose of the Analysis

The first step is to identify potential losses to be prevented, describe the system and system-level hazards to be analyzed, and set the system boundaries and safety constraints.
An overview of potential losses in an SG is reported (Table 1) and these are further modelled within the context of the proposed methodology.
Along with the identification of potential accidents, the associated list of hazards is defined (Table 2).
System level constraints can be then extracted from hazards description, for example, that smart grids must satisfy irregular system energy demands.

3.2. Modelling the Control Structure

The second step of the process is to develop a system hierarchical control structure and model the system interrelationships by using a set of feedback control loops. The model begins with a high-level structure (Figure 4) in which the basic systems are identified. Afterwards, it is refined to a more detailed one defining how these systems are controlled (Figure 5).
The next step is to follow the basic control loop set to define all the system components by categorizing them into controllers, sensors, actuators, and controlled processes. Once the controllers have been identified, responsibilities are assigned as refinement of the safety constraints. Next, control actions for each controller are defined based on these responsibilities. The definition of control actions includes the identification of the controllable elements on the way to incorporate active attributes to address electricity grid operational needs (Table 3). Feedback, then, can be derived from the control actions and responsibilities by first identifying the process models that controllers will need to make decisions (Table 4). The control structure is refined further by using the responsibilities to deepen and add further details (Figure 6).

3.3. Identifying Unsafe Control Actions

The main principles of STPA theory is the identification of Unsafe Control Actions and Causal Factors. The Unsafe Control Action (UCA) Analysis is performed to assess which of the potential unsafe controls may lead to the system-level hazards. The square parentheses indicate the linkage of each UCA with the accidents listed in Table 1. A not exhaustive list of UCAs is defined for the defined system in Table 5.
Once UCAs have been identified, they are translated into constraints on the behavior of each controller, as indicatively shown in Table 6.

3.4. Loss Scenarios

Following UCA identification, the reasons why unsafe control might occur in the system are examined and scenarios are developed to explain how faulty feedback, incomplete or weak requirements, component malfunctions, and other factors could cause unsafe control actions and finally lead to accidents. Once scenarios are identified, they can be used to identify gaps, develop additional constraints, recommendations, and define test cases for decision making evaluation. The scenarios are separated into three categories according to the reasons that may lead to unsafe control. Each UCA may be related to one or more different scenarios. As an example, an indicative list of scenarios developed from a selected number of UCAs is presented above.
(i)
Unsafe controller behavior
UCA: Load Forecaster (LF) does not make new load prediction while there is a change in the load schedule.
Scenario 1: The LF controller is not trained to meet requirements and fails to provide a load forecast during a change in schedule. As a result, less capacity may be required from the DNO (Distributed Network Operator) which can lead the Smartgrid not to meet local energy demand (H-1).
UCA: Load Balancer (LB) schedules load with total power consumption (at a time frame) higher than the capacity limit.
Scenario 1: The LB scheduling algorithm considers higher capacity limits than the actual ones in scheduling optimization. As a result, local energy demand and customer comfort preferences are not completely satisfied (H-2, H-3).
UCA: LB schedules appliance operation for a shorter than required period time to complete a work cycle before the deadline.
Scenario 1: The UAC requests for a task to complete in a certain time slack which is smaller than the required task operation time even if sufficient capacity is available, the LB fails in scheduling which may lead to partial satisfaction of local energy demand or customer preferences (H-2, H-3).
UCA: LB schedules each load more than one time.
Scenario 1: The LB algorithm incorrectly considers that a load request has been rejected and the corresponding task is scheduled again. As a result, the available capacity is not used prudently nor assessed accurately leading to the potential of higher capacity requirements and the smartgrid operating outside the capacity limits (H-1).
UCA: LB schedules a load prior to the one with higher priority.
Scenario 1: The Heuristic Function (HF) cannot assign properly the right Heuristic Value and the loading priorities are not determined correctly. This may lead to inability to meet local demand or customer preferences (H-2, H-3).
UCA: AC does not respond while there is a request for appliance operation.
Scenario 1: The AC is not triggered as required every TBD (To Be Done) seconds, thus, does not respond to a load request, which may cause inability to meet local energy demand or customer preferences (H-2, H-3).
UCA: UAC does not send updated operational status while there has been a change in status.
Scenario 1: There is a failure of the UAC hardware adaptor which does not trigger operational status modification. This may cause smartgrid to operate outside its capacity limits, not meeting local demand or customer preferences (H-1, H-2, H-3).
UCA: UAC sends the status too late (>TBD), seconds after it has been changed.
Scenario 1: There is a failure in the communication protocol and UAC sends status information with unacceptable delay. This may cause the network to operate outside capacity limits, not meeting local demand or customer preferences (H-1, H-2, H-3).
(ii)
Inadequate feedback and information
UCA: DRM demands higher capacity than actually required capacity for appliances to operate in the defined time horizon ahead.
Scenario 1: The load request rate of rejection is inappropriately measured due to insufficient information about the number of rejected requests from LB (the LB provides a higher number of rejected requests). Thus, in order to improve Quality of Service and avoid customer discomfort, DRM demands excessive capacity from the smartgrid. As a result, the network may operate out of its capacity limits (H1).
UCA: LF makes an excessive load prediction while appliance operation requirements can be met sufficiently according to the schedule.
Scenario 1: The LF forecasting model has used unreliable input data leading to excessive load predictions and resulting in higher load needs and the smartgrid operating outside its capacity limits [H-1].
UCA: LB schedules a load that cannot be covered by the capacity at the specific time frame.
Scenario 1: LB receives a ‘READY’ state assigned to the variable ‘Nominal Power’ for an appliance that is operating in ‘RUN’ state with a higher load consumption rate. This may lead to insufficient capacity to meet local demand or satisfy customer preferences (H-2, H-3).
Scenario 2: LB retrieves inaccurate or unrealistic information of local forecasts so that the required load cannot be supplied. As a result, the network may not be able to meet current local needs.
Scenario 3: LB retrieves inaccurate or unrealistic information about the available capacity. Again, the results may be that the inability of the network to meet current local needs.
UCA: UAC does not send a load request while an appliance need to start operating.
Scenario 1: Appliance description by the manufacturer is not sufficiently detailed to allow UAC to generate adequate commands for the appliance operation.
(iii)
Scenarios in which control actions are improperly executed or not executed
Control Action: UAC sends operational status commands (start/stop/Synch. Clock)
Scenario 1: Although UAC sends Start command for an appliance, the appliance does not start operating due to adaptor failure. This may lead to inability to meet local energy demand (H-2).
Scenario 2: Although UAC sends Stop command for an appliance, the appliance does not stop operating due to adaptor failure consuming, thus, energy unproductively. This will result in excessive demand and may lead Smartgrid to operate out of its capacity limits (H-1).
Based on the identified loss scenarios, the Causal Factors (CFs) leading to a UCA can be classified. In this process, CFs are the main reasons in this process that can lead control behavior to become UCAs. Following the CFs identification, and in order to provide information on how to reduce the CF-related risk associated with UCAs, the next step is to identify appropriate “safeguards” for each CF. The safeguards are actions required to either prevent the causal scenario from occurring or reduce the impact on the scenarios perceived by the relevant CF [34].

4. Discussion

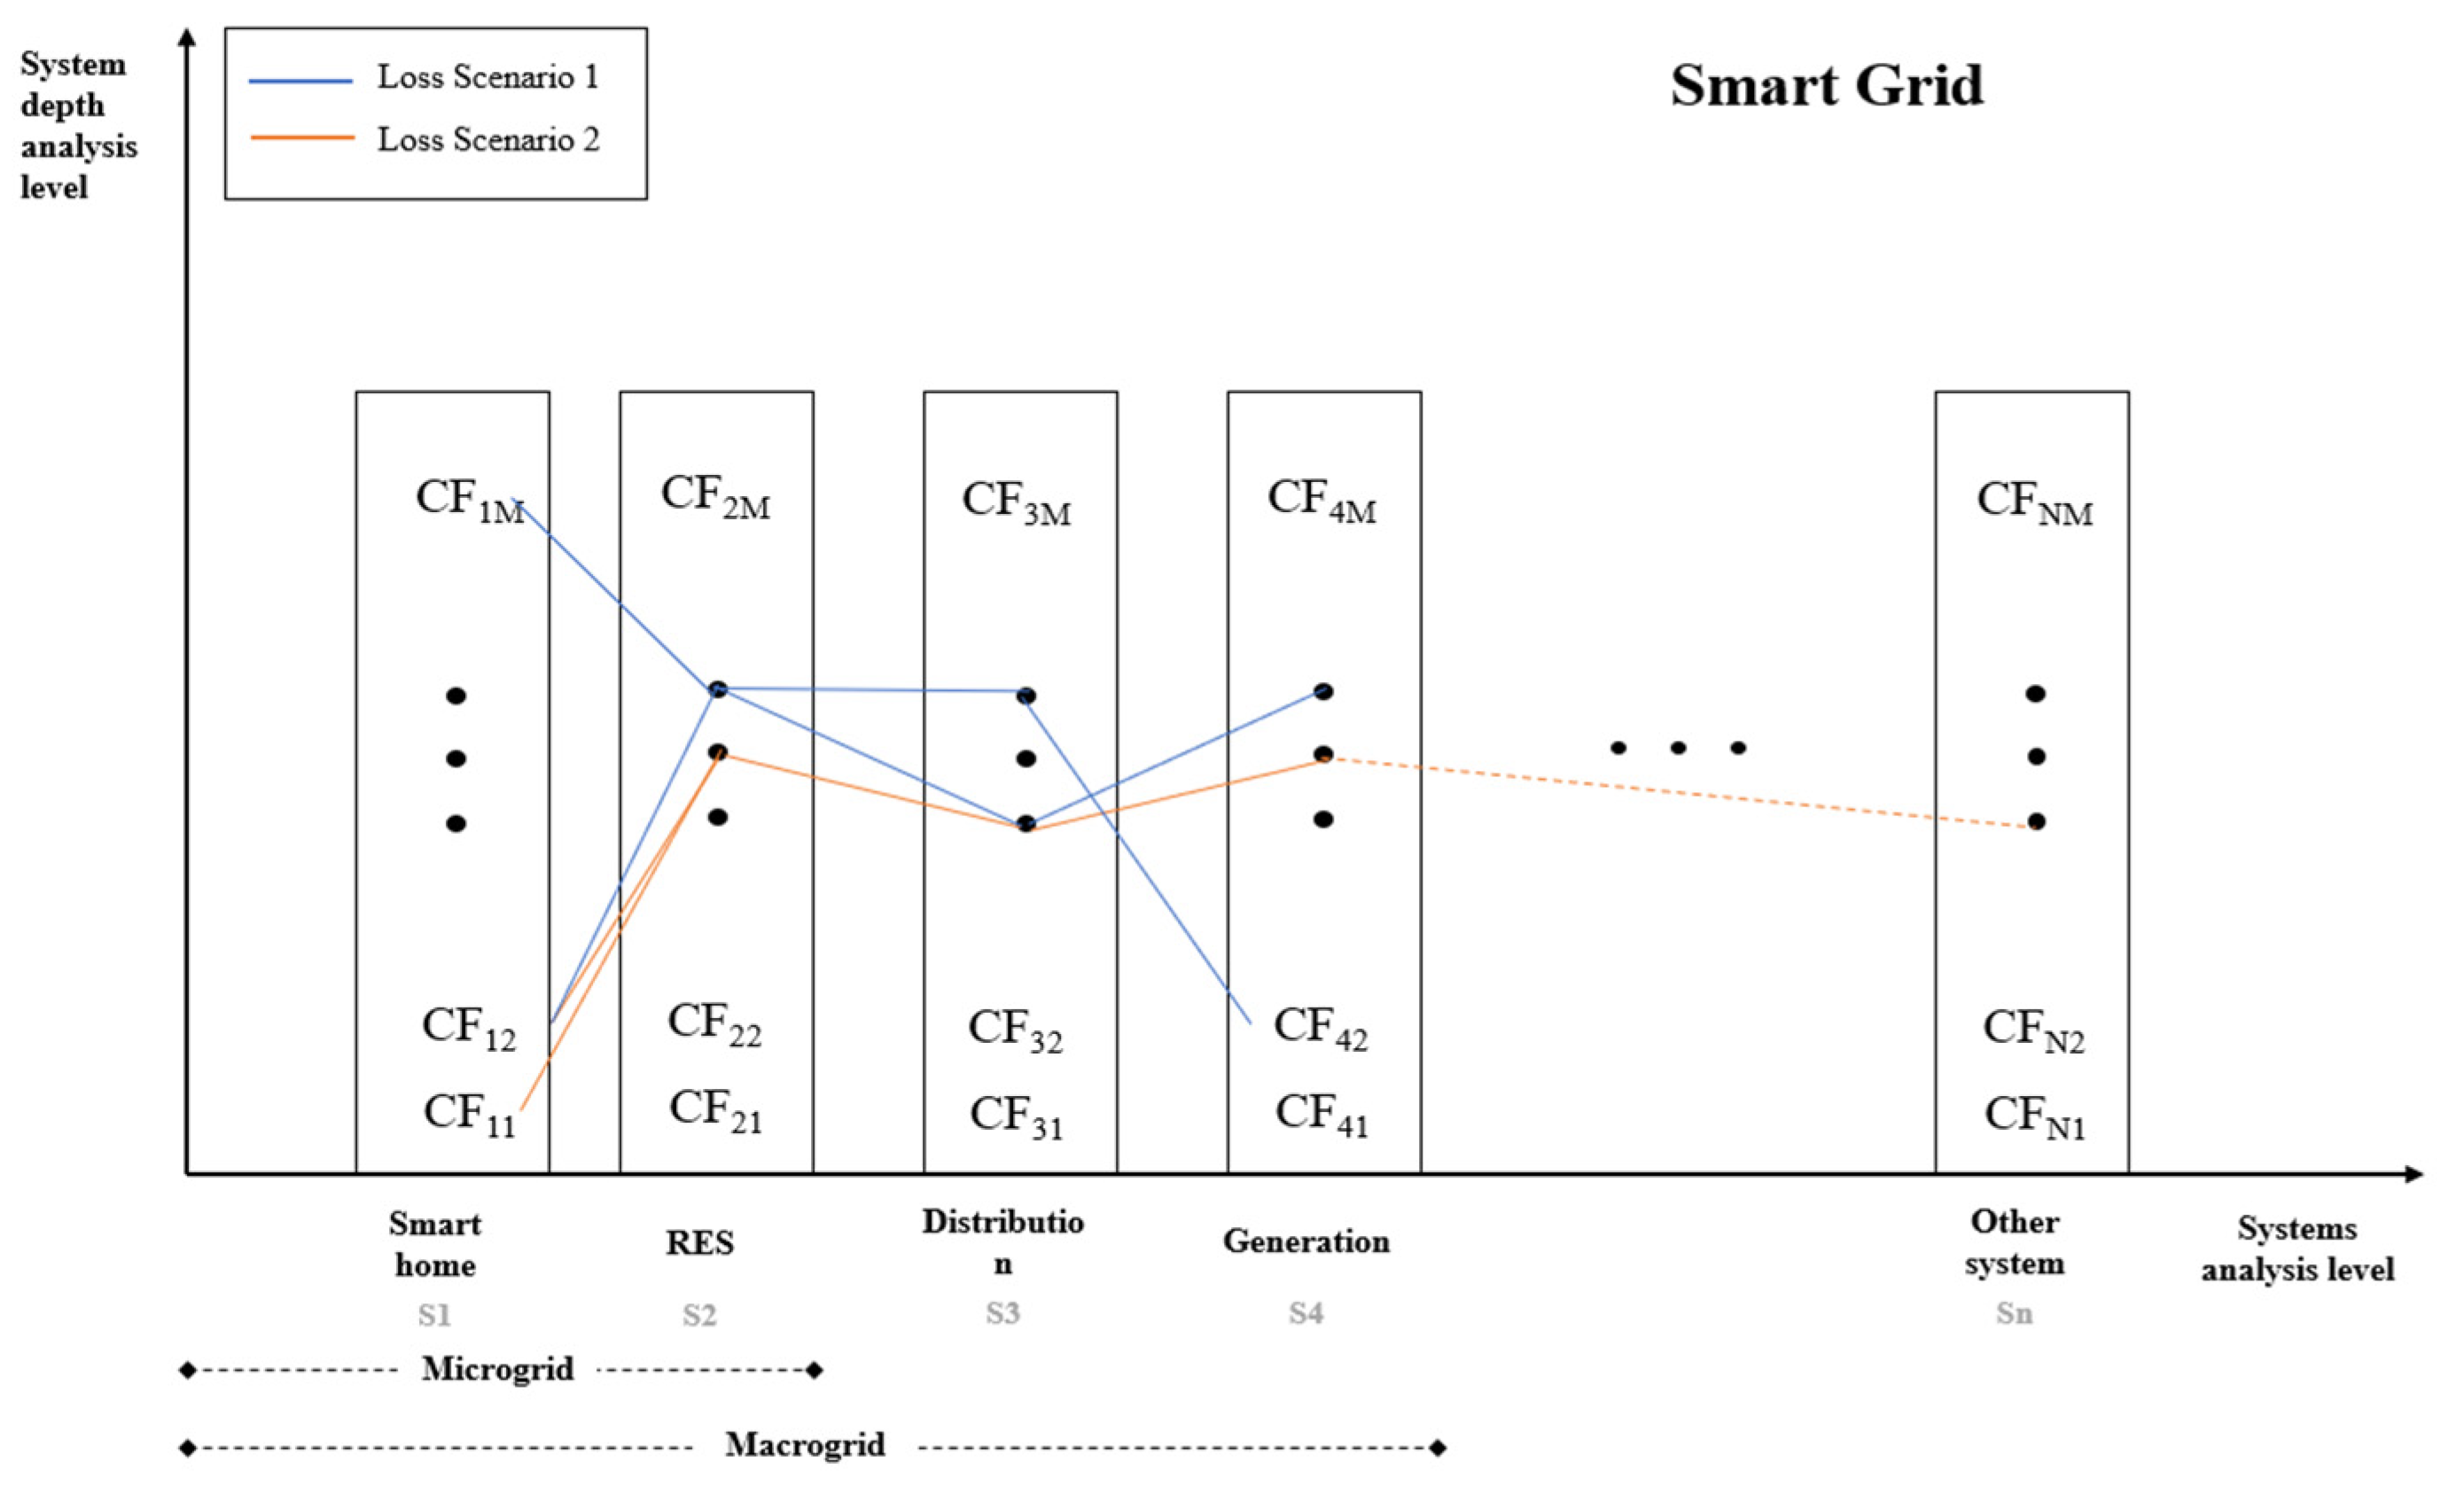
STPA’s top-down approach gives a strong outline for risk control measures to assess smartgrid operational performance, providing the capability to expand the scope of risk analysis both in a horizontal axis, considering all the systems of the SG (in this paper focusing on demand response system) as well as in a vertical axis, incorporating all the parts and their interactions in each system (Figure 7). The CFs of each system and the combination of CFs within and between systems can be exploited in different analysis levels, starting from residential area and Smart Homes on a microgrid scale up to macrogrid scale of a Smart Grid. In reality, STPA amplifies the identification process of CFs in different levels of analysis (both in terms of depth within a system and systems entirety), which can be adjusted according to the general system requirements and the corresponding feedback. Furthermore, before starting the STPA-based assessment, there is no need for a finalized safety process design, allowing the development of the safety process to be based on the STPA outcomes [35]. STPA can thus be used in the development of safety system design and support modification as the system continues to evolve, allowing safety standards to be enhanced [30]. The STPA findings can be used to generate a variety of safeguards to ensure secure operational control. Since the STPA method focuses on defining system-level risks and there is no importance value consideration, there is no practical or reliable way to assess each of the reported UCAs or safeguards. The major advantage is that having this whole system view can help in the risk assessment process when attempting to comprehend and evaluate the efficiency of control measures. This mechanism is useful in understanding where gaps in current operational risk structures may exist and in implementing targeted strategies through standard approaches of risk assessment. This point is reinforced by the fact that while there is potential for evolution where advances in risk management frameworks place higher stress on risk controls, there is not yet appropriate operational hazard management in providing those controls.

5. Conclusions

In recent days, the Smart Grid is replacing the traditional electricity grid due to the increasing demand of the energy for industrial and residential area. This increasing demand of energy leads to exploring innovative and technologically advanced ways to fulfil increasing energy demand. In this direction, as electricity grids become more complicated, the limitations of traditional risk analysis are revealed. More complex modelling techniques are required to handle the multi-dimensional synthesis of accidents in the electricity systems. The components of a smartgrid interact in ways that are complex and unforeseen at first glance, and this complexity leads to hazard states and risk scenarios which traditional hazard analysis techniques are unable to cope with. On the other hand, new analysis techniques, which are based on systems theory rather than on individual component failures, can provide advanced capabilities in analyzing and controlling such complex systems and processes. The analysis of complex systems requires a tool that can manage complexity while offering insight into the detailed system operation with the aim to reduce system vulnerability while maintaining its capabilities. This paper presents the adaptation of a new accident analysis technique called STPA (System-Theoretic Process Analysis) as a structured method to identify hazards and their associated risk to the smartgrid system. The proposed methodology investigates interconnections within smartgrid system control loop, which may lead to the discovery of hazards beyond the capability of traditional analysis. Considering the fact that the application of risk management methodologies in the grid management is still limited and incomplete, the proposed systemic structure provides a solution to deal with system design errors and handle with component interaction accidents, indirect, or non-linear interactions and complexity and systemic factors affecting all components. An important goal of this approach is to assist decision making during the early phases of design when only coarse information is known about the system.
A critical part of STPA is the definition of the control structure and all relevant system components and their relationships, as they form the base for the generation of a structured list of possible scenarios that may lead to hazards. Once the causal scenarios are identified, they can be used to provide detailed requirements for the designers in order to avoid the hazards and eliminate or mitigate the causal factors.
Future work plans include the development of techniques to choose and define the most critical scenarios and increase analysis level with the involvement of more controllers and actions as well as systems, in order to close the SG safety loop.

Author Contributions

S.K. conceived and developed of the presented framework. A.C. supervised the findings of this work. All authors discussed the results and contributed to the final manuscript. All authors have read and agreed to the published version of the manuscript.

Funding

This research has received no external funding.

Conflicts of Interest

The authors declare no conflict of interest.

Abbreviations

STAMPSystems-Theoretic Accident Model and Processes
STPASystem-Theoretic Process Analysis
SGSmart Grid
FTAFault Tree Analysis
HAZOPHazard and operability study
FMEAFailure Mode and Effects Analysis
UCAUnsafe Control Action
CFACausal Factor Analysis
DSMDemand-Side Management
DNODistributed Network Operator
DRMDemand Response Manager

References

  1. European Commission. Energy Technologies Information System (SETIS): Smart Electricity Grid. 2012. Available online: http://setis.ec.europa.eu/smart-electricity-grids (accessed on 10 March 2020).
  2. Chondrogianni, D.; Karatzas, S.; Stephanedes, Y. A Process-Centric Approach for System-of-Systems Integration in Smart Cities. 2018. Available online: http://3ftfah3bhjub3knerv1hneul-wpengine.netdna-ssl.com/wp-content/uploads/2018/12/Chondrogianni-V.-Dimitra-Karatzas-Stylianos-Stephanedes-Yorgos.pdf (accessed on 5 September 2019).
  3. NIST. NIST Framework and Roadmap for Smart Grid Interoperability Standards Release 1.0; Office of the National Coordinator for Smart Grid Interoperability, National Institute of Standard and Technology: Gaithersburg, MD, USA, 2010. [Google Scholar]
  4. Mohagheghi, S.; Yang, F.; Falahati, B. Impact of demand response on distribution system reliability. In Proceedings of the 2011 IEEE Power and Energy Society General Meeting, Detroit, MI, USA, 24–28 July 2011; IEEE: Piscataway, NJ, USA, 2011; pp. 1–7. [Google Scholar]
  5. Nordgård, D.E.; Sand, K.; Wangensteen, I. Risk assessment methods applied to electricity distribution system asset management. In Reliability, Risk and Safety: Theory and Applications; ESREL: Prague, Czech Republic, 2009; pp. 429–436. [Google Scholar]
  6. Brown, R.E. Electric Power Distribution Reliability; CRC Press: Boca Raton, FL, USA, 2017. [Google Scholar]
  7. Falaghi, H.; Haghifam, M.R.; Tabrizi, M.O. Fault indicators effects on distribution reliability indices. In Proceedings of the CIRED 2005—18th International Conference and Exhibition on Electricity Distribution, Turin, Italy, 6–9 June 2005; IET: London, UK, 2005; pp. 1–4. [Google Scholar]
  8. Holmgren, Å.J. Using graph models to analyze the vulnerability of electric power networks. Risk Anal. 2006, 26, 955–969. [Google Scholar] [CrossRef] [PubMed]
  9. Qureshi, Z. A review of accident modelling approaches for complex socio-technical systems. In Proceedings of the Twelfth Australian Workshop on Safety Critical Systems and Software and Safety-Related Programmable Systems, Adelaide, Australia, 30–31 August 2007; Australian Computer Society, INC.: Darlinghurst, Australia, 2007; Volume 86, pp. 47–59. [Google Scholar]
  10. I.E.C. 60812:2006 Analysis Techniques for System Reliability-Procedure for Failure Mode and Effects Anaysis (FMEA). 2006. Available online: http://www.iec.chAugust2014 (accessed on 18 April 2020).
  11. Ericson, C.A. Fault tree analysis-a history. In Proceedings of the 17th International System Safety Conference, Orlando, FL, USA, 16–21 August 1999. [Google Scholar]
  12. McDermid, J.A.; Nicholson, M.; Pumfrey, D.J.; Fenelon, P. Experience with the application of HAZOP to computer-based systems. In Proceedings of the 10th Annual Conference on Computer Assurance (COMPASS’95), Systems Integrity, Software Safety and Process Security, Gaithersburg, MD, USA, 26–30 June 1995; pp. 37–48. [Google Scholar]
  13. Hollnagel, E.; Woods, D.D.; Leveson, N. Resilience Engineering: Concepts and Precepts; Ashgate Publishing, Ltd.: Farnham, UK, 2006. [Google Scholar]
  14. Fleming, C.H.; Spencer, M.; Leveson, N.G.; Wilkinson, C. Safety Assurance in NextGen Technical Report; NASA Technical Report NASA/CR-2012-217553; NASA: Washington, DC, USA, 2012. [Google Scholar]
  15. Fleming, C.H.; Spencer, M.; Thomas, J.; Leveson, N.; Wilkinson, C. Safety assurance in NextGen and complex transportation systems. Saf. Sci. 2013, 55, 173–187. [Google Scholar] [CrossRef]
  16. Rasmussen, J. Risk management in a dynamic society: A modelling problem. Saf. Sci. 1997, 27, 183–213. [Google Scholar] [CrossRef]
  17. Leveson, N. A new accident model for engineering safer systems. Saf. Sci. 2004, 42, 237–270. [Google Scholar] [CrossRef] [Green Version]
  18. Leveson, N. Engineering a Safer World: Systems Thinking Applied to Safety; The MIT Press: Cambridge, MA, USA, 2012. [Google Scholar]
  19. Pereira, S.J.; Lee, G.; Howard, J. A system-theoretic hazard analysis methodology for a non-advocate safety assessment of the ballistic missile defense system. In Proceedings of the AIAA Missile Sciences Conference, Monterey, CA, USA, 14–16 November 2006. [Google Scholar]
  20. Thomas, J.; Leveson, N.G. Performing hazard analysis on complex, software and human-intensive systems. In Proceedings of the 29th ISSC Conference about System Safety, Las Vegas, NV, USA, 8–12 August 2011. [Google Scholar]
  21. Ishimatsu, T.; Leveson, N.G.; Thomas, J.; Katahira, M.; Miyamoto, Y.; Nakao, H. Modeling and hazard analysis using STPA. In NASA 2010 IV&V Annual Workshop; NASA: Washington, DC, USA, 2010. [Google Scholar]
  22. Chassiakos, A.; Karatzas, S. Systems-theoretic process analysis in buildings energy risk management. In Proceedings of the European Conference on Computing in Construction, Crete, Greece, 10–12 July 2019. [Google Scholar] [CrossRef] [Green Version]
  23. Cameron, I.; Mannan, S.; Németh, E.; Park, S.; Pasman, H.J.; Rogers, W.; Seligmann, B. Process hazard analysis, hazard identification and scenario definition: Are the conventional tools sufficient, or should and can we do much better? Process. Saf. Environ. Prot. 2017, 110, 53–70. [Google Scholar] [CrossRef] [Green Version]
  24. Lai, J.; Zhou, H.; Hu, W.; Zhou, D.; Zhong, L. Smart Demand Response Based on Smart Homes. Math. Probl. Eng. 2015, 2015, 912535. [Google Scholar] [CrossRef] [Green Version]
  25. Nichols, J.; Myers, B.A.; Higgins, M.; Hughes, J.; Harris, T.K.; Rosenfeld, R.; Pignol, M. Generating remote control interfaces for complex appliances. In Proceedings of the 15th Annual ACM Symposium on User Interface Software and Technology, Paris, France, 27–30 October 2002; ACM: New York, NY, USA, 2002; pp. 161–170. [Google Scholar]
  26. Karnouskos, S.; De Holanda, T.N. Simulation of a smart grid city with software agents. In Proceedings of the 2009 Third UKSim European Symposium on Computer Modeling and Simulation, Athens, Greece, 25–27 November 2009; IEEE: Piscataway, NJ, USA, 2009; pp. 424–429. [Google Scholar]
  27. Latifi, M.; Khalili, A.; Rastegarnia, A.; Zandi, S.; Bazzi, W.M. A distributed algorithm for demand-side management: Selling back to the grid. Heliyon 2017, 3, e00457. [Google Scholar] [CrossRef] [PubMed]
  28. Al-Sumaiti, A.S.; Ahmed, M.H.; Salama, M.M.A. Smart Home Activities: A Literature Review. Electr. Power Compon. Syst. 2014, 42, 294–305. [Google Scholar] [CrossRef]
  29. Leveson, N. System Safety Engineering: Back to the Future; Massachusetts Institute of Technology: Cambridge, MA, USA, 2002. [Google Scholar]
  30. Leveson, N.; Thomas, J. STPA Handbook. 2018. Available online: https://psas.scripts.mit.edu/home/get_file.php?name=STPA_handbook.pdf (accessed on 16 March 2020).
  31. Studienprojekt. Software Engineering Group of the University of Stuttgart. 2014. Available online: www.xstampp.de (accessed on 2 September 2019).
  32. Available online: https://www.volpe.dot.gov/infrastructure-systems-and-technology/advanced-vehicle-technology/safetyhat-transportation-system (accessed on 16 March 2020).
  33. Abdulkhaleq, A.; Wagner, S. XSTAMPP: An eXtensible STAMP Platform as Tool Support for Safety Engineering. In Proceedings of the 2015 STAMP Conference, Boston, MA, USA, 23–26 March 2015. [Google Scholar] [CrossRef]
  34. Merrett, H.C.; Horng, J.J.; Piggot, A.; Qandour, A.; Tong, C.W. Comparison of STPA and Bow-tie Method Outcomes in the Development and Testing of an Automated Water Quality Management System. In MATEC Web of Conferences; EDP Sciences: Les Ulis, France, 2019; Volume 273, p. 02008. [Google Scholar]
  35. Leveson, N. A systems approach to risk management through leading safety indicators. Reliab. Eng. Syst. Saf. 2015, 136, 17–34. [Google Scholar] [CrossRef] [Green Version]
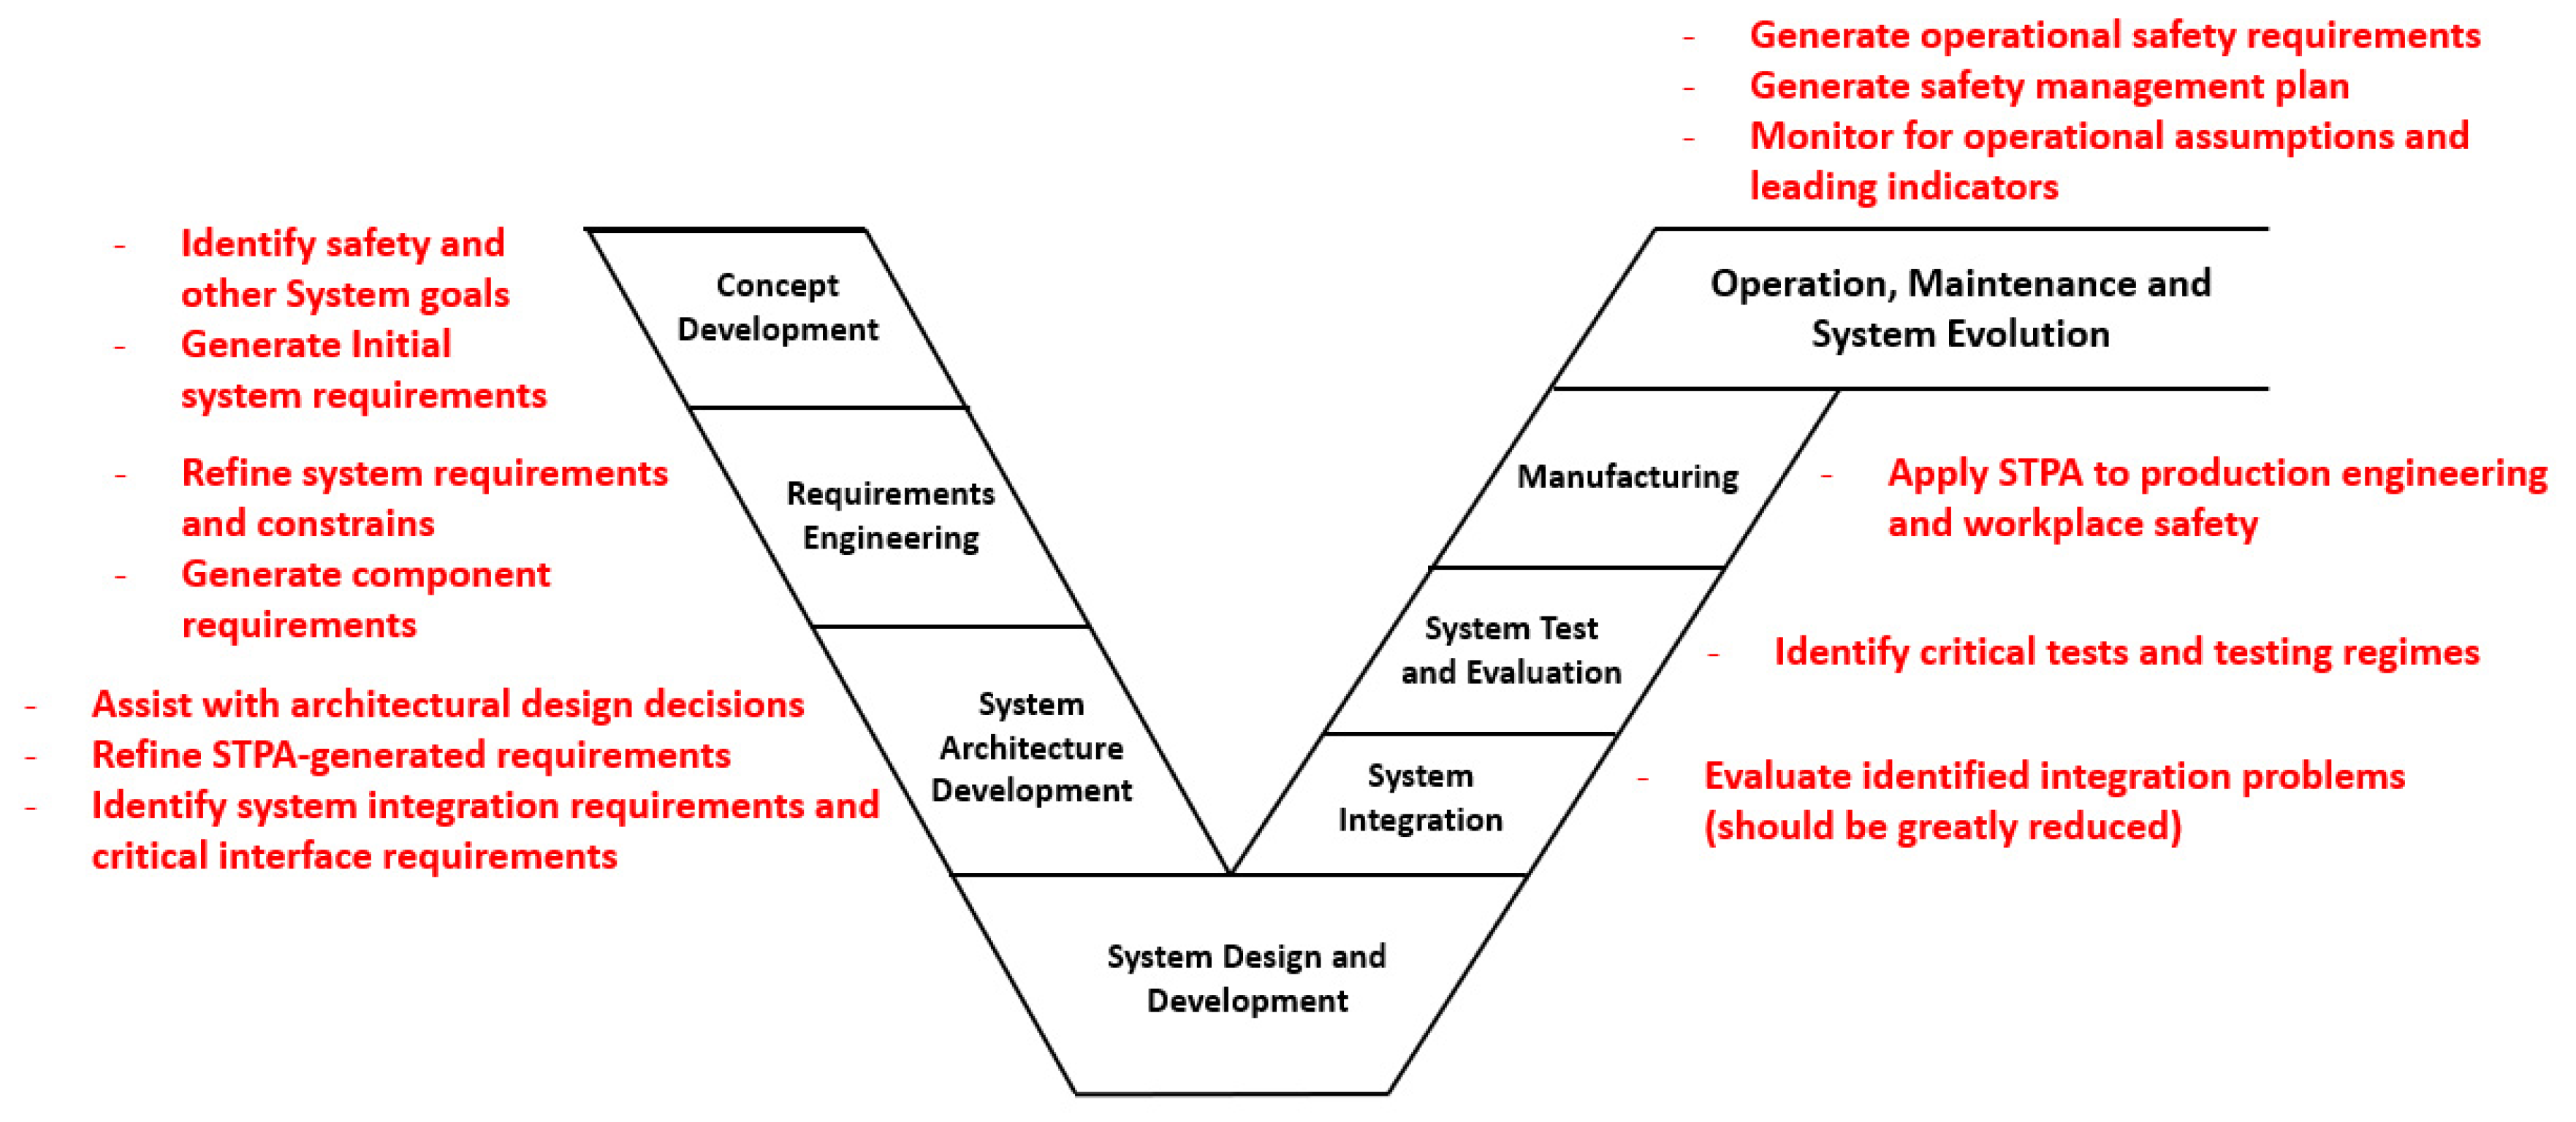
Figure 1. System Theoretic Process Analysis (STPA) and System Engineering Process [22].
Systems 08 00033 g001
Figure 2. Smart Homes (SHs) based Demand/Response system architecture.
Systems 08 00033 g002
Figure 3. System Theoretic Process Analysis (STPA) generic control loop [30].
Systems 08 00033 g003
Figure 4. Control structure—1st level.
Systems 08 00033 g004
Figure 5. Control structure—2nd level.
Systems 08 00033 g005
Figure 6. Control structure after refinement based on responsibilities—3rd level.
Systems 08 00033 g006
Figure 7. Causal Factors analysis level.
Systems 08 00033 g007
Table 1. List of identified Hazards.
No.Hazard DescriptionRelated Accidents
1Smartgrid cannot meet unexpected demands1, 3
2Smartgrid cannot satisfy local energy demands2
3Smartgrid cannot keep customers comfortable per their preferences2
Table 2. List of identified Accidents/Losses.
No.Accident Description
1Power shortages
2Customer Loss
3Grid equipment loss (capacitors, lines, etc.)
Table 3. Control Actions.
No.Control Action Description
1capacity demand
2provide the capacity limits
3predict required loads
4schedule load requests
5accept load request
6reject load request
7send operational status (start/stop/Synch. Clock) commands
8send load requests
9set comfort boundaries
Table 4. Feedback derived from Responsibilities and Processes.
No.ResponsibilitiesProcessFeedback
1Demand/Response Manager (DRM) asks for excess capacity from the Distributed Network Operator (DNO)Excess capacity is requiredExcess capacity
2DRM informs Load Balancer (LB) about the capacity limitsCapacity is adjustedAvailable capacity Predicted demand
3Load Forecaster (LF) provides load forecastsLoads are forecastedLoad schedule, Energy required, preemption, power load
4LB provide informs about available capacityCapacity available to cover loadsRejected requests
5LB schedules loads requestLoads are scheduledrejected requests, heuristic value, dependency matrix,
7Admission Control (AC) manages incoming requests from UACLoad requests acceptance/rejectionavailable capacity, requests
8Universal Appliances Controller (UAC) sends start/stop/synch. clock commands to adaptorsOperation management of appliancesload request
9UAC sends load request to ACLoad requestdirect consumption, indirect consumption, operational status
10Comfort Context set comfort boundariesMeet customer preferencesenvironmental conditions, operational status
11DNO provides excess capacityExcess capacity is deliveredRequired capacity
Table 5. Unsafe Control Actions for the controllers.
Unsafe Control Actions
Control ActionNot GivenProvided IncorrectlyWrong Timing or OrderStopped Too Soon or Applied Too Long
excess capacity demandDRM does not demand excess capacity while there is a need to cover more loads
(2, 3)
DRM demands more excess capacity than the actual required capacity for appliances to operate in the defined time horizon ahead
(1)
DRM demands excess capacity too late (>TBD) after request
(2, 3)
DRM stops Demanding for excess capacity while overload still remains
(2,3)
DRM demands less excessive capacity than the actual required capacity for appliances to operate in the defined time horizon ahead
(2,3)
DRM demands excessive capacity while the appliances can operate sufficiently in the defined time horizon ahead
(1)
provide the capacity limitsDRM does not provide capacity limits when these have been modified
(2, 3)
DRM provides capacity limits other than these required
(1, 2, 3)
DRM provides capacity limits too late (>TBD) after the capacity change
(1, 2, 3)
predict required loadsLF does not provide accurate load prediction while there is a change to the load schedule
(2, 3)
LF makes an inaccurate load prediction while appliances operation requirements can be met sufficiently according to the schedule
(1)
LF provides a load prediction too late (>TBD) after the change on the load schedule
(2, 3)
accept load request AC does not response while there is a request for an appliance to operate
(2, 3)
AC accepts load requests while it cannot be covered by the available capacity
(1, 2, 3)
AC accepts load request too late (>TBD) after the received request
(2, 3)
AC accepts load request while there is another request with higher priority
(2, 3)
reject load requestAC does not response while there is a request for an appliance to operate
(2, 3)
AC rejects load request while it can be covered by the available capacity
(2, 3)
AC rejects load request too late (>TBD) after the received request
(2, 3)
send operational status (start/stop/Synch. clock) commandsUAC does not send actuation demand while the appliance must start operating (2, 3)UAC sends appliance operational content different from the actual appliance status
(1, 2, 3)
UAC sends too late (>TBD) secs the status after it has been changed
(1, 2, 3)
send load requests UAC does not send load
requests while an appliance must start operating
(2, 3)
UAC send load requests for another appliance instead of the appliance must start operating
(2, 3)
UAC stops sending load requests for an appliance while its request is not
accepted yet (2, 3)
set comfort boundaries Context Module does not adjust comfort boundaries taking into account environmental conditions
(3)
Comfort Context set comfort boundaries not in line with user preferences
(3)
Comfort Context
adjust comfort
boundaries too late(>TBD) after preferences are modified
(3)
Comfort Context stops adjusting comfort boundaries although preferences change
(3)
Comfort Context set comfort boundaries not inline to
the actual env. conditions
(3)
Comfort Context adjust comfort boundaries too late(>TBD) secs after environmental conditions change
(3)
Comfort Context stops adjusting comfort boundaries although conditions change
(3)
schedule load requests LB schedule loads with total power consumption at each time frame more than the given capacity limit (1)
LB schedules a load to start while it should not according to the corresponding appliance operational status
(1)
LB schedule loads with
total power consumption at each time frame less than the given capacity limit (2, 3)
LB schedules a load prior to the one with higher priority.
(2, 3)
LB schedules a load that cannot be covered by the capacity at the specific defined time (2, 3)LB schedules a load prior to the one to which is
dependent
(2, 3)
Each appliance load is scheduled in an operation period in such a way that appliance is operated for less than the required time to complete
an operational cycle
(2, 3)
Each load is scheduled more than one time
(1)
Table 6. Safety Constraints.
No.Unsafe Control ActionsResulting Safety Constraints
1DRM does not demand excess capacity while there is a need to cover more loadsDRM must demand excess capacity when there is a need to meet consumption needs
2DRM demands more excessive capacity than the actual required for appliances to operate in the defined time horizon aheadDRM must demand the exact capacity required for the consumption of the appliances to operate efficiently in the defined time frame
3DRM demands excess capacity too late (>TBD) after requestDRM must demand excess capacity TBD secs after excessive load is identified
4DRM stops demanding for excessive capacity while overload remainsDRM must continue to demand for excessive capacity while there is over consumption in the respective time frame
5DRM demands less capacity than the actual required for appliances to operate in the defined time horizon aheadDRM must demand the required capacity to cover the over-consumption in a time frame
6DRM demands excess capacity while the appliances can operate sufficiently in the defined time horizon aheadDRM must not demand excess capacity while there is no overconsumption in a time frame
7DRM does not provide capacity limits when these have been changedDRM must provide capacity limits when thesehave been modified
8DRM provides capacity limits other than the actualDRM must provide capacity limits based on the actual conditions in premises
9DRM provides new capacity limits too late (>TBD) after the capacity changeDRM must provide new capacity limits within TBD secs after capacity change has been identified
10LF does not make new load prediction while there is a change to the load scheduleLF must adjust load predictions when there is a load schedule change