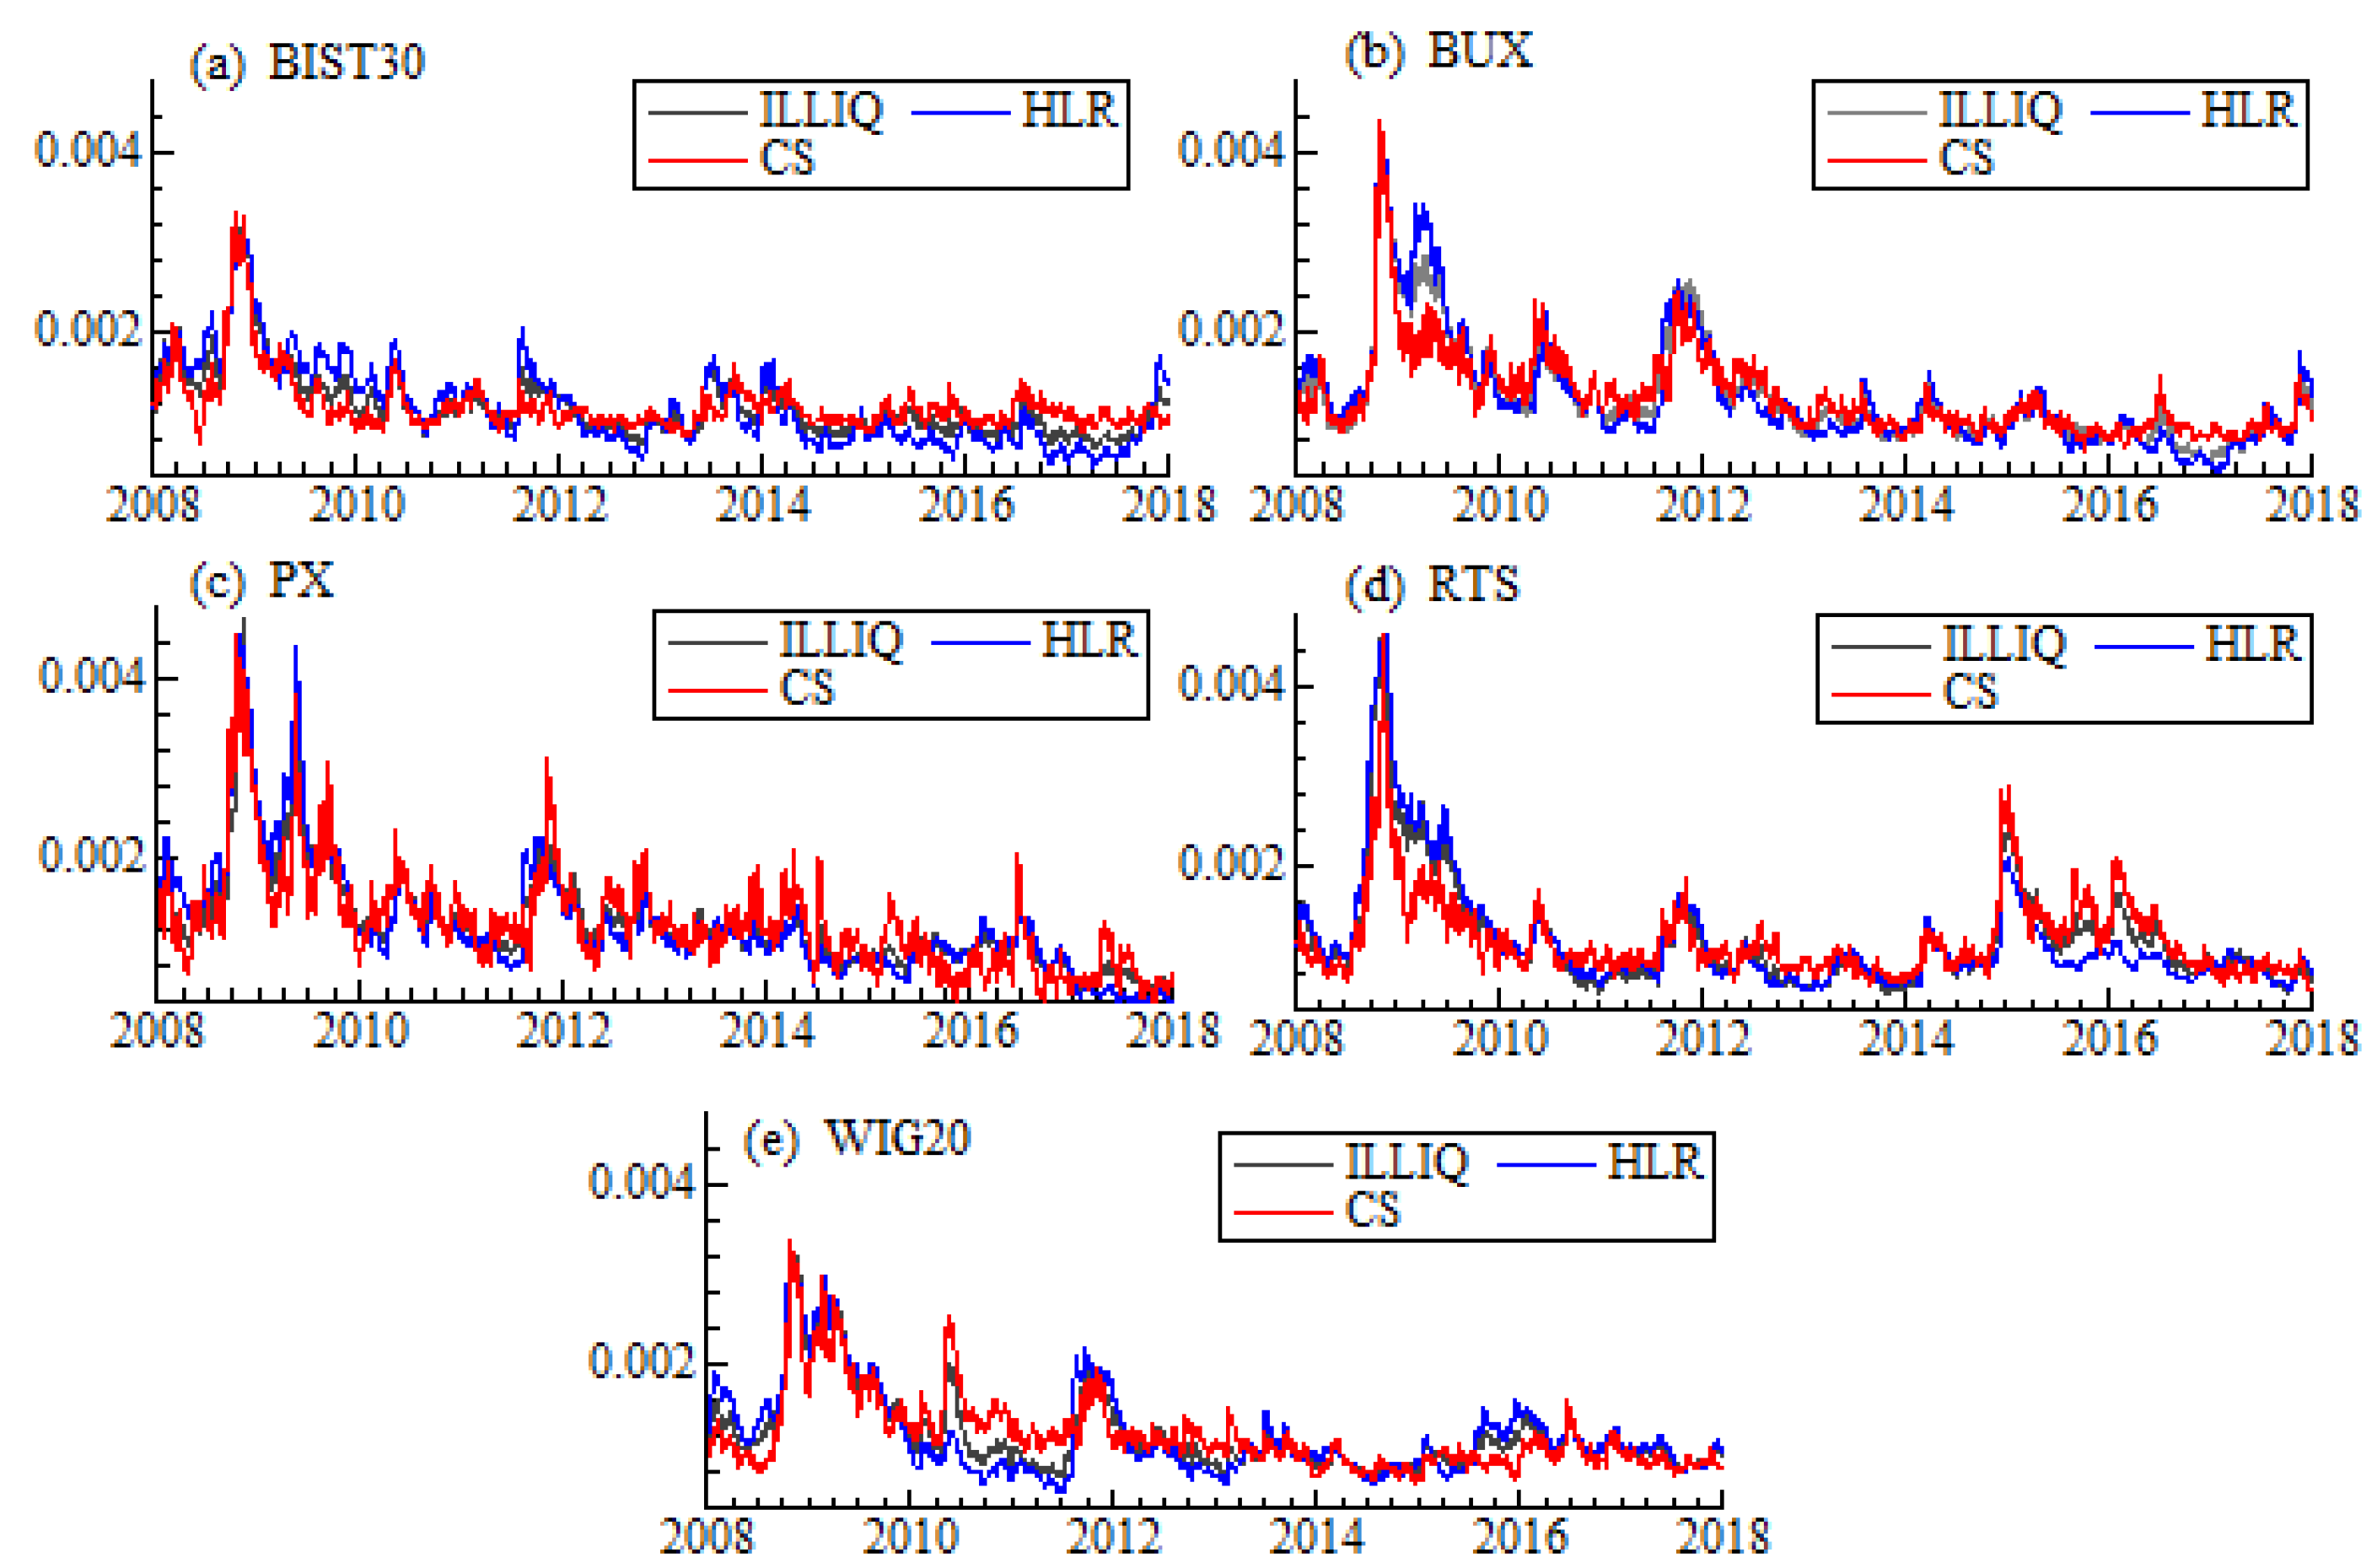
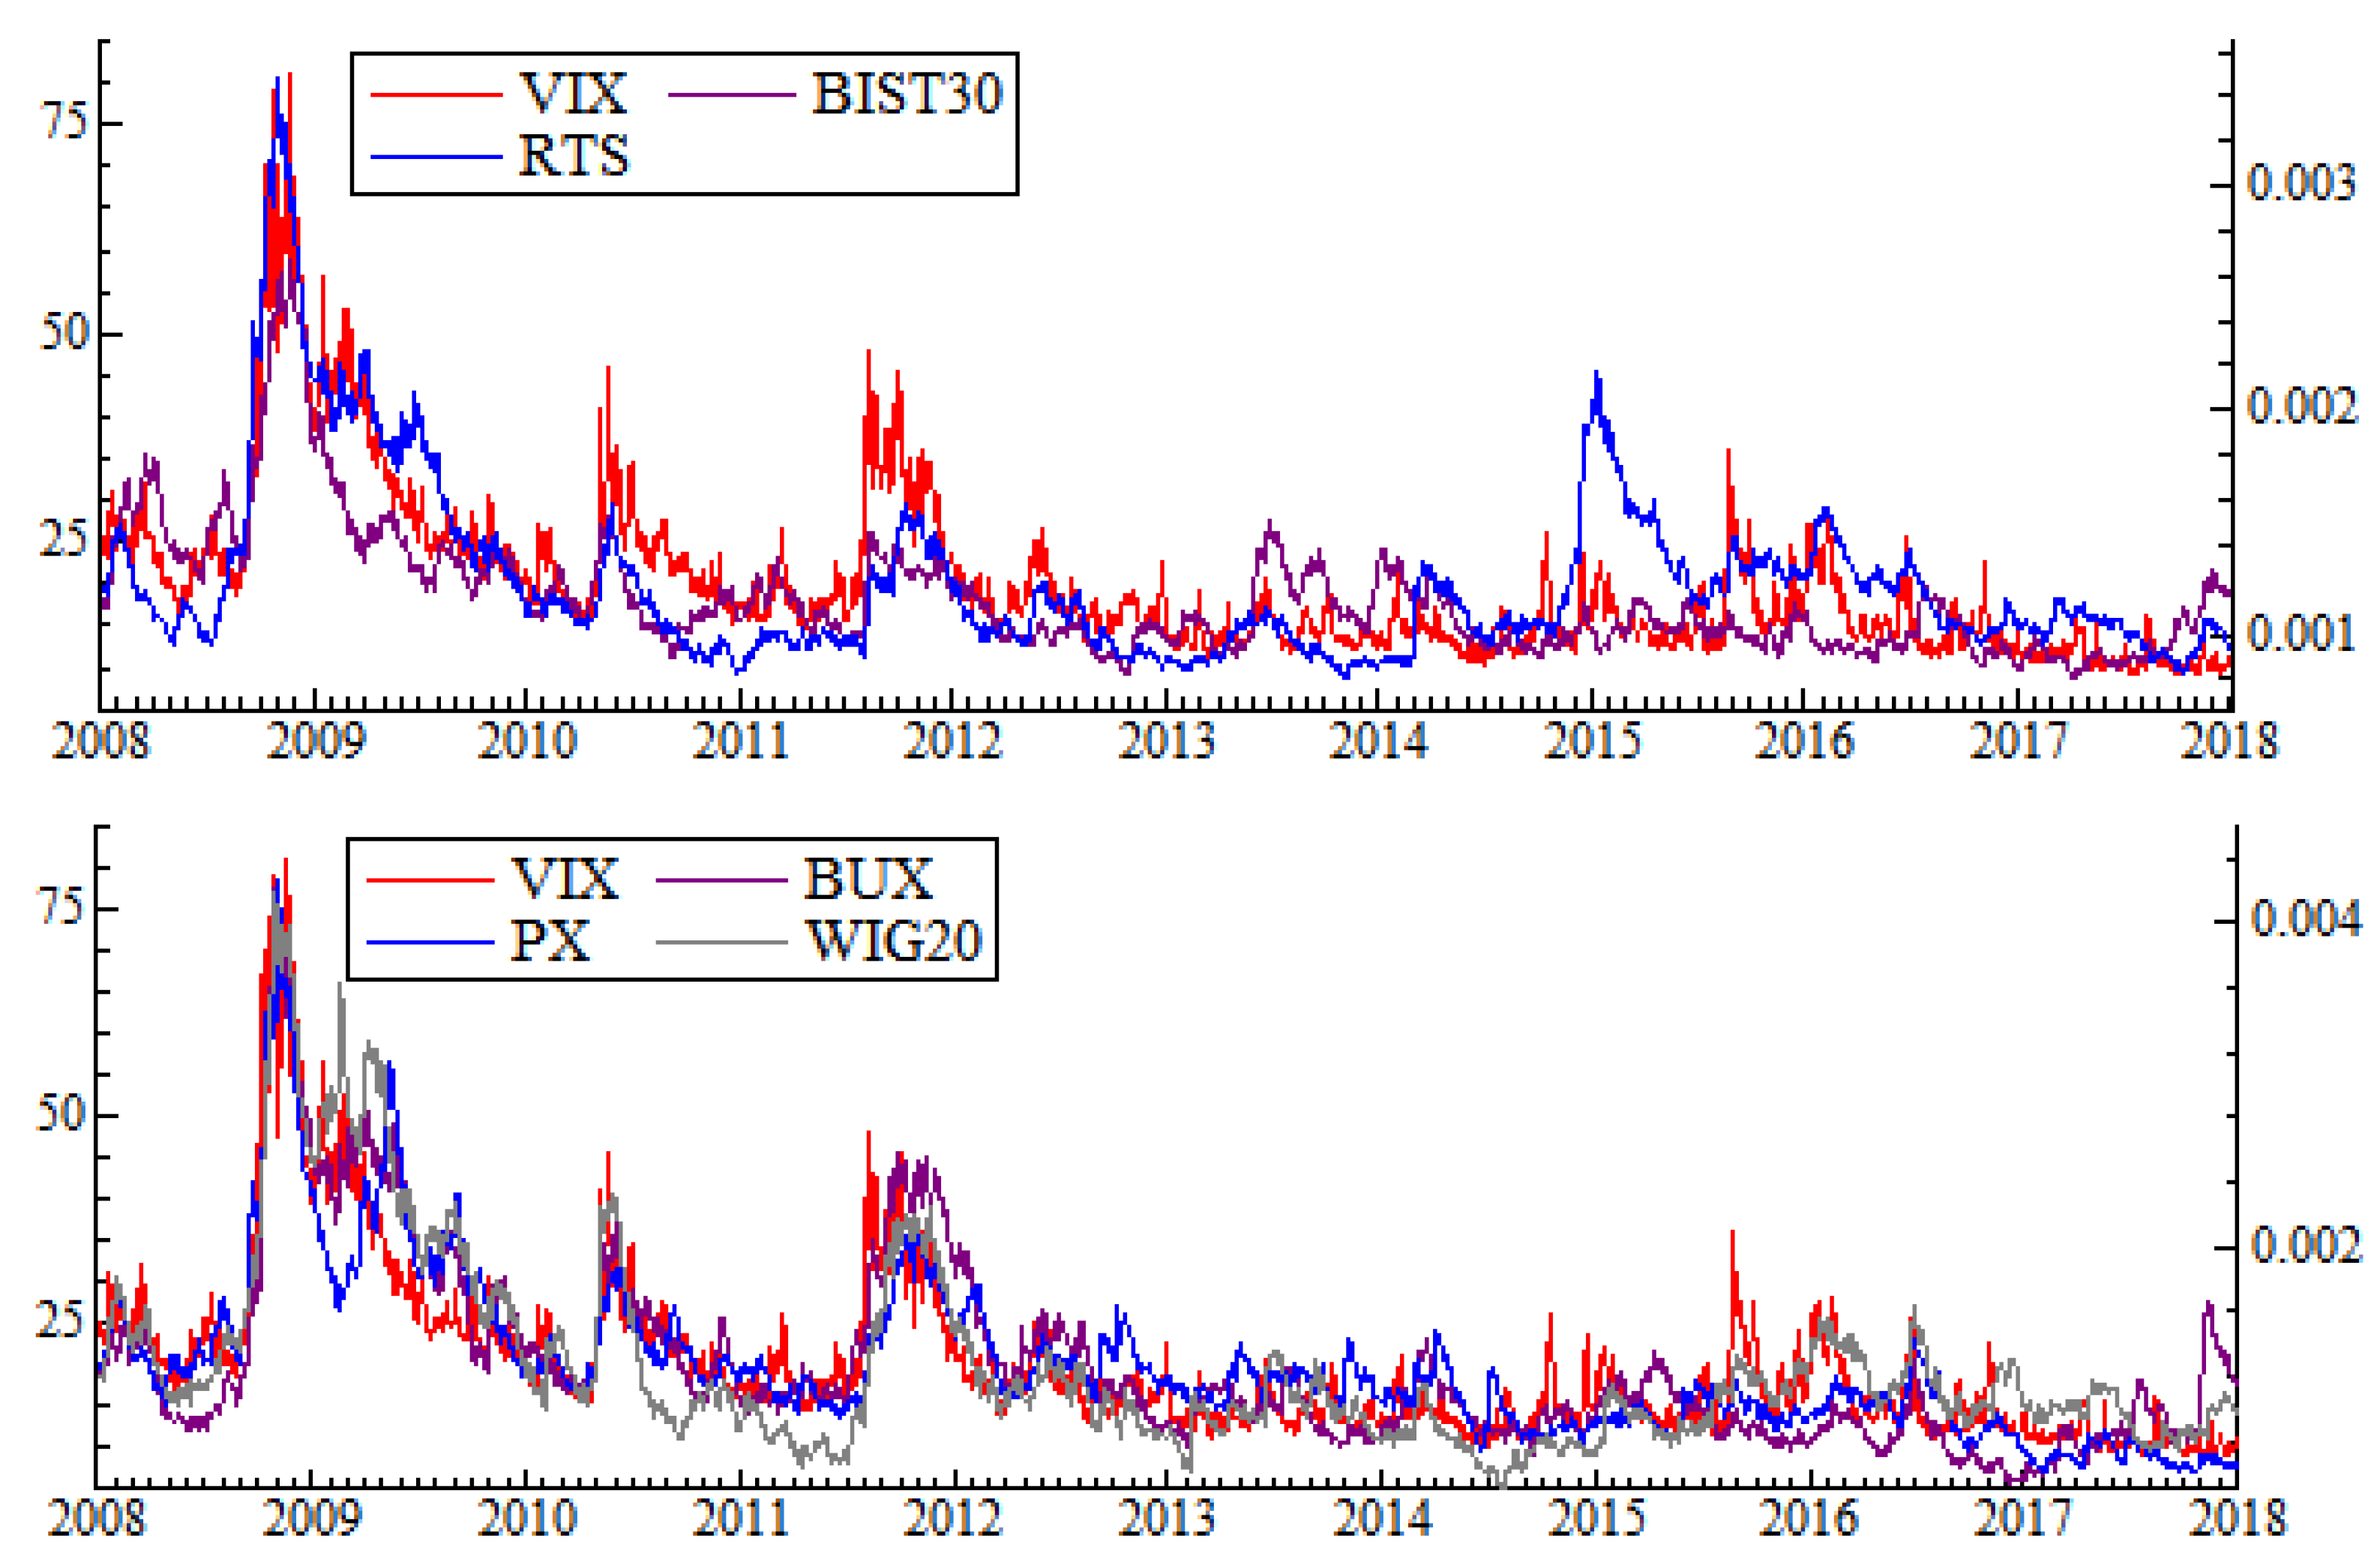
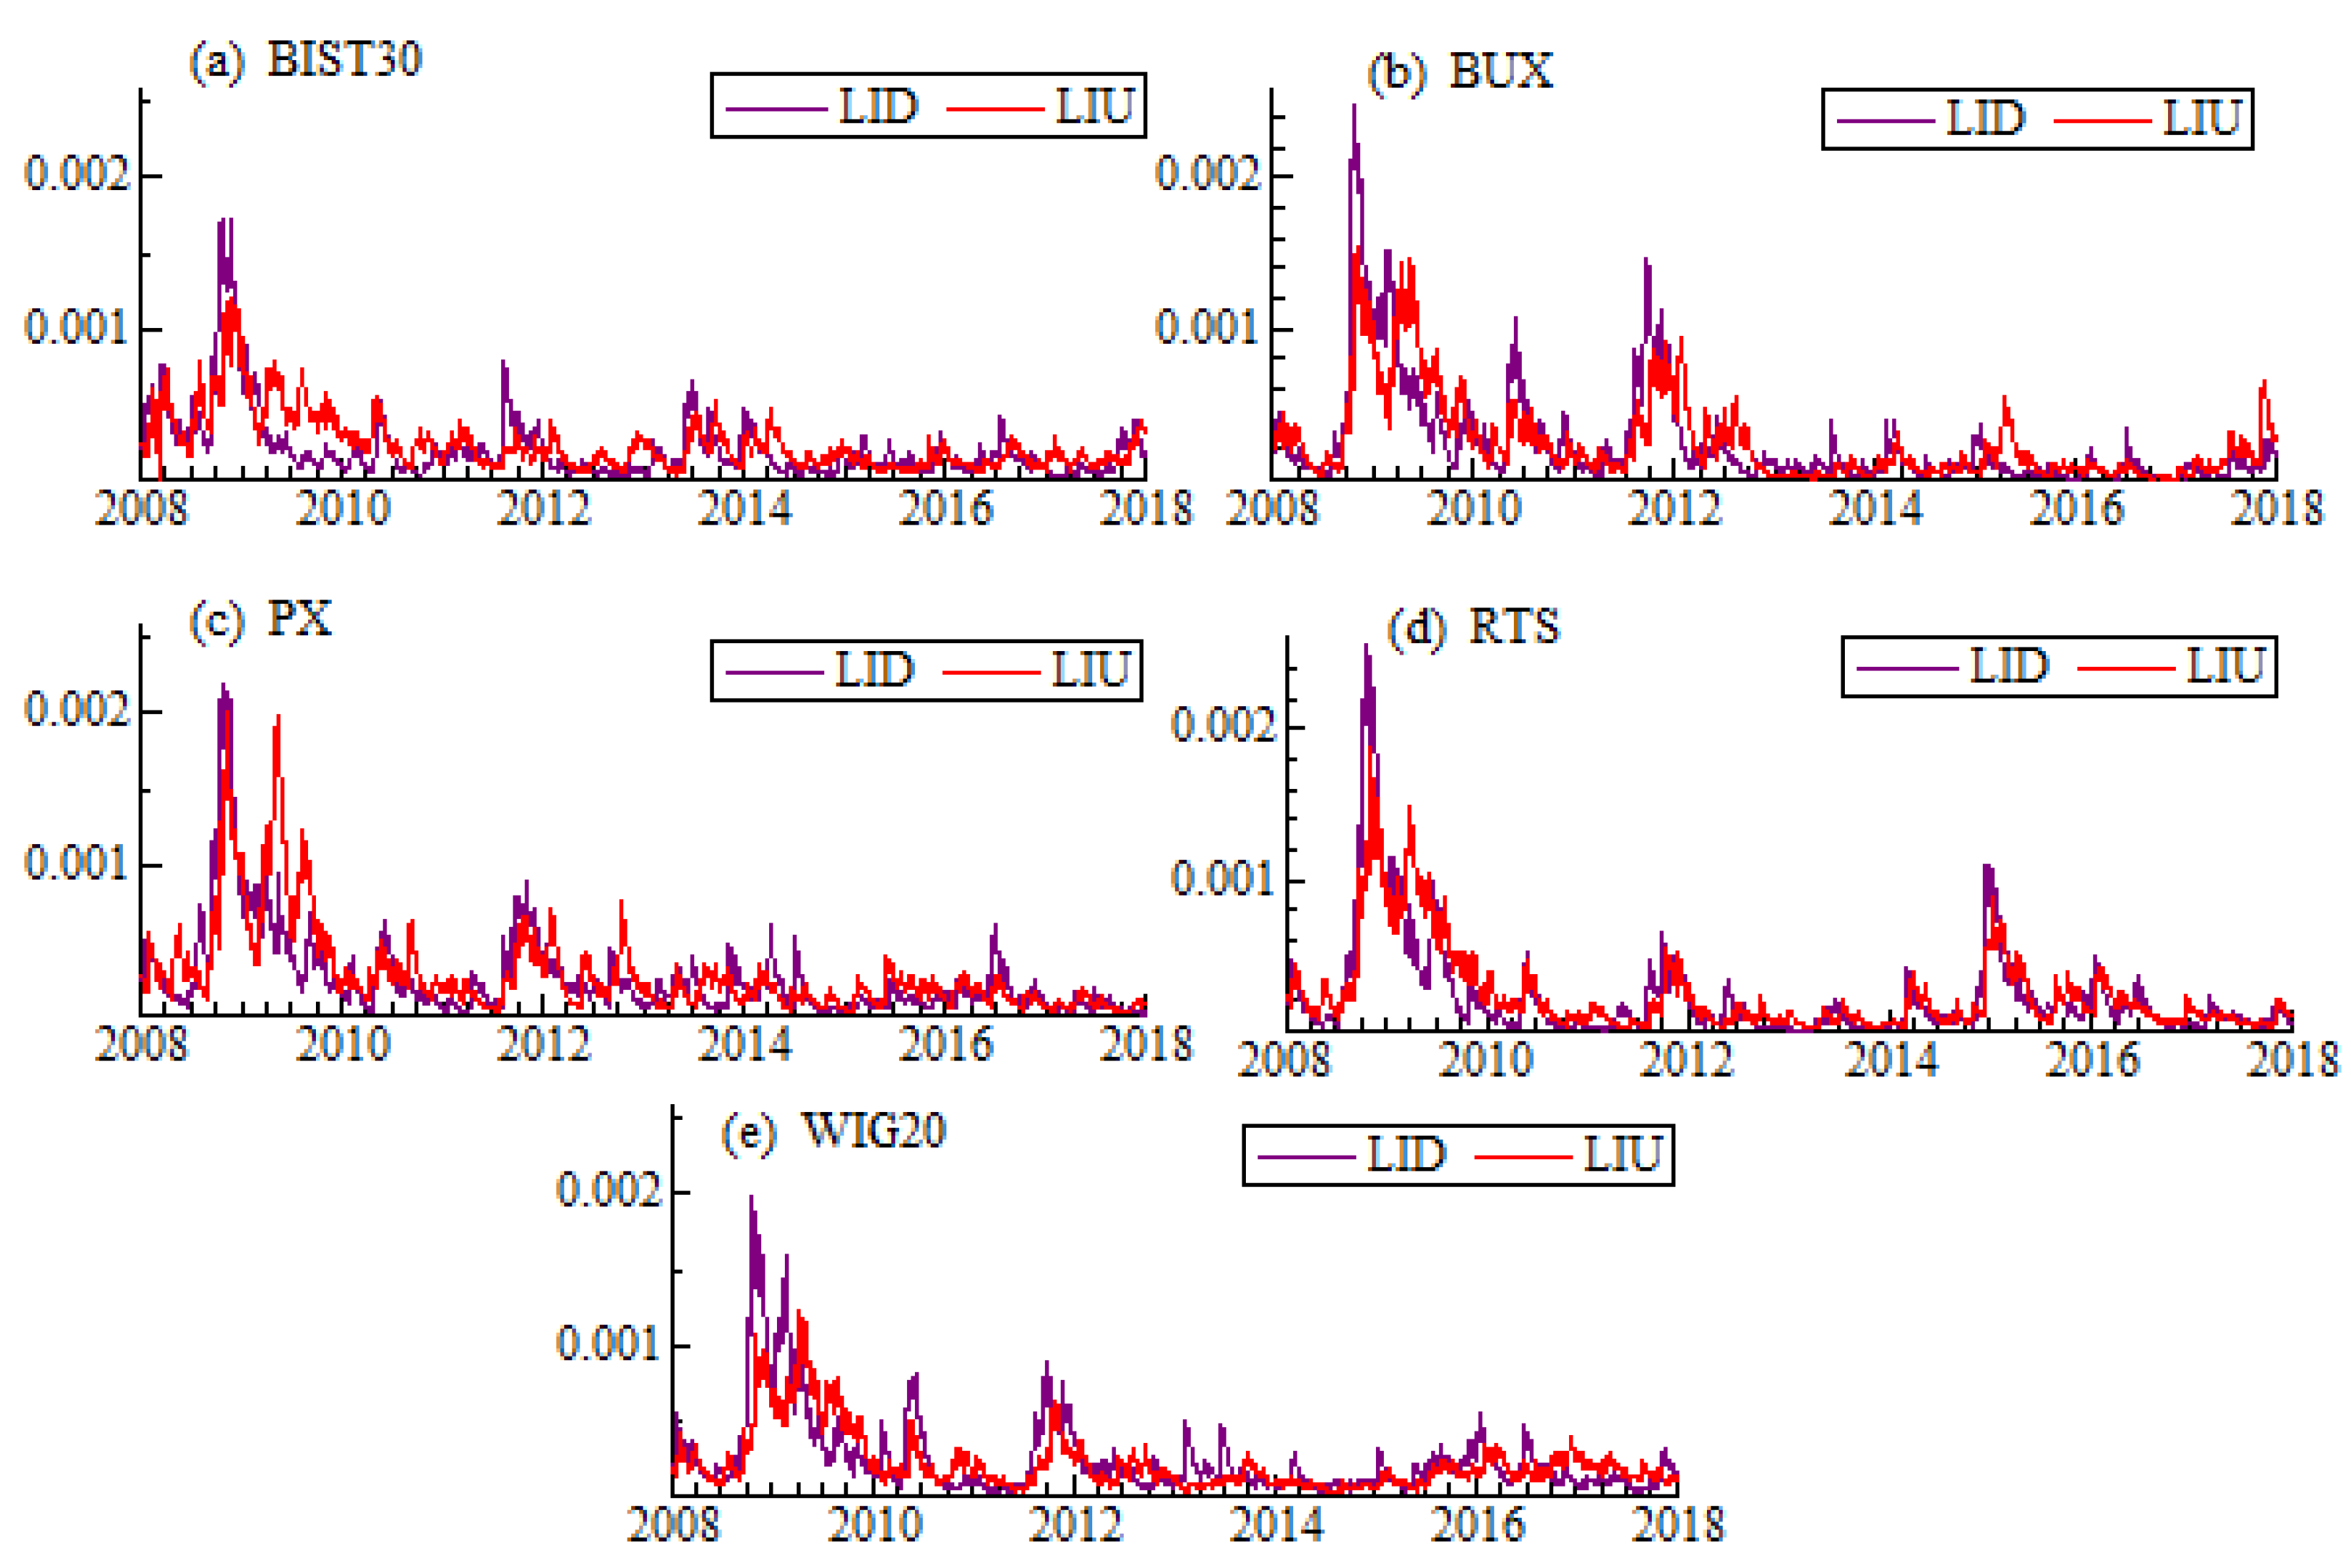
In order to examine commonality in liquidity we first define and calculate liquidity index for each emerging market. In this section we describe our sample, the liquidity proxies and the methodology used for the calculation of liquidity indices.
3.1. Data Source and Sample Preparation
We include the five most important emerging stock markets in Eastern Europe: the Czech Republic, Hungary, Poland, Russia and Turkey. This selection originates in the composition of the MSCI EM Europe Index that captures large and mid-cap representatives across six European emerging markets and as such the selection is similar to other studies [
29,
30]. Although MSCI EM Europe Index includes Greece, we do not consider the Greek stock market in our study as it has joined this index recently.
The data are from Refinitiv (former EIKON Thomson Reuters®) database and include all listed and delisted common stocks that have been the constituents of the main blue chip indices listed in these markets. These are: BIST30 (the Borsa Istanbul), BUX (the Budapest Stock Exchange), PX (former PX50, the Prague Stock Exchange), RTS (the Moscow Exchange) and WIG20 (the Warsaw Stock Exchange). We focus on these particular countries and blue-chip stocks that are listed in these stock markets because the financial intermediaries that operate on the European emerging markets tend to invest: (1) in countries from which the constituents of well-known indices come; and (2) mainly in the most liquid stocks that are listed in these markets.
The sample period starts in January 2008 and ends in December 2017 and thus includes at least two financial turmoils—it allows to evaluate commonality on the financial markets when the market fundamentals change. The calculations are based on the daily (low-frequency) data. We collect four prices, high, low, open and close, as well as volume for each stock in the sample. All prices are expressed in the USD currency to allow for comparisons across the markets. A company is included in the sample within the period if it was a constituent of the index—this issue is determined on the basis of “leavers and joiners” information available in Refinitiv. We control for so-called penny stocks, but as we focus on the most liquid ones which are the constituents of the main indices, they are eliminated systemically. We have also screened the data for suspicious events and outliers [
31].
Our original sample together with the number of stocks included in each of the five indices within the whole period and number of quotations are summarized in
Table 1. Between 2008 and 2017 there have been 53 different stocks which were or still are the constituents of the BIST30 index, 24 stocks from BUX, 18 from PX, 64 from RTS and 37 from WIG20. For the further analysis we need the sample with observations recorded on the same days for all markets. In fact, the working days on different exchanges vary. Removing all these days, for which we did not have the listings for all indices, would have resulted in reducing the size of the sample (see
Table 1). Thus, similarly to what has been done in [
32], we removed only these days, for which at least three out of five markets did not operate. The missing data were added in such a way, that for each stock for which data were missing, the prices were taken the same as in the previous observation, while volume has been set to zero. These data have been used for index calculation. In case of missing data in index, prices were treated as for a single stock, while volumes have been obtained from interpolation based on the previous and the next day.
Finally, in order to assess the commonality of the indices with volatility index, we use daily quotes of CBOE VIX index as a proxy. These data are from
www.cboe.com.
3.2. Liquidity Measures and Index Calculation Methodology
Our choice of liquidity measures are driven by the availability of the data. Although some liquidity measures used in the literature require intra-day data, measures based on low-frequency have been shown to be satisfying [
14,
15]. Further, the choice of our proxies is practically justified: managers rarely use sophisticated models or measures to gauge liquidity [
33]. We are interested in the simple measures that are calculated on the basis of daily data and proxy for liquidity in a single day (in contrast to some measures extensively used in the literature that are averaged within a month [
12,
15]). All liquidity measures and indices are in fact the proxies for “illiquidity”—the higher the values of measures and indices, the more illiquid the market is, and vice versa. The choice of the measures depends on the spectrum of comparison: price-based liquidity measures perform better than volume-based measures at representing cross-country liquidity effects, while on the within-country comparison the volume-based measures are better than price-based [
12]. We consider both within-country and cross-country comparisons, so we employ three liquidity measures based on daily data and that are widely employed in the studies for the developed markets: two bid-ask spread proxies, the high-low spread estimator [
34] and the adjusted quoted close spread [
35], as well as volume-based Amihud illiquidity [
36], which is a price-impact (elasticity) measure.
The idea of high-low spread estimator of [
34] is based on the notice that the high price within a day is related to a buyer-initiated trade, whereas the low price comes from a seller-initiated trade. The range between these two prices, the high and the low, encompasses the volatility of a stock as well as the transaction costs of trades. As shown in [
37], volatility reflects liquidity—in a cross-section the deep markets are usually less volatile than the thin ones. The high-low spread estimator (henceforth CS) is calculated using the following formula
where
,
is the high price in day
t,
is the low price in day
t, and
. As the high-low spread calculation is based on the high and the low prices from two consecutive days and its variance, the ratio estimated within two days will incorporate the variability of the overnight returns. Therefore, following [
34] we adjusted high-low spread estimator for overnight returns.
The second estimate of the bid-ask spread used in the study is the quoted close spread proposed by [
35]. It has been adjusted by replacing the ask and the bid prices with the high and the low prices, respectively. The reason for this adjustment is similar to one presented in [
34]—while the high and the low prices are widely available, bid and ask data are rarely offered. Thus, we calculate this proxy called here high-low range,
HLR, as follows:
As the high price and the low price are buyer and seller initiated prices respectively, the high-low range shows what is the biggest distance between these prices within a day. The denominator facilitates the comparisons between the stocks [
38]. The third liquidity proxies used in the study, Amihud illiquidity [
36], is the ratio of the daily absolute return
, to the logarithm of trading turnover:
This ratio follows the price impact definition of liquidity [
39] and captures how much price moves with a given trading volume. On the basis of these measures obtained for each stock separately, we construct liquidity index for each country. The liquidity index
on a given day
t is defined as follows:
where:
is a liquidity proxy for stock
i at a time
t,
is a weight of an individual stock
i at a time
t, and
n is the number of stocks. The weights are based on the turnover of a given stock
i on day
t, with respect to all remaining components’ turnover, and are daily updated. Thus the liquidity index is a turnover-weighted average of all stocks, which were components of a given market index (BIST30, BUX, PX, RTS, WIG20) on day
t. Because liquidity proxies are not continuous in time and indicate jumps, we propose to smooth a weighted spread proxy in order to reduce the noise. The method which is often applied when volatile data is analyzed, is exponentially weighted moving average, EWMA [
40]. The smoothing constant equal to 0.05 has been chosen within the simulation experiment. On the one hand, such value allows to smooth the series effectively, on the other hand, it does not distort the weighted spread. As a liquidity measure we take into account previously listed proxies: high-low spread estimator (CS), high-low range (HLR), and Amihud illiquidity (ILLIQ).
Various approaches might be used in commonality examination. The most popular one is to measure contemporaneous co-movements by calculating correlation coefficients. Some papers use linear regression approach and check, if the parameters in these “commonality regressions” are statistically significant [
22] or examine the determination coefficients in such regressions [
7,
41]. Alternatively, one may also consider partial correlation analysis as proposed in [
32,
42,
43]. As the liquidity indices display non-linear features, we decided to use the Spearman rank correlations and Kendall’s tau instead of the Pearson correlation coefficient.
All graphs presented in the paper are prepared in OxMetrics7 [
44], whereas the calculations are done in
R.


