Developing a Systematic Diagnostic Model for Integrated Agricultural Supply and Processing Systems

 ,
, 
Abstract
1. Introduction
Adoption Domains and Hypotheses
2. Methods
3. Results and Discussion
3.1. Systematic Diagnostic Model for IASPS
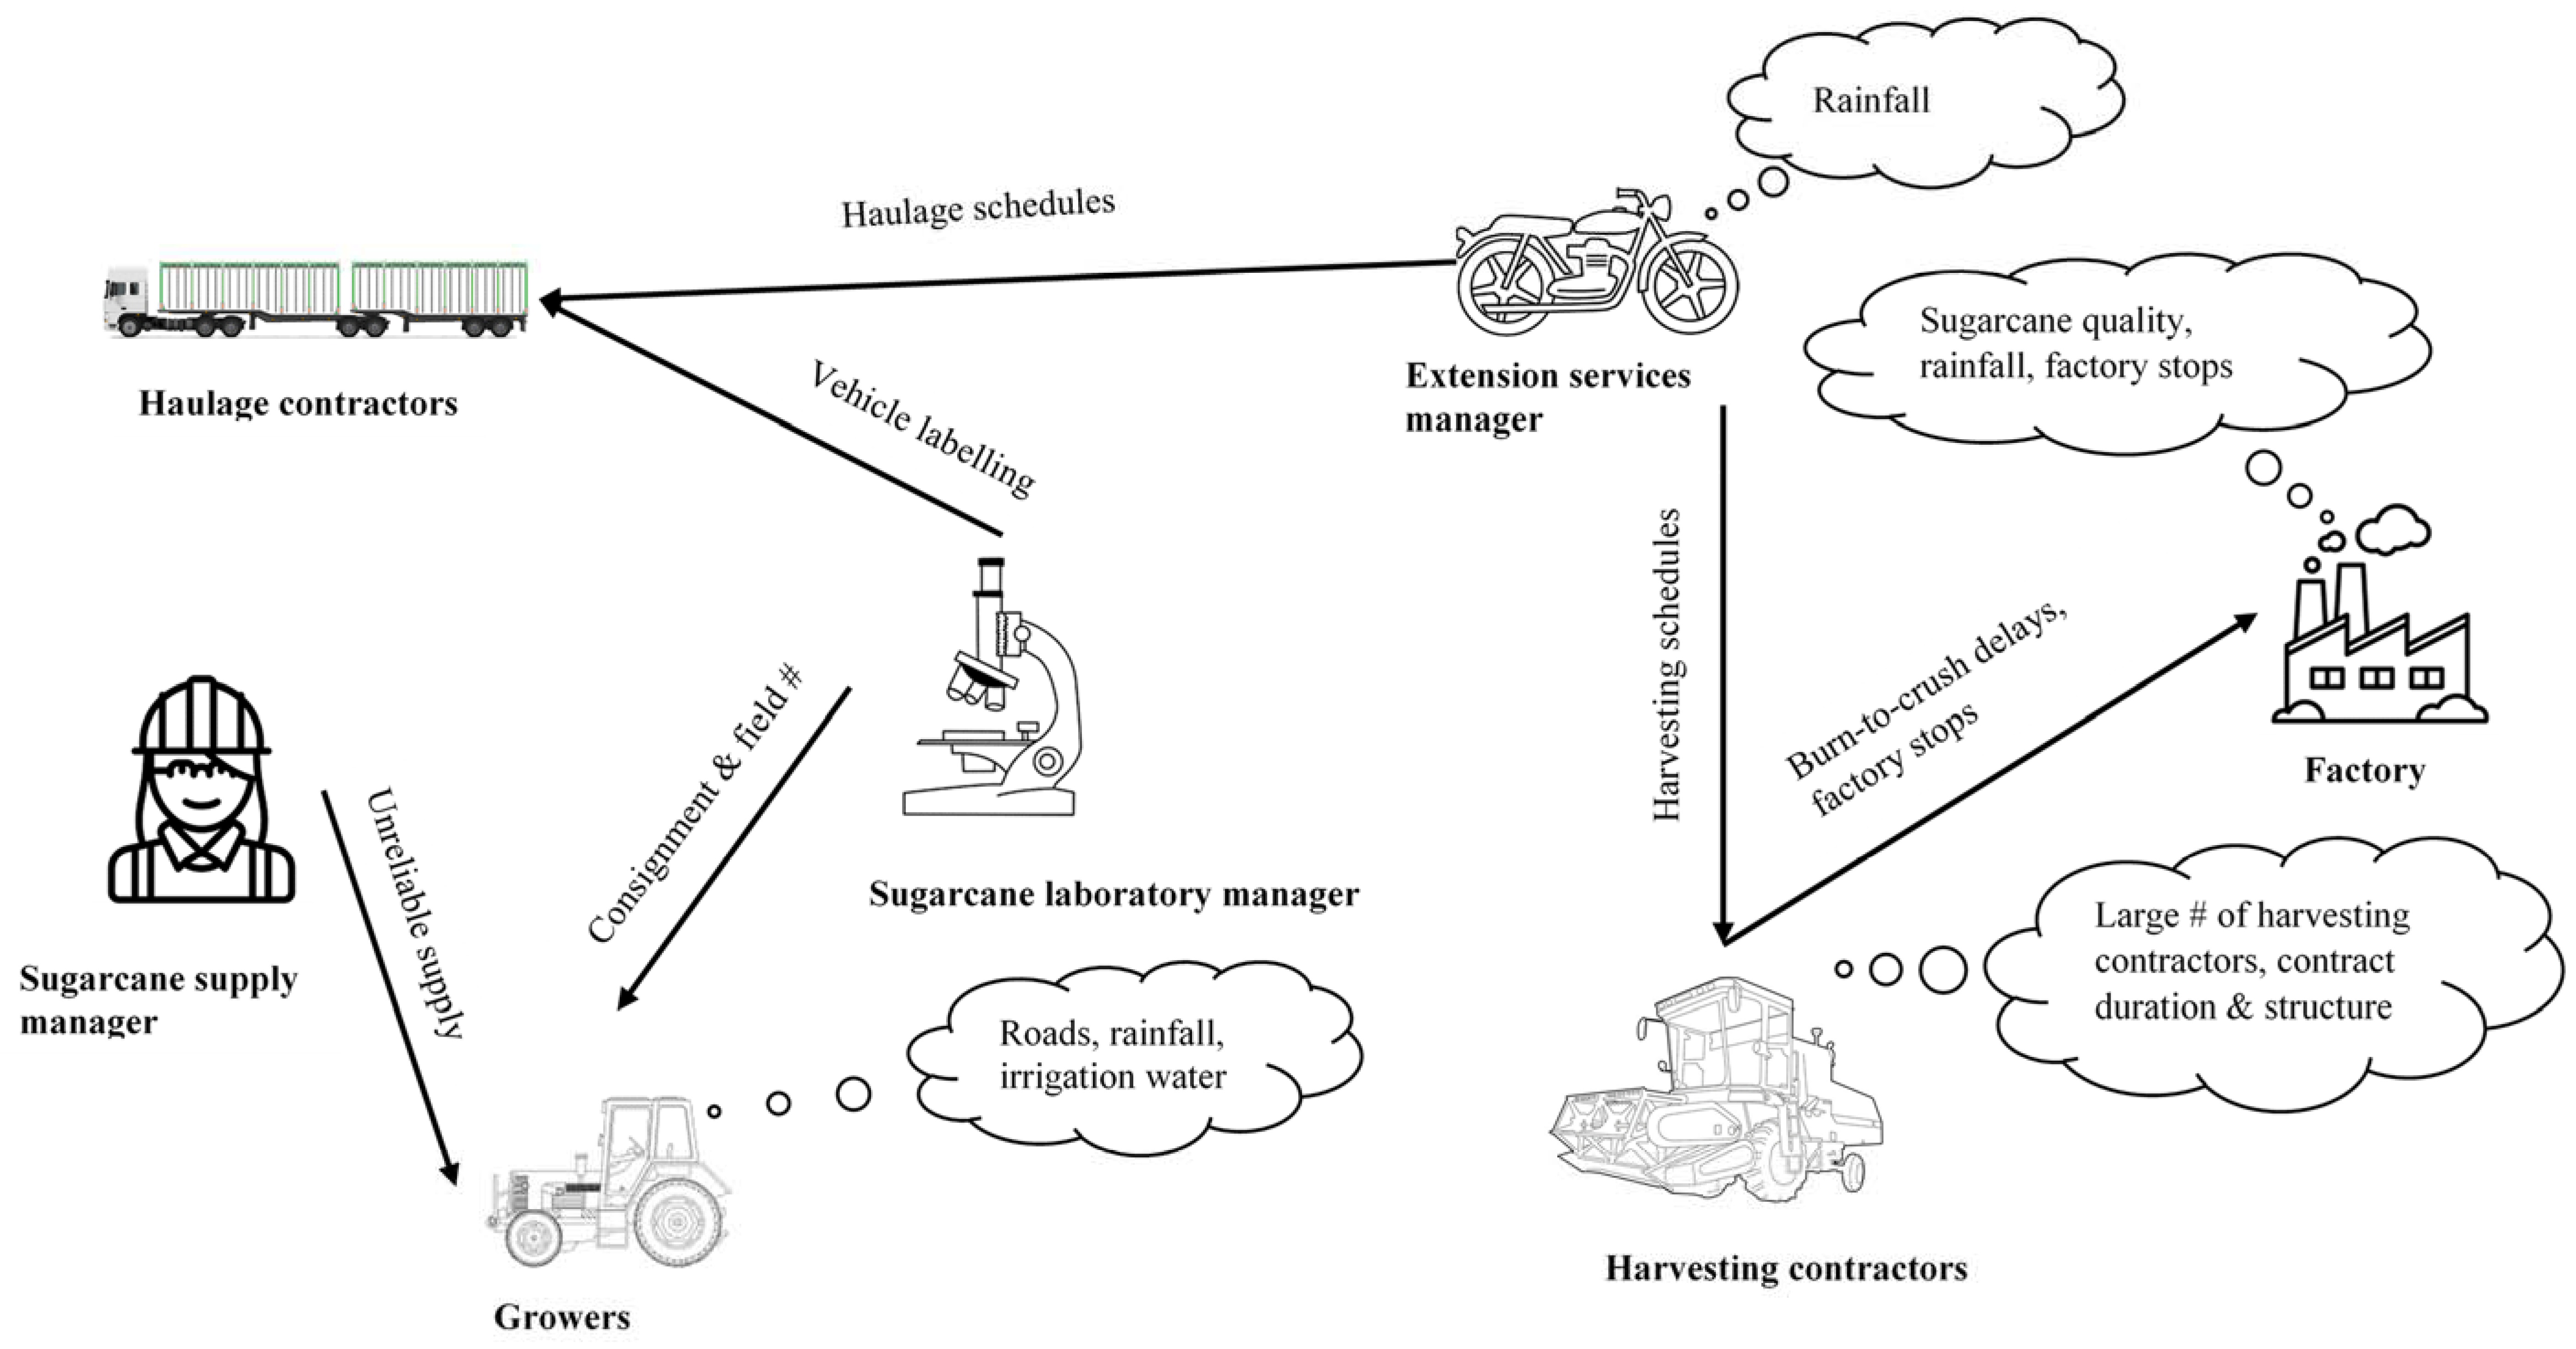
3.2. Case Study
4. Conclusions
Author Contributions
Funding
Acknowledgments
Conflicts of Interest
References
- Prahalad, C.K.; Mashelkar, R.A. Innovation’s Holy Grail. Harv. Bus. Rev. 2010, 88, 132–141. [Google Scholar]
- Ham, Y.N.; Johnston, R.B. A process model of inter-organisational SCM initiatives adoption. In Supply Chain Management: Issues in the New Era of Collaboration and Competition; Wang, W.Y.C., Heng, M.S.H., Chau, P.Y.K., Eds.; Idea Group Publishing: London, UK, 2007; pp. 191–225. [Google Scholar]
- Meyer-Larsen, N.; Hauge, J.B.; Muller, R.; Hamadache, K.; Aifadopoulou, G.; Forcolin, M.; Roso, V.; Tsoukos, G.; Westerheim, H. Accelerating the innovation uptake in logistics. In Innovative Methods in Logistics and Supply Chain Management: Current Issues and Emerging Practices; Blecker, T., Kersten, W., Ringle, C.M., Eds.; Epubli GmbH: Berlin, Germany, 2014; pp. 3–26. [Google Scholar]
- Shongwe, M.I.; Bezuidenhout, C.N. A heuristic for the selection of appropriate diagnostic tools in large-scale sugarcane supply systems. AIMS Agric. Food 2019, 4, 1–26. [Google Scholar]
- Bezuidenhout, C.N.; Kadwa, M.; Sibomana, M.S. Using theme and domain networking approaches to understand complex agriindustrial systems: A demonstration from the South African sugar industry. Outlook Agric. 2013, 42, 9–16. [Google Scholar] [CrossRef]
- Higgins, A.J.; Miller, C.J.; Archer, A.A.; Ton, T.; Fletcher, C.S.; McAllister, R.R.J. Challenges of operations research practice in agricultural value chains. J. Oper. Res. Soc. 2010, 61, 964–973. [Google Scholar] [CrossRef]
- McCown, R.L. Locating agricultural decision support systems in the troubled past and socio-technical complexity of “models for management”. Agric. Syst. 2002, 74, 11–25. [Google Scholar] [CrossRef]
- Rivera-Ferre, M.G.; Ortega-Cerdà, M.; Baumgärtner, J. Rethinking study and management of agricultural systems for policy design. Sustainability 2013. [Google Scholar] [CrossRef]
- Shongwe, M.I. A systems thinking approach to investigating complex sugarcane supply and processing systems: Integrating rich pictures and Bayesian networks. Syst. Pract. Action Res. 2018, 31, 75–85. [Google Scholar] [CrossRef]
- Bezuidenhout, C.N.; Bodhanya, S.; Sanjika, T.; Sibomana, M.; Boote, G.L.N. Network-analysis approaches to deal with causal complexity in a supply network. Int. J. Prod. Res. 2012, 50, 1840–1849. [Google Scholar] [CrossRef]
- Bezuidenhout, C.N.; Baier, T.J.A. An evaluation of the literature on integrated sugarcane production systems: A scientometrical approach. Outlook Agric. 2011, 40, 79–88. [Google Scholar] [CrossRef]
- Rogers, E.M. Diffusion of Innovations; Free Press: New York, NY, USA, 1995; ISBN 0028740742 (CLOTH); 0029266718 (PAPER). [Google Scholar]
- Davis, F. Perceived usefulness, perceived ease of use, and user acceptance of information technology. MIS Q. 1989, 13, 319–340. [Google Scholar] [CrossRef]
- Hsu, P.-F.; Kraemer, K.L.; Dunkle, D. Determinants of E-Business Use in U.S. Firms. Int. J. Electron. Commer. 2006, 10, 9–45. [Google Scholar] [CrossRef]
- Tornatzky, L.; Fleischer, M. The Process of Technology Innovation; Lexington Books: Lexington, KY, USA, 1990. [Google Scholar]
- Ali, J.; Kumar, S. Information and communication technologies (ICTs) and farmers’ decision-making across the agricultural supply chain. Int. J. Inf. Manag. 2011, 31, 149–159. [Google Scholar] [CrossRef]
- So, S.; Sun, H. Supplier integration strategy for lean manufacturing adoption in electronic-enabled supply chains. Supply Chain Manag. Int. J. 2010, 15, 474–487. [Google Scholar] [CrossRef]
- Lee, S.G.; Trimi, S.; Kim, C. The impact of cultural differences on technology adoption. J. World Bus. 2013, 48, 20–29. [Google Scholar] [CrossRef]
- Lin, H.F. Understanding the determinants of electronic supply chain management system adoption: Using the technology–organization–environment framework. Technol. Forecast. Soc. Chang. 2014, 86, 80–92. [Google Scholar] [CrossRef]
- Zsidisin, G.A.; Melnyk, S.A.; Ragatz, G.L. An institutional theory perspective of business continuity planning for purchasing and supply management. Int. J. Prod. Res. 2005, 43, 3401–3420. [Google Scholar] [CrossRef]
- Suddaby, R.; Seidl, D.; Le, J.K. Strategy-as-practice meets neo-institutional theory. Strateg. Organ. 2013, 11, 329–344. [Google Scholar] [CrossRef]
- Johnston, R.B.; Gregor, S. A structuration-like theory of industry-level activity for understanding the adoption of interorganizational systems. Eur. J. Inf. Syst. 2000, 9, 243–251. [Google Scholar] [CrossRef]
- Patterson, K.A.; Grimm, C.M.; Corsi, T.M. Adopting new technologies for supply chain management. Transp. Res. 2003, E39, 95–121. [Google Scholar] [CrossRef]
- Seymour, L.F.; Lambert-Porter, E.; Willuweit, L. An RFID adoption framework: A container supply chain analysis. In Advances in Information Systems Research, Education and Practice; Avison, D., Kasper, G.M., Pernici, B., Ramos, I., Roode, D., Eds.; Springer: New York, NY, USA, 2008; pp. 175–188. [Google Scholar]
- Schut, M.; van Paassen, A.; Leeuwis, C.; Klerkx, L. Towards dynamic research configurations: A framework for reflection on the contribution of research to policy and innovation processes. Sci. Public Policy 2014, 41, 207–218. [Google Scholar] [CrossRef]
- Bezuidenhout, C.N.; Bodhanya, S. Identifying Opportunities in South African Sugarcane Supply Chain Systems: A Synopsis, Limitations, and Recommendations; University of KwaZulu-Natal: Durban, South Africa, 2010. [Google Scholar]
- Zhang, C.; Dhaliwal, J. An investigation of resource-based and institutional theoretic factors in technology adoption for operations and supply chain management. Int. J. Prod. Econ. 2009, 120, 252–269. [Google Scholar] [CrossRef]
- Kurnia, S.; Johnston, R.B. The need for a processual view of inter-organizational systems adoption. J. Strateg. Inf. Syst. 2000, 9, 295–319. [Google Scholar] [CrossRef]
- Lyytinen, K.; Damsgaard, J. Inter-organizational information systems adoption—A configuration analysis approach. Eur. J. Inf. Syst. 2011. [Google Scholar] [CrossRef]
- Defee, C.C.; Stank, T.P. Applying the strategy-structure-performance paradigm to the supply chain environment. Int. J. Logist. Manag. 2005, 16, 28–50. [Google Scholar] [CrossRef]
- Abosag, I. The Commitment-Trust Theory: The British and Saudi Arabian Cross-National Perspectives; University of Nottingham: Nottingham, UK, 2006. [Google Scholar]
- Kang, I.; Lee, S.; Choi, J. Using fuzzy cognitive map for the relationship management in airline service. Expert Syst. Appl. 2004, 26, 545–555. [Google Scholar] [CrossRef]
- Koc Baban, P. Exploring the Effects of Supply Chain Structure on Supply Chain Integration in the Manufacturing Industry; University of Exeter: Exeter, UK, 2013. [Google Scholar]
- Stevens, G.C.; Johnson, M. Integrating the Supply Chain … 25 years on. Int. J. Phys. Distrib. Logist. Manag. 2016. [Google Scholar] [CrossRef]
- Zhang, Q.Y. Technology Infusion Enabled Value-Chain Flexibility: A Learning and Capability-Based Perspective; University of Toledo: Toledo, OH, USA, 2001. [Google Scholar]
- Scott, W.R.; Davis, G.F. Organizations and Organizing: Rational, Natural, and Open System Perspectives; Routledge: Abingdon-on-Thames, UK, 2015; ISBN 9780131958937. [Google Scholar]
- Kaasgari, M.A.; Imani, D.M.; Mahmoodjanloo, M. Optimizing a vendor managed inventory (VMI) supply chain for perishable products by considering discount: Two calibrated meta-heuristic algorithms. Comput. Ind. Eng. 2017, 103, 227–241. [Google Scholar] [CrossRef]
- Bezuidenhout, C. Review of sugarcane material handling from an integrated supply chain perspective. Proc. S. Afr. Sugar Technol. Assoc. 2010, 83, 63–66. [Google Scholar]
- De Carvalho Borella, M.R.; Barcellos, P.F.P.; Sachdev, H.; Merz, G.R.; Galelli, A. Organizational structure, service capability and its impact on business performance of logistics providers in the B2B context. Gest. Prod. 2017. [Google Scholar] [CrossRef]
- Jüttner, U.; Christopher, M. The role of marketing in creating a supply chain orientation within the firm. Int. J. Logist. Res. Appl. 2013. [Google Scholar] [CrossRef]
- Effendi, M.I.; Arifin, M.M. The relationships between environment, strategy, organizational structure, and business performance. Glob. J. Manag. Bus. Res. 2010, 10, 2–8. [Google Scholar]
- Tse, Y.K.; Zhang, M.; Akhtar, P.; MacBryde, J. Embracing supply chain agility: An investigation in the electronics industry. Supply Chain Manag. Int. J. 2016, 21, 140–156. [Google Scholar] [CrossRef]
- Far, S.M.; Akbari, M.; Clarke, S. The effect of it integration on supply chain agility towards market performance. Int. J. Emerg. Transdiscipl. 2017, 20, 99–117. [Google Scholar]
- Ngai, E.W.T.; Chau, D.C.K.; Chan, T.L.A. Information technology, operational, and management competencies for supply chain agility: Findings from case studies. J. Strateg. Inf. Syst. 2011, 20, 232–249. [Google Scholar] [CrossRef]
- Cagliano, R.; Caniato, F.; Spina, G. The linkage between supply chain integration and manufacturing improvement programmes. Int. J. Oper. Prod. Manag. 2006, 26, 282–299. [Google Scholar] [CrossRef]
- Merschmann, U.; Thonemann, U.W. Supply chain flexibility, uncertainty and firm performance: An empirical analysis of German manufacturing firms. Int. J. Prod. Econ. 2011, 130, 43–53. [Google Scholar] [CrossRef]
- Decheng, F.; Yu, H. Environmental uncertainty on supply chain growth mechanism of action research-based on the supply chain information system alignment and supply chain integration. J. Appl. Sci. 2013, 13, 1838–1842. [Google Scholar]
- Boon-itt, S.; Wong, C. The moderating effects of technological and demand uncertainties on the relationship between supply chain integration and customer delivery performance. Int. J. Phys. Distrib. Logist. Manag. 2011, 41, 253–276. [Google Scholar] [CrossRef]
- Salvato, C.; Vassolo, R. The sources of dynamism in dynamic capabilities. Strateg. Manag. J. 2018. [Google Scholar] [CrossRef]
- Wu, G.C. The influence of green supply chain integration and environmental uncertainty on green innovation in Taiwan’s IT industry. Supply Chain Manag. Int. J. 2013, 18, 539–552. [Google Scholar] [CrossRef]
- Chi, T.; Kilduff, P.P.D.D.; Gargeya, V.B. Alignment between business environment characteristics, competitive priorities, supply chain structures, and firm business performance. Int. J. Product. Perform. Manag. 2009, 58, 645–669. [Google Scholar] [CrossRef]
- Sebastiao, H.J.; Golicic, S. Supply chain strategy for nascent firms in emerging technology markets. J. Bus. Logist. 2008, 29, 75–91. [Google Scholar] [CrossRef]
- Ambe, I. Determining an optimal supply chain strategy. J. Transp. Supply Chain Manag. 2012, 6, 126–147. [Google Scholar] [CrossRef]
- Gligor, D.M.; Esmark, C.L.; Holcomb, M.C. Performance outcomes of supply chain agility: When should you be agile? J. Oper. Manag. 2015, 33–34, 71–82. [Google Scholar] [CrossRef]
- Um, J. The impact of supply chain agility on business performance in a high level customization environment. Oper. Manag. Res. 2017. [Google Scholar] [CrossRef]
- Lotfi, Z.; Mukhtar, M.; Sahran, S.; Zadeh, A.T. Information Sharing in Supply Chain Management. Procedia Technol. 2013, 11, 298–304. [Google Scholar] [CrossRef]
- Chopra, S. Supply Chain Management: Strategy, Planning, and Operation; Pearson Education: Boston, MA, USA, 2018. [Google Scholar]
- Khurana, M.; Mishra, P.; Singh, A. Barriers to information sharing in supply chain of manufacturing industries. Int. J. Manuf. Syst. 2011, 1, 9–29. [Google Scholar] [CrossRef]
- Kumar, G.; Banerjee, R.N.; Meena, P.L.; Ganguly, K.K. Joint planning and problem solving roles in supply chain collaboration. IIMB Manag. Rev. 2017. [Google Scholar] [CrossRef]
- Naspetti, S.; Lampkin, N.; Nicolas, P.; Stolze, M.; Zanoli, R. Organic supply chain collaboration: A case study in eight EU countries. J. Food Prod. Mark. 2011. [Google Scholar] [CrossRef]
- Weaver, B. Coordination, Cooperation, and Collaboration: Defining the C3 Framework. Available online: http://digitalcommons.bryant.edu/honors_management/13 (accessed on 15 January 2015).
- Sahin, F.; Robinson, E.P. Information sharing and coordination in make-to-order supply chains. J. Oper. Manag. 2005, 23, 579–598. [Google Scholar] [CrossRef]
- Mansoori, S.; Jamshidinavid, B.; Hashemi, S.R. The impact of supply chain integration on supply chain performance: A case study of the National Company of Oil Products Distribution of Kermanshah Province. J. Appl. Environ. Biol. Sci. 2014, 4, 229–237. [Google Scholar]
- Abdulkadiroǧlu, A.; Bagwell, K. Trust, reciprocity, and favors in cooperative relationships. Am. Econ. J. Microecon. 2013. [Google Scholar] [CrossRef]
- Soosay, C.A.; Hyland, P. A decade of supply chain collaboration and directions for future research. Supply Chain Manag. Int. J. 2015. [Google Scholar] [CrossRef]
- Hardman, P.; Darroch, M.; Ortmann, G. Improving cooperation to make the South African fresh apple export value chain more competitive. J. Chain Netw. Sci. 2002, 2, 61–72. [Google Scholar] [CrossRef]
- Masuku, M.B.; Kirsten, J.F. The role of trust in the performance of supply chains: A dyad analysis of smallholder farmers and processing firms in the sugar industry in Swaziland. Agrekon 2004, 43, 147–161. [Google Scholar] [CrossRef]
- Zand, D.E. Trust and Managerial Problem Solving. Adm. Sci. Q. 1972, 17, 229–239. [Google Scholar] [CrossRef]
- Nyaga, G.N.; Whipple, J.M.; Lynch, D.F. Examining supply chain relationships: Do buyer and supplier perspectives on collaborative relationships differ? J. Oper. Manag. 2010, 28, 101–114. [Google Scholar] [CrossRef]
- Kim, S.; Lee, H. The impact of organizational context and information technology on employee knowledge-sharing capabilities. Public Adm. Rev. 2006, 66, 370–385. [Google Scholar] [CrossRef]
- Kaipia, R.; Holmström, J.; Småros, J.; Rajala, R. Information sharing for sales and operations planning: Contextualized solutions and mechanisms. J. Oper. Manag. 2017. [Google Scholar] [CrossRef]
- Iakovou, E.; Vlachos, D.; Xanthopoulos, A. A stochastic inventory management model for a dual sourcing supply chain with disruptions. Int. J. Syst. Sci. 2010. [Google Scholar] [CrossRef]
- Shah, R.; Shin, H. Relationships among information technology, inventory, and profitability: An investigation of level invariance using sector level data. J. Oper. Manag. 2007, 25, 768–784. [Google Scholar] [CrossRef]
- Agus, A.; Shukri Hajinoor, M. Lean production supply chain management as driver towards enhancing product quality and business performance: Case study of manufacturing companies in Malaysia. Int. J. Qual. Reliab. Manag. 2012, 29, 92–121. [Google Scholar] [CrossRef]
- Lwiki, T.; Ojera, P.; Mugend, N.; Wachira, V. The impact of inventory management practices on financial performance of sugar manufacturing firms in Kenya. Int. J. Bus. Humanit. Technol. 2013, 3, 75–85. [Google Scholar]
- Cao, M.; Zhang, Q. Supply chain collaboration: Impact on collaborative advantage and firm performance. J. Oper. Manag. 2011, 29, 163–180. [Google Scholar] [CrossRef]
- Duffy, R.; Fearne, A. The impact of supply chain partnerships on supplier performance. Int. J. Logist. Manag. 2004, 15, 57–72. [Google Scholar] [CrossRef]
- Flynn, B.B.; Huo, B.; Zhao, X. The impact of supply chain integration on performance: A contingency and configuration approach. J. Oper. Manag. 2010. [Google Scholar] [CrossRef]
- Jiang, X.; Li, M.; Gao, S.; Bao, Y.; Jiang, F. Managing knowledge leakage in strategic alliances: The effects of trust and formal contracts. Ind. Mark. Manag. 2013. [Google Scholar] [CrossRef]
- Dyer, J.; Chu, W. The Role of Trustworthiness in Reducing Transaction Costs and Improving Performance: Empirical Evidence from the United States, Japan, and Korea. Organ. Sci. 2003, 14, 57–68. [Google Scholar] [CrossRef]
- Zaheer, A.; McEvily, B.; Perrone, V. Does Trust Matter? Exploring the Effects of Interorganizational and Interpersonal Trust on Performance. Organ. Sci. 1998, 9, 141–159. [Google Scholar] [CrossRef]
- Um, K.H.; Kim, S.M. The effects of supply chain collaboration on performance and transaction cost advantage: The moderation and nonlinear effects of governance mechanisms. Int. J. Prod. Econ. 2018, in press. [Google Scholar] [CrossRef]
- Simatupang, T.M.; Sridharan, R. Design for supply chain collaboration. Bus. Process Manag. J. 2008, 14, 401–418. [Google Scholar] [CrossRef]
- Pol, M.G.; Inamdar, K.H. Framework to implementation for vendor managed inventory. Int. J. Eng. Res. Dev. 2012, 2, 46–50. [Google Scholar]
- Sandberg, E. Logistics collaboration in supply chains: Practice vs. theory. Int. J. Logist. Manag. 2007, 18, 274–293. [Google Scholar] [CrossRef]
- Irungu, B.K.; Wanjau, K. Effectiveness of vendor managed inventory systems in retail supermarkets in Kenya. Int. J. Bus. Public Manag. 2011, 1, 85–89. [Google Scholar]
- Sartorius, K.; Kirsten, J.; Masuku, M. A new institutional economic analysis of small farmer contracts and relations in the sugar supply chains in South Africa and Swaziland. In Proceedings of the IAMA Annual Conference, Cancun, Mexico, 21–24 June 2003; pp. 1–13. [Google Scholar]
- Saenz, M.J.; Revilla, E.; Knoppen, D. Absorptive Capacity in Buyer–supplier Relationships: Empirical Evidence of Its Mediating Role. J. Supply Chain Manag. 2012, 50, 18–40. [Google Scholar] [CrossRef]
- Schein, E.H. Organizational Culture and Leadership; John Wiley & Sons: San Francisco, CA, USA, 2010; ISBN 0787968455. [Google Scholar]
- Zhang, Z.; Wan, D.; Jia, M.; Gu, L. Prior ties, shared values and cooperation in public-private partnerships. Manag. Organ. Rev. 2009. [Google Scholar] [CrossRef]
- Morgan, R.M.; Hunt, S.D. The Commitment-Trust Theory of Relationship Marketing. J. Mark. 1994, 58, 20–38. [Google Scholar] [CrossRef]
- Bouachouch, M.; Mamad, M. Analysis of the antecedents of inter-functional coordination in the supply chain context: Case of the medicament flows in a Moroccan university hospital. Int. J. Bus. Manag. 2014, 9, 97–107. [Google Scholar] [CrossRef]
- Urbancova, H. Results of analysis of organisational culture in organisations in the Czech Republic and Slovak Republic. Acta Univ. Agric. Silvic. Mendelianae Brun. 2012, 60, 433–440. [Google Scholar] [CrossRef]
- Latif, A. Individual Political Behavior in Organizational Relationship. J. Polit. Law 2011, 4, 199. [Google Scholar]
- Checkland, P.; Poulter, J. Learning for Action: A Short Definitive Account of Soft Systems Methodology, and Its Use Practitioners, Teachers and Students; Wiley & Sons: Chichester, UK, 2006; ISBN 0470025549. [Google Scholar]
- Maloni, M.J.; Benton, W.C. Power influences in the supply chain. J. Bus. Logist. 2000, 21, 42–73. [Google Scholar]
- Zhang, M.; Huo, B. The impact of dependence and trust on supply chain integration. Int. J. Phys. Distrib. Logist. Manag. 2013. [Google Scholar] [CrossRef]
- Turkkantos, S. The effect of use of power in buyer-seller relationships: An investigation on the firm size dependency. Int. J. Bus. Adm. 2014, 5, 86–95. [Google Scholar] [CrossRef]
- Belaya, V.; Hanf, J.H. Managing Russian agri-food supply chain networks with power. J. Chain Netw. Sci. 2012, 12, 215–230. [Google Scholar] [CrossRef]
- Leonidou, L.C.; Talias, M.A.; Leonidou, C.N. Exercised power as a driver of trust and commitment in cross-border industrial buyer-seller relationships. Ind. Mark. Manag. 2008, 37, 92–103. [Google Scholar] [CrossRef]
- Cheng, J.H.; Yeh, C.H.; Tu, C.W. Trust and knowledge sharing in green supply chains. Supply Chain Manag. 2008, 13, 283–295. [Google Scholar] [CrossRef]
- Schmidt, F.L.; Hunter, J. Methods of Meta-Analysis: Correcting Error and Bias in Research Findings; Sage: Thousand Oaks, CA, USA, 2014. [Google Scholar]
- Borenstein, M.; Hedges, L.; Higgins, P.T.; Rothstein, H.R. Introduction to Meta Analysis; John Wiley & Sons: Chichester, UK, 2009; ISBN 9780470057247. [Google Scholar]
- Le, H.; Oh, I.S.; Schmidt, F.L.; Wooldridge, C.D. Correction for Range Restriction in Meta-Analysis Revisited: Improvements and Implications for Organizational Research. Pers. Psychol. 2016. [Google Scholar] [CrossRef]
- Kock, A. A Guideline to Meta-Analysis. Tim Work. Pap. Ser. 2009, 2, 1–39. [Google Scholar]
- Geyskens, I.; Krishnan, R.; Steenkamp, J.-B.E.M.; Cunha, P.V. A Review and Evaluation of Meta-Analysis Practices in Management Research. J. Manag. 2009. [Google Scholar] [CrossRef]
- Anney, V.N. Ensuring the quality of the findings of qualitative research: Looking at trustworthiness criteria. J. Emerg. Trends Educ. Res. Policy Stud. 2014. [Google Scholar] [CrossRef]
- Treharne, G.J.; Riggs, D.W. Ensuring quality in qualitative research. In Qualitative Research in Clinical and Health Psychology; Palgrave Macmillan: Hampshire, UK, 2014; pp. 57–73. [Google Scholar]
- Morse, J.M.; Stern, P.N.; Corbin, J.; Bowers, B.; Charmaz, K.; Clarke, A.E. Developing Grounded Theory: The Second Generation; Routledge: London, UK, 2016; ISBN 978-1-59874-193-3. [Google Scholar]
- Charmaz, K. Constructing grounded theory: A practical guide through qualitative analysis. In Handbook of Constructionist Research; Holstein, J.A., Gubrium, J.F., Eds.; Guilford Press: New York, NY, USA, 2008; pp. 397–412. [Google Scholar]
- Cohen, J. A power primer. Psychol. Bull. 1992, 112, 155–159. [Google Scholar] [CrossRef] [PubMed]
- Baguley, T. Standardized or simple effect size: What should be reported? Br. J. Psychol. 2009, 100, 603–617. [Google Scholar] [CrossRef] [PubMed]
- Teimouri, H.; Izadpanah, N.; Akbariani, S.; Jenab, K.; Khoury, S.; Moslehpour, S. The effect of managerial power on employees’ affective commitment: Case study. J. Manag. 2015, 3, 21–30. [Google Scholar] [CrossRef]
- Jain, M.; Khalil, S.; Johnston, W.J.; Cheng, J.M.S. The performance implications of power-trust relationship: The moderating role of commitment in the supplier-retailer relationship. Ind. Mark. Manag. 2014, 43, 312–321. [Google Scholar] [CrossRef]
- Kalyar, M.N.; Naveed, T.; Anwar, M.S.; Iftikhar, K. Supply chain information integration: Exploring the role of institutional forces and trust. J. Bus. Adm. Educ. 2013, 3, 1–24. [Google Scholar]
- Fawcett, S.E.; Magnan, G.M.; McCarter, M.W. Benefits, barriers, and bridges to effective supply chain management. Supply Chain Manag. Int. J. 2008, 13, 35–48. [Google Scholar] [CrossRef]
- Nguyen, N.C.; Bosch, O. A systems thinking approach to identify leverage points for sustainability: A case study in the Cat Ba Biosphere Reserve, Vietnam. Syst. Res. Behav. Sci. 2013, 30, 104–115. [Google Scholar] [CrossRef]
- Ahmed, I.; Sutton, A.J.; Riley, R.D. Assessment of publication bias, selection bias, and unavailable data in meta-analyses using individual participant data: A database survey. BMJ 2012, 344, 1–10. [Google Scholar] [CrossRef]
- Mhlanga-Ndlovu, B.S.F.N.; Nhamo, G. An assessment of Swaziland sugarcane farmer associations’ vulnerability to climate change. J. Integr. Environ. Sci. 2017, 14, 39–57. [Google Scholar] [CrossRef]
- Reddy, Y.S.; Madhuri, K.N. Impact of delayed crush on post-harvest deterioration of promising early maturing sugarcane clones. Bioscan 2014, 9, 519–523. [Google Scholar]
- Ozkan-Tektas, O. The effects of opportunism and trust on buyer-supplier relationship: Do commitment types matter? Int. J. Bus. Soc. Res. 2014, 4, 14–26. [Google Scholar]
- Gerwel-Proches, C.N.; Bodhanya, S. An Application of Soft Systems Methodology in the Sugar Industry. Int. J. Qual. Methods 2015, 14, 1–15. [Google Scholar] [CrossRef]
- Simelane, G. Independent cane. Swazi Observer, 21 November 2016; 4. [Google Scholar]
- Hildbrand, S. Systemic Approaches to Improvement in Sugarcane Production and Supply: Umfolozi & Felixton Mill Areas; University of KwaZulu-Natal: KwaZulu-Natal, South Africa, 2013. [Google Scholar]
- Gomez, J.; Chapple, D.; McDonald, L. Sugar losses in burnt and green harvesting in Argentina. In Proceedings of the 28th Australian Society of Sugar Cane Technologists, Mackay, Australia, 2–5 May 2006; pp. 291–297. [Google Scholar]
- Walford, S.N.; Nel, S. Are Mannitol and Lactic Acid Indicators of Sugarcane Deterioration in a South African Context? Int. Sugar J. 2010, 112, 693–699. [Google Scholar]
- Swaziland Sugar Association Cane Testing. Available online: http://www.ssa.co.sz/cane-testing/?hilite=%22pol%22%2C%22%25%22 (accessed on 20 August 2017).
- Sibomana, M.S.; Sobratee, N.; Workneh, T.S.; Bezuidenhout, C.N. Post-harvest changes in sugarcane during harvest-to-crush delays in the Kwazulu-Natal Midlands. Int. Sugar J. 2016, 118, 442–449. [Google Scholar]
- Moor, B.S.C. Review of cane shredding. Proc. S. Afr. Sugar Technol. 1994, 68, 162–165. [Google Scholar]


| Researchers | Adoption Factors | |||||||||
|---|---|---|---|---|---|---|---|---|---|---|
| Physical | Collaboration | Culture | Economics | Environment | Strategy | Information Sharing | Power | Structures | History | |
| Chatterjee et al. [22] | √ | √ | √ | |||||||
| Hsu et al. [14] | √ | √ | √ | |||||||
| Seymour et al. [23] | √ | √ | √ | √ | √ | √ | √ | |||
| Chong et al. [24] | √ | √ | √ | |||||||
| Ranganathan and Jha [25] | √ | √ | √ | |||||||
| Pang and Bunker [26] | √ | √ | √ | |||||||
| Johnston and Gregor [27] | √ | √ | √ | √ | √ | √ | ||||
| Patterson et al. [28] | √ | √ | √ | √ | √ | |||||
| Matopoulos et al. [29] | √ | √ | √ | √ | ||||||
| Bezuidenhout et al. [5] | √ | √ | √ | √ | √ | √ | √ | √ | √ | √ |
| Schut et al. [30] | √ | √ | √ | √ | √ | |||||
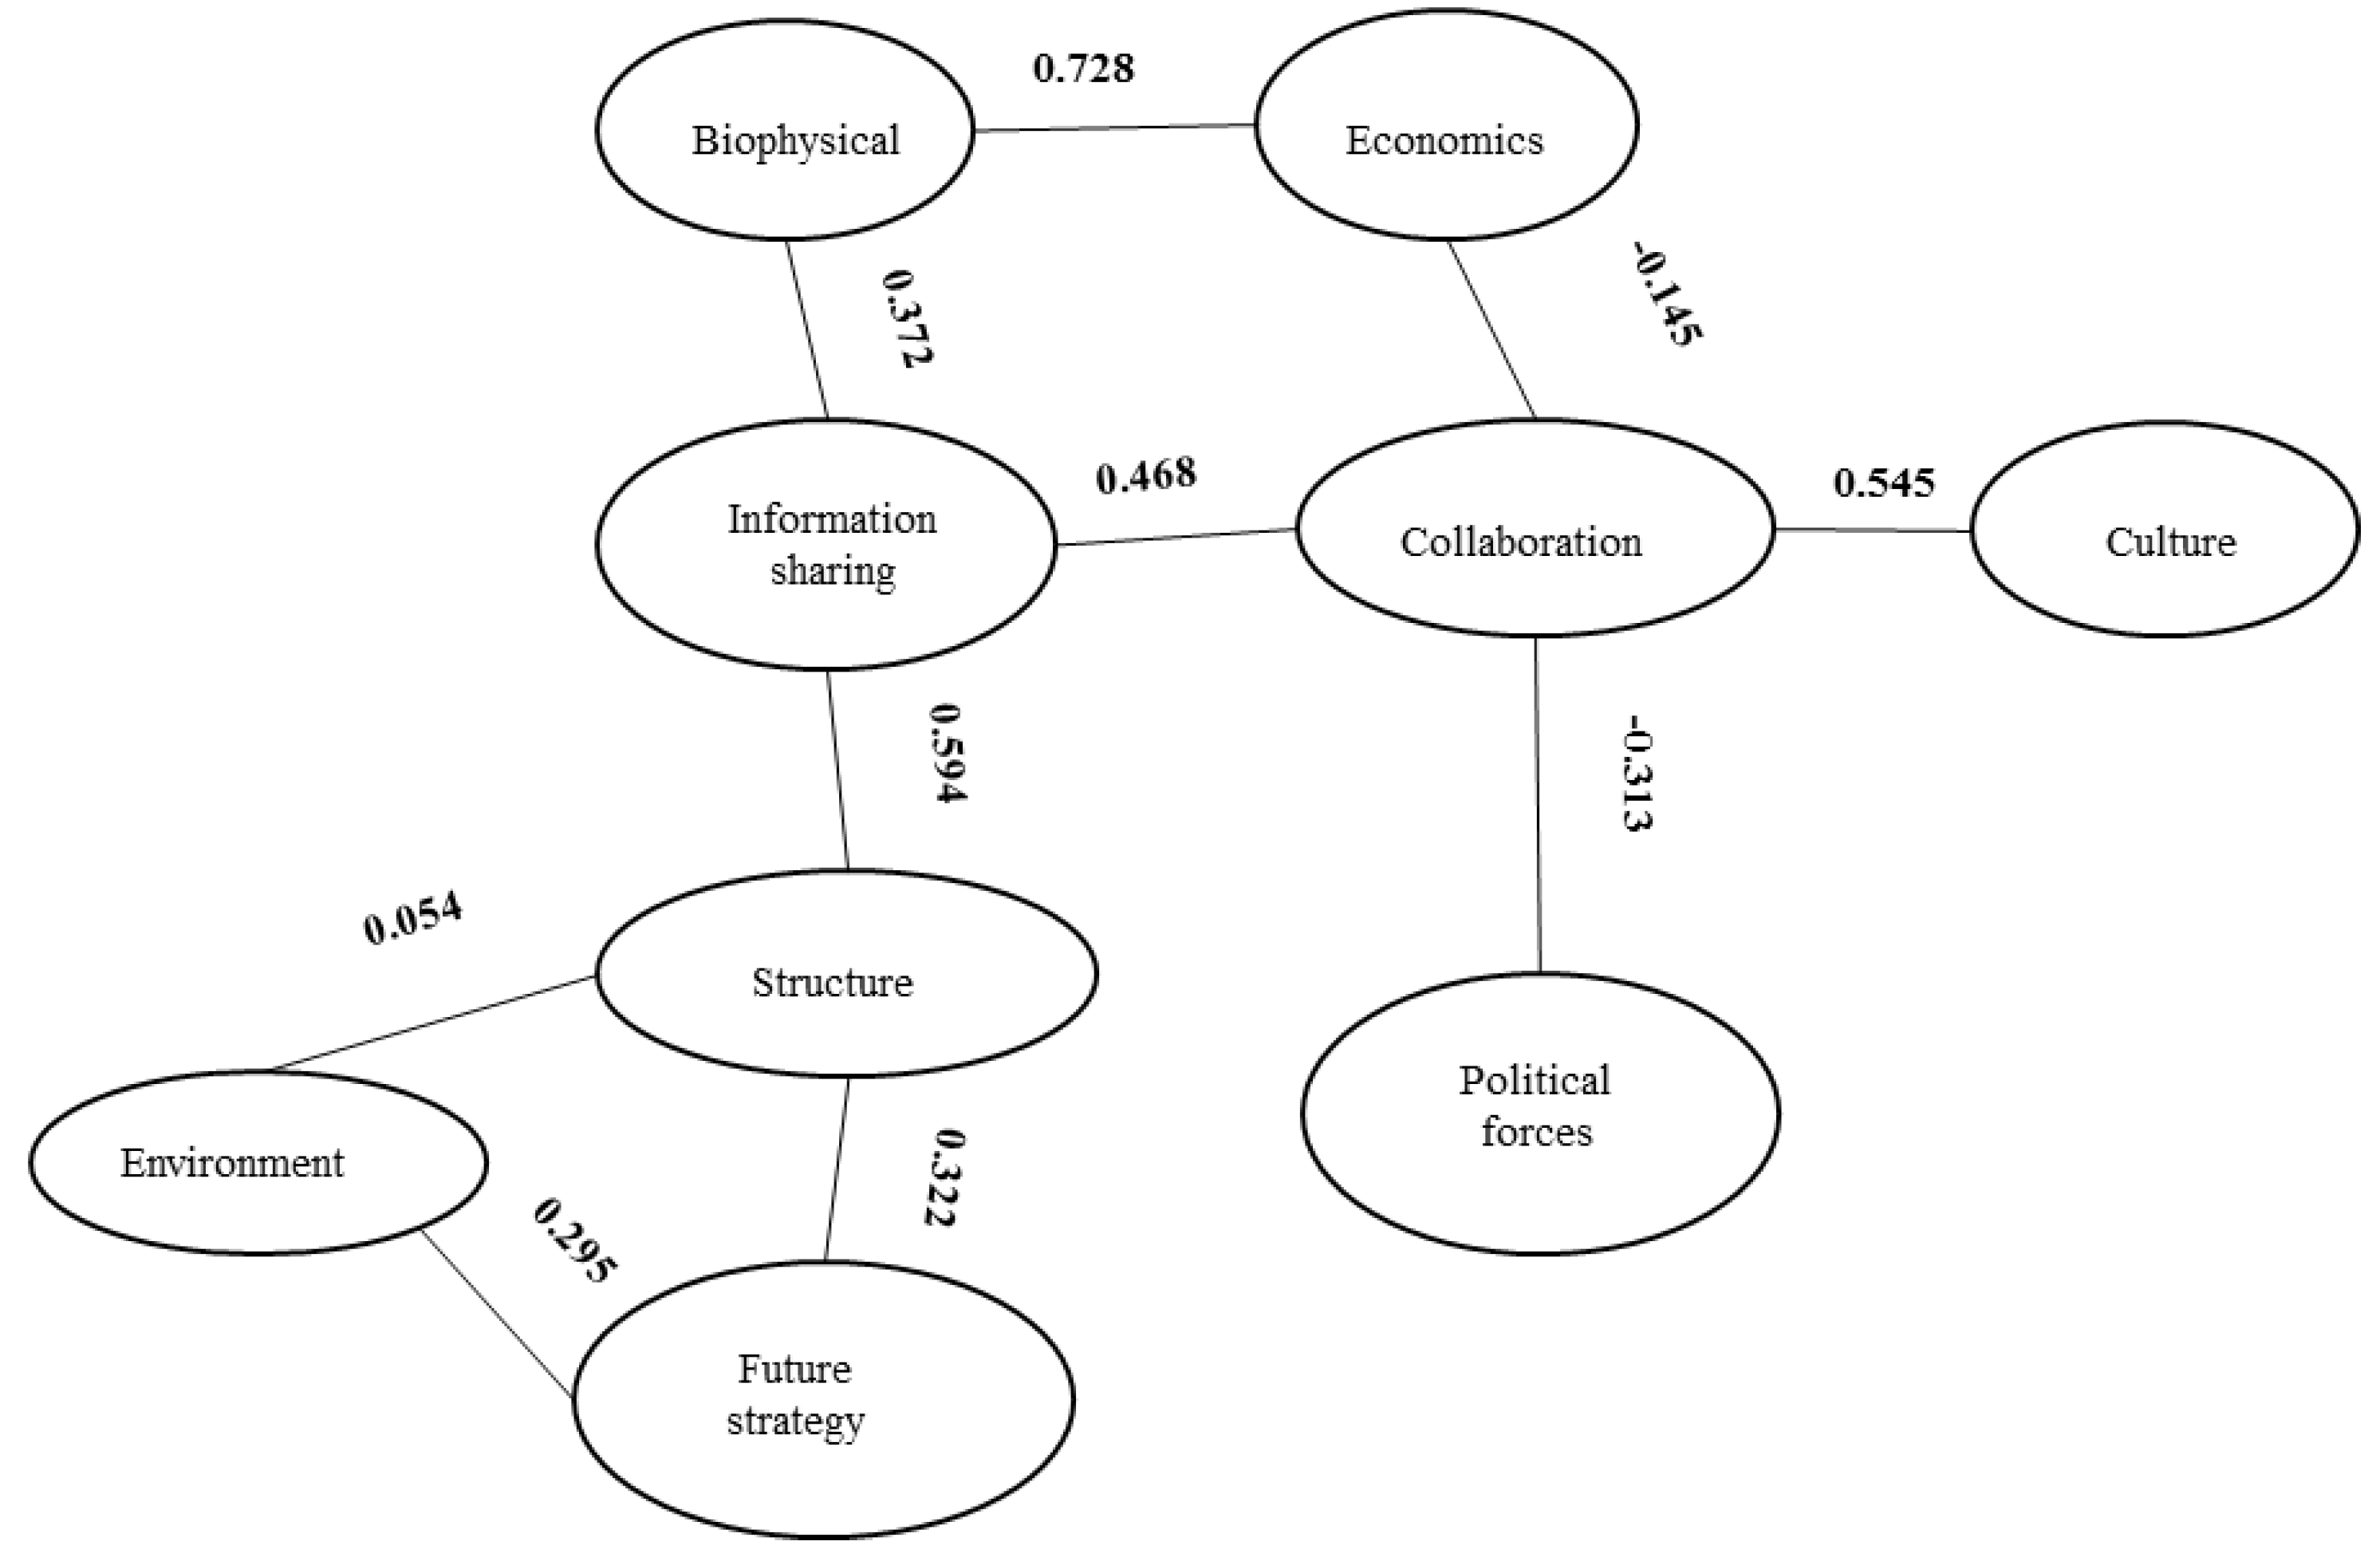
| Hypothesis | k | N | SE | 95% CV | Q | |||
|---|---|---|---|---|---|---|---|---|
| Upper | Lower | |||||||
| H1 (Structure–strategy) 1 | 10 | 1914 | 0.321 | 0.322 | M | 0.374 | 0.272 | 8.84 |
| H2 (Structure–environment) 2 | 11 | 1894 | 0.062 | 0.054 | Trivial | 0.069 | 0.038 | 14.51 |
| H3 (Strategy–environment) 3 | 15 | 2514 | 0.310 | 0.295 | S | 0.350 | 0.239 | 11.81 |
| H4 (Structure–information sharing) 4 | 10 | 2298 | 0.643 | 0.594 | L | 0.669 | 0.519 | 9.85 |
| H5 (Collaboration–information sharing) | 21 | 6810 | 0.530 | 0.468 | M | 0.540 | 0.396 | 15.00 |
| H6 (Information sharing–biophysical) 5 | 11 | 2029 | 0.336 | 0.372 | M | 0.434 | 0.309 | 8.68 |
| H7 (Biophysical–economic) 6 | 10 | 382 | 0.822 | 0.728 | L | 0.837 | 0.618 | 10.78 |
| H8 (Collaboration–economics) 7 | 11 | 2935 | −0.103 | −0.145 | S | −0.207 | −0.019 | 9.27 |
| H9 (Culture–collaboration) | 17 | 4776 | 0.595 | 0.545 | L | 0.619 | 0.469 | 20.07 |
| H10 (Political forces–collaboration) 8 | 19 | 4283 | −0.671 | −0.313 | M | −0.133 | −0.494 | 4.41 * |
© 2019 by the authors. Licensee MDPI, Basel, Switzerland. This article is an open access article distributed under the terms and conditions of the Creative Commons Attribution (CC BY) license (http://creativecommons.org/licenses/by/4.0/).
Share and Cite
Shongwe, M.I.; Bezuidenhout, C.N.; Sibomana, M.S.; Workneh, T.S.; Bodhanya, S.; Dlamini, V.V. Developing a Systematic Diagnostic Model for Integrated Agricultural Supply and Processing Systems. Systems 2019, 7, 15. https://doi.org/10.3390/systems7010015
Shongwe MI, Bezuidenhout CN, Sibomana MS, Workneh TS, Bodhanya S, Dlamini VV. Developing a Systematic Diagnostic Model for Integrated Agricultural Supply and Processing Systems. Systems. 2019; 7(1):15. https://doi.org/10.3390/systems7010015
Chicago/Turabian StyleShongwe, Mduduzi Innocent, Carel Nicolaas Bezuidenhout, Milindi Sylver Sibomana, Tilahun Seyoum Workneh, Shamim Bodhanya, and Vukile Vinah Dlamini. 2019. "Developing a Systematic Diagnostic Model for Integrated Agricultural Supply and Processing Systems" Systems 7, no. 1: 15. https://doi.org/10.3390/systems7010015
APA StyleShongwe, M. I., Bezuidenhout, C. N., Sibomana, M. S., Workneh, T. S., Bodhanya, S., & Dlamini, V. V. (2019). Developing a Systematic Diagnostic Model for Integrated Agricultural Supply and Processing Systems. Systems, 7(1), 15. https://doi.org/10.3390/systems7010015