Article

Veterinary Telemedicine: A System Dynamics Case Study

School of Business, University of Southern Maine, Portland, ME 04103, USA
*
Author to whom correspondence should be addressed.
Submission received: 5 December 2017 / Revised: 8 February 2018 / Accepted: 11 February 2018 / Published: 15 February 2018
(This article belongs to the Special Issue Theory and Practice in System Dynamics Modelling)

Abstract

:
Veterinary telemedicine has existed since the late 1990s. Various scholars have predicted its growth, others its decline. We constructed a system dynamics model of a veterinary telemedicine company providing services in one specialty in the industry. The model showed that severe shortages of specialists would limit growth in that, even with extensive marketing efforts. This limitation is likely to hold in other aspects of veterinary telemedicine. The paper concludes with recommendations for the company and the industry.

1. Introduction

1.1. Industry Overview

Telemedicine uses medical information exchanged between distant sites for diagnosis, consultation, and treatment, and transfer of medical data, of patients [1]. Telemedicine is as widespread in veterinary medicine as it is in human medicine [2,3]. As Papageorges and Herbert [3] mention, the following veterinary specialties used telemedicine as far back as 2001: tele-electrocardiography (EKGs), telesonography, teleradiology, and telecytology. (One of these is the specialty examined in the present paper.) They predicted that telecardiology, tele-endoscopy, teledermatology, tele-ophthalmology, and even tele-behavior therapy specialties would ultimately use this kind of tele-expertise. As far back as 2001, the journal Clinical Techniques in Small Animal Practice devoted an entire issue to telemedicine in veterinary practice [4] with Papageorges [5] predicting widespread use by 2010. Some (for example, [2]) assert that veterinary telemedicine will alleviate the shortage of veterinary specialists, while others [6] caution that technological barriers might prevent either widespread use or increased efficiency.
The present paper will examine a case study of a company trying to start a veterinary telemedicine business. Unlike the telemonitoring described in Warren et al. [7], this company has veterinary specialists examine test materials, sent to them remotely in discrete packets, for interpretation. All the specialists work remotely; none is on the company’s premises. Our goal is to examine whether there is growth potential in this industry, and, coincidentally, to examine if Papageorges’s [5] prediction has been fulfilled. To maintain confidentiality, the firm requests anonymity and even requests that we disguise its current particular specialty. However, the company shared all the data used in the present paper, and we believe them to be accurate.
The question is whether the veterinary telemedicine field can keep up with demand and its growth potential, or if a lack of specialists will force its incumbent firms to scale back. The industry is severely restricted in its growth by its available tangible assets, which include a limited amount of available specialists in the company’s current subfield, which currently total around 500 specialists, worldwide. The growth rate of specialists is slow; universities can currently produce about 40 per year. The company currently experiences specialist turnover of 7 percent. Hiring and retaining staff are important objectives for the company if it hopes to achieve growth and service existing clients well. If the company wants stay on its current trajectory then it will need to maintain an adequate hiring level above its current leakage rate. It will have to hire and retain enough of the available specialists entering and currently in the market, while also being aware that rivals are hiring from the same pool. The company’s potential clients currently total the 24,000 clinics in the U.S. and North America. Currently about 9000 of these clinics use telemedicine services, although this number is expected to grow rapidly over the next five to ten years. Potential clients are veterinary hospitals and clinics, which alone send many cases each year.

1.2. Opportunity

The company currently serves approximately 4100 clients and has a 45% share of this specialty veterinary telemedicine market. The company has some control over tangible resources such as specialists, sales reps, and equipment. Resources also include intangibles, such as brand reputation and service quality. We should mention here that the data with which we developed our model (described and explained later) come entirely from executives within the company
Our goal is to use a system dynamics model to show how the company can capture as much of the potential growth in this specialty telemedicine market as possible. This company’s growth opportunity is clear: to improve its current position and to win a greater market share of the available pool of clinics as telemedicine services grow over time. The company expects this market to quadruple in size over the next 5–10 years.
To increase contacts with more clients the company is using direct marketing, conferences and “lunch and learns”, and is using key opinion leaders who can influence its peers’ veterinary practices to get the word out. This creates a self-reinforcing feedback for the company as veterinarians use word of mouth and conferences to reinforce its growth. The company has a sales force of approximately 150 individuals, geographically distributed by number of clinics in an area, which allows sales people to call more frequently on the prospective clinics. Clinics require a certain level of service to maintain a level of quality. A diminishment in service quality would mean that companies would risk losing clinics. The company has the ability to win more clients but cannot win too many, as this will put too much pressure on the current specialists and reduce service quality.
This company hires three types of veterinary specialists:
  • Full time specialists who examine and interpret test materials for the company and have no other veterinary practice.
  • Scheduled specialists who examine and interpret test materials for the company on a scheduled basis, but who have their own practice.
  • Non-scheduled specialists, who examine and interpret test results for the company on an ad hoc basis, but who have their own practice.
The company pays the specialists in each category on a per-case basis, even though the full time specialists are employees and the other two categories are contractors. It charges an additional fee for “stat” cases (i.e., cases where the customer demands fast turnaround) and splits that fee with the relevant specialist.

2. Materials and Methods

2.1. Overview of the System Dynamics Method

System dynamics (SD) is a modeling approach typically used for policy analysis and design [8]. The SD approach is best suited for application to dynamic problems arising in complex systems characterized by interdependence, mutual interaction, information feedback, and circular causality. The system dynamics approach involves the following:
  • Defining problems dynamically, in terms of graphs over time; in system dynamics, these are called “reference modes”.
  • Striving for an endogenous, behavioral view of the significant dynamics of a system, a focus inward on the characteristics of a system that themselves generate or exacerbate the perceived problem; this is called a “dynamic hypothesis”.
  • Thinking of all concepts in the real system as continuous quantities interconnected in loops of information feedback and circular causality.
  • Identifying independent stocks or accumulations (levels) in the system and their inflows and outflows (rates).
  • Formulating a behavioral model capable of reproducing, by itself, the dynamic problem of concern. The model is usually a computer simulation model expressed in nonlinear equations, with the stocks being integrations of the flows mentioned in the last point.
  • Deriving understandings and applicable policy insights from simulations done using the resulting model.
  • Implementing changes resulting from model-based understandings and insights [9].
The loops mentioned in the third bullet point come in two varieties:
  • Reinforcing feedback, which amplifies disturbances in the loop. Some feedback theorists refer to these as positive feedback loops.
  • Balancing feedback, which dampens disturbances in the loop. Some feedback theorists refer to these as negative feedback loops.
The unique contribution of SD to policy analysis is not the notion that feedback is important (an idea that has been around in various forms for centuries) but is the practical application of this fundamental concept in the form of models that can be tested, calibrated, and refined in a rigorous and scientific way [10,11,12,13,14,15,16].

2.2. Appropriateness of System Dynamics for This Study

As Homer and Hirsch [17] put it, in discussing the nature of system dynamics:
A central tenet of system dynamics is that the complex behaviors of organizational and social systems are the result of ongoing accumulations—of people, material or financial assets, information, or even biological or psychological states—and both balancing and reinforcing feedback mechanisms. The concepts of accumulation and feedback have been discussed in various forms for centuries. System dynamics uniquely offers the practical application of these concepts in the form of computerized models in which alternative policies and scenarios can be tested in a systematic way that answers both “what if and why”.
[Emphasis supplied]
The present paper extends these ideas to examination of the strategy of a business organization. Wernerfelt [18] first developed the theory of the Resource-Based View of the Firm, which has become the dominant paradigm in strategy research and practice. Its basic principle is that firms create, maintain and deploy resources (tangible and intangible) and capabilities in ways that create competitive advantage. Dierickx and Cool [19] subsequently conceived of these resources and capabilities as accumulating stocks (hence the supplied emphasis in the quotation above), which coincidentally are the basis for system dynamics models. Warren [20] later coined the phrase “strategy dynamics”, which explicitly uses the system dynamics method to apply the Resource-Based View of the Firm, something Warren calls a firm’s “strategic architecture”. The present study is an application of strategy dynamics to a firm providing a telemedicine service to veterinary practices. Bayer, Barlow and Curry [21] used system dynamics, and Jean et al. [22] used parametric modeling, to examine human telemedicine, but the present study is the first, to our knowledge, to apply system dynamics to veterinary telemedicine.

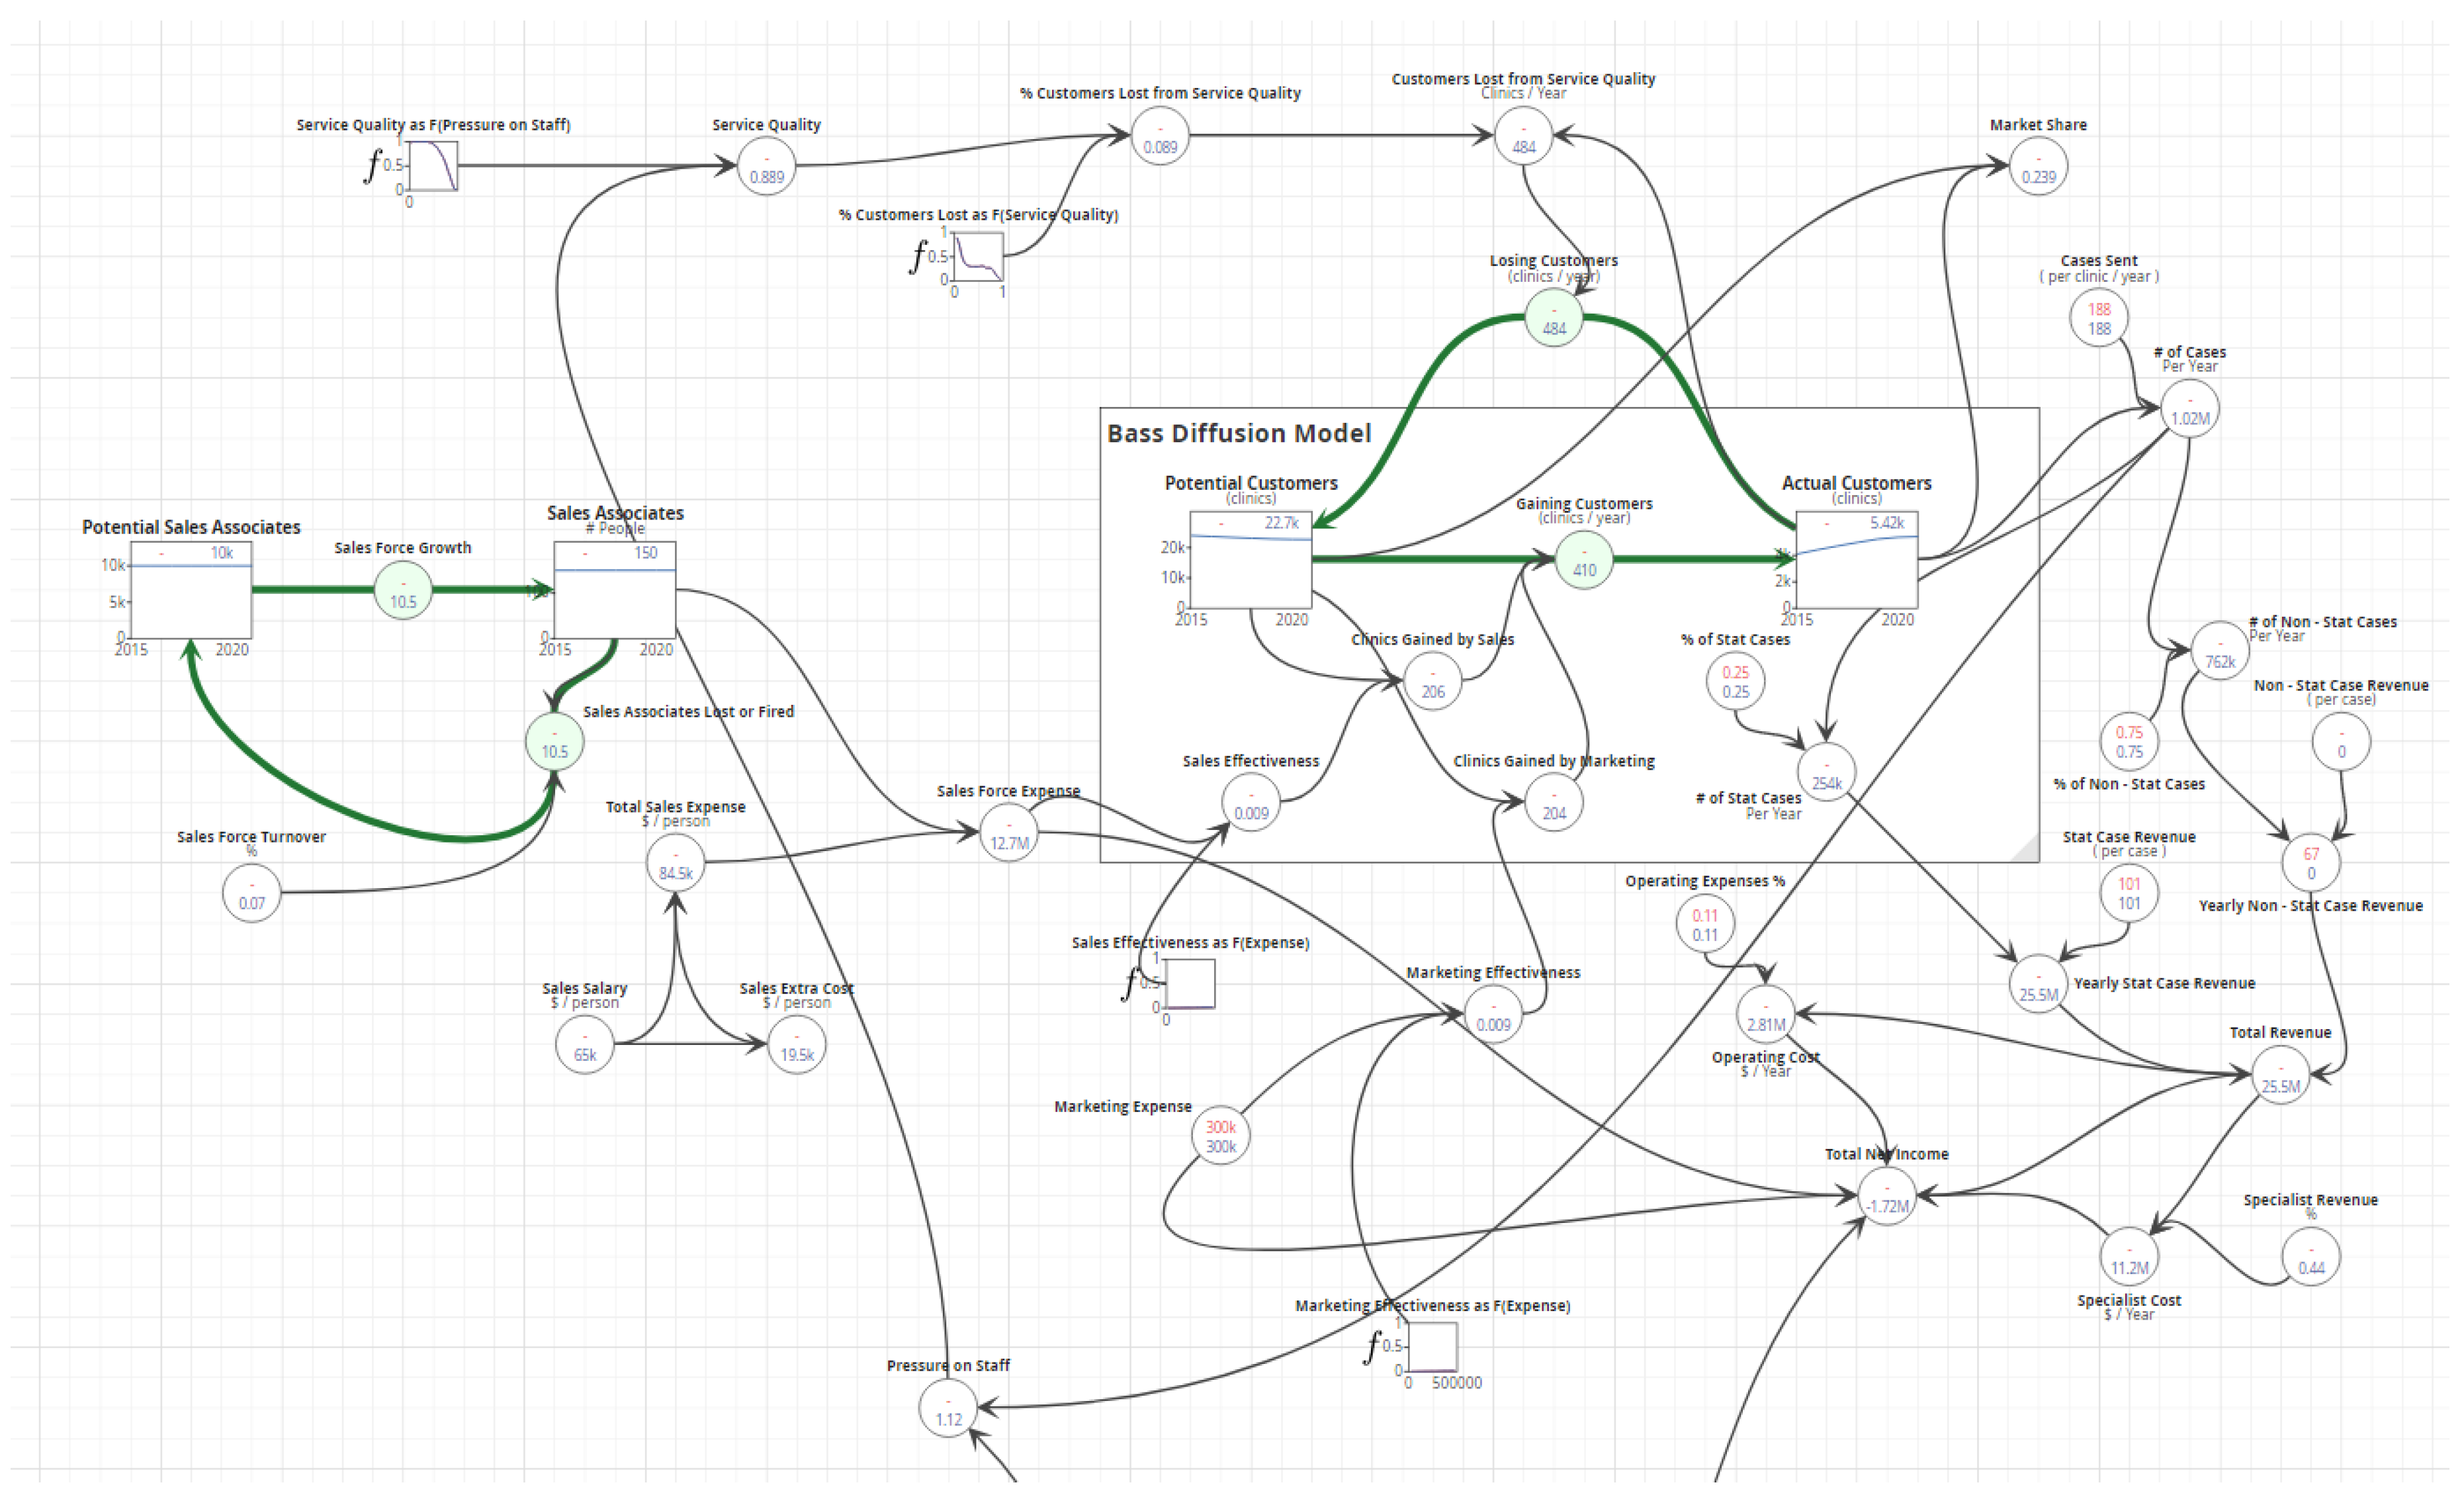
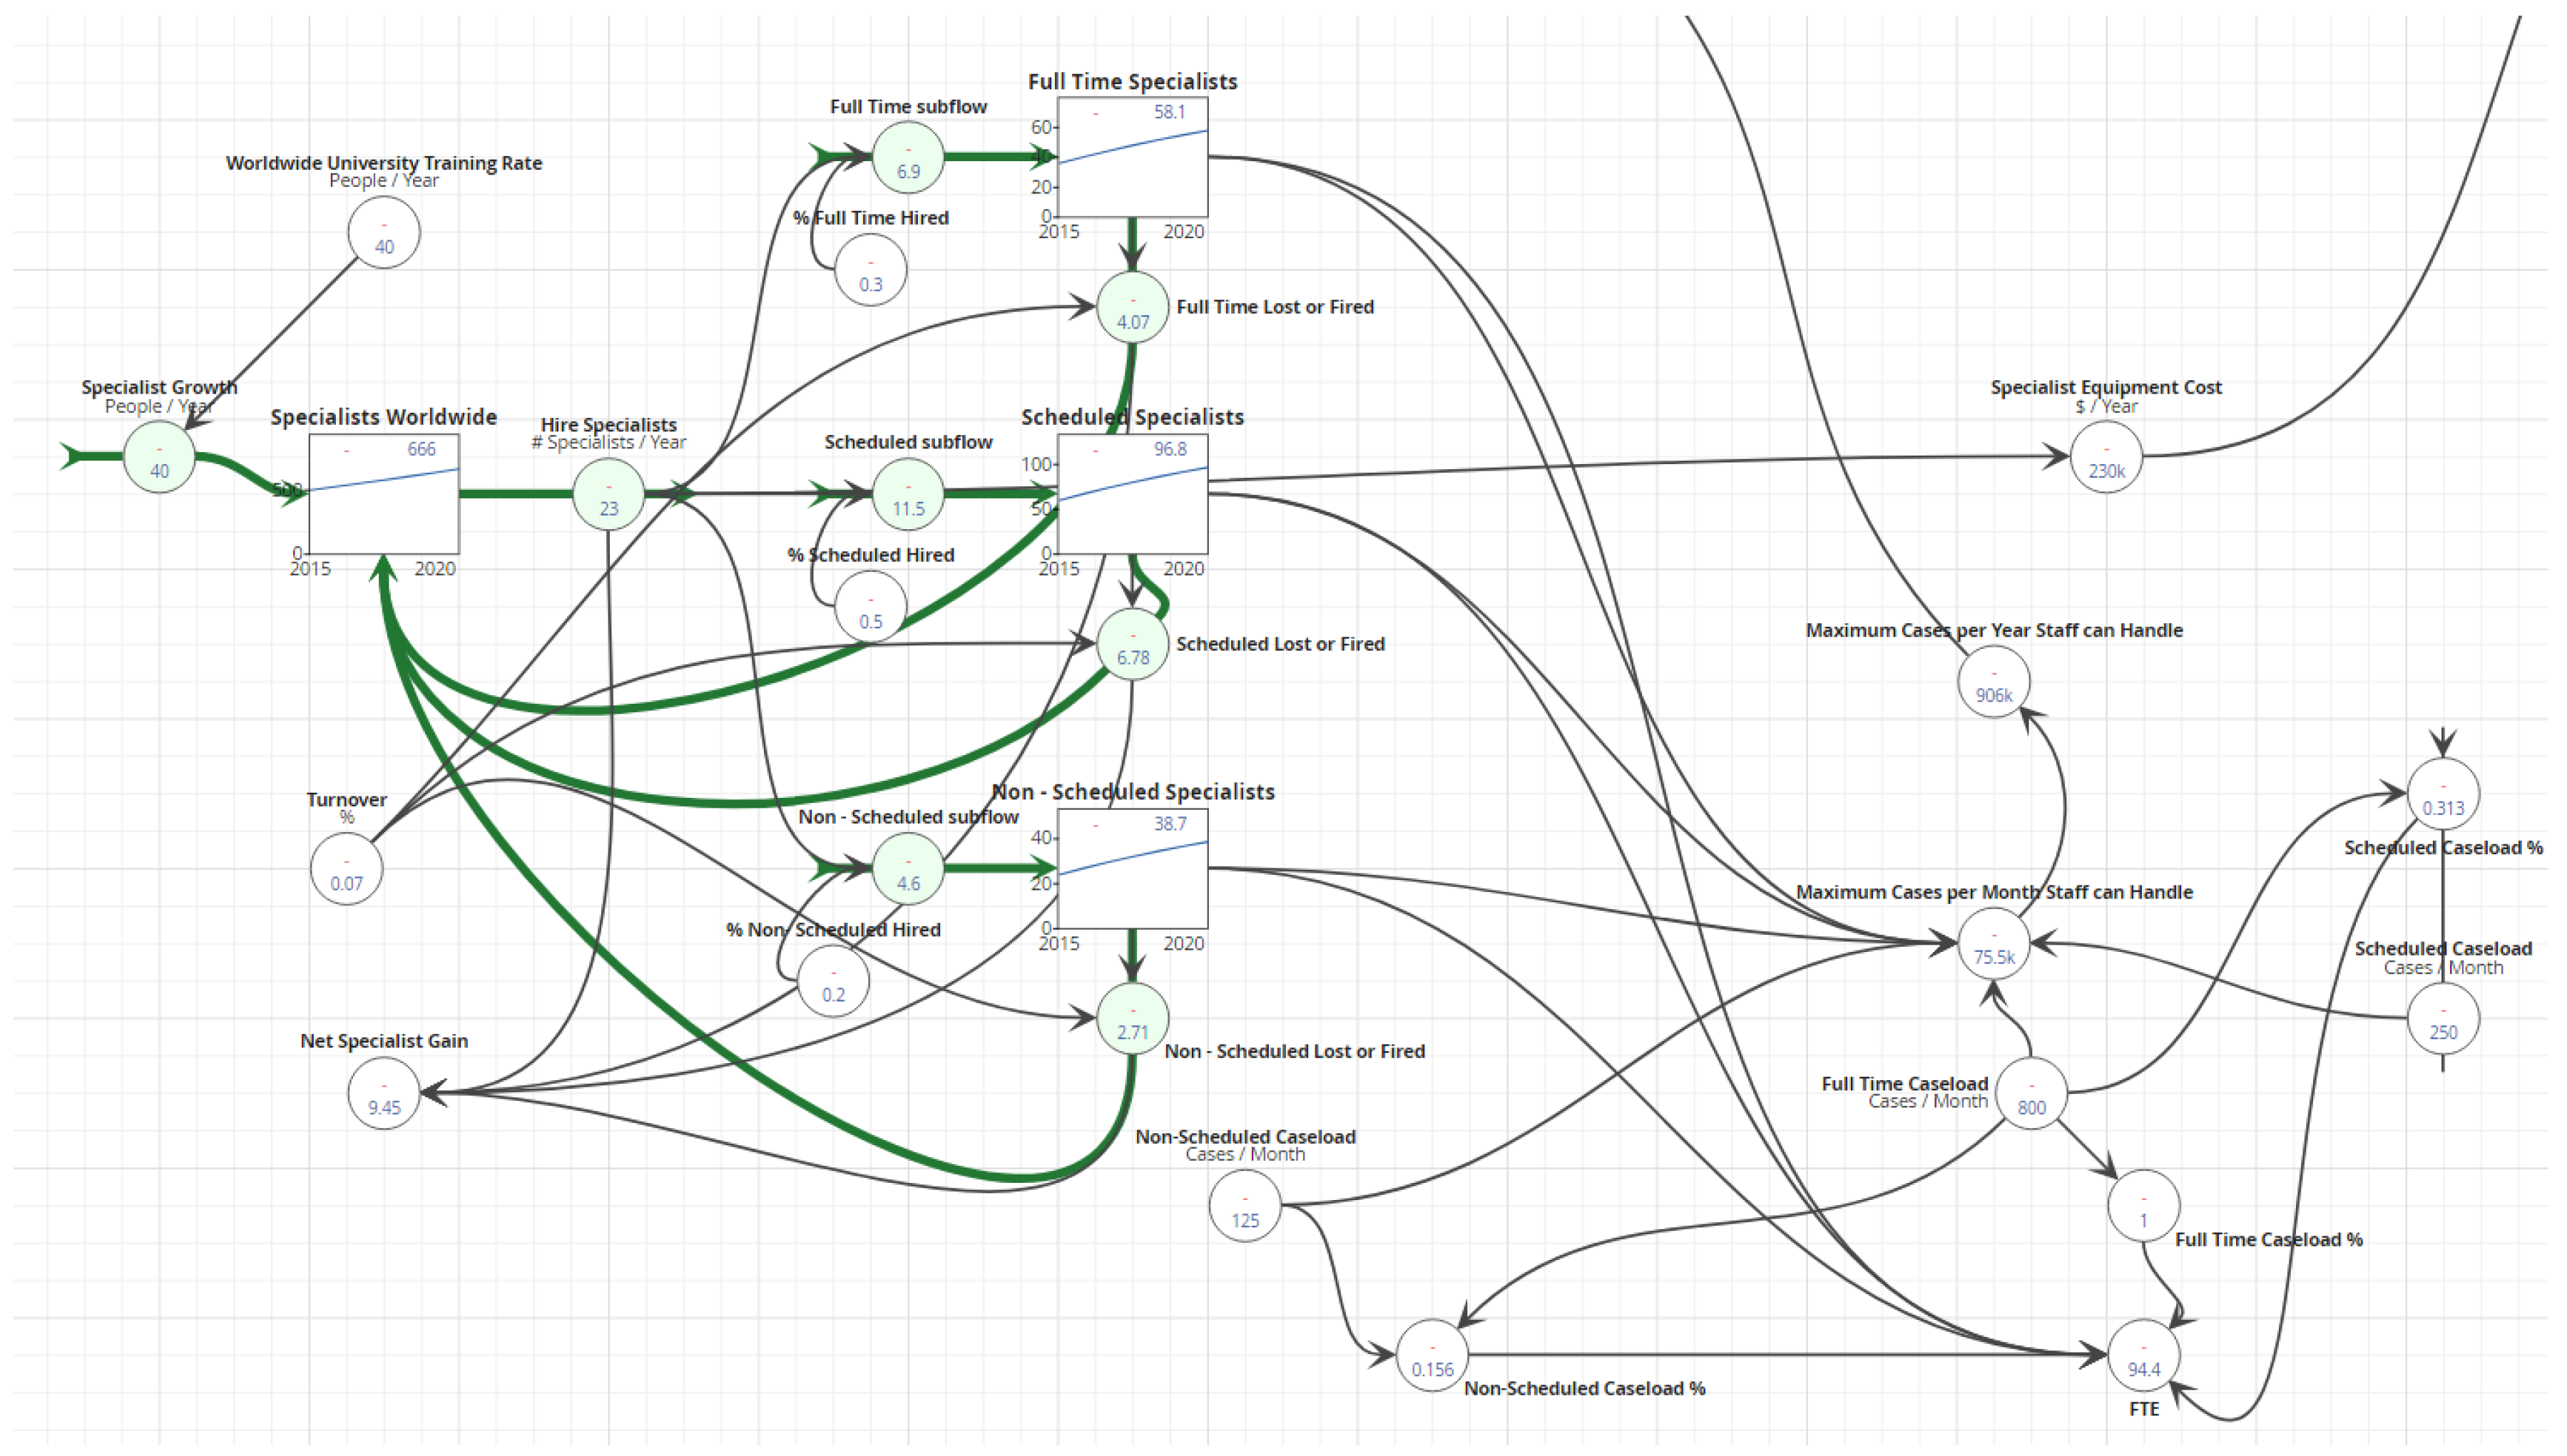
2.3. System Dynamics Model Used in This Paper

Using the Sysdea software package, we designed a system dynamics model (see Figure 1, Figure 2 and Figure 3) to mirror the strategic architecture of the focal veterinary telemedicine company. (A link to a shared version of this model is at [23]) In the model, we mapped out each facet of the business, to facilitate understanding of the relationships among different tangible and intangible factors. Sysdea, as per standard system dynamics convention, depicts resource stocks as boxes and their associated flows using thick green arrows. Sysdea depicts auxiliary variables and constants as circles with words next to them. We explain the two major parts of the model in the following sections.

2.3.1. Market Opportunity

The first part of the model (Figure 1) relates to the market opportunity that this company has in the telemedicine market. At the top center of the figure, in the green box, is the familiar structure of the Bass Diffusion Model. This shows how the company converts its potential customers of 24,000 clinics into actual customers through sales and marketing efforts. There are decisions that the company can make: it can choose how many sales associates to hire per year, the yearly salary of sales associates, and how much to spend on marketing per year. Marketing expense and sales expense drive marketing and sales effectiveness, which increase or decrease the flow rate of potential customers to actual customers. As Figure 1 shows, pressure on staff and service quality drive the flow rate of actual customers back to potential customers (losing customers; see Figure 2 for the lookup function that we used to formulate the relationship between Pressure on Staff and Service Quality). Towards the right side of the model, the number of actual customers this company has dictates the caseload (which breaks down into stat [urgent] and non-stat cases). This caseload in turn affects revenues, specialist costs, operating costs, and net income.

2.3.2. Specialists and Hiring

The second part of the model (see Figure 3) relates to specialists in this field of veterinary medicine and the company’s hiring process. In the starting year of 2015, there are around 500 specialists worldwide for this field of veterinary medicine. At the left side of the model, a flow of specialist growth enters the specialists’ worldwide stock at a rate of 40 specialists per year, which is the company’s estimated value of specialist growth. The company’s hiring draws out of this stock, with multiple split flows into stocks of full time, scheduled, and non-scheduled specialists. We highlight the decision variables in this part of the model using tan boxes. The company determines how many specialists to hire per year, and the target percentages of each type of specialist that it hires. Please note that these are decisions for viewing strategic outcomes; however, in real life it is harder to get full time hires (the company currently has 30% full time staff, but wants to get to 50%). Once specialists are hired, a turnover rate of 7% annually draws out of the specialist boxes back into the worldwide specialists’ pool. Towards the right side of the model, the numbers of specialists dictate the maximum caseload staff can handle per year, which relates with the actual cases sent by clients; this creates a pressure on staff ratio, and a service quality level. The service quality level drives customer retention and losses.

3. Results and Discussion

System dynamics modelers use sensitivity analysis to determine how much the results of a model change in response to changes in the value of its parameters or to changes in its structure [24]. In this paper, we use the former, parameter sensitivity, in the form of a series of tests in which we set different parameter values to see how the changes cause a change in the dynamic behavior of the stocks and financial outcome variables. Table 1 shows the decision variables for the base case and its results for key factors at year-end 2021. Figure 4 shows the related charts.
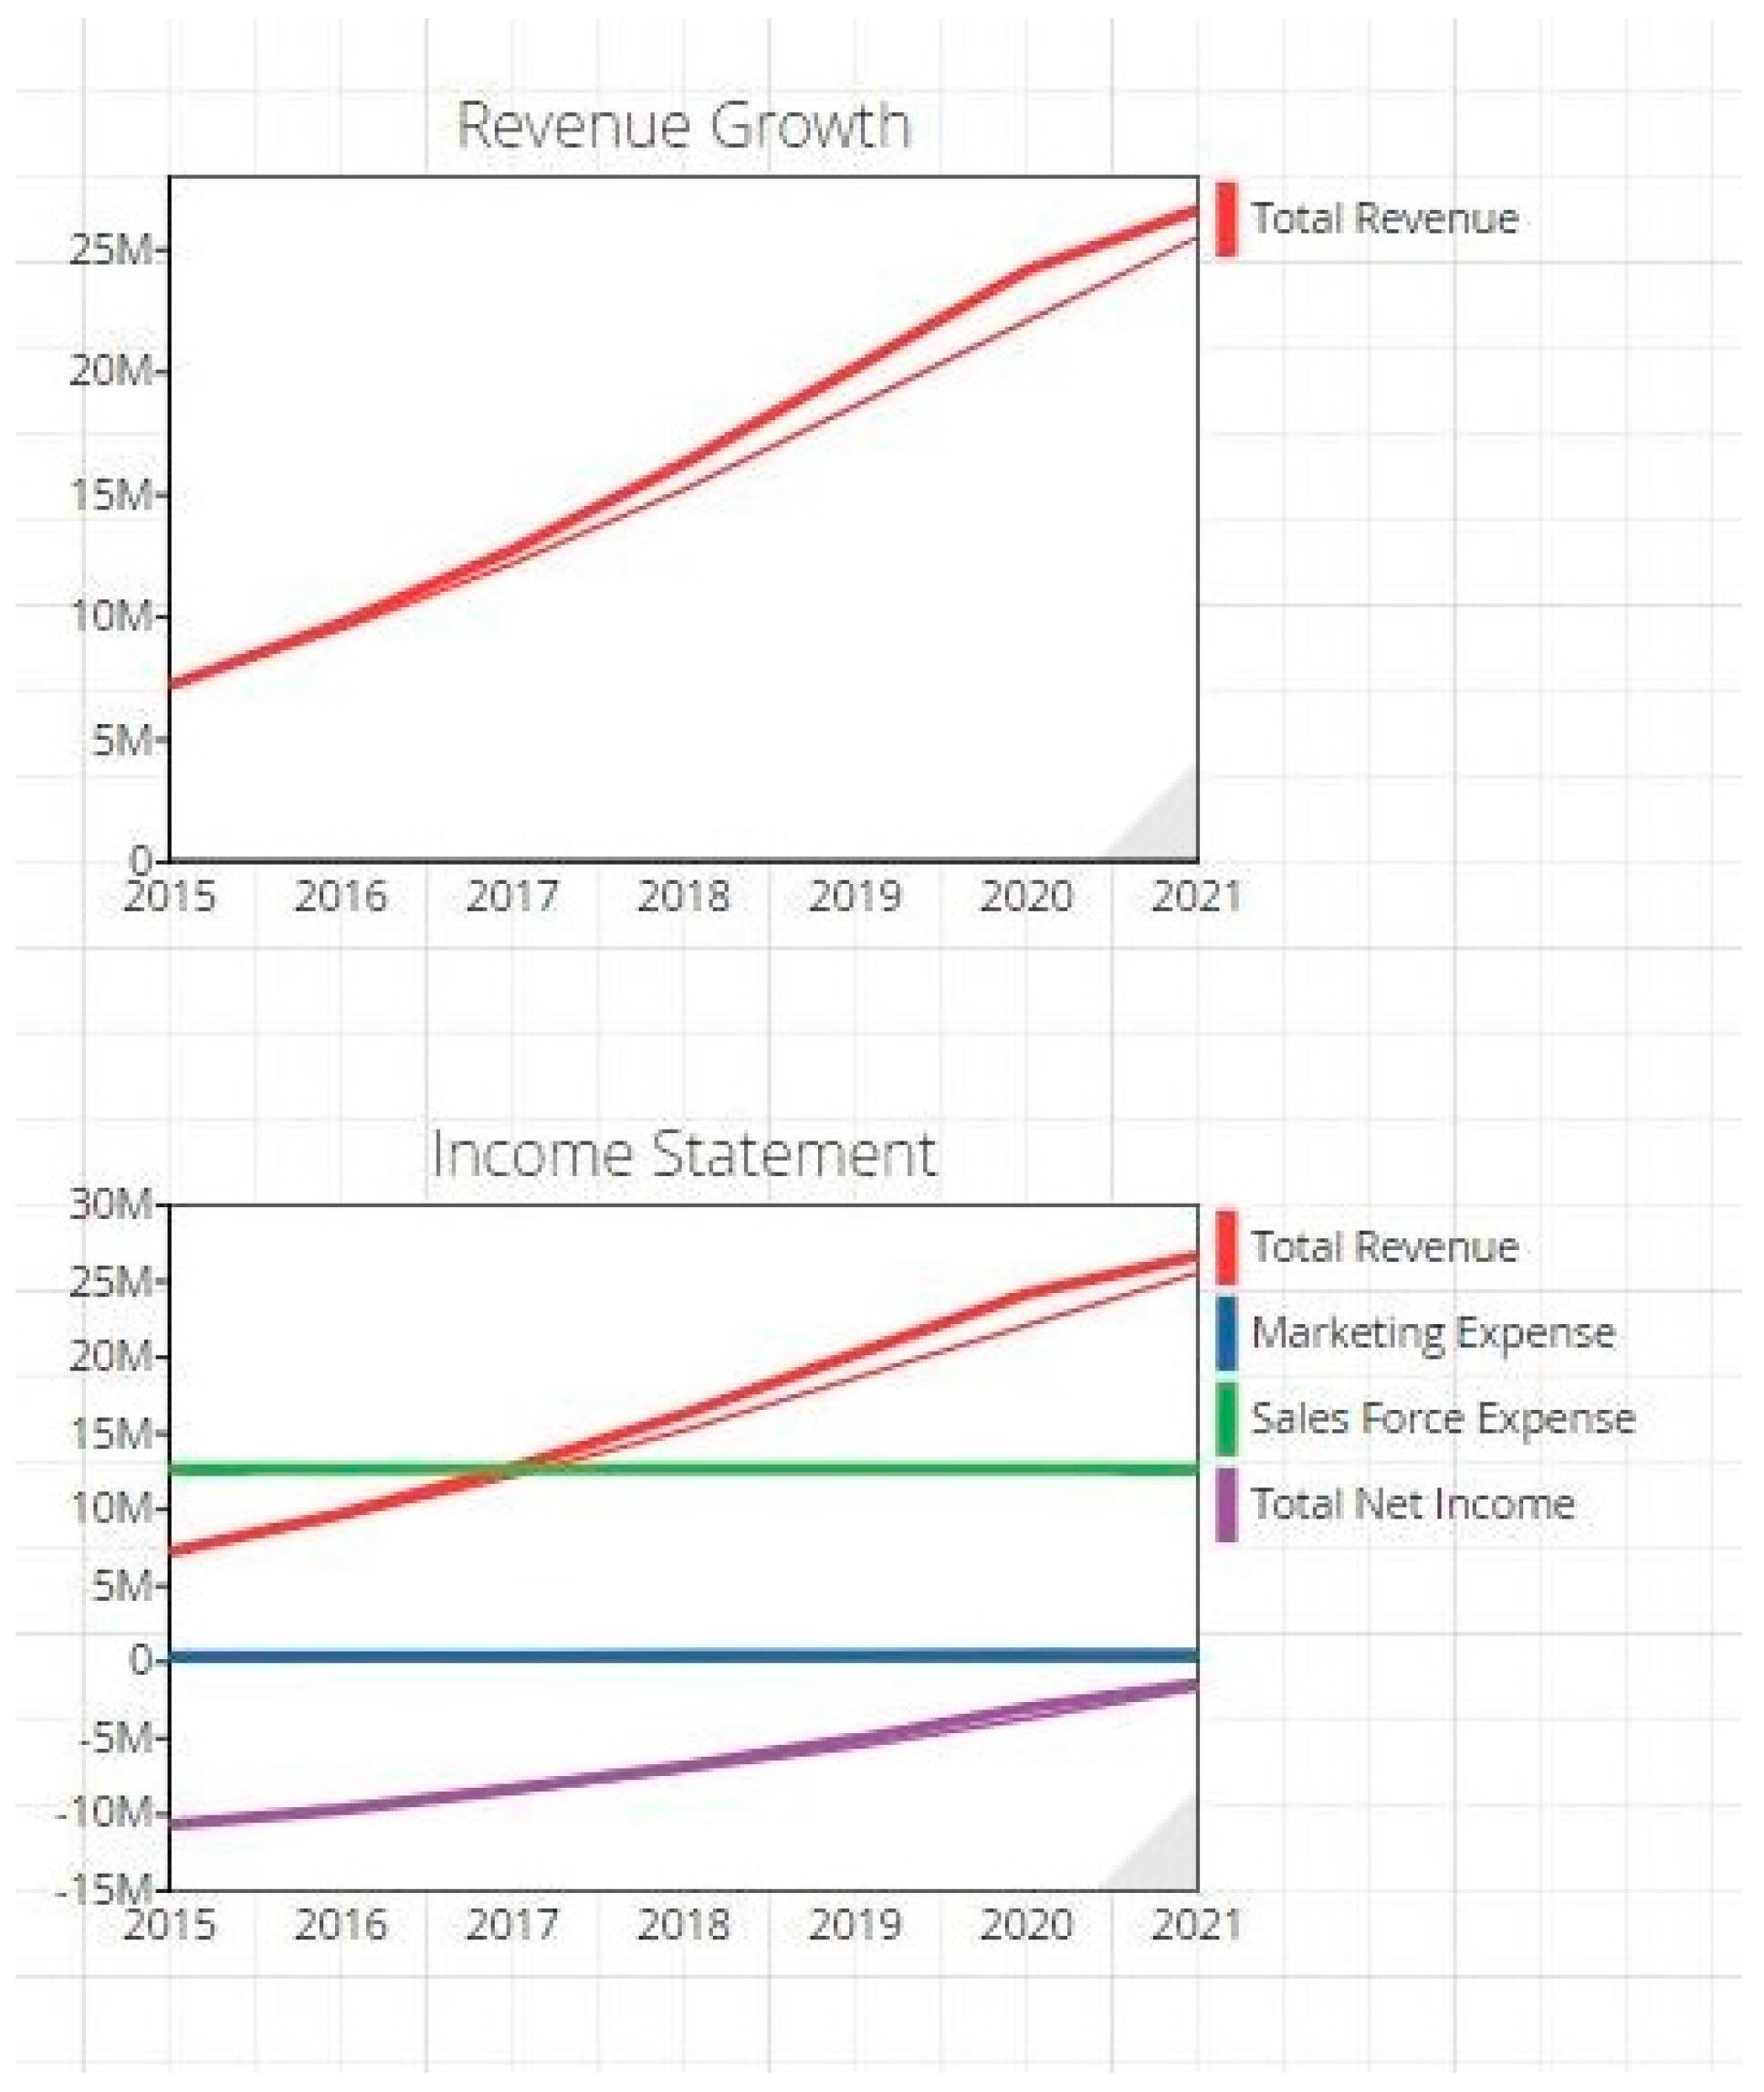
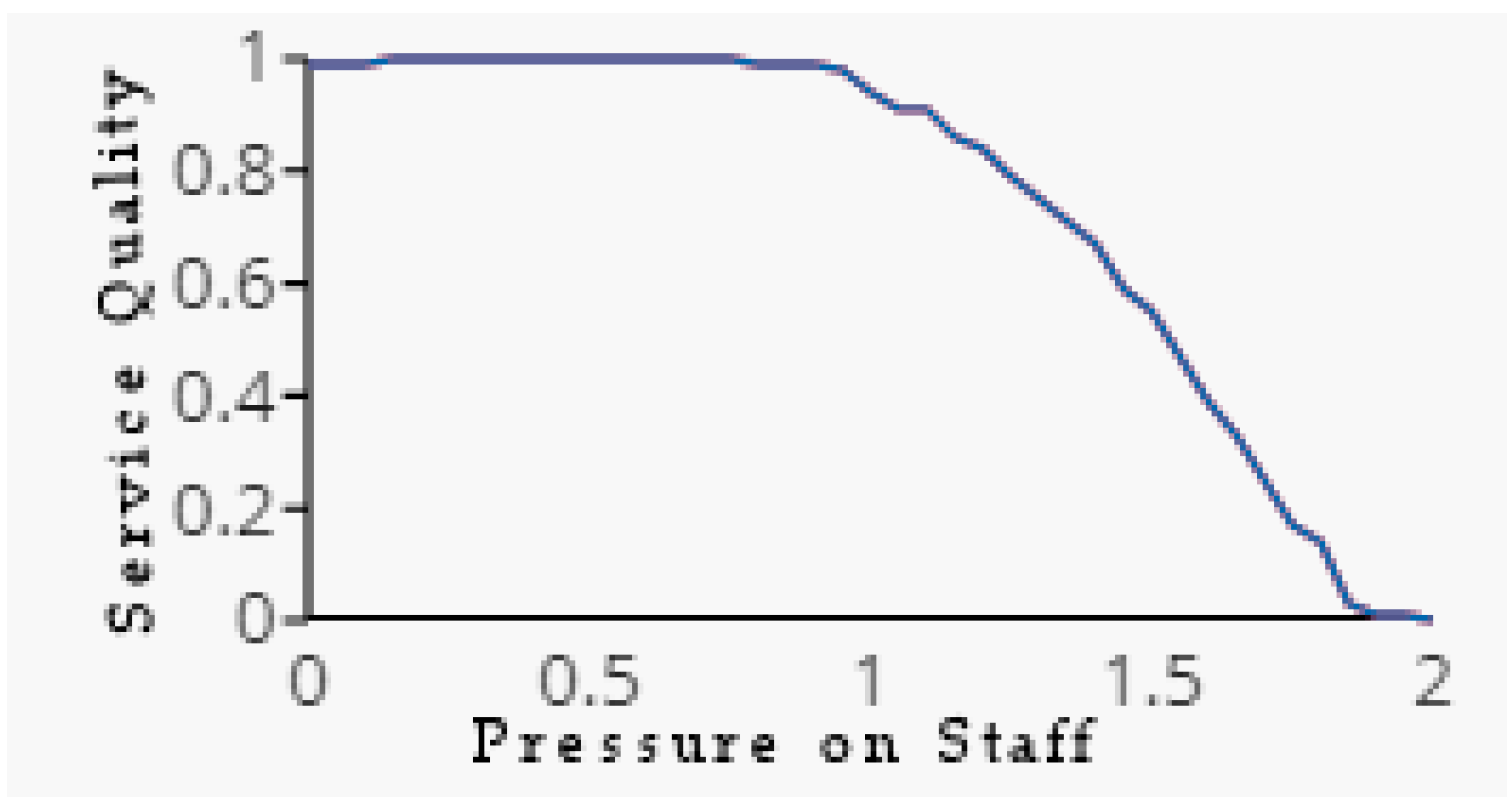
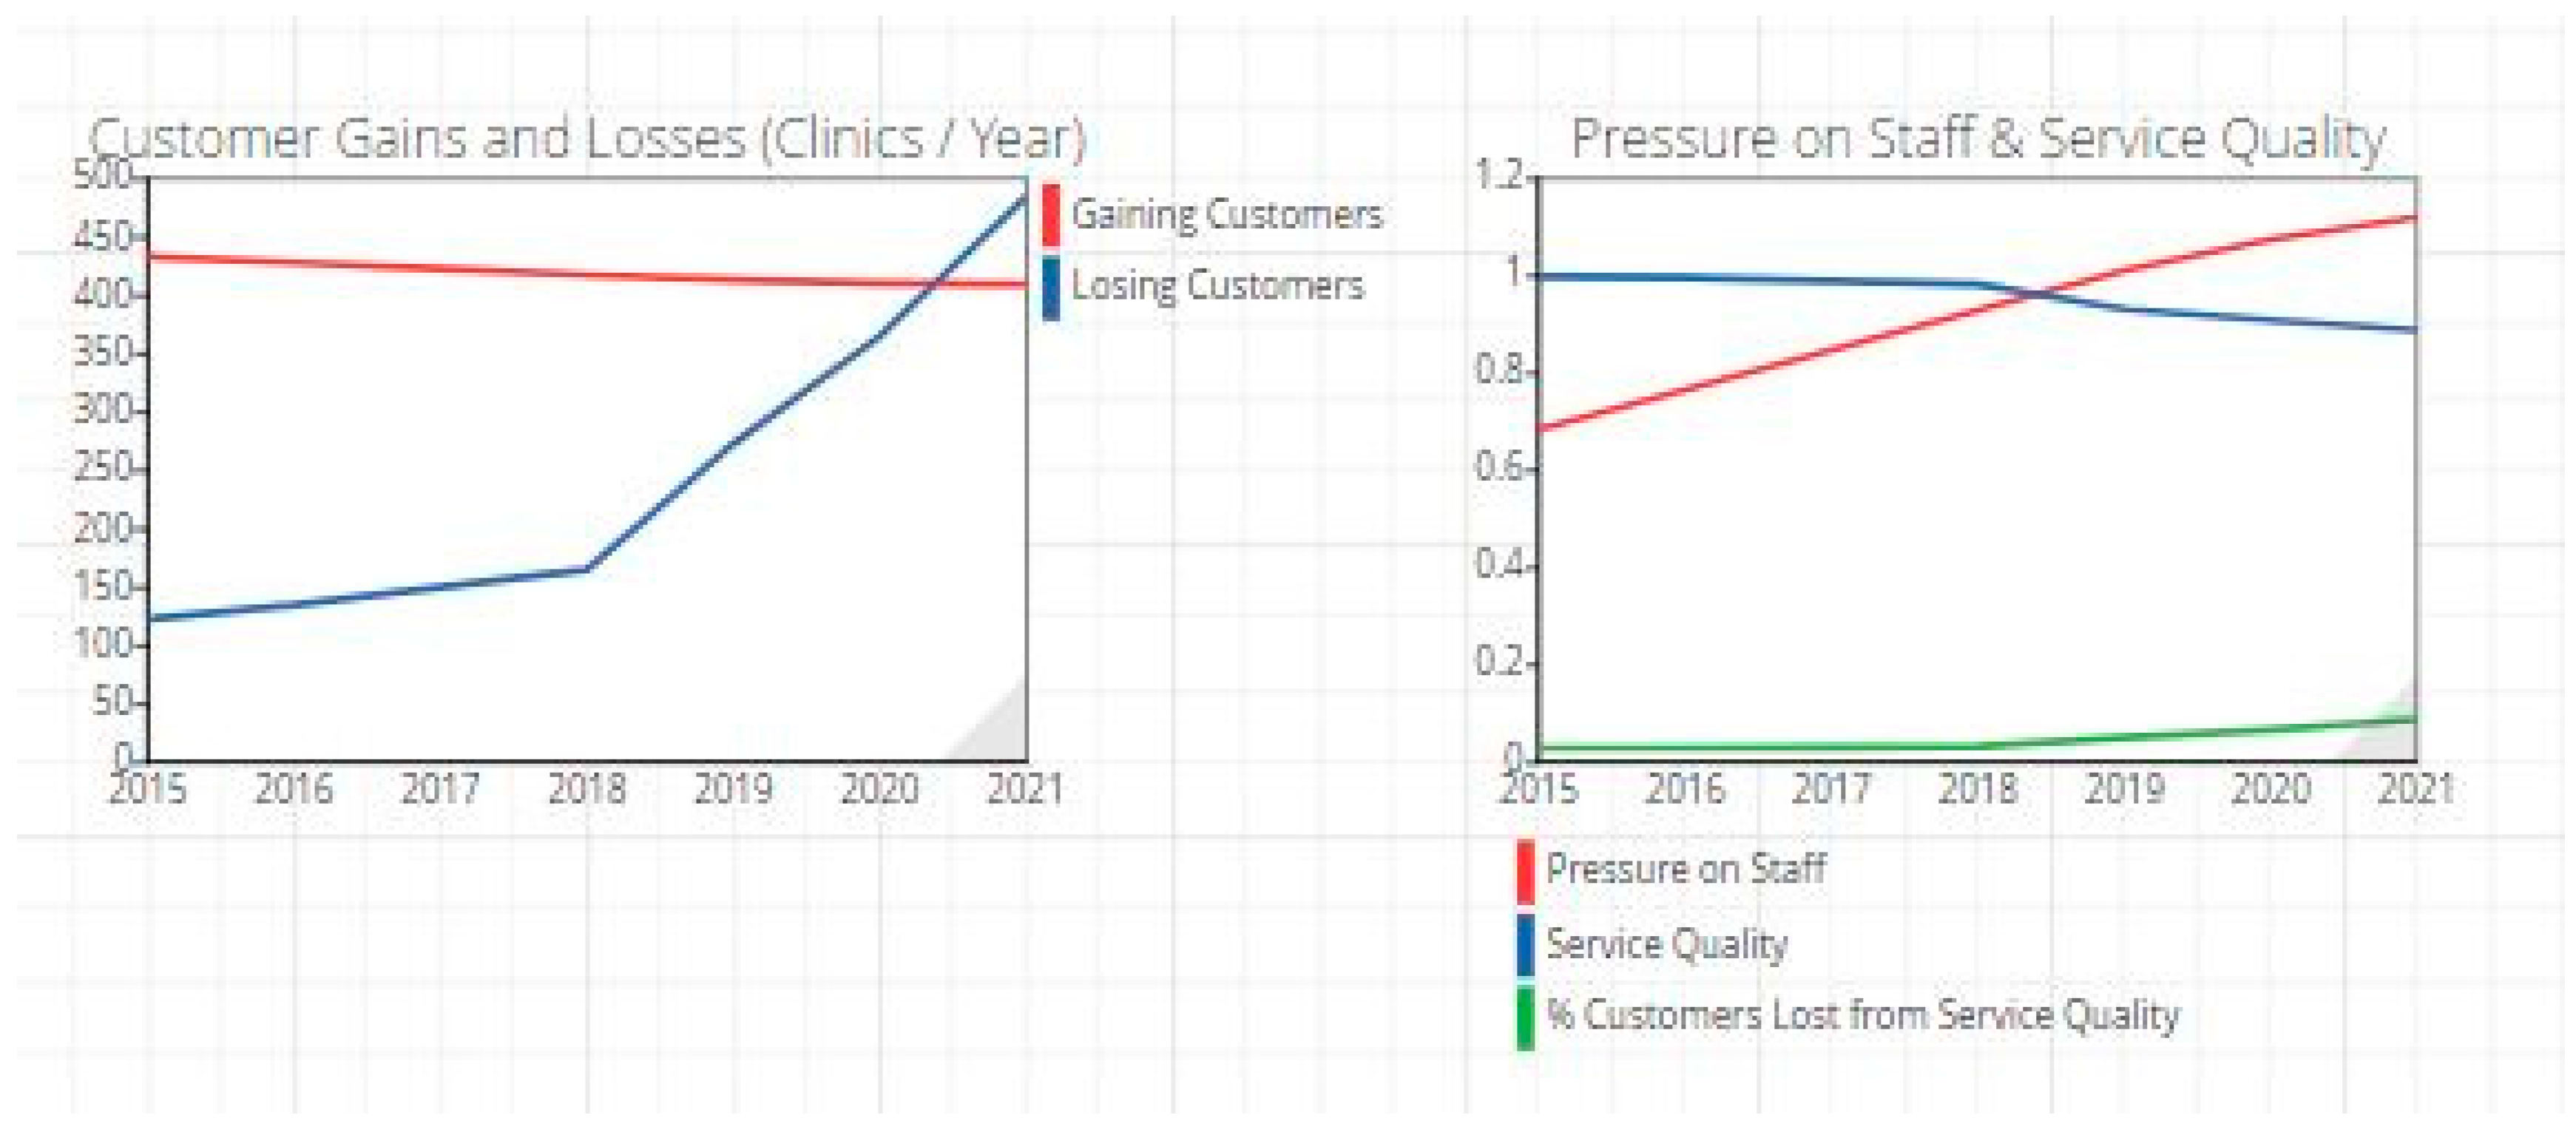
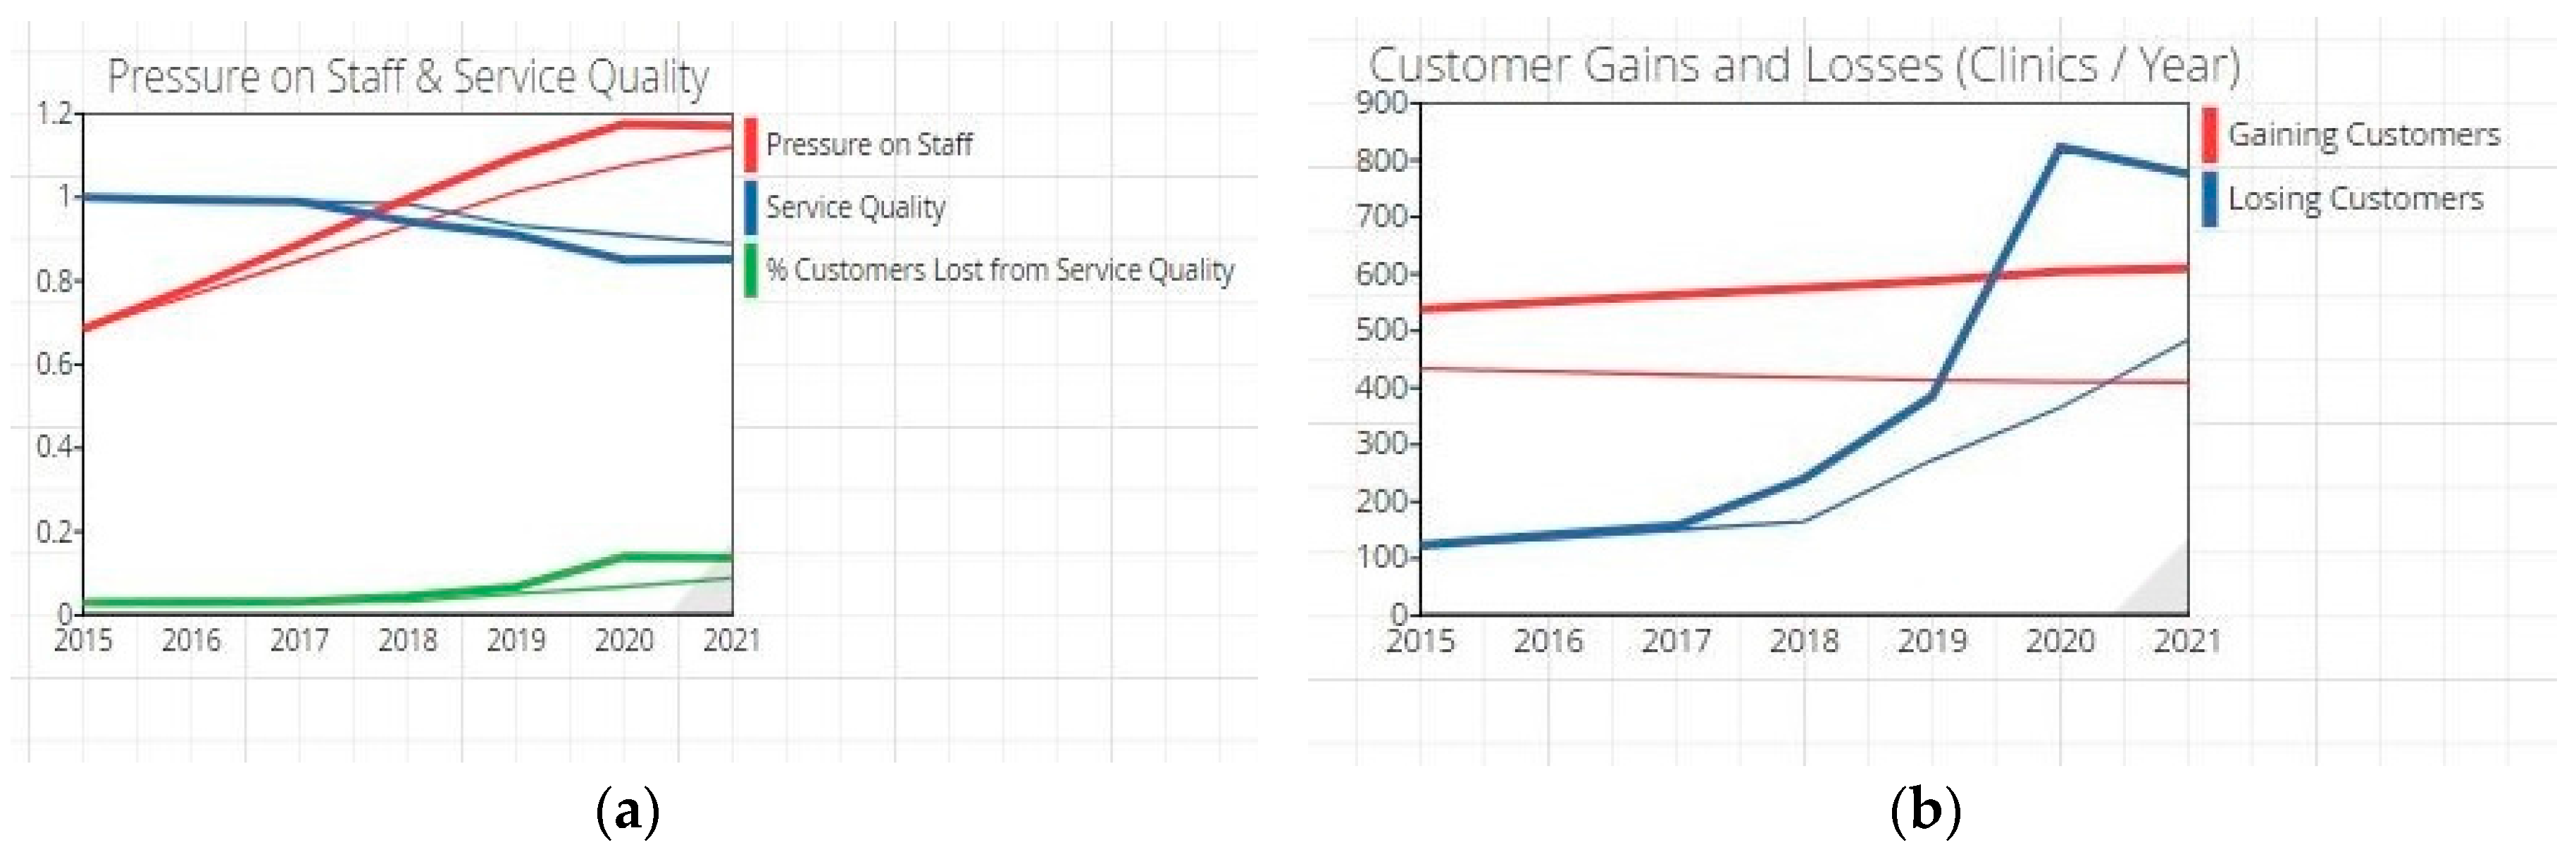
  • In the base case (based on projections the company supplied), by year-end 2021 the company receives 1.02 million cases, and surpasses $20 million in net income. It ends the year with 94.4 FTE employees, barely under its target of 95. However, the charts in Figure 4 for customer gains and losses and service quality indicate a problem for the company. Because of the increase in cases, pressure on staff reaches a level after year 3 where it causes service quality to drop significantly.
  • These factors cause the percentage of customers lost from service quality to rise above a steady rate of 3% to a rate of 8.9%. By the end of 2021, the company is losing more customers than it is gaining. For these reasons, it is clear that because of the specialists’ numbers, the company is not able to handle the growth in number of cases clients send. Following simulations will explore in detail this relationship between different hiring scenarios and performance.

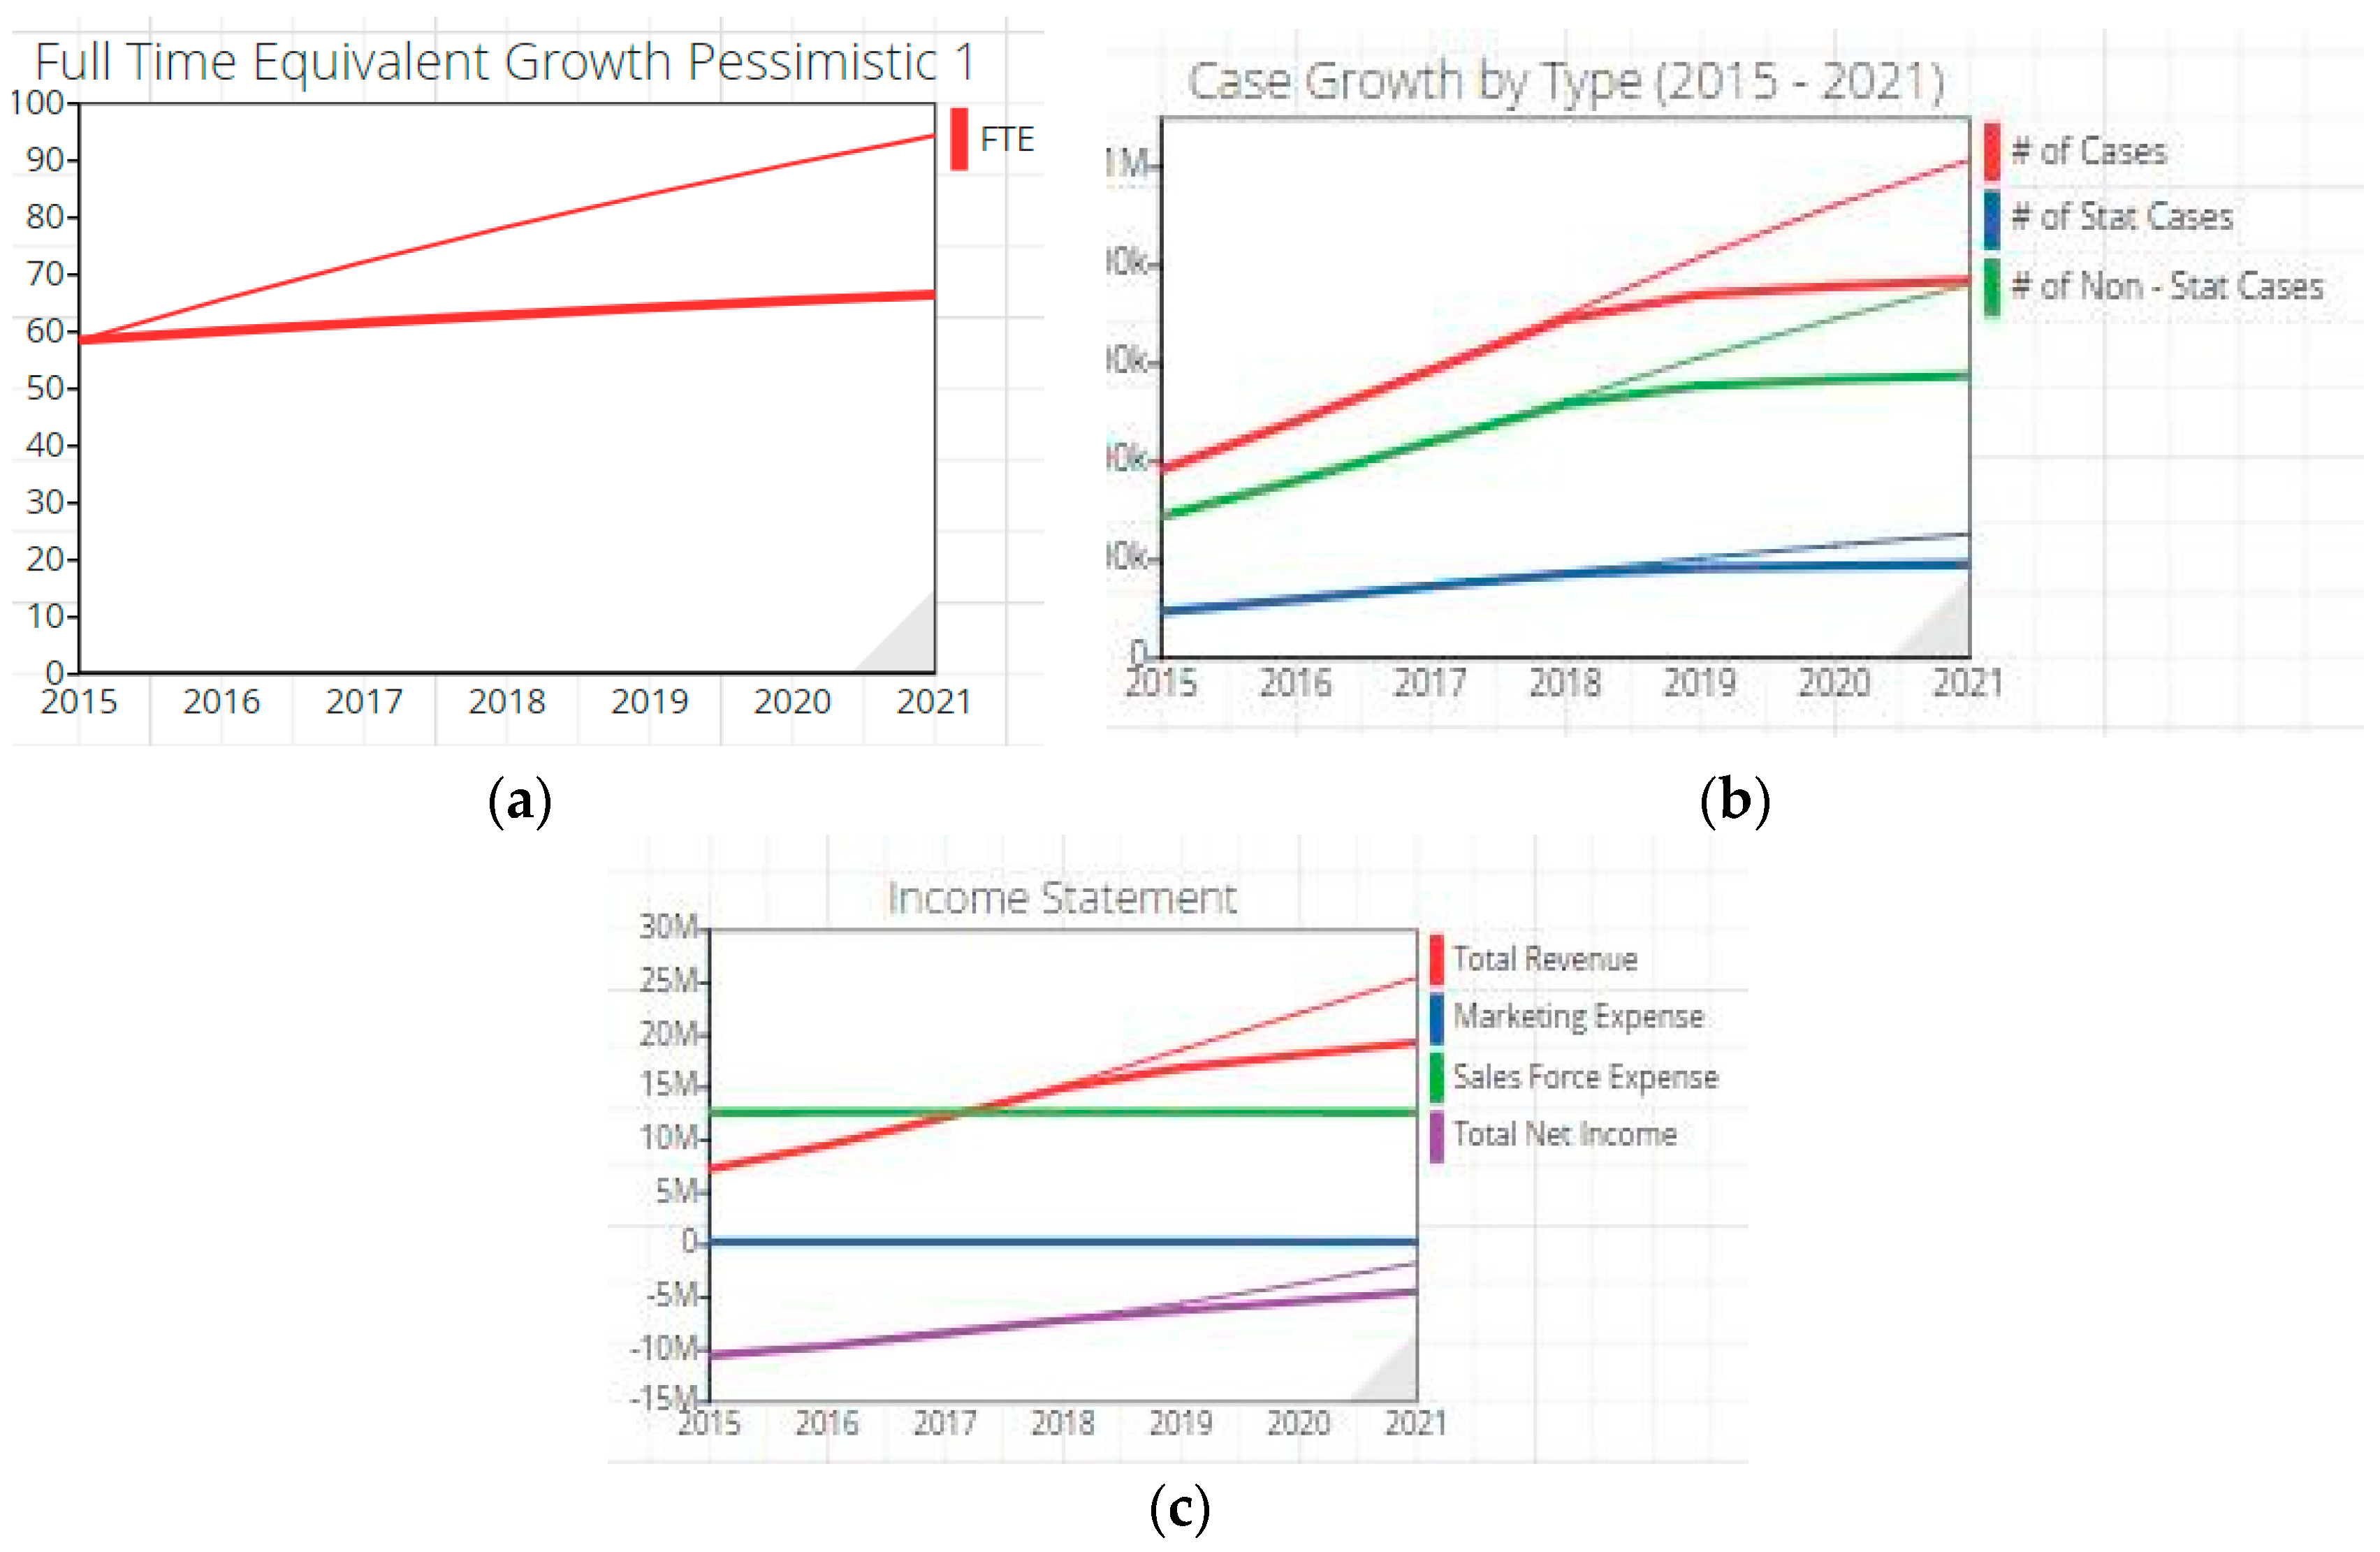
3.1. Pessimistic Hiring Scenario #1

We prepared a scenario of a realistic yet pessimistic outcome for the firm, through adjustments to the decision variables used for the base case. These changes reflect the possibility the firm would be unable to meet its goals of hiring in both total specialists as well as the percentage of full time specialists in the coming years. The company’s stated goal for the mix of specialists on staff was 50% full time, an increase of 20% from the firm’s current situation, so the percentage of full time employees hired in the pessimistic case was conversely reduced to 10%. We reduced the overall number of hires to 17 from 23, were overall hiring to be more difficult (see Table 2).
The reduction of both overall Specialists hired and the percentage of Full Time Specialists hired resulted in a staff with a significantly lower number of Full Time Equivalent employees from the base case—66.5 compared to 94.4 (See Table 3). This resulted in a smaller staff that overall was less efficient. This directly affected the firm’s growth of completed cases, which led to a drop in total revenue to $58 million, and a drop in net income to $13 million. As there was a decrease in hires, in this scenario, we reduced the costs associated with specialists but it had very little effect on overall operating costs.
Figure 5a–c show how various growth areas—in FTEs, cases, revenue and income—are all lower in pessimistic scenario 1. Sysdea, which generated these figures, shows the base case in thin lines and the scenario’s computed values in thick lines.

3.2. Pessimistic Hiring Scenario #2

In pessimistic scenario #2, we held new hires constant at 23/year while we reduced the percentages of hired specialists. Even though the final staff total was equal to the base case, with 192 Specialists employed, there were still significant differences in performance caused by the lower percentage of Full Time Equivalent employees hired. The FTE employees totaled 76.6 at year-end of 2021 in simulation #2. This is better than pessimistic simulation #1’s FTE value of 66.5, but still worse than the base case’s total of 94.4 FTE employees. Table 4 shows specific measures of performance in the two pessimistic cases compared with the base case values. Both are inferior to the base case, with pessimistic scenario #1 being worse. These findings show that a decrease in the overall number of hires/year would have a large effect on total net income; however, performance is further worsened if management reduces the percentage of full time specialists hired. This is because the staff as a whole can handle fewer cases, which raises pressure on staff, reduces service quality, and increases the number of customers lost.

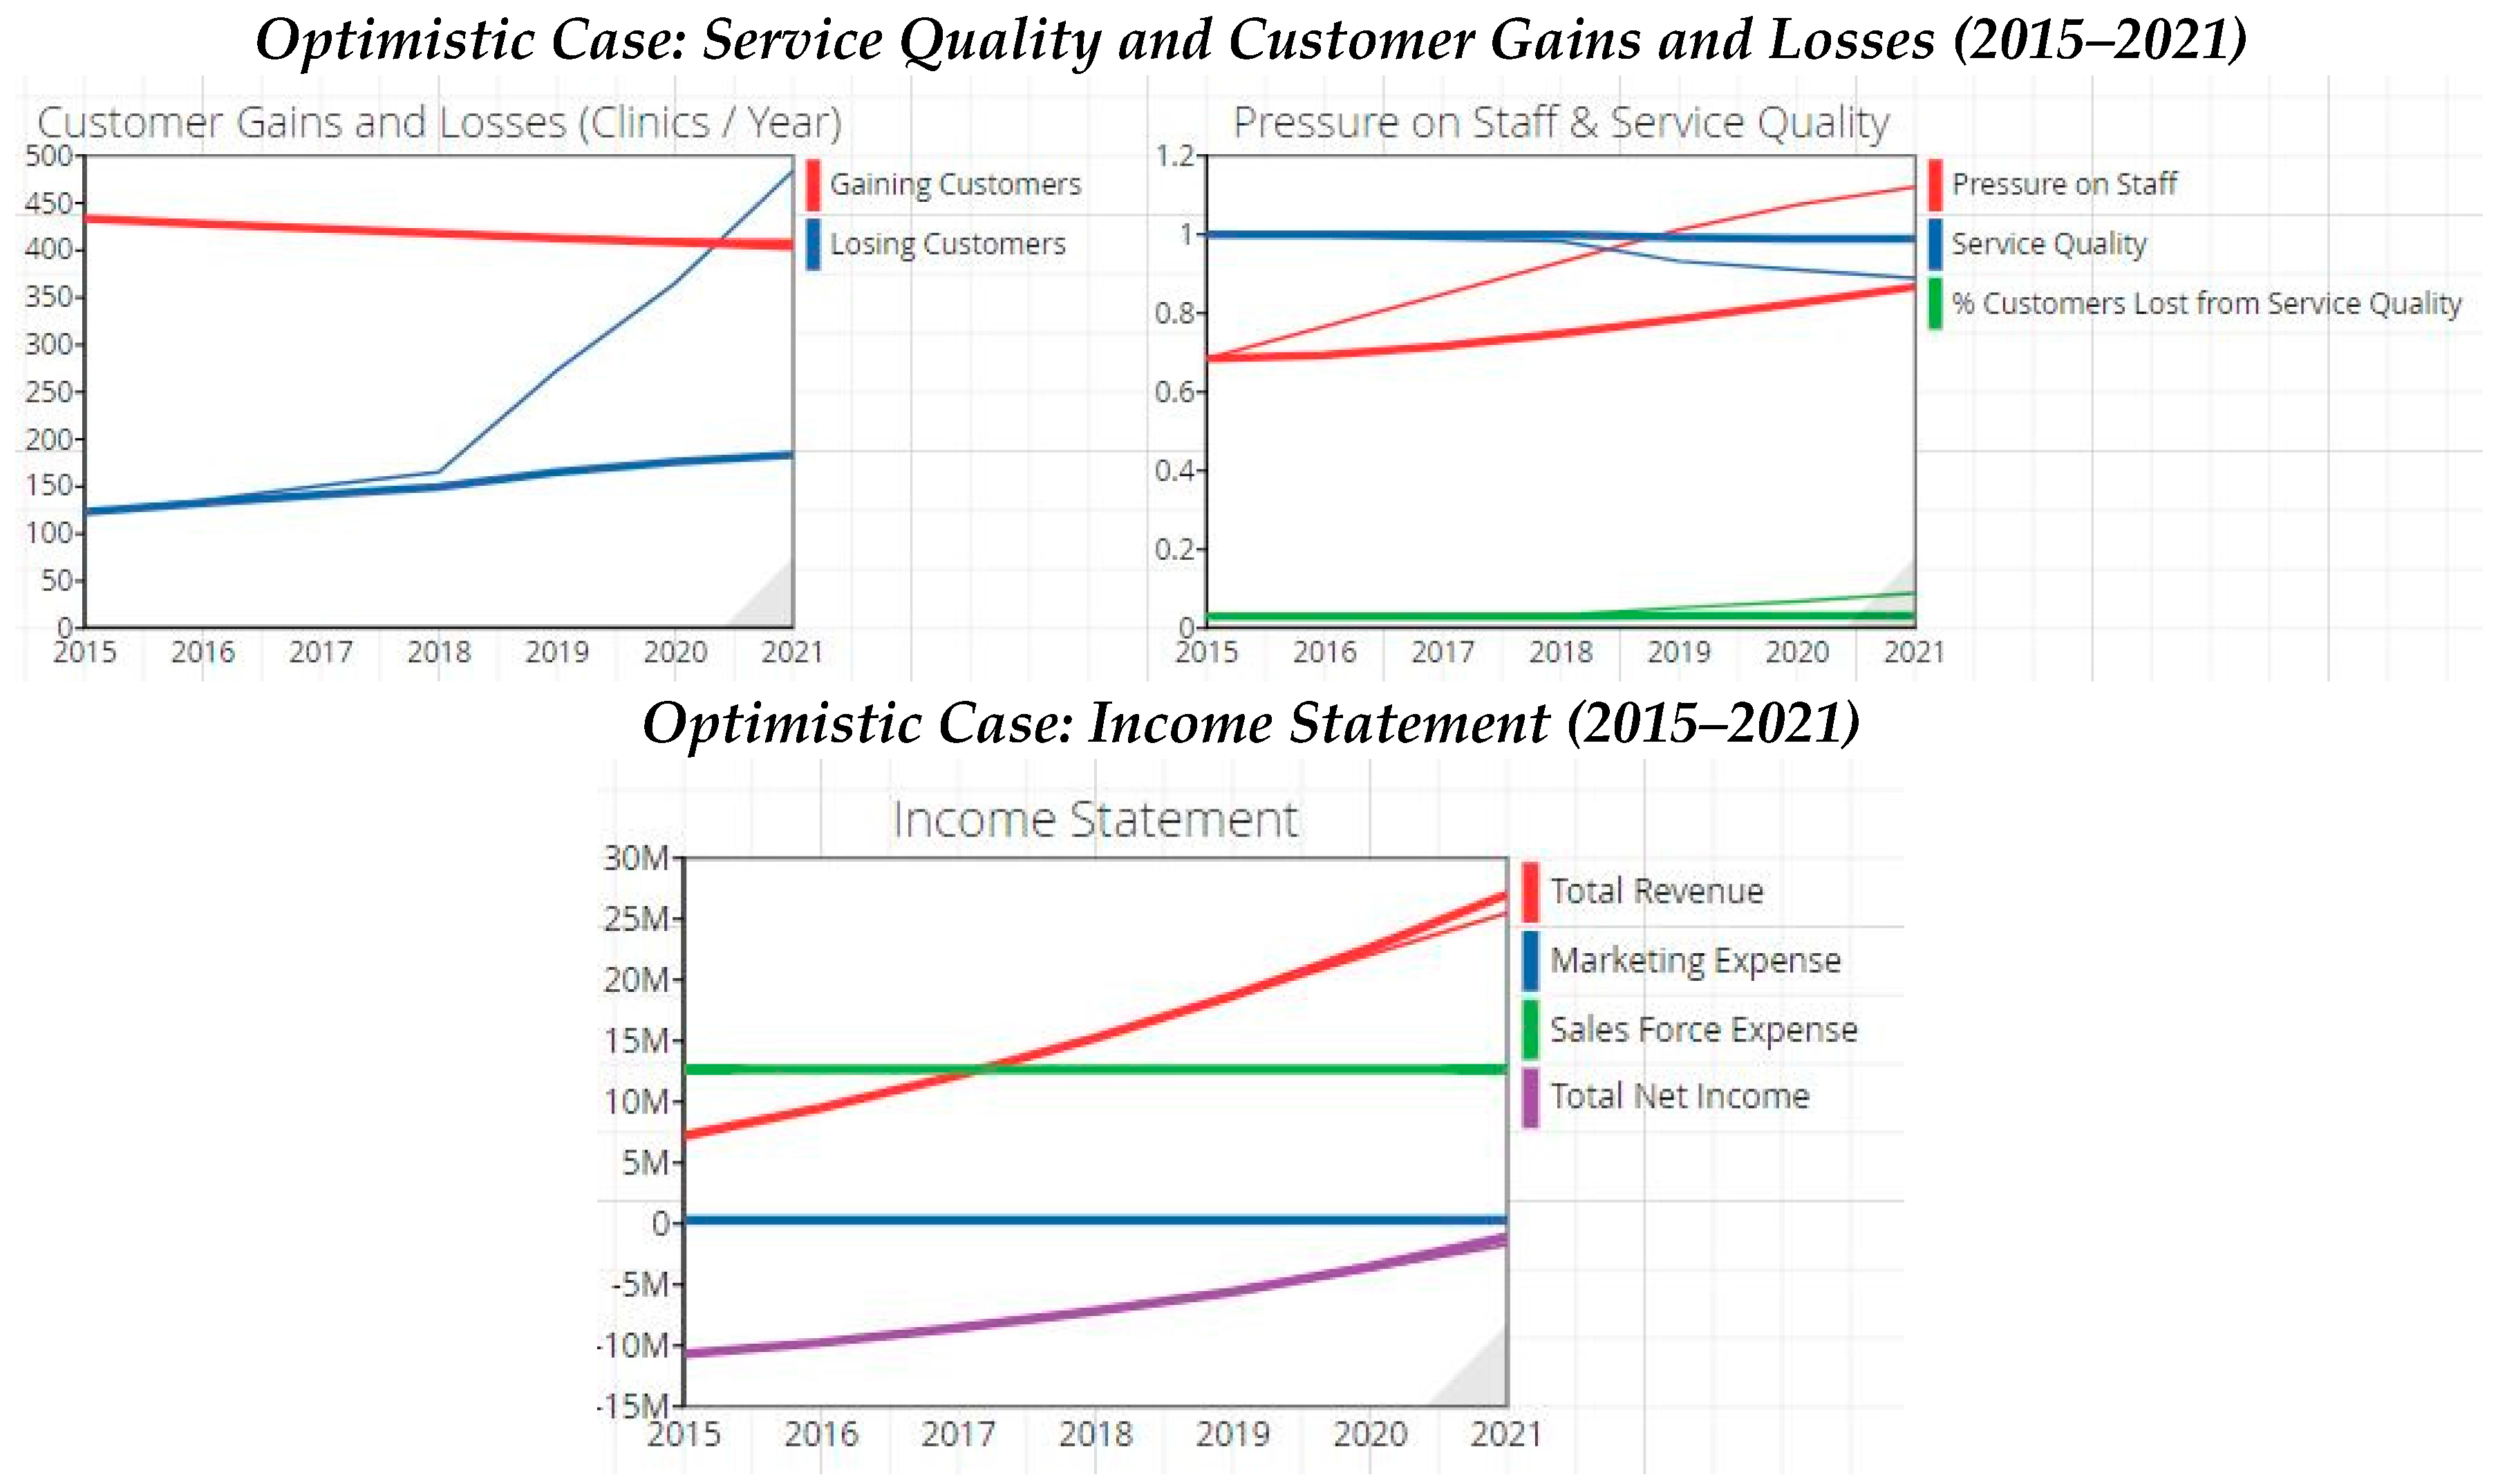
3.3. Optimistic Hiring Scenario

In this scenario, we continued our focus on the supply side of customer service, trying to have enough specialists on staff so that the company could minimize the number of customers leaving. This would allow the company to increase sales by increasing the number of cases from existing customers, rather than having to acquire new customers. This scenario attempted to hire enough specialists to keep service at a constant level. With a constant service level, clinics would be happy with the service they are receiving, and be more likely to stay.
Simulation revealed that hiring 29 specialists per year resulted in a constant level of service quality. This assumed that the company held its marketing expense at $300,000 and its sales force at 150 individuals. For this case, we raised the percentage of full time employees hired to 50%, which the company reported as its goal level for full time employees. Table 4 shows the decision variables for the optimal hiring case and results for key factors at year-end 2021.
The charts in Figure 6 show that by 2017 the pressure on staff starts increasing from the increased cases sent by clients, driving down service quality. However, because the company has more specialists on staff, these rates increase and decrease at much lower rates than they do in the base case, leading to a lower percentage of customers lost. This helps increase revenues in the last two periods by almost $5 million, which is a significant increase from the base case. However, these decisions do not significantly increase the expenses relative to total revenue. In the long term, these decisions would require increasing the hiring rates of more specialists, which would be difficult because of the limited worldwide pool of specialists. We will have more to say about this in the discussion.

3.4. Marketing Scenarios

3.4.1. Assumptions

For the marketing case, we decided to delve further into what drives inflows and outflows of clients, and how decisions by the company can affect these flows. The company currently has 4100 clients, which is the result of prior investments made in its resources. The company is acutely aware that the overall number of specialists has been growing at a small but steady rate every year. It can only grow as fast as the universities can produce specialists. Without gaining new specialists or entering different telemedicine fields it will be difficult for the company to increase its growth strategy and retain clients.
The company currently invests about $300,000 yearly in marketing, with small increases in this budget annually. The company uses marketing to make the industry aware of its presence, and to teach them about telemedicine and its benefits. It uses the sales force to keep relationships with current and prospective clients; the sales reps have a base salary of $40,000 plus commissions.
If the clients are not satisfied with its service, they could potentially switch to a competitor. Switching costs for the clients are low, because the clients do not have to invest in the equipment to perform telemedicine. The monetary loss of a client is high to this company, as it invests about $10,000 in training and equipment for each specialist hired to consult for clients. Therefore, client and specialist retention is important.

3.4.2. Marketing Scenario 1

One management decision in this scenario was to increase marketing expense, which should increase awareness of the company. The goal of this scenario was to show what happens when the company tries to gain more customers without being able to increase specialists.
Table 5 shows that total revenue increased and the company gained a larger number of clinics over the base case. This makes sense as the larger investments in resources such as marketing and sales force help drive growth. However, while these figures increased, this scenario did not have a good outcome. Clients gained created too much pressure on staff, which in turn reduced service quality (see Figure 7a). The specialists could not handle the increase in caseload, and the outflow of customers increased more than the inflow of customers did (see Figure 7b). The increased spending on marketing, sales salaries and hires resulted in significantly increased operating costs. This caused the net income for the company to decrease (see Figure 8). These results show the key dilemma and trade-off in this situation—to keep up with growth, management would have to obtain more specialists to prevent service quality from declining, but such specialists are in very short supply.

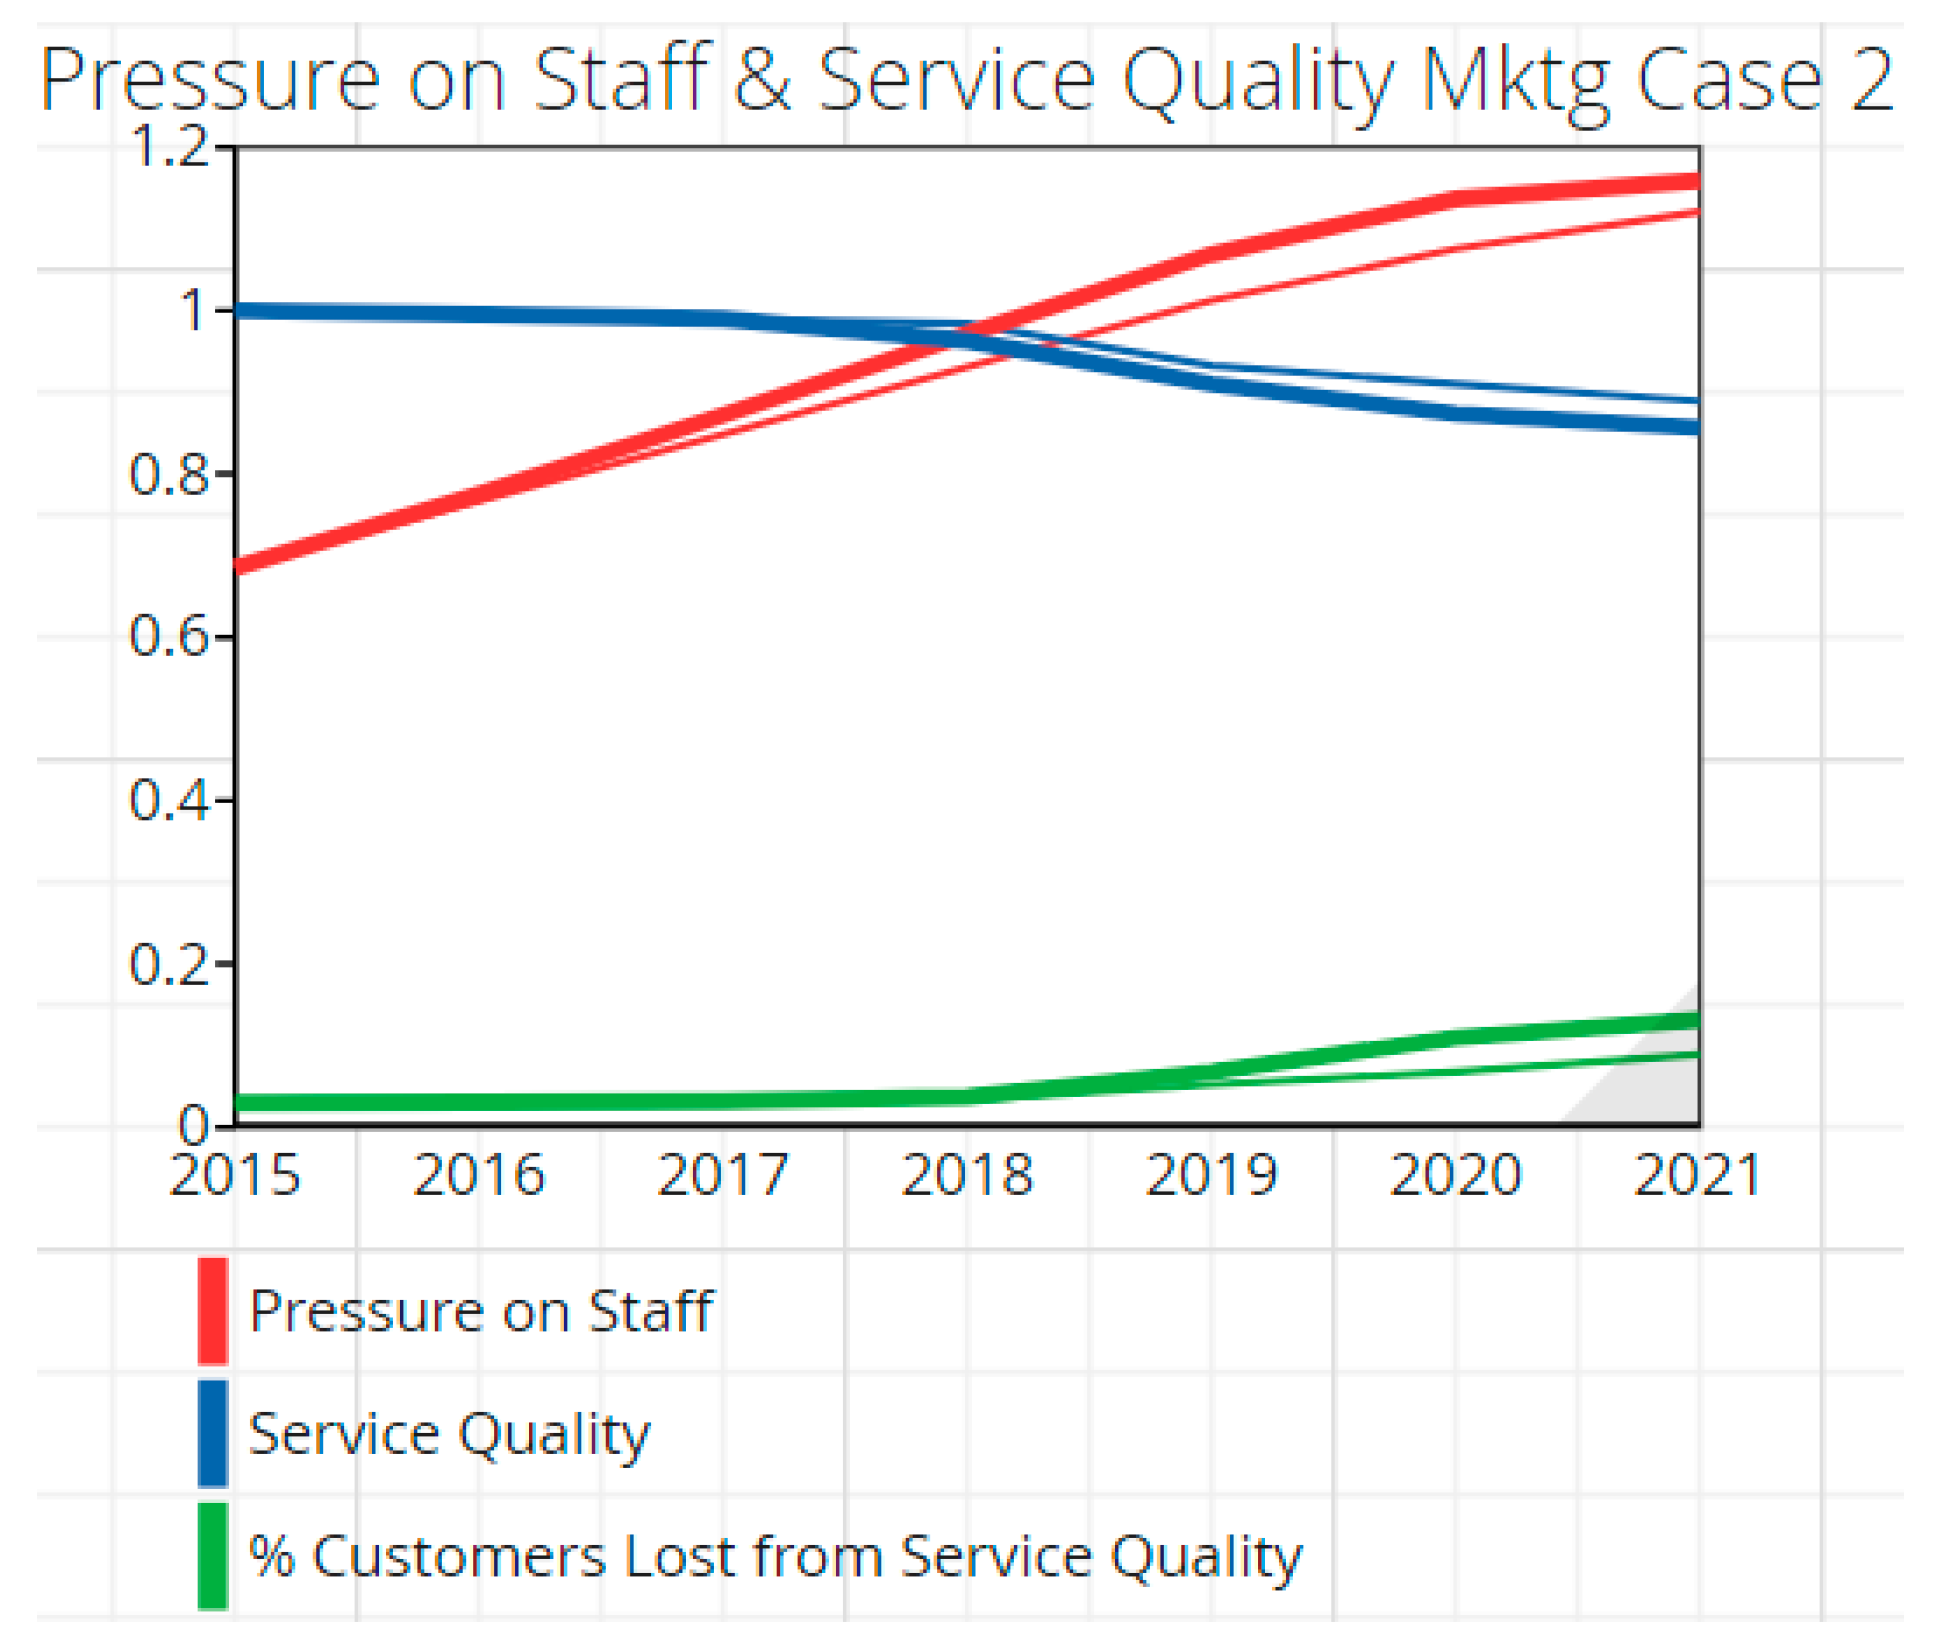
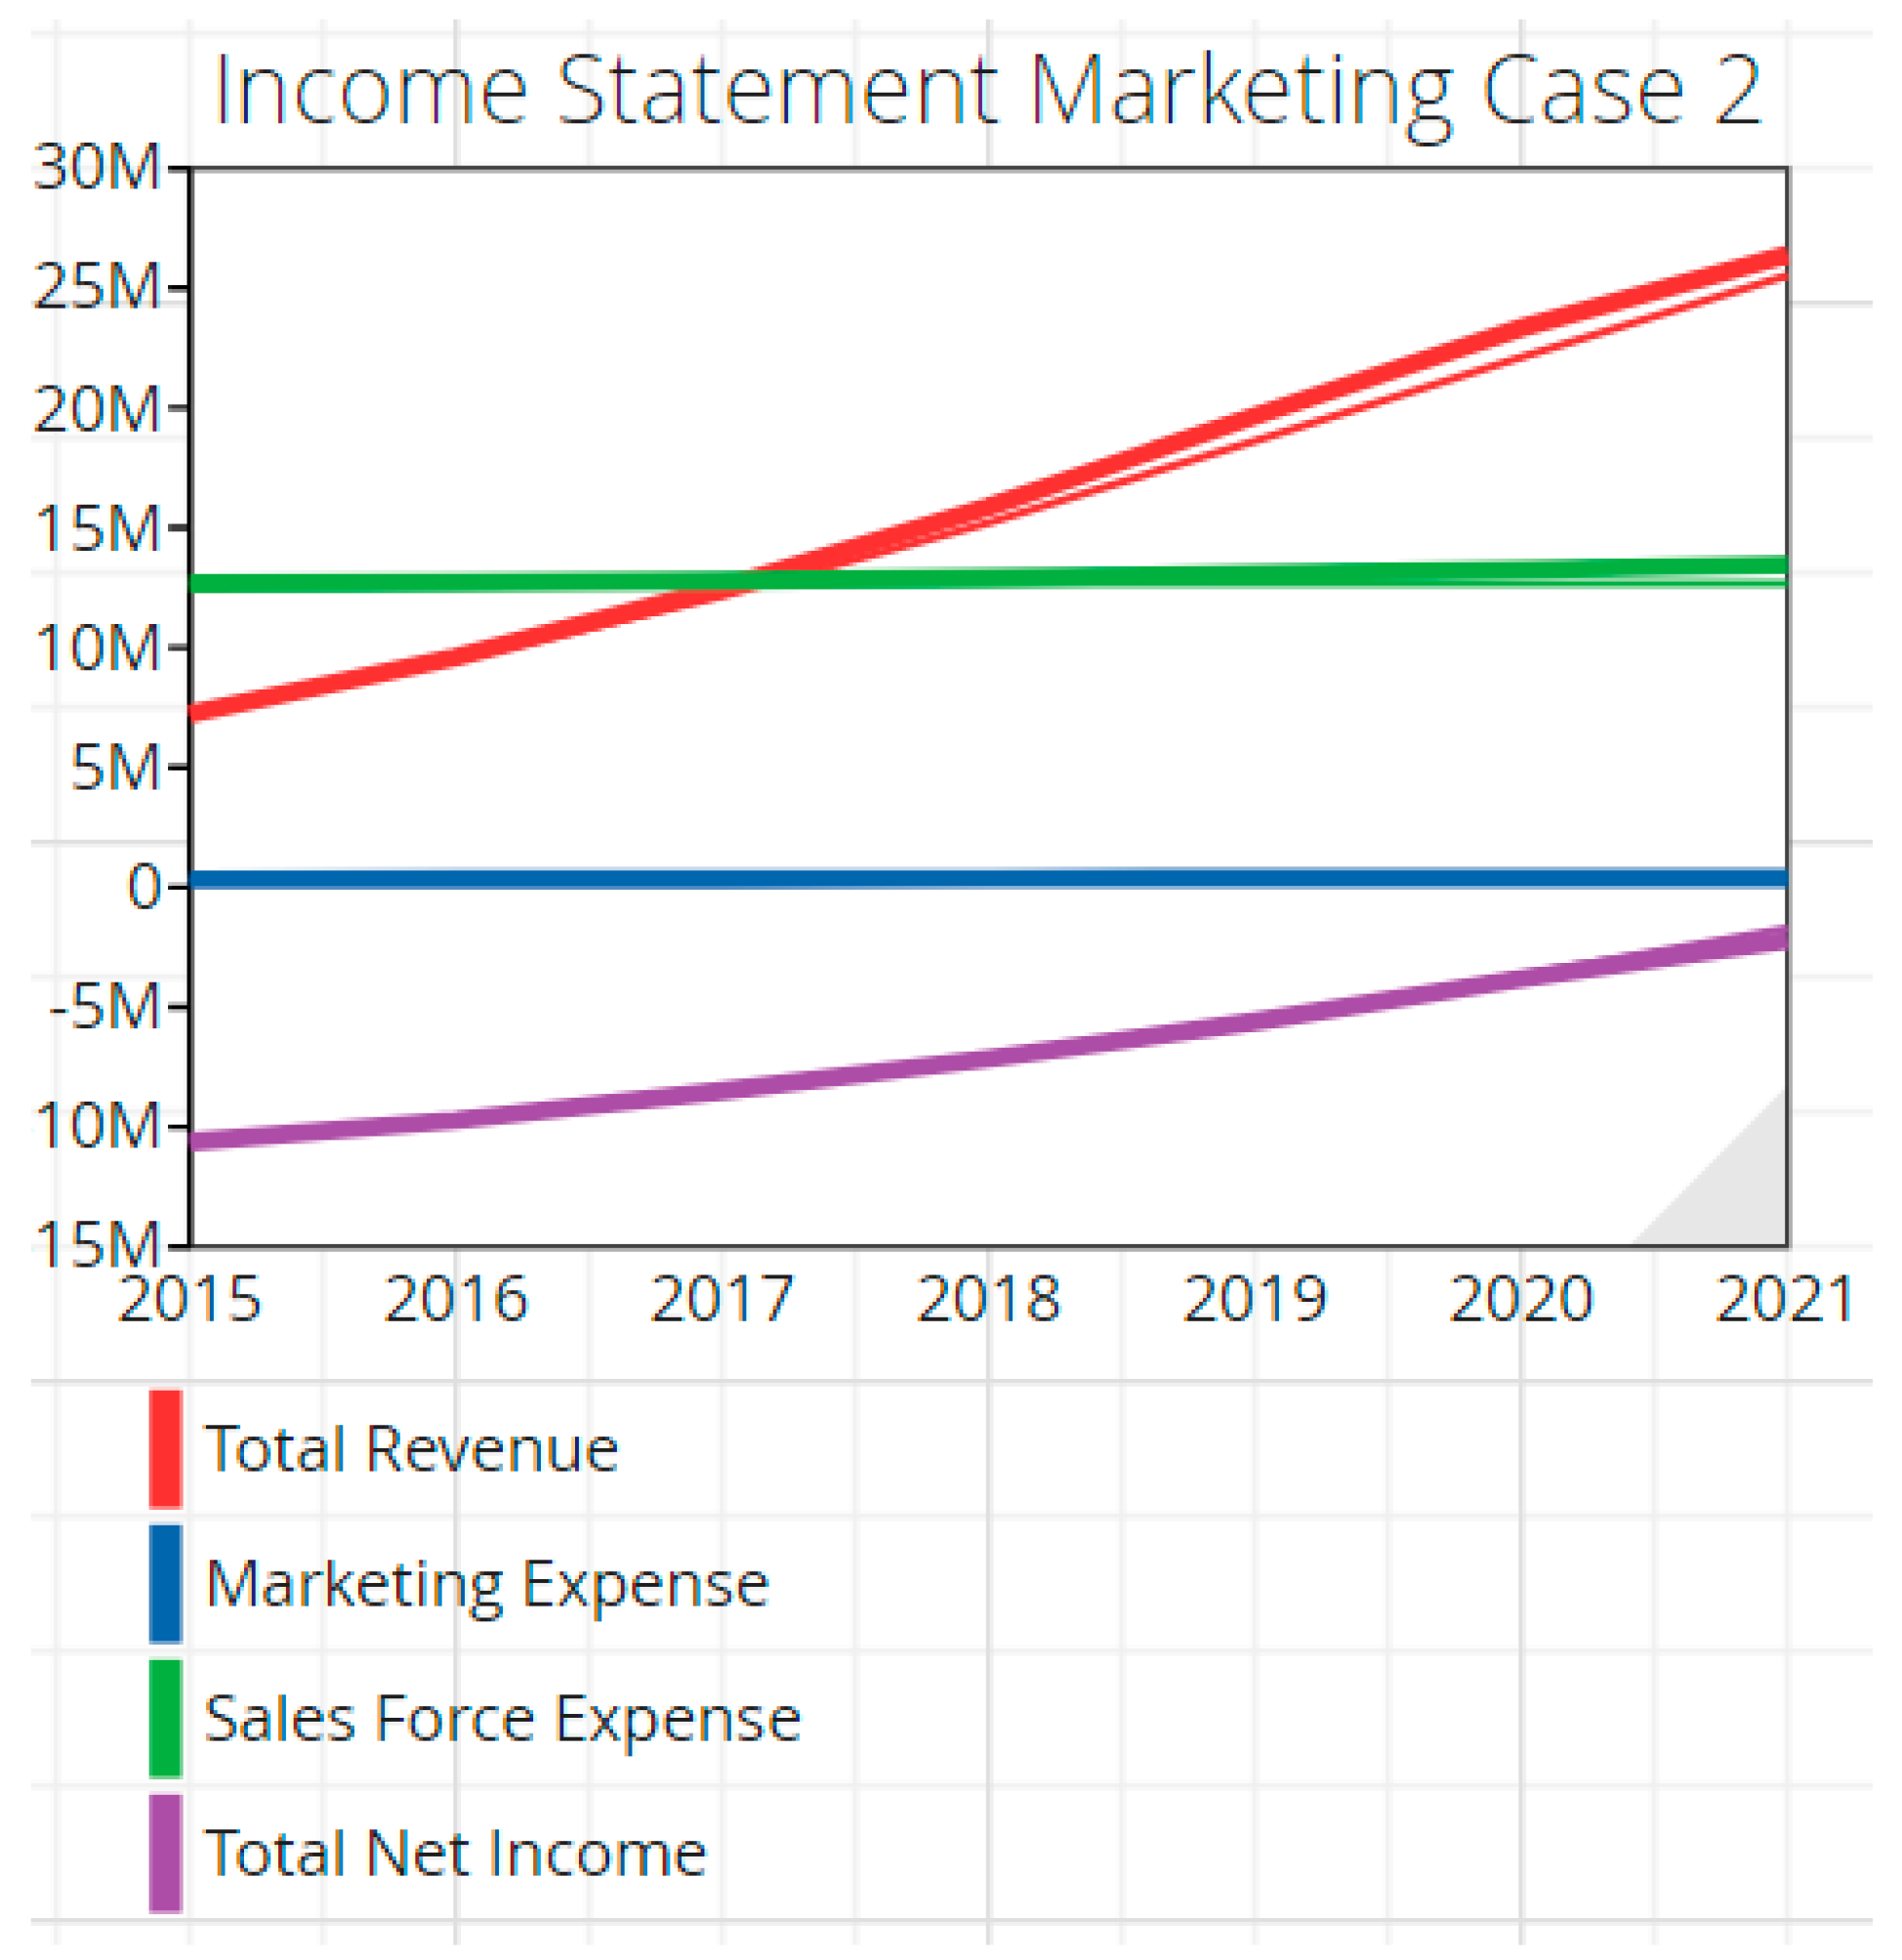
3.4.3. Marketing Scenario 2

In marketing scenario 2, we wanted to test a less aggressive approach towards growth. We decided to not increase the sales salaries, and only increase marketing and the amount of hires to the sales staff. Instead of $25,000 added per year to marketing, we decreased it to $15,000. We decreased the hiring of staff from one to .5 per year. At first, the company was winning more clients than it was losing, but as in the first case, the pressure on the staff increased enough to cause the customers lost to surpass the customers gained (see Figure 9). The company could take this approach if it knew it would have to hire more specialists in the future, so that it could well service the clients gained. This would be tricky and management would have to do it before the clients losses increased too much. By implementing a less aggressive approach, the company was able to end 2021 with a net profit over the base case (see Figure 10). We do not believe that would continue, as the net income should continue to decrease. Overall, these simulations show that the company would be ill advised to grow too quickly using sales or marketing without investing in more specialists.

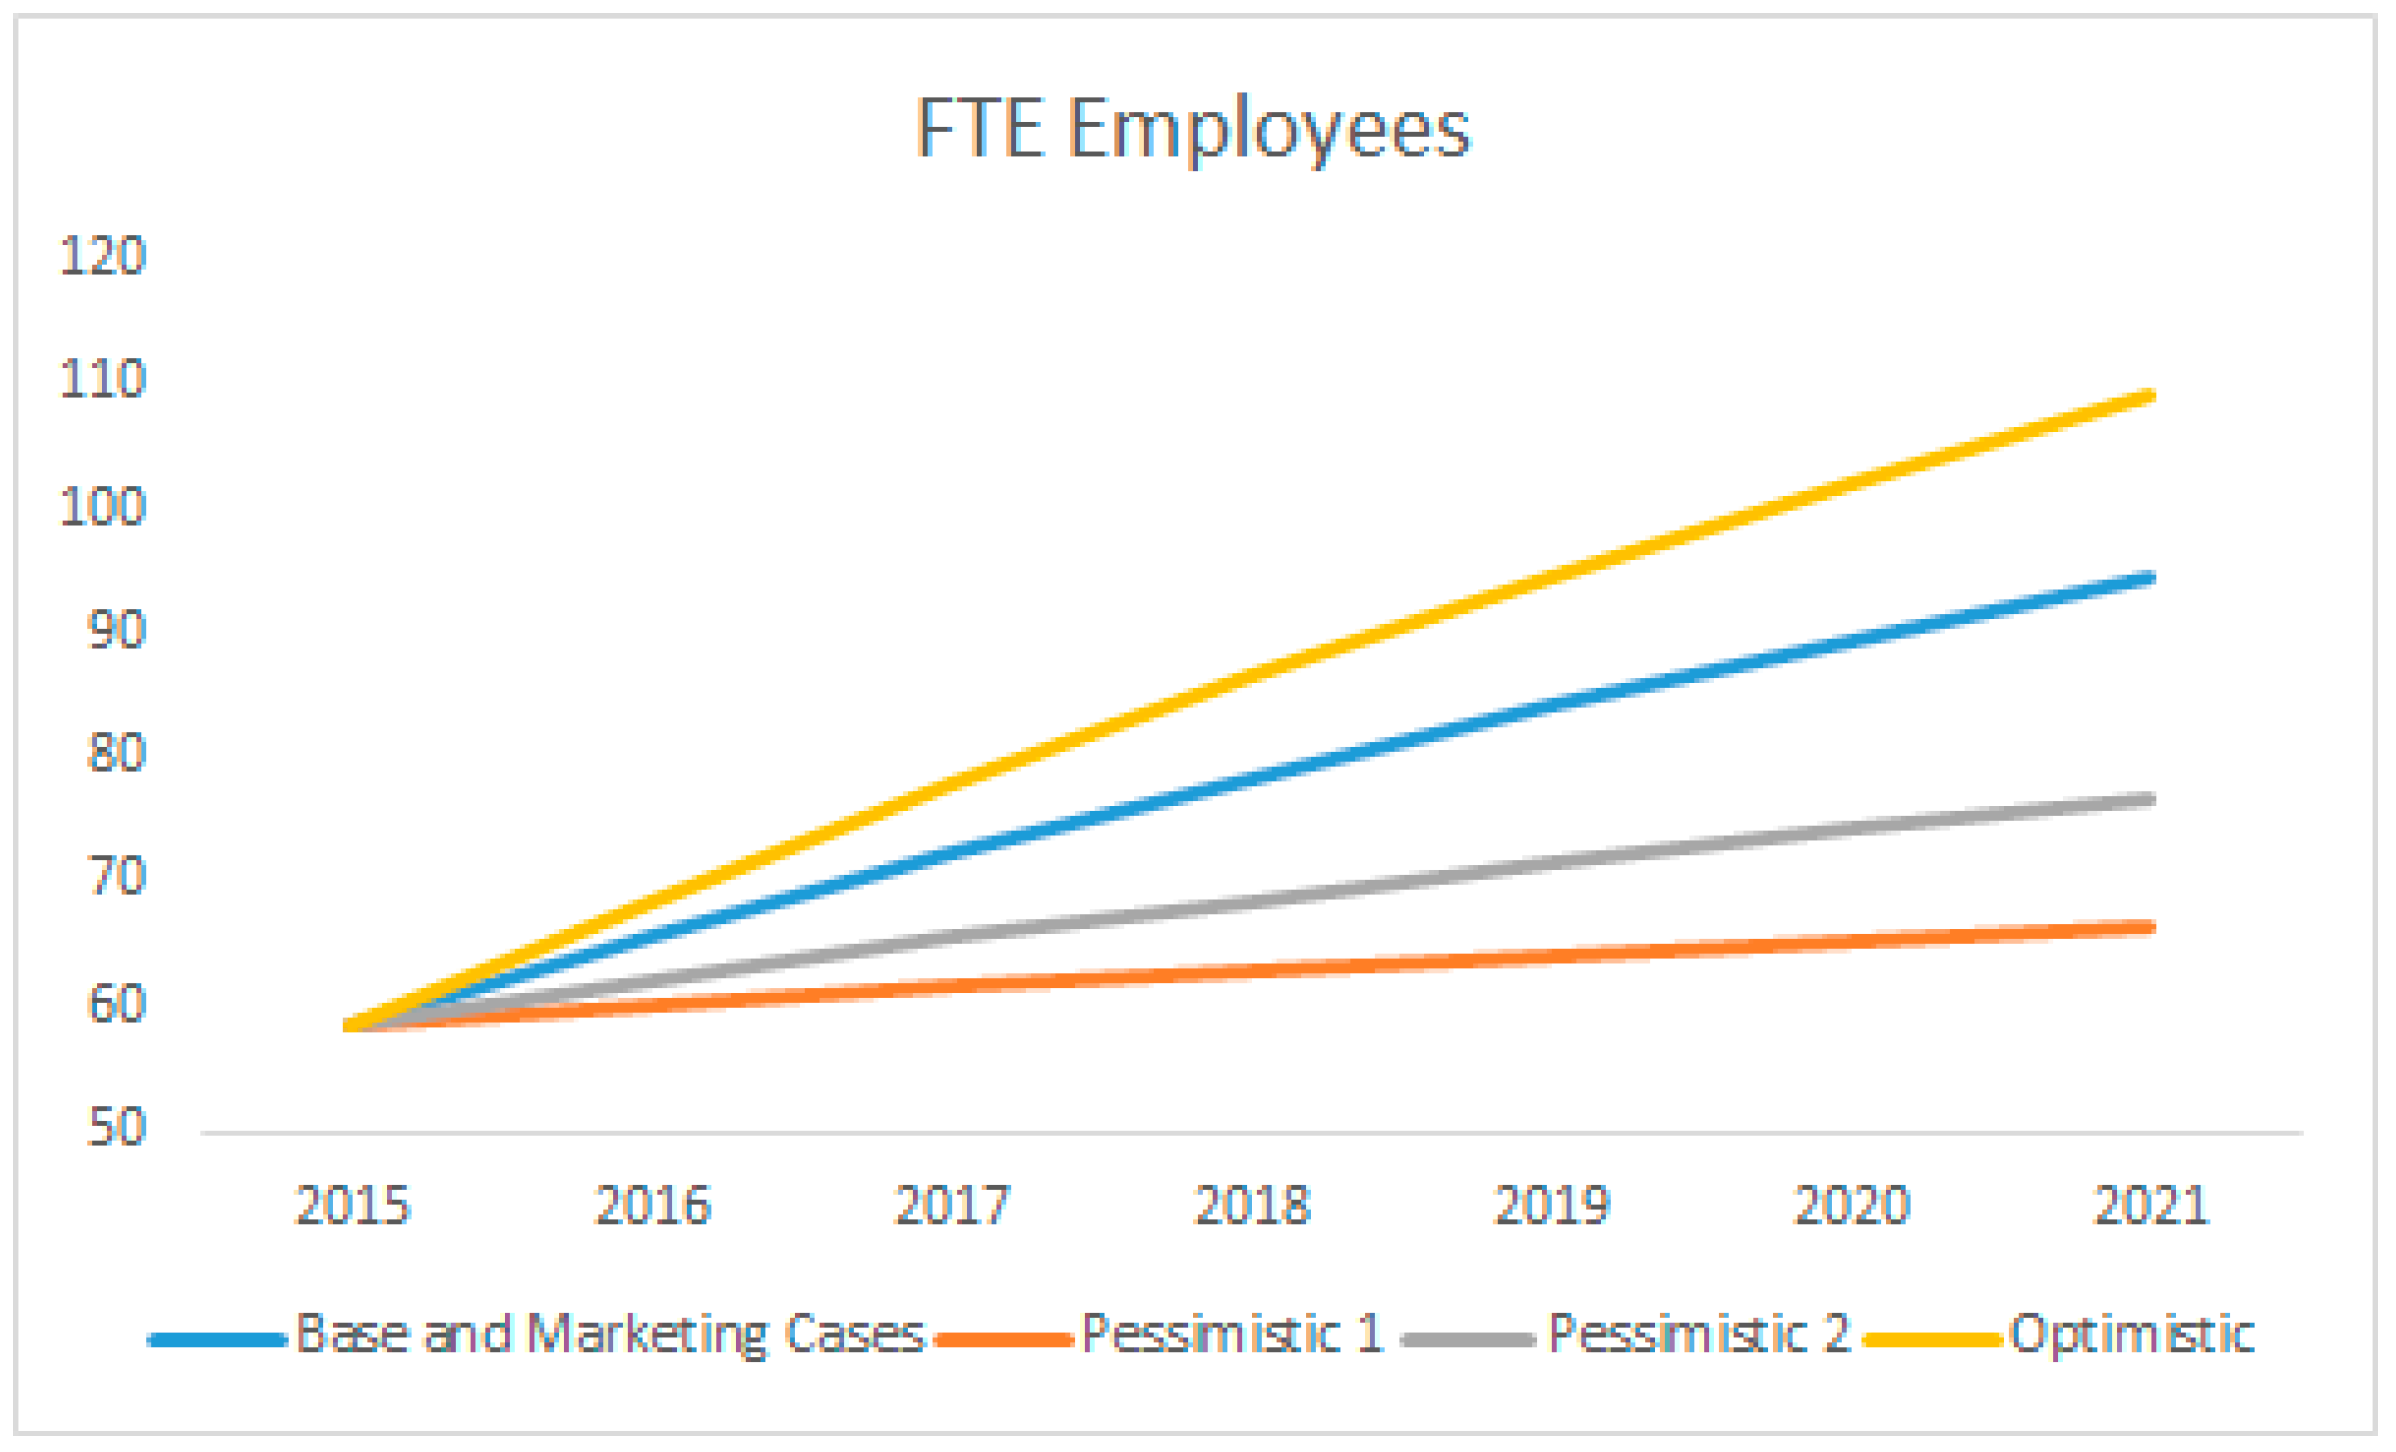
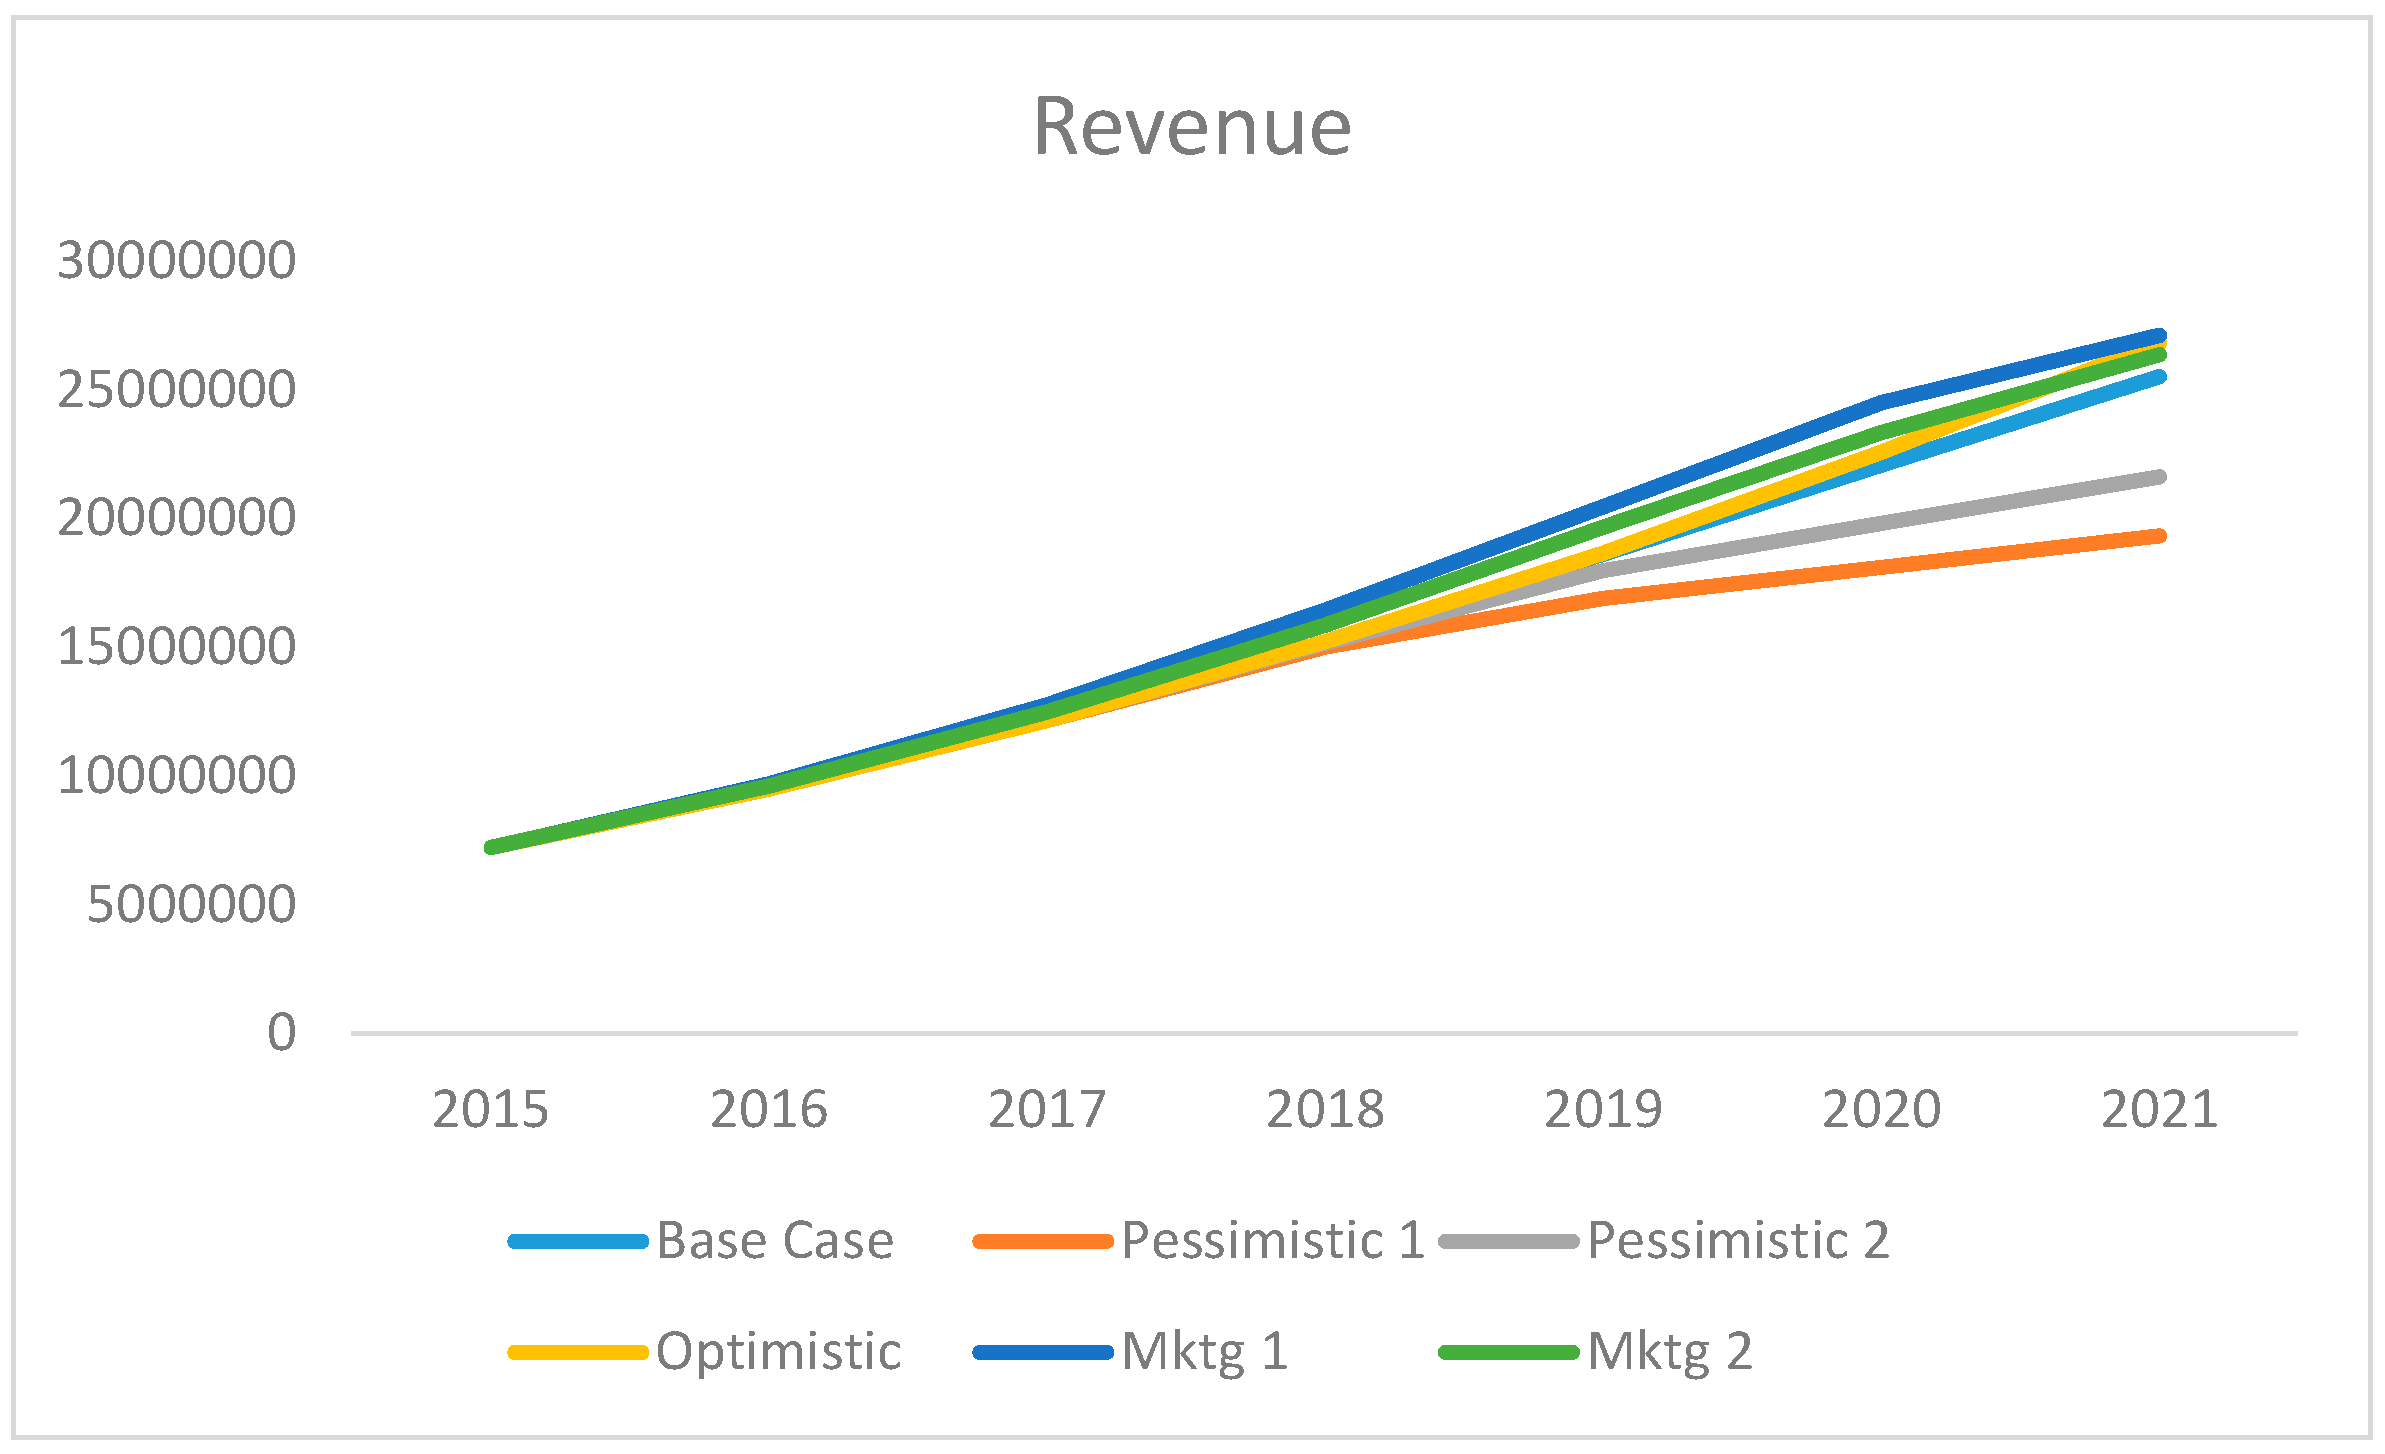
3.5. Comparison of Scenarios

We could compare the scenario results along many dimensions, but we will limit ourselves to three measures that are operationally or financially important to any business: Pressure on Staff, FTE Employees, and Revenue.

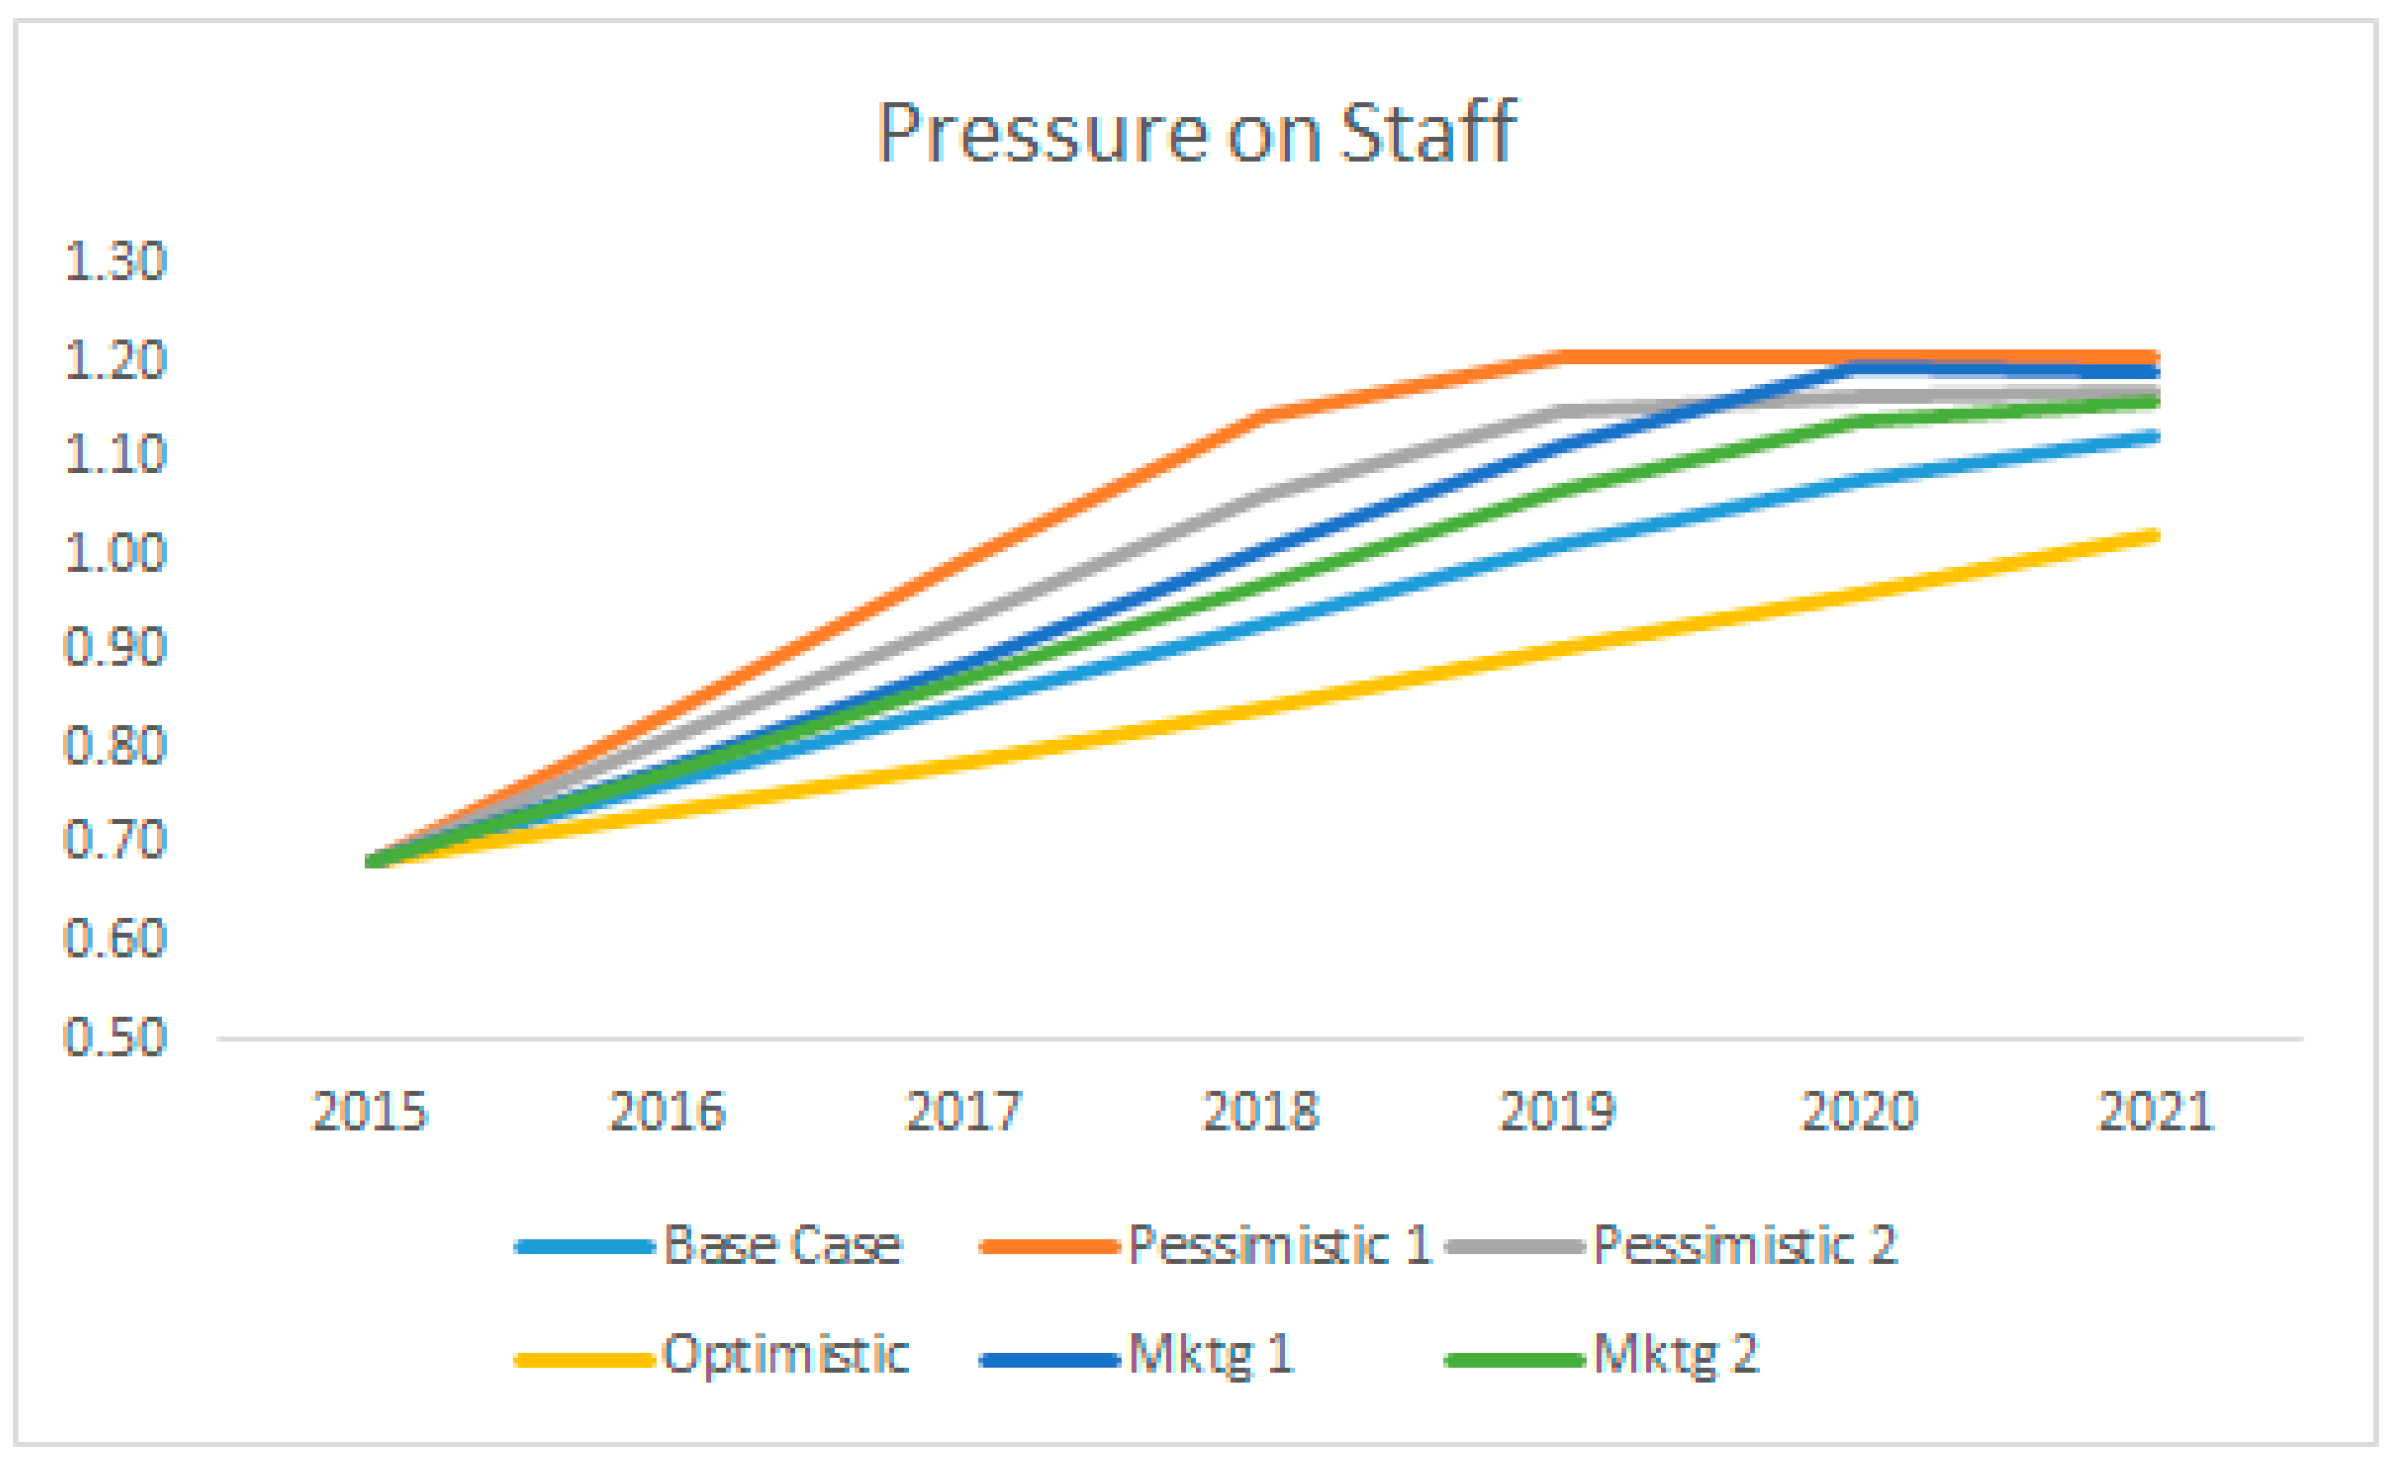
3.5.1. Pressure on Staff

As Figure 11 shows, adequate hiring (Optimistic scenario) will produce the least, and inadequate hiring (Pessimistic 1) will produce the most, pressure on staff. However, as we have stated several times, the Optimistic scenario’s hiring is not realistic. Interestingly, the firm’s current policy, captured in the Base Case, seems to be a good adaptation to the current situation. Its pressure on staff is too high, but by the end of the period the base case’s pressure on staff is lower than both the aggressive marketing scenario (Marketing Scenario #1) and the Pessimistic Hiring scenario. Nevertheless, the good result from the Optimistic Hiring scenario clearly points to the need for firms in this industry and specialty to work somehow to increase the available specialists. Anything that would move the firms closer to the Optimistic hiring scenario would likely produce better results, i.e., lower Pressure on Staff.

3.5.2. FTE Employees

We have seen in the various scenarios that full time specialists can shoulder a much larger burden of cases. We have seen that the Optimistic Scenario, which seeks to hire the same percentage of full time specialists as the base case does, but with a larger absolute number (29 instead of 23), is superior if the firm wants to have sufficient full time capacity to meet its customers’ needs. However, we have also seen that the shortage of specialists makes even this modest 6-person hiring increase unlikely. Figure 12 shows how the Optimistic Hiring scenario produces the most full time specialist capacity, but it also shows that the base case (which shares the blue curve in Figure 12 with the two Marketing scenarios) is a reasonable adaptation, giving a reasonable ratio of FTE specialists to Pressure on Staff. However, perhaps a greater implication is that firms in the industry need to devise strategies to increase the number of specialists produced by universities.

3.5.3. Revenue

Figure 13 compares how the six scenarios generate revenue. The two Marketing scenarios (dark blue and green curves in the figure) generate the most; however, as we saw in Figure 11, at the cost of high Pressure on Staff and lower Service Quality. The figure also shows that neither Pessimistic Hiring scenario (orange and gray curves in the figure) provides sufficient capacity to generate high revenues. Again, the firm’s current policy, as captured in the base case (light blue curve in the figure), seems to be a good, adaptive middle ground, but does not allow for growth beyond the current performance.

4. Conclusions

Similar to what Senge [25] called a “Limits to Growth” systems archetype, the restricted pool of specialists is the resource in this industry that governs performance and growth in the short and long term. The company may be able to find success through using incentive programs, better pay and benefits, or striving to create a desirable work culture and environment to try to get the current scheduled and non-scheduled specialists to transition to full time workloads. Additionally, as specialists often work for multiple firms, converting part time specialists to full time ones, or even converting them from unscheduled to scheduled specialists, may decrease a specialist’s desire to take on cases from rival firms. This would increase the company’s annual case capacity and decrease competitor’s ability to have access to the firm’s specialists. Therefore, any company in this industry should focus efforts on its retention and recruiting policies. If the company could improve its retention, it would make hiring more efficient, and slightly reduce the risk of the limited talent pool. However, these are obviously the approaches of a mature industry with high levels of supplier power [26]—stealing extremely scarce labor supply from other firms, or trying at all costs to hold on to labor supply currently employed. Should these approaches fail, we have doubts about the growth potential of this business, at least in the short term. In the longer term, it might be possible to get universities to produce a higher number of specialists.
As Warren [27] has pointed out, capabilities in the Resource-Based View of the Firm can confer competitive advantage if they help firms do activities in some combination of quickly, well, or efficiently. Veterinary telemedicine companies should reach out to the universities producing specialists to develop relationships with both the programs and students. With a proper amount of organizational learning [25,27], this could lead to the development of a new capability—being able to access and recruit new hires more quickly, better and more efficiently.
It is clear that the number of specialists who become available every year in this field limits the veterinary telemedicine industry. This industry has a potentially healthy outlook, as observers expect demand for the industry’s services to continue to grow, but unless its members, such as the focal company examined in the present paper, solve the issues of specialist supply, the industry is unlikely to realize its growth potential. From the insights gained through the process of modeling the company, we recommend the following actions:
  • Focus on creating relationships with universities that produce specialists.
  • Try to improve the hiring rate of current specialists through incentive programs.
  • Develop incentive programs to persuade scheduled and non-scheduled specialists to switch to full time.
  • Pursue greater investments in marketing and sales force only if the company can hire specialists to keep up with the growth.
  • Scale this telemedicine business model to other specialties in veterinary medicine, to reduce the unique risks created by the lack of specialists in this particular specialty.

Author Contributions

Tristan Jordan gathered data, designed the initial model and wrote the first draft of the paper. John Voyer altered and re-ran the model, added several figures, and wrote the final version.

Conflicts of Interest

The authors declare no conflicts of interest.

References

  1. Meher, S.K.; Rath, B.K.; Kailash, S. Telemedicine: AIIMS experience. Ukr. J. Telemed. 2008, 6, 387–404. [Google Scholar]
  2. Devi, S.; Singh, R.D.; Ghasura, R.S.; Sharma, M.K.; Sharma, M.C. Telemedicine: A new rise of hope to animal health care sector-A Review. Agric. Rev. 2015, 36, 153–158. [Google Scholar] [CrossRef]
  3. Papageorges, M.; Hebert, P. Other telemedicine applications. Clin. Tech. Small Anim. Pract. 2001, 16, 125–126. [Google Scholar] [CrossRef] [PubMed]
  4. Papageorges, M. Foreword. Clin. Tech. Small Anim. Pract. 2001, 16, IV. [Google Scholar] [CrossRef]
  5. Papageorges, M. Introduction. Clin. Tech. Small Anim. Pract. 2001, 16, 87–89. [Google Scholar] [CrossRef] [PubMed]
  6. Poteet, B. Veterinary Teleradiology. Vet. Radiol. Ultrasound 2008, 49, S33–S36. [Google Scholar] [CrossRef] [PubMed]
  7. Warren, S.; Nagl, L.; Schmitz, R.; Yao, J.; Hildreth, T.; Erickson, H.; Poole, D.; Andresen, D. A distributed infrastructure for veterinary telemedicine. In Proceedings of the 25th Annual International Conference of the IEEE Engineering in Medicine and Biology Society, Cancun, Mexico, 17–21 September 2003. [Google Scholar]
  8. Forrester, J. Industrial Dynamics; MIT Press: Cambridge, MA, USA, 1961. [Google Scholar]
  9. System Dynamics Society. Introduction to System Dynamics. Available online: https://www.systemdynamics.org/what-is-sd (accessed on 10 January 2018).
  10. Forrester, J.W.; Senge, P.M. Tests for building confidence in system dynamics models. In System Dynamics: TIMS Studies in the Management Sciences; Legasto, A., Forrester, J., Lyneis, J., Eds.; North-Holland: New York, NY, USA, 1980; pp. 209–228. [Google Scholar]
  11. Homer. Why we iterate: Scientific modeling in theory and practice. In System Dynamics Review; Homer: Los, Griechenland, 1996. [Google Scholar]
  12. Morecroft, J.D.W. Rationality in the analysis of behavioral simulation models. Manag. Sci. 1985, 31, 900–916. [Google Scholar] [CrossRef]
  13. Randers, B.v.J. Elements of the System Dynamics Method; MIT Press: Cambridge, MA, USA, 1980. [Google Scholar]
  14. Richardson, G.P. Feedback Thought in Social Science and Systems Theory; University of Pennsylvania Press: Philadelphia, PA, USA, 1991. [Google Scholar]
  15. Sterman, J. Business Dynamics: Systems Thinking and Modeling for a Complex World; Irwin/McGraw-Hill: Boston, MA, USA, 2000. [Google Scholar]
  16. Sterman, J. System dynamics modeling: Tools for learning in a complex world. Calif. Manag. Rev. 2001, 43, 8–25. [Google Scholar] [CrossRef]
  17. Homer, J.B.; Hirsch, G.B. System dynamics modeling for public health: Background and opportunities. Am. J. Public Health 2006, 96, 452–458. [Google Scholar] [CrossRef] [PubMed]
  18. Wernerfelt, B. A resource-based view of the firm. Strateg. Manag. J. 1984, 5, 171–180. [Google Scholar] [CrossRef]
  19. Dierickx, I.; Cool, K. Asset stock accumulation and sustainability of competitive advantage. Manag. Sci. 1989, 35, 1504–1511. [Google Scholar] [CrossRef]
  20. Warren, K. The dynamics of strategy. Bus. Strateg. Rev. 1999, 10, 1–16. [Google Scholar] [CrossRef]
  21. Bayer, S.; Barlow, J.; Curry, R. Assessing the impact of a care innovation: Telecare. Syst. Dyn. Rev. 2007, 23, 61–80. [Google Scholar] [CrossRef]
  22. Jean, C.; Jankovic, M.; Stal-Le Cardinal, J.; Bocquet, J.-C. Predictive modelling of telehealth system deployment. J. Simul. 2015, 9, 182–194. [Google Scholar] [CrossRef]
  23. Shared version of the system dynamics model to mirror the strategic architecture of the focal veterinary telemedicine company. Available online: https://app.sysdea.com/shared/4cM1hUf6wKFxRKLoxTpBOA (accessed on 14 February 2018).
  24. Breierova, L.; Choudhari, M. An Introduction to Sensitivity Analysis. MIT Sloan School D-Memo D-4526–2. 1996. Available online: https://ocw.mit.edu/courses/sloan-school-of-management/15-988-system-dynamics-self-study-fall-1998-spring-1999/readings/sensitivityanalysis.pdf (accessed on 14 February 2018).
  25. Senge, P. The Fifth Discipline; Currency/Doubleday: New York, NY, USA, 2000. [Google Scholar]
  26. Porter, M. Competitive Strategy; The Free Press: New York, NY, USA, 1980. [Google Scholar]
  27. Warren, K. Strategy Dynamics Essentials; Strategy Dynamics Ltd.: Princes Risborough, UK, 2015. [Google Scholar]
Figure 1. Market opportunity for a veterinary telemedicine business.
Systems 06 00006 g001
Figure 2. Function for service quality vs. pressure on staff.
Systems 06 00006 g002
Figure 3. Specialist hiring practices.
Systems 06 00006 g003
Figure 4. Base case: customer gains and losses and service quality.
Systems 06 00006 g004
Figure 5. (a) FTE growth, pessimistic scenario #1; (b) case growth, pessimistic scenario #1; (c) income statement, pessimistic scenario #1.
Systems 06 00006 g005
Figure 6. Results of optimistic case. (Thin lines are from the base case).
Systems 06 00006 g006
Figure 7. (a) Pressure on staff and service quality, marketing scenario 1; (b) customer gains and losses, marketing scenario 1.
Systems 06 00006 g007
Figure 8. Revenues and income, marketing scenario 1.
Systems 06 00006 g008
Figure 9. Marketing scenario 2: service quality and customer gains and losses.
Systems 06 00006 g009
Figure 10. Marketing scenario 2: net income.
Systems 06 00006 g010
Figure 11. Pressure on staff, all scenarios.
Systems 06 00006 g011
Figure 12. FTE employees, all scenarios.
Systems 06 00006 g012
Figure 13. Revenue, all scenarios.
Systems 06 00006 g013
Table 1. Base case decisions and results.
DecisionsResults (Year End 2021)
Marketing Expense$300,000# of Cases1.02 Million
Specialists Hired23Revenue$76.6 Million
% Full Time Hired30Total Net Income$21.3 Million
% Scheduled Hired50FTE Employees94.4
% Non-Scheduled Hired20Pressure on Staff1.12
Sales Salary$65,000Service Quality0.889
% Sales Force Growth10.5Customers Lost484 (8.9% of actual)
Market Share (% of NA Clinics)23.9%
Table 2. Pessimistic simulation decisions.
Decisions#1 Reduced Hires#2 Hires Same as Base
Marketing Expense$300,000$300,000
Specialists Hired1723
% Full Time Hired1010
% Scheduled Hired6060
% Non-Scheduled Hired3030
Sales Salary$65,000$65,000
% Sales Force Growth10.510.5
Table 3. Comparison of base case with pessimistic simulation runs.
17 Hires with
10% FTE Hiring
23 Hires with
10% FTE Hiring
Base Case (23 Hires with
30% FTE Hiring)
Specialists Employed163192192
Percentage of Employees Full Time 66.5%76.6%94.4%
Total Cases Handled by Staff per Year639,000736,000906,000
Actual Customers410445905420
Total Net Income$13 Million$16 Million$21.3 Million
Table 4. Decisions and results for optimistic case.
DecisionsResults (Year End 2021)
Marketing Expenditure$300,000# of Cases1.08 Million
Hire Specialists29Revenue$81.1 Million
% Full Time Hired50Total Net Income$23.2 Million
% Scheduled Hired30FTE Employees129
% Non-Scheduled Hired20Pressure on Staff0.867
Sales Salary$65,000Service Quality0.99
% Sales Force Growth10.5Customers Lost184 (3.2% of actual)
Market Share (% of NA Clinics)25.70%
Table 5. Marketing scenario 1 decisions and results.
Decisions20162021Yearly IncreaseResults (Year End 2021)
Marketing Expenditure$325,000$475,000$25,000 Base CaseMarketing Scenario
Hire Specialists23230Total Revenue$76.6 M$81.4 M
% Full Time Hired30300Total Net Income$21.3 M$16.2 M
% Scheduled Hired50500Customers Lost484889
% Non-Scheduled Hired20200Clinics Gained by Marketing204404
Sales Salary$68,575$90,0255.5% or $3575Clinics Gained by Sales206349
% Sales Force Growth11.517.51.0Pressure on Staff1.121.19
Operating Cost$8.42 M$8.95 M

