1. Introduction
Following a destructive earthquake, rescue priorities must often be determined while transportation access, communication links, and field observations remain disrupted. Reports on the 2022
6.8 Luding earthquake documented extensive building damage, earthquake-induced landslides, road blockages, and rapidly evolving information conditions [
1,
2,
3,
4,
5]. Recent advances in AI-assisted point-cloud processing and multisensor structural health monitoring have improved the speed and scope of post-disaster condition assessment [
6,
7]. Although these technologies expand the evidence available to decision makers, they do not by themselves reconcile conflicting observations or determine how scarce rescue resources should be allocated.
Under such conditions, rescue prioritization cannot be reduced to a ranking based on mean scores. Optical imagery may suggest possible signs of life, whereas infrared observations can be distorted by complex surface-temperature patterns. Radar data may indicate cavities within debris without directly confirming survivor presence, while ground reports may be affected by communication delays, incomplete access, and local judgment. Consequently, different information channels may provide sharply divergent assessments of the same location. Simple aggregation can obscure alternatives characterized by strong directional conflict, and a reduction in opinion distance does not necessarily imply that the underlying evidence has become more reliable.
Research on consensus formation has provided extensive insight into how opinions evolve under social influence, incomplete information, and trust-related risk [
8,
9,
10,
11,
12,
13,
14,
15,
16,
17,
18]. Three-way decision theory, in turn, introduces an explicit deferment region for alternatives that cannot yet be accepted or rejected with sufficient confidence [
19,
20,
21,
22,
23]. These two research streams offer important foundations for emergency group decision-making, but a practical gap remains. Opinion convergence does not reveal whether an apparent consensus is supported by independent evidence, repeated information from common sources, or opposing observations that have been averaged into a moderate score. Similarly, a deferment region provides limited protection when its boundaries remain fixed regardless of the current conflict structure.
This study therefore focuses on a question that differs from conventional predictive classification: how should an internally diagnosed conflict state alter the degree of caution embedded in acceptance and rejection boundaries? To address this question, we develop the Conflict-Driven Action Boundary Generation Model (CABGM), an implementable conflict-sensitive decision-support model that links composite-conflict diagnosis to a constructed association proxy and three normalized action propensities. Together with a bounded feedback residual, these quantities generate state-dependent acceptance and rejection boundaries at each evaluation round. Only alternatives assigned to the deferment region enter the subsequent score-update step. The resulting decision pathway is explicit and reproducible, while the structural coefficients remain theory-constrained operating settings subject to prespecified sign, normalization, boundedness, boundary-ordering, and feasibility requirements.
The model evaluation addresses two related questions. First, can directionally opposed or insufficient evidence remain visible when an aggregate score would otherwise encourage immediate commitment? Second, when publicly documented physical evidence is coded independently of subsequent operations, does the resulting priority order remain directionally consistent with later documented operational attention? These questions are examined through a controlled evaluation, a retrospective public-record application, synthetic stress tests, and parameter-sensitivity analyses, which assess complementary aspects of model behavior, empirical applicability, and local stability.
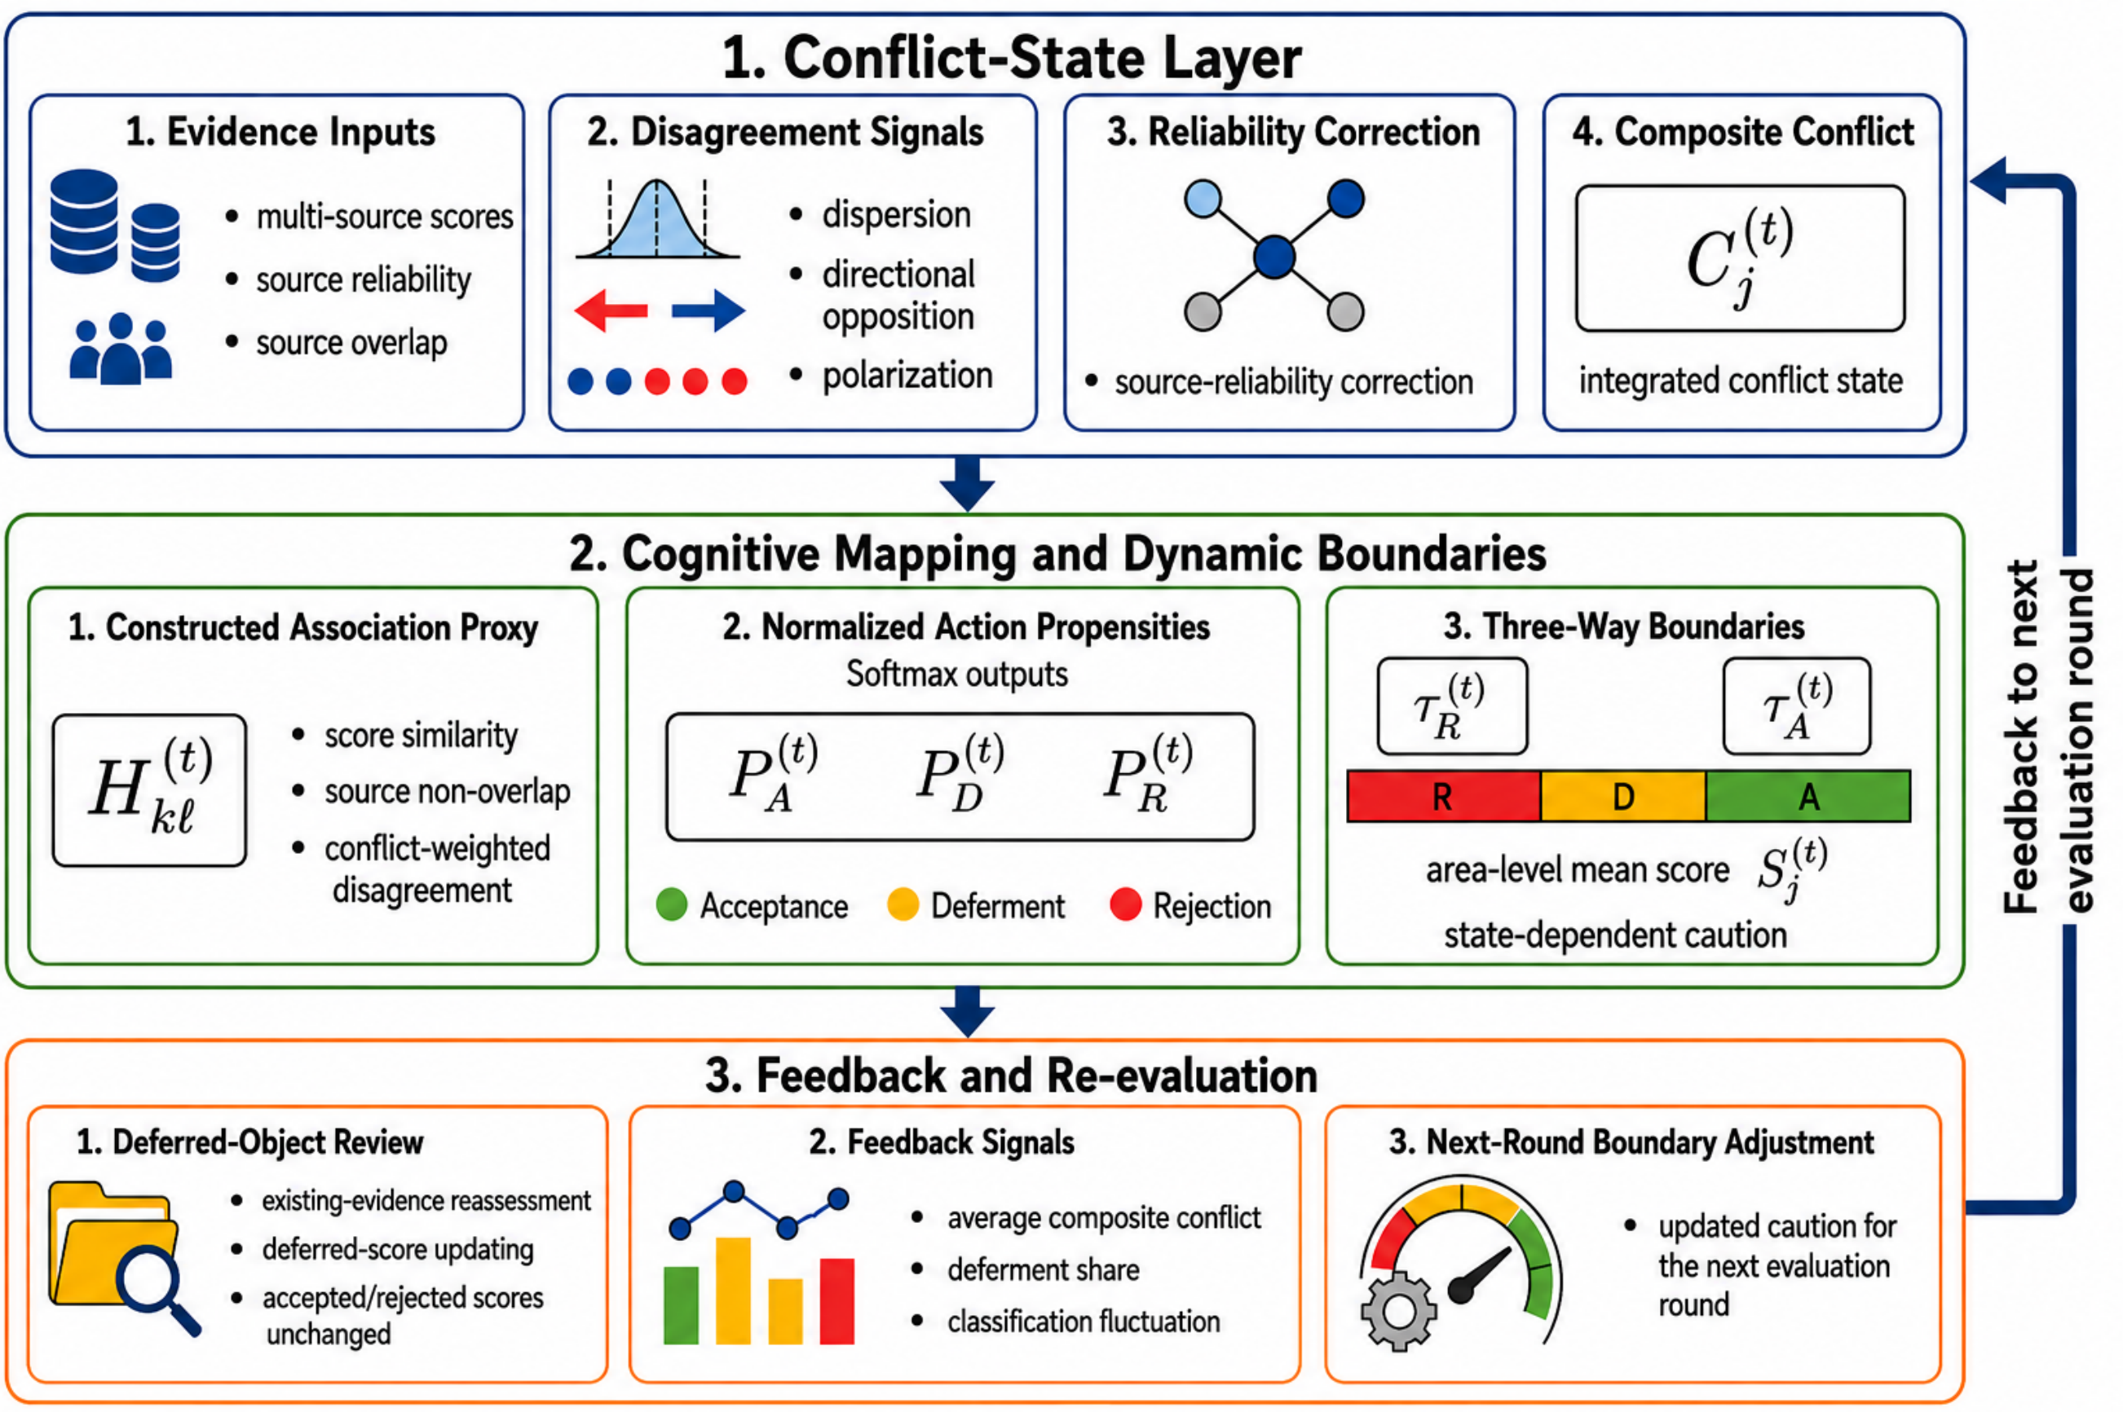
CABGM contributes an explicit state-to-boundary decision pathway for emergency group decision-making. Broad priority ordering may already be strongly shaped by physical evidence such as seismic intensity, documented damage, access disruption, and life-safety indications; CABGM addresses the additional question of whether that ordering provides sufficient support for immediate commitment. By translating directional disagreement, source-overlap structure, potential association, threshold proximity, and unresolved evidence into state-dependent boundary caution, the model identifies when further verification should precede the commitment of scarce rescue resources and provides a traceable explanation for that decision. The overall architecture of CABGM and the interactions among its principal components are summarized in
Figure 1.
Because recent emergency-consensus and disaster-decision models are built for different information structures, they cannot be transferred directly to the present scalar-score setting. The adaptive-consensus model proposed by Yan et al. [
17], for example, is formulated for hesitant fuzzy 2-tuple linguistic information and large-group clustering, whereas Bayesian disaster-decision models commonly require event-specific network nodes and conditional probability tables [
24]. Reconstructing either data structure from the present
score matrix would require information that was not observed. The comparative analysis therefore uses two mechanism-preserving adaptations: a scalar-score adaptive-consensus procedure that retains the original feedback and consensus-state logic, and a reliability-informed Dirichlet comparator that represents uncertainty in evidence-channel weights. The implementation details—including the governing equations, decision thresholds, evaluation budgets, stopping criteria, and random-seed settings where applicable—are reported explicitly. Neither comparator is presented as an exact reproduction of the original framework.
3. Conflict-Driven Action Boundary Generation Model (CABGM)
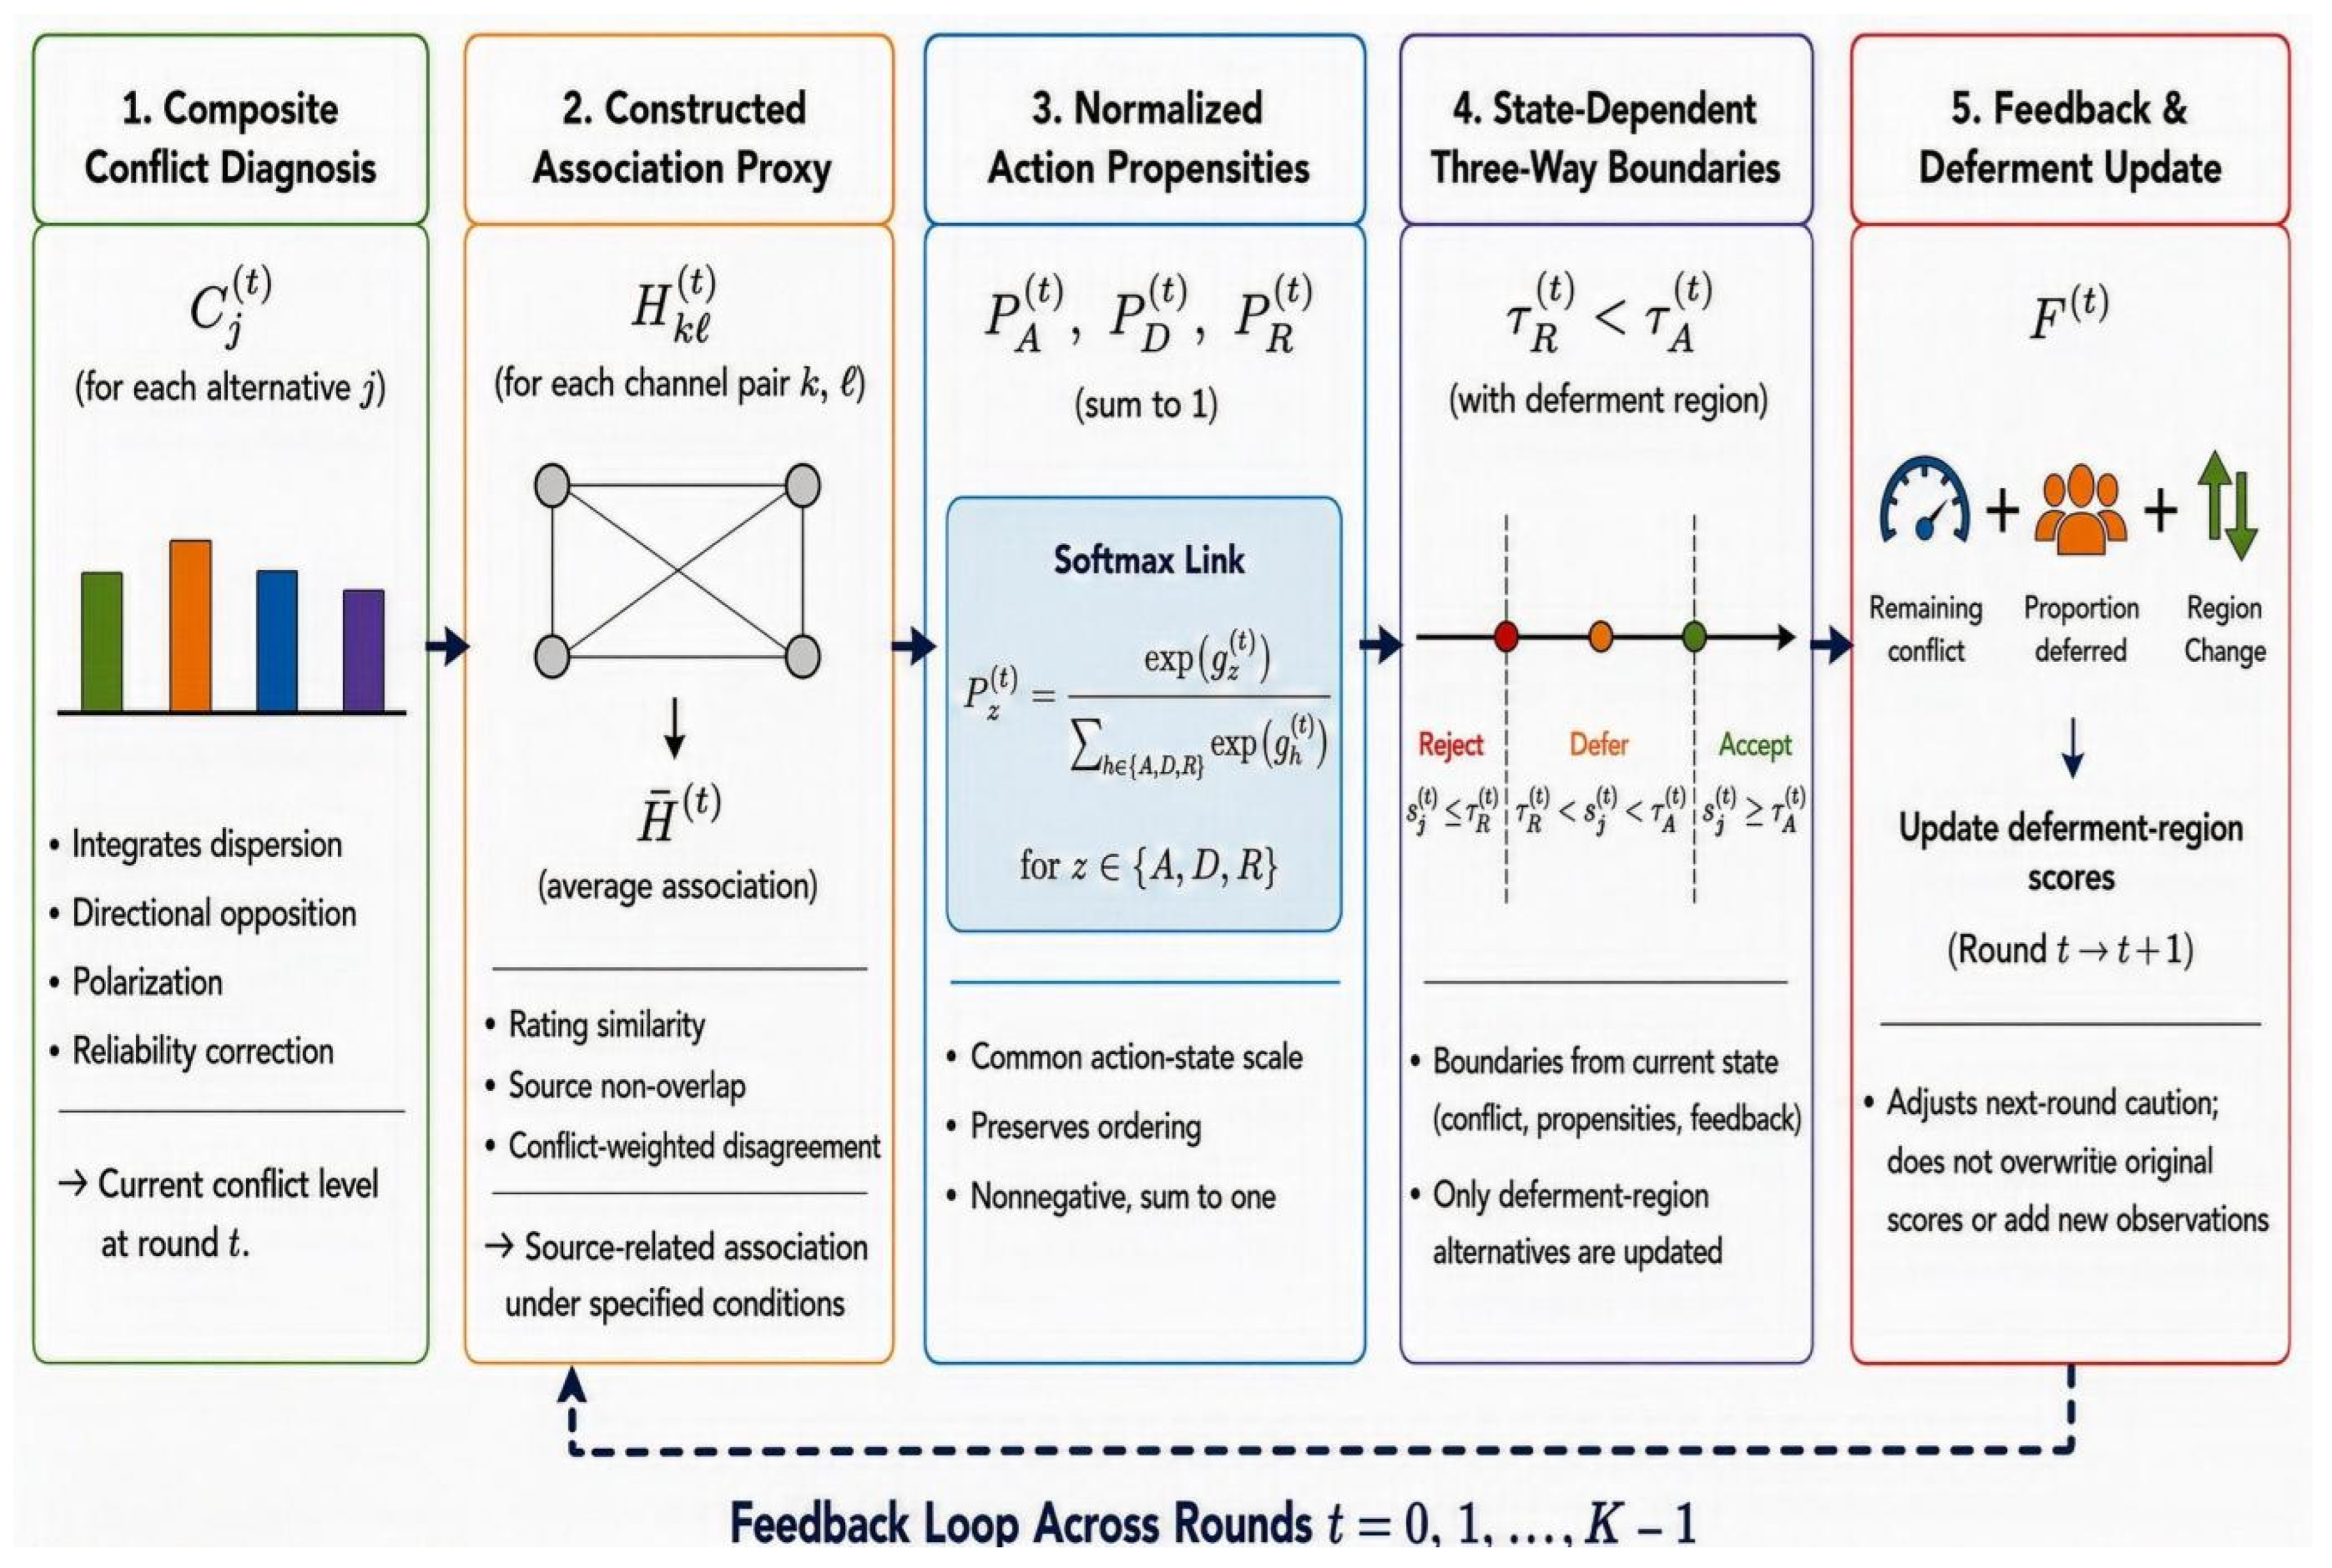
This section operationalizes the theoretical framework developed above as an implementable and reproducible conflict-sensitive decision-support model. CABGM begins by diagnosing the conflict structure embedded in the score matrix. A constructed association proxy then represents potential coupling under the stated assumptions regarding information sources, and the Softmax function maps the resulting action scores into normalized action propensities. These propensities are used to generate state-dependent three-way decision boundaries. Once the alternatives have been classified, only those retained in the deferment region enter the internal re-evaluation process. The model is designed to preserve analytical traceability under limited data rather than to claim statistical identification.
CABGM distinguishes among empirical inputs, structural model settings, and operating constraints. The score matrix, documentary reliability vector, and document-level overlap matrix constitute the empirical input layer and can be reconstructed from operational or documentary records. The coefficients governing conflict diagnosis, action scoring, association modulation, feedback, and score updating define the structural specification of the model, whereas the feasible boundary intervals and conflict-safety margins serve as policy-sensitive operating constraints. In the retrospective public-record application, documentary evidence is used to construct the input layer, while the structural specification is held fixed and evaluated through the parameter-admissibility protocol in
Section 3.5 and the sensitivity analysis in
Section 4.6. This separation preserves a traceable link between empirical evidence and the operating assumptions of the model.
3.1. Composite Conflict Diagnostic
Following the conceptual framework in
Section 2, CABGM represents object-level conflict as a composite of score dispersion, directional opposition, polarization, and source-reliability correction. Let the set of candidate areas be
and let the set of assessors or evidence channels be
The standardized score assigned by assessor
to area
at evaluation round
is denoted by
, and the corresponding mean score for area
is denoted by
. To retain the distinct forms of disagreement that may affect an action decision, the composite-conflict diagnostic is defined as
The weighted specification provides a transparent first-order representation of the conflict structure. Each normalized component captures a distinct aspect of disagreement. The corresponding weights form part of CABGM’s theory-constrained structural specification, determine the relative contribution of each component, and are subject to the admissibility and sensitivity analyses described below.
The source-reliability correction in Equation (1) is kept analytically separate from the source-overlap information introduced later in the association proxy. The former adjusts score deviations according to the reliability assigned to each source, whereas the latter captures source-sharing information that may contribute to potential association among evidence channels. Maintaining this distinction prevents reliability adjustment and source-overlap information from being incorporated repeatedly across different components of the model.
3.2. Constructed Association Proxy and Normalized Action-Propensity Mapping
The association quantity in CABGM is neither an observed trust weight nor a statistical measure of dependence. It is a constructed proxy designed to respond to rating similarity, source overlap, and object-level conflict. The proxy therefore provides an operational representation of potential coupling under the stated source assumptions, rather than identifying an underlying dependence structure from independent observations.
In Equation (2), measures the similarity between the current score vectors of assessors or evidence channels and , while denotes their source overlap. The term captures the extent to which their disagreement is concentrated on alternatives with substantial object-level conflict. The three components are bounded within the unit interval and enter the proxy with prespecified directions. Their weighted combination provides a transparent and reproducible representation of source-related association under the specified information conditions. The quantity is used operationally within CABGM and is not interpreted as a statistically identified latent dependence measure.
At the round level, the mean association proxy and average composite conflict are first combined into a raw interaction term. A separate bounded coefficient then determines how strongly this interaction affects the action scores:
Here, represents the unmodulated interaction between the round-level association state and composite conflict, whereas is the final modulation term passed to the action-score equations. denotes the round-level mean association proxy and denotes the average composite conflict across alternatives. Keeping these quantities separate makes the computational sequence explicit and prevents the modulation coefficient from being applied more than once.
The association-modulation coefficient is required to retain a baseline contextual effect when conflict is low, strengthen as average conflict increases, and respond conservatively when classification instability persists. A local first-order approximation consistent with these directional requirements is given by
Equation (4) follows from a local first-order expansion of a continuously differentiable modulation function around a reference state , subject to and . The constant and derivative terms are absorbed into , , and . This approximation is intended for a bounded neighborhood of the reference state, with the truncation operator limiting extrapolation beyond the feasible range. Nonlinear alternatives are possible, but their additional curvature parameters cannot be identified reliably from the present data.
The final modulation term enters a common state vector used to calculate the three action scores:
The round-level mean and dispersion summarize the distribution of area-level scores without replacing the object-specific conflict diagnostic. The linear action-score specification is adopted for interpretability and reproducibility; it is not presented as a unique implication of nonadditive judgment. Its coefficients encode directional assumptions that can be subjected to admissibility screening and sensitivity analysis, although different admissible coefficient combinations may produce similar classifications.
The three action scores are subsequently mapped onto the unit simplex through the Softmax function:
The resulting quantities are referred to as normalized action propensities rather than probabilities of acceptance, deferment, or rejection. No observed action frequencies or likelihood-based estimates are available, and no calibration loss can be evaluated to support a behavioral probability interpretation. Within CABGM, these propensities provide comparable inputs to the boundary functions and allow the association-modulation effect to enter all three action channels through a single traceable pathway.
3.3. Derivation of Three-Way Boundary Functions
The boundary functions are subject to explicit operational constraints. On the acceptance side, an increase in composite conflict, deferment propensity, or the feedback residual should raise the boundary and thereby make acceptance more demanding, whereas a stronger acceptance propensity may lower it moderately. On the rejection side, the adopted specification lowers the boundary as composite conflict, rejection propensity, or the feedback residual increases, while a stronger deferment propensity raises it. Because rejection requires an area’s mean score to fall below the rejection boundary, a lower boundary imposes a more conservative rejection criterion. These sign conditions describe local partial effects with the remaining inputs held constant; they do not imply that either boundary must move monotonically across evaluation rounds.
Assuming that the underlying boundary functions are continuously differentiable in a neighborhood of the case-specific reference state, a first-order Taylor approximation, coefficient reparameterization, and truncation to feasible intervals yield
Given the state-dependent boundaries, the three-way region assignment is determined jointly by the area-level mean score and the corresponding conflict-safety margin. Let
denote the set of candidate areas. At evaluation round
, the acceptance, rejection, and deferment regions are defined as
Accordingly, an area enters a decisive region only when both its score condition and the corresponding conflict-safety condition are satisfied; otherwise, it remains in deferment. These margins are internal operating safeguards rather than outcome-derived labels. A margin violation therefore indicates insufficient support for a decisive assignment within CABGM, rather than an observed prediction error.
Role of the asymmetric-cost premise. Within CABGM, the asymmetric-cost premise provides the decision-theoretic basis for introducing greater caution on the acceptance side. Let denote the loss associated with prematurely accepting a high-conflict area and the loss associated with temporarily retaining that area in the deferment region for further verification. The ordering reflects the greater consequence of committing scarce rescue resources on the basis of unresolved or directionally conflicting evidence.
Rather than entering the model as an isolated cost ratio, this premise is embedded in the composite CABGM architecture. It works jointly with composite-conflict diagnosis, normalized action propensities, association modulation, and feedback-sensitive boundary generation to regulate the degree of caution expressed by the acceptance and rejection rules. The resulting formulation provides an integrated mechanism through which heterogeneous evidence conditions can be translated into state-dependent three-way decision boundaries, while preserving uncertain or high-conflict alternatives for further verification before definitive action is taken.
3.4. Feedback Function and Deferment Region Update
Classification fluctuation should not enter the boundary mechanism as an isolated feedback signal, because the migration of a single alternative could otherwise exert a disproportionate influence on the subsequent round. CABGM therefore defines the feedback residual as a weighted combination of the average composite conflict, the proportion of alternatives remaining in the deferment region, and the change in region assignments:
Here, represents the unresolved conflict carried by the current score configuration, measures the share of alternatives for which a definitive decision has not yet been reached, and captures classification fluctuation between successive rounds. Their convex combination retains the distinct sources of residual uncertainty while keeping on an interpretable scale. The feedback residual subsequently enters the association-modulation and boundary-generation processes, allowing unresolved conflict and classification behavior to affect the degree of caution applied in the next round without being treated as new evidence.
The convex form of Equation (9) prevents an isolated classification change from dominating the feedback signal. It also keeps feedback bounded when its constituent terms lie in the unit interval. The resulting classification trajectory nevertheless depends jointly on the boundary coefficients, update rates, truncation intervals, and the distance of each alternative from the current boundaries. Feedback should therefore be understood as a regulatory component of the closed-loop mechanism rather than as a stand-alone determinant of boundary movement.
Score revision is restricted to alternatives in the deferment region. To construct the corresponding influence matrix, let
where
introduces self-retention into the association matrix. Row normalization of
yields the row-stochastic update matrix
. The global and alternative-specific update rates are then defined as
The global rate increases with the average level of unresolved conflict, while adjusts the revision intensity to the conflict associated with alternative . The parameter retains a baseline level of re-evaluation, and provides the local conflict scale. This scaling constant is distinct from the conflict-safety margins used in the three-way classification rule.
For each
, the score vector is updated according to
Equation (11) combines the current score vector with its association-weighted counterpart. The object-specific rate determines the extent of this internal re-evaluation, while the truncation operator preserves the normalized score range. Alternatives in the acceptance and rejection regions are not score-updated; only deferred alternatives are reconsidered before the conflict state, action propensities, feedback residual, and decision boundaries are recalculated.
The update mechanism thus links selective score revision with conflict-responsive boundary generation. A reduction in conflict after updating is a natural consequence of weighted aggregation, but it is interpreted together with changes in the generated boundaries and region assignments. CABGM therefore uses score contraction as one component of an integrated re-evaluation process rather than as the sole criterion for decision improvement.
3.5. Boundedness, Conditional Stability, and Parameter Admissibility
The score-update mechanism is bounded by construction. Because
is row stochastic, multiplying a score vector in the unit hypercube by
produces another vector in the same domain. The update in Equation (11) is a convex combination of the current score vector and its association-weighted counterpart. Hence,
Equation (12) ensures that repeated updating cannot drive the scores outside their normalized range. This result establishes the feasibility of the score dynamics, although boundedness alone does not imply convergence of the complete feedback system. Region assignments are discrete, and the boundaries vary with the internal state; alternatives located close to either boundary may therefore change regions as the state evolves.
Stabilization of both the score configuration and the three-way partition can be supported by additional structural conditions, including persistent connectivity, uniformly positive effective weights, a sufficiently small feedback gain, and positive separation between each alternative and the decision boundaries. Throughout the numerical analysis, stability refers to the observed condition in which the three region sets cease to change after a finite number of rounds while average composite conflict no longer exhibits material variation. This operational definition is used to characterize the reported trajectory without extending Equation (12) beyond its boundedness result.
Reproducible parameter-admissibility protocol. Let
denote the complete vector of structural CABGM coefficients and let
denote the corresponding admissible parameter region. A candidate vector
is retained only if it satisfies the following conditions. Its coefficient signs must be consistent with the theoretical effects specified in
Section 2, and nonnegative weights within the same functional component must be normalized. Action propensities, feedback values, updated scores, and generated boundaries must remain within their declared feasible ranges. The rejection boundary must remain strictly below the acceptance boundary, the update matrix must remain row stochastic, and the reported trajectory must be reproducible from the same initial state, evaluation budget, stopping rule, and random-seed specification.
These requirements define a transparent admissible operating domain for the integrated CABGM mechanism. The baseline vector represents a reproducible operating point within this domain, while the sensitivity analysis examines which parameter groups exert the greatest influence and whether alternative admissible settings produce comparable three-way partitions. The purpose of this protocol is not to identify a single numerically privileged parameter vector, but to ensure that the proposed architecture operates consistently with its theoretical direction, boundary logic, and computational constraints.
3.6. Computational Complexity and Scalability
Let denote the number of alternatives, the number of assessors or evidence channels, and the number of update rounds. In each round, CABGM evaluates the conflict and association quantities for all channel pairs associated with each alternative. The row-stochastic score update also involves dense matrix–vector operations for alternatives in the deferment region. These calculations dominate the score aggregation, action-propensity mapping, boundary generation, and feedback evaluation, whose computational costs are at most linear in the size of the score matrix. The overall time and space complexities are therefore and , respectively.
The asymptotic analysis was supplemented with runtime measurements from the reference implementation. The experiments were conducted under Windows 11 using Python 3.12.13 and NumPy 2.3.5. Following one untimed warm-up run, each configuration was executed 30 times, and the median runtime and interquartile range were recorded. As reported in
Table 1, the median runtime increased from 0.84 ms for 10 alternatives and four channels to 389.57 ms for 500 alternatives and 20 channels. The observed runtimes show that the implementation remains computationally manageable at the tested scales, while the reported values remain specific to the stated software and hardware environment.
The principal notation and operational status of the model quantities are summarized in
Table 2.
4. Luding Earthquake: Controlled Evaluation and Retrospective Public-Record Application
This section evaluates CABGM through two complementary settings. The first uses a controlled score matrix with prespecified evidence profiles to examine the model under directional conflict, consistent support, boundary proximity, and intermediate evidence. The second applies the frozen CABGM specification to ten named settlement-scale units reconstructed from public records. Together, the two analyses examine the operational behavior of the proposed mechanism and its retrospective applicability using documented disaster evidence. The controlled inputs support mechanism evaluation, whereas the public-record application provides an empirical reference without serving as an independently labeled outcome-validation sample.
4.1. Controlled Evaluation Settings and Data Boundaries
Public reports on the 2022 magnitude-6.8 Luding earthquake provide the physical context for the controlled evaluation, including severe terrain constraints, structural damage, earthquake-induced landslides, road disruption, and uneven access to information. The numerical inputs in
Table 3,
Table 4,
Table 5 and
Table 6 form a controlled evaluation setting with deliberately designed evidence profiles. They are used to isolate specific evidential configurations and should not be interpreted as direct measurements from an operational rescue-command system or as the results of formal assessor elicitation.
Table 3 distinguishes the publicly documented disaster context from the inputs constructed or specified for model analysis. The earthquake characteristics provide the physical context for the controlled evaluation but are not converted directly into area-level scores. The area-by-channel score matrix is used to examine directional conflict, consistent support, boundary proximity, and intermediate evidence. The source-reliability vector and source-overlap matrix enter the conflict and association components as exogenous controlled settings, while seeded random matrices are used only in the synthetic stress tests.
The ten anonymous alternatives , …, are controlled evaluation objects rather than named operational locations. Their score profiles were deliberately designed to represent identifiable evidential configurations, including directional opposition, consistent support, boundary proximity, intermediate evidence, and low-support conditions. This controlled design makes the CABGM computational pathway directly inspectable under known input structures without implying that the individual decimal values were extracted from public disaster records.
Area has scores concentrated near the middle of the scale. The available evidence concerning damage and signs of life is therefore insufficient to support a definitive decision, making further sensing preferable to immediate commitment. Area has generally low scores but lies close to the rejection boundary, representing a case in which aftershock or landslide risk may delay ground access while additional review remains warranted. Areas receive consistently low scores across the four channels, representing locations with no detected signs of life, prohibitive access costs, or repeated negative searches. Taken together, these profiles expose the model to directional conflict, threshold proximity, intermediate evidence, and low-support alternatives rather than testing it against a single predetermined classification pattern.
Table 5 reports the baseline structural parameter vector
used in the controlled evaluation. The vector
was selected from the admissible region defined in
Section 3.5 after its directional consistency, within-group normalization, state boundedness, boundary ordering, update feasibility, and computational reproducibility had been verified. It serves as a reproducible operating point for the numerical evaluation and was not tuned to the final classifications or later operational-attention records.
Table 5 distinguishes parameter admissibility from empirical calibration. The baseline vector satisfies the specified directional, normalization, boundedness, boundary-ordering, and reproducibility conditions and is used as a theory-constrained operating specification for the proposed composite model. The asymmetric-cost premise determines the direction of caution but does not prescribe a unique numerical cost ratio. The specification is therefore evaluated through model-mechanism analysis, comparative controls, and sensitivity analyses conducted within the stated parameter neighborhood.
The Round-0 calculation follows a fixed computational sequence. The score and conflict inputs are first used to calculate the mean association proxy and average composite conflict, whose product forms the raw interaction term. The bounded modulation coefficient is then applied once to obtain the final modulation term included in the action-state vector. Softmax normalization produces the three action propensities, which enter the acceptance and rejection boundary functions before the object-level conflict-safety margins are applied.
The controlled mechanism study considers four evidence channels: optical remote sensing, infrared detection, radar detection, and ground command. Their assumed source overlap is represented by the matrix in
Table 6. Together with the source-reliability vector and initial score matrix, this matrix forms the exogenous input set for the subsequent CABGM evaluation.
The overlap matrix is symmetric and has a unit diagonal. Its off-diagonal elements encode scenario assumptions regarding shared information across evidence channels rather than estimates derived from communication logs. Because greater overlap reduces the source non-overlap component of the constructed association proxy, the multi-scenario synthetic stress test varies these elements to examine model behavior under different source structures instead of relying on a single fixed configuration.
4.2. Retrospective Public-Record Application and Audit Protocol
The audit reconstructed ten named settlement-scale units from publicly available records. The documentary reconstruction drew on the official seismic-intensity map [
30] and rescue-response records issued by national, provincial, and local authorities [
31,
32,
33,
34,
35]. Four physical fields were considered: seismic intensity, documented damage, access disruption, and life-safety indications. Each field was coded on a five-point ordinal scale and subsequently normalized for use in the frozen CABGM specification.
Missing and conflicting evidence. The absence of a public report was not treated as evidence of absence and was therefore not coded as zero. A unit-by-field item was initially marked as missing when no eligible source contained field-specific information. It was marked as conflicting when eligible records supported nonadjacent categories and no authoritative update resolved the discrepancy. Numerical coding was undertaken only when the documentary record supported a defensible category under the definitions in
Table 7.
Unresolved items were retained as such and subjected to lower- and upper-bound sensitivity analysis rather than completed by midpoint imputation. In the present audit, all items initially marked as missing or conflicting were resolved through documentary review before the frozen model was evaluated. The “Flagged channels” column in
Table 8 therefore identifies fields that required additional review; it does not indicate unresolved numerical missingness.
Public-record coding protocol. The unit of analysis, evidence cutoff, source hierarchy, coding direction, and category definitions were specified before documentary coding began. For settlement-scale unit
and physical field
, the evidence was assigned an ordinal category
. The corresponding normalized input was calculated as
. The five categories were therefore mapped to 0, 0.25, 0.50, 0.75, and 1.00. The resulting matrix
is supplied as the initial score matrix for the retrospective CABGM application. Higher values consistently represented stronger evidence of rescue priority, including greater seismic intensity, more severe documented damage, more substantial access disruption, or stronger life-safety indications. The operational definitions in
Table 7 were fixed before the CABGM outputs and the subsequent operational-attention reference were examined.
Source hierarchy and record selection. Documentary records were reviewed according to a fixed hierarchy. National and provincial government or professional-agency records received the highest priority, including earthquake-intensity maps and releases issued by emergency-management, transport, and earthquake authorities. These were followed by county- or township-level official releases, peer-reviewed studies or identifiable technical reports, and established news reports attributed to named authorities, rescue teams, or field investigators. Anonymous online statements and reports without identifiable evidence provenance were excluded from numerical coding.
When several records were available for the same unit and field, an explicit official update superseded an earlier preliminary report. Records referring to different observation times were not treated as direct contradictions. Where records from the same time window and authority level remained inconsistent, the original evidence was reassessed using the prespecified hierarchy and category definitions. The final category was determined from the documentary record independently of the resulting CABGM classification.
Because this analysis is a retrospective documentary reconstruction rather than a prospective temporal holdout, the four physical fields were constructed using eligible records released no later than 11 September 2022 at 11:30 China Standard Time. This cutoff corresponds to the latest record included in the source register. The later operational-attention reference was reserved for descriptive retrospective comparison and was not treated as an independent holdout outcome or a ground-truth class.
The audit provides a traceable documentary basis for the model inputs. The physical fields were reconstructed from cited records under the prespecified protocol, while source overlap was derived from documented source sharing and derivation. The structural coefficients governing conflict diagnosis, action scoring, boundary generation, feedback, and score updating remained fixed at their theory-constrained operating settings. Neither the reconstructed inputs nor the later operational-attention reference was used to estimate or optimize these coefficients.
Rule-guided documentary coding. For each unit-by-field item, the audit register recorded the supporting reference, the relevant documentary statement, the assigned category
, and any missing or conflict flag. Coding was completed without reference to the CABGM classification, final model ranking, or later operational-attention record. Where reconciliation was required, the category was assigned according to the source hierarchy and the definitions in
Table 7. No value was altered to improve correspondence with either the CABGM output or the retrospective reference.
The research team conducted the coding under the prespecified protocol, and each field assignment was linked to identifiable documentary evidence. The resulting dataset is used as a rule-guided retrospective reconstruction for empirical reference rather than as an outcome-labeled validation sample. Although the explicit definitions, source hierarchy, and evidence cutoff improve transparency and reproducibility, the coding process was not independently validated through external review or formal assessment by domain experts.
Audit-specific documentary reliability and document-level source overlap. The public-record application used a documentary reliability vector and a document-level source-overlap matrix constructed independently of those used in the controlled evaluation. For each registered document s, documentary quality was assessed in terms of authority, directness, and traceability. The document-quality score was calculated as . Authority reflects the institutional status of the issuer, directness indicates the proximity of the record to primary field observation or an original technical release, and traceability indicates whether the statement can be linked to an identifiable issuer or primary source.
For physical field
, let
denote the set of registered documents used to construct that field. Field-level documentary reliability was calculated as
. In the order seismic intensity, documented damage, access disruption, and life-safety indications, the resulting reliability vector was
Document-level source overlap was determined from the reuse of registered documents across physical fields, rather than from similarity between their numerical scores. For fields
and
, overlap was calculated using the Jaccard coefficient:
,
. The resulting overlap matrix was
The arithmetic mean is retained as the baseline field-level reliability measure because it characterizes the average quality of the documentary evidence assigned to a field, whereas the number of registered documents reflects evidence volume rather than quality. A direct count bonus could mechanically increase reliability when additional records are derivative, reproduce the same official release, or differ only in publication format. Document reuse is instead represented in the Jaccard overlap matrix. The document count
is nevertheless reported in
Table 9 to make the unequal evidence volume explicit and is examined in the sensitivity analysis below.
Document count, quality dispersion, and substantive cross-source consistency represent distinct dimensions of documentary uncertainty. The document-quality range in
Table 9 describes within-field heterogeneity in authority, directness, and traceability. However, because the audit register records whether a document contributes to a field but does not encode parallel document-level ordinal claims for every unit–field item, a separate within-field agreement coefficient cannot be identified from the archived data. Omitting such consistency information may overstate reliability when nominally high-quality sources disagree, whereas a small source set may understate evidential precision even when its records agree. Accordingly,
should be interpreted as a documentary-quality index rather than as an estimate of sampling precision or cross-source agreement. Future prospective audits should retain source-specific claims and timestamps so that agreement and temporal consistency can be estimated directly.
These quantities are transparent, rule-derived documentary settings. The reliability values summarize the quality of the registered evidence and do not represent empirical probabilities of source accuracy. Similarly, the overlap matrix records document reuse across fields rather than a statistically identified latent dependence structure.
Reliability sensitivity. The six unique registered documents had an overall mean document-quality score of 0.8694 and, because several supported more than one physical field, generated 11 field-document assignments. The seismic-intensity field contained one document; conventional leave-one-document-out recalculation was infeasible because removing it would eliminate the field’s documentary basis. Excluding the single seismic-intensity assignment, the remaining field-document assignments yielded ten field-specific leave-one-document-out scenarios, each removing one document from one field while holding the other field reliabilities fixed. The corresponding quality ranges were 1.000, , , and for seismic intensity, documented damage, access disruption, and life-safety indications, respectively. The leave-one-document-out recalculations produced field-level reliability ranges of for documented damage, for access disruption, and for life-safety indications. For the sensitivity analysis only, count-aware reliability for field was calculated as the document-count-weighted combination of its baseline reliability and the overall mean document-quality score. Specifically, the baseline field mean received a weight equal to that field’s document count, the overall mean received a weight of , and their weighted sum was divided by the sum of those two weights. In the sensitivity analysis, the shrinkage weight was set to 1, 2, and 4; larger values imposed greater shrinkage toward 0.8694. This robustness specification does not replace the baseline arithmetic-mean documentary reliability measure and does not introduce an additional CABGM parameter. The resulting reliability vectors were , , and , respectively. The single-document seismic-intensity reliability was also stress-tested at 0.75 and 0.85, and a conservative lower-quality stress vector of was evaluated. Across the baseline, ten field-specific leave-one-document-out scenarios, two single-document intensity stress scenarios, three count-aware shrinkage settings, and the conservative lower-quality stress scenario (17 scenarios in total), the CABGM allocation remained 6/4/0 and the Bayesian allocation remained 4/6/0. Under the manuscript’s common ranking protocol, Spearman’s remained 0.912, Kendall’s remained 0.839, the exact two-sided permutation -value remained 0.0016, and the top-four overlap remained 100%. The Bayesian acceptance-support probabilities for Dewei Town and Moganling Village varied only from 0.5651 to 0.6703 and from 0.5602 to 0.6670, respectively, and remained below the 0.80 commitment threshold in every tested scenario. Thus, the tested perturbations did not materially alter the public-record conclusions; direct cross-source agreement remains unavailable in the retrospective register.
Priority ranks were determined first by the final three-way region, with acceptance preceding deferment and deferment preceding rejection, and then by the final mean score within each region. Units sharing the same region and final mean score received the corresponding average tied rank.
Table 8 records the physical evidence entered into the frozen model, whereas
Table 10 presents the later operational-attention reference alongside the resulting CABGM classification. The latter is used solely for retrospective comparison and is not treated as a ground-truth class.
The scalar-score adaptive-consensus comparator and the reliability-informed Dirichlet weight-uncertainty comparator were implemented using the equations, thresholds, stopping rules, and random-seed settings specified in
Section 4.4.
The evaluation counts reported here refer to the named-unit public-record audit and should be distinguished from those obtained in the subsequent controlled mechanism comparison. Differences in evaluation counts arise from the distinct initial score structures used in the two analyses.
For the rank-concordance analysis, units were ordered first by their final three-way region and then by the final mean score within each region. The exact two-sided permutation test enumerated all 3150 unique permutations of the operational-attention vector, which was coded on the prespecified four-level scale and contained three observed categories with multiplicities of 4, 4, and 2, while holding each model-derived ranking fixed. The reported
p-value is the proportion of permutations producing an absolute Spearman correlation at least as large as the observed value. The resulting rank-concordance statistics are reported in
Table 11.
All five methods produced a Spearman correlation of 0.912, Kendall’s tau-b of 0.839, an exact permutation p-value of 0.0016, and 100% top-four overlap. This agreement reflects the common physical evidence supplied to all methods, as the broad ordering is strongly influenced by seismic intensity, documented damage, access disruption, and life-safety indications. The result provides a historical anchor for the reconstructed priority order without establishing comparative predictive superiority.
The three-way allocations reveal differences that are not captured by rank correlation alone. The fixed-threshold conflict gate, opinion-distance update, adaptive-consensus adaptation, and CABGM each produced an acceptance/deferment/rejection split of 6/4/0, whereas the Bayesian weight-uncertainty comparator produced a split of 4/6/0. Under the Bayesian rule, Dewei Town and Moganling Village moved from acceptance to deferment, although their relative positions remained fifth and sixth because their mean scores still exceeded those of the other deferred units. Identical rank concordance can therefore coexist with different levels of commitment, making it necessary to interpret rank statistics together with region allocation and mechanism diagnostics.
A related pattern appears in the public-record audit. Yanzigou Village, Wajiao Township, and Wanggangping Township all have a final mean score of 0.625 and are assigned to deferment. Their source-linked flags nevertheless preserve different evidence limitations. Yanzigou Village was flagged for damage, access, and life-safety evidence; Wajiao Township for intensity, damage, and life-safety evidence; and Wanggangping Township for damage, access, and life-safety evidence. Reading the deferment decision together with these flags provides a more specific basis for further documentary review than the aggregate mean score alone.
The audit should therefore not be assessed solely by whether CABGM changes the overall priority ranking. Several methods recover the same broad severity order. The controlled comparisons in
Section 4.4 instead examine whether directional conflict, boundary proximity, channel-weight uncertainty, score contraction, and feedback lead to distinguishable commitment behavior under a common scalar-score representation.
4.3. CABGM Evaluation Trajectory and Three-Way Classification Results
Table 12,
Table 13 and
Table 14 make the computational pathway from the score matrix to the three-way classification auditable.
Table 12 reports the object-level score and conflict quantities.
Table 13 separates the raw interaction between association and conflict from the final modulated term, while
Table 14 reports the row-normalized matrix used exclusively for deferred-score updating. Together, the tables connect conflict diagnosis, action-propensity normalization, boundary generation, and feedback without applying the modulation coefficient more than once.
The contrast between and demonstrates why an aggregate mean cannot replace the decomposition of dispersion, directional opposition, polarization, and source-reliability correction.
Table 13 distinguishes the raw interaction from the final modulation term included in the action-state vector. The reported values are consistent with the mathematical definitions and the subsequent boundary calculations. Feedback and the update rate remain separate round-level quantities and are reported at the stages where they enter the subsequent calculations.
Row normalization converts the pairwise association strengths into the influence matrix . This row-stochastic matrix is used exclusively for deferred alternatives.
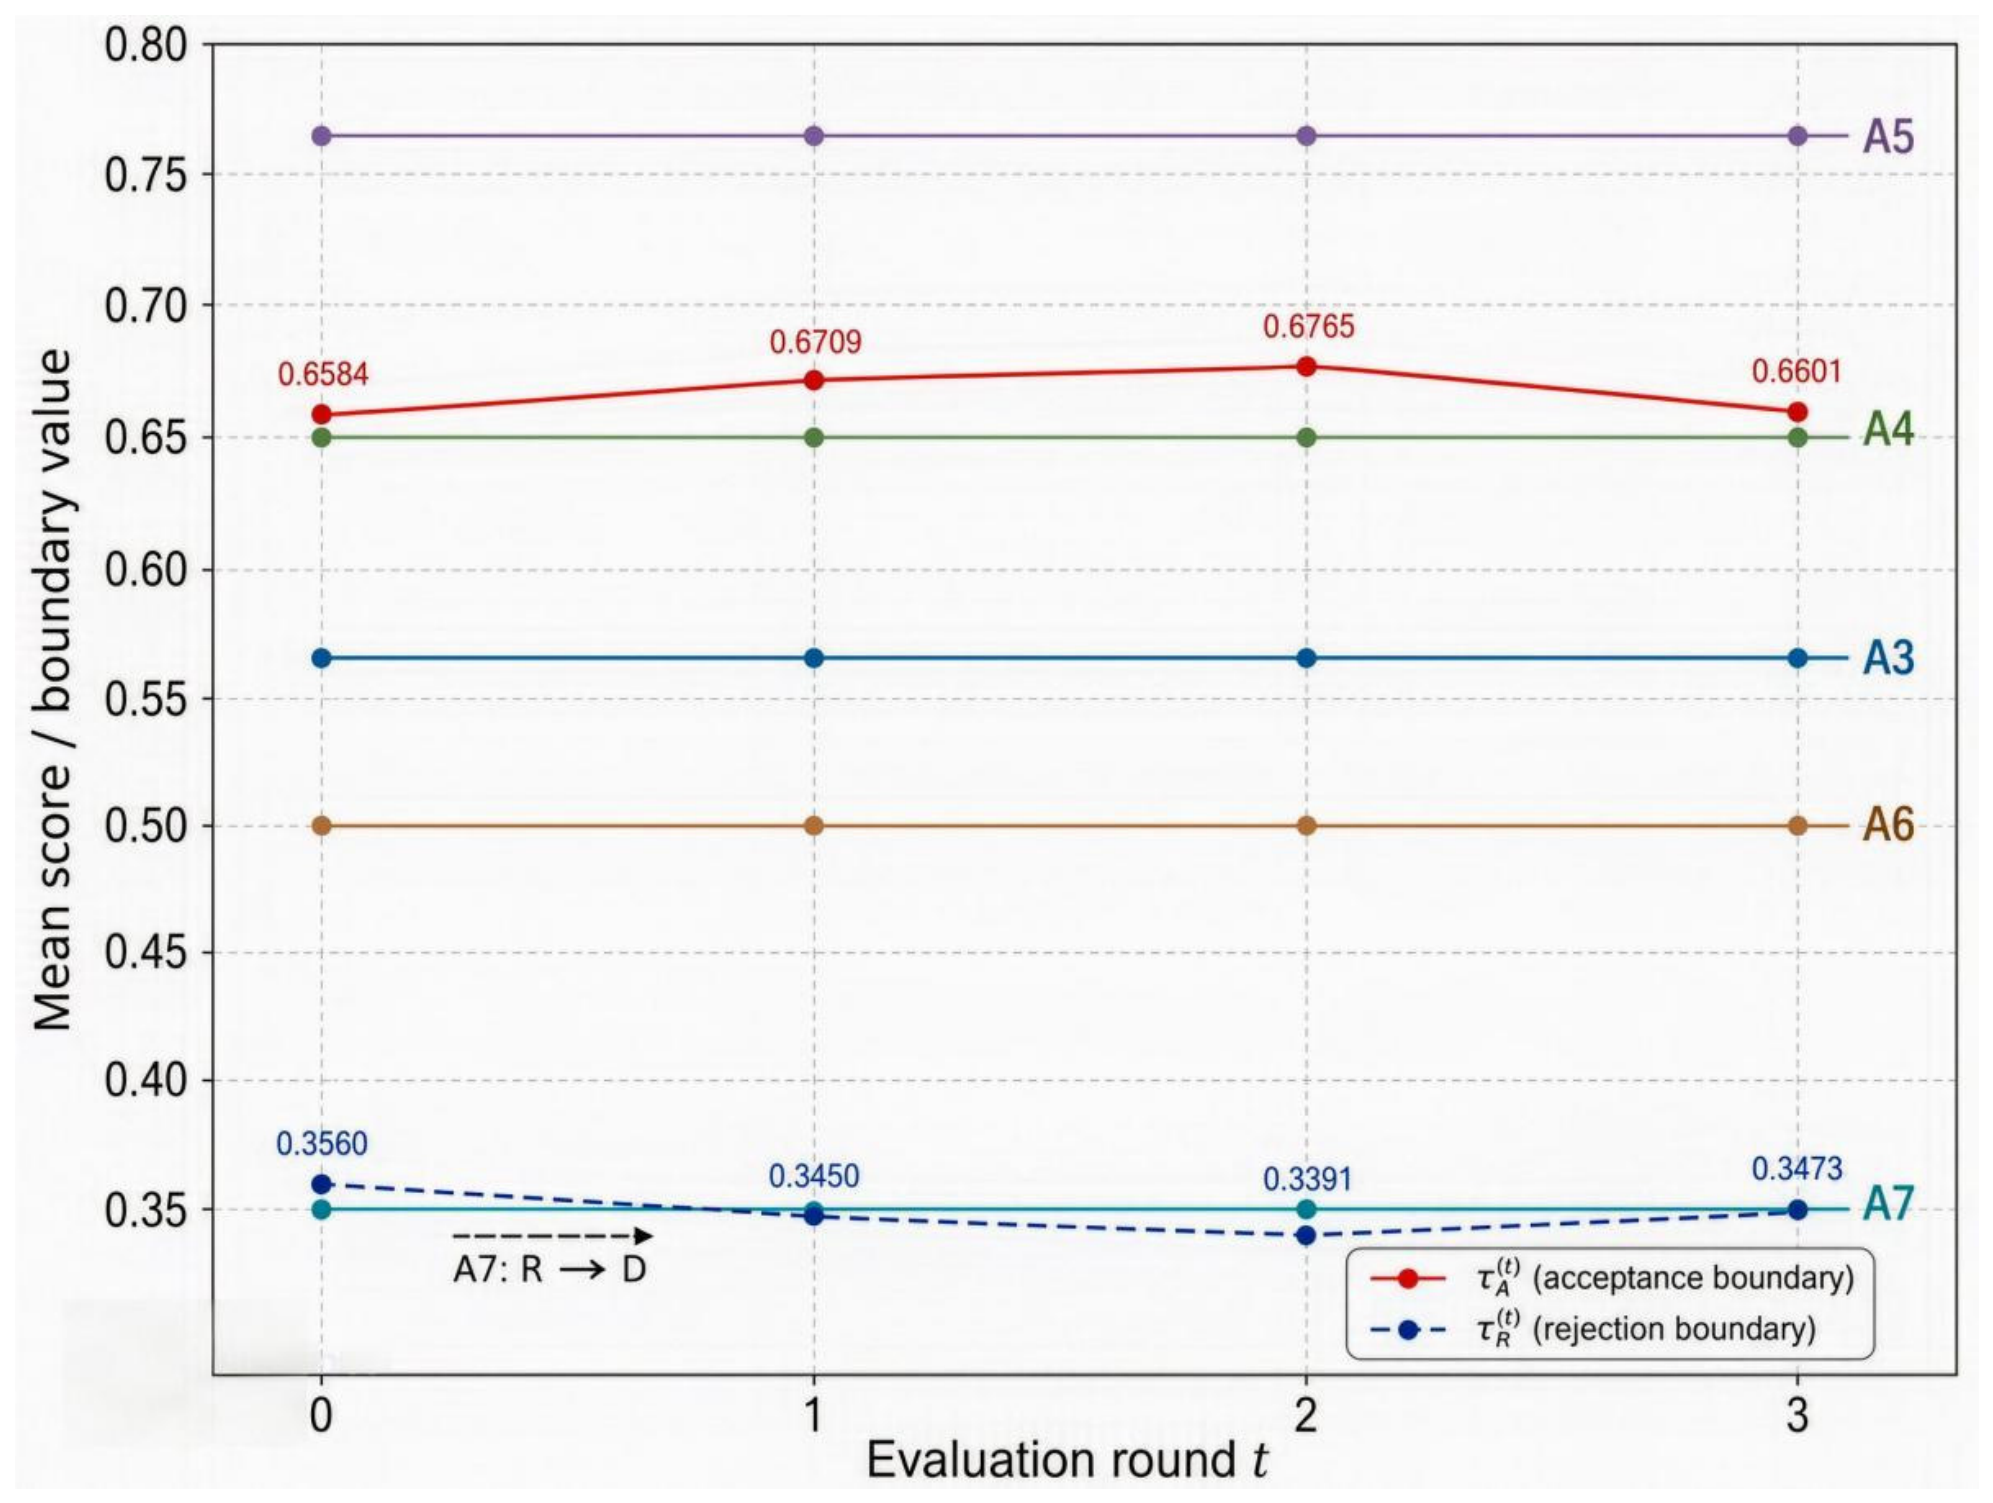
In Round 0, the average composite conflict is 0.2245 and the mean association proxy is 0.6507, yielding a raw interaction of 0.1461. Applying the modulation coefficient of 0.2608 produces a final modulation term of 0.0381. Substitution into the shared action-state vector gives normalized action propensities of 0.3087, 0.2515, and 0.4398. The corresponding acceptance and rejection boundaries are 0.6584 and 0.3560, respectively, consistent with the trajectory reported in
Table 15.
We next examine how the evolving internal state of CABGM affects the generated boundaries and the resulting region assignments.
Table 15 reports the normalized action propensities and the acceptance and rejection boundaries over four evaluation rounds, while
Table 16 presents the corresponding three-way classifications. Taken together, the two tables distinguish changes caused by boundary adaptation from those arising from the revision of individual score vectors.
In Round 0, is assigned to the acceptance region, to the rejection region, and and to the deferment region. Three representative deferred alternatives illustrate why a common mean-score rule is insufficient. Although has a moderate mean score, its channel assessments are sharply divided between high and low values, indicating pronounced directional conflict. The assessments of are comparatively consistent, but its mean score remains immediately below the acceptance boundary, making it a threshold-adjacent case. By contrast, the scores of are concentrated near the middle of the scale and provide no sufficiently clear directional signal. The deferment region therefore does not combine all indeterminate alternatives into an undifferentiated category. Instead, it preserves distinct cases requiring conflict resolution, threshold review, or additional evidence.
After Round 0, moves from the rejection region to the deferment region, although its score vector remains unchanged because alternatives assigned to the rejection region are not score-updated. The migration is caused by the feedback-sensitive rejection boundary, which decreases from 0.3560 to 0.3450. This result provides a direct illustration of boundary adaptation that is independent of mechanical score smoothing. It should not, however, be interpreted as evidence that the revised classification is externally more accurate.
Table 15 and
Table 16 summarize four evaluations under the common stopping protocol. The region assignments obtained after Round 1 remain unchanged in Rounds 2 and 3, and the procedure therefore terminates after two consecutive unchanged transitions. The acceptance boundary increases from 0.6584 to 0.6765 through Round 2 before declining to 0.6601 in Round 3. Over the same period, the rejection boundary decreases from 0.3560 to 0.3391 and subsequently rises to 0.3473. This partial reversal reflects the changing feedback residual and shows that the generated boundaries need not evolve monotonically across rounds. The observed stabilization is a reproducible property of the specified operating point rather than a general convergence result.
The numerical entries alone do not show how individual alternatives are positioned relative to the moving boundaries.
Figure 3 therefore displays the acceptance and rejection boundaries together with representative area trajectories. The figure provides a case-specific visualization of the reported model run and should not be interpreted as evidence of global convergence.
Figure 3 shows how the two boundaries evolve as the internal state of CABGM is recalculated. Alternatives retained in the deferment region remain available for internal re-evaluation, whereas the score vectors of accepted and rejected alternatives remain fixed. Nevertheless, a change in the generated boundaries may alter the region membership of an alternative whose score vector has not changed, as illustrated by the movement of
after the rejection boundary decreases. The figure therefore makes the distinction between score revision and boundary adaptation explicit, while the broader boundedness and conditional-stability properties are addressed separately in
Section 3.5.
4.4. Mechanism Controls and Cross-Framework Benchmarks Under a Common Numerical Protocol
The comparisons in this section are intended to diagnose differences among mechanisms rather than to assess predictive performance. All methods use the same initial score matrix, evaluation budget, and final three-way reporting scheme. Where a comparator requires fixed scalar cutoffs, common acceptance and rejection reference points are used, whereas CABGM retains its state-dependent boundaries. The internal controls isolate the effects of score contraction and boundary feedback. Two cross-framework comparators are also included: a scalar-score adaptation of the adaptive-consensus logic proposed by Yan et al. [
17] and a reliability-informed Dirichlet comparator for uncertainty in evidence-channel weights, motivated by the Bayesian decision-network framework of Gu et al. [
24] and the Bayesian bootstrap of Rubin [
36].
The full CABGM specification is retained as defined in
Section 3.1,
Section 3.2,
Section 3.3,
Section 3.4 and
Section 3.5, including the composite-conflict diagnostic, constructed association proxy, normalized action-propensity mapping, feedback function, dynamic boundary equations, deferred-score update rule, structural coefficient vector, and stopping protocol. The frozen-score and no-feedback controls modify only the component identified by their respective names. The adaptive-consensus and Bayesian procedures are external comparators and do not alter the CABGM formulation.
The original adaptive-consensus and Bayesian frameworks rely on hesitant linguistic distributions, clustering structures, or event-specific conditional probability tables that are unavailable in the present scalar-score matrix. The implementations used here should therefore be understood as transparent scalar-score adaptations that preserve selected procedural principles of the cited methods, rather than as exact reproductions of their original formulations.
All iterative procedures are subject to a maximum of eight evaluations. The CABGM-based specifications use the classification-stability and score-tolerance stopping rule defined in the original implementation. Let denote the three-way partition at evaluation round . Specifically, both and must hold for two consecutive transitions. The adaptive-consensus comparator instead follows its prespecified consensus target for all alternatives. Static procedures and the Bayesian weight-uncertainty comparator contain no iterative score-update step and are therefore reported as one-evaluation mechanisms. This difference is stated explicitly rather than subsumed under a common definition of convergence.
For comparison with adaptive emergency-consensus methods, the logic of Yan et al. [
17] is adapted to direct scalar scores. For alternative
at evaluation round
, the consensus level is defined as
. The adjustment rate is specified as
. Each score is then revised toward the within-alternative mean:
. The procedure terminates when all alternatives satisfy
, or when the eight-evaluation budget is exhausted. The final means are classified using the common reference thresholds of 0.65 and 0.35. This implementation retains the adaptive consensus-adjustment principle of Yan et al. [
17], while replacing hesitant fuzzy 2-tuple linguistic information with the direct scalar scores available in the present study. In the controlled scenario, the comparator terminates after six evaluations, reduces average pairwise dispersion from 0.1700 to 0.0608, and produces
.
Uncertainty in channel importance is examined using a reliability-informed Dirichlet specification for the channel weights. For Monte Carlo draw , the channel-weight vector is sampled as , where denotes the reliability of evidence channel , and is the mean channel reliability. This normalization yields The weighted score of alternative in draw ν is then calculated as A total of 200,000 Monte Carlo draws are generated using random seed 20260803. Alternative is assigned to the acceptance region when and to the rejection region when All remaining alternatives are assigned to the deferment region.
This comparator represents reliability-informed uncertainty in channel weights rather than a complete disaster-specific Bayesian network. In the controlled scenario, it produces , , .
The acceptance-support probability for is 0.5043, while the rejection-support probability for is 0.4562. Neither reaches the commitment threshold of 0.80, and both alternatives are therefore retained in deferment. The acceptance-support probability for is 1.0000, whereas the rejection-support probabilities for are all 1.0000. Multiplying the full Dirichlet concentration vector by 0.5, 1, 2, 4, or 8 does not alter the resulting partition.
A value of 0.80 was specified a priori as a symmetric, conservative commitment threshold; it was neither estimated nor optimized from the controlled results. The score cutoffs 0.65 and 0.35 define the acceptance-support and rejection-support events, respectively, whereas governs the posterior support required before either event produces a decisive assignment. A threshold-sensitivity check was therefore conducted for using the same 200,000 reliability-informed Dirichlet draws and random seed. The resulting partition was unchanged at all six thresholds: , , and . The comparator’s controlled partition is therefore insensitive to the commitment threshold within this prespecified range, although 0.80 remains an operating rule rather than an empirically calibrated probability cutoff.
The fixed-threshold conflict gate retains the initial score matrix and applies acceptance and rejection boundaries of 0.65 and 0.35, respectively. Its conflict-safety margins are identical to those used in the CABGM controlled scenario, but neither the scores nor the internal state can alter the two boundaries.
The opinion-distance update revises deferred score vectors toward their within-alternative means using the common adjustment step of 0.25 specified in the original implementation, followed by reclassification under the fixed boundaries. Because this operation preserves each alternative-level mean, it reduces within-alternative dispersion without changing the score-based ordering.
The frozen-score feedback control keeps the score matrix unchanged while allowing the original CABGM feedback mechanism to modify the association-modulation coefficient and the two dynamic boundaries. It therefore isolates boundary movement from score smoothing without changing any structural coefficient.
The no-feedback CABGM retains the composite-conflict diagnostic, constructed association proxy, normalized action-propensity mapping, row-stochastic score update, structural coefficient vector, and conflict-safety rules. Classification-history feedback is removed only from the association-modulation coefficient and the two boundary functions, in accordance with the control specification.
Full CABGM is implemented as specified in
Section 3.1,
Section 3.2,
Section 3.3,
Section 3.4 and
Section 3.5. Deferred alternatives undergo the prescribed score-update process, and the resulting classification state enters the feedback calculation for the next evaluation. Its four-evaluation trajectory is the same as that reported in
Table 15 and
Table 16.
As shown in
Table 17, no method dominates all internal comparison criteria. The initial average pairwise dispersion is 0.1700. The opinion-distance update reduces this value to 0.0956 with a mean absolute adjustment of 0.0516. The adaptive-consensus comparator yields the lowest final dispersion, 0.0608, but requires six evaluations and produces the largest mean absolute adjustment, 0.0788. The no-feedback CABGM ends with a dispersion of 0.0869 and an adjustment of 0.0595, whereas full CABGM ends with a dispersion of 0.0996 and an adjustment of 0.0503. Because the fixed-threshold, Bayesian, and frozen-score procedures leave the score matrix unchanged, their final dispersion remains 0.1700.
The fixed-threshold conflict gate assigns the two threshold-adjacent alternatives decisively: enters acceptance and enters rejection. The opinion-distance update reduces score dispersion but retains the same partition because it preserves each alternative-level mean. The adaptive-consensus adaptation produces the strongest contraction of disagreement, yet its use of fixed reference thresholds likewise leaves accepted and rejected. Stronger consensus contraction therefore does not, by itself, generate conflict-responsive action boundaries.
The Bayesian comparator integrates over reliability-informed channel weights without altering the score matrix. It retains and in deferment because neither reaches the probability threshold required for commitment. Its final controlled partition is identical to that produced by full CABGM, although the two procedures reach that partition through different mechanisms.
The frozen-score feedback control provides a more direct attribution of the boundary effect. Under this control, moves from rejection to deferment even though its score vector remains unchanged. The migration must therefore be attributed to the movement of the feedback-sensitive rejection boundary rather than to score smoothing. Conversely, when classification-history feedback is removed, returns to acceptance and remains in rejection, even though the original deferred-score update is retained.
Full CABGM reaches the same final controlled partition as the Bayesian weight-uncertainty comparator, but it does so through an explicit trajectory of feedback-sensitive boundary adjustment rather than through a one-evaluation probability-based commitment rule. It does not yield the lowest final dispersion, require the fewest evaluations, or produce a uniquely more cautious partition. Its incremental contribution lies in making the transmission of diagnosed conflict into action-boundary adjustment explicit and traceable.
Each iterative method is evaluated under its disclosed stopping rule and evaluation budget. The adaptive-consensus comparator retains its own consensus target because it is designed to achieve consensus rather than CABGM-style classification stability. In the absence of independently observed outcome losses, the methods are compared in terms of region behavior, adjustment burden, dispersion, and diagnostic transparency, rather than ranked according to predictive accuracy.
The controls and cross-framework benchmarks thus separate the effects of score contraction, channel-weight uncertainty, and boundary feedback. The opinion-distance and adaptive-consensus procedures reduce dispersion while retaining decisive classifications for and . The Bayesian comparator and full CABGM defer both alternatives, while the frozen-score control establishes that the migration of can occur without any change in its score vector. These results support a mechanism-based interpretation of CABGM rather than a claim of uniform conservatism or superior external accuracy.
4.5. Challenge-Case Analysis and Operational Interpretation
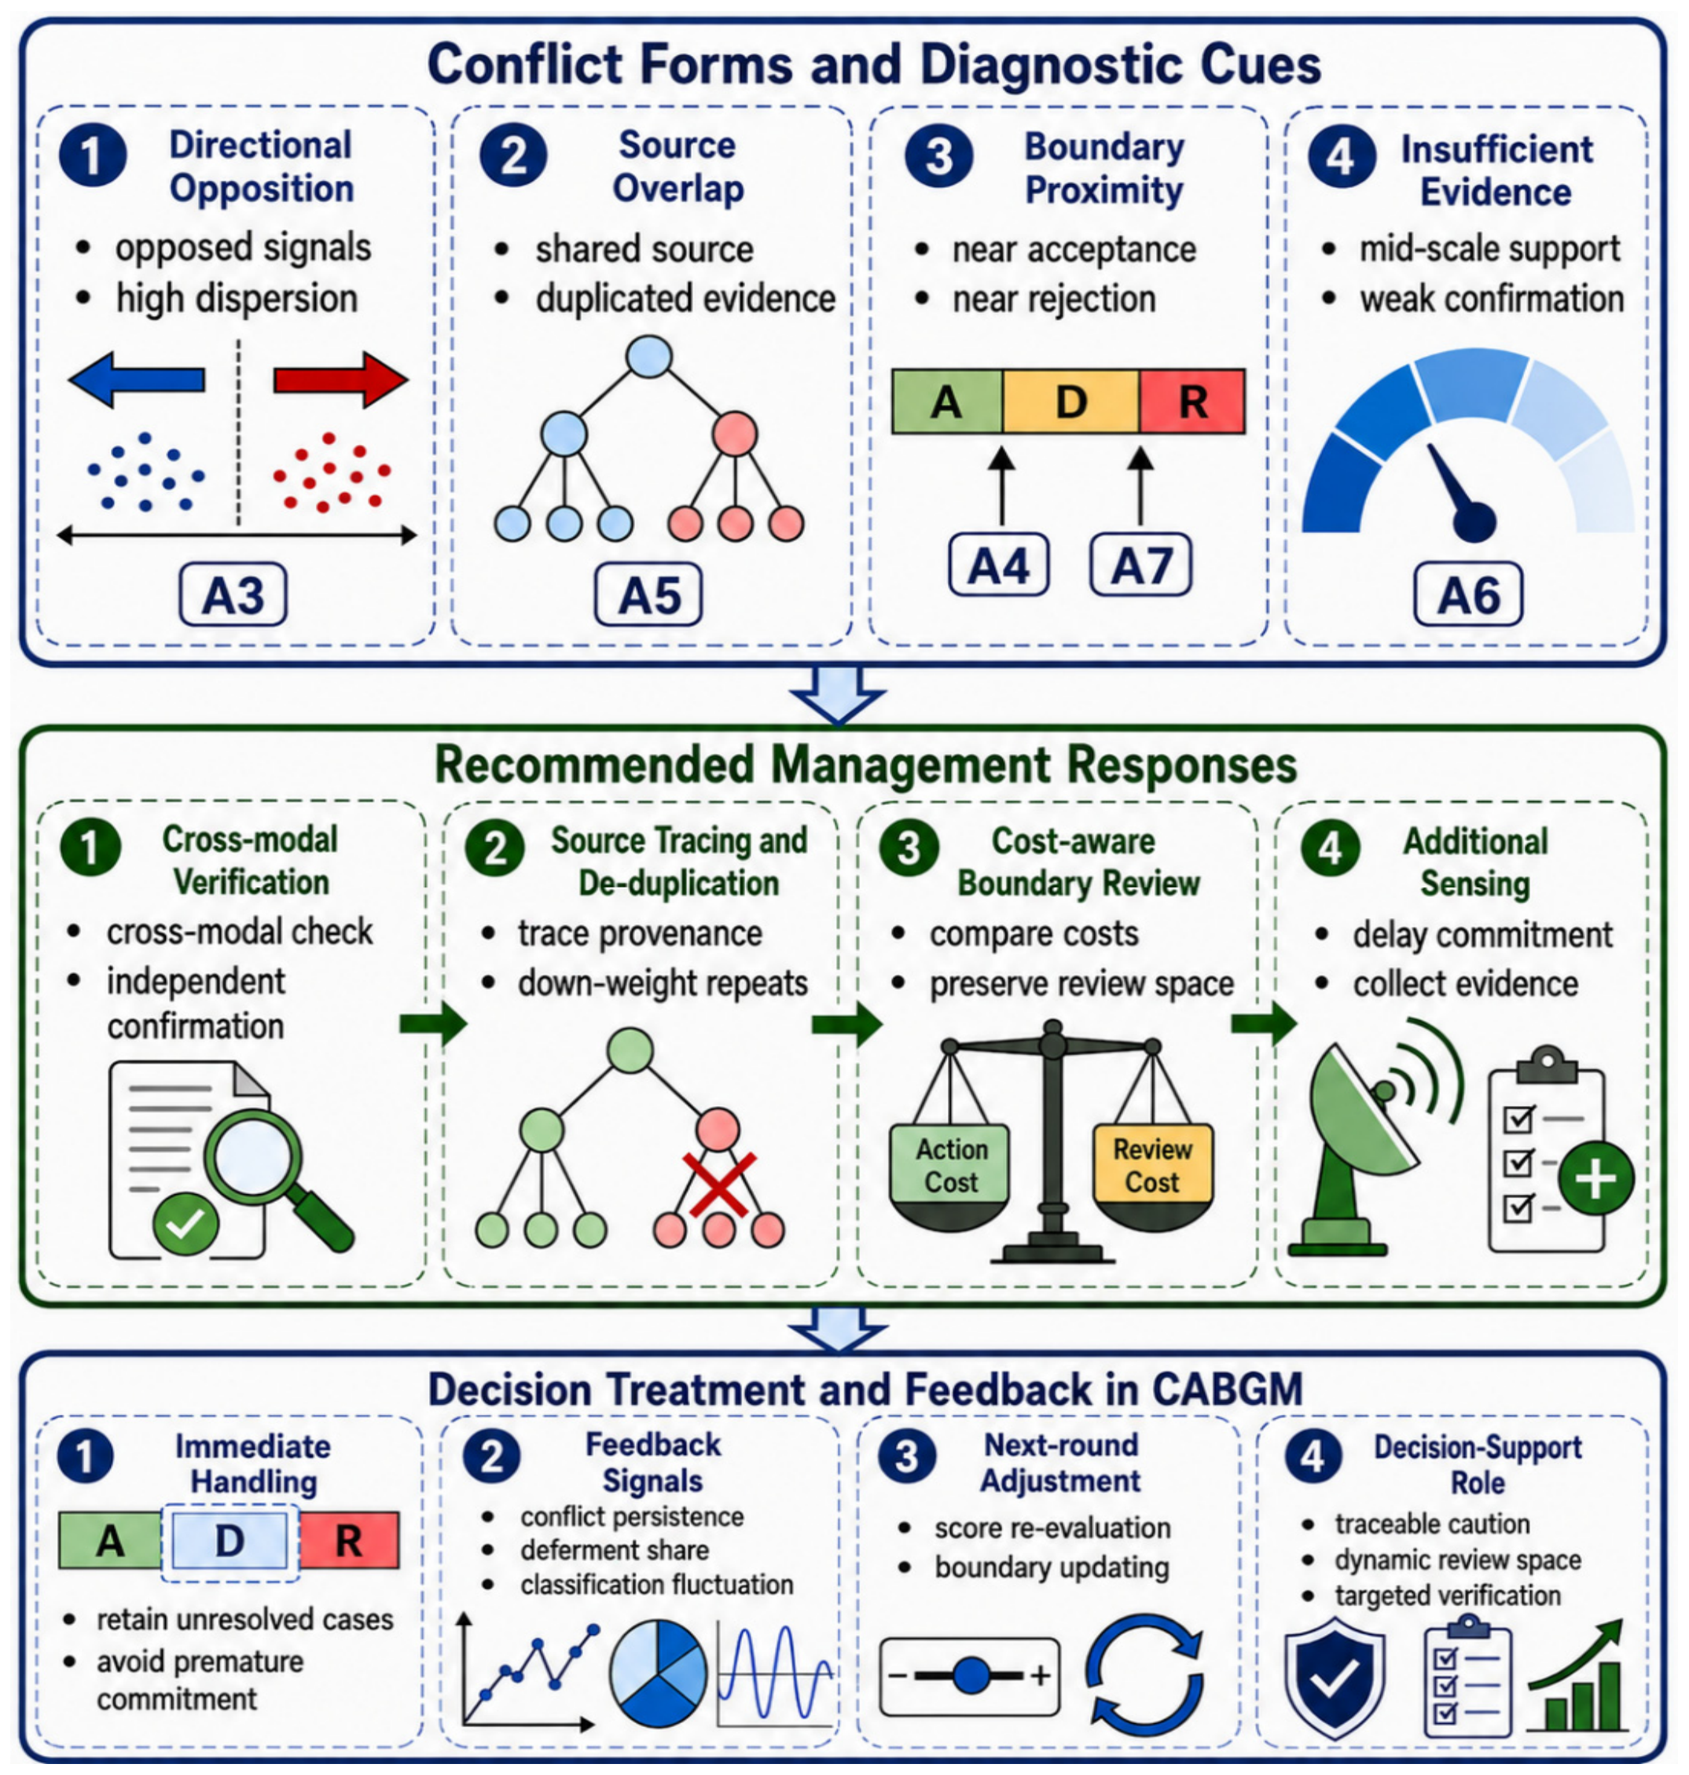
The challenge cases identified above imply distinct verification needs, which are summarized in
Figure 4.
Figure 4 links the evidential conditions diagnosed by CABGM to their corresponding management responses. Directional opposition motivates targeted reinforcement of the evidence base; source overlap calls for source tracing and deduplication; boundary proximity requires cost-aware review; and insufficient evidence indicates that further sensing is needed before a definitive commitment is made. These responses are connected to the deferment and feedback mechanisms of CABGM, through which unresolved alternatives remain available for further verification and subsequent boundary adjustment. The figure clarifies the operational interpretation of deferment but does not prescribe a specific field intervention or establish the effectiveness of any management response.
Table 18 recasts the controlled comparison as an internal conflict- and boundary-safety diagnostic. The diagnostic labels are defined from the initial score structure before model classification and are not derived from the resulting region assignments. The reported counts therefore indicate whether a method makes a decisive assignment for an alternative that has been prespecified as requiring further review. The challenge-case comparison is intended to examine commitment behavior under prespecified difficult evidence configurations rather than to estimate classification error. The contrast between the no-feedback and full CABGM specifications isolates the contribution of feedback-sensitive boundary adjustment, while the frozen-score control confirms that boundary-driven reclassification can occur without score revision.
The directional high-conflict set requires both directional opposition and substantial pairwise dispersion. It is defined as . Under the reported thresholds, is the controlled high-conflict alternative.
A separate boundary-adjacent set is defined as . This set contains and . In the present controlled scenario, a decisive boundary-adjacent assignment means accepting or rejecting , rather than retaining the alternative in the deferment region.
These diagnostics are deterministic functions of the controlled input matrix. They are independent of the final region assignments, although they necessarily depend on the input scores from which they are constructed. Their purpose is to compare how different methods implement caution under the same controlled scenario.
Alternative satisfies the directional high-conflict diagnostic, and none of the reported methods directly accepts it under the reproduced controlled protocol. The more informative distinction concerns and , which constitute the boundary-adjacent set. The fixed-threshold conflict gate, opinion-distance update, adaptive-consensus adaptation, and no-feedback CABGM make decisive assignments for both alternatives. By contrast, the Bayesian weight-uncertainty comparator, frozen-score feedback control, and full CABGM retain them in the deferment region.
Taken together,
Table 17 and
Table 18 provide a more precise account of the incremental mechanism represented by CABGM. The adaptive-consensus comparator achieves the strongest contraction of disagreement, whereas the Bayesian weight-uncertainty comparator produces the same final controlled partition as full CABGM without iterative score revision. CABGM therefore does not dominate the broader benchmarks under every numerical criterion. Its distinctive contribution is more specific: the cautious treatment of
and
is generated through feedback-sensitive action boundaries and remains traceable across evaluation rounds, while requiring a smaller mean absolute score adjustment than the adaptive-consensus comparator.
4.6. Joint and Local Sensitivity of Core Parameter Groups
The sensitivity analysis is intended to characterize parameter uncertainty around the baseline operating point rather than to estimate, select, or recalibrate the structural coefficients. The baseline specification remains unchanged throughout the analysis, and none of the sensitivity results is used to optimize the reported three-way classification.
The one-at-a-time local sweeps are complemented by a variance-based total-effect screening of six parameter groups [
37,
38]: action scores, association weights, boundary coefficients, conflict weights, feedback-update parameters, and modulation coefficients. Each group is varied within a ±30% neighborhood of the baseline setting, while the prescribed normalization conditions, coefficient signs, boundary ordering, and feasible boundary intervals are maintained. The screening design uses two independent base samples of 256 points each, together with one hybrid matrix for each parameter group. Total-effect indices are calculated for the final acceptance boundary, final rejection boundary, deferment share, and average composite conflict.
First-order indices are not reported because the available Monte Carlo design yielded unstable estimates for the discrete classification output. The total-effect indices should therefore be interpreted as local screening measures within the specified scenario neighborhood, rather than as identified population quantities or estimates of causal parameter effects.
Table 19 shows that the boundary-coefficient group has the largest total effect on all four reported outputs. Its influence is particularly pronounced for the acceptance boundary, deferment share, and average composite conflict, with total-effect indices of 0.915, 0.943, and 0.956, respectively. The action-score group also contributes materially, especially to the rejection boundary and average conflict. By comparison, the association-weight and modulation groups have very small total effects within the tested neighborhood. This pattern indicates local equifinality: multiple nearby specifications of these parameters can produce similar boundary values and region assignments.
The comparatively modest effects associated with the conflict-weight and feedback-update groups should not be interpreted as evidence that these components are unnecessary. Their influence is conditional on the integrated model structure and the restricted neighborhood examined here. The screening identifies which groups account for the greatest output variation around the current operating point; it does not assess the contribution of a component when that component is removed from the integrated model.
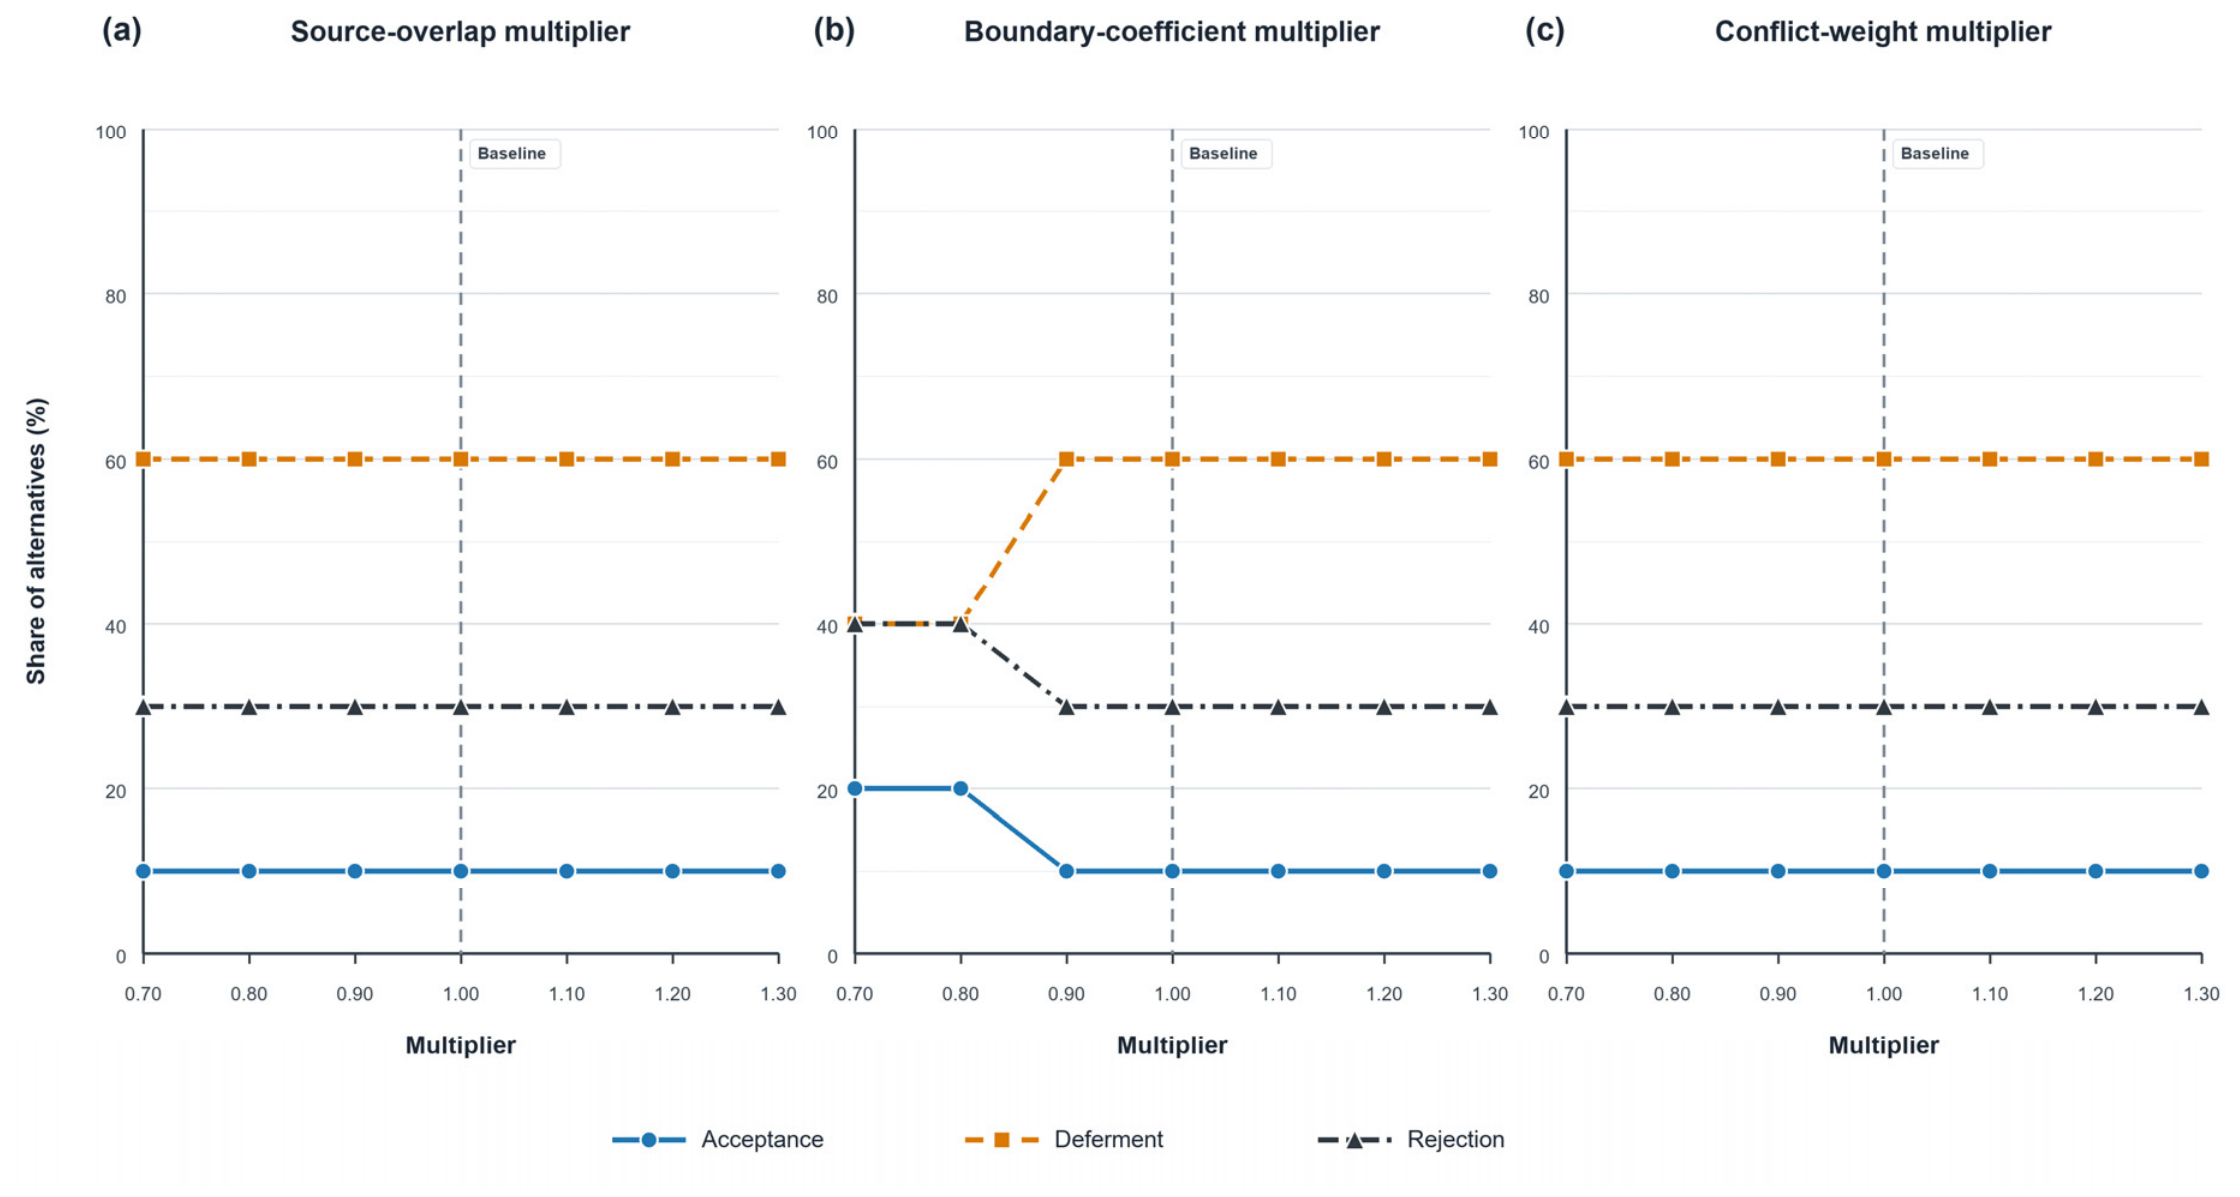
Figure 5 complements the group-level screening by displaying changes in the proportions of alternatives assigned to the acceptance, deferment, and rejection regions under one-at-a-time variation of three selected parameter groups. Panel (a) varies the source-overlap multiplier, Panel (b) varies the boundary-coefficient multiplier, and Panel (c) varies the conflict-weight specification multiplier. A multiplier of 1.00 corresponds to the baseline specification. The trajectories illustrate local responses within the displayed admissible ranges and should not be interpreted as empirically estimated response functions.
Taken together, the local sweeps and total-effect screening do not establish global robustness or empirical calibration. They show that, within the tested ±30% admissible neighborhood, the controlled trajectory is most sensitive to the boundary and action-score groups, whereas the association and modulation groups exhibit greater local equifinality. Future operational calibration should therefore prioritize information capable of identifying the boundary and action-score specifications before attempting fine adjustment of the association or modulation terms. The present single-event setting is insufficient to determine a unique coefficient vector for any of these groups.
4.7. Local Perturbation Analysis of Evidence-Channel Scores
Whereas
Section 4.6 examines uncertainty in the structural parameter groups, the present experiment evaluates local sensitivity to perturbations in the input scores. For repetition b and disturbance level p, every entry of the controlled area-by-channel matrix is perturbed independently according to
, where
,
, and
. Projection is applied before CABGM evaluation; values outside [0, 1] are clipped to the nearest boundary rather than resampled. The CABGM partition and generated boundaries are then recomputed for each perturbed matrix. Each disturbance level is evaluated over 5000 repetitions using random seed 20260625. Changes in the acceptance and rejection regions are recorded together with the overall proportion of baseline region assignments retained. The resulting classification changes and Wilson 95% confidence intervals are reported in
Table 20.
As the disturbance magnitude increases from ±5% to ±15%, the classification-retention rate decreases from 96.4% to 92.5%. At ±5%, the acceptance and rejection regions change in 15.5% and 20.5% of repetitions, respectively; at ±15%, the corresponding rates rise to 35.5% and 39.1%. Nevertheless, more than 92% of the baseline region assignments are retained at every disturbance level. No entry was clipped at ±5%; 338 of 200,000 entries (0.17%) were clipped at ±10%, and 1942 of 200,000 entries (0.97%) were clipped at ±15%. These low clipping frequencies suggest that the retention estimates are not primarily driven by values accumulating at the admissible boundaries.
The rising region-change rates indicate that boundary-adjacent alternatives respond to both local score movement and the system-level regeneration of the CABGM boundaries. Because all 40 score entries are perturbed and the classification mechanism is rerun, a change in the acceptance or rejection region cannot be attributed to a single score in isolation. The retained-assignment measure is therefore the more direct summary of local stability: it evaluates all alternative-level assignments rather than requiring the complete acceptance or rejection set to remain identical.
These results indicate substantial, but not complete, local retention around the controlled score matrix reported in
Table 4. They do not establish global robustness, because the experiment considers independent multiplicative perturbations only within a limited neighborhood of that matrix. The experiment also does not address uncertainty in the structural coefficients, which is examined separately in
Section 4.6. The reported clipping rule and frequencies make the numerical experiment reproducible while also delimiting the interpretation of the observed retention rates.
4.8. Multi-Scenario Synthetic Stress Test
The preceding analyses examine CABGM in the neighborhood of a single controlled score matrix. To assess its mechanism behavior across a broader range of synthetic evidence structures, the stress test jointly varies the score-generating process and the source-overlap structure. Three score processes—uniform, centered beta, and polarized correlated—are crossed with low, medium, and high source-overlap settings, yielding nine experimental conditions. Each condition contains 1000 independently generated matrices, with ten alternatives and four evidence channels in each matrix. All simulations use random seed 20260625. For
, the overlap matrix for level h is constructed as
, with
and symmetry imposed, where
,
,
. This transformation shifts the mean off-diagonal overlap while retaining 35% of the baseline pairwise deviations.
This experiment is intended to examine whether the conflict-sensitive classification mechanism behaves consistently across different synthetic score structures. It is not an extension of the public-record audit and does not provide additional evidence concerning rank concordance with documented operational attention. The high-conflict and ambiguous challenge criteria are calculated directly from each generated initial score matrix before CABGM-specific feedback, dynamic-boundary adjustment, or final classification is applied. The reported measures are the share of high-conflict alternatives assigned directly to the acceptance region and the share of ambiguous alternatives retained in the deferment region.
Across the uniform-score conditions, the high-conflict direct-acceptance share ranges from 3.2% to 3.7%, while ambiguous-object retention ranges from 92.8% to 94.2%. Under the centered-beta process, direct acceptance falls to 0.1–0.4% and ambiguous-object retention reaches 99.9–100.0%. Under the polarized-correlated process, no internally identified high-conflict alternative is directly accepted, and ambiguous-object retention is 100.0% at all three overlap levels. The associated Wilson intervals are reported in
Table 21 and were calculated from the 1000 matrices in each condition.
Within each score process, the explicitly constructed low, medium, and high overlap matrices produce comparatively small changes in the two reported outcomes. This does not imply that source overlap is irrelevant to CABGM. Rather, over the off-diagonal ranges 0.107–0.247, 0.357–0.497, and 0.657–0.797, its effect is conditioned by the score distribution and the remaining components of the integrated classification mechanism. The synthetic results therefore characterize joint mechanism behavior and should not be interpreted as isolated causal effects of source overlap.
The fixed-threshold conflict gate is more conservative in these simulations and retains all alternatives flagged by its internal rule. By contrast, opinion-distance contraction produces a higher direct-acceptance rate in the uniform and centered-beta conditions. CABGM occupies an intermediate position between a strict static gate and a convergence-oriented updating rule. This comparison concerns the behavior of the respective mechanisms under synthetic inputs and does not establish that any method is more accurate in operational rescue decisions.
Overall, the stress test indicates that CABGM’s commitment behavior varies more strongly across the three score-generating processes than across the explicitly defined overlap levels examined here. These synthetic results complement, but do not extend, the empirical claims of the public-record audit.
5. Conclusions and Discussion
Earthquake rescue prioritization may become unreliable when an apparently reasonable aggregate score conceals sharply opposed assessments, substantial source overlap, or other forms of potential association among evidence channels. To address this problem, this study developed the Conflict-Driven Action Boundary Generation Model (CABGM), which links composite-conflict diagnosis, a constructed association proxy, normalized action propensities, and feedback-sensitive three-way decision boundaries within a unified framework. Rather than treating disagreement reduction as the sole objective, CABGM retains unresolved or threshold-adjacent alternatives in the deferment region when the available evidence does not yet support immediate commitment.
The empirical audit and controlled mechanism study provide complementary evidence regarding model behavior. In the public-record audit, all five methods produced the same rank-concordance statistics and recovered the same broad historical ordering, although the Bayesian weight-uncertainty comparator retained more settlement-scale units in deferment. The controlled comparison further showed that no method dominates every numerical criterion. The adaptive-consensus adaptation achieved the lowest final dispersion, while the Bayesian comparator produced the same final acceptance/deferment/rejection partition as full CABGM without iterative score revision. These results indicate that historical rank concordance, disagreement contraction, and cautious classification capture different aspects of decision performance and should not be treated as interchangeable measures.
The contribution of CABGM lies primarily in its explicit state-to-boundary mechanism. Composite-conflict diagnosis preserves the form of disagreement instead of compressing all discrepancies into a single distance measure. The constructed association proxy represents potential coupling arising from rating similarity, source non-overlap, and conflict-weighted disagreement, while the Softmax transformation maps the action scores into normalized action propensities rather than empirically calibrated probabilities. These quantities, together with the feedback residual, determine the degree of caution embedded in the acceptance and rejection boundaries at each evaluation round. The model therefore makes the transmission of diagnosed conflict into boundary adjustment explicit and traceable.
The controlled results also distinguish boundary adaptation from score smoothing. Full CABGM retains and for further review with a mean absolute score adjustment of 0.0503, compared with 0.0788 under the adaptive-consensus comparator. More importantly, the frozen-score feedback control shows that can move from the rejection region to the deferment region even when its score vector remains unchanged. This migration is therefore attributable to the movement of the feedback-sensitive rejection boundary rather than to mechanical contraction of the assessments. CABGM does not achieve the lowest dispersion or the fewest evaluations, but it provides a transparent explanation of why an alternative remains unresolved and how that caution emerges from the evolving conflict state.
Several limitations should be acknowledged. The controlled score matrix was designed to examine model mechanisms rather than being reconstructed directly from real-time rescue operations. Although the public-record audit provides a traceable empirical anchor, it remains retrospective and does not constitute independent outcome validation. In addition, the structural coefficients represent a theory-constrained operating specification rather than estimates obtained from multi-event data. Future research should therefore evaluate CABGM across multiple emergency events, incorporate independently defined action or outcome records, and examine application-specific parameter calibration.
From an operational perspective, CABGM should be treated as a human-in-the-loop conflict-screening aid rather than an automatic dispatch rule or a substitute for incident command. When an alternative with relatively strong aggregate support is also characterized by directional opposition, substantial source overlap, or proximity to an action boundary, assignment to the deferment region indicates that the evidential basis for immediate commitment remains insufficient. Appropriate follow-up may involve cross-modal verification, source-provenance tracing, or targeted field inspection. Any corroborating information obtained through these procedures should enter the model as a new observation. It should not be represented by an additional round of score smoothing, because the current update mechanism internally re-evaluates existing assessments rather than assimilating newly acquired field evidence. Transfer to another emergency setting would therefore require a new evidence protocol, external review of the input-construction process, and prespecified decision-cost assumptions.