1. Introduction
With the rapid development of emerging technologies, such as 5G communication, artificial intelligence, and new energy vehicles, technology standardization has emerged as an important mechanism for promoting industry innovation routines and ensuring market fairness. As an effective mechanism for reducing licensing friction and trade costs, the patent pool has become a crucial regulatory infrastructure within technology standardization and the technology ecosystem [
1]. For example, the HEVC/VVC pool provides a package license covering all current HEVC versions, while MPEG LA offers bundled licensing for the essential patents of the H.264 video coding standard [
2].
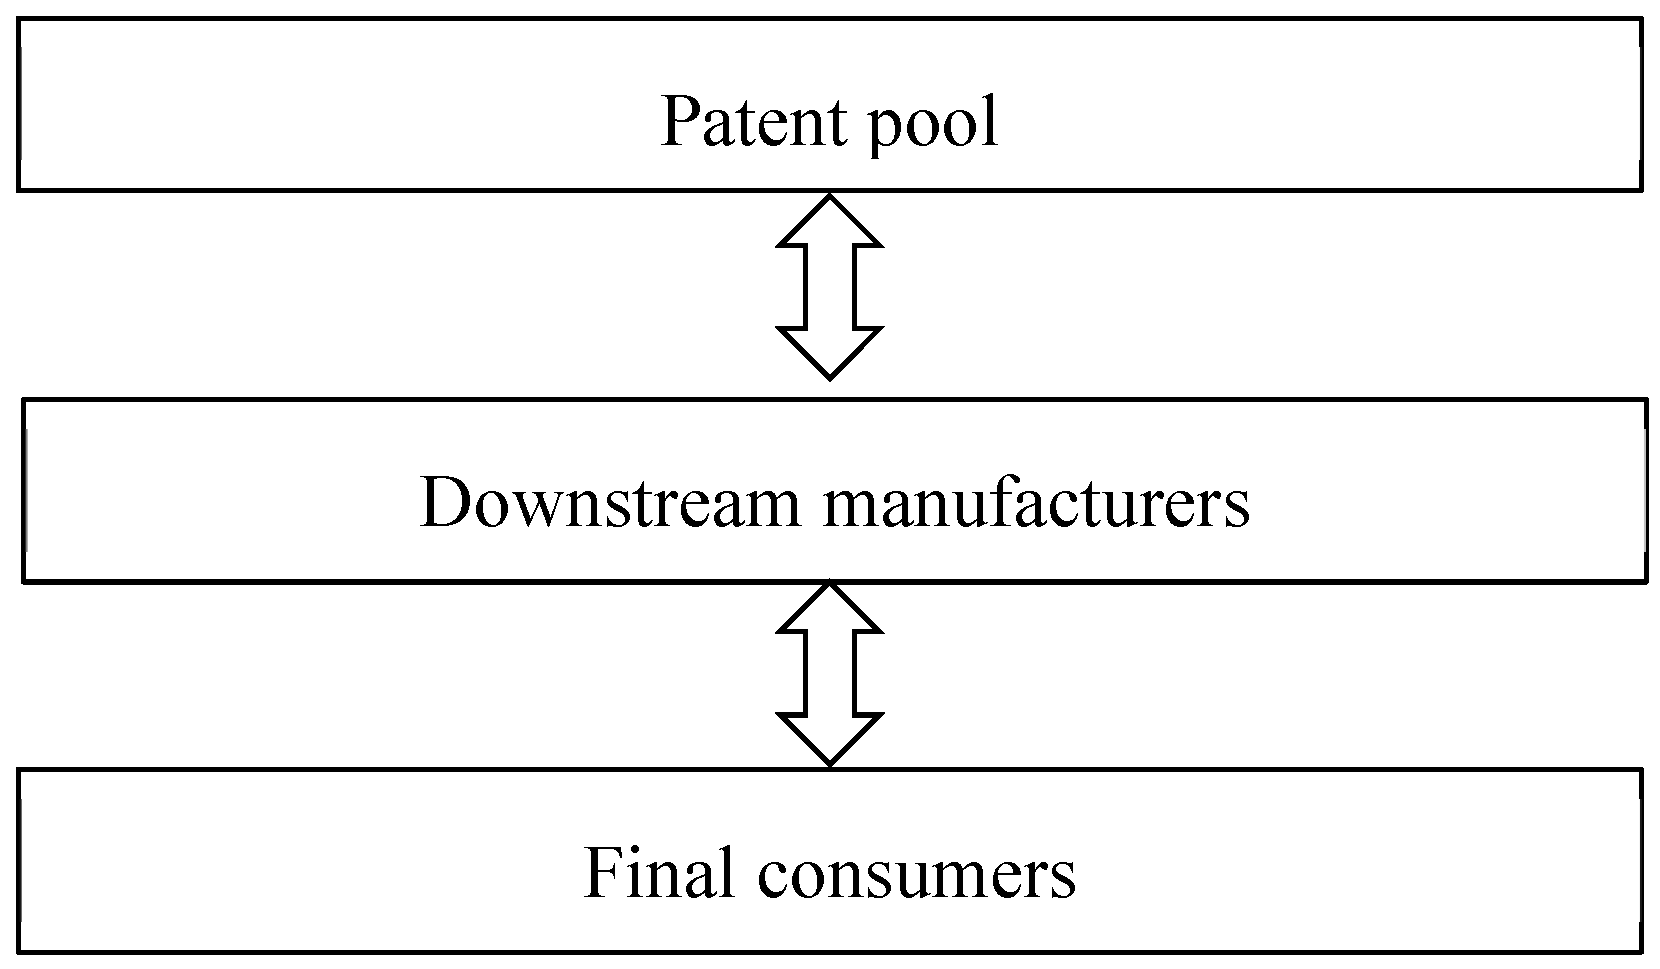
From a systems perspective, the technology ecosystem can be conceptualized as a multi-layer complex system consisting of the patent pool, external patents, downstream manufacturers, and final consumers. In the upstream market layer, the patent pool and external patent holders act as technology providers, licensing patents to licensees, which are the manufacturers. In the downstream market layer, the manufacturers utilize the licensed patents as critical input to produce products for final consumers. The structure of the patent technology ecosystem is shown in
Figure 1.
Patent pools function via agreements among patent holders that outline the systemic terms and conditions of licensing. Usually, the management models of a patent pool system are defined by two primary dimensions: the licensing model and the administration model.
First, regarding the licensing dimension, two primary models dictate the distribution of technologies: package licensing and individual licensing. Under the package licensing model, the patent pool offers a single, comprehensive license for constituent patents. The system’s total revenue is then distributed among participants. For instance, patent pools like MPEG LA, DVD 6C, and various 5G consortia offer one license for their standard essential patents (SEPs), effectively mitigating the risks of patent negotiations and litigation [
3]. Conversely, under the individual licensing model, the pool allows each patent holder to establish a distinct licensing agreement for their patents with a third-party licensee. For example, the Open Invention Network (OIN) and LOT network permit participants in the patent pool to license their patents to other entities [
4,
5].
Besides the variety in licensing, there are also different strategies for patent pool administration. There are two main administration models in the operation of patent pools: the self-administration model and third-party administration model. Under the self-administration model, core patent holders take responsibility for formulating and managing the patent pool, as well as licensing the patents within it. These core patent holders often implement targeted licensing strategies based on their own profits. For example, the Haier small home patent pool is managed by Haier itself, and the Wanhua polyurethane industry chain patent pool is administered by Wanhua [
6,
7].
In contrast, in the third-party administration model, the patent pool is governed by a neutral entity or a specialized organization. This entity manages the licenses, collects payments, and distributes royalties among the consortium members [
8]. The independent third-party administrator usually determines the licensing fee by considering the total profits of the patent pool. For example, the video distribution patent pool is administered by Access Advance [
9], and Sisvel administers multiple patent pools such as DVB-T2, AV1, Wi-Fi 6, and Cellular IoT [
10].
The patent pool system management, which consists of licensing and administration models, is of great significance to the technology ecosystem. Since downstream manufacturers produce products based on these patents, an appropriate management model, encompassing both the licensing model and administration model, can lower the barriers for manufacturers to access core technologies. This, in turn, influences the manufacturers’ decisions in the downstream market. As a result, when exploring the patent pool’s management strategies, which encompass the licensing model and the administration model, it is necessary to consider the downstream manufacturers’ decisions in the technology ecosystem.
The patent pool’s management strategies have not been thoroughly explored in previous research. To bridge this gap, we aim to address the following research questions:
How should the patent pool system choose its optimal management strategies, covering both licensing and administration models within the government system?
How does the patent pool system impact the downstream market?
How do system parameters affect patent pool system state?
We present a game-theoretical model to study the management strategies for the patent pool system, considering the downstream manufacturers’ decisions under different licensing and administration models. We find that when the operational cost is low, the patent pool system adopts package licensing with self-administration. When the operational cost is high, if the revenue share is low, the system state shifts to individual licensing with third-party administration. If the revenue share is high, it shifts to package licensing with third-party administration. Compared to the other system states, package licensing with third-party administration encourages manufacturers to produce higher outputs, thereby intensifying downstream market competition. As the external patent royalty rate increases, the core patent holder tends to reduce its royalty rate, while the complementary patent holder and independent third-party administrator tend to raise theirs. We also examine the impacts of system features such as revenue share, risk cost, and external royalty on the patent pool system state.
Our contributions can be summarized from three aspects. First, we explore the patent pool system management strategies within a three-layer technology ecosystem, where manufacturers engage in competition in the downstream market layer. This multi-layer system structure enables a more comprehensive understanding of how the patent pool interacts with the competitive dynamics in the downstream market system. Second, we investigate the coordination between licensing models, namely individual licensing and package licensing, and administration models, specifically self-administration and third-party administration, in the context of the equilibrium of the patent pool system. By studying this, we can uncover the optimal combinations of these models that lead to an efficient patent pool system. Third, we examine the effects of the patent pool system on downstream market competition and royalty rates. Additionally, we analyze how system features influence the system states. This provides a more comprehensive understanding of the patent pool system management within complex technology and economic systems.
The remainder of this paper is structured as follows. In
Section 2, we review the related literature.
Section 3 outlines our model setup. Subsequently, in
Section 4, we analyze the management strategies of the patent pool system and their impact on the downstream market. Next, in
Section 5, we examine how system features influence the patent pool system states.
Section 6 concludes the paper.
2. Literature Review
Our work draws on two lines of literature, i.e., studies on patent pool licensing, and studies on patent pool administration.
2.1. Patent Pool Licensing
Licensing determines how patents within a patent pool are priced, influencing patent holders’ profits, manufacturers’ costs, and consumer welfare. A number of studies have explored patent pools from diverse aspects, such as litigation strategies [
11], bargaining [
12], sharing rules [
13,
14], dominant design [
15], industry control and innovation [
16] and knowledge spillover [
17]. Different from these, our study focuses on the patent pool’s selection between individual licensing and package licensing.
The literature has delved into individual licensing and package licensing within a patent pool. Under package licensing, the patent pool sets a unified royalty rate for the bundled patents in the pool, with revenues distributed among holders [
18,
19]. Scholars have analyzed package licensing and examined its effects. For example, Wang et al. (2013) studied patent licensing among manufacturers with cost differentials [
20]. Henkel (2022) explored the licensing level of essential patents from a value-chain perspective [
21]. Gallini (2014) discovered that package licensing can lower downstream product prices, softening competition between pooled and non-pooled products [
18]. Empirically, package licensing has been found to simplify licensing for patent implementers. Peng et al. (2026) found that coordinated pricing is most effective under moderate technological turbulence for patent pools [
22].
Under individual licensing, the patent pool allows participants to set their patent licensing fees independently [
19,
23]. Individual licensing has been regarded as a “screening mechanism” that enables patent holders to undercut the pool’s bundled price and prevent collusion [
19,
24]. Scholars have studied individual licensing and found that it may be inefficient for complementary patents [
25]. For example, Gallini (2014) found it can lead to a higher price in the downstream market [
18]. In the IT industry, individual licensing can increase transaction costs for manufacturers who lack the resources to negotiate with patent holders [
25,
26,
27].
Some scholars have also explored the differences between package licensing and individual licensing. For example, Ishihara and Yanagawa (2018) found that, compared to independent licensing, package licensing can enable anti-competitive price discrimination [
26]. Nikolic and Galli (2022) emphasized the necessity of package licensing for resolving royalty stacking and double-marginalization, leading to a lower licensing fee than individual licensing for 5G patents [
27]. Özmen et al. (2025) reported that 100% of pools using package licensing strategy disclose FRAND-compliant rates, compared to only 47% of firms using separate pricing [
28].
Unlike existing literature, we not only investigate the patent pool’s royalty rate decision under individual licensing and package licensing models but also the entity that sets these royalty rates, i.e., the administrator. This aids in uncovering the optimal combinations of these models that lead to efficient patent pool management. To the best of our knowledge, this combination has not been explored before.
2.2. Patent Pool Administration
Administration models determine who administers the pool, including members (self-administration) or an independent entity (third-party administration). In third-party administration, a specialized administrator like MPEG-LA or Sisvel manages the patent pool, including essentiality checks, royalty collection, and licensing [
27,
28]. Theoretical studies have found that third-party administration can reduce conflicts of interest. Specifically, independent third-party administrators not connected to downstream product markets can ensure the impartial implementation of package licensing [
18,
19]. For example, Layne-Farrar and Lerner (2011) found that patent pools under third-party administration are more likely to adopt value-proportional royalty rules [
29]. Nikolic and Galli (2022) found that third-party administration can help the patent pool overcome resistance from vertically integrated firms [
27]. Özmen et al. (2025) found that third-party administration can enhance transparency in the patent pool [
28].
Self-administration occurs when the patent pool members, often the core patent holders, oversee operations, as in the DVD6C pool administered by Toshiba. Proponents point to lower administrative costs and retained control over key decisions [
29]. However, in self-administration, the core patent holder may manipulate its licensing rate to extend market power [
18]. Scholars have studied the heterogeneous effects of the two administration models. For instance, Joshi and Nerkar (2011) found that the patent pools under self-administration may stifle innovation to maintain market power [
30]. Peng et al. (2026) found that self-administration can be effective under high technological turbulence, as vertically integrated members in self-administration pools can rapidly adjust pricing in response to disruptive innovations [
22].
A patent pool is a marketing alliance that licenses technology to manufacturers [
15,
31,
32]. Studies have focused on the interaction between the patent pool and manufacturers. For instance, Joshi and Nerkar (2011) studied the effect of patent pools on manufacturer performance in innovation [
30]. Ernst et al. (2016) investigated the relationship between patent management and manufacturers’ financial and patenting performances [
33]. Azzam (2019) studied how manufacturers manage their participation in a patent pool [
34].
The existing literature has examined the licensing model (individual vs. package) and the administration model (self vs. third-party) of patent pools, but there has been little work jointly modeling these two strategic choices in a unified framework that also incorporates downstream Cournot competition. The profitability effect of package versus individual licensing may critically depend on who administers the pool, yet this interaction remains unstudied. We address this gap by developing a four-stage game that endogenizes both the licensing and administration choices, thereby offering a system-level understanding of patent pool governance in technology ecosystems.
In summary, in this study, we study the strategies of the patent pool management model. These strategies comprise licensing models, namely the individual and package licensing models, and administration models, specifically the self-administration and third-party administration models. Further, we explore the patent pool licensing strategies and administration strategies within the technology ecosystem, where the patent pool’s decision is intertwined with the actions of competitive manufacturers in the downstream market. By doing so, our research provides a comprehensive understanding of how the patent pool chooses management strategies and how the management strategies affect the downstream market.
3. Model Setup
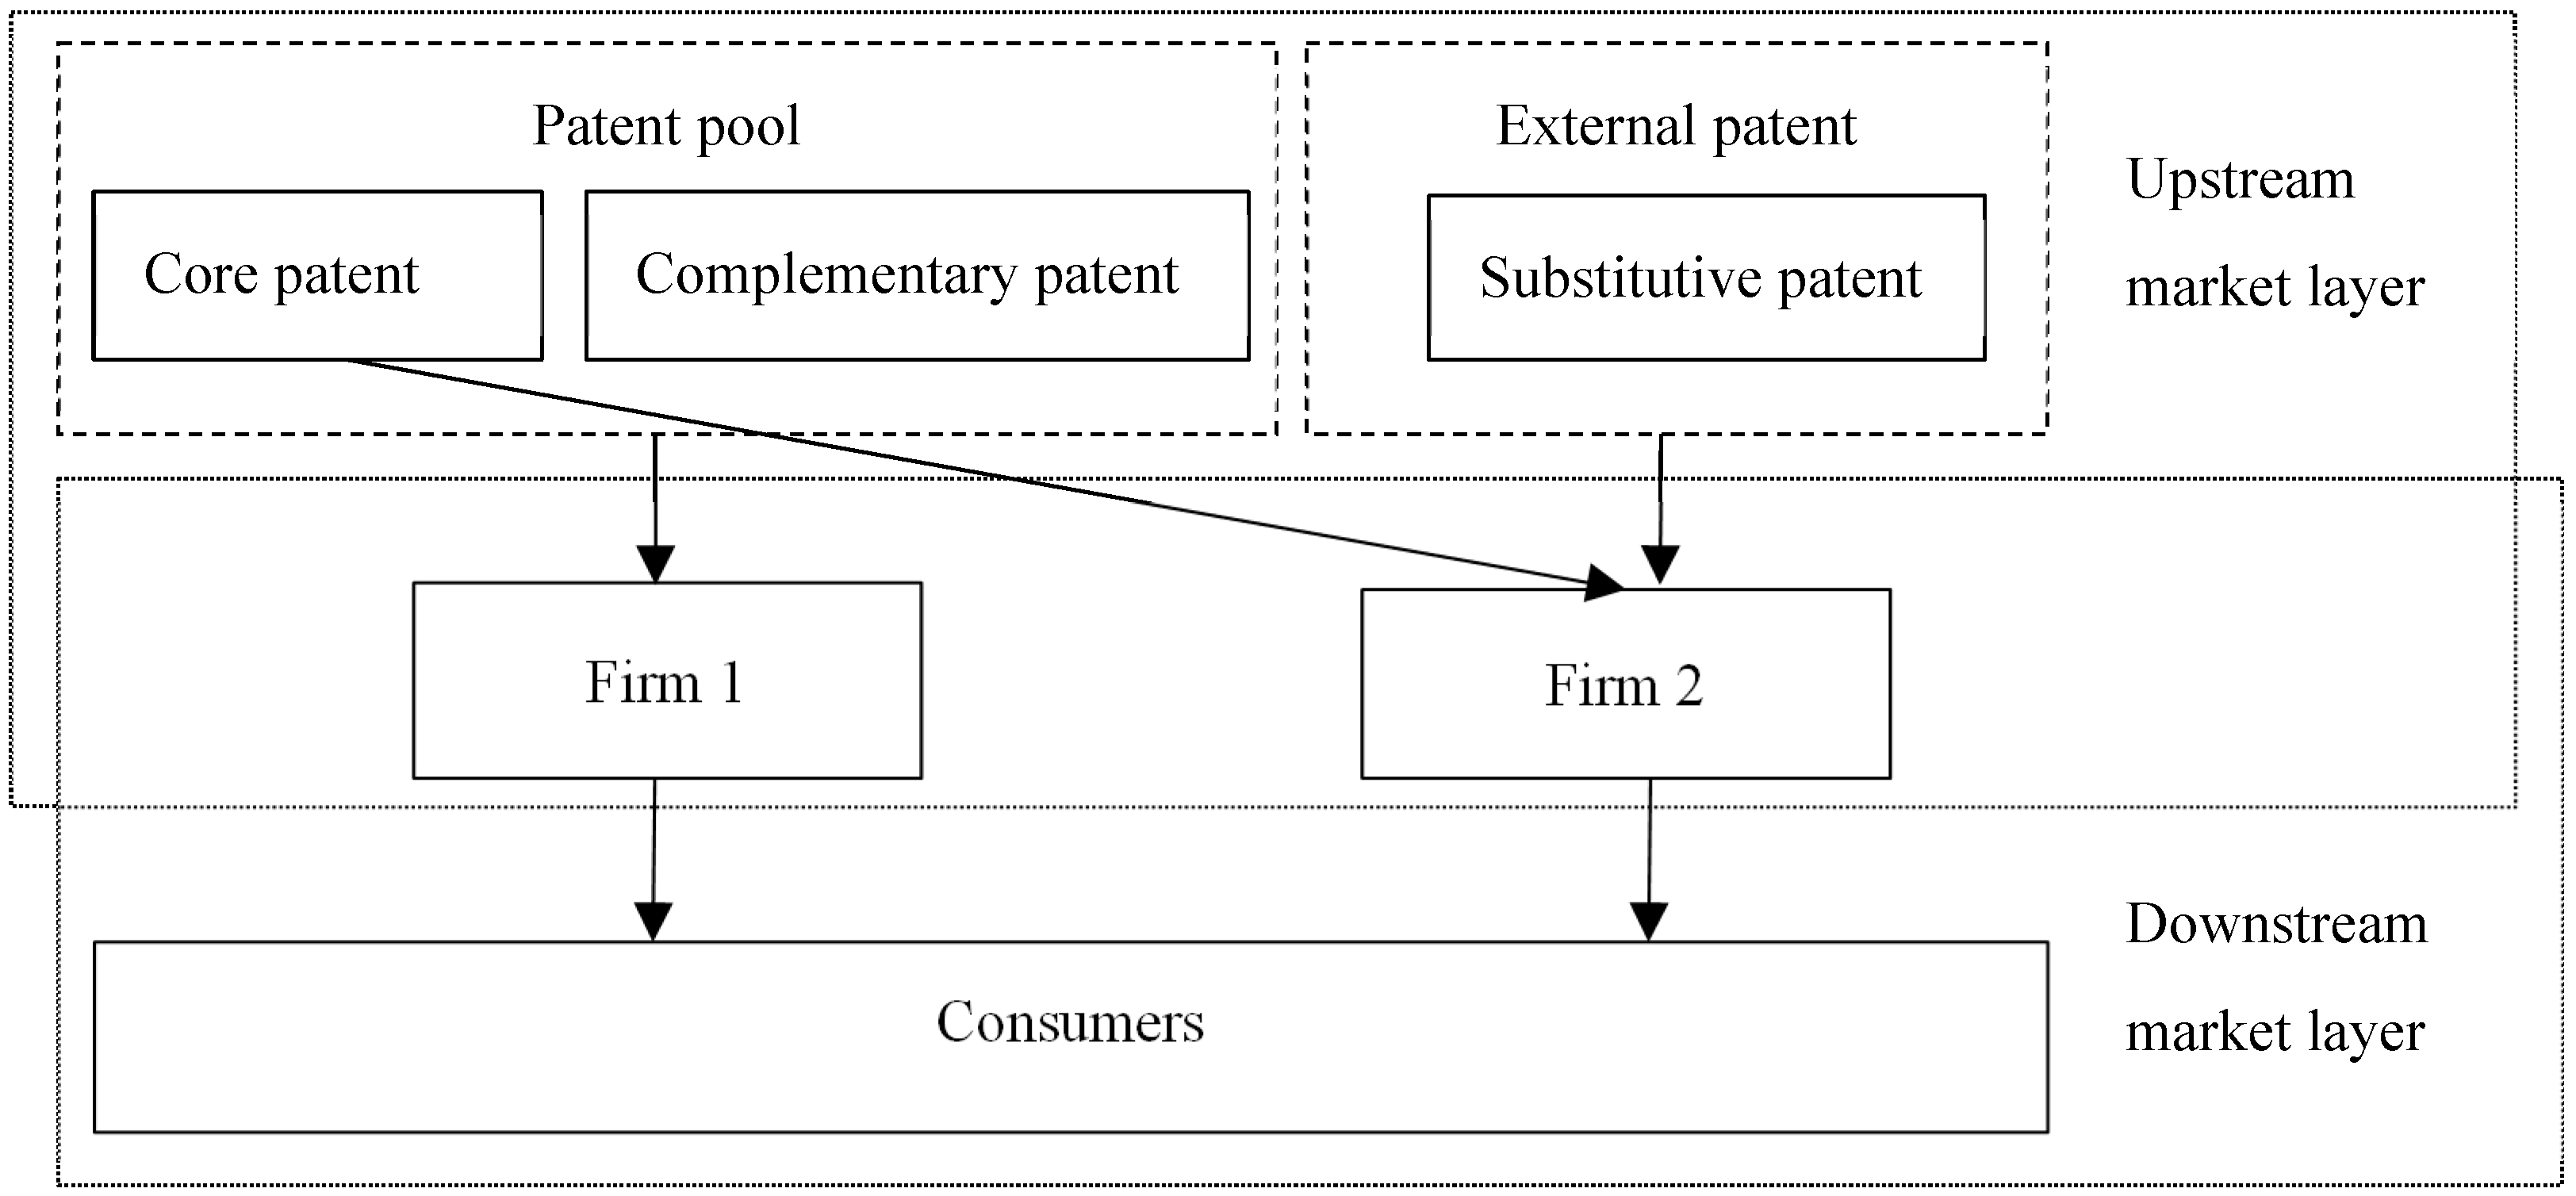
In this section, we first introduce our system model. We considered a three-tier system structure comprising an upstream and a downstream market. In the upstream market layer, patent holders license their technology to manufacturers. In the downstream market layer, two manufacturers (hereafter referred to as firms) use these patents to produce goods and compete against one another. The specific system structure is outlined in
Figure 2.
Consistent with prior literature [
35,
36,
37,
38], the two manufacturers (denoted as firm
) engage in Cournot competition in the downstream market layer, simultaneously choosing outputs to maximize their respective profits. The inverse demand function faced by the manufacturers is given by
, where
represents the market price, and
denotes the total output, with
being the output of firm
. The parameter
captures the potential market size, while
represents the price sensitivity coefficient. We assume the market is sufficiently large such that
. The notations in our paper are summarized in
Table 1.
In the upstream market layer, there is a patent pool alongside independent patents held outside the pool. The patent pool comprises two distinct patents, including a core patent and a complementary patent. Outside the pool, there exists a substitutive patent that serves as an alternative to the complementary patent. The core patent is essential for both firms’ production. The complementary and external substitutive patents are mutually substitutable.
The patent pool is established by the core patent holder. Initially, the core patent holder administers the patent pool. With the inclusion of the complementary patent and the emergence of the substitutive patent, the core patent holder decides which licensing scheme the patent pool system should adopt and whether to transfer the administration of the pool to an independent administrator.
Firms adopt asymmetric patent strategies within the downstream market system. We assume that firm 1 licenses the entire patent pool, including both the core and complementary patents. Firm 2 licenses only the core patent from the pool and acquires the substitutive patent from the external holder. Furthermore, licensing a patent outside the pool entails a patent risk cost, denoted by . This cost arises from the complex and time-consuming negotiations required with independent patent holders who are outside the scope of the patent pool. Thus, firm 2 incurs an additional patent risk cost , whereas firm 1 does not. Furthermore, the royalty rate of the substitutive patent is denoted by , which is an exogenous parameter. This asymmetric assignment reflects real-world asymmetric patent coverage. It is a deliberate modeling choice that allows us to examine how differences in patent portfolios influence the strategic interactions between patent holders and downstream manufacturers.
The patent pool operates under two distinct licensing models, including individual licensing and package licensing. Under the individual licensing model, the holders of the core and complementary patents in the patent pool set their own royalty rates. Under the package licensing model, a unified rate is set by the patent pool administrator for the bundled patents. This total revenue is then allocated between patent holders in the pool. Specifically, the core patent holder receives a share , while the complementary patent holder receives the remaining share . To capture the market power of the core patent holder, we assume .
There are two administration models for the patent pool, which are self-administration and third-party administration. Under the self-administration model, the core patent holder assumes responsibility for managing the pool, incurring an operational cost . In this regime, the royalty rate is set to maximize the profit of the core patent holder. In contrast, under the third-party administration model, an independent third-party administrator manages the patent pool. This administrator determines the royalty rate to maximize the total joint profit of the pool, which encompasses the returns to both the core and complementary patent holders. The operational cost is shared equally between the two patent holders. Specifically, both the core and complementary patent holders contribute each to the independent third-party administrator.
The timeline of the dynamic game proceeds in four stages:
Stage 1. The core patent holder selects the administration model (self-administration or third-party administration), and the licensing model (individual licensing or package licensing).
Stage 2. If package licensing is selected, a unified royalty rate, denoted as , is determined. The decision maker depends on the chosen administration structure. Under self-administration, the core patent holder sets . When under third-party administration, the independent administrator sets .
Stage 3. Patent holders set their respective individual royalty rates. Under individual licensing, the core patent holder sets the rate for the core patent, and the complementary patent holder inside the patent pool sets the rate for the complementary patent. Under the package licensing, the core patent holder additionally sets an external royalty rate for firms that only license the core patent outside the bundle.
Stage 4. Given the established royalty rates, firms () simultaneously determine their product outputs (), engaging in Cournot competition.
The participants’ decisions under different licensing and administration models in the patent pool system are shown in
Table 2.
4. Analysis
In this section, we detail the analysis of the management strategies of the pool patent system, including its licensing model and administration model. First, we examine the firms’ output levels and patent holders’ licensing strategies in each subgame. We then explore the equilibrium management model of the patent pool. Given the distinctions between licensing model and administration model, four equilibrium subgame configurations, which are individual licensing with self-administration, individual licensing with third-party administration, package licensing with self-administration, and package licensing with third-party administration. We first study the equilibrium for individual licensing under self-administration.
4.1. Equilibrium of Individual Licensing with Self-Administration
Under the individual licensing with self-administration model, the patent pool is managed by the core patent holder. The core patent holder and the complementary patent holder set the core patent rate and the complementary patent rate , respectively.
Firm 1 determines its output to maximize its profit, which is expressed as follows:
Here, denotes the product price in the downstream market and denotes the total cost of utilizing patents.
Similarly, firm 2 determines its output to maximize its profit, which is expressed as follows:
Here, represents the cost of licensing the core patent and represents the cost of using patents outside the patent pool, including the external royalty rate () and patent risk cost ().
Since both firms need to license the core patent to produce, the core patent holder determines the core patent royalty rate to maximize its profit as follows:
Since only firm 1 licenses the patents from the complementary patent holder, the complementary patent holder determines its complementary patent royalty rate to maximize its profit as follows:
Firms’ optimal outputs and patent holders’ optimal royalty rates in the pool in the equilibrium for individual licensing with self-administration are summarized in Lemma 1.
Lemma 1 (Equilibrium of individual licensing under self-administration). Under the individual licensing with self-administration model, the core patent holder sets the core patent royalty rate as , and the complementary patent holder sets the complementary patent royalty rate as . Given these rates, the firm licensing the entire pool sets the output as , while the firm relying on external patents sets the output as .
Lemma 1 characterizes the equilibrium outcomes in individual licensing under self-administration. It establishes that the royalty rate for the core patent exceeds that of the complementary patent (). The core patent’s royalty rate is negatively correlated with the cost of using outside patents, whereas the complementary patent’s rate is positively correlated with the external costs. Furthermore, the production level depends on the market size. Specifically, when the downstream market is small (), production under the patent pool regime exceeds that based on external substitutive patents (). Conversely, in a large downstream market, the output of the firm licensing the patent pool is lower than that of the firm relying on outside patents.
Next, we examine the equilibrium for package licensing under self-administration.
4.2. Equilibrium of Package Licensing with Self-Administration
Under the package licensing with self-administration model, the core patent holder manages the patent pool and sets a unified royalty rate
for both patents in the pool and a royalty rate
for firms that license external patents. Under the package licensing with self-administration, firm 1 determines its output to maximize its profit as follows:
Firm 2 determines its output to maximize its profit as follows:
The core patent holder determines both the unified royalty rate and the core patent royalty rate to maximize its profit as follows:
The complementary patent holder’s profit is as follows:
The firms’ optimal outputs and patent holders’ optimal royalty rates in the equilibrium for package licensing with self-administration are summarized in Lemma 2.
Lemma 2 (Equilibrium of package licensing with self-administration). Under package licensing with self-administration, the core patent holder sets the unified royalty rate as and the core patent royalty rate as . Confronted with these rates, the firm licensing the entire pool sets the output as , while the firm relying on external patents sets the output as .
Under the package licensing with self-administration, the core patent holder sets a unified royalty rate for access to the entire patent bundle. The unified rate decreases with the external patent royalty rate (). The production volume of firms utilizing the patent pool increases with the total cost of using external patents, while the production outputs of firms using external patents decrease with the cost of outside patents.
We derive the equilibrium for individual licensing under third-party administration in
Section 4.3.
4.3. Equilibrium of Individual Licensing with Third-Party Administration
Under individual licensing with third-party administration, an independent specialized entity administrates the patent pool. The core patent holder and the complementary patent holder decide the royalty rate for core and complementary patents, respectively. Firm 1 determines its output to maximize its profit as follows:
Firm 2 determines its output to maximize its profit as follows:
The core patent holder determines the core patent royalty rate to maximize its profit as follows:
The complementary patent holder determines its complementary patent royalty rate to maximize its profit as follows:
The firms’ optimal outputs and patent holders’ optimal royalty rates in the equilibrium for individual licensing with third-party administration are summarized in Lemma 3.
Lemma 3 (Equilibrium of individual licensing with third-party administration). Under individual licensing with third-party administration, the core patent holder sets the core patent royalty rate as , and the complementary patent holder sets the complementary patent royalty rate as . Confronted with these rates, the firm licensing the whole pool sets the output as , while the firm relying on external patents sets the output as .
Lemma 3 establishes that under the individual licensing regime, the royalty rate for the core patent and the complementary patent are the same under self-administration and third-party administration. This equivalence arises because the distinction between these administrative models affects only the distribution of operational costs among patent holders, without altering firms’ production decisions. Furthermore, the product output level in the market depends on the downstream market size. When the market is small, production based on the patents pool exceeds that based on external patents. Conversely, in a large downstream market, the output of products based on the pool is less than that based on external patents.
Next, we explore the equilibrium of package licensing with third-party administration.
4.4. Equilibrium of Package Licensing with Third-Party Administration
Under the package licensing model, an independent third-party administrator manages the patent pool and sets the unified royalty rate for the bundled patents in the pool. The core patent holder decides the core patent royalty rate for firms that license external patents. Firm 1 determines its output to maximize its profit as follows:
Firm 2 determines its output to maximize its profit as follows:
The core patent holder determines the core patent royalty rate to maximize its profit as follows:
The complementary patent holder’s profit is as follows:
The independent administrator determines the unified royalty rate to maximize the profit of the patent pool, which is as follows:
The firms’ optimal outputs and the independent administrator’s optimal unified rate in the equilibrium for package licensing with third-party administration are summarized in Lemma 4.
Lemma 4 (Equilibrium of package licensing with third-party administration). Under package licensing with third-party administration, the independent third-party administrator sets the unified royalty rate as . The core patent holder sets its royalty rate as . Given these rates, the firm licensing the entire pool sets the output as , while the firm relying on external patents sets the output as .
Under package licensing with third-party administration, the independent third-party administrator sets a unified rate for the bundled patents in the pool. This rate increases with outside patent price (), while the core patent royalty rate decreases with the outside patent price (). The production volume based on the patent pool expands as the cost of using outside patents increases. Conversely, the production volume of products relying on external patents decreases with the cost of using outside patents.
Having derived the equilibrium outputs and royalty rates across different licensing and administration models, we now compare the core patent holder’s profits under each subgame configuration to determine the equilibrium in the patent pool system.
4.5. Equilibrium of the Patent Pool System
By comparing the core patent holder’s profit across various licensing and administration regimes, the equilibrium management strategies of the patent pool system are characterized as follows:
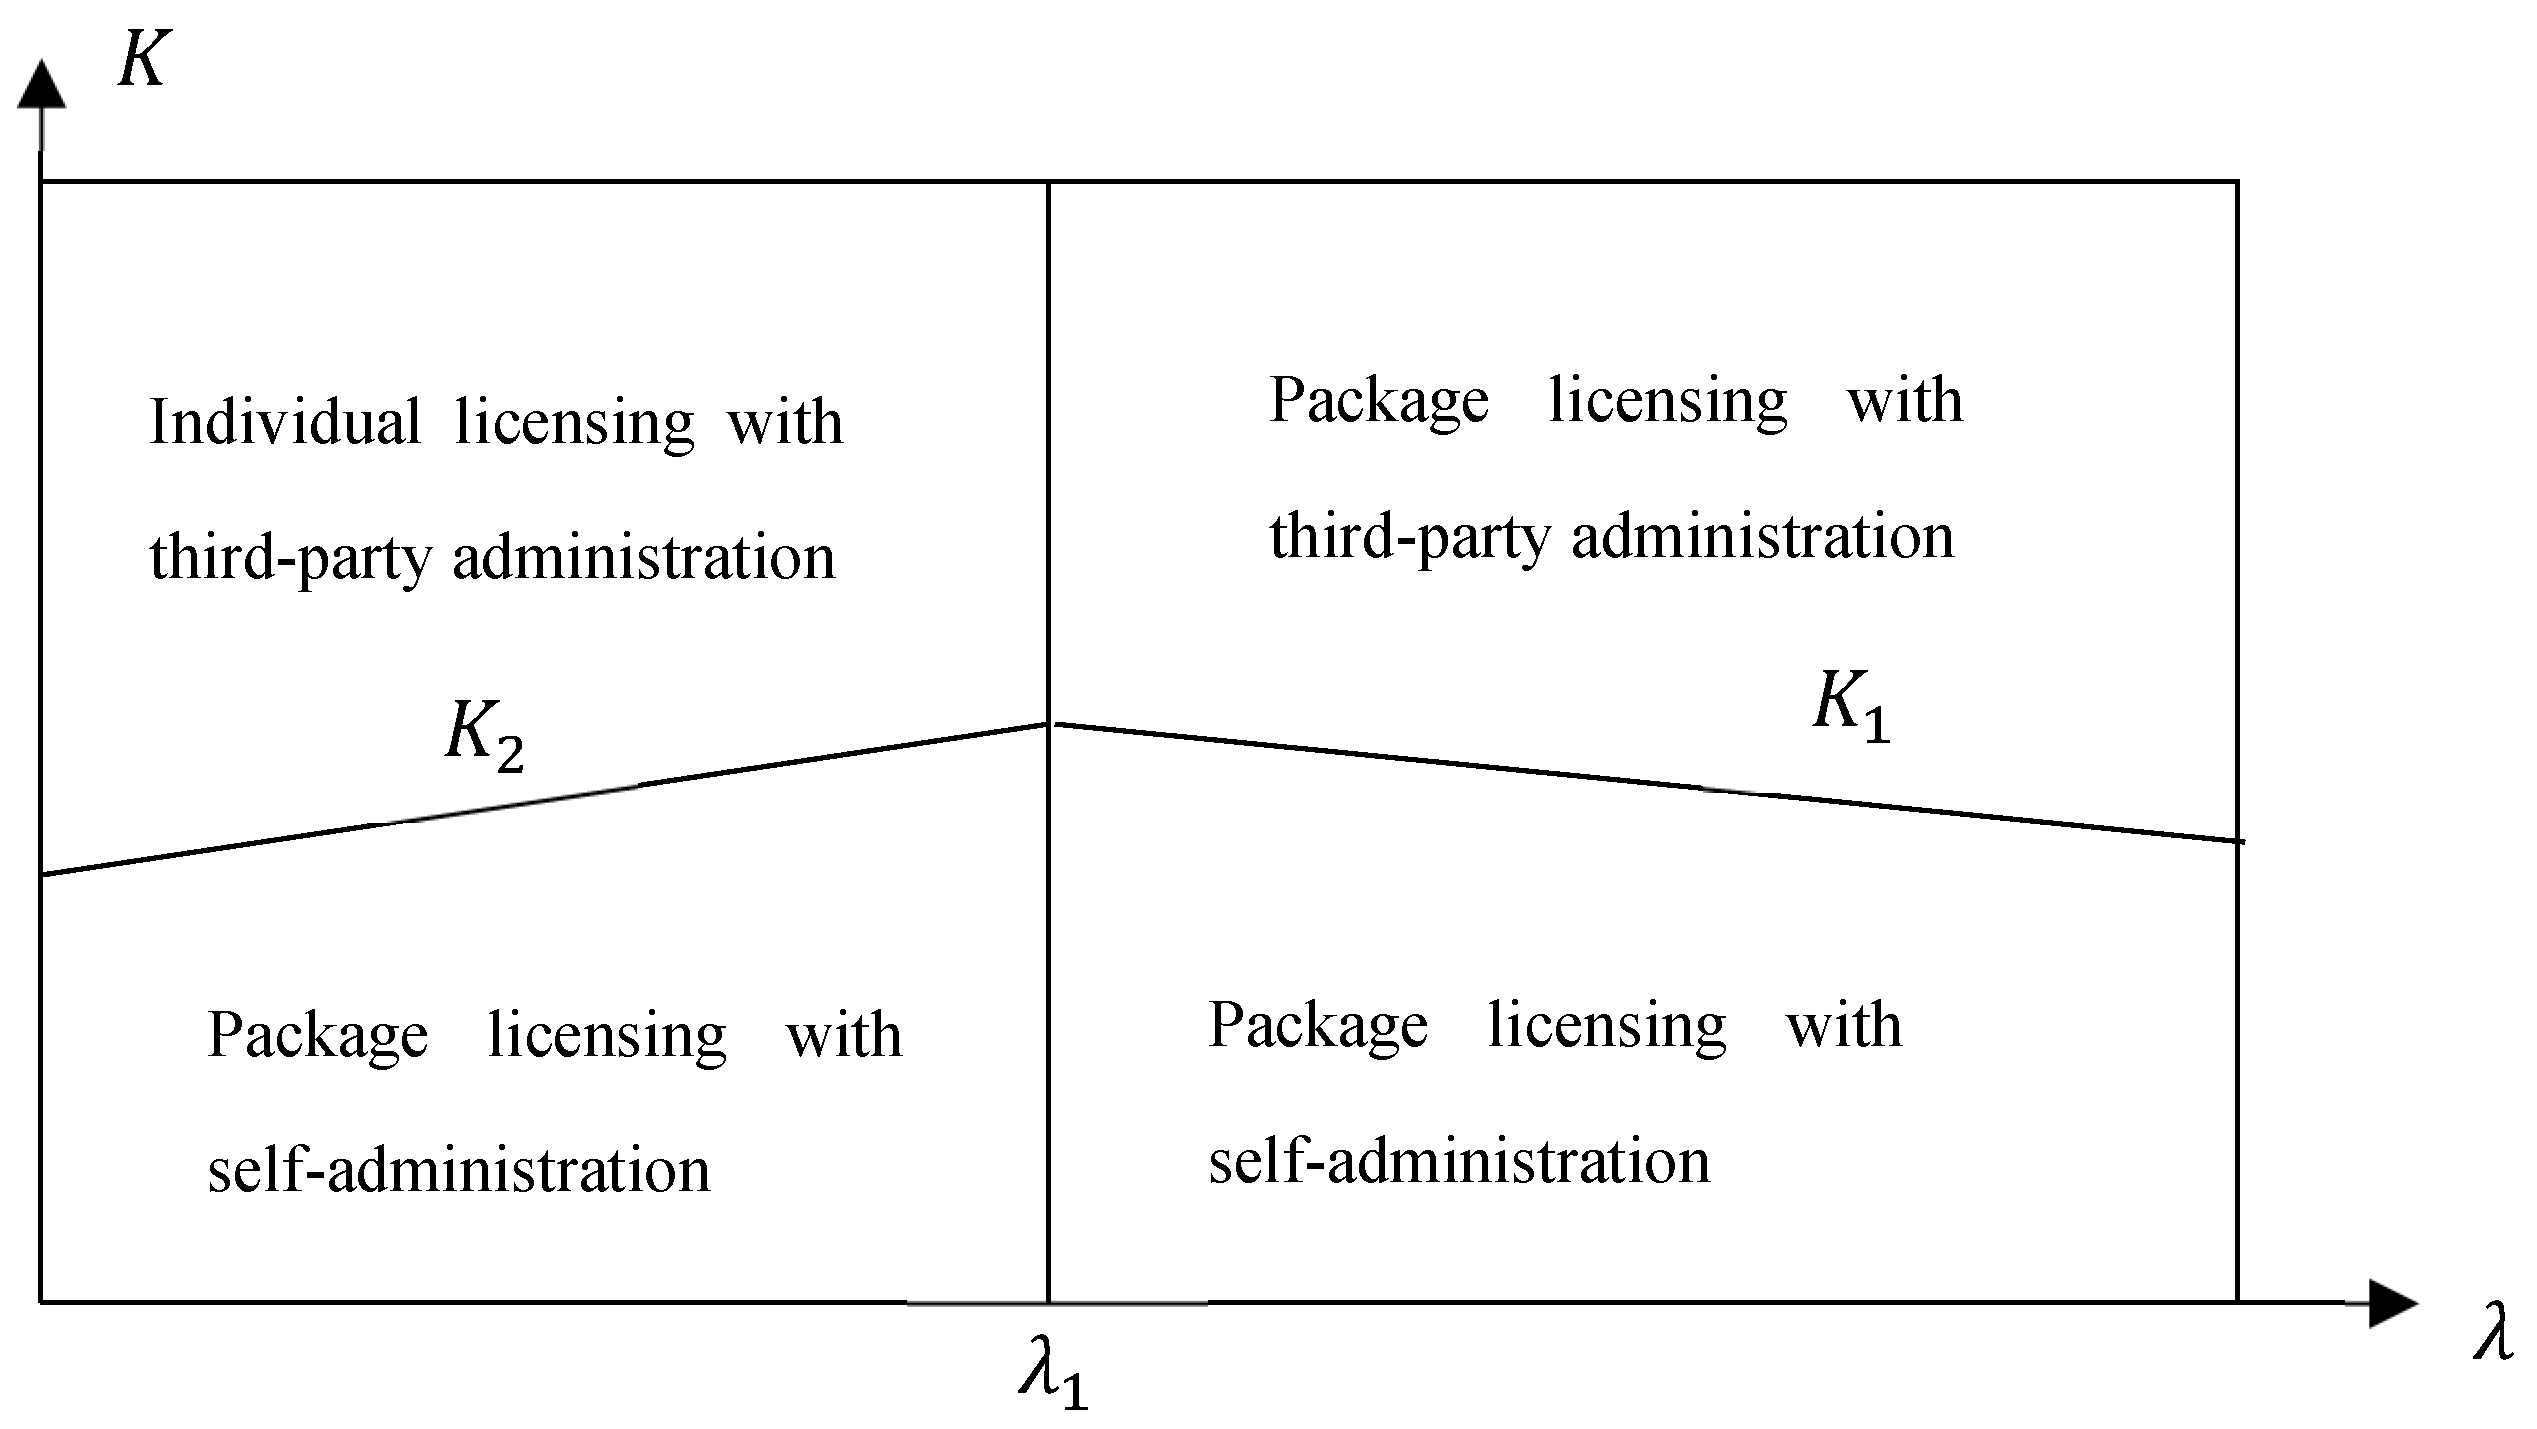
Proposition 1 (Equilibrium management strategies of the patent pool system).
1a. High revenue share (): If the operational cost is low (), the package licensing with self-administration is adopted by the patent pool system; otherwise, package licensing with third-party administration is adopted.
1b. Low revenue share (): If the operational cost is low (), the package licensing with self-administration model is adopted by the pool system; otherwise, individual licensing with third-party administration is adopted.
The expressions for
,
, and
are provided in
Appendix A.
The system state transitions of the patent pool’s management are depicted in
Figure 3.
Proposition 1 and
Figure 3 illustrate the system state transitions of the patent pool’s management. Specifically, under a low operational cost, the system stabilizes under package licensing with self-administration. Conversely, when the operational cost is high, the state shifts to individual licensing with third-party administration if the revenue share is low, or to package licensing with third-party administration if the revenue share is high.
Proposition 1 explains the rationales behind the patent pool system states. First, the revenue share can affect the system behavior regarding the patent pool’s management strategy. Faced with a lower revenue share, the patent pool system is more likely to adopt individual licensing rather than package licensing under third-party administration. This is because a higher revenue share improves the core patent holder’s profits from package licensing, making the overall system more likely to choose package licensing when the revenue share is high.
The operational cost, which can influence the administration model, is also a critical parameter in the patent pool system. The core patent holder can bear the entire operational cost under self-administration or share the cost with other pool participants in the pool under third-party administration. Consequently, when the operational cost is low, the core patent holder prefers to bear the operational cost, since it can obtain greater profits by setting the unified rate. When the operational cost is high, the additional profit gained from setting the unified rate cannot compensate for the increased cost. Thus, the patent pool system transfers the licensing rights to the independent third-party administrator.
Our findings align with industry trends. For instance, upon the launch of the HEVC pool, it was widely expected that it would deploy package licensing with self-administration, which was the successful management model employed by the H.264 pool (now VIA-LA). However, given the escalating operational costs caused by the complexities of next-generation video standards, core patent holders instead established HEVC Advance (now Access Advance) as a specialized independent administrator to manage the HEVC licensing landscape, adopting a package licensing with third-party administration [
39].
Proposition 1 also demonstrates that, for the core patent holder, adopting individual licensing under self-administration is always less profitable compared to adopting it under third-party administration. These outcomes stem from the following systemic mechanisms: First, while individual licensing grants pool participants autonomy in setting royalty rates, the fixed-cost nature of the operational cost of the patent pool exerts a nonnegligible systemic influence on patent holders’ rate decision. Second, the allocation of operational costs varies across administration models. Under the self-administration model, the core patent holder incurs the full operational cost. Under the third-party administration, the participants in the pool share the patent pool operational cost. Therefore, when employing individual licensing, the core patent holder achieves more profits from third-party administration.
Having analyzed the equilibrium management strategies of the patent pool system, we next examine the effects of the patent pool system on the downstream market competition in Proposition 2.
Proposition 2 (The impact of patent pool system on downstream market competition). Relative to other system states, package licensing with third-party administration lowers the market price, thereby intensifying competition in the downstream market.
Proposition 2 indicates that, compared to both individual licensing with third-party administration and package licensing with self-administration, the package licensing with third-party administration induces firms to produce higher output. This increase reduces the downstream market price and thereby intensifies market competition. The underlying mechanisms are as follows.
First, under the third-party administration, package licensing leads to a lower market price, which may appear counterintuitive given that package licensing is often expected to mitigate competition. This is consistent with the finding of Gallini (2014) that package licensing can lower downstream product prices and soften competition between pooled and non-pooled products [
18]. The insights behind this can be explained as follows. Under individual licensing, patent holders set royalty rates independently. For the complementary patent holder, offering a low royalty rate induces the core patent holder to also lower its rate. This reduction stimulates higher production of products utilizing external patents. The volume expansion reduces the complementary patent holder’s marginal return. Consequently, to raise marginal profit, the complementary patent holder strategically raises its royalty rate. This strategic behavior leads to higher overall royalties and mitigates market competition.
Second, under package licensing, the administrative structure critically determines the outcome. Under self-administration, the core patent holder captures profits from both products within the patent pool and those utilizing outside patents. To maximize these combined margins, the core patent holder tends to set a high unified royalty rate. Conversely, under third-party administration, an independent administrator sets the unified royalty rate based on the whole patent pool’s welfare. To compete effectively against external patents, the administrator is incentivized to set a lower unified rate. This lower rate encourages higher production volumes and drives down market price, thus intensifying competition.
Next, we examine the impacts of external patent royalty rate on the royalty rate in the patent pool and derive the impacts in Proposition 3.
Proposition 3 (Impacts of external patent royalty rate on royalty rates in the patent pool).
3a. Under the individual licensing model, the core patent royalty rate decreases with the external patent royalty rate, whereas the complementary patent royalty rate increases with it.
3b. Under package licensing with self-administration, both the unified rate and the core patent rate decrease with the external patent royalty rate.
3c. Under package licensing with third-party administration, the unified rate increases with the external patent royalty rate, while the core patent rate decreases with it.
Proposition 3 indicates that the impact of the external patent royalty rate varies across different patent pool system states. Specifically, as the external rate increases, the core patent holder tends to reduce its royalty rate, while the complementary patent holder and independent third-party administrator tend to raise theirs. The underlying systemic mechanisms are as follows.
First, the external patent royalty rate represents the cost of producing products using external patents. Products licensing the complementary patent and products utilizing external patents compete in the downstream market. As a competitor to the outside patent, the complementary patent holder tends to raise its royalty rate to capture higher marginal profits in response to an increase in the cost of utilizing outside patents. As a result, under the individual licensing model, the complementary patent royalty rate increases with the external royalty rate.
Second, under package licensing with third-party administration, the independent third-party administrator sets the unified rate based on the patent pool’s total profit. Since the external patent is outside the pool, the independent administrator raises the unified rate in response to the rising cost of using outside patents.
Finally, products licensing either the complementary patent or the external patent both require a license for the core patent. Thus, the core patent holder profits from both products. As the cost of producing via external patents increases, the core patent holder tends to lower the royalty rates it can control. This strategy aims to sustain the output volume of products utilizing the outside patent, which would otherwise decline due to higher costs. Consequently, as the external rate increases, the core patent rate decreases across all management strategies, as does the unified rate under package licensing with self-administration.
We further examine the impacts of downstream market potential on royalty rates in Proposition 4.
Proposition 4 (The impact of the downstream market potential on patent royalty rates). All the royalty rates within the patent pool increase with the downstream market potential.
Proposition 4 indicates that all royalty rates rise as market potential expands. This occurs because, in a larger market, downstream firms can expand their output and charge higher prices. Consequently, patent pool participants can extract higher royalties due to the enlarged economic scale of the system.
5. Impact of System Features on Patent Pool System State
After analyzing the patent pool system management strategies, downstream market competition, and the impacts of market features on royalty rates, we proceed to examine how the system features influence the patent pool system states. First, we explore the impacts of market potential on the patent pool system state in Proposition 5.
Proposition 5 (The impact of the revenue share on the patent pool system state). As the revenue share increases, the patent pool system is more likely to adopt package licensing with self-administration when the revenue share is low, and package licensing with third-party administration when the revenue share is high.
Proposition 5 indicates that
decreases with the revenue share and
increases with the revenue share. Consequently, when the revenue share is low (
), the patent pool system is more likely to employ package licensing with self-administration as the revenue share increases. Conversely, when the revenue share is high (
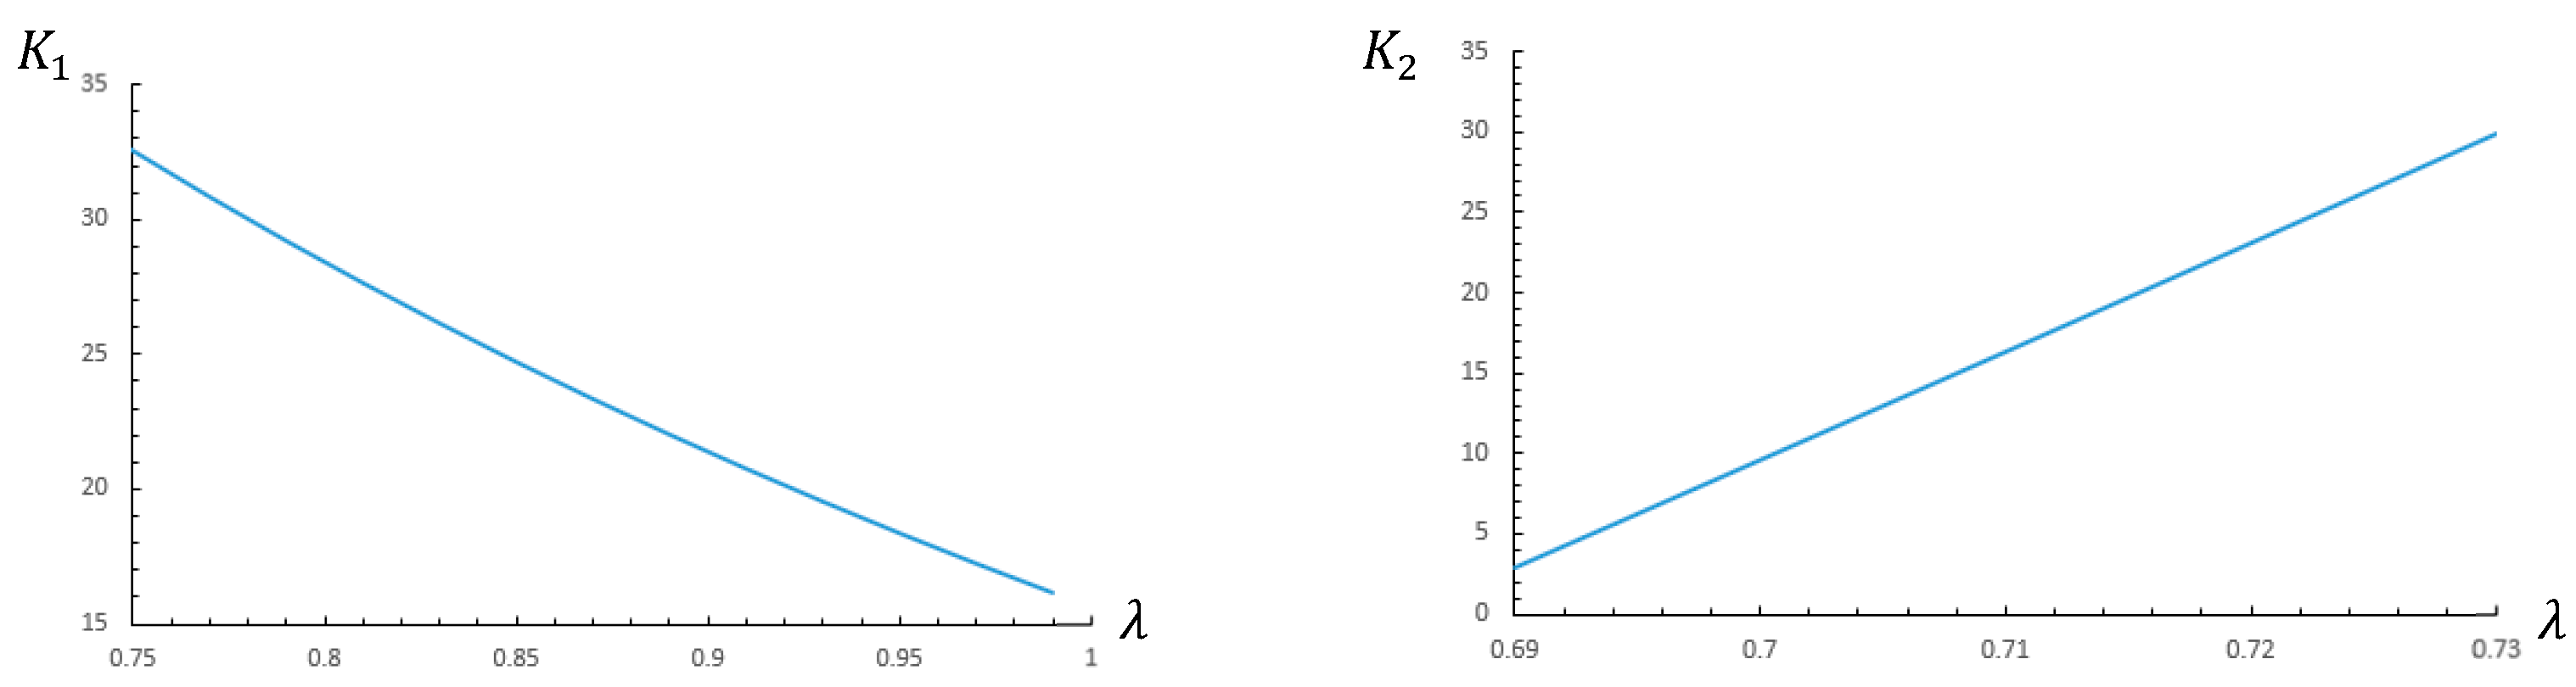
), the system is more likely to adopt package licensing with third-party administration as the revenue share increases. The numerical results in
Figure 4 show that
increases with
and
decreases with
.
The rationale can be explained as follows. As shown in
Figure 4, when the revenue share is low (
), the patent pool system chooses between package licensing with self-administration, which is affected by the revenue share, and individual licensing with third-party administration, which is independent of the revenue share. In the case of package licensing with self-administration, as the unified rate is decided by the core patent holder, when the revenue share increases, the core patent holder can adjust the unified rate to obtain more profits. Consequently, the patent pool system is more prone to adopt package licensing with self-administration.
When the revenue share is high (), the patent pool system selects between package licensing with third-party administration and package licensing with self-administration. Under package licensing with third-party administration, as the revenue share increases, the independent administrator can raise the unified rate to ensure the profits of the complementary patent holder. Meanwhile, the core patent holder can also profit from products using outside patents. In contrast, under package licensing with self-administration, the core patent holder must consider the complementary patent holder’s profit, potentially sacrificing some of the profits from products using external patents. As a result, the core patent holder is more likely to transfer administration to an independent third-party entity as the revenue share increases.
Next, we examine the effects of risk cost on the patent pool system state.
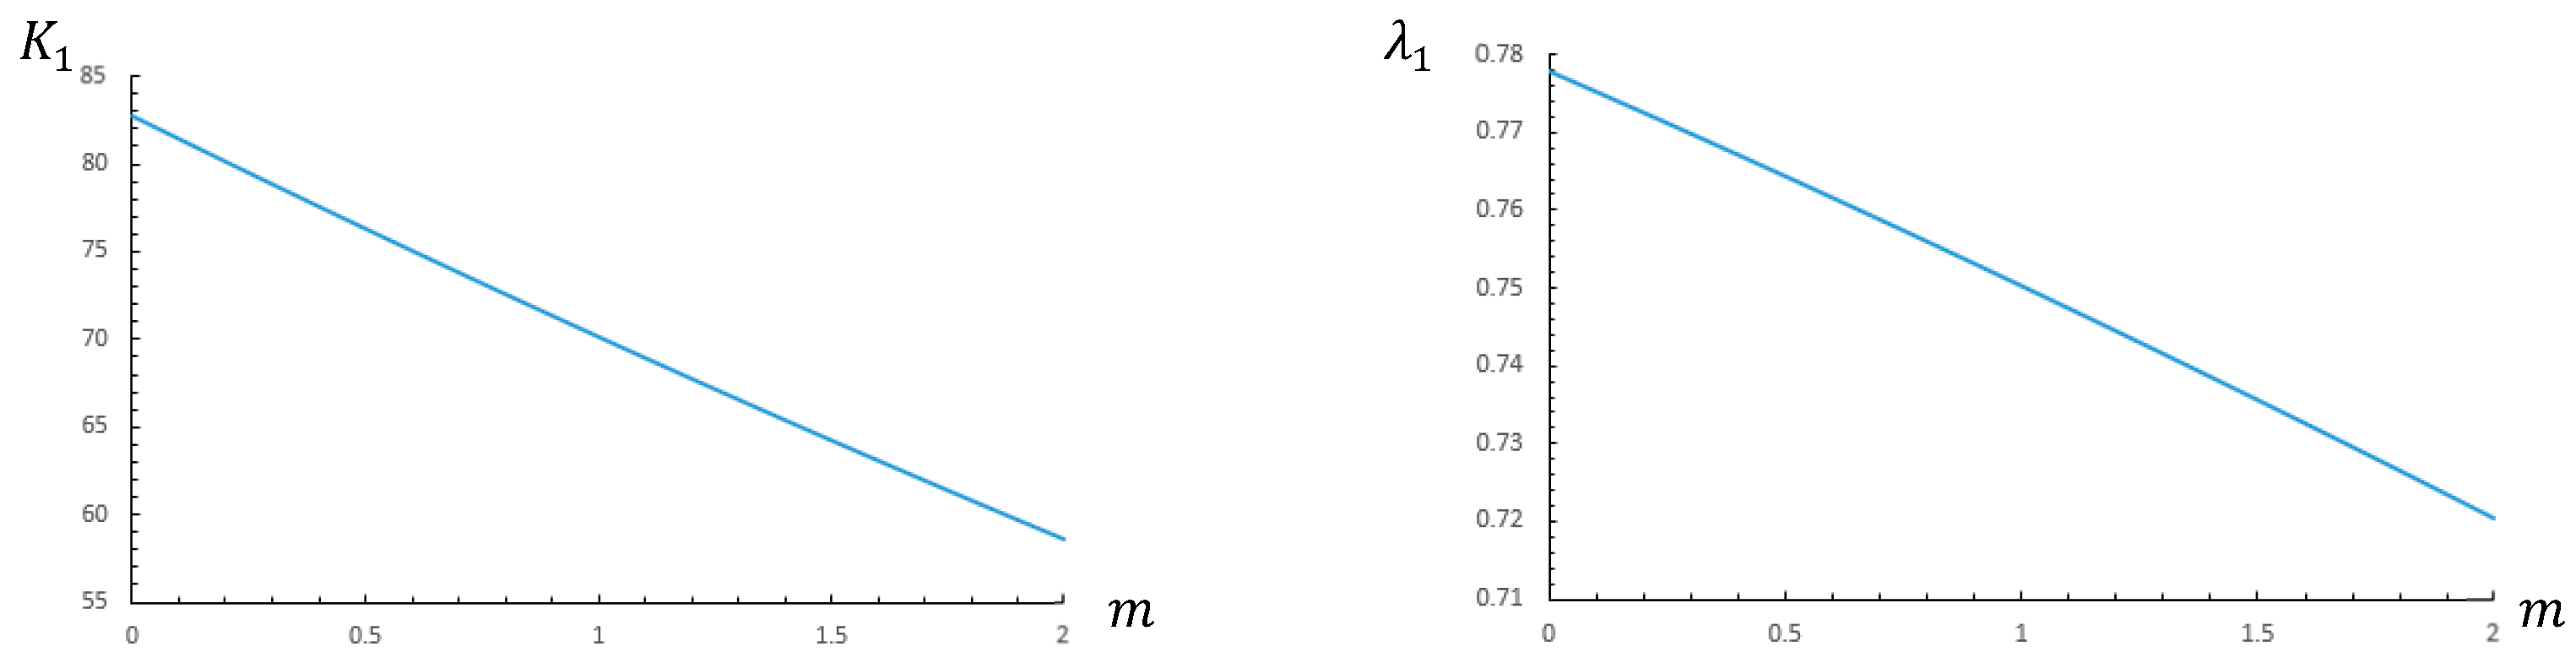
Proposition 6 (The impact of the risk cost on the patent pool’s system state). The patent pool system is more likely to deploy package licensing with third-party administration as the risk cost decreases.
When the risk cost (
) increases, both the revenue share threshold (
) and the operational cost threshold (
) decrease, i.e.,
and
. The numerical results show how
and
move with respect to
in
Figure 5. Consequently, the patent pool system becomes more inclined to adopt package licensing with third-party administration. The reasons can be explained as follows.
First, the risk cost represents the expense firms incur when licensing substitutive patents outside the pool. An increase in risk cost raises the production cost of products relying on external patents. Under individual licensing with third-party administration, the complementary patent holder can strategically adjust their patent’s rate in response to these higher external costs. However, the core patent holder obtains profits from both products licensed by the pool and those utilizing external patents. To prevent destructive competition triggered by the complementary patent holder’s rate adjustment, the core patent holder prefers a unified royalty rate. This rate is set to maximize the aggregate profits of the entire patent pool system. Therefore, as the risk cost rises, the pool increasingly favors package licensing with third-party administration.
Second, under package licensing, third-party administration becomes more attractive to the core holder than self-administration when the risk cost is high. A high risk cost effectively raises the marginal cost of producing goods that rely on external patents, thereby reducing the total downstream output and shrinking the core holder’s profits. Faced with declining returns, the core holder has a stronger incentive to transfer administration to an independent third party. In this way, it can share the management cost across all participants in the pool. Consequently, a higher risk cost incentivizes the system to adopt package licensing with third-party administration.
Next, we investigate how the external royalty rate influences patent pool system state in Proposition 7.
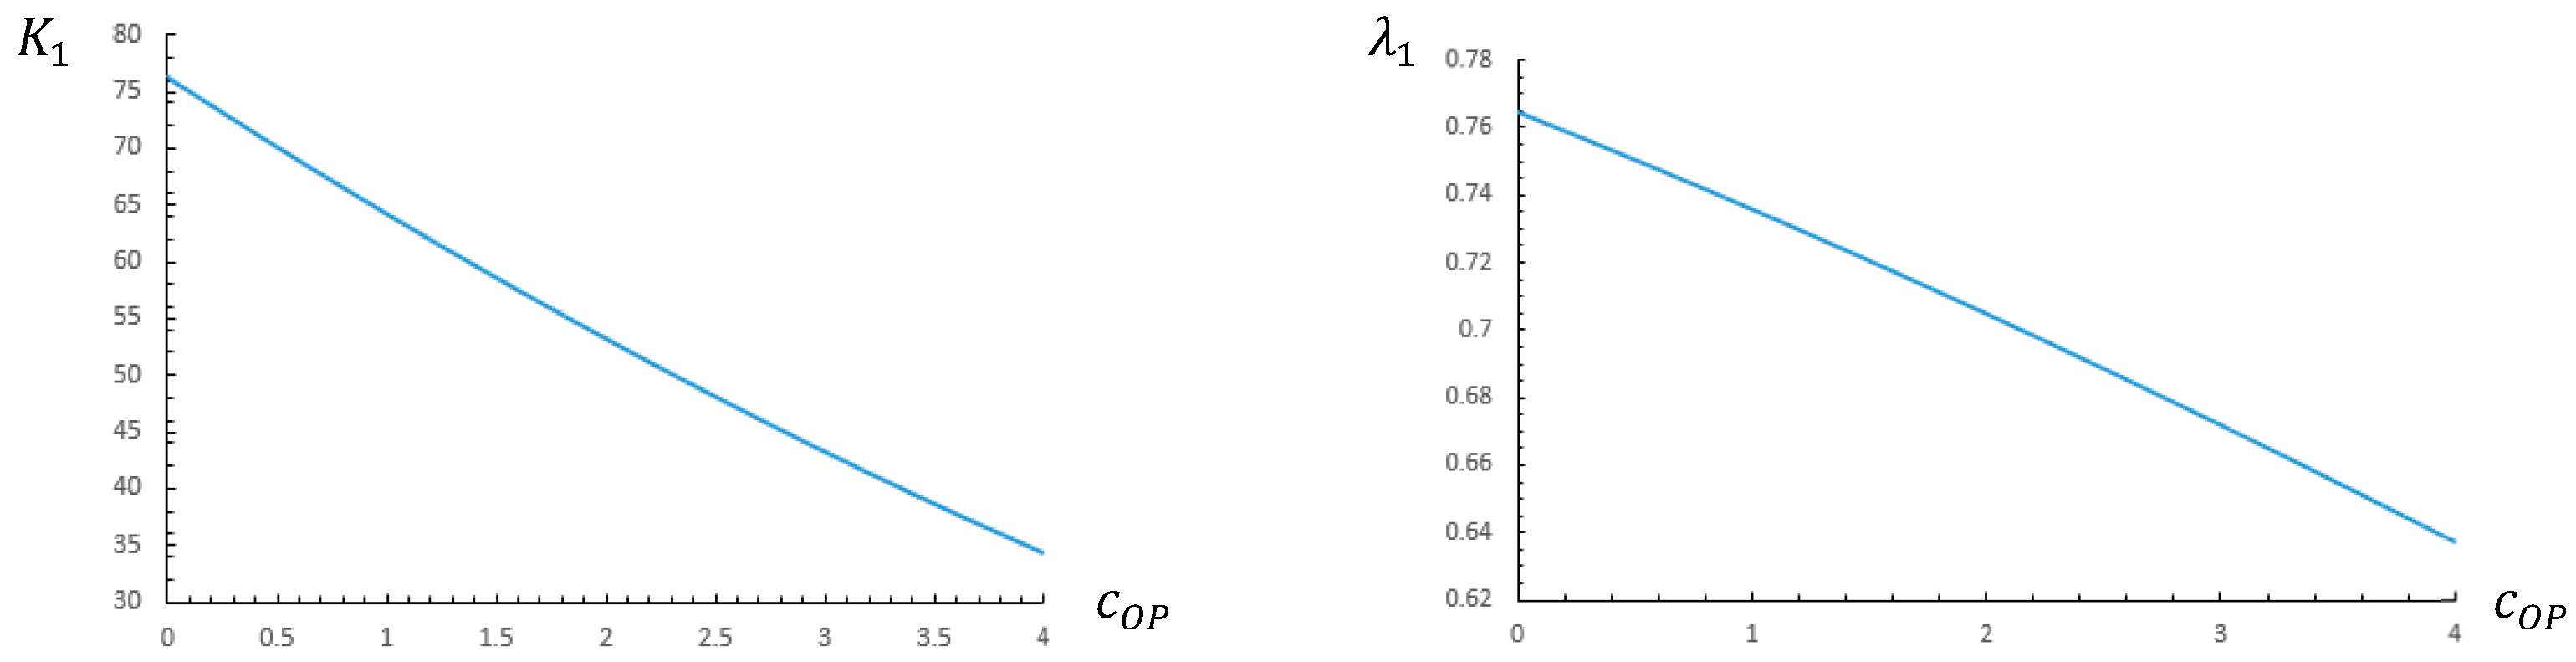
Proposition 7 (The impact of the external royalty rate on the patent pool’s system state). As the external royalty rate () decreases, the patent pool system is more likely to adopt package licensing with third-party administration.
Both the risk cost and the external royalty rate are costs incurred by firms producing products relying on outside patents. Consequently, the impacts of the external rate are similar to those of the risk cost. Specifically, as the external rate increases, the revenue share threshold decreases (
) and the operational cost threshold decreases (
). The numerical results in
Figure 6 show these effects. As a result, an increase in the external rate leads to a stronger incentive for the patent pool system to deploy package licensing under third-party administration.
6. Conclusions
The rapid advancement of new technologies has enabled the patent pool to become a vital infrastructure in the technology ecosystem. The management strategy of the patent pool system not only affects the profits of participants, but also impacts the competition among manufacturers in the downstream market. We present a game-theoretical model to explore the management strategies of a patent pool system, taking into account the downstream manufacturers’ decisions under different licensing and administration models.
First, we analyzed the equilibria for four system states, which are individual licensing with self-administration, package licensing with self-administration, individual licensing with third-party administration, and package licensing with third-party administration. Based on these sub-game system equilibria, we then studied the equilibrium strategies of the patent pool management. The results indicate that when the operational cost is low, the patent pool opts for package licensing with self-administration. When the operational cost is high, if the revenue share is low, the strategy switches to individual licensing with third-party administration. If the revenue share is high, it shifts to package licensing with third-party administration.
Next, we examined the influence of the patent pool system on downstream market competition. Our findings show that, compared to other system states, package licensing with third-party administration encourages manufacturers to increase their outputs, thereby intensifying downstream market competition. We also investigated the effects of the external rate on patent pool royalty rates. The results show that as the external rate rises, the core patent holder tends to lower its royalty rate, while the complementary patent holder and independent third-party administrator tend to raise theirs.
Finally, we explored the impacts of system features on the patent pool’s system states. As the revenue share increases, the patent pool system is more likely to adopt package licensing with self-administration when the revenue share is low, and package licensing with third-party administration when the revenue share is high. Additionally, as the risk cost and external rate increase, the patent pool system is more prone to deploy package licensing with third-party administration.
From a policy perspective, our findings contribute to the antitrust and FRAND debate on patent pools. The result that third-party administration combined with package licensing lowers royalty rates and intensifies downstream competition supports the antitrust rationale for independent administration. By decoupling governance from patent holders’ profit motives, it reduces conflicts of interest and mitigates the risk of supra-competitive royalty stacking. Thus, regulators and standard-setting organizations should consider both licensing structures and governance arrangements when evaluating FRAND compliance and competition law. Future research could formally model the interaction between governance choices and regulatory oversight mechanisms.
Our study provides a theoretical foundation for establishing profit distribution mechanisms and efficient service models for patent pool system management. It is helpful for patent pools and core patent holders to fully consider industry characteristics when choosing appropriate licensing and administration models to manage the patent pool. In essence, our study offers valuable insights into patent pool management within complex systems.
Our study is not without limitations. First, our model assumes that the patent pool system adopts a uniform package licensing strategy. In practice, patent pools usually provide multiple patent packages to manufacturers to form a multi-product system, which could be investigated in future research. Second, we assumed identical licensing fees for all manufacturers. In reality, patent pool systems may offer differentiated discounts based on manufacturers’ products, output, regions, and other characteristics. Third, our duopoly framework with two internal patents and one external patent provides a tractable starting point, but the results may differ in markets with more than two firms. Extending the model to these richer market structures is an important direction for future work. Fourth, the external royalty rate was treated as exogenous. Modeling the external patent holder as a strategic actor would enrich the analysis of the technology ecosystem. Fifth, future research could conduct empirical studies using industry data to validate the findings in this paper since the numerical illustrations included in this study serve primarily as demonstrations rather than robustness analyses. Future research could conduct systematic sensitivity analyses to further validate the theoretical predictions.