Article

T-Spherical Fuzzy-Valued Neutrosophic MEREC-EDAS Framework for Evaluating Low-Carbon Cooling and Energy Management Technologies for Data Centers


Institute of Intelligent & Interactive Technologies, College of Technology and Design, University of Economics Ho Chi Minh City—UEH University, Ho Chi Minh City 700000, Vietnam
*
Author to whom correspondence should be addressed.
Systems 2026, 14(9), 1039; https://doi.org/10.3390/systems14091039
Submission received: 11 June 2026 / Revised: 10 August 2026 / Accepted: 18 August 2026 / Published: 24 August 2026

Highlights

Please indicate how your work links to systems science via your contributions to systems practice, theory, and/or methodology.
  • The study advances systems-oriented decision methodology by integrating T-Spherical Fuzzy-Valued Neutrosophic modeling, objective MEREC weighting, and EDAS ranking to evaluate interacting technical, environmental, economic, and operational dimensions under uncertainty.
  • It supports systems practice in sustainable data centers by treating cooling, energy use, carbon performance, reliability, costs, maintenance, and infrastructure compatibility as interdependent decision factors rather than optimizing isolated components.
What are the main findings and/or the implications of the main findings?
  • Direct-to-Chip Liquid Cooling and Liquid Immersion Cooling form a robust leading technology tier, with AI-Enabled Energy Management also performing strongly; sensitivity tests indicate that the exact first-ranked technology can vary across scenarios.
  • Carbon reduction potential, electricity-demand reduction, maintenance complexity, operational-cost efficiency, and cooling efficiency emerge as the most influential criteria, suggesting that technology selection should emphasize whole-system performance rather than any single cost or efficiency measure.

Abstract

Fuzzy multi-criteria decision-making is important for technology assessment when expert judgments contain uncertainty, hesitation, and inconsistent evidence. This study develops a T-Spherical Fuzzy-Valued Neutrosophic Set (T-SFVNS)-based MEREC-EDAS framework for evaluating low-carbon cooling and energy-management technologies for data centers. Expert linguistic assessments are represented by T-Spherical Fuzzy-Valued Neutrosophic Numbers and aggregated before a score function is used at the explicit scalarization boundary. Standard MEREC then derives objective criterion weights from criterion-removal effects, and standard EDAS ranks alternatives by their positive and negative distances from the average score profile. The application evaluates nine technologies against ten criteria using assessments from thirty domain specialists. The corrected MEREC calculation assigns the greatest weights to carbon reduction potential (0.127), electricity demand reduction (0.125), maintenance complexity (0.124), operational cost efficiency (0.123), and cooling efficiency (0.123). The final ranking is Direct-to-Chip Liquid Cooling, Liquid Immersion Cooling, AI-Enabled Energy Management, Water-Side Free Cooling, Free-Air Cooling, Rear-Door Heat Exchanger Cooling, Hot/Cold Aisle Containment, Renewable-Powered Cooling, and Thermal Storage-Assisted Cooling. Weight perturbation, q-parameter, leave-one-expert-out, alternative-deletion, dominated-alternative, and multi-method comparisons show that the leading tier is robust, although the exact order of the two liquid-cooling technologies is sensitive in some scenarios. The findings provide a transparent and reproducible decision-support basis while explicitly acknowledging the information compression and rank-reversal limitations of score-based MCDM.

1. Introduction

Multi-criteria decision-making (MCDM) under uncertainty is a core problem in modern technology evaluation tasks. In many real-world situations, technological options are often evaluated based on multiple conflicting criteria, while quantitative data may be incomplete, unstable, or not sufficiently reliable. Particularly for emerging technologies, expert opinions often cannot be expressed in crisp, absolute values, but rather contain ambiguity, hesitation, uncertainty, and sometimes inconsistency. Fuzzy set theory, proposed by Zadeh, laid the foundation for representing ambiguous information through degrees of belonging instead of traditional binary logic [1]. Building upon that foundation, intuitionistic fuzzy sets expand the scope of expression by simultaneously adding levels of belonging and non-belonging, better reflecting the uncertainty in evaluation [2].
Subsequent developments in fuzzy decision-making have continuously expanded the uncertainty performance capabilities of experts. Pythagorean fuzzy sets broaden the distinction between membership and non-membership, allowing professionals more flexibility in their judgments [3]. The q-rung orthopair fuzzy sets further generalize the constraint conditions, thereby increasing the ability to represent more complex evaluation scenarios [4]. Picture fuzzy sets include neutral and disapproval components, making them more suitable for contexts where experts don’t just express agreement or disagreement [5]. Spherical fuzzy sets were then introduced to simultaneously model membership, non-membership, and hesitancy in a three-dimensional structure [6]. T-spherical fuzzy sets further extend the domain of representation through the parameter (t), allowing for more flexible handling of evaluation states with high levels of hesitation [7].
Parallel to the development of fuzzy set theory, neutrosophic set theory was proposed to represent independently the three components of truth, indeterminacy, and falsehood [8]. The strength of the neutrosophic set lies in its ability to handle situations where information is not only ambiguous, but also incomplete, uncertain, or inconsistent. This characteristic is particularly relevant to technology evaluation problems, where a solution may simultaneously be perceived as having high potential, significant implementation risks, and still lacking sufficient empirical evidence. However, traditional fuzzy or neutrosophic models may still have limitations when it comes to simultaneously representing multiple expert cognitive states within a more information-rich evaluation space.
Established as an advanced representational construct, T-Spherical Fuzzy-Valued Neutrosophic Sets (T-SFVN) represent the fundamental intersection of T-spherical fuzzy information theory and neutrosophic logic [9]. By embedding the triad of truth, uncertainty, and falsity into a T-spherical fuzzy space, this structure provides a modeling mechanism with superior flexibility. This mathematical fusion allows T-Spherical Fuzzy-Valued Neutrosophic information to fully capture complex cognitive nuances, where supportive beliefs, opposing attitudes, and states of hesitation or internal conflict coexist. This multidimensional tolerance capability has become a crucial attribute in technology valuation problems, at a time when performance, cost, risk, and the probability of actual deployment are still unknowns hidden within the murky realm of information.
Possessing a resource-rich expressive space is only a necessary condition; for this mathematical structure to function effectively in practice, it requires a foundation in the form of a complete multi-criteria decision-making process. A comprehensive decision model cannot stop at accurately modeling expert knowledge; it must also encompass two core phases: objectively quantifying the number of key criteria and hierarchically ranking alternative options. Faced with this systemic demand, this study proposes a unified integrated framework combining T-SFVNs with the two algorithms Method based on the Removal Effects of Criteria (MEREC) and Evaluation based on Distance from Average Solution (EDAS), establishing a closed-loop mathematical programming roadmap for technological problems in particular and evaluation problems under uncertainty in general.
In the proposed framework, MEREC is chosen to determine the weighting of objective criteria. MEREC determines the importance of each criterion based on the effect of removing the criterion from the decision matrix [10]. If removing a criterion significantly alters the overall performance of the options, that criterion is considered to have played a more important role in the evaluation process. This approach reduces reliance on subjective weights directly assigned by experts and is suitable for problems with multiple technical, economic, environmental, and operational criteria. In technology selection problems, this advantage is particularly important because experts can evaluate alternatives based on individual criteria, but directly determining the relative importance of all criteria is often easily influenced by personal experience or cognitive bias. EDAS is used in the ranking phase because this method evaluates solutions based on the positive and negative distances from the mean solution [11]. Unlike methods based on ideal or anti-ideal solutions, EDAS uses the average solution as a more realistic reference point within the set of solutions under consideration. This is relevant to technology evaluation problems, where alternatives often have different levels of maturity, performance, cost, and risk. EDAS also has the ability to simultaneously handle benefit and cost criteria, making it suitable for selection problems where an option may be technically efficient but disadvantageous in terms of cost, implementation, or operational complexity.
Recent MCDM studies have demonstrated the value of combining objective weighting methods with fuzzy models in sustainable technology selection. For example, the MEREC–Spherical Fuzzy CoCoSo model has been applied to prioritize marine energy technologies in the Vietnamese context [12]. Another study used T-spherical fuzzy matrix energy to evaluate offshore wind energy storage technology, thereby demonstrating the potential of T-spherical fuzzy information in energy technology problems with high levels of uncertainty [13]. Furthermore, MCDM neural frameworks have also been used in the selection of sustainable energy storage technologies, demonstrating the capabilities of neural information in handling uncertain and inconsistent information [14]. However, these studies have not yet developed a framework to integrate T-Spherical Fuzzy-Valued Neutrosophic information with MEREC and EDAS in the same assessment process. To illustrate and test the feasibility of the proposed framework, this study uses the problem of evaluating low-carbon cooling and energy management technologies for data centers as an application context. Data centers are essential infrastructure for the digital economy, but the rapid expansion of cloud computing, artificial intelligence, and big data is significantly increasing electricity consumption, cooling needs, and carbon emissions. Energy efficiency studies show that data center evaluation should not be based solely on Power Usage Effectiveness but should also consider many other aspects related to energy, eco-design, operating conditions, and system boundaries [15]. Therefore, this context is suitable for testing the capabilities of a novel MCDM model in handling multiple conflicting criteria and uncertain expert information.
Low-carbon cooling and energy management technologies for data centers are diverse, including free cooling, airflow optimization, direct liquid cooling, immersion cooling, radiative cooling, waste heat recovery, AI-based energy management, carbon-aware computing, and renewable energy integration. Studies on data center energy conservation and emission reduction technologies show that the decarbonization roadmap requires a combination of optimizing IT equipment, improving cooling systems, upgrading power supply systems, operational management, and the use of clean energy [16]. Review studies of cooling technologies also show that air conditioning, free cooling, and liquid cooling all have the potential to improve energy efficiency, but each technology differs in terms of climatic conditions, cost, scalability, and technical requirements [17]. In addition to cooling, intelligent energy management and waste heat recovery extend the scope of evaluation from the equipment level to the system level. Reinforcement learning and deep reinforcement learning have been extensively studied to optimize cooling systems, task scheduling, resource allocation, and network traffic control in data centers [18]. Waste heat recovery also creates opportunities to reuse waste heat from servers for low-temperature applications or zone heating systems, thereby improving overall energy efficiency [19]. At the same time, studies on green-aware management emphasize that sustainable data center development needs to be viewed as a systems management issue, in which hardware, software, cooling, energy, and operations are interdependent [20].
The experimental environment, provided by data centers, possesses the stringent attributes necessary to test the operational capabilities of the proposed framework across three intrinsic dimensions. This suitability is first confirmed by a spectrum of alternative technologies possessing entirely different technical characteristics. This diversity inevitably leads to a complex conflict within the evaluation criteria matrix, where goals of optimizing energy efficiency and carbon reduction potential must be traded off against reliability, scalability, technological maturity, and pressure from investment, operating, and maintenance costs. This challenge is further exacerbated by the fact that most current solutions remain on the boundary between research and large-scale implementation, making expert panel decisions prone to hesitation, uncertainty, and inconsistency. This case study, therefore, not only has purely practical application value, but also serves as a perfect stress test to demonstrate the ability of the T-Spherical Fuzzy Valued Neutrosophic MEREC-EDAS mathematical model to manage uncertain information.
In summary, the methodological research gap of the paper begins to be clearly defined based on the divergence between the two contemporary academic schools of thought. While current documentation on low-carbon data centers focuses heavily on technology assessment, thermal simulation, control optimization, or system performance analysis, these works often only explain purely technical characteristics and miss out on building a decision-making model capable of prioritizing decisions from the perspective of expert uncertainty; conversely, fuzzy and neutrosophic MCDM studies have yet to fully exploit the power of integrating T-SFVNs with MCDM models into a unified whole. This lack of parallel makes the establishment of a T-Spherical Fuzzy Valued Neutrosophic MCDM model an essential requirement, simultaneously filling the gap in both the theoretical mathematics of multi-valued mathematics and the practical application of sustainable methods.
The main objective of this research is to develop a T-Spherical Fuzzy-Valued Neutrosophic MEREC-EDAS framework for multi-criteria technology evaluation under uncertainty conditions. In this framework, T-Spherical Fuzzy Valued Neutrosophic Sets are used to represent expert evaluation; MEREC is applied to determine the objective weight of the criteria; and EDAS is used to rank alternatives based on their distance from the mean solution. The problem of selecting low-carbon cooling and energy management technologies (LCCEMTs) for a data center is used as a case study to illustrate the calculation process, feasibility testing, and application value demonstration of the proposed framework.
This research has three main contributions. Firstly, the research aims to develop a new MCDM framework based on T-Spherical Fuzzy-Valued Neutrosophic, thereby expanding the ability to represent uncertainty, hesitation, and inconsistency in expert evaluation. Secondly, the study integrates MEREC and EDAS into the same T-Spherical Fuzzy Valued Neutrosophic environment, creating a unified process that includes objective weighting and alternative ranking. Third, the study illustrates the proposed framework through the problem of selecting cooling technology and low-carbon energy management for data centers, thereby demonstrating the applicability of the model in a sustainable technology context with many conflicting criteria.
The rest of the article is organized as follows. Section 2 presents a literature review on low-carbon cooling and energy management technologies for data centers, as well as related fuzzy and neutrosophic MCDM studies. Section 3 introduces the fundamental concepts and processes of the T-Spherical Fuzzy-Valued Neutrosophic MEREC-EDAS framework. Section 4 presents a case study, including technological options, criteria, expert data, and calculation procedures. Section 5 discusses the results, methodological implications, and practical significance. Section 6 concludes the study, outlines limitations, and suggests directions for further research.

2. Literature Review

2.1. Low-Carbon Technologies for Sustainable Data Centers Studies

Low-carbon cooling and energy management technologies for data centers have evolved from individual optimization solutions to integrated configurations at the system level. Instead of simply improving the performance of cooling equipment, recent research has begun to simultaneously consider climatic conditions, building design, renewable energy sources, waste heat recovery, intelligent control, and flexible operation. Güğül et al. assessed the feasibility of net-zero energy data centers through a combination of free cooling, heat reuse, building improvements, and solar power systems, thereby demonstrating that carbon reduction for data centers needs to be approached as an integrated problem involving multiple technologies rather than optimizing just a single component [21].
Within the cooling technology group, direct liquid cooling is attracting significant attention due to its ability to meet the high-power density demands of modern data centers. This technology brings the refrigerant closer to the heat source than air cooling, thereby improving heat transfer and reducing the need for large-scale air circulation. Kong et al. provide an overview of direct liquid cooling technologies and emphasize that this group of solutions has the potential to improve energy efficiency and operational safety in high-density computing environments [22]. Experimental studies on cold plate liquid cooling also show that a direct-to-chip approach can improve cooling efficiency in systems that simulate high heat loads, but implementation depends on heat exchanger design, liquid delivery system, and actual operating conditions [23].
Immersion cooling is another technology with great potential in the context of increasing server heat density. Unlike direct liquid cooling, immersion cooling places the equipment or component in a dielectric liquid environment, increasing the heat contact area and reducing reliance on fan systems. Liu and colleagues developed an optimization model for immersion cooling combined with liquid air energy storage, demonstrating that this approach can be evaluated simultaneously in terms of thermodynamic performance and economic efficiency [24]. Another study on cooling immersion combined with economizers showed that the energy efficiency of this technology can vary significantly depending on the climate zone, thus highlighting the role of local conditions in the selection of cooling technology [25].
Besides liquid cooling and immersion cooling, flexible cooling configurations and operation at high temperatures are also considered approaches to reducing cooling energy consumption. Raising operating temperatures within safe limits can reduce the load on the cooling system but needs to be balanced against hardware reliability and the risk of performance degradation. Hriez et al. studied the potential for energy savings in data centers operating at high temperatures and showed that this strategy could reduce cooling needs if properly controlled [26]. Mohammed et al. compared cooling solutions for high-density data centers, analyzing air-based cooling with hot aisle containment and two-phase immersion cooling as two technical approaches with different operational characteristics [27].
Waste heat recovery is an important set of solutions because it converts a portion of the energy wasted in data center operations into a useful energy source. Yuan et al. reviewed waste heat sources in data centers, including exhaust gases, recirculated water, and coolants, and analyzed heat utilization scenarios for heating, district heating, cooling, power generation, and industrial or agricultural applications [28]. Monsalves et al. quantified the economic and environmental impacts of integrating large data centers with highly renewable energy systems, in which flexible cooling and waste-heat equipment were incorporated into an energy system optimization model [29]. Wang et al. approached this problem at the integrated systems level, pointing out that the mismatch between waste heat sources and heat demand can significantly affect the practical efficiency of heat recovery schemes [30].
Smart energy management extends the challenge of carbon reduction from the equipment level to the control and operational levels. Real-time optimization methods can adjust feed temperature, water flow, cooling load, and operating status according to changing IT load conditions and the external environment. Qu et al. proposed a real-time optimization method for liquid-cooled data centers, demonstrating that intelligent control can significantly improve energy efficiency under varying thermal load and ambient temperature conditions [31]. Liu et al. developed an online job scheduling model for low-carbon data center operations, in which deep reinforcement learning is used to simultaneously reduce energy costs and carbon footprint when handling heterogeneous tasks [32].
A newer line of research involves coordinating computing load spatially and temporally to take advantage of low-carbon power sources. Riepin et al. showed that shifting workloads over time and location can support the goal of 24/7 carbon-free energy matching in power systems with a high proportion of renewable energy [33]. Figini et al. studied the sizing problem of energy storage and local power generation systems for data centers under simultaneous cost and carbon targets, thereby showing that the choice of on-site energy technology requires a balance between investment, operation, and emissions [34]. Takci et al. analyzed the role of data centers as a flexible power source for the electricity system, emphasizing that the ability to adjust workload and power consumption can support renewable energy integration and emissions reduction at the system level [35].
The profound differentiation of the aforementioned low-carbon cooling and energy management technologies confirms that this is not a homogeneous set of solutions. The unique nature of each technology, from energy efficiency and maturity levels to cost pressures and maintenance barriers, has pushed this selection process into a highly complex, multi-criteria decision-making space. This challenge is further amplified by the fact that the empirical parameters and operational reliability of advanced technologies have not yet reached saturation, directly creating areas of hesitation and uncertainty in the expert panel’s perception. This multifaceted and multipolar nature transforms the data center ecosystem into an ideal experimental environment for testing the MCDM model’s ability to control conflict criteria.

2.2. Fuzzy Multiple Criteria Decision-Making Studies

Fuzzy MCDM has become an important methodological approach in technology, energy, and sustainable development assessment problems, where assessment information is often incomplete, linguistic, or difficult to represent with precise numerical values. In these problems, alternative solutions are often considered simultaneously based on multiple conflicting criteria, such as technical performance, cost, environmental impact, risk level, feasibility, and long-term reliability. Therefore, fuzzy MCDM provides a structured approach to transforming expert judgment into computable information while maintaining the inherent uncertainty in human judgment. The recent development of spherical fuzzy, T-spherical fuzzy, Fermatean fuzzy, and neutrosophic environments suggests that MCDM research is shifting from classical fuzzy structures to more informative representational models.
Spherical fuzzy MCDM is widely used due to its ability to simultaneously represent membership, non-membership, and hesitancy. This characteristic is well suited for sustainability problems, where experts may advocate for one solution but remain hesitant or have not fully ruled out the associated risks. Ghoushchi et al. developed a SWARA-CODAS algorithm integrated into a spherical fuzzy environment to assess barriers to clean energy adoption, thereby demonstrating that spherical fuzzy modeling can support the analysis of complex problems in the energy transition [36]. Moslem proposed a streamlined spherical fuzzy AHP model for sustainable urban transport solution selection, demonstrating that the spherical fuzzy environment can reduce the burden of pairwise comparisons but still reflect hesitation in expert judgment [37]. T-spherical fuzzy MCDM further expands this research direction by providing a more flexible representation domain for expert evaluation. Compared to spherical fuzzy sets, T-spherical fuzzy sets allow for a wider domain of feasibility through a parameterized power structure, making them more suitable for problems with a high degree of uncertainty. Wang et al. developed an improved CoCoSo method based on Frank operational laws and softmax functions in a T-spherical fuzzy environment, showing that aggregation and compromise ranking can be enhanced when expert ratings are represented by more informative fuzzy structures [38]. Gurmani et al. proposed aggregation operators in a T-spherical fuzzy linguistic environment and integrated them with a combinational distance-based assessment method for the contractor selection problem in renewable energy projects, thereby confirming the usefulness of T-spherical fuzzy information in complex sustainable project decisions [39].
Another notable trend is the integration of scalable fuzzy environments with objective weighting and ranking methodologies. Chen proposed an integrated MEREC-taxonomy approach within a T-spherical fuzzy environment for decision analysis in smart agriculture, demonstrating that T-spherical fuzzy information can be embedded into a complete decision-making process including criterion importance identification and alternative classification [40]. Alballa et al. developed a multi-criteria group decision model based on Frank aggregation operators in a (p,q,r)-spherical fuzzy environment for classifying renewable energy sources, further confirming the role of extended spherical-type fuzzy structures in energy problems [41]. These studies show that the current methodological trend is not only about expanding fuzzy sets, but also about integrating them with more complete MCDM processes. In the field of renewable energy and sustainable technologies, fuzzy MCDM has been used to assess not only technologies, but also the location, barriers, strategies, and system efficiency. Hezam et al. applied spherical fuzzy methods to evaluate wave energy positioning, technology, and converter options, showing that fuzzy MCDM can support decisions involving both spatial and technological dimensions [42]. Wang et al. used an integrated MCDM model to analyze renewable energy technology selection, thereby demonstrating that the objective weighting method can be effectively combined with traditional ranking algorithms in energy technology selection [43]. These studies are relevant to the current research because selecting cooling and low-carbon energy management technologies for data centers also requires simultaneous consideration of multiple options, criteria, and context-dependent performance.
EDAS-based fuzzy MCDMs have also attracted attention due to their easily interpretable logic based on distance from the mean solution. Kacprzak proposed a new fuzzy extension of EDAS for group decision-making, showing that EDAS structures can adapt to uncertain evaluations while retaining the advantage of comparing alternatives to a mean reference point [44]. This approach is particularly well-suited to technology evaluation because alternatives often lack a clear, ideal benchmark, especially when they differ in maturity, cost, performance, and readiness for deployment. In such cases, EDAS’s average-solution logic provides a more practical basis for comparison than approaches that rely solely on ideal or anti-ideal solutions. Studies based on MEREC represent an important line of research because they approach the problem of criterion weighting from an objective perspective. Instead of requiring experts to directly assign weights, MEREC infers the importance of criteria from the decision matrix by measuring the effect of removing each criterion. Haq et al. developed a single-valued neutrosophic framework, MEREC-MARCOS, for sustainable material selection, demonstrating how removal-effect weighting can be combined with uncertainty modeling in sustainability problems [45]. Nhieu et al. proposed a distance-based objective weighting model for benchmarking industrial palletizing robots, thereby emphasizing the value of objective weights in technology comparison problems with multiple technical and operational criteria [46]. These studies reinforce the role of objective weighting in modern MCDM, especially when the criteria set is large, heterogeneous, and difficult to prioritize through subjective evaluation.
Neutrosophic MCDMs also thrive on their ability to represent truth, indeterminacy, and falsity as separate components. Ma et al. proposed a MEREC-EDAS framework in a single-valued neutrosophic environment for assessing challenges in teaching quality, showing that neutrosophic information can naturally combine with both objective weights and mean-distance-based rankings, demonstrating that neutrosophic information can naturally combine with both objective weights and mean-distance-based rankings [47]. Xu introduces a new distance measure for single-valued neutrosophic sets and combines it with TODIM and TOPSIS, highlighting the role of distance-based modeling in neutrosophic decision-making [48]. These studies show that neutrosophic MCDM is suitable for situations where expert evaluation contains uncertainties and inconsistencies that are difficult to fully capture with conventional fuzzy values.
In addition to applications at the technology level, MEREC and objective weighting variations have also been extended to sustainable performance assessment problems at the system level. Nguyen and Nhieu developed the DNMEREC-DNMARCOS model to compare sustainability performance between G7 and BRICS economies, showing that MEREC can be adapted and extended to more complex assessment contexts beyond single technology choices [49]. This expansion is significant for the current research because the proposed framework not only needs to rank alternative technologies but also needs to provide a sufficiently flexible weighting system to reflect differences in the roles of criteria in an uncertain environment. The development of MCDM theory is shifting the focus towards advanced fuzzy architectures that encompass broader uncertainty domains, transcending both spherical and rudimentary neutrosophic structures. A typical trend is the application of Fermatean fuzzy sets and extended paradigms to solve complex decision-making problems [50]. The focus of this shift is on the capacity to represent information, the power of aggregation mechanisms and the synchronization of the hybrid weighting–ranking process. However, a paradox exists within the literature system: profound fragmentation. Current research directions seem to operate in isolation, either delving only into spherical/T-spherical fuzzy integration, focusing solely on the neutrosophic environment, or developing isolated local algorithms such as MEREC, EDAS, CODAS, CoCoSo, MARCOS, or TOPSIS without finding common ground.
As a natural consequence of the development of fuzzy decision theory, previous MCDM studies have excelled in translating mathematics into more complex spaces such as spherical, T-spherical, Fermatean fuzzy, and neutrosophic. The success of these approaches is valuable evidence of the capabilities of objective weighting or distance-based ranking in green infrastructure projects. However, establishing a unified framework capable of simultaneously binding T-Spherical Fuzzy-Valued Neutrosophic information with both MEREC and EDAS algorithms remains an unfinished task. This core constraint established an ideal research space, shaping the objectives and methodology for the framework proposed in this paper.
The methodological position of the present framework is clarified by comparison with recent uncertain-MCDM models. The interval-valued spherical fuzzy SWARA model for telemedicine prioritization retains interval uncertainty but relies on a subjective, sequential criterion-weighting process [51]. The circular spherical fuzzy Frank-WASPAS model expands the information domain and supplies parametric aggregation flexibility, but its results depend on the selected algebraic parameter and a compensatory sum-product ranking rule [52]. The AHP-driven Aczel-Alsina T-spherical fuzzy model formally represents prioritization among criteria and develops flexible aggregation operators, although AHP introduces pairwise-comparison burden and subjective consistency requirements [53]. Recent Aczel-Alsina power aggregation for intuitionistic hesitant fuzzy information emphasizes operator flexibility [54], while Uninorm combination weighting with MULTIMOORA-Borda illustrates a hybrid route that combines multiple weighting and ranking logics [55]. These studies are valuable alternatives, but they answer different design questions from removal-effect weighting and average-based appraisal. By contrast, the present framework uses T-SFVNSs to represent three internally structured truth, indeterminacy, and falsity assessments, employs MEREC to infer criterion weights from the decision matrix without direct criterion-weight elicitation, and uses the original EDAS logic [56] to benchmark each technology against the observed average rather than an ideal or anti-ideal point. Its disadvantages are equally explicit: the nine-dimensional T-SFVNN is compressed to a score before weighting and ranking, the linguistic scale requires theoretical or empirical calibration, and EDAS may exhibit rank reversal when the candidate set changes. These limitations motivate the robustness and comparison analyses reported in Section 4.
MEREC was selected because criterion-removal effects provide a direct and auditable interpretation of structural importance, not because MEREC is universally superior to newer objective-weighting methods. EDAS was selected because an average reference is meaningful for technology screening when no universally accepted ideal technology exists. WENSLO, LOPCOW, MABAC, MAIRCA, RAFSI, and other weighting-ranking combinations remain valid alternatives; the comparative analysis therefore tests whether the main decision pattern depends on the ranking engine. This positioning responds to recent calls for explicit sensitivity and validation protocols in MCDM studies [57,58].

3. Methodology

  • Preliminaries
Definition 1.
A T-Spherical Fuzzy-Valued Neutrosophic Set (T-SFVNS)  S over the universe of discourse  U ^   is defined as
S = u , T S ( u ) , I S ( u ) , F S ( u ) : u U ^ ,
where  T S ( u ) ,  I S ( u ) , and  F S ( u )  denote the truth, indeterminacy, and falsity neutrosophic values, respectively, and each of them is represented by a T-spherical fuzzy value. For any  u U ^ ,
T S ( u ) = ( μ S , T ( u ) , ω S , T ( u ) , ν S , T ( u ) ) ,
I S ( u ) = ( μ S , I ( u ) , ω S , I ( u ) , ν S , I ( u ) ) ,
F S ( u ) = ( μ S , F ( u ) , ω S , F ( u ) , ν S , F ( u ) ) ,
such that all components belong to [0, 1] and satisfy the T-spherical conditions
( μ S , T ( u ) ) q + ( ω S , T ( u ) ) q + ( ν S , T ( u ) ) q 1 ,   q 1
( μ S , I ( u ) ) q + ( ω S , I ( u ) ) q + ( ν S , I ( u ) ) q 1 ,   q 1
( μ S , F ( u ) ) q + ( ω S , F ( u ) ) q + ( ν S , F ( u ) ) q 1 ,   q 1
By definition,
0 T S ( u ) + I S ( u ) + F S ( u ) 3
A T-Spherical Fuzzy-Valued Neutrosophic Number (T-SFVNN) is therefore written as
Γ = ( μ T , ω T , ν T ) , ( μ I , ω I , ν I ) , ( μ F , ω F , ν F )
This structure provides a richer representation of uncertain information because the truth, indeterminacy, and falsity parts are each expressed through an internal T-spherical fuzzy triple rather than a single scalar quantity.
Definition 2.
Let
Γ = ( μ T , ω T , ν T ) , ( μ I , ω I , ν I ) , ( μ F , ω F , ν F )
be a T-SFVNN. The score function of  Γ  is defined as
Π ( Γ ) = 1 3 ( μ T ) q ( ν T ) q + 1 ( ( μ I ) q ( ν I ) q ) + 1 ( ( μ F ) q ( ν F ) q ) .
Definition 3.
The accuracy function of  Γ  is defined as
Γ = ( μ T ) q + ( ω T ) q + ( ν T ) q ( μ F ) q + ( ω F ) q + ( ν F ) q .
Definition 4.
Let  Γ 1  and  Γ 2   be two T-SFVNNs. Their comparison is determined as follows:
(i) If  Π ( Γ 1 ) < Π ( Γ 2 ) , then  Γ 1 < Γ 2 ;
(ii) If  Π ( Γ 1 ) > Π ( Γ 2 ) , then  Γ 1 > Γ 2 ;
(iii) If  Π ( Γ 1 ) = Π ( Γ 2 ) , then the comparison is completed by the accuracy values  A ( Γ 1 )  and  A ( Γ 2 ) .
Definition 5.
The quadratic score function of  Γ  is defined as
Ω Γ = 1 3 [ ( μ T ) 2 q ( ν T ) 2 q + 1 ( ( μ I ) 2 q ( ν I ) 2 q )                                 + 1 ( ( μ F ) 2 q ( ν F ) 2 q ) ] .
Definition 6.
The quadratic accuracy function of  Γ  is defined as
B Γ = ( μ T ) 2 q + ( ω T ) 2 q + ( ν T ) 2 q ( μ F ) 2 q + ( ω F ) 2 q + ( ν F ) 2 q .
Definition 7.
Let  Γ 1  and  Γ 2   be two T-SFVNNs. Their comparison can also be conducted by using the quadratic score and quadratic accuracy functions. Specifically:
(i) If  Ω ( Γ 1 ) < Ω ( Γ 2 ) , then  Γ 1 < Γ 2 ;
(ii) If  Ω ( Γ 1 ) > Ω ( Γ 2 ) , then  Γ 1 > Γ 2 ;
(iii) If  Ω ( Γ 1 ) = Ω ( Γ 2 ) , then the comparison is completed using  B ( Γ 1 )  and  B ( Γ 2 ) .
Definition 8.
Let  Γ ε ,  ε = 1 ,   2 , , n , be a collection of T-SFVNNs and let
η = ( η 1 , η 2 , , η n )
be a weight vector such that  η ε  [0, 1] and
ε = 1 n η ε = 1
The T-Spherical Fuzzy-Valued Neutrosophic Weighted Average operator (T-SFVNWA) is defined as
T-SFVNWA ( Γ 1 , Γ 2 , , Γ n ) = η 1 Γ 1 η 2 Γ 2 η n Γ n
Its explicit form is written as
T-SFVNWA ( Γ 1 , Γ 2 , , Γ n ) = 1 ε = 1 n 1 ( μ T ε ) q η ε 1 q , ε = 1 n ( ω T ε ) η ε , ε = 1 n ( ν T ε ) η ε , ε = 1 n ( μ I ε ) η ε , 1 ε = 1 n 1 ( ω I ε ) q η ε 1 q , 1 ε = 1 n 1 ( ν I ε ) q η ε 1 q , ε = 1 n ( μ F ε ) η ε , 1 ε = 1 n 1 ( ω F ε ) q η ε 1 / q , 1 ε = 1 n 1 ( ν F ε ) q η ε 1 / q
This operator is used to synthesize multiple T-SFVNN values into a single representative assessment while preserving the T-spherical neutrosophic structure.
Definition 9.
Let  Γ ε ,  ε = 1 ,   2 , , n , be a collection of T-SFVNNs with the same weight vector  η . The T-Spherical Fuzzy-Valued Neutrosophic Weighted Geometric operator (T-SFVNWG) is defined as
T-SFVNWG ( Γ 1 , Γ 2 , , Γ n ) = ( Γ 1 ) η 1 ( Γ 2 ) η 2 ( Γ n ) η n
Its explicit form is
T-SFVNWG ( Γ 1 , Γ 2 , , Γ n ) = ε = 1 n ( μ T ε ) η ε , 1 ε = 1 n 1 ( ω T ε ) q η ε 1 q , 1 ε = 1 n 1 ( ν T ε ) q η ε 1 q ,                                 1 ε = 1 n 1 ( μ I ε ) q η ε 1 q , ε = 1 n ( ω I ε ) η ε , ε = 1 n ( ν I ε ) η ε ,                                 1 ε = 1 n 1 ( μ F ε ) q η ε 1 / q , ε = 1 n ( ω F ε ) η ε , ε = 1 n ( ν F ε ) η ε .
Although both T-SFVNWA and T-SFVNWG are theoretically available, the present study employs the weighted average form in the application stage.
Mathematical properties of the aggregation operators
The T-SFVNWA and T-SFVNWG operators satisfy four properties required for consistent aggregation. Let Z ( k ) , k = 1 , , K , be admissible T-SFVNNs, and let the paired weights satisfy λ k 0 and Σ k λ k   = 1 .
Proposition 1 (Idempotency).
If  Z ( 1 ) = = Z ( K ) = Z , then both T-SFVNWA and T-SFVNWG return Z. This follows because the weighted products reduce to the original components when the weights sum to one.
Proposition 2 (Boundedness and closure).
The aggregate lies componentwise between the corresponding lower and upper bounds of the input collection and remains an admissible T-SFVNN. The product and probabilistic-sum terms in Equations (18)–(20) remain in ([0, 1]); applying the T-spherical constraints to these monotone terms preserves each q-powered triple sum at or below one.
Proposition 3 (Monotonicity).
If  Z 1 ( k ) Z 2 ( k )  for every paired input and the same weight vector is used, both aggregated results preserve the order. Each component expression is monotone in the direction specified by the T-SFVNN comparison rule.
Proposition 4 (Permutation invariance of paired inputs).
Simultaneously permuting the input T-SFVNNs and their associated weights does not change either aggregate because multiplication and addition are commutative. This property does not imply that unequal weights may be reassigned to different experts without changing the result.

3.1. The T-SFVNS-Based MEREC-EDAS Framework

The framework preserves the T-SFVNN structure during linguistic conversion, cost–benefit normalization, and group aggregation. Scalarization is introduced only after the collective T-SFVNN matrix has been established. The subsequent weighting and ranking stages use the standard MEREC and EDAS formulations.
The 15-label scale in Table 1 is a theory-constrained scale rather than an empirically estimated psychometric instrument. Its performance dimension increases the truth-membership anchor and decreases the falsity-membership anchor from very low to very high. Its certainty dimension adjusts the indeterminacy-related components and moderates the extremity of truth and falsity. Every truth, indeterminacy, and falsity triple satisfy μ ^ q + ω ^ q + ν ^ q 1 . At q = 4 , the largest triple sum is 0.452429; all 45 triples are admissible. Within each confidence pattern, the score increases strictly from very low to very high. The scale is also admissible for q = 2 ,   3 , a n d   5 , providing a basis for q-sensitivity testing.
Step 1. Identify experts, alternatives, and criteria. Let A i , C j , and Ek denote alternatives, criteria, and experts. Expert credibility is computed from education and experience rather than assigned arbitrarily. Let d k 2 , 3 , 4 , 5 represent Bachelor, Master, PhD, and Professor categories, respectively, and let y k be years of experience. The raw credibility score and normalized expert weight are
g k = d k + β l n 1 + y k , λ k = g k h = 1 K g h , β = 0.218974
The logarithm limits the dominance of very long experience while preserving education and experience differences. The formula reproduces the supplied expert weights with a maximum absolute error below 2.26 × 10 8 .
Step 2. Construct individual decision matrices. Each linguistic assessment is converted through Table 1 into
X i j k = μ T , i j k , ω T , i j k , ν T , i j k , μ I , i j k , ω I , i j k , ν I , i j k , μ F , i j k , ω F , i j k , ν F , i j k
The individual matrix is denoted by X ( k ) = [ X i j ( k ) ] m × n , and every record is checked for admissibility (23).
Step 3. Normalize benefit and cost criteria. Benefit assessments are unchanged. For a cost criterion,
X ~ i j k = μ F , ω F , ν F , ν I , 1 ω I , μ I , μ T , ω T , ν T
All later criteria therefore share a benefit orientation.
Step 4. Aggregate expert judgments. The collective T-SFVNN is
X ~ i j = T-SFVNWA X ~ i j 1 , , X ~ i j K ; λ 1 , , λ K
The collective decision matrix is denoted by
X ~ = X ~ i j m x n
Step 5. Establish the scalarization boundary. The standard score function is applied only to the collective matrix:
s i j = Π X ~ i j , S = s i j m × n
The quadratic score and accuracy matrices remain diagnostic outputs and are not substituted for the score matrix in the baseline model.
Step 6. Normalize for standard MEREC. Because Step 3 has converted every criterion to benefit orientation, standard MEREC uses
n i j = m i n i s i j s i j , N = n i j m × n
Thus, 0 < n i j 1 . No min-max normalization, reciprocal transformation, or numerical constant ε is required.
Step 7. Calculate overall performance. For each alternative,
S i = l n 1 + 1 n j = 1 n l n n i j
Step 8. Remove each criterion and derive objective weights. The performance after removing (C_j) retains the original denominator ( n ), as in standard MEREC:
S i j j = l n 1 + 1 n l j l n n i l
The criterion effect and normalized weight are
E j = i = 1 m S i S i j j , w j = E j l = 1 n E l , j = 1 n w j = 1
Step 9. Construct the EDAS average solution. Standard EDAS is applied to the score matrix:
s j = 1 m i = 1 m s i j
Step 10. Compute relative distances from average. Because every criterion is benefit-oriented,
P D A i j = m a x 0 , s i j s j s j , N D A i j = m a x 0 , s j s i j s j
These are relative score distances; they are not nine-dimensional Euclidean distances between T-SFVNNs.
Step 11. Aggregate positive and negative distances.
S P i = j = 1 n w j P D A i j , S N i = j = 1 n w j N D A i j
N S P i = S P i m a x i S P i , N S N i = 1 S N i m a x i S N i
Step 12. Obtain appraisal scores and ranks.
A S i = 1 2 N S P i + N S N i
Alternatives are ranked in descending order of (AS_i).

3.2. Information Preservation, Model Selection, and Validation Protocol

The scalarization in Step 5 is intentionally delayed but is not lossless. Mapping nine T-SFVNN components to one score prevents exact reconstruction of the original truth-indeterminacy-falsity configuration. The model therefore retains the aggregated T-SFVNN, quadratic score, and accuracy outputs for audit and diagnostics. Quantitative checks compare score distances with nine-dimensional distances, score ordering with quadratic-score ordering, and final rankings under alternative q values. This approach measures the consequences of compression instead of claiming that no information is lost.
MEREC and EDAS were paired because they answer distinct questions. MEREC asks how strongly the decision structure changes when a criterion is removed; EDAS asks whether an alternative performs above or below the observed average. Validation includes one-at-a-time weight perturbation, q sensitivity, leave-one-expert-out analysis, comparison with TOPSIS, CODAS, CoCoSo, and MARCOS after common T-SFVNN preprocessing, and rank-reversal tests based on alternative deletion and dominated-alternative addition. EDAS does not mathematically eliminate rank reversal. For recurring technology screening, a fixed-reference protocol should retain the baseline criterion weights and average profile; a fully recalculated candidate set must be interpreted as a new decision problem.

4. Numerical Results

This section implements the proposed T-SFVN MEREC-EDAS framework for evaluating low-carbon cooling and energy management technologies in the data center context. The case study is designed as a methodological validation rather than a simple empirical ranking exercise. It follows the full computational chain developed in Section 3, moving from expert identification and linguistic evaluation to T-SFVN transformation, expert aggregation, score-based scalarization, MEREC-based objective weighting, and EDAS-based alternative ranking. Through this structure, the case study demonstrates how the proposed framework preserves uncertainty information in the early stages of evaluation and converts it into decision-support outputs only when required for weighting and ranking.
The decision problem consists of nine low-carbon cooling and energy management technologies, ten evaluation criteria, and thirty experts. The expert panel was constructed to reflect the interdisciplinary nature of data center technology assessment. As shown in Table 1, the experts come from data center operation, HVAC engineering, sustainability research, energy management, IT infrastructure, artificial intelligence, thermal systems, green building, cloud infrastructure, decision science, and sustainable computing. Their assigned weights range from 0.021 to 0.049 and satisfy the normalization requirement in Step 1 of the proposed framework. These weights are used only to aggregate expert judgments. They are not used to directly determine the importance of criteria. This distinction is important because the framework separates expert credibility from criterion importance: expert weights support collective judgment formation, while criterion weights are later extracted objectively through the MEREC removal-effect mechanism.
Experts were selected purposively using three eligibility conditions: at least one relevant academic or professional qualification, direct work or research experience in at least one criterion domain, and familiarity with data-center cooling, energy systems, sustainability, or decision analysis. The panel was deliberately interdisciplinary because no single profession covers thermal performance, energy demand, carbon effects, capital and maintenance requirements, water use, retrofit constraints, operating cost, and reliability simultaneously. Evaluations were collected independently using the same definitions, alternatives, criteria, and 15-label scale. No consensus round was used; disagreement was preserved through the T-SFVNN aggregation stage. The validation file confirms that all 2700 expert-alternative-criterion records satisfy the q-spherical constraints. The leave-one-expert-out analysis reported in Section 4.4 evaluates whether any single expert drives the final result.
The alternatives considered are presented in Table 2. The nine technologies include Renewable-Powered Cooling (RPC), Free-Air Cooling (FAC), Water-Side Free Cooling (WFC), Hot/Cold Aisle Containment (HAC), Direct-to-Chip Liquid Cooling (DLC), Liquid Immersion Cooling (LIC), Thermal Storage-Assisted Cooling (TSC), Rear Door Heat Exchanger Cooling (RDH), and AI-Enabled Building Energy Management (AEM). These alternatives represent different technological routes for reducing cooling-related energy consumption and carbon emissions in data center operations. Some technologies focus on direct thermal removal, such as DLC and LIC; some rely on environmental or infrastructure conditions, such as FAC and WFC; some improve airflow or rack-level thermal management, such as HAC and RDH; others support system-level decarbonization through renewable power, thermal storage, or intelligent control.
The evaluation criteria are reported in Table 3. The ten criteria include cooling efficiency (RC1), carbon reduction potential (RC2), scalability for capacity growth (RC3), electricity demand reduction (RC4), initial capital requirement (RC5), maintenance complexity (RC6), water-use intensity (RC7), retrofit compatibility (RC8), operational cost efficiency (RC9), and system reliability (RC10). The criteria capture technical, environmental, economic, and operational dimensions of LCCEM technology evaluation. RC5, RC6, and RC7 are non-beneficial criteria, while the remaining criteria are beneficial criteria. This mixed benefit–cost structure increases the complexity of the decision problem because a technology with strong cooling or carbon performance may still be penalized by high capital requirements, intensive maintenance, or water dependence.
After defining the alternatives and criteria, each expert provided linguistic evaluations for the performance of each technology under each criterion. Table 4 presents the linguistic evaluation matrix provided by Expert 1 as an illustrative input. The same assessment protocol was applied to all thirty experts. These linguistic evaluations represent the first layer of uncertainty in the framework because experts are not forced to assign exact numerical values. Instead, they express judgments through a linguistic scale that incorporates both performance intensity and certainty pattern.
The linguistic evaluations in Table 4 were then converted into T-Spherical Fuzzy-Valued Neutrosophic Sets according to the linguistic scale defined in Section 3. Table 5 presents the individual T-SFNs decision matrix of Expert 1, the results of the remaining experts are detailed in the attached Supplementary Materials. This table is important because it shows how qualitative expert judgments are mathematically represented before entering the group aggregation process. Each linguistic term is transformed into a structured fuzzy-neutrosophic assessment rather than a single crisp value. In this way, the model retains truth, indeterminacy, and falsity information at the individual expert level. This step corresponds to Step 2 of the proposed computational procedure and establishes the uncertainty-preserving foundation of the framework.
The individual T-SFVN decision matrices were then normalized according to the criterion type and aggregated by using the T-SFVN operator in Equations (17) and (18). Table 6 presents the aggregated T-SFVN evaluation matrix. This matrix is a central output of the early computational stage because it preserves the T-SFVN structure after group aggregation. The proposed framework does not perform early defuzzification. Instead, it first integrates the weighted opinions of thirty experts while maintaining the truth, indeterminacy, and falsity components of their assessments. This design enables the model to carry expert uncertainty into the collective decision matrix, strengthening the methodological advantage of the framework over crisp aggregation or direct scoring approaches.
The aggregated T-SFVN evaluation matrix was subsequently transformed into a crisp score-based evaluation matrix by applying the score function in Equation (11). The resulting matrix is reported in Table 7. The values in Table 7 should not be interpreted as raw expert scores. They are score-based representations generated after linguistic evaluations have been transformed into T-SFVN information and aggregated across experts. This controlled scalarization is methodologically important because it allows the framework to retain uncertainty during group evaluation and introduce scalar values only when the MEREC and EDAS stages require numerical inputs.

4.1. Standard MEREC Results and Computational Verification

Table 8 is the collective score matrix obtained only after the T-SFVNN assessments have been normalized and aggregated. The supplied computational output was reproduced to machine precision: the maximum absolute difference between the independently recalculated q = 4 group scores and Table 8 was 6.66 × 10⁻¹⁶. Standard MEREC was then applied directly to this positive, benefit-oriented score matrix. This correction removes the earlier min-max-reciprocal transformation and the artificial 1012 values; no ε constant is used.
For example, the minimum RC1 score is 0.654336 and the RPC score is 0.716579, giving n ( R P C , R C 1 ) = 0.654336 / 0.716579 = 0.913139 . The overall RPC performance is S ( R P C ) = 0.030650 . Removing RC1 changes this value by 0.008852. Repeating this calculation for every alternative and criterion produces Table 9; column sums yield the criterion effects E j , and normalization yields the criterion weights.
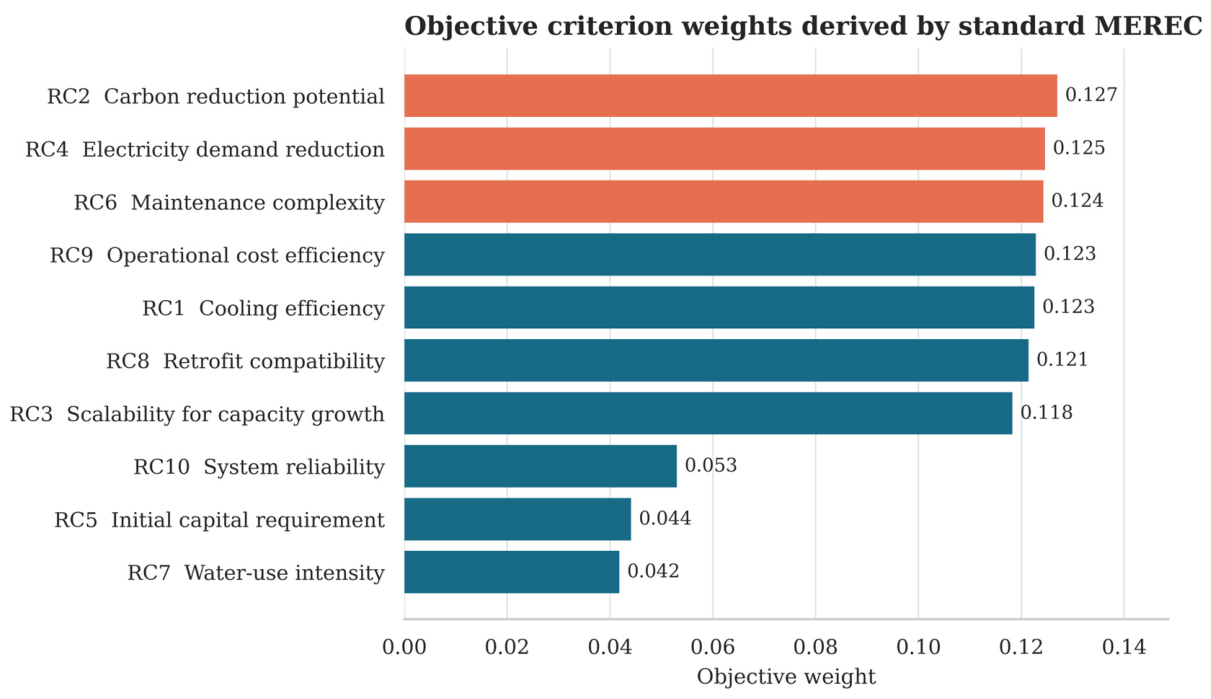
As shown in Figure 1, Carbon reduction potential (RC2) has the highest weight (0.127), followed by electricity demand reduction (RC4, 0.125), maintenance complexity (RC6, 0.124), operational cost efficiency (RC9, 0.123), and cooling efficiency (RC1, 0.123). The relatively low weights of water-use intensity (RC7, 0.042) and initial capital requirement (RC5, 0.044) do not mean that these criteria are unimportant in practice; they indicate that, within this particular matrix, removing them changes the cross-alternative performance structure less than removing the leading criteria.

4.2. EDAS Results

Standard EDAS uses the average score of each criterion. For RC1, the average is 0.686540. Because RPC has a score of 0.716579, P D A ( R P C , R C 1 ) = ( 0.716579 0.686540 ) / 0.686540 = 0.043753 and N D A ( R P C , R C 1 ) = 0 . Table 10 and Table 11 report all relative distances. Then, the EDAS appraisal scores are calculated as shown in Table 12.
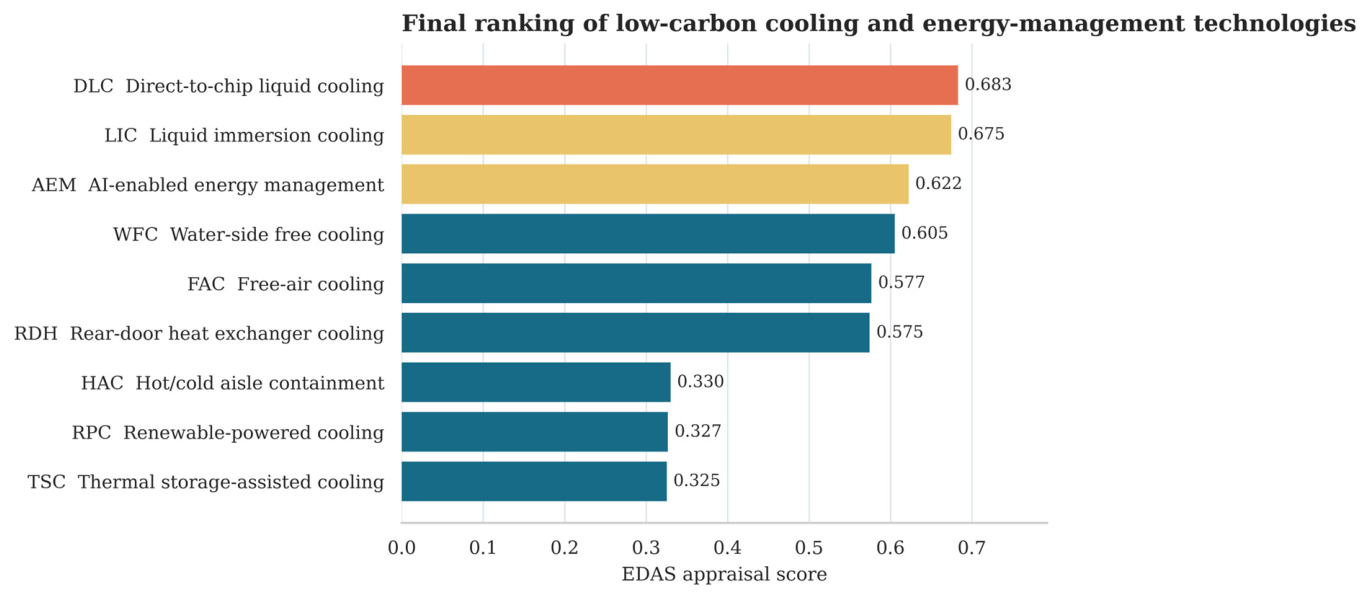
As shown in Figure 2, the final ranking is DLC > LIC > AEM > WFC > FAC > RDH > HAC > RPC > TSC. Direct-to-Chip Liquid Cooling records the highest appraisal score (0.683), narrowly ahead of Liquid Immersion Cooling (0.675). AI-Enabled Energy Management ranks third (0.622). The small score gap between DLC and LIC indicates that the result should be interpreted as a leading liquid-cooling tier rather than an absolute technological dominance under every scenario.

4.3. Sensitivity and Expert-Panel Robustness

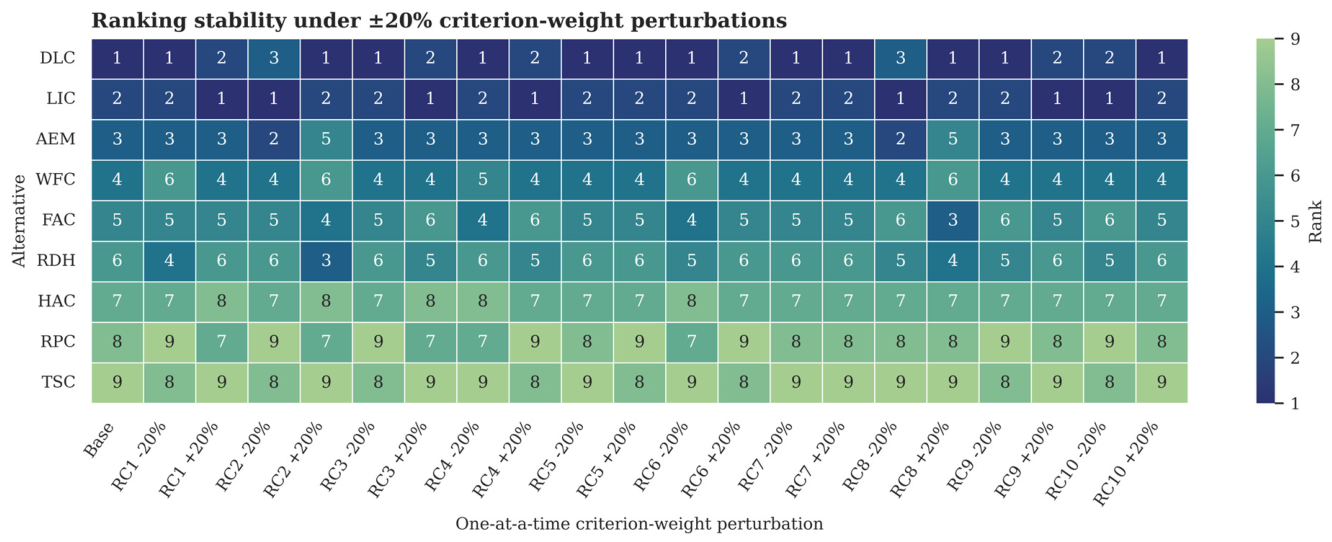
One-at-a-time perturbations changed each MEREC weight by −20%, −10%, +10%, and +20%, followed by renormalization. Across 40 scenarios, rank correlation with the baseline ranged from 0.833 to 1.000. DLC ranked first in 26 scenarios and LIC ranked first in 14 (see Figure 3). Both appeared in the top three in all 40 scenarios, while AEM appeared in the top three in 38 scenarios. Thus, the leading tier is stable, but the exact first position is sensitive because DLC and LIC have similar appraisal scores.
The q-sensitivity analysis independently repeated T-SFVNWA aggregation, score construction, standard MEREC weighting, and EDAS ranking for ( q = 2 , 3 , 4 , 5 ) . As shown in Table 13, the top choice changes from LIC at ( q = 2 , 3 ) to DLC at ( q = 4 , 5 ) , whereas AEM remains third and rank correlations remain at least 0.950. This again supports a stable top tier but not a parameter-invariant first place.
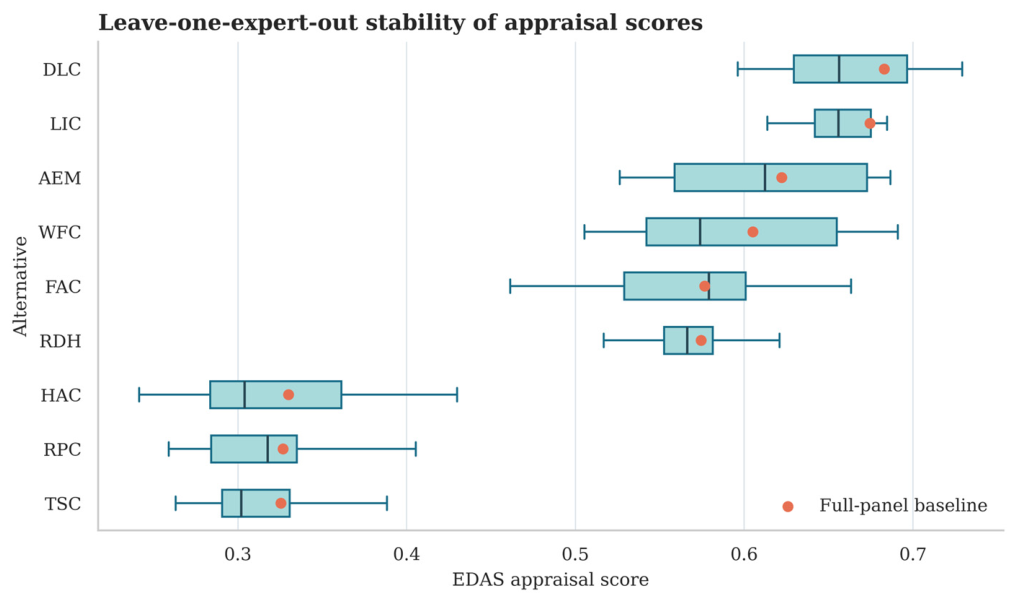
Leave-one-expert-out analysis repeated the entire aggregation-weighting-ranking chain thirty times. Spearman correlations with the full-panel ranking ranged from 0.717 to 0.967 (see Figure 4). First-place frequencies were AEM: 4, DLC: 14, LIC: 6, WFC: 6. The wider variation than in weight perturbation indicates that the expert composition affects close alternatives; however, the appraisal-score distributions retain clear separation between the leading group and the bottom group.

4.4. Comparative Validation and Rank-Reversal Diagnostics

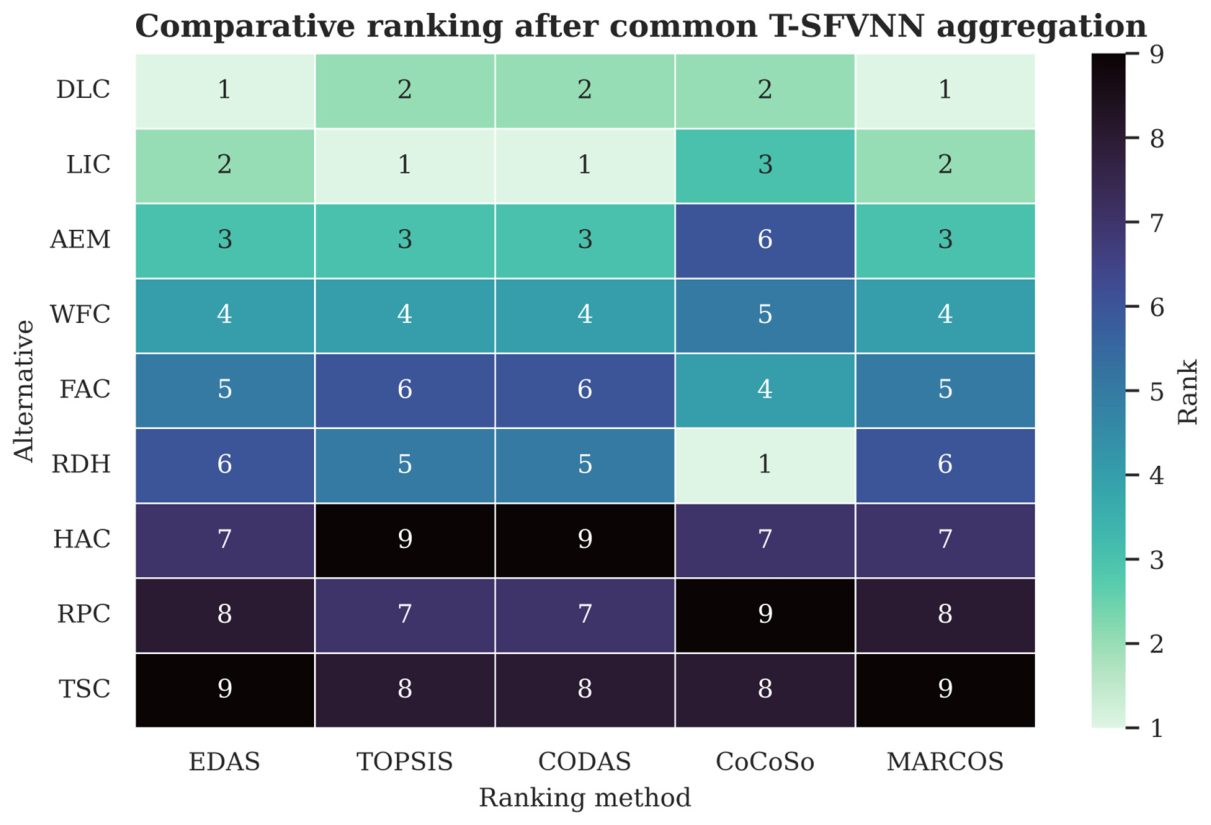
TOPSIS, CODAS, CoCoSo, and MARCOS were applied after the same T-SFVNN aggregation, score construction, and standard MEREC weighting. This design isolates sensitivity to the ranking engine; it does not claim that the comparison methods are native T-SFVNN extensions as show in Table 14.
As shown in Figure 5, EDAS and MARCOS produce identical ranks. TOPSIS and CODAS correlate 0.917 with EDAS and exchange DLC and LIC in the first two positions. CoCoSo is less concordant (rho = 0.667) and places RDH first. Therefore, the study supports cross-method agreement on several high-performing technologies but does not claim universal superiority of EDAS.
EDAS is susceptible to rank reversal because both the average profile and normalized appraisal values depend on the candidate set. The complete model also recalculates MEREC weights when candidates change. Nine leave-one-alternative-out tests and one dominated-addition test were therefore performed.
As shown in Table 15, deletion-test correlations range from 0.786 to 1.000. Adding a strictly dominated alternative places it last, but the original order is not perfectly invariant (rho = 0.950). The method therefore mitigates interpretation risk through explicit diagnostics; it does not eliminate rank reversal. For repeated procurement or technology-screening cycles, weights and average reference values should be frozen from an approved baseline universe. If the model is fully recalculated after candidates change, the result should be treated as a new decision problem.

4.5. Information-Compression Diagnostics

The score and quadratic-score matrices have a cellwise Spearman correlation of 0.792; the final alternative rankings based on these two scalarizations correlate 0.850, and DLC remains first. However, pairwise nine-dimensional T-SFVNN distances correlate only 0.421 with pairwise score distances, while score and accuracy correlate −0.098. These results confirm that scalarization preserves substantial ordering information but discards part of the internal truth-indeterminacy-falsity geometry. The aggregated T-SFVNN, quadratic score, and accuracy matrices are therefore retained in the computational output for audit rather than discarded.

5. Discussion

5.1. Theoretical and Methodological Implications

The main contribution is a disciplined integration boundary rather than the mere juxtaposition of three named methods. T-SFVNSs retain separate truth, indeterminacy, and falsity assessments, each expressed as a T-spherical triple, through expert-level normalization and aggregation. This is richer than models that use a single membership-nonmembership pair or one spherical triple. MEREC and EDAS are then applied in their standard forms after an explicitly disclosed score transformation. This correction is important: it prevents artificial reciprocal values, removes dependence on an arbitrary ε, and aligns every reported table with the actual equations.
The framework differs from subjective-weighting models such as IVSF-SWARA [51] and AHP-driven T-spherical Aczel-Alsina prioritization [53] because criterion importance is inferred from the evaluation matrix. It differs from the circular spherical fuzzy Frank-WASPAS model [52] because it separates uncertainty aggregation, objective weighting, and average-based ranking instead of embedding all compensation within a parameterized sum-product rule. These differences are advantages when expert judgments are uncertain and direct criterion-weight elicitation is undesirable. The trade-offs are the loss of information at scalarization, dependence on a theory-constrained linguistic scale, and sensitivity to candidate-set and panel changes.
The robustness results refine the claim of stability. DLC, LIC, and AEM form the leading baseline tier. Weight perturbation keeps DLC and LIC in the top three in every scenario, but q variation and leave-one-expert-out tests sometimes exchange the leading positions or elevate WFC/AEM. Comparative methods also disagree on the exact winner. Accordingly, the scientifically defensible conclusion is tier stability and broad rank concordance, not universal dominance of a single technology or ranking engine.

5.2. Managerial Implications

Data-center operators can use the results as a staged screening tool. DLC and LIC deserve priority in high-density facilities because they combine strong cooling and electricity-demand performance. DLC has the highest baseline EDAS score, but its narrow advantage over LIC means that site-specific fluid handling, hardware compatibility, safety, maintenance capability, and vendor ecosystem should determine the final choice. AEM ranks third and can complement rather than replace physical cooling upgrades by improving monitoring, control, and load coordination.
The MEREC weights direct managerial attention to carbon reduction, electricity demand, maintenance complexity, operating-cost efficiency, and cooling efficiency. Procurement teams should therefore require comparable evidence on energy use, carbon effects, maintenance labor and skills, operating costs, and thermal performance. Lower objective weights for initial capital and water use are properties of this dataset, not permission to ignore budget or local water constraints. Managers should add hard feasibility thresholds where regulatory, safety, budget, or resource constraints cannot be compensated by performance on other criteria.
The sensitivity analyses provide a governance rule for decisions. DLC and LIC should be treated as a robust shortlist rather than a deterministic first-versus-second conclusion. A pilot study, total-cost assessment, and site-specific engineering audit should resolve the final selection. For repeated evaluation cycles, the organization should document a baseline candidate universe, freeze weights and average profiles for comparable updates, and rerun rank-reversal diagnostics whenever technologies enter or leave the shortlist.

5.3. Policy and Sustainability Implications

Policy incentives for low-carbon data centers should avoid technology-neutral subsidies based solely on capital expenditure. Support can be tied to measured electricity-demand reduction, verified carbon performance, reliability, and maintainability. Standards for reporting thermal efficiency, lifecycle emissions, water use, retrofit requirements, and operating costs would improve comparability and reduce the uncertainty that currently enters expert judgments. Public or utility programs can also support pilots for liquid cooling and AI-enabled control, especially where high-density computing growth makes conventional air cooling increasingly constrained.

5.4. Limitations

The case uses one structured expert panel and one technology-criterion design. The 15-label scale is theoretically constrained but has not been psychometrically calibrated across populations. The score function is many-to-one and cannot preserve the full nine-dimensional T-SFVNN geometry. Objective weights and EDAS averages depend on the observed alternative set, producing measurable rank-reversal risk. Comparative ranking methods were applied after common T-SFVNN preprocessing rather than developed as native T-SFVNN extensions. Finally, close appraisal scores indicate that rankings should support, not replace, engineering feasibility studies and site-specific cost-risk analysis.

6. Conclusions

This study develops a T-SFVNS-based MEREC-EDAS framework for evaluating low-carbon cooling and energy-management technologies for data centers. Expert linguistic assessments are converted into T-SFVNNs, normalized by criterion type, aggregated with expert credibility weights, and scalarized only after the collective matrix is obtained. Standard MEREC determines objective weights without min-max-reciprocal transformation, and standard EDAS evaluates alternatives through relative score distances from the average solution.
The corrected analysis assigns the highest weights to carbon reduction potential, electricity demand reduction, maintenance complexity, operational cost efficiency, and cooling efficiency. The baseline ranking is DLC > LIC > AEM > WFC > FAC > RDH > HAC > RPC > TSC, with appraisal scores of 0.683, 0.675, and 0.622 for the leading three alternatives. Weight perturbation and cross-method analysis support a stable leading tier, while q sensitivity, expert omission, and candidate-set tests show that the exact winner and some middle ranks can change. The framework therefore provides a transparent shortlist and audit trail rather than an invariant universal ordering.
Future research should calibrate the linguistic scale empirically, develop ranking procedures that retain more of the T-SFVNN geometry, test fixed-reference and rank-reversal-resistant variants, and validate the model with measured energy, carbon, water, reliability, maintenance, and lifecycle-cost data from operating data centers. Cross-site studies can determine whether the weight and ranking patterns generalize beyond the present expert-informed application.

Supplementary Materials

The following supporting information can be downloaded at: https://www.mdpi.com/article/10.3390/systems14091039/s1, Tables S1–S30: Linguistic evaluation matrix provided by Expert 1–30; Tables S31–S60: Individual T-SFNs Decision Matrix of Expert 1–30.

Author Contributions

Conceptualization, H.-K.N. and N.-L.N.; methodology, N.-L.N.; validation, N.-L.N.; formal analysis, N.-L.N.; data curation, H.-K.N.; writing—original draft preparation, H.-K.N.; writing—review and editing, H.-K.N.; supervision, N.-L.N. All authors have read and agreed to the published version of the manuscript.

Funding

This research is funded by University of Economics Ho Chi Minh City—UEH, Vietnam.

Data Availability Statement

The anonymized expert assessments, validation records, aggregated T-SFVNN matrices, score diagnostics, standard MEREC calculations, EDAS calculations, sensitivity results, and comparative outputs are provided in this article and the Supplementary Materials workbook accompanying this article.

Conflicts of Interest

The authors declare no conflicts of interest.

References

  1. Zadeh, L.A. Fuzzy sets. Inf. Control 1965, 8, 338–353. [Google Scholar] [CrossRef] [Scilit]
  2. Atanassov, K.T. Intuitionistic fuzzy sets. In Intuitionistic Fuzzy Sets: Theory and Applications; Springer: Berlin/Heidelberg, Germany, 1999; pp. 1–137. [Google Scholar]
  3. Yager, R.R. Pythagorean Fuzzy Subsets. In Proceedings of the 2013 joint IFSA World Congress and NAFIPS Annual Meeting (IFSA/NAFIPS), Edmonton, AB, Canada, 24–28 June 2013; pp. 57–61. [Google Scholar]
  4. Yager, R.R. Generalized orthopair fuzzy sets. IEEE Trans. Fuzzy Syst. 2016, 25, 1222–1230. [Google Scholar] [CrossRef] [Scilit]
  5. Cường, B.C. Picture fuzzy sets. J. Comput. Sci. Cybern. 2014, 30, 409. [Google Scholar] [CrossRef] [Scilit]
  6. Kutlu Gündoğdu, F.; Kahraman, C. Spherical fuzzy sets and spherical fuzzy TOPSIS method. J. Intell. Fuzzy Syst. 2019, 36, 337–352. [Google Scholar] [CrossRef] [Scilit]
  7. Ullah, K.; Mahmood, T.; Jan, N. Similarity measures for T-spherical fuzzy sets with applications in pattern recognition. Symmetry 2018, 10, 193. [Google Scholar] [CrossRef] [Scilit]
  8. Smarandache, F. Neutrosophy: A Unifying Field in Logics: Neutrosophic Logic. Neutrosophy, Neutrosophic Set, Neutrosophic Probability; American Research Press: Santa Fe, NM, USA, 1999. [Google Scholar]
  9. Al-Quran, A.; Al-Sharqi, F.; El-Wahed Khalifa, H.A.; Alqahtani, H.; Awad, A.; Ma, B. T-Spherical Fuzzy-Valued Neutrosophic Set Theory. Int. J. Neutrosophic Sci. 2024, 23, 104–115. [Google Scholar] [CrossRef] [Scilit]
  10. Keshavarz-Ghorabaee, M.; Amiri, M.; Zavadskas, E.K.; Turskis, Z.; Antucheviciene, J. Determination of objective weights using a new method based on the removal effects of criteria (MEREC). Symmetry 2021, 13, 525. [Google Scholar] [CrossRef] [Scilit]
  11. Torkayesh, A.E.; Deveci, M.; Karagoz, S.; Antucheviciene, J. A state-of-the-art survey of evaluation based on distance from average solution (EDAS): Developments and applications. Expert Syst. Appl. 2023, 221, 119724. [Google Scholar] [CrossRef] [Scilit]
  12. Nhieu, N.-L.; Dang, T.D. Harnessing Vietnam’s coastal potential: Prioritizing marine energy technologies with an objectively weighting decision-making approach. Renew. Energy 2024, 230, 120881. [Google Scholar] [CrossRef] [Scilit]
  13. Nhieu, N.-L. The T-spherical fuzzy einstein interaction operation matrix energy decision-making approach: The context of vietnam offshore wind energy storage technologies assessment. Mathematics 2024, 12, 2498. [Google Scholar] [CrossRef] [Scilit]
  14. Mishra, A.R.; Pamucar, D.; Rani, P.; Shrivastava, R.; Hezam, I.M. Assessing the sustainable energy storage technologies using single-valued neutrosophic decision-making framework with divergence measure. Expert Syst. Appl. 2024, 238, 121791. [Google Scholar] [CrossRef] [Scilit]
  15. Shao, X.; Zhang, Z.; Song, P.; Feng, Y.; Wang, X. A review of energy efficiency evaluation metrics for data centers. Energy Build. 2022, 271, 112308. [Google Scholar] [CrossRef] [Scilit]
  16. Zhu, H.; Zhang, D.; Goh, H.H.; Wang, S.; Ahmad, T.; Mao, D.; Liu, T.; Zhao, H.; Wu, T. Future data center energy-conservation and emission-reduction technologies in the context of smart and low-carbon city construction. Sustain. Cities Soc. 2023, 89, 104322. [Google Scholar] [CrossRef] [Scilit]
  17. Alkrush, A.A.; Salem, M.S.; Abdelrehim, O.; Hegazi, A.A. Data centers cooling: A critical review of techniques, challenges, and energy saving solutions. Int. J. Refrig. 2024, 160, 246–262. [Google Scholar] [CrossRef] [Scilit]
  18. Kahil, H.; Sharma, S.; Välisuo, P.; Elmusrati, M. Reinforcement learning for data center energy efficiency optimization: A systematic literature review and research roadmap. Appl. Energy 2025, 389, 125734. [Google Scholar] [CrossRef] [Scilit]
  19. Hao, Y.; Zhou, H.; Tian, T.; Zhang, W.; Zhou, X.; Shen, Q.; Wu, T.; Li, J. Data centers waste heat recovery technologies: Review and evaluation. Appl. Energy 2025, 384, 125489. [Google Scholar] [CrossRef] [Scilit]
  20. Lin, W.; Lin, J.; Peng, Z.; Huang, H.; Lin, W.; Li, K. A systematic review of green-aware management techniques for sustainable data center. Sustain. Comput. Inform. Syst. 2024, 42, 100989. [Google Scholar] [CrossRef] [Scilit]
  21. Güğül, G.N.; Gökçül, F.; Eicker, U. Sustainability analysis of zero energy consumption data centers with free cooling, waste heat reuse and renewable energy systems: A feasibility study. Energy 2023, 262, 125495. [Google Scholar] [CrossRef] [Scilit]
  22. Kong, R.; Zhang, H.; Tang, M.; Zou, H.; Tian, C.; Ding, T. Enhancing data center cooling efficiency and ability: A comprehensive review of direct liquid cooling technologies. Energy 2024, 308, 132846. [Google Scholar] [CrossRef] [Scilit]
  23. Heydari, A.; Gharaibeh, A.R.; Tradat, M.; Manaserh, Y.; Radmard, V.; Eslami, B.; Rodriguez, J.; Sammakia, B. Experimental evaluation of direct-to-chip cold plate liquid cooling for high-heat-density data centers. Appl. Therm. Eng. 2024, 239, 122122. [Google Scholar] [CrossRef] [Scilit]
  24. Liu, C.; Hao, N.; Zhang, T.; Wang, D.; Li, Z.; Bian, W. Optimization of data-center immersion cooling using liquid air energy storage. J. Energy Storage 2024, 90, 111806. [Google Scholar] [CrossRef] [Scilit]
  25. Ham, S.H.; Jang, D.S.; Kwon, S.; Chung, J.Y.; Kim, Y. Comparative energy performance evaluation of high-density data centers using air-and immersion-cooling systems with various economizers. Energy 2026, 347, 140367. [Google Scholar] [CrossRef] [Scilit]
  26. Hriez, S.; Hmidan, M. Energy-Saving Potentials in High-Temperature Data Centers: A Spatio-Temporal Analysis. Results Eng. 2025, 28, 108138. [Google Scholar] [CrossRef] [Scilit]
  27. Mohammed, N.M.; El-Maghlany, W.M.; Elhelw, M.; Abdelaziz, A.H. Performance improvement of high-density data center via two-phase liquid immersion cooling. J. Therm. Anal. Calorim. 2025, 150, 4279–4294. [Google Scholar] [CrossRef] [Scilit]
  28. Yuan, X.; Liang, Y.; Hu, X.; Xu, Y.; Chen, Y.; Kosonen, R. Waste heat recoveries in data centers: A review. Renew. Sustain. Energy Rev. 2023, 188, 113777. [Google Scholar] [CrossRef] [Scilit]
  29. Monsalves, J.J.; Bergaentzlé, C.; Keles, D. Impacts of flexible-cooling and waste-heat recovery from data centres on energy systems: A Danish case study. Energy 2023, 281, 128112. [Google Scholar] [CrossRef] [Scilit]
  30. Wang, J.; Guo, Y.; Yue, C.; Deng, W.; Zeng, L. Comprehensive assessment of waste heat recovery mismatch and renewable energy integration in data centers: A multifaceted energy, economic, and environmental perspectives. J. Clean. Prod. 2024, 472, 143466. [Google Scholar] [CrossRef] [Scilit]
  31. Qu, S.; Duan, K.; Guo, Y.; Feng, Y.; Wang, C.; Xing, Z. Real-time optimization of the liquid-cooled data center based on cold plates under different ambient temperatures and thermal loads. Appl. Energy 2024, 363, 123101. [Google Scholar] [CrossRef] [Scilit]
  32. Liu, W.; Yan, Y.; Sun, Y.; Mao, H.; Cheng, M.; Wang, P.; Ding, Z. Online job scheduling scheme for low-carbon data center operation: An information and energy nexus perspective. Appl. Energy 2023, 338, 120918. [Google Scholar] [CrossRef] [Scilit]
  33. Riepin, I.; Brown, T.; Zavala, V.M. Spatio-temporal load shifting for truly clean computing. Adv. Appl. Energy 2025, 17, 100202. [Google Scholar] [CrossRef] [Scilit]
  34. Figini, E.; Paolone, M. Achieving dispatchability in data centers: Carbon and cost-aware sizing of energy storage and local photovoltaic generation. Sustain. Energy Grids Netw. 2025, 43, 101920. [Google Scholar] [CrossRef] [Scilit]
  35. Takci, M.T.; Qadrdan, M.; Summers, J.; Gustafsson, J. Data centres as a source of flexibility for power systems. Energy Rep. 2025, 13, 3661–3671. [Google Scholar] [CrossRef] [Scilit]
  36. Ghoushchi, S.J.; Garg, H.; Bonab, S.R.; Rahimi, A. An integrated SWARA-CODAS decision-making algorithm with spherical fuzzy information for clean energy barriers evaluation. Expert Syst. Appl. 2023, 223, 119884. [Google Scholar] [CrossRef] [Scilit]
  37. Moslem, S. A novel parsimonious spherical fuzzy analytic hierarchy process for sustainable urban transport solutions. Eng. Appl. Artif. Intell. 2024, 128, 107447. [Google Scholar] [CrossRef] [Scilit]
  38. Wang, H.; Mahmood, T.; Ullah, K. Improved CoCoSo method based on Frank softmax aggregation operators for T-spherical fuzzy multiple attribute group decision-making. Int. J. Fuzzy Syst. 2023, 25, 1275. [Google Scholar] [CrossRef] [Scilit]
  39. Gurmani, S.H.; Zhang, S.; Awwad, F.A.; Ismail, E.A.A. Combinative distance-based assessment method using linguistic T-spherical fuzzy aggregation operators and its application to multi-attribute group decision-making. Eng. Appl. Artif. Intell. 2024, 133, 108165. [Google Scholar] [CrossRef] [Scilit]
  40. Chen, T.-Y. An integrated MEREC-taxonomy methodology using T-spherical fuzzy information: An application in smart farming decision analytics. Adv. Eng. Inform. 2024, 62, 102891. [Google Scholar] [CrossRef] [Scilit]
  41. Alballa, T.; Rahim, M.; Alburaikan, A.; Almutairi, A.; Khalifa, H.A.E.-W. MCGDM approach based on (p, q, r)-spherical fuzzy Frank aggregation operators: Applications in the categorization of renewable energy sources. Sci. Rep. 2024, 14, 23576. [Google Scholar] [CrossRef] [Scilit] [PubMed]
  42. Hezam, I.M.; Ali, A.M.; Sallam, K.; Hameed, I.A.; Abdel-Basset, M. Assessment of wave energy location, technology, and converter toward sustainability using integrated spherical fuzzy MCDM approach. Case Stud. Therm. Eng. 2024, 59, 104527. [Google Scholar] [CrossRef] [Scilit]
  43. Wang, C.-N.; Nguyen, H.-K.; Nhieu, N.-L. Optimizing Energy Choices: MEREC-TOPSIS Analysis of Renewable Technologies. In Computational Economics; Springer Nature: Berlin/Heidelberg, Germany, 2025; pp. 1–21. [Google Scholar]
  44. Kacprzak, D. A new extension of the EDAS method in a fuzzy environment for group decision-making. Decision 2024, 51, 263–277. [Google Scholar] [CrossRef] [Scilit]
  45. Haq, R.S.U.; Saeed, M.; Mateen, N.; Siddiqui, F.; Naqvi, M.; Yi, J.B.; Ahmed, S. Sustainable material selection with crisp and ambiguous data using single-valued neutrosophic-MEREC-MARCOS framework. Appl. Soft Comput. 2022, 128, 109546. [Google Scholar] [CrossRef] [Scilit]
  46. Nhieu, N.-L.; Nguyen, H.-K.; Thinh, N.T. Industrial Palletizing Robots: A Distance-Based Objective Weighting Benchmarking. Mathematics 2025, 13, 3313. [Google Scholar] [CrossRef] [Scilit]
  47. Ma, X. New Approach Single Valued Neutrosophic Sets for Teaching Quality Challenges Evaluation in College Public English Broad Impacts. Neutrosophic Sets Syst. 2025, 81, 62. [Google Scholar]
  48. Xu, D.; Zhao, Y. A new distance measure for single-valued neutrosophic set and an improved method based on TOPSIS and TODIM to multi-attribute decision-making. Int. J. Knowl.-Based Intell. Eng. Syst. 2025, 29, 322–335. [Google Scholar] [CrossRef] [Scilit]
  49. Nguyen, H.-K.; Nhieu, N.-L. Comparative Sustainability Efficiency of G7 and BRICS Economies: A DNMEREC-DNMARCOS Approach. Mathematics 2025, 13, 3640. [Google Scholar] [CrossRef] [Scilit]
  50. Büyüközkan, G.; Uztürk, D.; Ilıcak, Ö. Fermatean fuzzy sets and its extensions: A systematic literature review. Artif. Intell. Rev. 2024, 57, 138. [Google Scholar] [CrossRef] [Scilit]
  51. Bakary, S.; Bouraima, M.B.; Badi, I. A multi-criteria-decision making methodology to prioritizing telemedicine expansion opportunities. J. Contemp. Decis. Sci. 2026, 2, 55–63. [Google Scholar] [CrossRef] [Scilit]
  52. Hussain, A.; Ullah, K.; Ali, Z.; Saidani, O. Smart Technologies for Water Sewage Systems and Decision-Making with Circular Spherical Fuzzy Framework. J. Contemp. Decis. Sci. 2026, 2, 194–215. [Google Scholar] [CrossRef] [Scilit]
  53. Sarfraz, M.; Tešić, D.; Demir, G. AHP-Based Aczel–Alsina Prioritization under T-Spherical Fuzzy Information for Artificial Intelligence in Smart Systems. J. Contemp. Decis. Sci. 2026, 2, 305–322. [Google Scholar] [CrossRef] [Scilit]
  54. Wang, P.; Zhu, B.; Yan, K.; Zhang, Z.; Ali, Z.; Pamucar, D. Power aggregation operators based on Aczel-Alsina T-norm and T-conorm for intuitionistic hesitant fuzzy information and their application to logistics service provider selection. Artif. Intell. Rev. 2025, 58, 204. [Google Scholar] [CrossRef] [Scilit]
  55. Wang, P.; Fu, Y.; Liu, P.; Zhu, B.; Wang, F.; Pamucar, D. Evaluation of ecological governance in the Yellow River basin based on Uninorm combination weight and MULTIMOORA-Borda method. Expert Syst. Appl. 2024, 235, 121227. [Google Scholar] [CrossRef] [Scilit]
  56. Keshavarz Ghorabaee, M.; Zavadskas, E.K.; Olfat, L.; Turskis, Z. Multi-criteria inventory classification using a new method of evaluation based on distance from average solution (EDAS). Informatica 2015, 26, 435–451. [Google Scholar] [CrossRef] [Scilit]
  57. Sarkar, A.; Goswami, S.S.; Gupta, K.K. Sensitivity Analysis and Validation in MCDM Methods: A Comprehensive Review with Advancements, Applications, and Future Directions. Spectr. Decis. Mak. Appl. 2026, 4, 1–14. [Google Scholar] [CrossRef] [Scilit]
  58. Sarkar, A.; Goswami, S.S.; Behera, D.K.; Bozanic, D. Criteria Weighting Methods in Multi-Criteria Decision Making: A Comprehensive Review of Subjective, Objective, and Hybrid Approaches. J. Contemp. Decis. Sci. 2026, 3, 1–34. [Google Scholar] [CrossRef] [Scilit]
Figure 1. Objective criterion weights derived by standard MEREC.
Systems 14 01039 g001
Figure 2. Final EDAS appraisal scores and ranking.
Systems 14 01039 g002
Figure 3. Ranking stability under extreme one-at-a-time criterion-weight perturbations.
Systems 14 01039 g003
Figure 4. Leave-one-expert-out distributions of EDAS appraisal scores.
Systems 14 01039 g004
Figure 5. Comparative ranking after common T-SFVNN preprocessing.
Systems 14 01039 g005
Table 1. Expert qualifications and assigned weights.
ExpertHighest DegreeYear of Experience Working/Research FieldExpert Weight
1Bachelor15Data Center Technician0.023
2Bachelor10HVAC Engineer0.022
3PhD18Sustainability Researcher0.040
4Bachelor8Facility Engineer0.021
5Bachelor15Mechanical Engineer0.023
6Master15Energy Management Specialist0.031
7Bachelor13IT Infrastructure Engineer0.022
8PhD13AI Research Scientist0.040
9Bachelor14Energy Systems Analyst0.022
10Master3Renewable Energy Engineer0.029
11PhD1Cooling Systems Researcher0.036
12Master20Green Building Consultant0.032
13Professor19Sustainable Engineering0.049
14Master20Smart Energy Engineer0.032
15PhD20Thermal Systems Scientist0.040
16Master6Data Center Energy Consultant0.030
17Master13Environmental Specialist0.031
18PhD1HVAC Researcher0.036
19Master6Building Automation Engineer0.030
20Professor16Energy Systems0.049
21Master4Sustainability Consultant0.029
22PhD8Data Scientist0.039
23Master10Cooling Technology Engineer0.030
24PhD9Decision Science Researcher0.039
25Master15Energy Auditor0.031
26Master12Cloud Infrastructure Engineer0.031
27Professor3Green Technology0.046
28Master18Operations Engineer0.032
29PhD16Smart Energy Researcher0.040
30Professor11Sustainable Computing0.048
Table 2. The considered low-carbon cooling and energy management technologies for the data center context.
SymbolLCCEMTsDescriptionKey Attributes
RPCRenewable-Powered CoolingA cooling configuration that is partially or fully supported by renewable energy sources, such as solar or wind power, to reduce carbon emissions from data center operations.Carbon reduction potential; renewable energy integration; reduced grid dependence; supports sustainable operation.
FACFree-Air CoolingA low-carbon cooling approach that uses filtered ambient air to reduce or replace mechanical cooling under suitable outdoor conditions.Low energy consumption; climate-dependent performance; reduced chiller use; relatively simple cooling principle.
WFCWater-Side Free CoolingA cooling solution that uses low-temperature water sources or cooling towers to reduce chiller energy consumption and improve cooling efficiency.Reduced chiller energy use; high efficiency under suitable conditions; water-dependent operation; improved cooling performance.
HACHot/Cold Aisle ContainmentAn airflow management strategy that separates hot and cold air streams to minimize mixing, improve cooling effectiveness, and reduce unnecessary energy use.Improved airflow control; reduced thermal mixing; retrofit-friendly; lower cooling energy waste.
DLCDirect-to-Chip Liquid CoolingAn advanced liquid cooling solution that delivers coolant directly to high-heat server components, enabling efficient heat removal in high-density computing environments.Efficient heat removal; suitable for high-performance servers; supports dense computing environments; improves thermal stability.
LICLiquid Immersion CoolingA high-efficiency cooling technology in which IT equipment is submerged in dielectric fluid to achieve superior thermal management and reduce cooling energy consumption.High cooling efficiency; suitable for high-density IT loads; reduced mechanical cooling demand; advanced thermal control.
TSCThermal Storage-Assisted CoolingA cooling system integrated with thermal energy storage to shift cooling loads, reduce peak electricity demand, and improve overall energy efficiency.Peak-load shifting; improved energy flexibility; reduced electricity demand during peak hours; enhanced operational efficiency.
RDHRear Door Heat Exchanger CoolingA rack-level cooling technology that removes server heat through a heat exchanger mounted at the rear of the rack, improving thermal control and reducing room-level cooling demand.Rack-level heat removal; improved local thermal control; reduced room-level cooling load; suitable for targeted cooling.
AEMAI-Enabled Building Energy ManagementAn intelligent energy management system that uses AI-based monitoring, prediction, and control to optimize cooling operation and energy use in data centers.Predictive control; real-time monitoring; energy optimization; adaptive cooling management.
Table 3. Assessment criteria for LCCEM technology evaluation.
SymbolCriteriaDescription
RC1Cooling efficiencyMeasures the ability of the technology to remove heat effectively while minimizing cooling-related energy consumption.
RC2Carbon reduction potentialMeasures the capability of the technology to reduce carbon emissions associated with data center cooling and energy use.
RC3Scalability for capacity growthEvaluates the ability of technology to support future data center expansion, increased IT loads, and capacity growth.
RC4Electricity demand reductionAssesses the extent to which the technology can reduce total electricity consumption or peak electricity demand.
RC5Initial capital requirementRepresents the upfront investment required for purchasing, installing, and integrating the technology.
RC6Maintenance complexityAssesses the level of technical difficulty, frequency, and resource requirements associated with maintaining the technology.
RC7Water-use intensityMeasures the amount of water required for operation, especially in cooling-related processes.
RC8Retrofit compatibilityMeasures how easily the technology can be integrated into existing data center infrastructure without major redesign or disruption.
RC9Operational cost efficiencyEvaluates the ability of technology to reduce long-term operating costs, including energy, maintenance, and system management costs.
RC10System reliabilityEvaluates the stability, durability, and operational dependability of the technology under continuous data center operation.
Table 4. Linguistic evaluation matrix provided by Expert 1.
LCCEMTsRC1RC2RC3RC4RC5RC6RC7RC8RC9RC10
RPCM_CM_MM_UH_CL_MH_UVL_UVH_MVH_UVH_U
FACM_UH_CH_MH_UVL_UVH_MVL_CVL_CVL_MVH_C
WFCH_MH_UVH_CVH_MVL_CVL_CVH_MVL_UL_CH_M
HACVH_CVH_MVH_UVL_CVH_MVL_UH_UL_ML_UM_U
DLCVH_UVL_CVL_MVL_UH_UL_MH_CM_CM_MM_C
LICVL_MVL_UL_CL_MH_CM_CM_MM_UH_CL_M
TSCL_CL_ML_UM_CM_MM_UL_UH_MH_UVL_U
RDHL_UM_CM_MM_UL_UH_ML_CVH_CVH_MVL_C
AEMM_MM_UH_CH_ML_CVH_CVL_MVH_UVL_CVH_M
Table 5. Individual T-SFNs Decision Matrix of Expert 1.
LCCEMTsRC1RC2RC3RC4RC5RC6RC7RC8RC9RC10
RPC(0.500, 0.140, 0.300)
(0.220, 0.120, 0.180)
(0.460, 0.140, 0.220)
(0.500, 0.160, 0.320)
(0.400, 0.180, 0.240)
(0.420, 0.160, 0.240)
(0.500, 0.180, 0.340)
(0.600, 0.220, 0.280)
(0.380, 0.180, 0.260)
(0.700, 0.120, 0.180)
(0.180, 0.120, 0.160)
(0.280, 0.120, 0.200)
(0.340, 0.140, 0.500)
(0.380, 0.180, 0.240)
(0.620, 0.140, 0.180)
(0.620, 0.160, 0.260)
(0.540, 0.220, 0.300)
(0.400, 0.160, 0.240)
(0.220, 0.140, 0.600)
(0.540, 0.220, 0.300)
(0.660, 0.140, 0.180)
(0.760, 0.120, 0.160)
(0.340, 0.160, 0.220)
(0.220, 0.120, 0.160)
(0.700, 0.140, 0.200)
(0.520, 0.200, 0.280)
(0.280, 0.140, 0.200)
(0.700, 0.140, 0.200)
(0.520, 0.200, 0.280)
(0.280, 0.140, 0.200)
FAC(0.500, 0.180, 0.340)
(0.600, 0.220, 0.280)
(0.380, 0.180, 0.260)
(0.700, 0.120, 0.180)
(0.180, 0.120, 0.160)
(0.280, 0.120, 0.200)
(0.660, 0.140, 0.220)
(0.360, 0.180, 0.240)
(0.340, 0.140, 0.220)
(0.620, 0.160, 0.260)
(0.540, 0.220, 0.300)
(0.400, 0.160, 0.240)
(0.220, 0.140, 0.600)
(0.540, 0.220, 0.300)
(0.660, 0.140, 0.180)
(0.760, 0.120, 0.160)
(0.340, 0.160, 0.220)
(0.220, 0.120, 0.160)
(0.180, 0.100, 0.720)
(0.180, 0.100, 0.160)
(0.820, 0.100, 0.100)
(0.180, 0.100, 0.720)
(0.180, 0.100, 0.160)
(0.820, 0.100, 0.100)
(0.200, 0.120, 0.660)
(0.360, 0.180, 0.240)
(0.740, 0.120, 0.140)
(0.820, 0.100, 0.120)
(0.160, 0.100, 0.140)
(0.160, 0.100, 0.120)
WFC(0.660, 0.140, 0.220)
(0.360, 0.180, 0.240)
(0.340, 0.140, 0.220)
(0.620, 0.160, 0.260)
(0.540, 0.220, 0.300)
(0.400, 0.160, 0.240)
(0.820, 0.100, 0.120)
(0.160, 0.100, 0.140)
(0.160, 0.100, 0.120)
(0.760, 0.120, 0.160)
(0.340, 0.160, 0.220)
(0.220, 0.120, 0.160)
(0.180, 0.100, 0.720)
(0.180, 0.100, 0.160)
(0.820, 0.100, 0.100)
(0.180, 0.100, 0.720)
(0.180, 0.100, 0.160)
(0.820, 0.100, 0.100)
(0.760, 0.120, 0.160)
(0.340, 0.160, 0.220)
(0.220, 0.120, 0.160)
(0.220, 0.140, 0.600)
(0.540, 0.220, 0.300)
(0.660, 0.140, 0.180)
(0.300, 0.120, 0.560)
(0.200, 0.120, 0.180)
(0.700, 0.120, 0.140)
(0.660, 0.140, 0.220)
(0.360, 0.180, 0.240)
(0.340, 0.140, 0.220)
HAC(0.820, 0.100, 0.120)
(0.160, 0.100, 0.140)
(0.160, 0.100, 0.120)
(0.760, 0.120, 0.160)
(0.340, 0.160, 0.220)
(0.220, 0.120, 0.160)
(0.700, 0.140, 0.200)
(0.520, 0.200, 0.280)
(0.280, 0.140, 0.200)
(0.180, 0.100, 0.720)
(0.180, 0.100, 0.160)
(0.820, 0.100, 0.100)
(0.760, 0.120, 0.160)
(0.340, 0.160, 0.220)
(0.220, 0.120, 0.160)
(0.220, 0.140, 0.600)
(0.540, 0.220, 0.300)
(0.660, 0.140, 0.180)
(0.620, 0.160, 0.260)
(0.540, 0.220, 0.300)
(0.400, 0.160, 0.240)
(0.340, 0.140, 0.500)
(0.380, 0.180, 0.240)
(0.620, 0.140, 0.180)
(0.380, 0.160, 0.440)
(0.560, 0.220, 0.300)
(0.540, 0.160, 0.220)
(0.500, 0.180, 0.340)
(0.600, 0.220, 0.280)
(0.380, 0.180, 0.260)
DLC(0.700, 0.140, 0.200)
(0.520, 0.200, 0.280)
(0.280, 0.140, 0.200)
(0.180, 0.100, 0.720)
(0.180, 0.100, 0.160)
(0.820, 0.100, 0.100)
(0.200, 0.120, 0.660)
(0.360, 0.180, 0.240)
(0.740, 0.120, 0.140)
(0.220, 0.140, 0.600)
(0.540, 0.220, 0.300)
(0.660, 0.140, 0.180)
(0.620, 0.160, 0.260)
(0.540, 0.220, 0.300)
(0.400, 0.160, 0.240)
(0.340, 0.140, 0.500)
(0.380, 0.180, 0.240)
(0.620, 0.140, 0.180)
(0.700, 0.120, 0.180)
(0.180, 0.120, 0.160)
(0.280, 0.120, 0.200)
(0.500, 0.140, 0.300)
(0.220, 0.120, 0.180)
(0.460, 0.140, 0.220)
(0.500, 0.160, 0.320)
(0.400, 0.180, 0.240)
(0.420, 0.160, 0.240)
(0.500, 0.140, 0.300)
(0.220, 0.120, 0.180)
(0.460, 0.140, 0.220)
LIC(0.200, 0.120, 0.660)
(0.360, 0.180, 0.240)
(0.740, 0.120, 0.140)
(0.220, 0.140, 0.600)
(0.540, 0.220, 0.300)
(0.660, 0.140, 0.180)
(0.300, 0.120, 0.560)
(0.200, 0.120, 0.180)
(0.700, 0.120, 0.140)
(0.340, 0.140, 0.500)
(0.380, 0.180, 0.240)
(0.620, 0.140, 0.180)
(0.700, 0.120, 0.180)
(0.180, 0.120, 0.160)
(0.280, 0.120, 0.200)
(0.500, 0.140, 0.300)
(0.220, 0.120, 0.180)
(0.460, 0.140, 0.220)
(0.500, 0.160, 0.320)
(0.400, 0.180, 0.240)
(0.420, 0.160, 0.240)
(0.500, 0.180, 0.340)
(0.600, 0.220, 0.280)
(0.380, 0.180, 0.260)
(0.700, 0.120, 0.180)
(0.180, 0.120, 0.160)
(0.280, 0.120, 0.200)
(0.340, 0.140, 0.500)
(0.380, 0.180, 0.240)
(0.620, 0.140, 0.180)
TSC(0.300, 0.120, 0.560)
(0.200, 0.120, 0.180)
(0.700, 0.120, 0.140)
(0.340, 0.140, 0.500)
(0.380, 0.180, 0.240)
(0.620, 0.140, 0.180)
(0.380, 0.160, 0.440)
(0.560, 0.220, 0.300)
(0.540, 0.160, 0.220)
(0.500, 0.140, 0.300)
(0.220, 0.120, 0.180)
(0.460, 0.140, 0.220)
(0.500, 0.160, 0.320)
(0.400, 0.180, 0.240)
(0.420, 0.160, 0.240)
(0.500, 0.180, 0.340)
(0.600, 0.220, 0.280)
(0.380, 0.180, 0.260)
(0.380, 0.160, 0.440)
(0.560, 0.220, 0.300)
(0.540, 0.160, 0.220)
(0.660, 0.140, 0.220)
(0.360, 0.180, 0.240)
(0.340, 0.140, 0.220)
(0.620, 0.160, 0.260)
(0.540, 0.220, 0.300)
(0.400, 0.160, 0.240)
(0.220, 0.140, 0.600)
(0.540, 0.220, 0.300)
(0.660, 0.140, 0.180)
RDH(0.380, 0.160, 0.440)
(0.560, 0.220, 0.300)
(0.540, 0.160, 0.220)
(0.500, 0.140, 0.300)
(0.220, 0.120, 0.180)
(0.460, 0.140, 0.220)
(0.500, 0.160, 0.320)
(0.400, 0.180, 0.240)
(0.420, 0.160, 0.240)
(0.500, 0.180, 0.340)
(0.600, 0.220, 0.280)
(0.380, 0.180, 0.260)
(0.380, 0.160, 0.440)
(0.560, 0.220, 0.300)
(0.540, 0.160, 0.220)
(0.660, 0.140, 0.220)
(0.360, 0.180, 0.240)
(0.340, 0.140, 0.220)
(0.300, 0.120, 0.560)
(0.200, 0.120, 0.180)
(0.700, 0.120, 0.140)
(0.820, 0.100, 0.120)
(0.160, 0.100, 0.140)
(0.160, 0.100, 0.120)
(0.760, 0.120, 0.160)
(0.340, 0.160, 0.220)
(0.220, 0.120, 0.160)
(0.180, 0.100, 0.720)
(0.180, 0.100, 0.160)
(0.820, 0.100, 0.100)
AEM(0.500, 0.160, 0.320)
(0.400, 0.180, 0.240)
(0.420, 0.160, 0.240)
(0.500, 0.180, 0.340)
(0.600, 0.220, 0.280)
(0.380, 0.180, 0.260)
(0.700, 0.120, 0.180)
(0.180, 0.120, 0.160)
(0.280, 0.120, 0.200)
(0.660, 0.140, 0.220)
(0.360, 0.180, 0.240)
(0.340, 0.140, 0.220)
(0.300, 0.120, 0.560)
(0.200, 0.120, 0.180)
(0.700, 0.120, 0.140)
(0.820, 0.100, 0.120)
(0.160, 0.100, 0.140)
(0.160, 0.100, 0.120)
(0.200, 0.120, 0.660)
(0.360, 0.180, 0.240)
(0.740, 0.120, 0.140)
(0.700, 0.140, 0.200)
(0.520, 0.200, 0.280)
(0.280, 0.140, 0.200)
(0.180, 0.100, 0.720)
(0.180, 0.100, 0.160)
(0.820, 0.100, 0.100)
(0.760, 0.120, 0.160)
(0.340, 0.160, 0.220)
(0.220, 0.120, 0.160)
Table 6. Aggregated T-SFVN evaluation matrix.
LCCEMTsRC1RC2RC3RC4RC5RC6RC7RC8RC9RC10
RPC(0.654, 0.114, 0.298),
(0.186, 0.113, 0.166),
(0.402, 0.118, 0.172)
(0.608, 0.135, 0.321),
(0.366, 0.176, 0.236),
(0.421, 0.138, 0.197)
(0.567, 0.155, 0.336),
(0.550, 0.216, 0.292),
(0.428, 0.157, 0.224)
(0.637, 0.115, 0.314),
(0.188, 0.113, 0.166),
(0.423, 0.119, 0.175)
(0.564, 0.135, 0.185),
(0.235, 0.825, 0.370),
(0.453, 0.139, 0.480)
(0.555, 0.155, 0.349),
(0.552, 0.217, 0.292),
(0.437, 0.158, 0.225)
(0.506, 0.156, 0.219),
(0.292, 0.784, 0.554),
(0.455, 0.158, 0.437)
(0.595, 0.136, 0.331),
(0.368, 0.177, 0.237),
(0.435, 0.139, 0.199)
(0.557, 0.156, 0.345),
(0.551, 0.217, 0.293),
(0.438, 0.158, 0.226)
(0.516, 0.156, 0.219),
(0.292, 0.784, 0.556),
(0.439, 0.159, 0.449)
FAC(0.567, 0.155, 0.336),
(0.550, 0.216, 0.292),
(0.428, 0.157, 0.224)
(0.637, 0.115, 0.314),
(0.188, 0.113, 0.166),
(0.423, 0.119, 0.175)
(0.593, 0.135, 0.335),
(0.368, 0.177, 0.237),
(0.436, 0.139, 0.199)
(0.555, 0.155, 0.349),
(0.552, 0.217, 0.292),
(0.437, 0.158, 0.225)
(0.506, 0.156, 0.219),
(0.292, 0.784, 0.554),
(0.455, 0.158, 0.437)
(0.595, 0.136, 0.331),
(0.368, 0.177, 0.237),
(0.435, 0.139, 0.199)
(0.635, 0.115, 0.151),
(0.164, 0.888, 0.191),
(0.442, 0.119, 0.527)
(0.652, 0.116, 0.294),
(0.187, 0.113, 0.166),
(0.400, 0.120, 0.176)
(0.606, 0.136, 0.318),
(0.368, 0.176, 0.236),
(0.418, 0.139, 0.200)
(0.648, 0.116, 0.150),
(0.164, 0.888, 0.193),
(0.424, 0.120, 0.541)
WFC(0.593, 0.135, 0.335),
(0.368, 0.177, 0.237),
(0.436, 0.139, 0.199)
(0.555, 0.155, 0.349),
(0.552, 0.217, 0.292),
(0.437, 0.158, 0.225)
(0.639, 0.115, 0.310),
(0.187, 0.114, 0.167),
(0.420, 0.119, 0.174)
(0.595, 0.136, 0.331),
(0.368, 0.177, 0.237),
(0.435, 0.139, 0.199)
(0.635, 0.115, 0.151),
(0.164, 0.888, 0.191),
(0.442, 0.119, 0.527)
(0.652, 0.116, 0.294),
(0.187, 0.113, 0.166),
(0.400, 0.120, 0.176)
(0.577, 0.136, 0.185),
(0.236, 0.824, 0.371),
(0.433, 0.139, 0.493)
(0.566, 0.156, 0.335),
(0.552, 0.216, 0.292),
(0.424, 0.159, 0.227)
(0.643, 0.115, 0.306),
(0.187, 0.113, 0.166),
(0.414, 0.119, 0.175)
(0.569, 0.135, 0.183),
(0.235, 0.825, 0.370),
(0.446, 0.138, 0.483)
HAC(0.639, 0.115, 0.310),
(0.187, 0.114, 0.167),
(0.420, 0.119, 0.174)
(0.595, 0.136, 0.331),
(0.368, 0.177, 0.237),
(0.435, 0.139, 0.199)
(0.557, 0.156, 0.345),
(0.551, 0.217, 0.293),
(0.438, 0.158, 0.226)
(0.652, 0.116, 0.294),
(0.187, 0.113, 0.166),
(0.400, 0.120, 0.176)
(0.577, 0.136, 0.185),
(0.236, 0.824, 0.371),
(0.433, 0.139, 0.493)
(0.566, 0.156, 0.335),
(0.552, 0.216, 0.292),
(0.424, 0.159, 0.227)
(0.508, 0.155, 0.218),
(0.292, 0.785, 0.554),
(0.452, 0.158, 0.439)
(0.599, 0.135, 0.328),
(0.367, 0.177, 0.237),
(0.431, 0.138, 0.199)
(0.560, 0.155, 0.344),
(0.551, 0.217, 0.293),
(0.437, 0.158, 0.225)
(0.519, 0.155, 0.217),
(0.293, 0.784, 0.553),
(0.439, 0.157, 0.452)
DLC(0.557, 0.156, 0.345),
(0.551, 0.217, 0.293),
(0.438, 0.158, 0.226)
(0.652, 0.116, 0.294),
(0.187, 0.113, 0.166),
(0.400, 0.120, 0.176)
(0.606, 0.136, 0.318),
(0.368, 0.176, 0.236),
(0.418, 0.139, 0.200)
(0.566, 0.156, 0.335),
(0.552, 0.216, 0.292),
(0.424, 0.159, 0.227)
(0.508, 0.155, 0.218),
(0.292, 0.785, 0.554),
(0.452, 0.158, 0.439)
(0.599, 0.135, 0.328),
(0.367, 0.177, 0.237),
(0.431, 0.138, 0.199)
(0.639, 0.115, 0.148),
(0.163, 0.889, 0.191),
(0.437, 0.119, 0.531)
(0.654, 0.114, 0.298),
(0.186, 0.113, 0.166),
(0.402, 0.118, 0.172)
(0.608, 0.135, 0.321),
(0.366, 0.176, 0.236),
(0.421, 0.138, 0.197)
(0.651, 0.114, 0.148),
(0.163, 0.889, 0.190),
(0.424, 0.118, 0.545)
LIC(0.606, 0.136, 0.318),
(0.368, 0.176, 0.236),
(0.418, 0.139, 0.200)
(0.566, 0.156, 0.335),
(0.552, 0.216, 0.292),
(0.424, 0.159, 0.227)
(0.643, 0.115, 0.306),
(0.187, 0.113, 0.166),
(0.414, 0.119, 0.175)
(0.599, 0.135, 0.328),
(0.367, 0.177, 0.237),
(0.431, 0.138, 0.199)
(0.639, 0.115, 0.148),
(0.163, 0.889, 0.191),
(0.437, 0.119, 0.531)
(0.654, 0.114, 0.298),
(0.186, 0.113, 0.166),
(0.402, 0.118, 0.172)
(0.580, 0.135, 0.183),
(0.236, 0.824, 0.369),
(0.433, 0.138, 0.496)
(0.567, 0.155, 0.336),
(0.550, 0.216, 0.292),
(0.428, 0.157, 0.224)
(0.637, 0.115, 0.314),
(0.188, 0.113, 0.166),
(0.423, 0.119, 0.175)
(0.564, 0.135, 0.185),
(0.235, 0.825, 0.370),
(0.453, 0.139, 0.480)
TSC(0.643, 0.115, 0.306),
(0.187, 0.113, 0.166),
(0.414, 0.119, 0.175)
(0.599, 0.135, 0.328),
(0.367, 0.177, 0.237),
(0.431, 0.138, 0.199)
(0.560, 0.155, 0.344),
(0.551, 0.217, 0.293),
(0.437, 0.158, 0.225)
(0.654, 0.114, 0.298),
(0.186, 0.113, 0.166),
(0.402, 0.118, 0.172)
(0.580, 0.135, 0.183),
(0.236, 0.824, 0.369),
(0.433, 0.138, 0.496)
(0.567, 0.155, 0.336),
(0.550, 0.216, 0.292),
(0.428, 0.157, 0.224)
(0.504, 0.155, 0.218),
(0.291, 0.785, 0.555),
(0.457, 0.158, 0.438)
(0.593, 0.135, 0.335),
(0.368, 0.177, 0.237),
(0.436, 0.139, 0.199)
(0.555, 0.155, 0.349),
(0.552, 0.217, 0.292),
(0.437, 0.158, 0.225)
(0.506, 0.156, 0.219),
(0.292, 0.784, 0.554),
(0.455, 0.158, 0.437)
RDH(0.560, 0.155, 0.344),
(0.551, 0.217, 0.293),
(0.437, 0.158, 0.225)
(0.654, 0.114, 0.298),
(0.186, 0.113, 0.166),
(0.402, 0.118, 0.172)
(0.608, 0.135, 0.321),
(0.366, 0.176, 0.236),
(0.421, 0.138, 0.197)
(0.567, 0.155, 0.336),
(0.550, 0.216, 0.292),
(0.428, 0.157, 0.224)
(0.504, 0.155, 0.218),
(0.291, 0.785, 0.555),
(0.457, 0.158, 0.438)
(0.593, 0.135, 0.335),
(0.368, 0.177, 0.237),
(0.436, 0.139, 0.199)
(0.633, 0.115, 0.149),
(0.163, 0.889, 0.191),
(0.447, 0.119, 0.527)
(0.639, 0.115, 0.310),
(0.187, 0.114, 0.167),
(0.420, 0.119, 0.174)
(0.595, 0.136, 0.331),
(0.368, 0.177, 0.237),
(0.435, 0.139, 0.199)
(0.635, 0.115, 0.151),
(0.164, 0.888, 0.191),
(0.442, 0.119, 0.527)
AEM(0.608, 0.135, 0.321),
(0.366, 0.176, 0.236),
(0.421, 0.138, 0.197)
(0.567, 0.155, 0.336),
(0.550, 0.216, 0.292),
(0.428, 0.157, 0.224)
(0.637, 0.115, 0.314),
(0.188, 0.113, 0.166),
(0.423, 0.119, 0.175)
(0.593, 0.135, 0.335),
(0.368, 0.177, 0.237),
(0.436, 0.139, 0.199)
(0.633, 0.115, 0.149),
(0.163, 0.889, 0.191),
(0.447, 0.119, 0.527)
(0.639, 0.115, 0.310),
(0.187, 0.114, 0.167),
(0.420, 0.119, 0.174)
(0.566, 0.136, 0.186),
(0.236, 0.824, 0.370),
(0.450, 0.139, 0.480)
(0.557, 0.156, 0.345),
(0.551, 0.217, 0.293),
(0.438, 0.158, 0.226)
(0.652, 0.116, 0.294),
(0.187, 0.113, 0.166),
(0.400, 0.120, 0.176)
(0.577, 0.136, 0.185),
(0.236, 0.824, 0.371),
(0.433, 0.139, 0.493)
Table 7. Crisp score-based evaluation matrix.
LCCEMTsRC1RC2RC3RC4RC5RC6RC7RC8RC9RC10
RPC0.7170.6940.6590.7080.7090.6530.7150.6880.6540.720
FAC0.6590.7080.6870.6530.7150.6880.7340.7160.6940.743
WFC0.6870.6530.7090.6880.7340.7160.7170.6580.7110.711
HAC0.7090.6880.6540.7160.7170.6580.7160.6900.6550.720
DLC0.6540.7160.6940.6580.7160.6900.7370.7170.6940.745
LIC0.6940.6580.7110.6900.7370.7170.7180.6590.7080.709
TSC0.7110.6900.6550.7170.7180.6590.7140.6870.6530.715
RDH0.6550.7170.6940.6590.7140.6870.7330.7090.6880.734
AEM0.6940.6590.7080.6870.7330.7090.7100.6540.7160.717
Table 8. Standard MEREC normalized matrix.
LCCEMTRC1RC2RC3RC4RC5RC6RC7RC8RC9RC10
RPC0.9130.9420.9940.9231.0001.0000.9930.9510.9990.984
FAC0.9940.9230.9521.0000.9920.9500.9670.9140.9420.954
WFC0.9521.0000.9230.9500.9660.9130.9900.9940.9190.997
HAC0.9230.9501.0000.9130.9890.9930.9920.9490.9970.984
DLC1.0000.9130.9430.9930.9910.9480.9630.9130.9420.951
LIC0.9430.9930.9200.9480.9620.9120.9890.9940.9231.000
TSC0.9200.9480.9990.9120.9880.9920.9930.9521.0000.992
RDH0.9990.9120.9430.9920.9920.9510.9680.9230.9500.966
AEM0.9430.9920.9240.9510.9670.9221.0001.0000.9130.989
Table 9. Cellwise absolute MEREC criterion-removal effects.
LCCEMTRC1RC2RC3RC4RC5RC6RC7RC8RC9RC10
RPC0.008850.005820.000620.007780.000000.000000.000670.004880.000140.00152
FAC0.000610.007700.004700.000000.000760.004960.003260.008660.005740.00456
WFC0.004710.000000.007710.004970.003360.008800.000930.000580.008140.00033
HAC0.007780.005010.000000.008880.001040.000720.000810.005090.000270.00154
DLC0.000000.008760.005580.000720.000890.005160.003600.008730.005740.00480
LIC0.005600.000720.007990.005170.003710.008880.001090.000610.007690.00000
TSC0.008080.005230.000130.008990.001190.000750.000660.004750.000000.00077
RDH0.000130.008900.005630.000750.000750.004840.003100.007710.004970.00335
AEM0.005630.000750.007570.004840.003200.007850.000000.000000.008800.00103
Table 10. Positive distance from average matrix.
LCCEMTRC1RC2RC3RC4RC5RC6RC7RC8RC9RC10
RPC0.0440.0100.0000.0320.0000.0000.0000.0020.0000.000
FAC0.0000.0300.0020.0000.0000.0030.0180.0430.0110.027
WFC0.0010.0000.0340.0030.0180.0430.0000.0000.0370.000
HAC0.0320.0020.0000.0430.0000.0000.0000.0050.0000.000
DLC0.0000.0420.0120.0000.0000.0050.0210.0440.0110.030
LIC0.0100.0000.0370.0050.0220.0440.0000.0000.0320.000
TSC0.0360.0040.0000.0440.0000.0000.0000.0010.0000.000
RDH0.0000.0430.0120.0000.0000.0010.0160.0330.0030.014
AEM0.0100.0000.0320.0010.0160.0330.0000.0000.0440.000
Table 11. Negative distance from average matrix.
LCCEMTRC1RC2RC3RC4RC5RC6RC7RC8RC9RC10
RPC0.0000.0000.0390.0000.0170.0480.0090.0000.0460.005
FAC0.0410.0000.0000.0480.0090.0000.0000.0000.0000.000
WFC0.0000.0490.0000.0000.0000.0000.0070.0410.0000.017
HAC0.0000.0000.0460.0000.0070.0410.0080.0000.0450.005
DLC0.0470.0000.0000.0410.0080.0000.0000.0000.0000.000
LIC0.0000.0420.0000.0000.0000.0000.0050.0410.0000.021
TSC0.0000.0000.0440.0000.0050.0400.0100.0000.0470.013
RDH0.0460.0000.0000.0400.0090.0000.0000.0000.0000.000
AEM0.0000.0410.0000.0000.0000.0000.0160.0470.0000.010
Table 12. EDAS appraisal parameters and final ranks.
LCCEMTSPSNNSPNSNASRank
RPC0.01090.01770.65360.00000.32688
FAC0.01320.01140.79540.35780.57665
WFC0.01510.01230.90790.30250.60524
HAC0.01020.01680.61120.04890.33007
DLC0.01660.01110.99650.36950.68301
LIC0.01660.01151.00000.34930.67462
TSC0.01050.01740.63290.01790.32549
RDH0.01280.01100.77240.37660.57456
AEM0.01550.01210.93020.31450.62233
Table 13. Sensitivity to the T-spherical parameter q .
qRank 1Spearman r h o vs. q = 4 Complete Ranking
2LIC0.967LIC > DLC > AEM > WFC > RDH > FAC > HAC > RPC > TSC
3LIC0.983LIC > DLC > AEM > WFC > FAC > RDH > HAC > RPC > TSC
4DLC1.000DLC > LIC > AEM > WFC > FAC > RDH > HAC > RPC > TSC
5DLC0.950DLC > LIC > AEM > WFC > FAC > RDH > RPC > TSC > HAC
Table 14. Comparative ranks across ranking methods.
LCCEMTEDASTOPSISCODASCoCoSoMARCOS
RPC87798
FAC56645
WFC44454
HAC79977
DLC12221
LIC21132
TSC98889
RDH65516
AEM33363
r h o vs. EDAS1.0000.9170.9170.6671.000
Table 15. Rank-reversal diagnostics.
Candidate-Set TestTop AlternativeSpearman RhoPairwise Inversions
RPCDLC1.0000
FACLIC0.8573
WFCDLC0.9292
HACLIC0.9761
DLCLIC0.9053
LICDLC0.7865
TSCLIC0.9522
RDHLIC0.8334
AEMDLC0.9053
Add dominated A10DLC0.950order changed
Disclaimer/Publisher’s Note: The statements, opinions and data contained in all publications are solely those of the individual author(s) and contributor(s) and not of MDPI and/or the editor(s). MDPI and/or the editor(s) disclaim responsibility for any injury to people or property resulting from any ideas, methods, instructions or products referred to in the content.