Article

Five Myths About Influence Operations: What 25 Million Tweets Across Seven State Campaigns Reveal

1
Thomas Lord Department of Computer Science, University of Southern California, Los Angeles, CA 90089, USA
2
Information Sciences Institute, University of Southern California, Marina del Rey, CA 90292, USA
Systems 2026, 14(8), 970; https://doi.org/10.3390/systems14080970
Submission received: 22 June 2026 / Revised: 4 August 2026 / Accepted: 5 August 2026 / Published: 10 August 2026

Highlights

Please indicate how your work links to systems science via your contributions to systems practice, theory, and/or methodology.
  • The paper treats influence operations as production systems rather than emergent social phenomena, using a systems-level empirical approach (25 million tweets across seven state-linked campaigns) to characterize their operational structure.
  • It contributes a methodology for separating operational signatures (staffing, content scheduling, amplification structure) from content-level signals, transferable to other adversarial information systems.
What are the main findings and/or the implications of the main findings?
  • Influence operations function as industrial content factories: compartmentalized by national origin, thinly staffed, and run on content calendars rather than optimized in real time against audience reception.
  • Viral reach is largely captured from external audiences rather than manufactured through the operations’ own amplification, and moral-emotional framing does not predict reception, implying that detection should target structural and distributional signatures rather than emotional content markers.

Abstract

A set of “stylized facts” about state-backed influence operations now circulates across journalism, policy, and the peer-reviewed literature: that they are monolithic troll armies; that they win by weaponizing moral-emotional language; that they manufacture their own virality; that they learn and optimize against feedback; and that they have become indistinguishable from ordinary users. Most rest on single-campaign studies, uncontrolled comparisons, and large-sample significance reported without baselines or multiple-comparison control, and are rarely re-tested. We assemble complete, government-attributed archives of seven state campaigns (25,076,853 tweets from 9071 accounts) with a matched organic-user baseline for five of them, and re-test all five claims under one protocol: pre-registration, Benjamini–Hochberg false-discovery control, permutation nulls, a future-reception placebo, and a takedown-snapshot decomposition. Scoped to these campaigns, every claim weakens or reverses: the operations are narratively segregated, thinly staffed production desks, not a unified army; an organic moral-contagion law fails to replicate in any of them, and a meaningless placebo predicts engagement as well; internal amplification supplies only 0.10 5.31 % of top-percentile reach; the remainder is captured from an external audience whose composition—genuine organic uptake versus coordination the archive cannot see—is structurally unobservable in takedown data, a limit we state as part of the finding; behavior is scripted, with rare apparent feedback mean-reverting toward baseline; and, while their per-account language has drifted off the 2016 “troll” fingerprint, they still coordinate 7– 70 × more tightly than matched real users—a regularity a frozen re-test reproduces, with the language-drift and segregation patterns, across twelve further country-groups. The five verdicts do not carry equal evidentiary weight: three rest on matched-baseline contrasts, one on a placebo-gated temporal design, and one (the moral-emotional claim) on a placebo-anchored test alone, a hierarchy this paper makes explicit. The corrected picture is coherent: an industrial content factory siloed in production but coordinated in execution, whose reach it does not internally manufacture. The detectable signature has migrated from language to coordination: per-account content fingerprints age out, while cross-account coordination remains the durable, cross-national marker. Because these operations run scripts rather than optimize against feedback, an adversary that genuinely optimized—now feasible with large language models—would look measurably different from the operations studied here: a forward warning, not a present finding. The recurring lesson is methodological: on corpora of confirmed manipulation, baseline-free significance reconstructs the analyst’s expectations, and platform and policy decisions rest on those beliefs.

1. Introduction

Few online phenomena have been studied as intensively as state-backed influence operations (IOs). Since the public release of the first platform-attributed archives, a research and policy ecosystem has grown around them, and with it a set of widely repeated claims about how these operations achieve influence. Many of these claims have hardened into “stylized facts”: statements that circulate across investigative journalism, government and think-tank reporting, and the peer-reviewed literature with the confidence of settled knowledge.
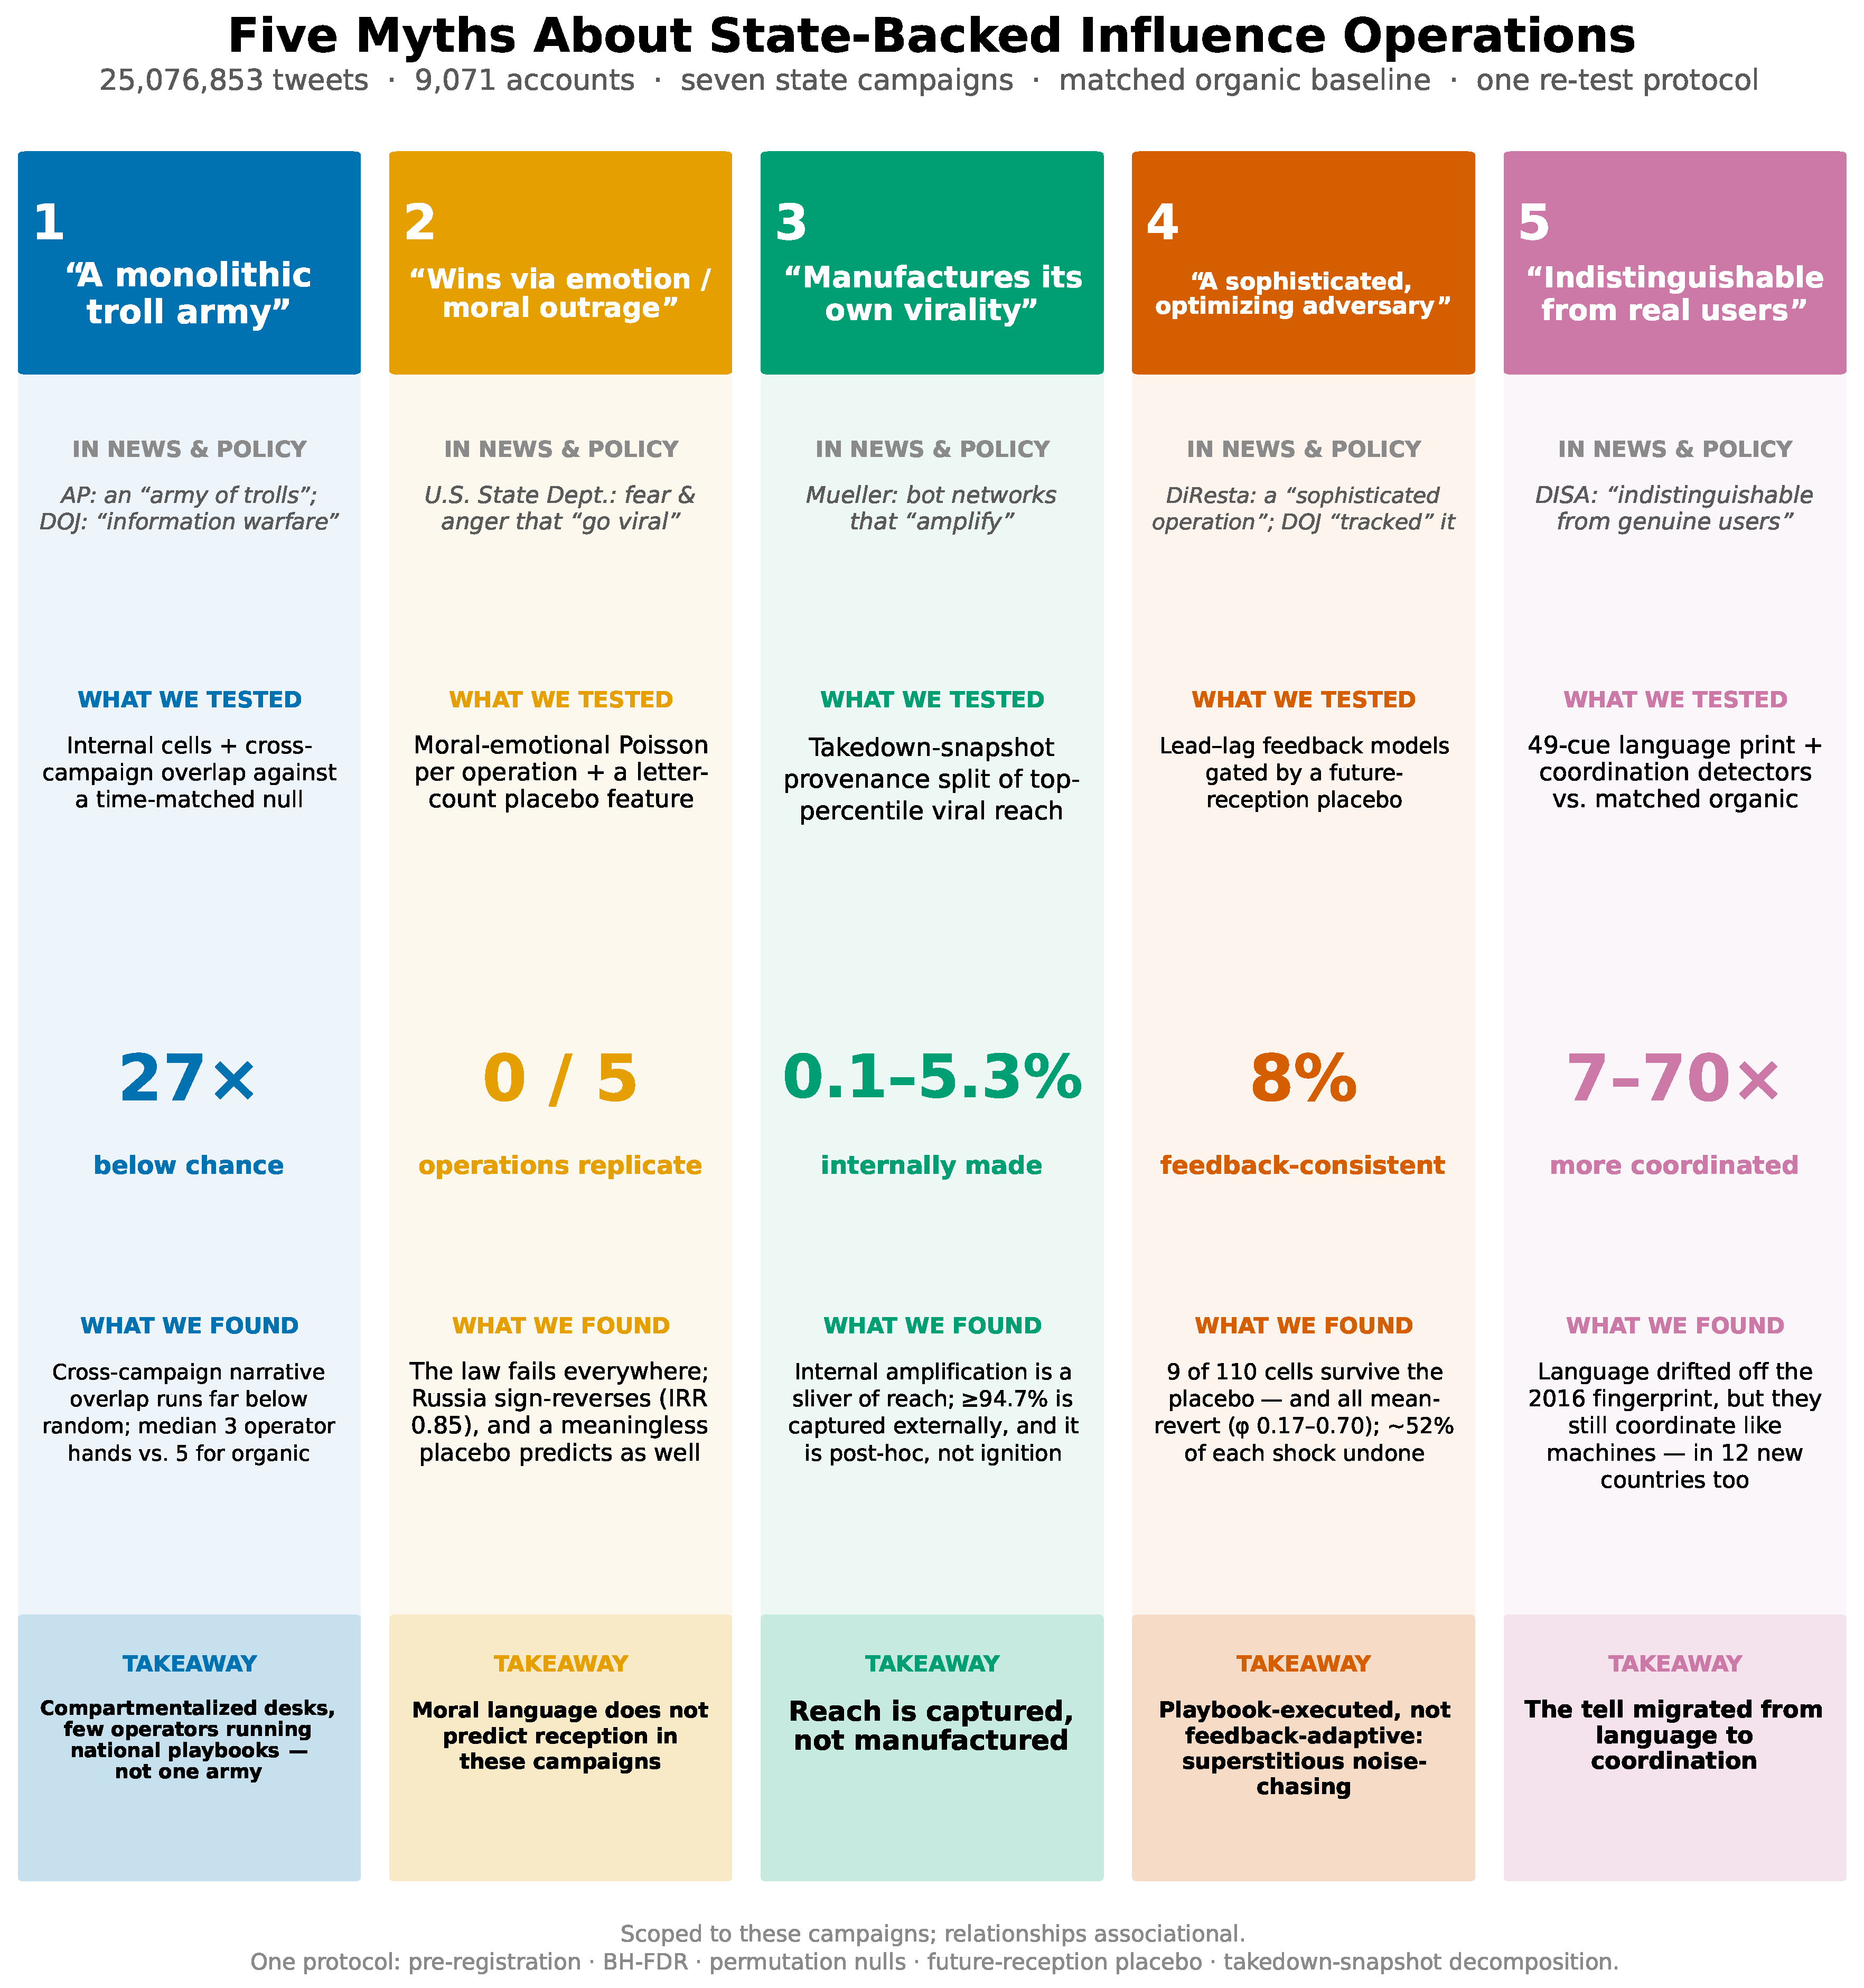
This paper examines five of them: (1) that an influence operation is a monolithic troll army, acting in concert; (2) that it wins on emotion, that moral-emotional and outrage-laden language is what drives the spread of its content; (3) that it manufactures its own virality through sockpuppet self-amplification; (4) that it is a sophisticated, optimizing adversary that learns from reception and adapts what it says to what works; (5) that it has become indistinguishable from real users’ content, or, in the mirror-image folk belief, that it is still detectable by the crude linguistic tics of the 2016-era troll. Figure 1 previews each claim, its provenance, the test we apply, and the corrected finding; Table 1 gives the signature statistics.
Each of these beliefs has a published provenance, and we attach that provenance to each myth rather than debunking a strawman: every section below opens by attributing its claim to at least one peer-reviewed or authoritative source, and wherever possible to a source that makes the claim about state influence operations specifically rather than about social media or human psychology in general. The point is not that these sources are careless. It is that the claims were, for the most part, established on evidence that cannot by itself separate a genuine signal from a measurement artifact: single campaigns rather than portfolios, the manipulation arm with no organic comparison, statistical significance on enormous samples reported without placebos or false-discovery control, and a near-total absence of re-testing. Beyond the scholarly provenance, each belief also circulates as received wisdom in journalism and policy reporting; Appendix A catalogues representative statements of each myth across authoritative news outlets and government, intelligence, and policy-institution documents.
We assemble complete archives (not samples) of seven government-documented influence campaigns released through the Twitter Information Operations program: 25,076,853 tweets posted by 9071 accounts attributed to operations linked to Russia, Iran, Venezuela, and Bangladesh, spanning 2009–2018. We pair these with a matched organic-user baseline drawn from an independent release of same-country, same-period accounts that were never taken down [1]. Against this evidence base, we re-test each of the five claims under a single, pre-registered common protocol described in Section 3. Where a claim was originally established on the manipulation arm alone, we re-establish it as a contrast against real users; where it rested on uncorrected significance, we apply false-discovery control and permutation nulls; and, where it could be confounded by trend or regression-to-the-mean, we introduce placebo features that a genuine effect must beat.
Three cautions bound every claim in this paper. First, our evidence concerns these specific, already-investigated campaigns; we make no claim about influence operations that platforms never caught, and “these operations do not do X” is never “no influence operation does X.” Second, all reported relationships are associational: we describe what co-occurs, never what causes what. Where a verb such as “manufactures,” “learns,” or “optimizes” appears in a myth title or a quoted source, it belongs to the folk claim under test, not to our own analytic vocabulary. Third, several widely believed patterns turn out not to hold in these campaigns’ data; showing this does not make the campaigns harmless. On the contrary, several of the corrected findings describe a more efficient adversary than the folk picture suggests, not a less consequential one.
This paper makes four contributions. First, we re-test five recurring claims about influence operations at portfolio scale, anchored to a matched organic baseline and under a pre-registered protocol; each claim weakens or reverses when scoped to these campaigns. Second, we replace the folk picture with an internally coherent account of these operations as compartmentalized, thinly staffed content factories whose viral reach is captured from an external audience rather than internally generated. Third, we document a reusable methodological lesson: on a corpus of confirmed manipulation, significance testing without baselines, placebos, or false-discovery control reproduces the very patterns analysts expect to find, so that only matched baselines, placebo features, and pre-registration separate a genuine regularity from a measurement artifact. Fourth, we replicate the corrected regularities out-of-sample on twelve further country-groups, establishing that they are cross-national rather than idiosyncratic to the original four countries.

2. Related Work

This section is organized around the five claims the paper tests: for each, we summarize what prior work has established and on what evidence, then review how cross-campaign analyses have previously been conducted and state how the present design relates to that work.

2.1. Prior Evidence on Each of the Five Claims

Claim 1 (organization). Early empirical accounts characterized state campaigns through the content and behavior of disclosed troll accounts. The foundational study of the Internet Research Agency (IRA) already described an industrial operation of specialized, interchangeable parts rather than an undifferentiated mass [2], and a subsequent multi-view clustering of state operations recovered internal communities organized by function [3]. Recent network studies show that coordinated communities decompose into behavioral archetypes and that coordination is temporally unstable [4]. Event-centered case studies show the same decomposition in the wild: eleven concurrent coordinated campaigns detected around the 2023 Israel–Hamas war promoted distinct narratives with no centralized control, relying on low-complexity co-retweet and copy–paste tactics that largely failed to penetrate organic networks [5]. At the cross-operation level, reported coordination among separate state operations [6] attenuates substantially once proper baselines are applied [7]. What has been missing is a direct, portfolio-scale measurement of compartmentalization and staffing across several operations under one protocol.
Claim 2 (moral-emotional language). The moral-contagion law, that each added moral-emotional word is associated with substantially greater diffusion in organic networks, was established on large political-tweet corpora [8] and linked to feedback learning [9]. Its robustness is contested: a re-analysis showed the model can fail to outperform an implausible alternative [10], and a pre-registered replication and meta-analysis by the original authors reports a positive but small and heterogeneous effect that reverses sign in one corpus [11]. Adjacent work locates the engagement lever in out-group animosity [12] (with in-group solidarity dominant around conflict events [13]), in negativity [14], and in outrage-driven resharing without reading [15]. Applied to influence operations specifically, an analysis of the released IRA corpus reports a modest engagement premium for negative sentiment [16]. No prior study has re-tested the moral-contagion claim inside multiple state campaigns with placebo controls.
Claim 3 (self-amplification). Automated accounts demonstrably amplify low-credibility content early in cascades and by targeting influential users [17], and coordinated accounts can boost reach up to a saturation threshold [18]. However, differential spread at scale is carried more by human resharing than by automation [19]; automated accounts are less central to diffusion than high-profile human accounts [20]; state-propaganda dissemination is dominated by ordinary citizen accounts [21], with low-quality content concentrated among a small set of “supersharer” users [22]; and linked exposure–outcome studies find IRA reach concentrated among a few strongly partisan users and dwarfed by domestic media [23,24]. What fraction of state operations’ viral posts reach their own accounts’ supply has not previously been decomposed campaign by campaign.
Claim 4 (adaptation). The policy literature portrays these operations as data-driven optimizers [25,26]. The academic literature documents a weaker, temporal claim: tactics, language, and identities change over time [27,28]. Against the optimizer reading, trolls have been found to act independently of the feedback they receive [29], automated accounts lack the time-varying behavioral dynamics of genuine users [30], and a campaign-agnostic classifier attributes cross-operation detectability to shared, templated tactics [31]. The generative-AI turn renews the concern that operations will scale and adapt [32,33], but the persuasion evidence is mixed: AI-generated propaganda approaches human material only with human curation [34], machine-generated text can be perceived as credible [35], LLM-based microtargeting does not reliably outperform untargeted messaging [36], and conversational persuasion gains require interactive dialogue [37]. The red-teaming of open-weight models shows they can be steered with simple prompts into producing politically positioned influence content, though susceptibility is model-specific and asymmetric [38], and longitudinal conversational studies find LLM persuasion concentrated among psychologically susceptible users, with most participants anchored to their initial stance [39]. A direct lead–lag test of whether state operations reallocate content toward what earns reception has been missing.
Claim 5 (distinguishability). One line of work finds human-operated troll accounts individually similar to ordinary users [29,40,41]; another reports high-accuracy detection from behavioral and linguistic features [42,43,44]. Detector research bears out both halves: linguistic drift across campaigns forces continual model adaptation [45,46], while fused coordination signatures, built from co-retweet, co-URL, text-reuse, and hashtag-sequence similarity [47,48,49], generalize across operations [50] and platforms [51,52]. The early automation-centric literature [53,54] anticipated this migration of the detectable signal from account content to collective behavior. What has been missing is a matched-baseline quantification: how much more tightly do operation accounts coordinate than comparable real users, and does the 2016 linguistic fingerprint still hold?

2.2. Cross-Campaign Designs and the Baseline Problem

Prior cross-campaign work falls into three designs. Comparative descriptions contrast a small number of released campaigns on content and targeting [28]. Predictive designs train on some campaigns and test on others, showing that content [44] and coordination [31,45,50] features transfer. Baseline-controlled designs are rarest: the inter-state-coordination episode [6,7] illustrates how a cross-campaign claim can dissolve once an appropriate null is introduced, and the release of labeled organic control datasets [1] has only recently made matched comparisons feasible at portfolio scale. Methodologically, computational social science has shown that analytic flexibility can manufacture almost any effect from a single dataset [55,56], with specification-curve reporting as one corrective [57].
The present design combines the three strands: complete archives of seven campaigns rather than samples, a matched organic baseline [1] rather than within-corpus description, and a single pre-registered protocol (false-discovery control, permutation nulls, placebo features) applied uniformly to all five claims, followed by a frozen out-of-sample re-test on twelve further country-groups. To our knowledge, no prior study has re-tested this set of recurring claims jointly, under one protocol, against a matched baseline.

3. Data and Methods

3.1. Campaigns

The primary corpus comprises seven state-attributed campaigns released through the Twitter Information Operations archive [58]: two operations attributed to the Russian Internet Research Agency and associated Russian activity, two attributed to Iran, two attributed to Venezuela, and one to Bangladesh. In total, the corpus contains 25,076,853 tweets from 9071 released accounts (8275 of which authored at least one tweet), spanning posting dates from 2009 to 2018. Because the data are takedown snapshots, engagement counters reflect their state at suspension; we treat this explicitly (Section 3.6). Throughout, accounts and internal groupings are referred to only by pseudonymous desk or cluster identifiers; no real handles or numeric account identifiers appear in this paper. Table 2 summarizes the seven campaigns; account and tweet totals are public Twitter-release metadata. A companion study of this same seven-campaign corpus decomposes its hostile content, separating identity-directed hate from partisan and geopolitical invective and showing that the campaigns sort into three hostility regimes as single “hate” rate flattens [59].

3.2. Organic Baseline

For five of the seven campaigns, we draw a matched organic-control arm from an independent release of accounts that were active in the same country and period but were never taken down [1]. “Matched” here means matched on topic/period activity, not on demographics or account age. This baseline is what converts a within-corpus description (“IO accounts do X”) into the comparison that the claims actually require (“IO accounts do X more than comparable real users”). The controls are drawn from the discussion in which the campaign operated (the country and period of the release), not from the population the operation impersonated. The two choices answer different questions. Matching on the impersonated target population would ask how well the operation blends into its audience, an interesting question that the released data cannot support (the releases supply no never-suspended target-country arm for most campaigns, and multi-audience operations such as the IRA, which simultaneously addressed domestic Russian, United States, and other audiences, admit no single target arm). Matching on the release’s own discussion instead asks whether accounts embedded in the same information environment behave and coordinate as the operation does, which is the comparison the five claims require; the resulting scope is stated in Section 10. One campaign (the largest Venezuelan operation) has no available control and is reported descriptively; one Iranian mapping is provisional and is never pooled into the confirmed-five contrasts. All organic-control results are reported at the aggregate class level only (no per-account dossiers, rankings, identifiers, or text), consistent with the control accounts being ordinary users and with the baseline’s license terms.

3.3. Common Protocol

A shared protocol underlies every test:
  • Pre-registration. Each analysis run committed a timestamped pre-registration file (fixing its hypotheses, estimators, feature definitions, and pass/fail decision rules) to the project repository before any model was fit on the outcome data, and a fixed random seed was used throughout for reproducibility. Deviations forced during analysis (for example, a campaign dropping below the power threshold for a given test) are logged as registered deviations rather than silently absorbed.
  • Multiple-comparison control. Benjamini–Hochberg false-discovery control is applied within each pre-registered test family, and we report q-values rather than raw p-values for those families. A family is the full set of campaign-level (or pair-level) contrasts for one research question, so that, for instance, all cross-campaign sharing tests form one family and all moral-contagion specifications another. Where the design admits only a small number of matched control draws (the Seckin baseline supplies ten, giving a one-sided add-one p-floor of 0.0909 that BH cannot push below 0.05 ), we say so explicitly and carry the conclusion on the confidence-interval exclusion of the null ratio rather than on a q-value.
  • Permutation and rewiring nulls. Reference distributions for the network and segregation statistics are built by resampling rather than assumed: recovered coordination cells are validated against a degree-preserving rewiring null [60] that holds each account’s connectivity fixed while randomizing partners; cross-campaign narrative, domain, and target overlap is tested against a time-matched (and, separately, popularity-matched) null that preserves each campaign’s activity volume and timing; nulls use 1000 draws where the per-permutation cost permits, with the smaller draw counts used for the most expensive tests disclosed in place and framed as exact tests.
  • Effect sizes with uncertainty. We report effect sizes (incidence-rate ratios, Cliff’s δ , abnormality ratios) with bootstrap confidence intervals rather than p-values alone.
  • Three signature placebos and decompositions. Three design elements carry particular weight, and each is a full sentence of logic. First, the learning test (Section 7) uses a future-reception placebo: because future reception cannot cause present behavior, a genuine feedback signal must depend strongly on past reception and negligibly on future reception, so a cell whose past and future coefficients are comparable is exhibiting trend or autocorrelation, not learning. Second, the virality test (Section 6) uses a takedown-snapshot decomposition that isolates the one campaign (the IRA) whose frozen engagement counters reconcile exactly with the archive’s internal retweet edges, so that subtracting the operation’s own retweets from the snapshot counter yields a clean internal/external split. Third, the emotion test (Section 5) pairs its predictor with an XYZ letter-count placebo, the count of the letters x, y, and z in the tweet text, a deliberately meaningless feature introduced by Burton and colleagues [10], and reports two moral-foundations dictionaries side by side rather than averaged. Appendix B gives the full specification of each.

3.4. Estimands and Test Statistics

Four estimands recur across the five tests. First, reception is modeled per operation i with a no-follower fixed-effects Poisson regression,
E [ y i t ] = exp α i + β x i t + γ z i t ,
where y i t is the engagement count of tweet t, x i t the standardized feature of interest (moral-emotional load, or the XYZ letter-count placebo), z i t persona controls, and the reported effect is the incidence-rate ratio IRR = e β per standard deviation. The future-reception placebo (Myth 4) re-fits a lead–lag form and contrasts the coefficient on past reception, β past , with that on future reception, β fut : a genuine feedback signal requires β past β fut 0 , whereas β past β fut indicates trend or autocorrelation.
Second, coordination and overlap statistics are scored against resampled nulls as a lift,
lift = S obs E null [ S ] ,
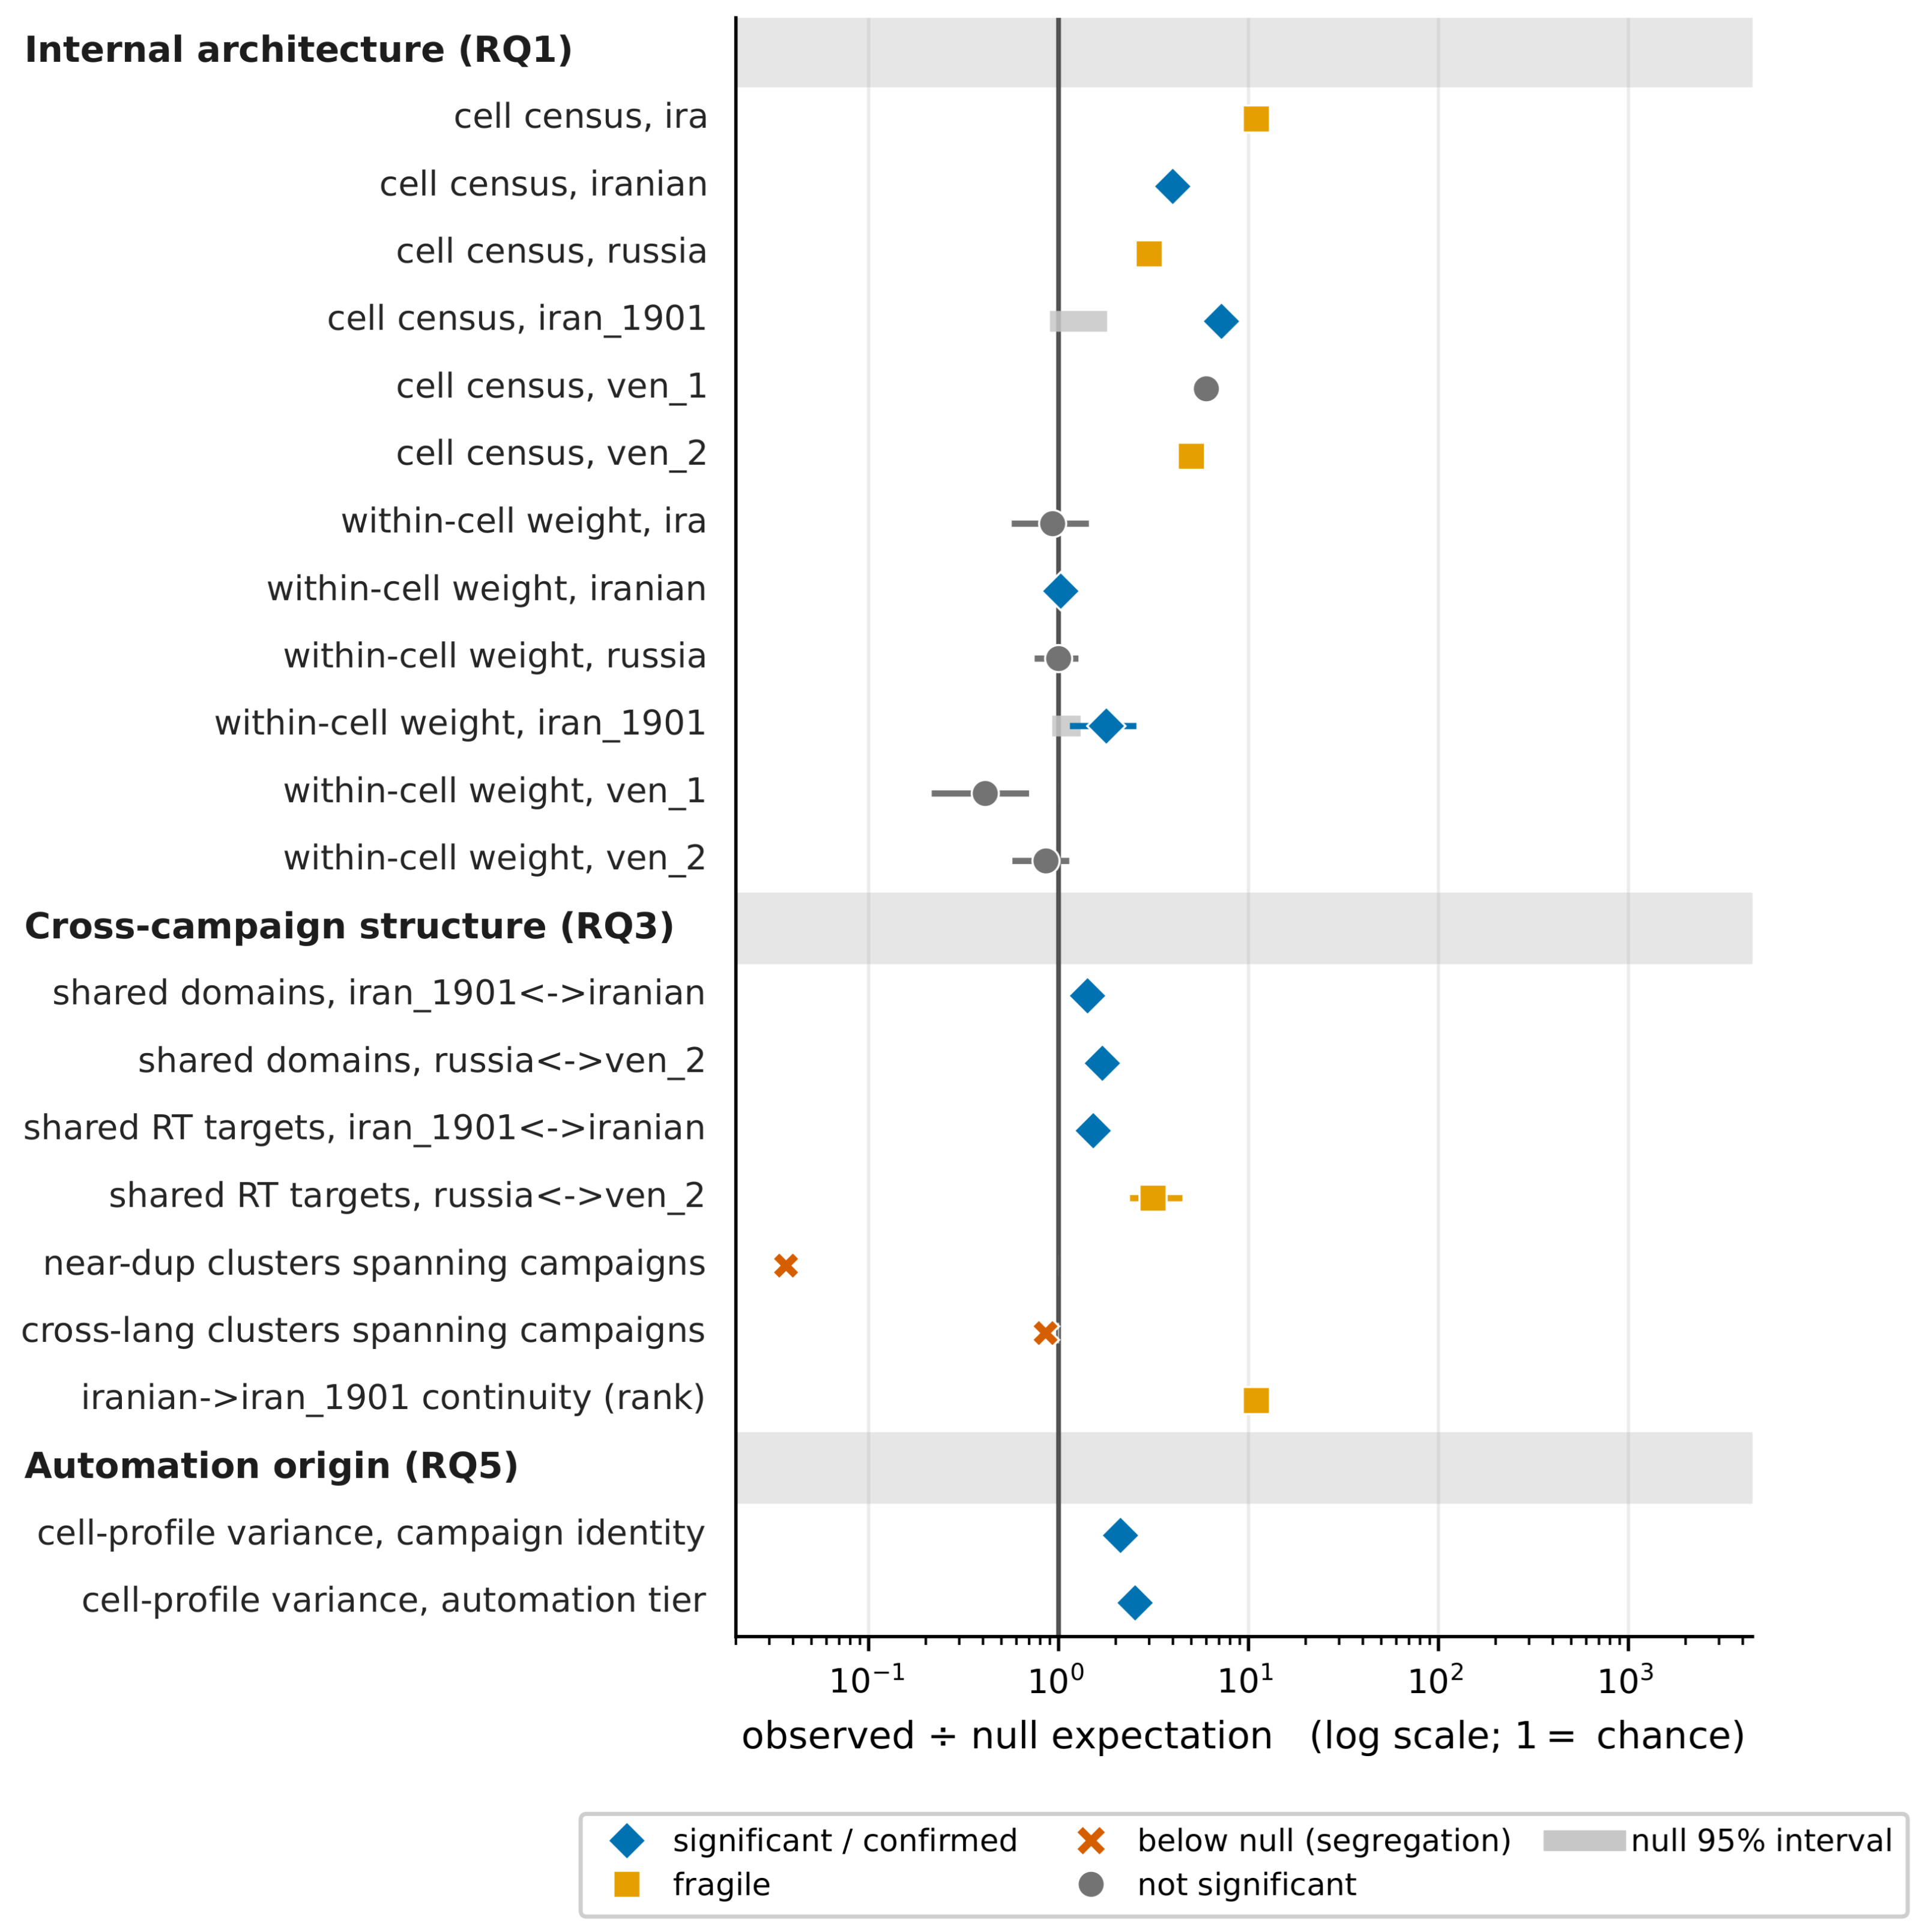
where S denotes a simple count fixed in advance for each test: for internal structure, the number of validated coordination edges or cells; for cross-campaign overlap, the number of narrative clusters (or shared domains, or shared retweet targets) spanning at least two campaigns. S obs is that count computed on the real data, and E null [ S ] is the mean of the same count over at least 1000 resampled null datasets, built by degree-preserving rewiring for internal structure and by time-matched (separately, popularity-matched) resampling for cross-campaign overlap. A lift of 1 means the observed count equals chance; a lift of 0.037 , as in the narrative-spanning test, means the campaigns share about 27 ×  fewer clusters than chance, i.e., segregation rather than convergence. As a worked example for cross-campaign narrative spanning, S obs = 39,113 shared clusters versus E null [ S ] 1,064,682 under the time-matched permutation null, giving lift = 0.037 .
Third, the matched-baseline contrast (Myth 5) is an abnormality ratio per detector d,
A d = S d IO S d organic ,
where d indexes the four coordination detectors (co-retweet synchrony, same-minute co-activity, near-duplicate text, co-hashtag), S d IO is detector d’s coordination rate computed on the campaign’s released accounts, and S d organic is the mean of the same rate over ten matched-size draws of organic control accounts from the same country and period, computed with the detector’s thresholds frozen (no re-tuning between arms). A ratio A d = 7.7 therefore reads as follows: the operation exhibits 7.7 × the same-minute co-activity of comparable real users. A contrast is declared abnormal-high only when the bootstrap 95 % confidence interval of A d excludes 1 and  A d > 1 .
Fourth, whether reception-chasing yielded a durable benefit (Myth 4) is read from a Galton mean-reversion coefficient,
r t + 1 = ϕ r t + ε t ,
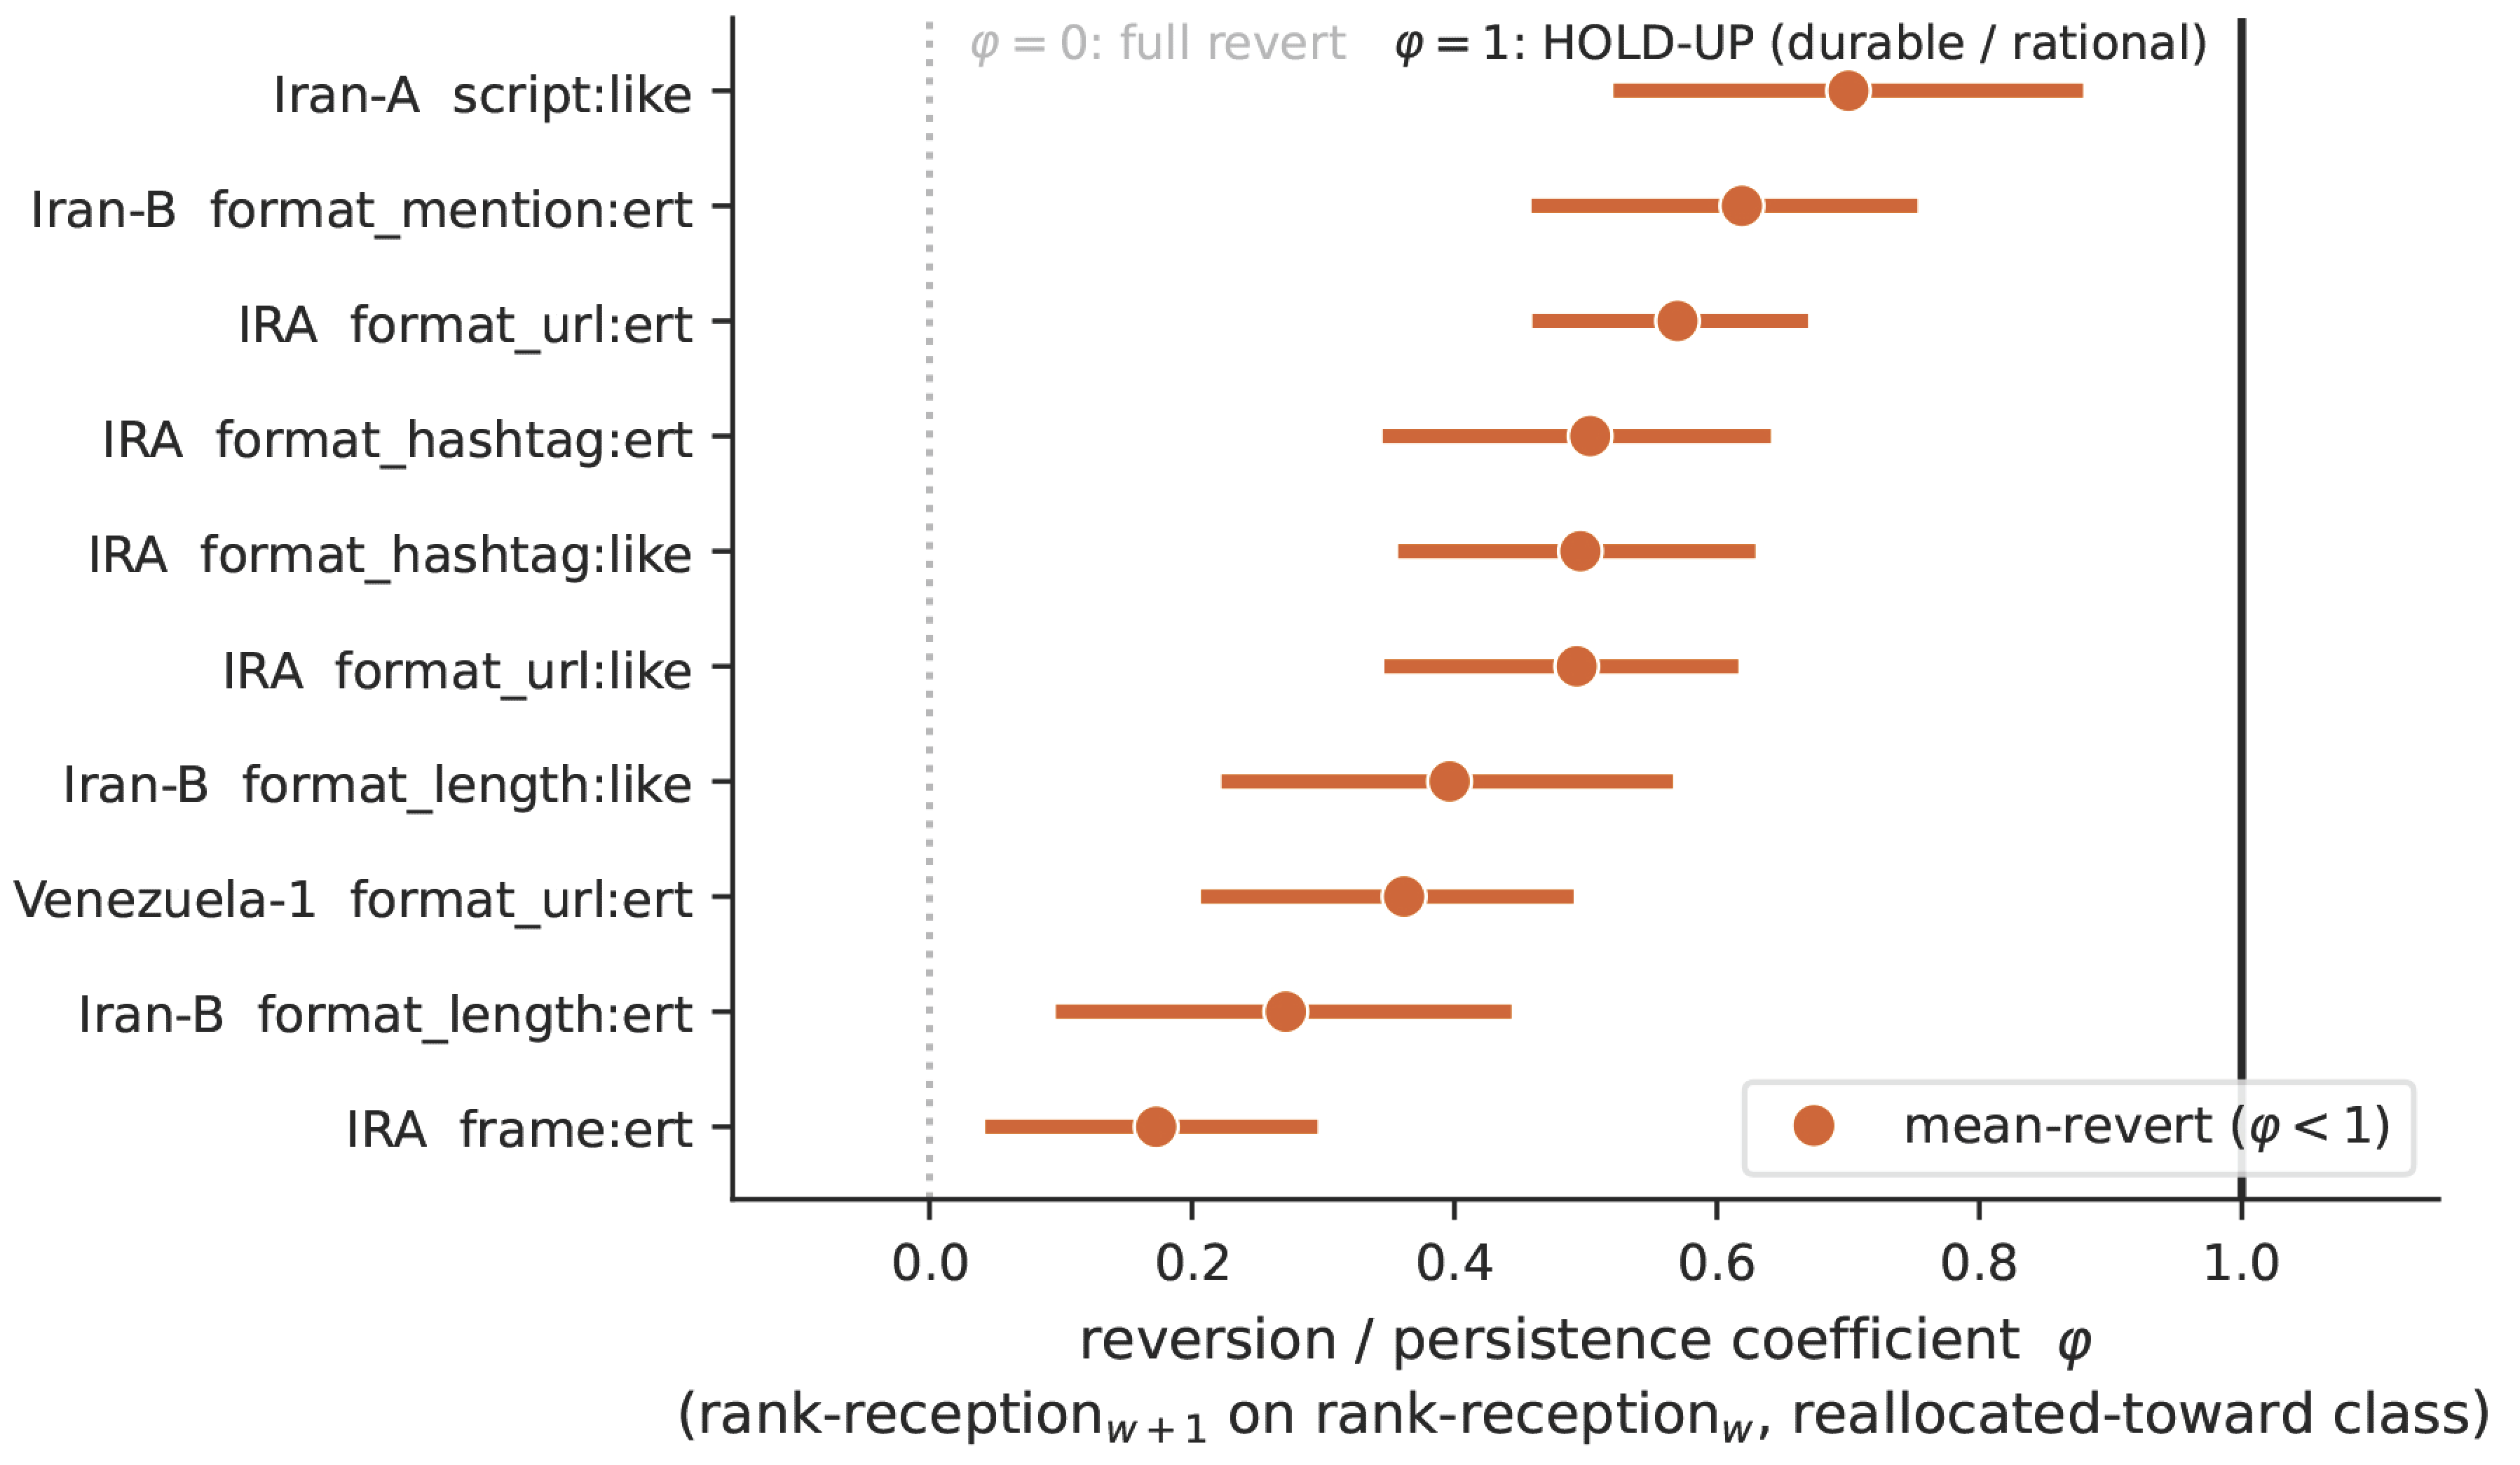
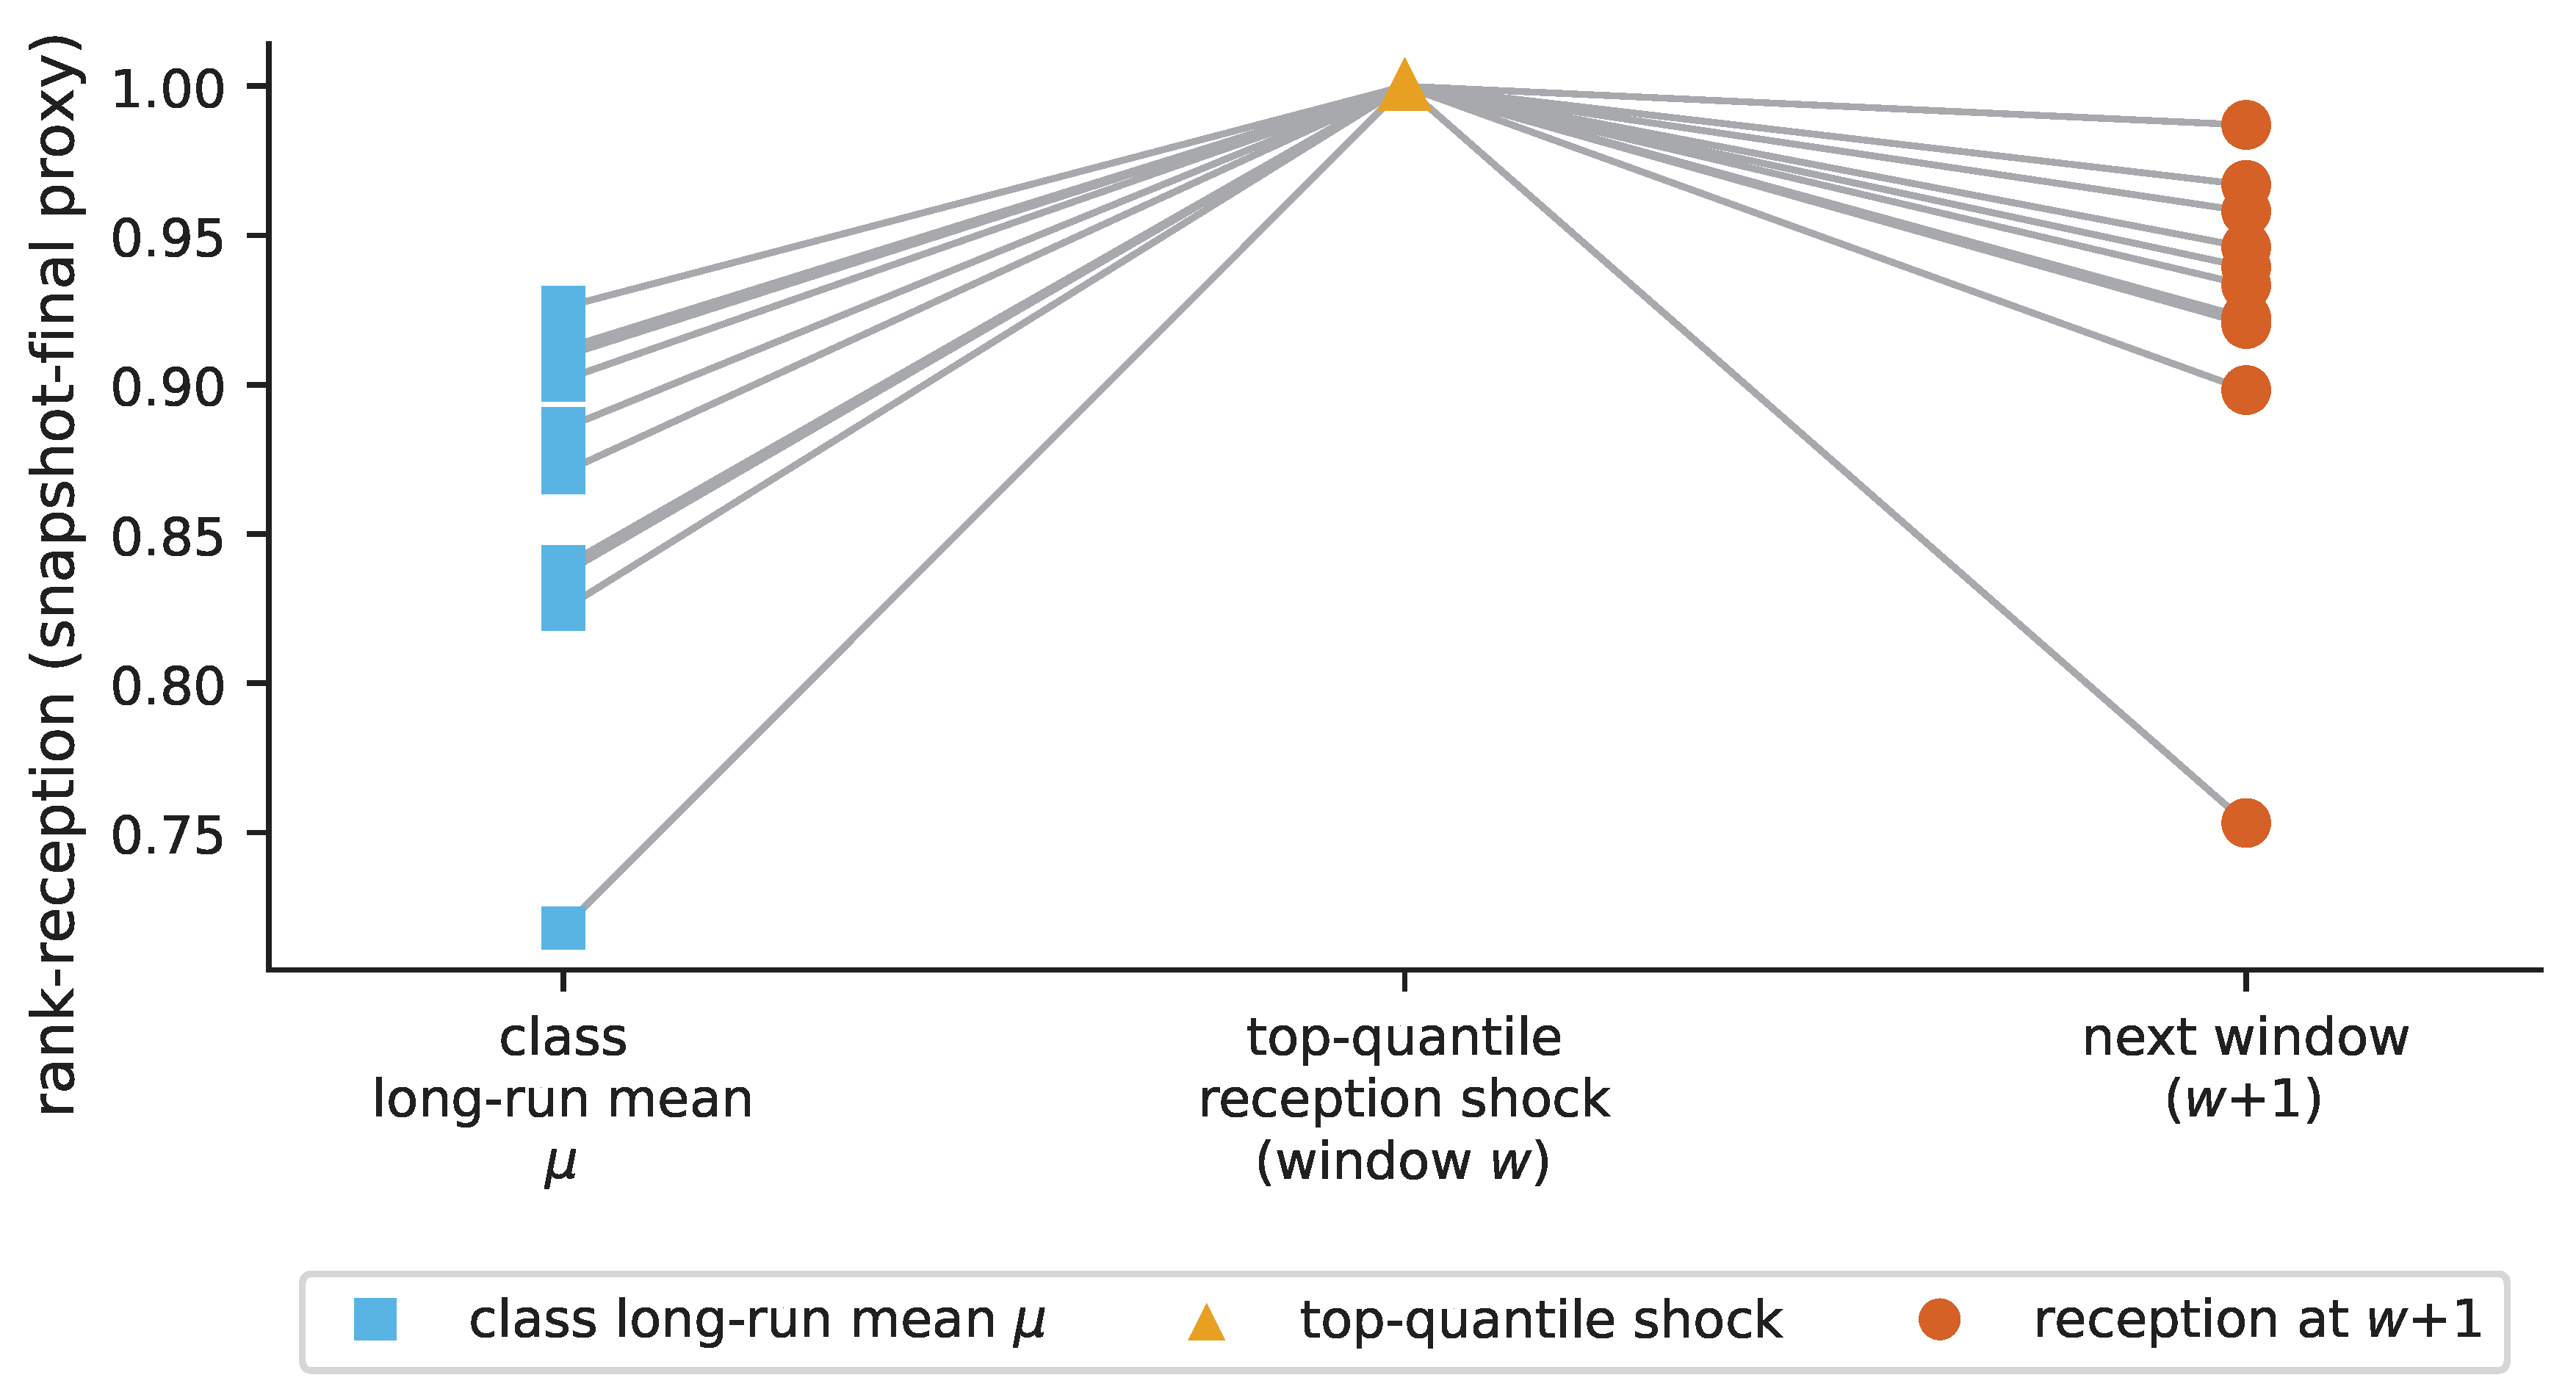
where r t is the rank-reception of a reallocated-toward content class in window t: ϕ 1 would indicate a persistent, rational hold-up, while ϕ < 1 with its bootstrap interval strictly below 1 indicates mean-reversion (a transient response to noise). Within each pre-registered test family, the resulting p-values are converted to Benjamini–Hochberg q-values [61].

3.5. Claim-Level Estimands, Tests, and Decision Rules

Each myth is a broad narrative claim; Table 3 decomposes each into the specific estimand we test, the null hypothesis, the statistical test, the outcome variable, the baseline, and the pre-registered decision rule, together with the evidentiary tier on which the verdict rests. The tiers are not equivalent, and we order them explicitly: matched-baseline contrasts (Myths 1 [in its staffing arm] and 5) are the strongest instrument; direct decompositions with stated bounds (Myth 3) and placebo-gated temporal designs (Myth 4) are intermediate; the placebo-anchored design (Myth 2), forced by the organic baseline’s lack of engagement counts, is the weakest and is flagged as such wherever Myth 2 is discussed. Every myth-level test family was pre-registered (hypotheses, estimators, and decision rules committed to the project repository before model fitting), with forced deviations logged; the desk-level authorship clustering is a pre-registered family with one registered deviation (its model-order selector), while the Linvill–Warren label overlay (Section 4) is a post hoc convergent-validity check, the national-playbook reading is interpretive, and the large-language-model outlook (Section 9) is discussion, not analysis. Appendix B gives the full specification behind every row.

3.6. Measurement Limitations

Three measurement constraints bound the design. The engagement counters are takedown-final snapshots, a proxy we validate where possible but never treat as live telemetry. The external audience of these operations is structurally unobservable: the archives record only the operations’ own accounts, so an outside user who amplified an operation’s content leaves no row, a hard ceiling we return to in Section 6 and Section 10. And the organic baseline’s license forbids redistribution, so only derived aggregate statistics are reported. Each constraint scopes the corresponding claims; Section 10 collects them.

4. Myth 1: “A Monolithic Troll Army”

  • The claim and its provenance.
In popular and policy discourse, the “troll factory” is imagined as a single, unified army acting in concert (Appendix A). The foundational scholarship is in fact more specific: Linvill and Warren, analyzing the IRA’s English-language activity, describe an industrial operation “mass produced from a system of interchangeable parts, where each class of part fulfilled a specialized function,” identifying distinct handle categories [2]. The myth, then, is the popular reading of “troll factory” as one undifferentiated mass; the published account already points toward specialization. Recent network studies reinforce this reading: coordinated communities decompose into behavioral archetypes rather than a single mass [3,4], while reported coordination among separate operations [6] weakens once proper baselines are applied [7]. Our task is to measure that compartmentalization directly and ask what it implies about how the factory is staffed.
  • The test.
We reconstruct each operation’s internal structure from co-activity, shared-infrastructure, and content-overlap networks, validating recovered cells against a degree-preserving rewiring null. We then measure the cross-campaign overlap of narratives, domains, and external retweet targets against a time-matched null and, as a production-side capstone, estimate how many distinct authorial “hands” sit behind each desk [62] using a joint stylometric-and-behavioral clustering with the number of operators selected by prediction strength and bracketed by bootstrap. Three terms recur and are defined here. A desk is a coordination-recovered cluster of accounts: a validated cell of the fused coordination network, reported at eight or more active accounts. A hand is a distinct authorial signature within a desk, recovered by jointly clustering per-account style features (language-aware function-word frequencies, punctuation and emoji rates, lexical diversity, message-length statistics) and behavioral features (posting-client mix, burstiness, inter-tweet timing, diurnal rhythm). The operator estimate k ^ is the largest number of clusters whose split-half prediction strength [63] reaches 0.80 , bracketed by a 50-draw account-level bootstrap; Appendix B specifies the features, algorithm, and selection rule in full.
  • The finding.
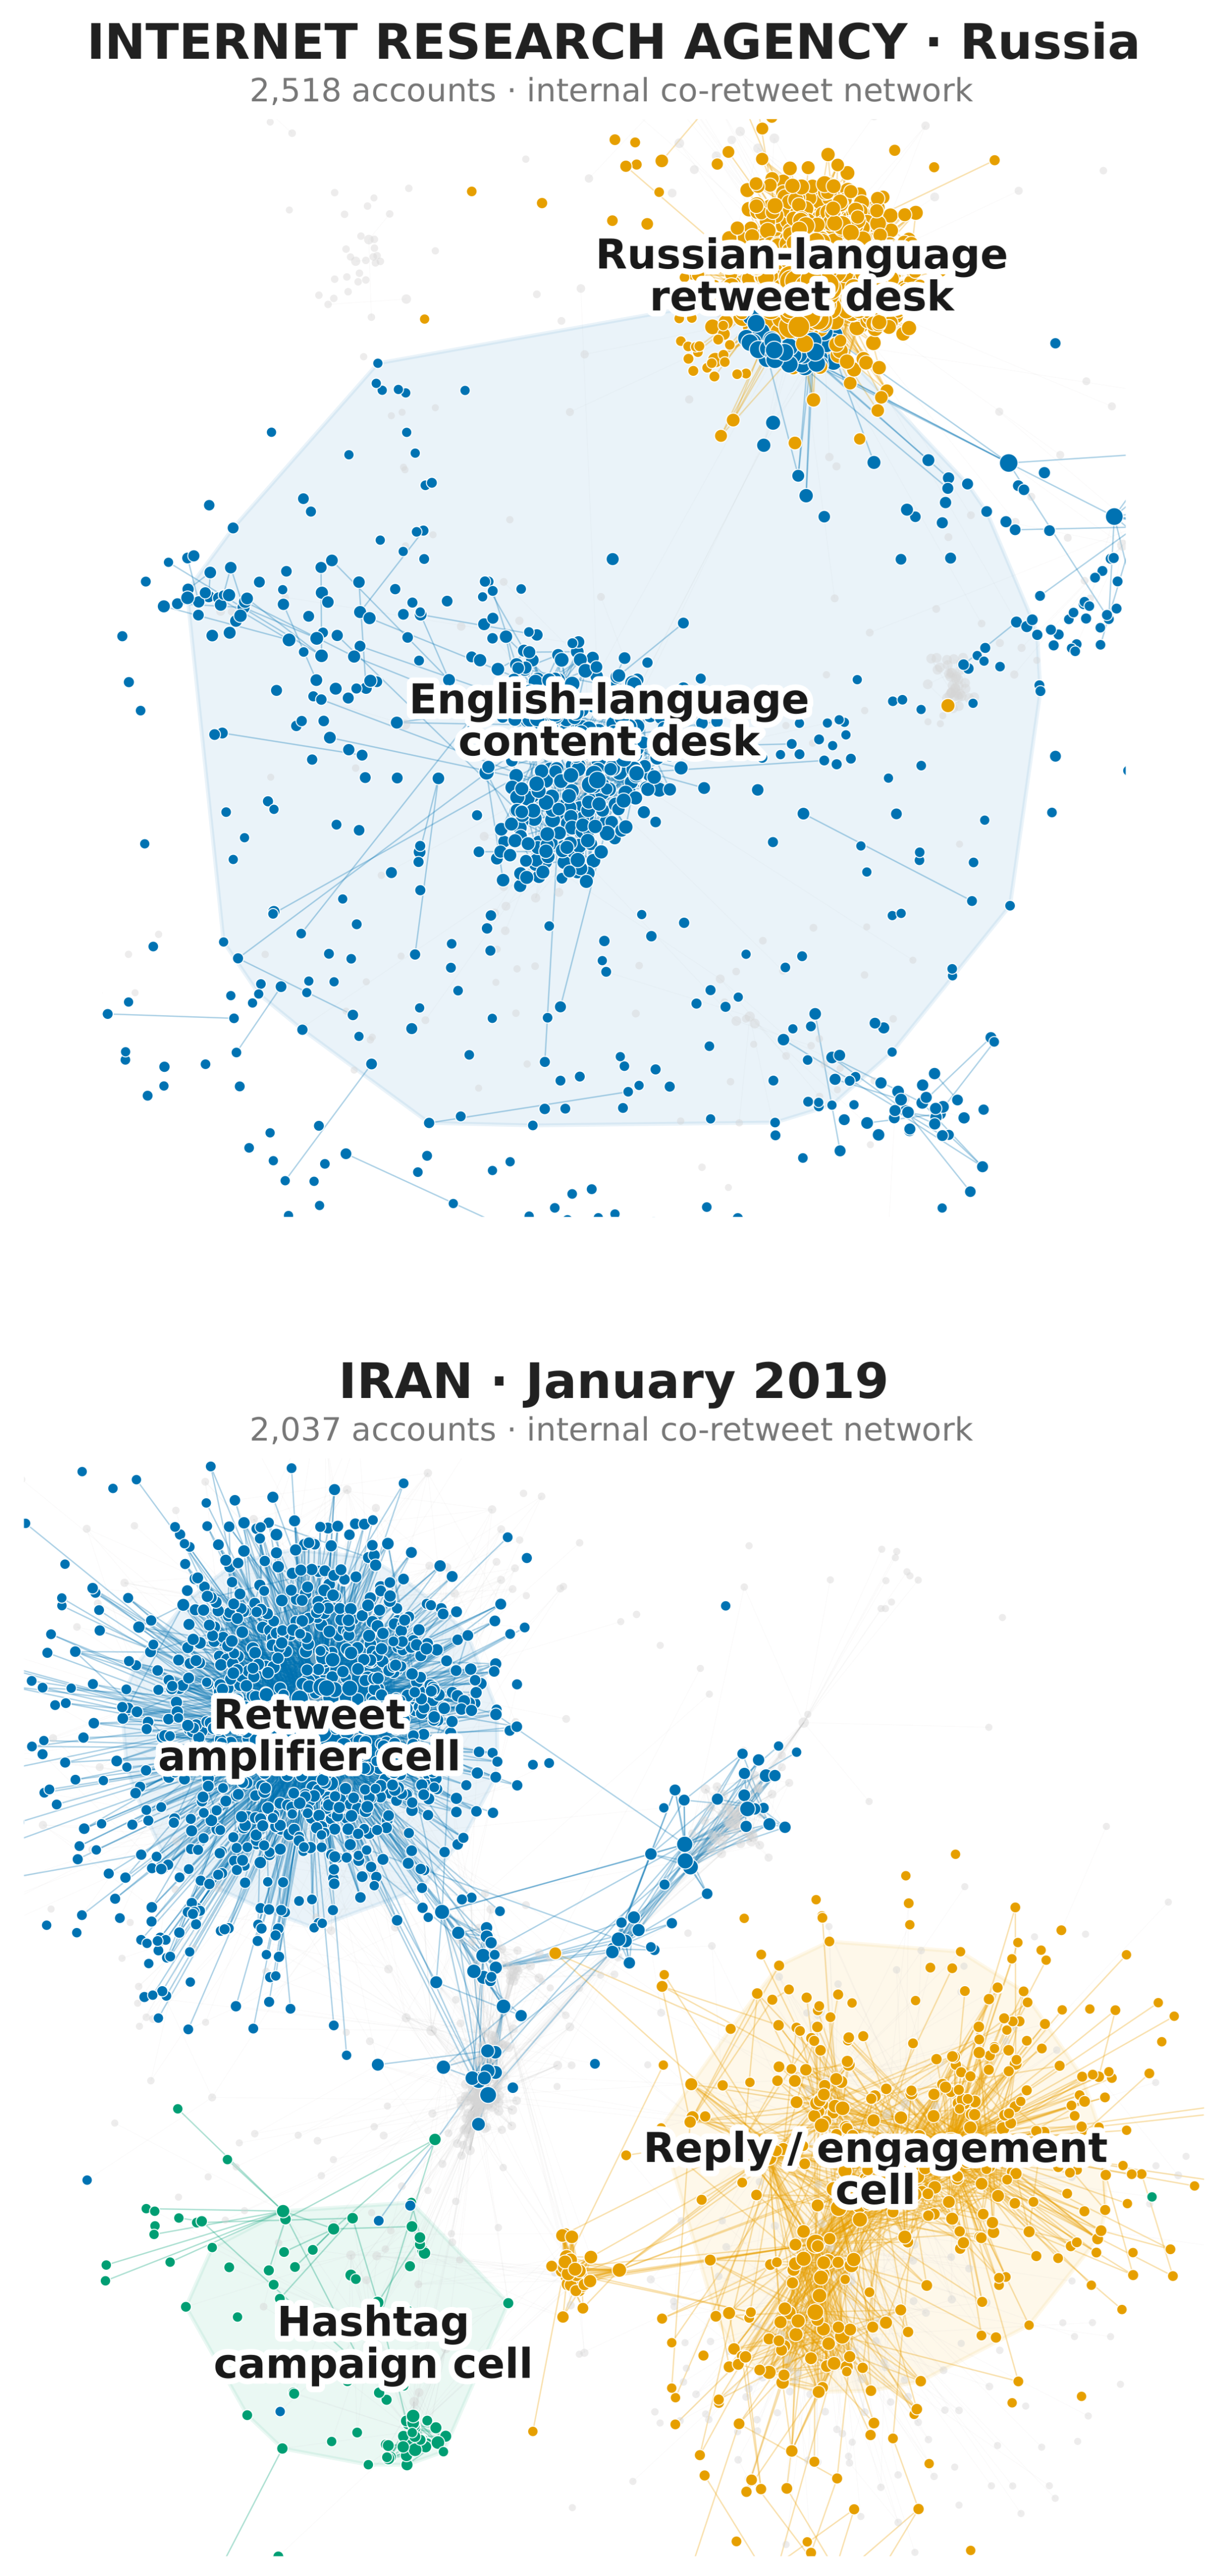
The operations are not one army; they are narratively segregated desks, and the segregation is far below chance. Across the portfolio, cross-campaign near-duplicate narrative spanning is observed at 39,113 shared clusters against a time-matched null of roughly 1,064,682, a lift of 0.037 , i.e., about 27 ×  below chance (Figure 2). Operations share narratives, domains, and external targets less than random pairs would: 12 of 21 campaign pairs share fewer domains, and 14 of 21 fewer external retweet targets, than popularity-matched chance. The internal topology is national-playbook-specific: the Iranian operations are genuinely cellular (one resolves into eight language-aligned consensus cells); the IRA is a single dominant fabric concealing a 569-account Russian-language retweet desk that is Cyrillic-dominant (Cliff’s δ = + 0.61 ), distinct in client mix (Jensen–Shannon divergence 0.54 against a null maximum of 0.01 , p = 0.001 ), yet keeps the same office-hour rhythm as the English side, i.e., one organization running parallel desks. The only reliable cross-campaign link is between the two Iranian operations (shared-domain lift 1.42 , q = 0.018 ; shared external-target lift 1.52 ; six bespoke clients exclusive to the pair). And campaign identity explains roughly twice as much cell-feature variance as automation level (adjusted R 2   0.155 vs. 0.084 ): the desks are campaign-shaped first, automation-shaped second.
  • How many hands.
Behind these large multi-account desks sit notably few operators. A joint style-and-behavior clustering returns a single stable signature ( k ^ = 1 ) for 20 of 33 analyzable desks, with every desk at k ^ 6 ; the two largest IRA desks (1249 and 1100 active accounts) and the largest Venezuelan desks each collapse to a single hand. Because short, multilingual tweets under-individuate authors (the same pipeline collapses organic accounts too), the defensible comparison is the absolute operator count at matched sample size: IO desks carry a median of 3 distinct hands versus 5 for comparable organic crowds (one-sided Mann–Whitney p = 0.023 ). A synthetic positive control confirms the estimator tends to over-split, making “few hands” a conservative reading. Staffing density is itself playbook-specific (a ~ 5 × spread): the scripted IRA and Venezuelan fabrics show the fewest hands per account, the cellular Iranian operations the most. A neural authorship-style representation (LUAR content-independent embeddings) [64], computed independently on the same desks, reproduces the collapse and is if anything sharper (24 of 33 desks at a single neural signature; median one hand in both arms); the two representations agree at the aggregate level but not on the precise per-desk count (Spearman ρ = 0.08 ), so we report “hands” as a range, not a headcount.
  • External staffing evidence.
An independent line of evidence, based on personnel records rather than platform data, supports this staffing picture. Poliakoff and Toepfl analyze 350 curricula vitae that former IRA staff self-published on Russia’s two main job-search platforms between 2013 and 2021 [65]. Their sample is cumulative and organization-wide (the authors state that their data “allow no conclusions about the absolute numbers” of the workforce, and treat 350 as an undercount); its modal role is “content manager” ( n = 194 , 55 % of the sample), the organization resembles a mid-sized media or PR company with a five-level hierarchy, and only 2.8 % of workers explicitly reported using English at work, with the small foreign-targeting departments explicitly untraceable in the CV data. These figures reconcile with ours once the estimands are aligned: a cumulative payroll of hundreds, spread across departments, platforms, shifts, and nine years of turnover, is consistent with our finding that any one Twitter-facing desk was authored by a few concurrent hands, because our k ^ counts concurrently distinguishable authorial signatures per desk, not the organization’s headcount. Their observation that English-capable staff formed a small sliver of the payroll independently corroborates the thin staffing that our stylometric collapse recovers for the English-language desk.
  • Convergent validity against independent hand labels.
Because Linvill and Warren assigned each IRA account to a functional category by hand [2], their labels furnish an external check on desks we recovered from coordination and style with no access to those labels. Matching their public account-category release to the IRA arm by screen name returns a role for 2604 of our IRA accounts (91.6% of their distinctly labeled handles; the shortfall concentrates in the RightTroll category, consistent with its heavier suspension and handle turnover). The hand labels fall along our recovered structure rather than across it (Table 4). The two giant single-hand desks split by language exactly as the manual categories do: the Russian-language desk (giant hand #2) is essentially entirely NonEnglish, while the English-language desk (giant hand #1) absorbs all four English functional categories—RightTroll, LeftTroll, HashtagGamer, and Fearmonger. Two readings follow. First, a desk reconstructed without the hand labels reproduces the first cut an independent team drew manually. Second, and more consequentially, that single English desk is one stylometric hand yet co-hosts all four English categories: the much-discussed handle “types” are job functions resident in a single authoring desk, not separate armies—real at the level of content function, collapsed at the level of authorship. The lone partial exception, NewsFeed (automated headline-amplifier accounts), sits mostly in smaller desks, consistent with a low-coordination feed function rather than a manned role. This check is confirmatory and IRA-only—no comparable external hand-labeling exists for the other operations—and alters no primary estimate.
  • Scoped takeaway.
These operations are compartmentalized productions run by few operators executing national playbooks, not a unified army. This finding extends rather than contradicts the specialization Linvill and Warren first described, and quantifies just how thinly the factory is staffed.
  • The architecture, drawn.
Figure 3 renders this compartmentalization directly for the two largest operations. Each node is an account and each edge a within-operation co-retweet; node color marks the largest coordination desks the clustering recovers, and node size scales with within-operation degree. The IRA (top) is a single dense fabric that nonetheless braids two co-equal desks: a low-retweet, hashtag-driven English-language content desk and a high-retweet, link-amplifying Russian-language desk—the same D0/D1 division that the Linvill–Warren overlay in Table 4 independently labels English versus non-English. Iran (January 2019, bottom) instead resolves into functionally distinct cells—a retweet-amplifier cell, a reply/engagement cell, and a hashtag-campaign cell—rather than one undifferentiated mass. The two operations are wired along visibly different national playbooks, yet each is a compartmentalized production floor of specialized desks rather than a unified army; the contrast between a single braided fabric and a set of separated cells is exactly the national-playbook specificity the cell statistics report.

5. Myth 2: “Wins via Emotion/Moral Outrage”

  • The claim and its provenance.
Having established what the factory is, we turn to what it produces and whether that content earns attention. The general principle is Brady and colleagues’ moral-contagion law: in organic networks, each added moral-emotional word is associated with substantially greater diffusion [8], an effect whose expression is itself amplified by social-feedback learning [9]. The belief that this law drives influence operations has been instantiated directly on real troll data: analyzing the released IRA Twitter corpus, Suk and colleagues report that “negative tweets had 1.206 times the rate of retweets than those without negative sentiment” [16], and the policy literature describes the operations as engineering emotionally resonant memes and human-interest content for spread [26] (Appendix A). There is also independent reason for caution: Burton, Cruz, and Hahn show that the contagion model can perform no better than an implausible alternative [10], precisely the fragility we test for inside state propaganda. A large pre-registered replication and meta-analysis by the original authors likewise finds the effect positive but small and heterogeneous, even reversing sign in one corpus [11], while adjacent work locates the engagement lever in out-group animosity [12] and negativity [14] rather than in moral-emotional content as such.
  • The test.
On the 16,459,645 original (non-retweet) tweets in the corpus, we fit the moral-emotional reception model per operation, never pooled. The moral-emotional predictor is the per-tweet count of matches against the moral-emotional word list of Brady and colleagues [8], standardized per standard deviation; the engagement outcome is the tweet’s external retweet count (the snapshot retweet counter net of retweets by the operation’s own accounts), with like counts as a co-primary outcome (the Russian hub, whose like and retweet counters collapse to near-identity, is read on likes). The model is a fixed-effects Poisson regression with account and year fixed effects, controls for tweet age, URL/hashtag/mention presence, automation decile, near-duplicate cluster size, and standard errors clustered by account; each estimate is reported across a nine-specification curve (three covariate sets crossed with three outlier-trimming rules). Appendix B gives the full specification. We report two moral-foundations dictionaries side-by-side, never averaged because they genuinely diverge (mean Spearman ρ = 0.25 ), and, critically, an XYZ letter-count placebo: the count of occurrences of the letters x, y, and z in the tweet text (after removing URLs and mentions), standardized identically and entered into the identical model. This deliberately meaningless feature, introduced by Burton and colleagues in their re-analysis of the moral-contagion evidence [10], is the test’s diagnostic instrument: it has no plausible psychological mechanism, so if it earns an engagement coefficient comparable to or larger than the moral-emotional feature on the same sample, a positive moral-emotional coefficient cannot be read as evidence of moral contagion; it shows instead that, at this corpus size, baseline-free significance attaches even to noise.
  • The finding.
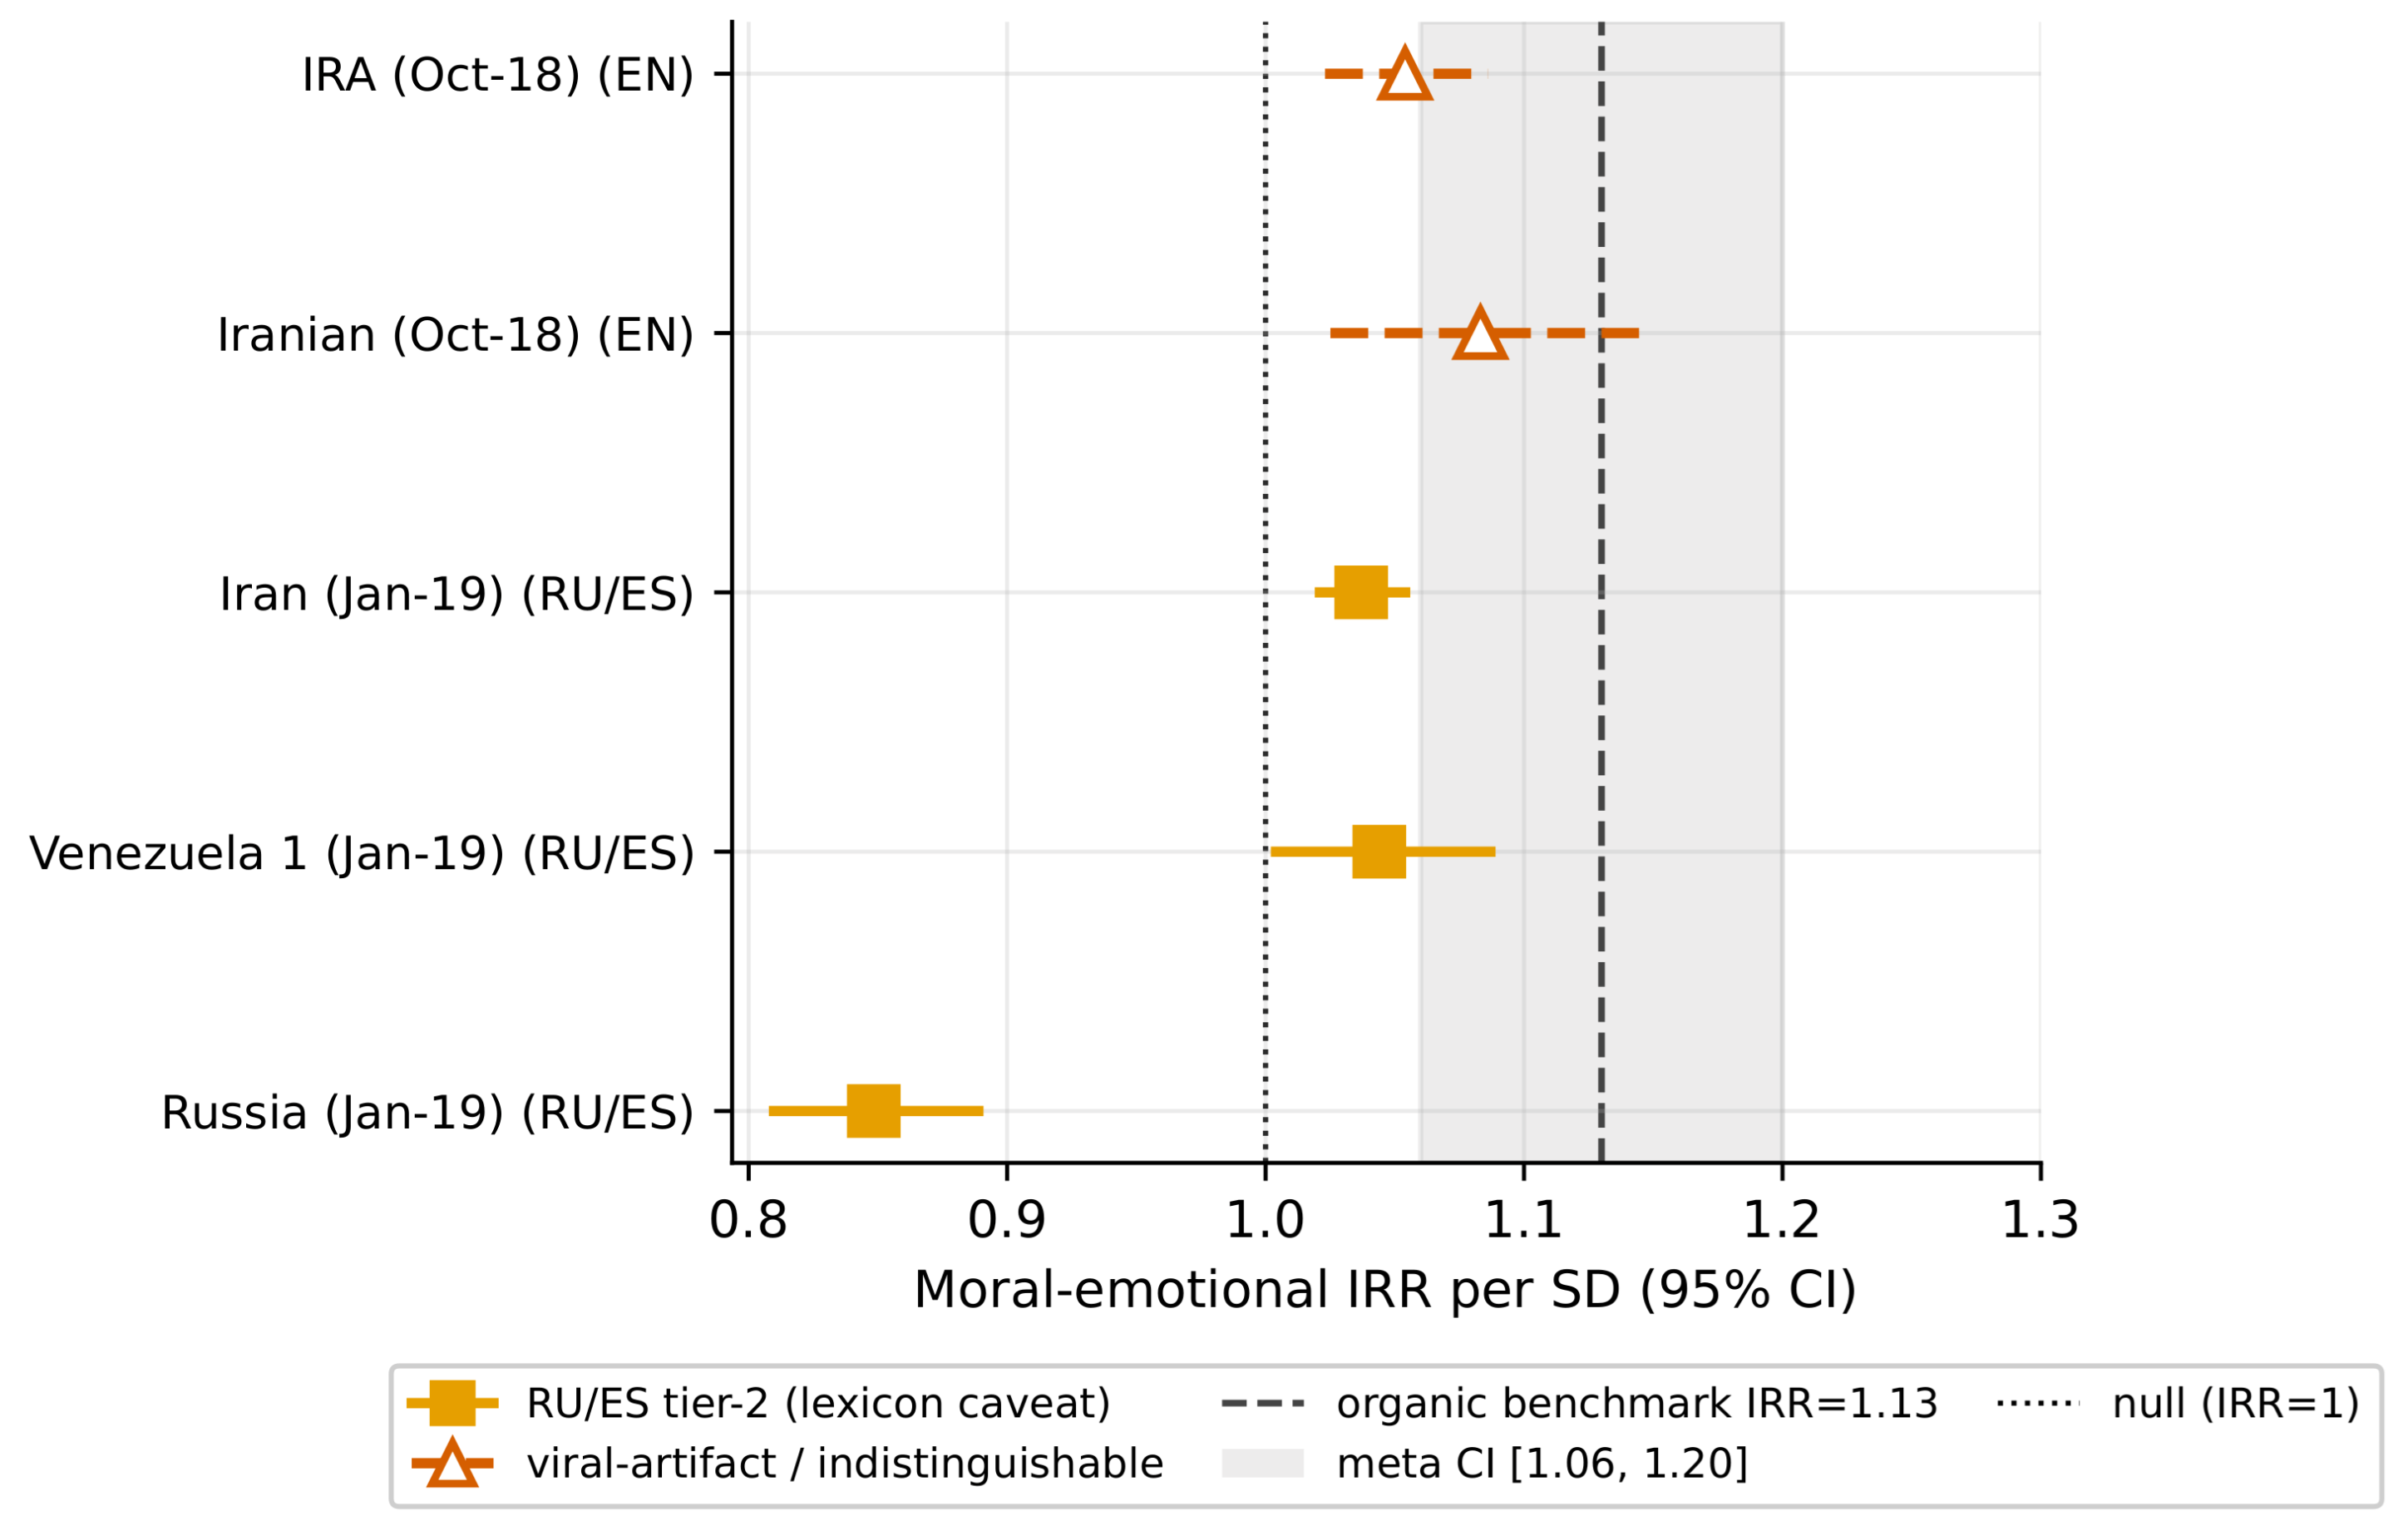
The organic moral-contagion law does not replicate in any operation (Figure 4). Against an organic anchor incidence-rate ratio (IRR) of about 1.13 , the Russian operation sign-reverses: moral-emotional wording is associated with less engagement net of persona (IRR 0.848 , 95% CI [ 0.810 , 0.889 ] , 0 of 9 specifications positive), while its XYZ letter-count placebo is strongly positive ( 1.537 ). The corpus manufactures a spurious positive effect for a meaningless feature even where morality is genuinely negative. The Iranian (Oct-2018) operation’s moral effect (IRR 1.083 , [ 1.025 , 1.145 ] ) is statistically indistinguishable from its XYZ letter-count placebo ( 1.103 , [ 1.053 , 1.155 ] ). The remaining operations are weakly positive but below the organic anchor and outside its confidence interval (Iran 1.037 , Venezuela 1.044 ), or at the reception floor. This is the “large-corpus mirage” Burton and colleagues warned of, demonstrated inside state propaganda: on samples this large, baseline-free significance attaches to noise.
  • Scoped takeaway.
Moral-emotional language does not predict reception in these campaigns’ data, and a meaningless placeholder predicts as well. This is a claim about these operations and this measurement, not that affect or morality is irrelevant to virality in general. One methodological caveat distinguishes this myth from the others: because the organic baseline lacks engagement counts (Section 10), Myth 2 alone is placebo-anchored rather than baseline-anchored. We do not contrast IO against a like-for-like organic reception model; instead, the XYZ letter-count placebo shows that the apparent moral-emotional effect is not feature-specific: a meaningless placeholder earns the same or larger coefficient on the same samples. That is sufficient to defeat the specific claim (that morality drives reception in these operations) without resting on a within-corpus positive, but it is a weaker instrument than the matched-baseline contrasts that carry Myths 1, 3, and 5, and we flag it as such. If anything, the prior literature sharpens the result: even the IO-specific instantiation finds sentiment to be one driver among informational and topical ones, with positive sentiment slightly suppressing retweets [16], so the belief we test is narrow, and it does not hold here.

6. Myth 3: “Manufactures Its Own Virality”

  • The claim and its provenance.
A central image of influence operations is sockpuppet self-amplification: the operation engineers its own viral ignition (Appendix A). This mechanism is well-established in the diffusion literature: automated accounts amplify low-credibility content, especially early in a cascade and by targeting influential users [17], and coordinated accounts can boost a cascade’s reach up to a saturation threshold [18]. Against this, linked exposure studies find that Russian IRA reach was concentrated among a few partisan users and dwarfed by domestic media, with no measurable attitudinal effect [23], that differential spread is carried more by human resharing than by automation [19], that automated accounts are less central to diffusion than verified or high-profile human accounts [20], and that amplification, where present, often runs through a cross-platform laundering of external media [51]. The question is how much of these operations’ actual viral reach this internal machinery accounts for.
  • The test.
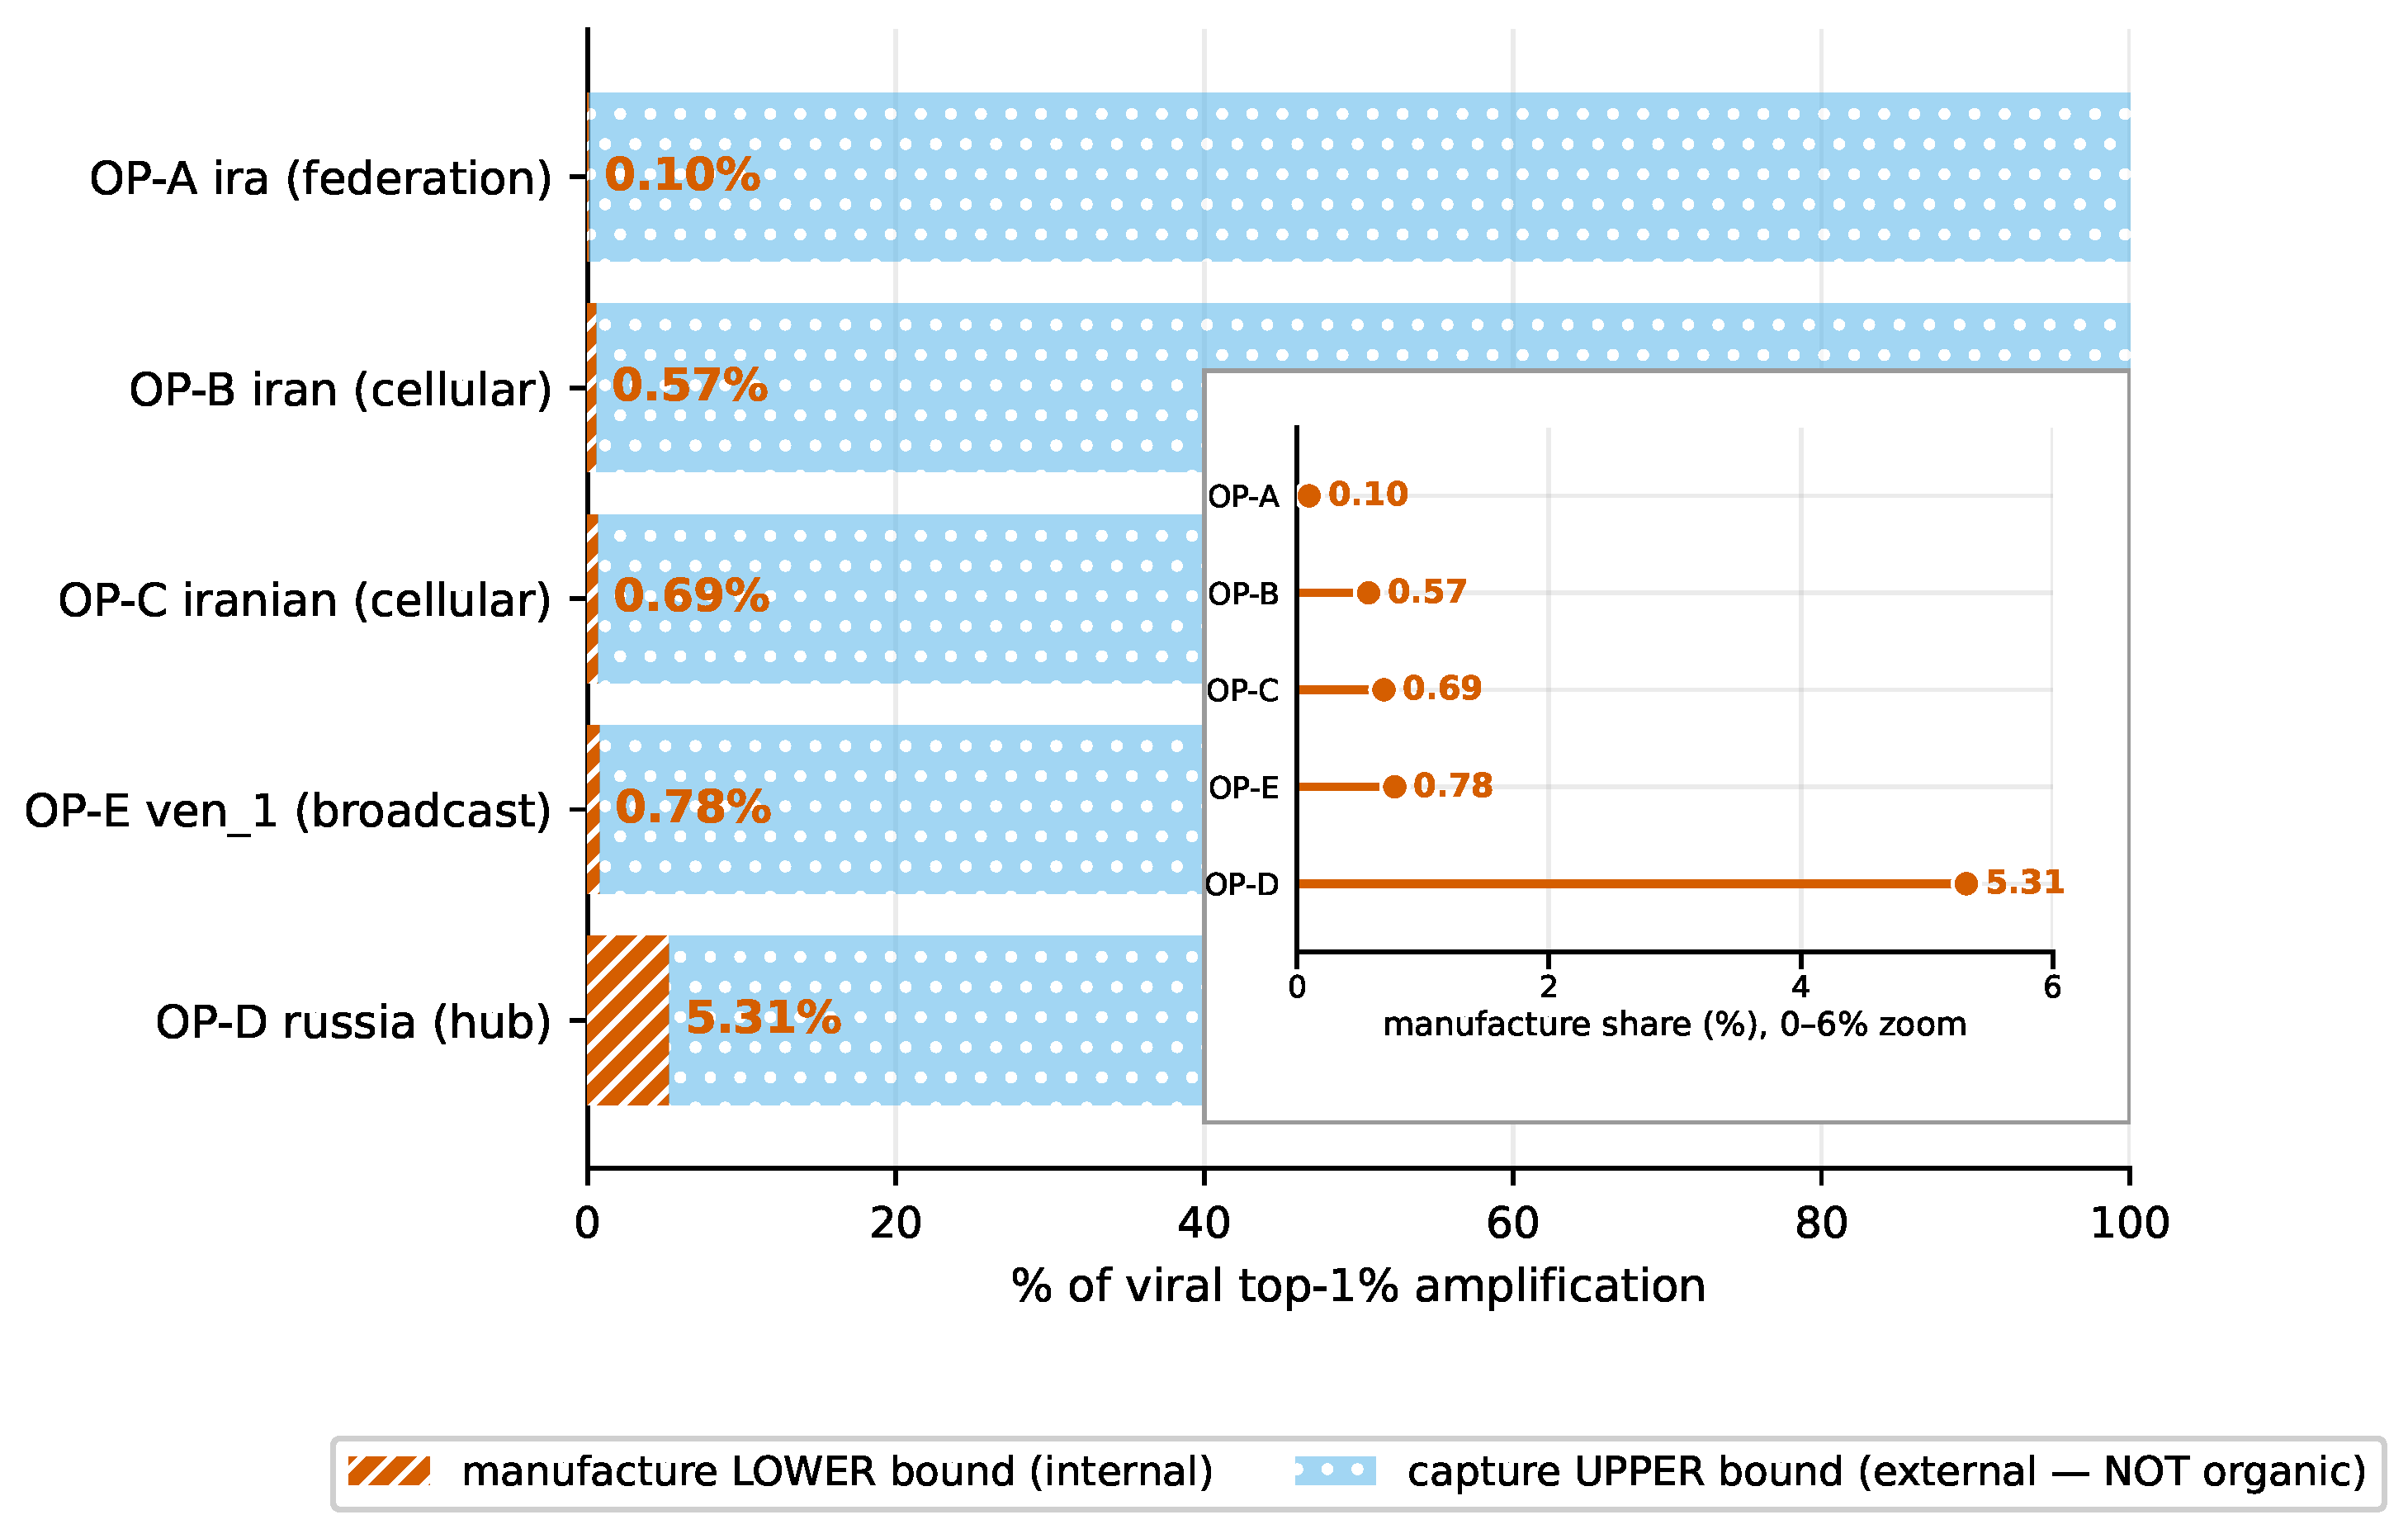
The decomposition proceeds in four defined steps; Appendix B states each in full. First, viral originals are each campaign’s top 1 % of original tweets ranked by external reach (top 0.1 % and top decile as robustness tiers). Second, internal amplification is counted directly from the archive’s retweet edges: the number of retweets of that original emitted by the operation’s own released accounts. Third, external reach is snapshot-dependent. For the IRA, whose frozen retweet counters reconcile exactly with the archive’s internal retweet edges, external reach is the snapshot counter minus the internal count, a clean subtraction. For the other campaigns, the frozen counters already exclude retweets from co-suspended accounts, so the counter itself serves as an internal-stripped external bound, and subtracting again would double-remove; these external figures are upper bounds on capture and the internal shares are lower bounds on manufacture, and are labeled as such. The manufactured share of an original is internal amplification over internal-plus-external. Fourth, to ask whether the internal amplification that is present looks like synchronized ignition or diffuse after-the-fact sharing, we define within-author seeding synchrony as the share of an original’s internal retweets that land in a one-minute bucket containing at least two distinct amplifying accounts, and fit a within-author fixed-effects Poisson regression of external reach on this share (standardized per standard deviation, standard errors clustered by account). The pre-registered reading is that a robust positive association is the signature of manufactured ignition, while a negative or null association indicates diffuse post hoc sharing.
  • The finding.
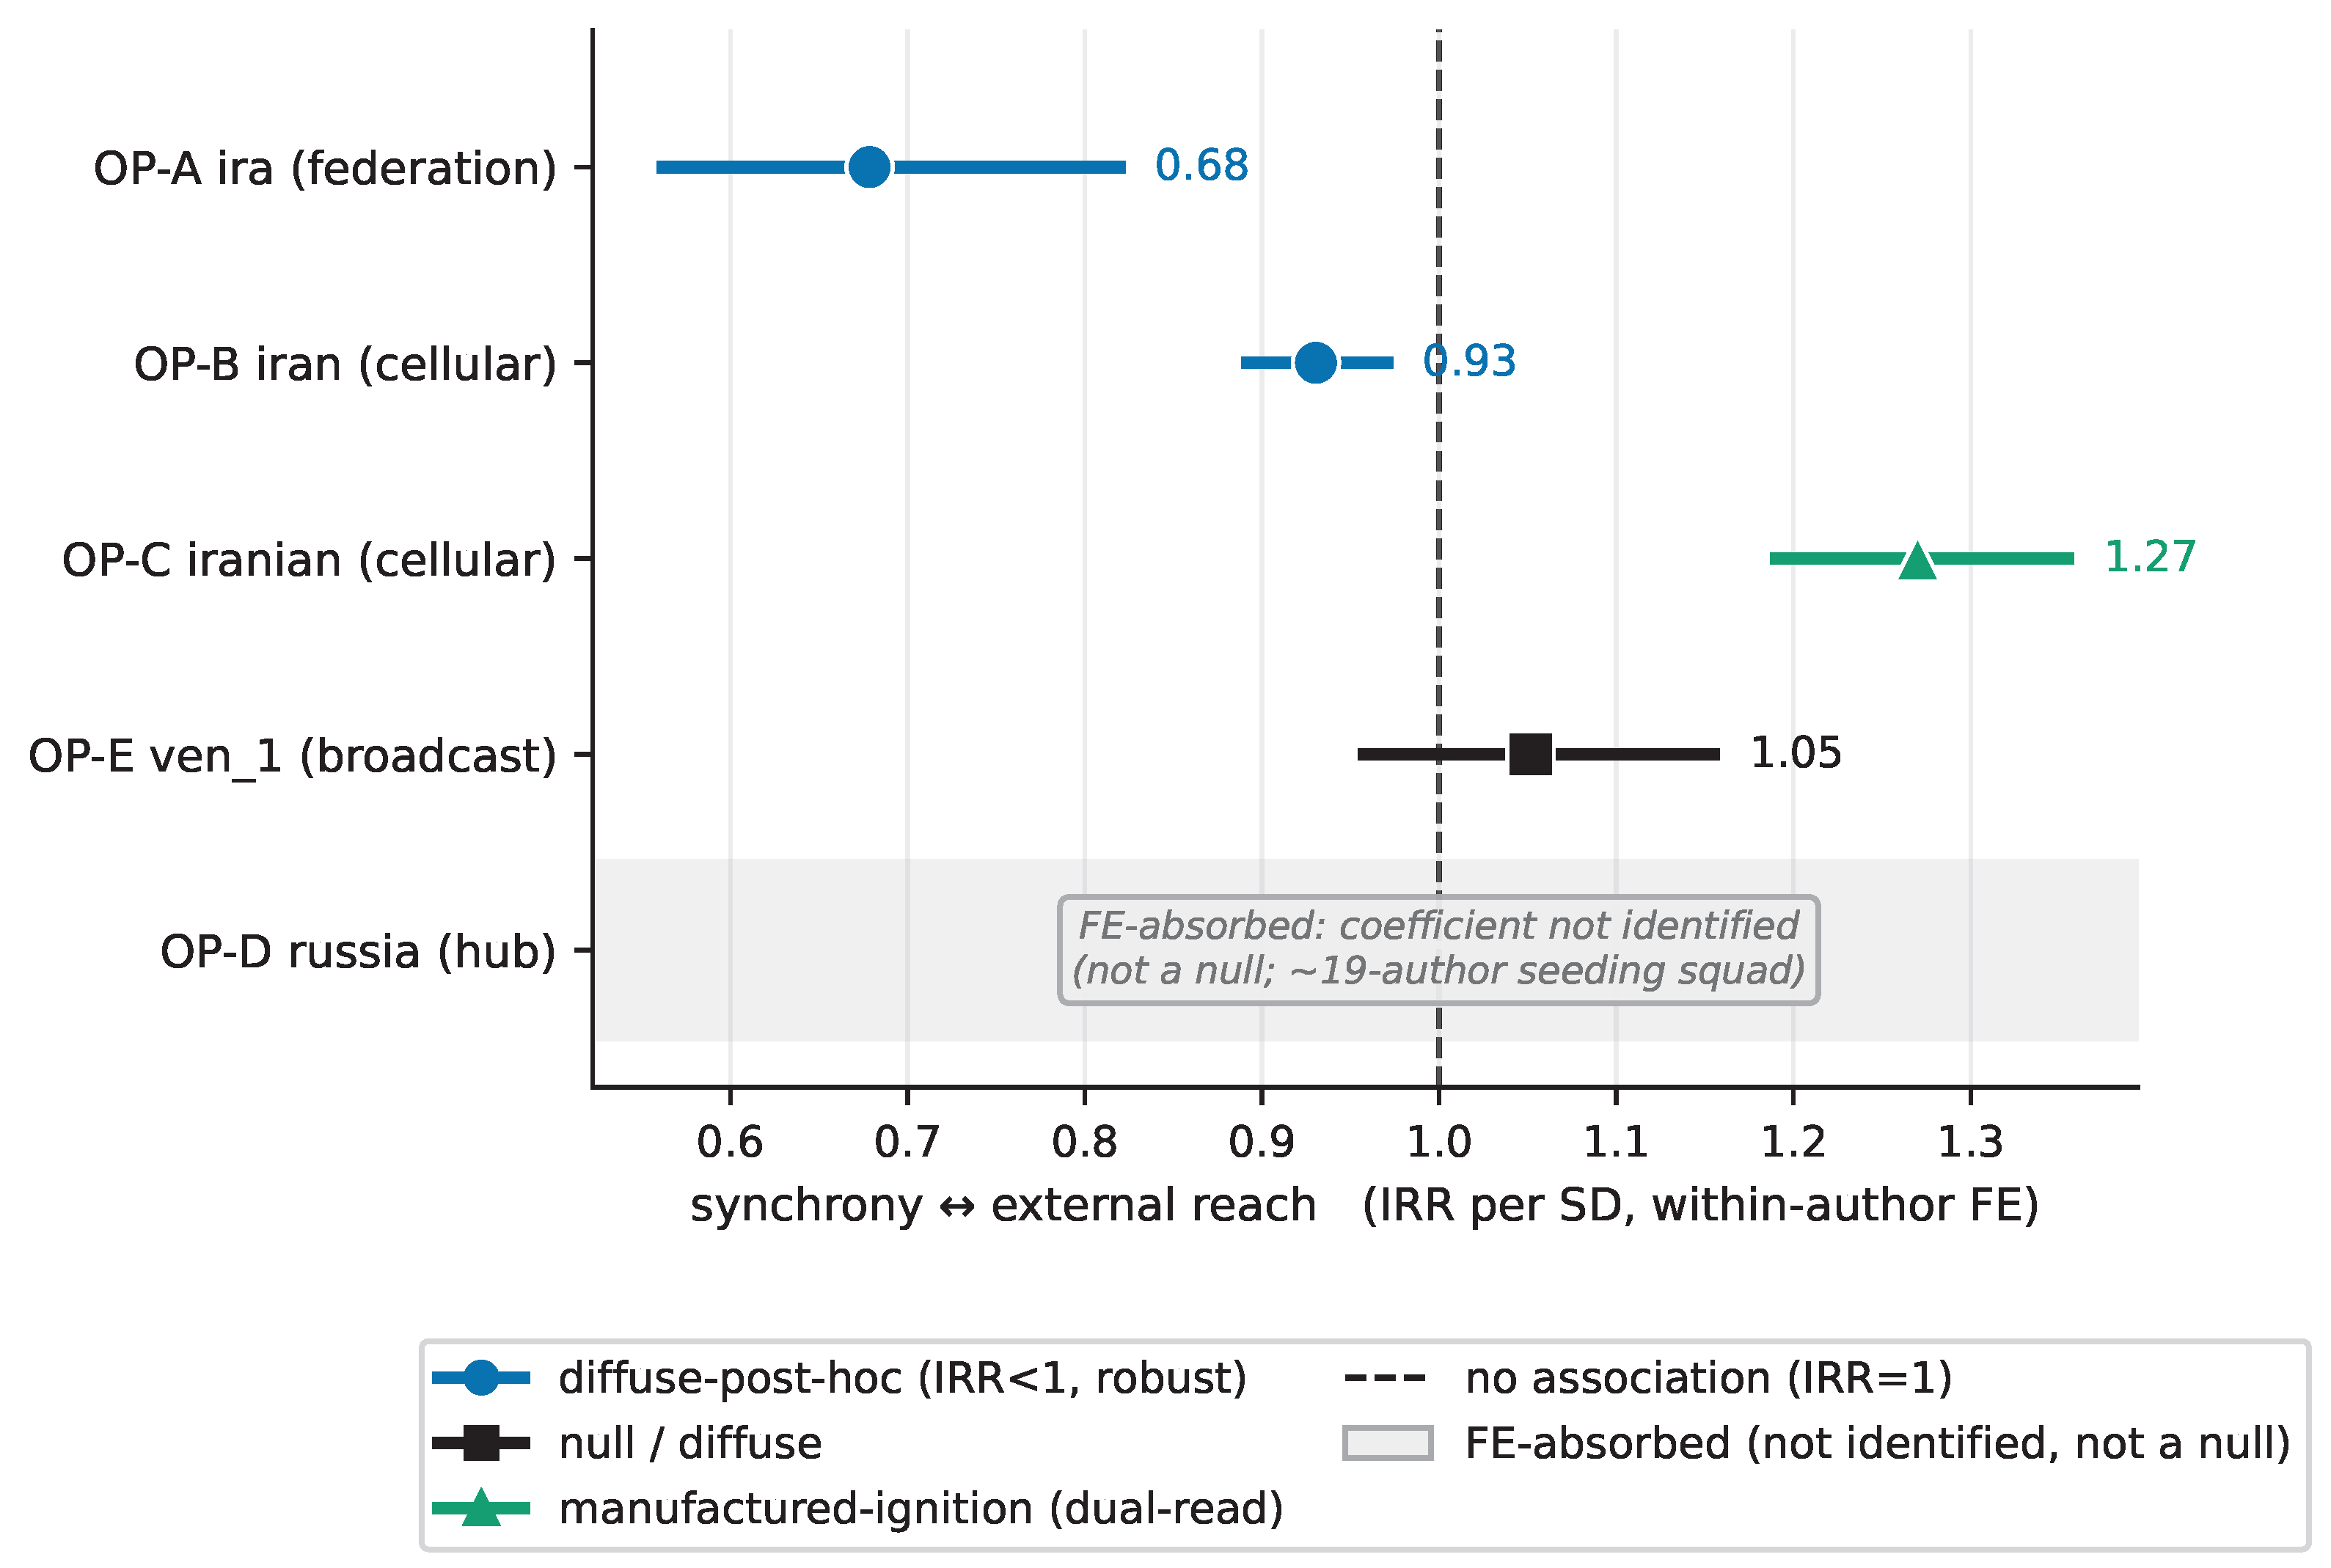
Internal manufacture is a small fraction of viral reach (Figure 5). Across operations, it supplies 0.10 % (IRA), 0.57 % (Iran, Jan-2019), 0.69 % (Iranian, Oct-2018), 0.78 % (Venezuela-1), and 5.31 % (the Russian hub) of top-percentile reach; the captured share is therefore ≥99.2% everywhere except the Russian hub ( 94.7 % ), while the per-original median manufactured share is 0 in every stratum, consistent with prior findings that the bulk of state-propaganda dissemination is carried by ordinary users rather than the operation’s own accounts [21], and that dissemination of low-quality content concentrates in a small set of ordinary “supersharer” users [22]. Internal amplification is enriched among the winners ( 1.7 12.5 × ), but enrichment is consistent with either manufactured ignition or undetected external coordination, and it does not account for the reach. The enrichment looks like diffuse post hoc sharing, not synchronized ignition (Figure 6): within-author seeding synchrony is associated with fewer external accounts, not more, in the IRA (IRR 0.68 , q = 0.0004 ) and Iran ( 0.93 , q = 0.003 ), null in Venezuela, and positive in only one operation, the confirmed Iranian (Oct-2018) operation (IRR 1.27 , q < 10 11 ), the lone ignition-like signature. (This ignition result, and the cellular Iranian structure noted under Myth 1, both derive from the operations’ own released archives; the provisional Iranian mapping noted in Section 3 concerns only the matched-control contrast of Myth 5, where it is flagged in place.) Within-author seeding synchrony here means same-author co-timed posting; it is distinct from the cross-account same-minute synchrony that distinguishes IO from organic users under Myth 5: the former anti-predicts reach, the latter marks inauthenticity. External reach tracks the breadth of amplifiers, not their same-minute synchrony. Producer and amplifier roles are distinctly divided by playbook (Cramér’s V = 0.304 , a moderate association), from a 12-account Russian seeding squad to a 717-account Iranian one.
  • Scoped takeaway.
Reach in these operations is captured, not manufactured, which is not “no reach.” We state the bounding limit plainly and quarantine it in Section 10: because the archives record only the operations’ own accounts, the external pool cannot be split into genuine organic uptake versus undetected coordination that the corpus sees only the internal tip of. The captured/manufactured contrast holds; the internal composition of the captured share is not resolvable here.

7. Myth 4: “A Sophisticated, Optimizing, Adaptive Adversary”

  • The claim and its provenance.
Having found that reception (Myth 2) and viral reach (Myth 3) lie largely outside these operations’ control, we now ask whether they nonetheless reallocate toward them. The operations are widely described as learning machines that optimize against feedback (Appendix A). The authoritative policy account portrays the IRA as “run like a sophisticated marketing agency” that “developed their content using digital marketing best practices” [26], and the doctrine literature calls Russian propaganda “remarkably responsive and nimble” [25]. The academic literature makes a weaker, temporal claim (that tactics, language, and identities change over time [27,28], which we do not dispute), while our own prior work finds trolls act “regardless of the feedback” they receive from genuine users [29] and that automated accounts lack the time-varying behavioral dynamics that characterize genuine human activity [30]. Consistent with a scripted reading, a campaign-agnostic classifier across nineteen state operations attributes their detectability to shared, templated tactics [31], field experiments find no measurable persuasive effect from IRA contact [24], and even large-language-model microtargeting does not reliably outperform untargeted messaging [34,36]. We test the strong belief: do operators reallocate content toward what earns reception?
  • The test.
The design asks a defined question: does a campaign shift its output toward the content classes that earned reception in preceding weeks? The unit of analysis is a cell: one campaign crossed with one behavior axis and one reception channel (retweets or likes). Eleven behavior axes are tested, spanning surface presentation (URL, hashtag, and mention inclusion; message-length bin; time-of-day; script; language) and content (moral-emotional load; frame, agenda, and target classes), giving 110 feasible operation-level cells. Within each cell, campaign activity is divided into windows (weekly for five campaigns; biweekly for the sparser Russian hub), and the behavior outcome is the prevalence share of each class within its axis and window. The model is a fractional logit regression of next-window prevalence on the class’s reception rank (the percentile rank of the class’s mean engagement among that window’s classes, a snapshot-robust transform of the frozen counters) at lags one to three, with class fixed effects, an autoregressive prevalence term, and a linear trend; inference uses a permutation null of at least 1000 draws with Benjamini–Hochberg control per campaign and channel. Each cell then passes a pre-registered four-step gate. A cell is feedback-consistent only if (i) its summed past-reception coefficient is positive and significant against the permutation null, (ii) the model beats an identical specification without the reception terms, and (iii) the future-reception placebo separates: the coefficient on next-window reception, estimated in the same specification, is smaller than half the matched past coefficient in absolute value. Cells failing (i) are scripted; cells failing (ii) are absorbed by trend and autocorrelation; cells failing (iii) are trend artifacts, an apparent adaptation that is time-symmetric and therefore cannot be feedback. For the cells that survive, we ask whether reception-chasing yielded a durable benefit, regressing the favored class’s next-window reception rank on its current rank (a Galton mean-reversion regression, with a 2000-iteration moving-block bootstrap): a slope near 1 would indicate a durable hold-up of the gained reception; a slope below 1 indicates the gain decays. Appendix B states every term.
  • The finding.
The operations are scripted, not feedback-adaptive (Figure 7 and Figure 8). Of 110 feasible operation-level cells, only 9 ( 8 % ) are genuinely feedback-consistent once the placebo is applied; 18 ( 16 % ) are the corpus’s largest apparent-adaptation coefficients, unmasked by the placebo as time-symmetric trend; and 83 ( 76 % ) are flat. Eight of the nine surviving cells are surface-presentation axes (whether to include a URL, hashtag, or mention), never content; the cleanest case, the share of IRA originals containing a URL, shows the canonical signature (past-reception coefficient + 1.3 , placebo coefficient slightly negative). And every feedback-consistent cell mean-reverts: Galton coefficients of 0.17 0.70 with every bootstrap interval strictly below 1, a median 52 % of each reception shock reverting within one window, and transient responses to noise rather than durable optimization, with no durable retention of the reception gain. The IRA shows content drift negatively associated with its own reception gradient: it moves away from, not toward, the agendas that earned the most engagement. Feedback, where present, is centralized at the operation or desk level and essentially absent at the account level (the feedback-consistent count collapses 9 6 2 from operation to desk to account). Without the placebo, the 9 genuine cells and the 18 trend artifacts together would have read as some 27 “learning” cells.
  • Scoped takeaway.
These operations are playbook-executed, not feedback-adaptive. We use “learn” descriptively, never as a claim of cognition or operator intent, and all relationships are associational. Scripted is not the same as harmless, and it sets a baseline: an adversary that genuinely optimized against reception, as large language models now make feasible [38,66], would look measurably different from this. That contrast is a forward warning, not a present finding.

8. Myth 5: “Indistinguishable from Real Users” (And Its Mirror, “Still a Crude 2016 Troll”)

  • The claim and its provenance.
Two opposing folk beliefs coexist, both widely circulated in news and policy reporting (Appendix A). One holds that modern IO accounts are individually indistinguishable from real users: the human-operated troll accounts in coordinated networks “present traits more similar to regular users” and lack the synchronization signatures of bots, so that loose coordination, not individual features, is what detection must target [41]; our own clustering work similarly finds trolls “appear indistinguishable” on behavior and intermingle with genuine accounts [29,40]. The other holds that operations remain catchable by 2016-era linguistic fingerprints: behavioral and linguistic signatures separate trolls from users at high accuracy [42], content-based features generalize across campaigns and platforms [44], and dozens of deception-linked language markers achieve strong classification [43]. Recent detectors bear out both halves of this tension: cross-campaign linguistic drift forces continual model adaptation [45,46], while fused coordination signatures remain the durable tell [48,49]. We test both against the matched organic baseline.
  • The test.
On the five campaigns with a matched control arm, we re-compute the 49-cue deception fingerprint and a battery of coordination-network detectors in the family established for uncovering coordinated activity [47] (same-minute synchrony, copypasta text similarity, co-retweet synchrony, co-hashtag) for IO versus matched real users. Each detector has a fixed operational definition, frozen across both arms with no re-tuning: same-minute synchrony counts one-minute buckets in which two accounts are co-active; copypasta similarity clusters near-duplicate originals at a character five-gram Jaccard similarity of at least 0.71 (minimum 25 characters and 4 tokens); co-retweet synchrony links accounts that retweet the same tweet within one minute, at a floor of ten distinct co-retweeted tweets; and co-hashtag activity links accounts by hashtag co-use with analogous floors. Appendix B tabulates every threshold, and Appendix C reports the sensitivity of the contrasts to the detector windows, similarity tiers, and control-draw counts. Because the baseline draws are budget-limited (ten matched draws give a one-sided p-floor of 0.0909 ), a contrast is declared abnormal only when the 95 % confidence interval excludes 1 and the ratio exceeds 1.
  • The finding.
The language has evolved off the 2016 fingerprint, but the coordination has not (Figure 9). The deception fingerprint only partially replicates (mean sign-agreement 0.54 across the confirmed five, ranging 34 % 66 % ): the “non-immediate, low-affective stance” markers persist, but the conversational markers the 2016 literature relied on (questions, punctuation, hashtags) reverse, with IO using fewer in every campaign. Modern IO in this corpus is more moralized and more negatively emotional than organic users while being less conversational, the opposite of the 2016 high-hashtag, high-engagement conversational profile. Nevertheless, on coordination, the operations are abnormal relative to matched real users: same-minute synchrony runs 7.7 70.3 × organic, copypasta similarity 2.2 16.4 × , and co-retweet synchrony 15.7 35 × in the powered campaigns, while co-hashtag, as pre-registered, realizes the predicted negative-control null ( 0.73 1.0 × , never above 1) in every campaign, confirming that the matched baseline did not manufacture the contrasts.
  • Cross-national replication.
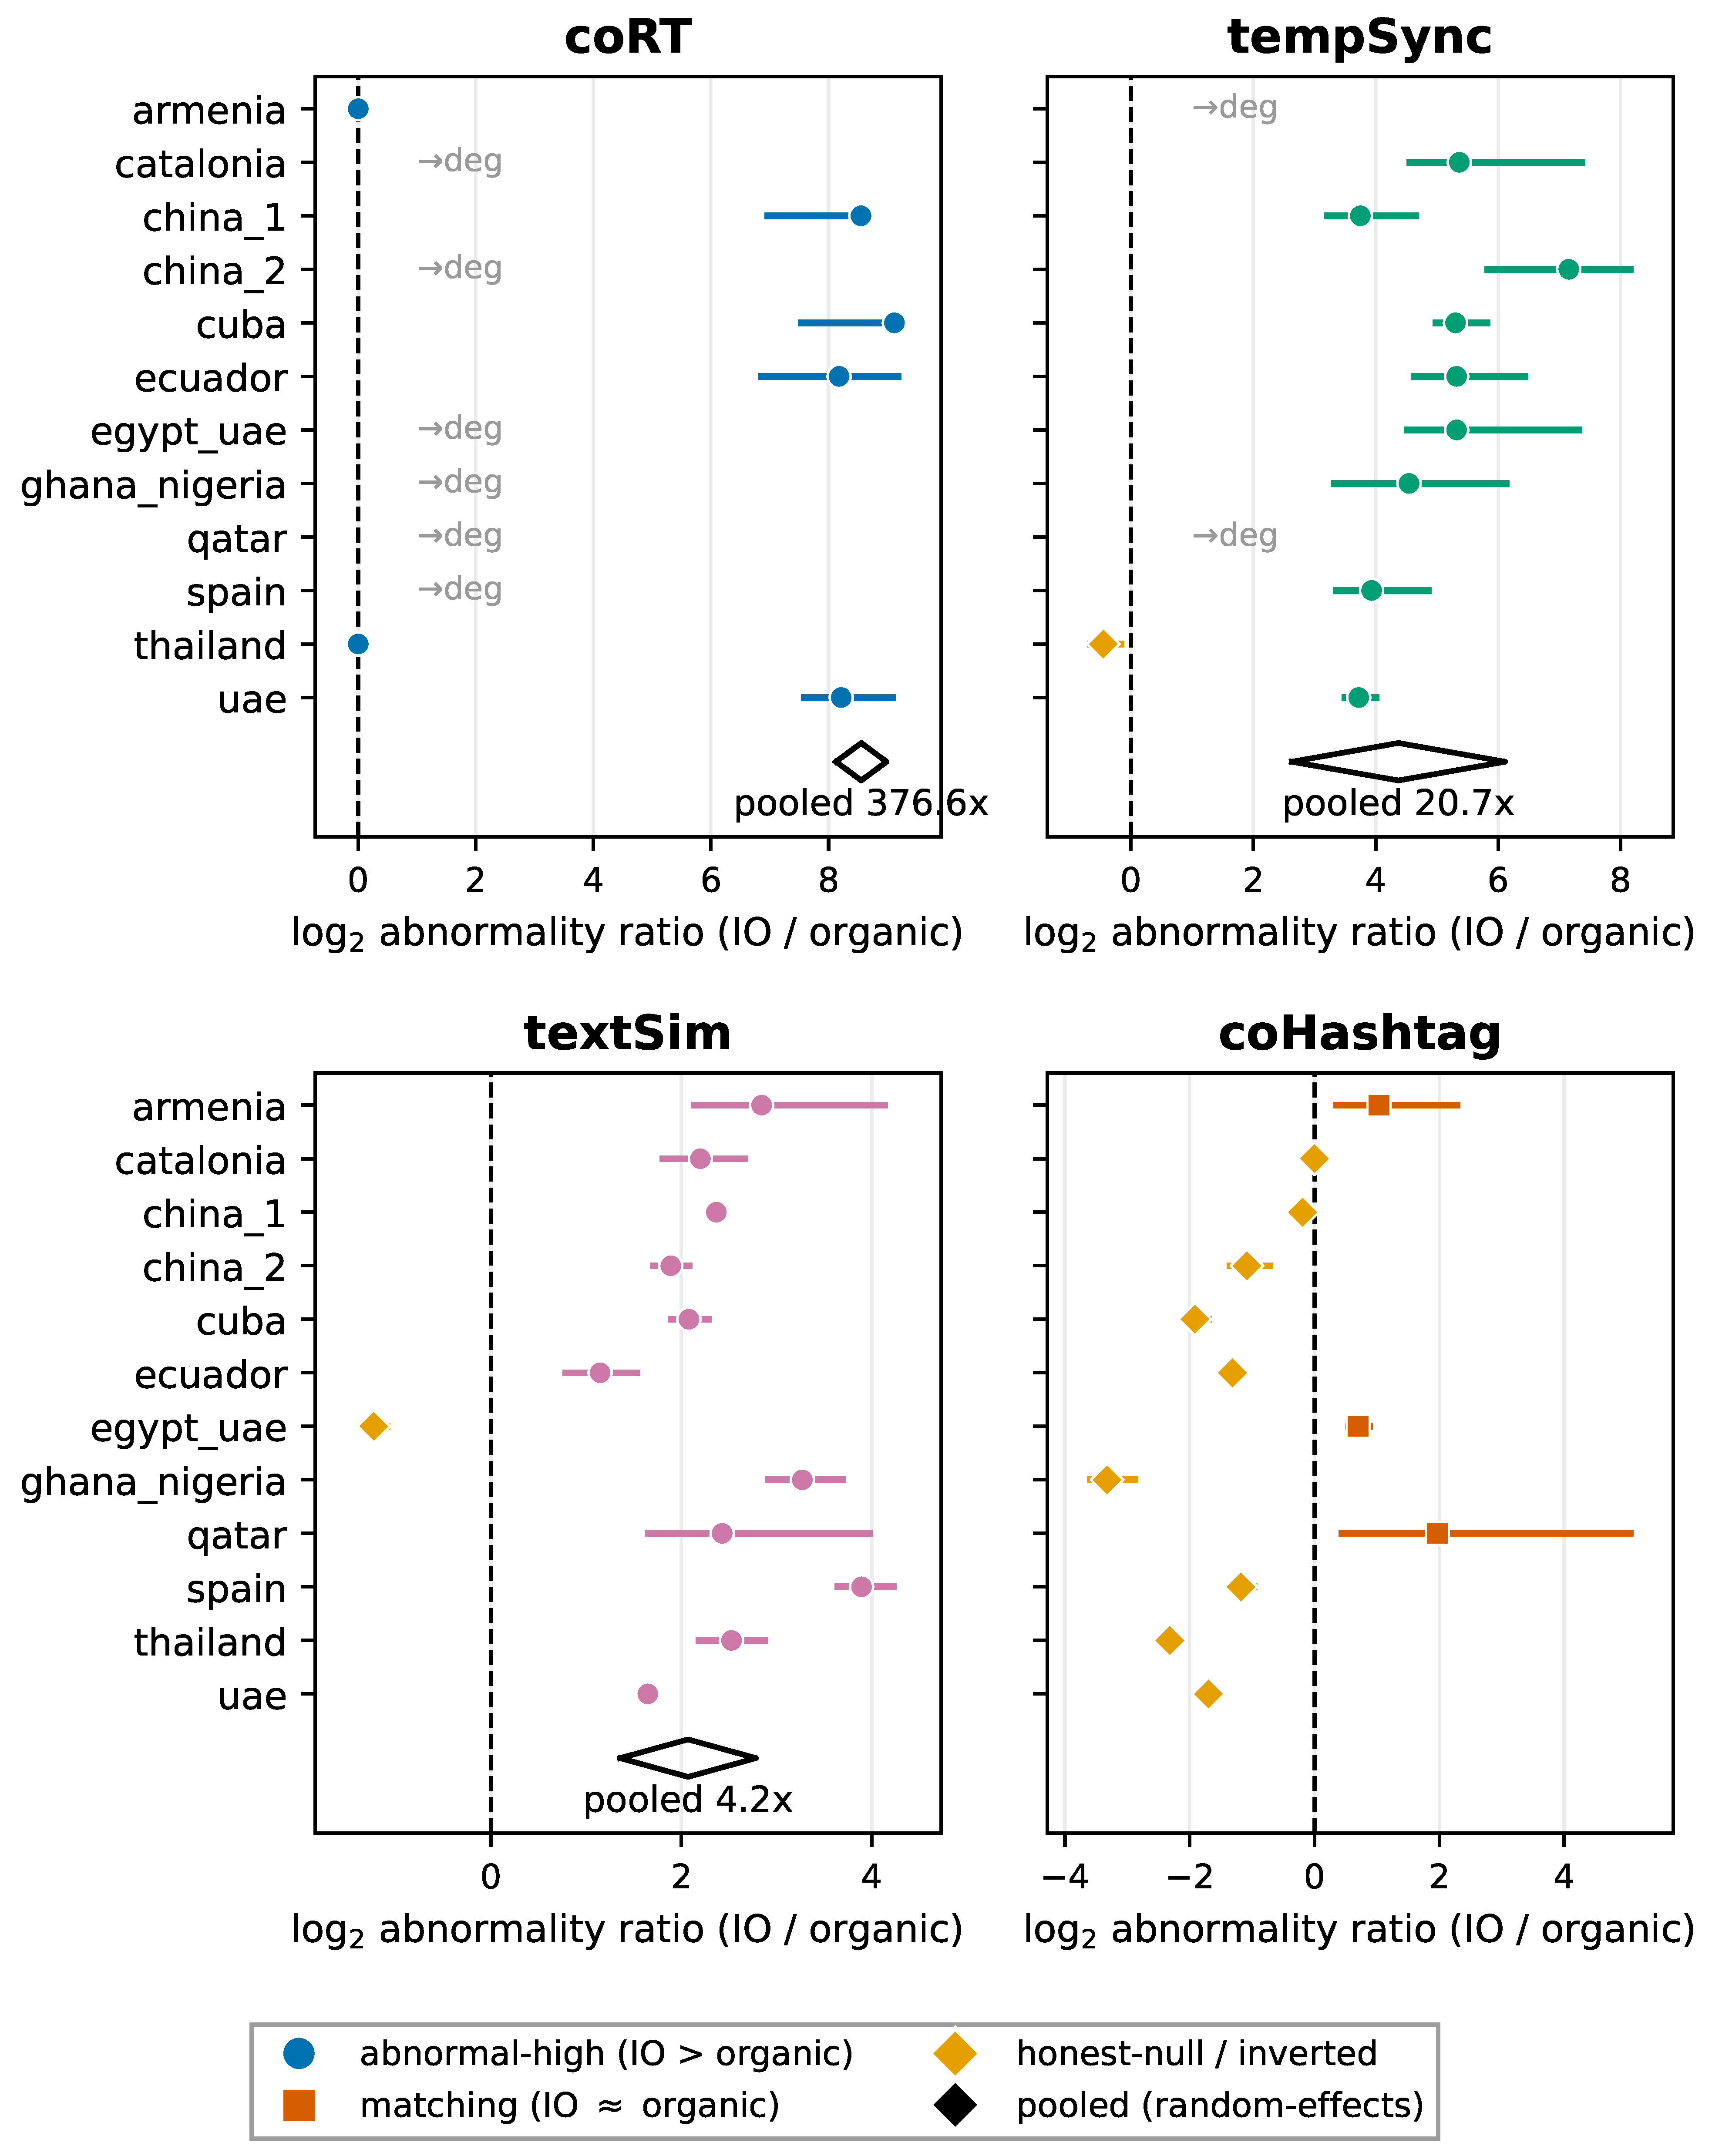
To test whether these are regularities or artifacts of the original four countries, we re-ran the frozen pipeline (no re-tuning) on twelve new, non-corpus country-groups against their matched controls (Figure 10, Table 5). All three regularities replicate out-of-sample, and the null of indistinguishability is rejected in every country: copypasta similarity is abnormally high in 11 of 12 (pooled random-effects ratio 4.20 × , CI [ 2.56 , 6.89 ] ), same-minute synchrony in 11 of 12 ( 20.7 × , [ 6.2 , 69.2 ] ), co-retweet synchrony in 10 of 12 ( 376 × where finite), and the co-hashtag negative-control null reproduces in 9 of 12. The language-drift split reproduces (mean English sign-agreement 0.594 ), and cross-campaign content segregation persists ( 16 × below null, p = 0.001 ), indicating no global template. Four small-arm country-groups (Armenia 31, Qatar 29, Ghana 60, Catalonia 76 IO accounts) lean on degeneracy-driven verdicts, and three co-hashtag matches fail on the smallest arms; we flag these rather than down-weighting them.
  • Scoped takeaway.
Neither folk belief holds: these operations no longer talk like 2016 trolls, but they still coordinate like machines. The detectable signature has migrated from language to coordination, and that migration is cross-national.

9. Discussion

Before interpretation, the findings should be separated by epistemic grade because they are not all of one kind. Some are directly observed in the archives: the segregation lifts, the reach-decomposition shares, and the detector statistics on the operations’ own accounts. Some are inferred from matched comparisons and inherit the matching’s assumptions: the staffing contrast against organic crowds and the coordination abnormality ratios against matched organic users. And some are only partly identified: the composition of the external audience behind captured reach (organic uptake versus undetected coordination, not computable in takedown data) and the Myth 2 verdict, which rests on a placebo anchor rather than a like-for-like organic comparison. The paragraphs below keep these grades distinct, and Table 3 records them claim by claim.
  • What is true: the corrected picture.
The five corrected findings are not five disconnected negatives; they compose a single, coherent account. These operations are industrial content factories: compartmentalized into nationally fingerprinted desks (Myth 1), thinly staffed by few operators executing calendars rather than crowds of improvisers (Myth 1), producing content on a script rather than optimizing it against reception (Myth 4). What they cannot do internally is make that content travel: the moral-emotional lever that the folk model treats as their primary mechanism does not move reception in their own data (Myth 2), and their viral reach is predominantly captured from an external audience they do not control rather than manufactured by their own retweets (Myth 3). What durably distinguishes them from real users is not the content of any single account, whose language has converged toward the ordinary (Myth 5), but the machine-like coordination across accounts that persists regardless of individual-account linguistic convergence (Myth 5). “Siloed in production, coordinated in execution” is not a contradiction; it is the corrected mechanism.
  • Why the reach limit and the coordination evidence fit together.
The hardest limit in this paper, that we cannot decompose external reach into organic uptake and undetected coordination (Myth 3), is partly backstopped by the coordination evidence (Myth 5). The two myths use the word “synchrony” for two different objects, and separating them is what makes the reconciliation work. Under Myth 5, the discriminating signal is cross-account same-minute synchrony: many accounts acting in lockstep, which is what separates the operations from matched organic users at 7– 70 × . Under Myth 3, the question is whether within-author seeding synchrony, one account’s own co-timed posting of a viral original, predicts how far that original then travels externally; it does not, and, in the IRA and Iran, it weakly anti-predicts reach. These are consistent: cross-account coordination is a reliable indicator of inauthenticity, but the same synchrony does not drive external reach. Thus, where reach is observable, on the operations’ own accounts, the synchrony that marks the operation as coordinated is precisely not the mechanism that propagates its content externally; the diffuse external sharing that does carry the bulk of reach shows no such lockstep signature in the operations where we can look. The unresolved part of the reach question, whether the external pool is organic or partly undetected coordination, is therefore bounded by what coordination looks like where we can measure it: if undetected coordination were carrying the external reach, it would have to do so without the same-minute, copypasta, and co-retweet signatures that coordination otherwise leaves in every measurable context. This is an inference from the internal accounts to an unobservable external pool, not a measurement of that pool; it narrows the question rather than closing it.
  • The methodological lesson.
The common thread across all five myths is that a corpus of platform-confirmed manipulation will, analyzed without a baseline, a placebo, or false-discovery control, reproduce the patterns analysts expect to find. A meaningless count of the letters x, y, and z predicts engagement on these samples (Myth 2); the corpus’s largest “adaptation” coefficients are time-symmetric trend (Myth 4); within-corpus significance on the manipulation arm says nothing about how these accounts compare to real users until an organic arm is added (Myths 2 and 5). Pre-registration, matched baselines, placebo features, and permutation nulls are not procedural formalities here; they are what separates a genuine regularity from a spurious artifact. Several of our positive controls (detectors that do fire on coordination, a co-hashtag negative control that reproduces as a clean null, a fingerprint classifier that separates campaigns at high accuracy) demonstrate that the null findings are not attributable merely to insufficient statistical power.


10. Limitations

These results concern seven specific, already-investigated campaigns and twelve further country-groups; they do not speak to operations that platforms never detected, and no claim here generalizes to “all influence operations.” The engagement counters are takedown-final snapshots, a small acknowledged limitation addressed by the snapshot decomposition. The genuinely bounding limitation is the external-reach decomposition of Myth 3: the archives record only the operations’ own accounts, so the external audience is structurally invisible and the organic-versus-undetected-coordination split of the captured reach is not a computable quantity in this corpus, a limit partly, not wholly, addressed by the coordination evidence of Myth 5. The matched-baseline contrasts rest on budget-limited draws (a p-floor of 0.0909 ), so confidence-interval verdicts, not false-discovery-corrected q-values, carry several of the Myth 5 conclusions; in the cross-national replication, the country-groups with small IO arms (Armenia, 31 accounts; Qatar, 29; Ghana, 60; Catalonia, 76) lean on degeneracy-driven verdicts and are flagged individually. The organic baseline is matched on country, period, and topic activity, not on account demographics; residual differences in account age, activity intensity, follower structure, and temporal availability are not balanced by construction and could contribute to the stylometric and behavioral contrasts independently of authenticity. Appendix C reports activity and temporal-coverage balance for the five usable campaign–control pairs; follower balance is not testable because the organic arm lacks a metadata snapshot comparable to the takedown freeze, and the pre-registered co-hashtag negative control, which reproduces in both the confirmed five and most cross-national groups, is the design’s built-in check that the baseline does not manufacture coordination contrasts. The organic baseline also lacks engagement counts, which makes an organic moral-contagion replication impossible and leaves Myth 2’s verdict anchored to the within-corpus placebo rather than a like-for-like organic comparison. Stylometric “hands” estimates are ranges, not headcounts, and the dictionary-based stylometric features and the neural authorship embeddings (LUAR) agree only in aggregate. The Linvill–Warren convergent-validity overlay (Myth 1) is confirmatory and IRA-only: it joins by screen name (incomplete coverage, concentrated in the heavily churned RightTroll category), no comparable external hand labeling exists for the other operations, and the NewsFeed category is the one label that does not fall in the two giant desks. All relationships reported are associational. Control-subject content is reported only in aggregate, consistent with its license and with the controls being ordinary users.

11. Conclusions

Scoped to these seven state campaigns, five widely circulated beliefs about how influence operations work either weaken or reverse under baseline-anchored, pre-registered testing. The operations are not monolithic armies but compartmentalized, thinly staffed production desks; they do not win on moral-emotional language, which fails to predict reception in their own data; they do not manufacture their own virality, which is predominantly captured rather than internally generated; they do not optimize against feedback, behaving instead on scripts whose rare apparent adaptation is statistically indistinguishable from noise; and they are neither indistinguishable from real users nor still caught by 2016-era language, having drifted linguistically toward the ordinary while continuing to coordinate 7– 70 × more tightly than matched organic users. The corrected picture, an industrial content factory whose reach is predominantly captured from an external audience it does not control rather than internally manufactured (with the organic-versus-undetected-coordination composition of that external reach left unresolved), accounts for the evidence more consistently than the folk model it replaces. The recurring lesson for the field is methodological: on corpora of confirmed manipulation, significance without baselines and placebos reconstructs the analyst’s expectations, and only pre-registered, baseline-anchored, placebo-gated testing tells us which “stylized facts” are facts.

Funding

This research received no external funding.

Institutional Review Board Statement

Not applicable.

Informed Consent Statement

Not applicable.

Data Availability Statement

The primary corpus derives from the public Twitter Information Operations archive; the organic baseline derives from an independent release [1] and is reported in aggregate only, without redistribution. Pre-registration files, analysis code, and derived aggregate tables are maintained in a project repository and will be made available on publication; because the organic baseline’s license forbids redistribution, the released artifacts contain derived aggregate statistics only, never control-account records or text.

Conflicts of Interest

The author declares no conflicts of interest.

Appendix A. Provenance of the Five Myths in Public and Policy Discourse

Each myth is attributed in the body to peer-reviewed or authoritative scholarship. To document that these beliefs are not academic strawmen but circulate as received wisdom, Table A1 catalogues representative statements of each myth in authoritative news reporting and in government, intelligence, and policy-institution documents. This catalogue is illustrative, not exhaustive, and is kept deliberately separate from the scholarly references: its purpose is to evidence the popular and policy framing that the paper tests, not to endorse these sources. All entries are verbatim excerpts (abridged with ellipses where noted); each was retrieved from the cited outlet, and the full catalogue with URLs and retrieval notes accompanies the project’s supplementary materials. Quotation here documents how a claim was publicly framed and implies no judgment of the cited authors.
Table A1. Representative framings of each myth in authoritative news and policy discourse. “Type” is News, Policy/Govt (government, intelligence, or legal documents), or Think-Tank/NGO (including reports commissioned by the U.S. Senate Select Committee on Intelligence). Quotes are verbatim, abridged with “…” where indicated.
MythSource (Outlet, Year)TypeRepresentative Framing (Verbatim)What it Portrays/Distorts
M1Associated Press, 2015News“Russia’s army of trolls lead Putin’s online propaganda campaign” (headline)A single unified “army” of trolls acting in concert.
M1IRA Indictment (DOJ/Special Counsel), 2018Policy/Govt“…conduct what it called ‘information warfare against the United States of America’ …”One organization waging unified information warfare.
M1Reuters, 2018 (Iran)News“a sprawling network of anonymous websites and social media accounts in 11 different languages”The Iran operation as one vast, sprawling, unified network.
M1The Conversation, 2024News“…hired hundreds of online commentators (trolls) …responsible for promoting and amplifying the narratives that suited the Kremlin’s agenda”“Troll factory” of hundreds serving one centralized agenda.
M1New Knowledge (SSCI report), 2018Think-Tank/NGO“a sweeping and sustained social influence operation …aimed directly at US citizens”The flagship Senate-commissioned report frames it as one unified operation.
M2U.S. State Dept. GEC, Weapons of Mass Distraction, 2019Policy/Govt“…fear, and anger—are the very characteristics that increase the likelihood a message will go viral.”A government report asserting emotion is what drives spread.
M2IRA Indictment (DOJ/Special Counsel), 2018Policy/Govt“…a strategic goal to sow discord in the U.S. political system …”Anchors the divisive emotional framing of the operation.
M2Oxford Internet Institute/Graphika (SSCI report), 2018Think-Tank/NGO“spreading sensationalist, conspiratorial, and other forms of junk political news and misinformation”Attributes reach to sensational, inflammatory content.
M2PBS NewsHour, 2018News“elicit outrage with posts about liberal appeasement of ‘others’ at the expense of US citizens”The core tactic framed as eliciting outrage.
M2Univ. of Colorado Boulder (Vargo study), 2020News“…fear and anger appeals work really well in getting people to engage.”Attributes engagement success to fear/anger appeals.
M3Mueller Report, via Brookings, 2019Policy/Govt“…individual accounts that would post content, which bot networks would then amplify.”A two-tier internal machine where bots amplify own content.
M3Symantec (threat intelligence), 2019Think-Tank/NGO“Auxiliary accounts were configured to retweet content pushed out by the main accounts.”A designed self-amplification architecture.
M3Atlantic Council DFRLab, 2020 (Venezuela)Think-Tank/NGO“…artificially amplified …to make the hashtags seem more popular and organic than they were.”Manufactured appearance of organic popularity.
M3CBS News, 2018News“Russian bots retweeted Mr. Trump almost 470,000 times …”Bot-driven retweeting cast as the amplification engine.
M3Iran International, 2022 (Iran)News“…made software for the tweets and retweets and had created at least 256 accounts …”An automated self-retweet network manufacturing reach.
M4IRA Indictment (DOJ/Special Counsel), 2018Policy/Govt“…tracked the performance of content they posted over social media.”Basis for the data-driven, metrics-optimizing framing.
M4RAND (Paul & Matthews, Firehose of Falsehood), 2016Think-Tank/NGO“It is rapid, continuous, and repetitive.”Casts the operation as a fast, agile, responsive machine.
M4Oxford Internet Institute/Graphika (SSCI report), 2018Think-Tank/NGO“adapted existing techniques from digital advertising to spread disinformation …”Likens the IRA to a professional digital-marketing operation.
M4CBS News (quoting DiResta), 2018News“a sophisticated operation that does not hesitate to reach out to individual Americans”The “sophisticated operation” framing.
M5IRA Indictment (DOJ/Special Counsel), 2018Policy/Govt“…posing as U.S. persons and creating false U.S. personas …”(a) IO accounts blend in as ordinary Americans.
M5DISA, 2025Think-Tank/NGO“…often indistinguishable from genuine users …”(a) States flatly that accounts are indistinguishable.
M5The Intercept, 2024NewsAI personas “undetectable by social media algorithms”(a) Undetectable, human-seeming personas.
M5DOJ press release (RT “Meliorator” bot farm), 2024Policy/Govt“…create fake but authentic-appearing social media personas en masse.”(a) A 2024 U.S. government case: AI personas authentic at scale.
M5Atlantic Council DFRLab (Nimmo), 2018Think-Tank/NGO“…inability to use the grammatical articles—‘a’ and ‘the’—appropriately.”(b) The crude linguistic-tell stereotype.
M5Propastop (Estonian Defence League), 2024Think-Tank/NGO“…they slip and start writing in native Russian.”(b) Trolls betrayed by crude operational slip-ups.

Appendix B. Analytic Specification

This appendix specifies every analysis to replication detail. Throughout, “originals” are tweets with no retweet flag; all analyses run per campaign and are never pooled; the random seed is fixed at 42; and Benjamini–Hochberg control is applied within each pre-registered family.

Appendix B.1. Shared Variables

The engagement outcome used wherever external reception is modeled is the external retweet bound: the frozen snapshot retweet counter net of retweets emitted by the operation’s own released accounts, floored at zero. Like counts are a co-primary outcome. Standard controls, where a specification lists “persona controls,” are as follows: log tweet age at snapshot, indicators for URL, hashtag, and mention presence, the account’s automation decile, log near-duplicate cluster size, and (in a reported fork) log follower count. “Persona” always denotes an account; account fixed effects are fit on accounts with at least 50 originals.

Appendix B.2. Coordination Detectors

Five detector families are used, with all thresholds fixed before the two-arm contrasts and frozen identically across the IO and organic arms:
  • Co-retweet. Two variants. The fast co-retweet variant links two accounts that retweet the same tweet within Δ t { 1 , 5 , 60 } minutes (one minute is the primary window and the timestamp floor; five and sixty minutes form the pre-specified sensitivity ladder), with an edge admitted only at ten or more distinct co-retweeted tweets, the calibrated false-positive guard of Schoch and colleagues [67]. The projection variant scores account pairs by TF–IDF cosine over shared retweeted-tweet vocabularies (accounts below ten retweet events excluded; dyads below ten distinct shared tweets excluded), gated by a hypergeometric test with false-discovery control and validated against a degree-preserving rewiring null.
  • Same-minute synchrony. For each account pair, the count of one-minute buckets in which both accounts post (windows of one and five minutes computed; one minute reported). Expected co-activity under the null is computed analytically from each account’s own minute-level activity profile, at two tiers (within account–day–hour, and within account–day using the account’s empirical hour distribution); an edge is significant when the observed bucket count exceeds a Poisson tail test at q < 0.05 and a Monte-Carlo-calibrated count floor.
  • Near-duplicate text (copypasta). Originals of at least 25 characters and 4 tokens are normalized (URLs, mentions, hashtags, diacritics, case) and clustered by character five-gram MinHash (128 permutations) with locality-sensitive hashing at two tiers: a loose tier at Jaccard 0.71 (governs cluster membership) and a strict tier at Jaccard 0.878 (conservative variant). Cross-language near-duplicates use multilingual sentence embeddings at cosine 0.80 , a precision-first threshold never lowered. Account-level edges require clusters spanning at least two accounts and three messages.
  • Co-URL/shared domain. Accounts with at least ten URL posts, linked by shared canonical URLs and (excluding shortener hosts) registered domains, at a floor of two distinct shared entities; significance from a volume- and popularity-preserving entity-shuffle null with false-discovery control.
  • Co-hashtag. Accounts with at least ten hashtag uses, linked by shared-tag TF–IDF (floor of three shared tags), ordered within-tweet tag sequences (length 3 ), and rare-tag bursts (tags used by 2–10 accounts within 60 min); significance via a bipartite configuration model with a hypergeometric cross-check. In the two-arm contrasts, this detector is the pre-registered negative control: hashtag co-use tracks topic, which the baseline matches by construction, so it must not fire.
Desks (“cells”) are recovered from the edge-union of validated detector layers by Leiden clustering under the constant Potts model, scanning seven resolution values with 100 seeds each and consensus clustering at 0.5 co-assignment; the reported resolution is the most seed-stable non-degenerate partition, and cells are reported at five or more accounts (eight or more active accounts, at thirty or more authored tweets, for the stylometric analyses). Cross-campaign overlap statistics (narrative clusters, domains, retweet targets) are tested against a time-matched permutation null (campaign labels permuted within month strata, ≥1000 draws) and a popularity-matched hypergeometric null stratified by entity popularity; robustness variants drop shortener domains, the top 1 % of entities, and split the corpus into temporal halves.

Appendix B.3. Matched Organic Vaseline

The organic arm derives from an independent release of labeled control accounts [1]: accounts active in the same country and period as each campaign that were never taken down, matched on topic and period activity, not on demographics. Campaign–control pairs are reconciled by account count, date range, and post count (account identifiers are not joinable across anonymization schemes); all identifiers are salted-hash pseudonymized. One campaign (the largest Venezuelan operation) has no control set; one Iranian mapping is provisional (its released arm overshoots the control arm’s account count) and is never pooled. Two-arm contrasts draw ten matched-size control samples (size = min ( n IO , n control ) , drawn without replacement, seed 42); the abnormality ratio divides the IO detector rate by the mean rate over draws, with a 2000-iteration bootstrap confidence interval. With ten draws the one-sided add-one p-value cannot fall below 0.0909 , so verdicts are carried by confidence-interval exclusion of 1, as stated in Section 3.3. Appendix C reports arm balance.

Appendix B.4. Myth 1: Hands Pipeline

Style features per account: language-aware function-word frequencies (top twenty for the account’s dominant language), punctuation and emoji rates, capitalization rate, type–token ratio, character- and token-length statistics, hashtag/mention/URL rates, and retweet/reply shares. Behavioral features: posting-client entropy, top-client share, client count, burstiness, Fano factor, median inter-tweet gap, active days, and a diurnal profile (24-h and day-of-week). Each block is PCA-reduced to 90 % variance, unit-scaled, and clustered by Ward agglomeration; desks larger than 300 active accounts are subsampled to 300. The operator count k ^ is the largest k whose split-half prediction strength [63] reaches 0.80 ( k = 1 admissible; k capped at a quarter of the desk), bracketed by the 10th–90th percentile of k ^ over 50 account-level bootstrap draws. The pre-registered selector (the gap statistic) degenerated by running to the cap and was replaced by prediction strength; the substitution is logged as a registered deviation. A synthetic positive control injects known k-author mixtures built from organic accounts and recovers k = 1 , 2 , 3 , 5 exactly while over-splitting k = 8 (to 11), so low k ^ is conservative. The neural replication embeds up to 32 tweets per account with a content-independent authorship model (LUAR) [64] and applies the identical selector. The organic comparison applies the same pipeline to random samples of control accounts (thirty or more posts, capped at 250 accounts) from the same release.

Appendix B.5. Myth 2: Reception Model

Fixed-effects Poisson (quasi-maximum-likelihood) regression of the engagement outcome on the standardized predictor, with account and calendar-year fixed effects, the standard controls above, and standard errors clustered by account; incidence-rate ratios are e β per standard deviation with delta-method confidence intervals. The moral-emotional predictor is the per-tweet count of tokens matching the moral-emotional (“shared”) word list of Brady and colleagues [8] (72 terms; exact or stem match; URLs, mentions, and hashtags stripped; English tweets only). The two moral-foundations instruments reported side by side are the extended Moral Foundations Dictionary (per-tweet mean foundation probabilities over matched words) and the Moral Foundations Dictionary 2.0 (per-category counts). The XYZ placebo counts occurrences of the letters x, y, and z (case-insensitive) in the tweet text after URL and mention removal, standardized identically. The organic anchor 1.13 [ 1.06 , 1.20 ] is the pooled meta-analytic incidence-rate ratio per moral-emotional word from the pre-registered replication of Brady and colleagues [11]. Each campaign’s estimate is reported across nine specifications: three covariate sets (predictor only; plus controls; plus controls and follower count) crossed with three outlier rules (none; drop top 100; drop top 1000).

Appendix B.6. Myth 3: Decomposition and Ignition

Viral originals: per campaign, the top 1 % of originals by external retweet bound (top 0.1 % and top decile as robustness tiers). Internal amplification per original: the count of archive-internal retweet edges resolving to it; validation confirms exact agreement between per-original edge counts and no double counting. External reach: for the IRA, snapshot counter minus internal count (the IRA snapshot reconciles exactly with internal edges); for all other campaigns, the frozen counter already excludes co-suspended internal retweets (internal counts exceed the counter for a quarter to nearly half of originals), so the counter is used directly as an internal-stripped bound, and no second subtraction is applied. Manufactured share: internal over internal-plus-external. Winner enrichment compares mean internal amplification of viral originals against author-matched, content-cluster-refined non-viral controls (up to five per viral original), with a within-match-group permutation null (≥1000 draws) and a match-group cluster bootstrap. Ignition: within-author fixed-effects Poisson of external reach on the standardized same-minute seeding share (the share of an original’s internal retweets landing in a one-minute bucket with two or more distinct amplifiers), account-clustered standard errors, with a within-account seeding-shuffle placebo, an outlier ladder, an account jackknife, and a specification curve. The Russian hub is not identified in this regression (19 authors; the synchrony share is absorbed by the author fixed effect) and is reported as not identified, not as a null.

Appendix B.7. Myth 4: Feedback Panel

Panel construction: per campaign, windows of one week (two weeks for the sparser Russian hub; monthly as robustness), eleven behavior axes (URL, hashtag, and mention inclusion; length bin; day-part; script; language where multilingual; moral-emotional load; frame; agenda; target), outcome the within-axis prevalence share of each class per window, weighted by the window’s tweet count. Reception regressor: the percentile rank of the class’s mean engagement (external retweet bound or likes) among that window’s classes on the same axis, at lags one to three; the placebo is the same rank at lead one. Model: fractional logit (binomial quasi-likelihood, logit link) with class fixed effects, a first-order autoregressive prevalence term, a linear trend, and window-size controls. Inference: ≥1000-draw permutation of reception across windows within class, with Benjamini–Hochberg control per campaign and channel. Verdict hierarchy per cell, fixed before fitting: scripted (past-reception coefficient not positive-significant), absorbed (significant but not better than the identical model without reception terms, by information criterion and pseudo- R 2 ), trend artifact (better, but the lead-one placebo coefficient is at least half the matched past coefficient in absolute value), feedback-consistent (all gates passed, with the placebo below half). Of 132 enumerated cells, 110 are feasible. Galton persistence: for each feedback-consistent cell, the class with the highest mean reception rank is followed across consecutive windows, and next-window rank is regressed on current rank by ordinary least squares; the slope ϕ is bracketed by a 2000-iteration moving-block bootstrap (block length 3), with the median reverted fraction of top-quartile reception shocks reported alongside.

Appendix B.8. Pre-Registration Inventory

Every myth-level family carries a frozen pre-registration file in the project repository, committed before the corresponding models were fit, fixing hypotheses, estimators, feature definitions, and the verdict rules quoted above; the git history orders each pre-registration commit before its analysis and results commits. Forced deviations are logged in place, and the substantive ones are disclosed in this paper: the hands-model selector substitution (gap statistic to prediction strength), the ignition headline’s substitution of an identified synchrony measure for a fixed-effect-absorbed one, the Russian hub’s not-identified status, and per-campaign infeasibility exclusions. The Linvill–Warren label overlay is a post hoc convergent-validity check; the national-playbook characterization is interpretive; the large-language-model outlook is discussion, not analysis.

Appendix C. Sensitivity and Balance

Appendix C.1. Detector Sensitivity

The detector battery carries its sensitivity evidence within the pipeline, and we consolidate it here. Thresholds were fixed before the two-arm contrasts and applied identically to both arms, which removes threshold tuning as a source of the reported asymmetries. Within-detector ladders: the fast co-retweet window is computed at Δ t { 1 , 5 , 60 } minutes (the one-minute primary is the most conservative); same-minute synchrony is computed at one- and five-minute windows; near-duplicate clustering is reported at the loose tier with the strict tier ( 0.878 ) as the conservative variant, and the cross-language cosine margin was swept and logged during calibration; the synchrony validation suite recovers injected coordination under timestamp jitter up to tens of minutes with calibrated false-positive floors. Cell recovery is stable under resolution and seed perturbation (seven-resolution scan, 100 seeds, consensus at 0.5 ; membership similarity assessed across coarser and finer resolutions and across edge-inclusion variants) and under temporal-half splits. Cross-campaign overlap verdicts are unchanged when shortener domains and the top 1 % most popular entities are excluded and when the corpus is split into halves. In the matched-baseline family, the abnormality verdicts are insensitive to the number of control draws (10, 25, and 50 draws give the same conclusions in the network-abnormality companion analysis). The magnitudes at issue, 7.7 70 × on synchrony and 15.7 35 × on co-retweet, sit far above the variation these perturbations induce, and the co-hashtag negative control bounds what the baseline construction itself can manufacture.

Appendix C.2. Arm Balance

Table A2 reports per-account medians for both arms of the campaign–control pairs used in the two-arm contrasts. The arms are matched on country, calendar period (both arms span the same collection window), and topic activity. They are not balanced on activity intensity or per-account capture span: released IO accounts contribute their full posting histories (median 135–956 posts over months of activity), while control accounts contribute shorter capture slices (median 15–24 posts; for most control accounts, the captured posts fall within a single day, although the control arm as a whole spans the same years). Account age at last observed post is comparable for the IRA pair and skews older among controls elsewhere; median follower counts are higher among controls in every pair, though follower counters are snapshot-timing-confounded across arms and are not used in any contrast. Three design features address the volume asymmetry: every detector normalizes by per-account opportunity (analytic nulls conditioned on each account’s own activity profile; per-account floors), the abnormality ratios compare rates rather than raw counts, and the co-hashtag negative control, which shares the same floors and arms, does not fire. The residual caveat stands and is stated in Section 10: contrasts could be affected by unbalanced account-level covariates in ways the negative control does not fully bound.
Table A2. Arm balance for the campaign–control pairs (per-account medians). Span is the number of days between an account’s first and last captured post. Follower counts are snapshot-timing-confounded across arms and are shown for completeness only. The provisional Iranian mapping is included for transparency; it is never pooled into confirmed contrasts.
PairArmAccountsPostsSpan (d)Age (d)Followers
Russia (IRA)IO3293135378610140
Organic31,299230615384
Russia (other)IO361147177287101
Organic2175220960615
Iran (Oct-2018)IO660196233263392
Organic50152101043705
Iran (Jan-2019, prov.)IO31182718522767
Organic15,802240725553
Venezuela-2IO578886823196
Organic63272201677704
BangladeshIO1195635340117
Organic9291501301655

References

  1. Seckin, O.C.; Pote, M.; Nwala, A.; Yin, L.; Luceri, L.; Flammini, A.; Menczer, F. Labeled Datasets for Research on Information Operations. Proc. Int. AAAI Conf. Web Soc. Media 2025, 19, 2567–2574. [Google Scholar] [CrossRef] [Scilit]
  2. Linvill, D.L.; Warren, P.L. Troll Factories: Manufacturing Specialized Disinformation on Twitter. Polit. Commun. 2020, 37, 447–467. [Google Scholar] [CrossRef] [Scilit]
  3. Uyheng, J.; Cruickshank, I.J.; Carley, K.M. Mapping State-Sponsored Information Operations with Multi-View Modularity Clustering. EPJ Data Sci. 2022, 11, 25. [Google Scholar] [CrossRef] [Scilit] [PubMed]
  4. Tardelli, S.; Nizzoli, L.; Tesconi, M.; Conti, M.; Nakov, P.; Da San Martino, G.; Cresci, S. Temporal Dynamics of Coordinated Online Behavior: Stability, Archetypes, and Influence. Proc. Natl. Acad. Sci. USA 2024, 121, e2307038121. [Google Scholar] [CrossRef] [Scilit] [PubMed]
  5. Elmas, T.; Silva, F.N.; Pote, M.; Dey, P.; Chang, K.-C.; Ye, J.; Luceri, L.; Buntain, C.; Ferrara, E.; Flammini, A.; et al. Israel–Hamas War on X: A Case Study of Coordinated Campaigns and Information Integrity. arXiv 2026, arXiv:2604.10566. [Google Scholar] [CrossRef] [Scilit]
  6. Wang, X.; Li, J.; Srivatsavaya, E.; Rajtmajer, S. Evidence of Inter-State Coordination amongst State-Backed Information Operations. Sci. Rep. 2023, 13, 7716. [Google Scholar] [CrossRef] [Scilit] [PubMed]
  7. Pantè, V.; Axelrod, D.; Flammini, A.; Menczer, F.; Ferrara, E.; Luceri, L. Beyond Interaction Patterns: Assessing Claims of Coordinated Inter-State Information Operations on Twitter/X. In Proceedings of the Companion Proceedings of the ACM Web Conference 2025 (WWW ’25 Companion), Sydney, Australia, 28 April–2 May 2025; pp. 1234–1238. [Google Scholar] [CrossRef] [Scilit]
  8. Brady, W.J.; Wills, J.A.; Jost, J.T.; Tucker, J.A.; Van Bavel, J.J. Emotion Shapes the Diffusion of Moralized Content in Social Networks. Proc. Natl. Acad. Sci. USA 2017, 114, 7313–7318. [Google Scholar] [CrossRef] [Scilit] [PubMed]
  9. Brady, W.J.; McLoughlin, K.; Doan, T.N.; Crockett, M.J. How Social Learning Amplifies Moral Outrage Expression in Online Social Networks. Sci. Adv. 2021, 7, eabe5641. [Google Scholar] [CrossRef] [Scilit] [PubMed]
  10. Burton, J.W.; Cruz, N.; Hahn, U. Reconsidering Evidence of Moral Contagion in Online Social Networks. Nat. Hum. Behav. 2021, 5, 1629–1635. [Google Scholar] [CrossRef] [Scilit] [PubMed]
  11. Brady, W.J.; Rathje, S.; Globig, L.K.; Van Bavel, J.J. Estimating the Effect Size of Moral Contagion in Online Networks: A Pre-Registered Replication and Meta-Analysis. PNAS Nexus 2025, 4, pgaf327. [Google Scholar] [CrossRef] [Scilit] [PubMed]
  12. Rathje, S.; Van Bavel, J.J.; van der Linden, S. Out-Group Animosity Drives Engagement on Social Media. Proc. Natl. Acad. Sci. USA 2021, 118, e2024292118. [Google Scholar] [CrossRef] [Scilit] [PubMed]
  13. Kyrychenko, Y.; Brik, T.; van der Linden, S.; Roozenbeek, J. Social Identity Correlates of Social Media Engagement before and after the 2022 Russian Invasion of Ukraine. Nat. Commun. 2024, 15, 8127. [Google Scholar] [CrossRef] [Scilit] [PubMed]
  14. Robertson, C.E.; Pröllochs, N.; Schwarz, K.; Pärnamets, P.; Van Bavel, J.J.; Feuerriegel, S. Negativity Drives Online News Consumption. Nat. Hum. Behav. 2023, 7, 812–822. [Google Scholar] [CrossRef] [Scilit] [PubMed]
  15. McLoughlin, K.L.; Brady, W.J.; Goolsbee, A.; Kaiser, B.; Klonick, K.; Crockett, M.J. Misinformation Exploits Outrage to Spread Online. Science 2024, 386, 991–996. [Google Scholar] [CrossRef] [Scilit] [PubMed]
  16. Suk, J.; Lukito, J.; Su, M.-H.; Kim, S.J.; Tong, C.; Sun, Z.; Sarma, P. Do I Sound American? How Message Attributes of Internet Research Agency (IRA) Disinformation Relate to Twitter Engagement. Comput. Commun. Res. 2022, 4, 590–628. [Google Scholar] [CrossRef] [Scilit]
  17. Shao, C.; Ciampaglia, G.L.; Varol, O.; Yang, K.-C.; Flammini, A.; Menczer, F. The Spread of Low-Credibility Content by Social Bots. Nat. Commun. 2018, 9, 4787. [Google Scholar] [CrossRef] [Scilit] [PubMed]
  18. Cinelli, M.; Cresci, S.; Quattrociocchi, W.; Tesconi, M.; Zola, P. Coordinated Inauthentic Behavior and Information Spreading on Twitter. Decis. Support Syst. 2022, 160, 113819. [Google Scholar] [CrossRef] [Scilit]
  19. Vosoughi, S.; Roy, D.; Aral, S. The Spread of True and False News Online. Science 2018, 359, 1146–1151. [Google Scholar] [CrossRef] [Scilit] [PubMed]
  20. González-Bailón, S.; De Domenico, M. Bots Are Less Central than Verified Accounts during Contentious Political Events. Proc. Natl. Acad. Sci. USA 2021, 118, e2013443118. [Google Scholar] [CrossRef] [Scilit] [PubMed]
  21. Golovchenko, Y.; Hartmann, M.; Adler-Nissen, R. State, Media and Civil Society in the Information Warfare over Ukraine: Citizen Curators of Digital Disinformation. Int. Aff. 2018, 94, 975–994. [Google Scholar] [CrossRef] [Scilit]
  22. Baribi-Bartov, S.; Swire-Thompson, B.; Grinberg, N. Supersharers of Fake News on Twitter. Science 2024, 384, 979–982. [Google Scholar] [CrossRef] [Scilit] [PubMed]
  23. Eady, G.; Paskhalis, T.; Zilinsky, J.; Bonneau, R.; Nagler, J.; Tucker, J.A. Exposure to the Russian Internet Research Agency Foreign Influence Campaign on Twitter in the 2016 US Election and Its Relationship to Attitudes and Voting Behavior. Nat. Commun. 2023, 14, 62. [Google Scholar] [CrossRef] [Scilit] [PubMed]
  24. Bail, C.A.; Guay, B.; Maloney, E.; Combs, A.; Hillygus, D.S.; Merhout, F.; Freelon, D.; Volfovsky, A. Assessing the Russian Internet Research Agency’s Impact on the Political Attitudes and Behaviors of American Twitter Users in Late 2017. Proc. Natl. Acad. Sci. USA 2020, 117, 243–250. [Google Scholar] [CrossRef] [Scilit] [PubMed]
  25. Paul, C.; Matthews, M. The Russian “Firehose of Falsehood” Propaganda Model: Why It Might Work and Options to Counter It; Perspective PE-198; RAND Corporation: Santa Monica, CA, USA, 2016. [Google Scholar] [CrossRef] [Scilit]
  26. DiResta, R.; Shaffer, K.; Ruppel, B.; Sullivan, D.; Matney, R.; Fox, R.; Albright, J.; Johnson, B. The Tactics & Tropes of the Internet Research Agency; Report Prepared for the U.S. Senate Select Committee on Intelligence; New Knowledge: Austin, TX, USA, 2018. [Google Scholar]
  27. Zannettou, S.; Caulfield, T.; De Cristofaro, E.; Sirivianos, M.; Stringhini, G.; Blackburn, J. Disinformation Warfare: Understanding State-Sponsored Trolls on Twitter and Their Influence on the Web. In Proceedings of the 2019 World Wide Web Conference, San Francisco, CA, USA, 13–17 May 2019; pp. 218–226. [Google Scholar] [CrossRef] [Scilit]
  28. Zannettou, S.; Caulfield, T.; Setzer, W.; Sirivianos, M.; Stringhini, G.; Blackburn, J. Who Let the Trolls Out? Towards Understanding State-Sponsored Trolls. In Proceedings of the 10th ACM Conference on Web Science (WebSci ’19), Boston, MA, USA, 30 June–3 July 2019; pp. 353–362. [Google Scholar] [CrossRef] [Scilit]
  29. Luceri, L.; Giordano, S.; Ferrara, E. Detecting Troll Behavior via Inverse Reinforcement Learning: A Case Study of Russian Trolls in the 2016 US Election. Proc. Int. AAAI Conf. Web Soc. Media 2020, 14, 417–427. [Google Scholar] [CrossRef] [Scilit]
  30. Pozzana, I.; Ferrara, E. Measuring Bot and Human Behavioral Dynamics. Front. Phys. 2020, 8, 125. [Google Scholar] [CrossRef] [Scilit]
  31. Saeed, M.H.; Ali, S.; Paudel, P.; Blackburn, J.; Stringhini, G. Unraveling the Web of Disinformation: Exploring the Larger Context of State-Sponsored Influence Campaigns on Twitter. In Proceedings of the 27th International Symposium on Research in Attacks, Intrusions and Defenses (RAID ’24), Padua, Italy, 30 September–2 October 2024; pp. 353–367. [Google Scholar] [CrossRef] [Scilit]
  32. Goldstein, J.A.; Sastry, G.; Musser, M.; DiResta, R.; Gentzel, M.; Sedova, K. Generative Language Models and Automated Influence Operations: Emerging Threats and Potential Mitigations. arXiv 2023, arXiv:2301.04246. [Google Scholar] [CrossRef] [Scilit]
  33. Ferrara, E. GenAI against Humanity: Nefarious Applications of Generative Artificial Intelligence and Large Language Models. J. Comput. Soc. Sci. 2024, 7, 549–569. [Google Scholar] [CrossRef] [Scilit]
  34. Goldstein, J.A.; Chao, J.; Grossman, S.; Stamos, A.; Tomz, M. How Persuasive Is AI-Generated Propaganda? PNAS Nexus 2024, 3, pgae034. [Google Scholar] [CrossRef] [Scilit] [PubMed]
  35. Spitale, G.; Biller-Andorno, N.; Germani, F. AI Model GPT-3 (Dis)informs Us Better than Humans. Sci. Adv. 2023, 9, eadh1850. [Google Scholar] [CrossRef] [Scilit] [PubMed]
  36. Hackenburg, K.; Margetts, H. Evaluating the Persuasive Influence of Political Microtargeting with Large Language Models. Proc. Natl. Acad. Sci. USA 2024, 121, e2403116121. [Google Scholar] [CrossRef] [Scilit] [PubMed]
  37. Salvi, F.; Horta Ribeiro, M.; Gallotti, R.; West, R. On the Conversational Persuasiveness of GPT-4. Nat. Hum. Behav. 2025, 9, 1645–1653. [Google Scholar] [CrossRef] [Scilit] [PubMed]
  38. Ruiz, D.C.; Serbina, A.; Rao, A.; Ferrara, E.; Luceri, L. How Far Will They Go? Red-Teaming Online Influence with Large Language Models. arXiv 2026, arXiv:2605.22880. [Google Scholar] [CrossRef] [Scilit]
  39. Carrillo, A.; Citraro, S.; Ardebili, A.A.; Taietta, E.; Rossetti, G.; Ferrara, E.; Veltri, G.A.; Stella, M. LLMs Can Persuade Only Psychologically Susceptible Humans on Societal Issues, via Trust in AI and Emotional Appeals, amid Logical Fallacies. arXiv 2026, arXiv:2604.16935. [Google Scholar] [CrossRef] [Scilit]
  40. Ezzeddine, F.; Ayoub, O.; Giordano, S.; Nogara, G.; Sbeity, I.; Ferrara, E.; Luceri, L. Exposing Influence Campaigns in the Age of LLMs: A Behavioral-Based AI Approach to Detecting State-Sponsored Trolls. EPJ Data Sci. 2023, 12, 46. [Google Scholar] [CrossRef] [Scilit] [PubMed]
  41. Saeed, M.H.; Ali, S.; Blackburn, J.; De Cristofaro, E.; Zannettou, S.; Stringhini, G. TrollMagnifier: Detecting State-Sponsored Troll Accounts on Reddit. In Proceedings of the 2022 IEEE Symposium on Security and Privacy (SP), San Francisco, CA, USA, 22–26 May 2022; pp. 2161–2175. [Google Scholar] [CrossRef] [Scilit]
  42. Im, J.; Chandrasekharan, E.; Sargent, J.; Lighthammer, P.; Denby, T.; Bhargava, A.; Hemphill, L.; Jurgens, D.; Gilbert, E. Still Out There: Modeling and Identifying Russian Troll Accounts on Twitter. In Proceedings of the 12th ACM Conference on Web Science (WebSci ’20), Southampton, UK, 6–10 July 2020; pp. 1–10. [Google Scholar] [CrossRef] [Scilit]
  43. Addawood, A.; Badawy, A.; Lerman, K.; Ferrara, E. Linguistic Cues to Deception: Identifying Political Trolls on Social Media. Proc. Int. AAAI Conf. Web Soc. Media 2019, 13, 15–25. [Google Scholar] [CrossRef] [Scilit]
  44. Alizadeh, M.; Shapiro, J.N.; Buntain, C.; Tucker, J.A. Content-Based Features Predict Social Media Influence Operations. Sci. Adv. 2020, 6, eabb5824. [Google Scholar] [CrossRef] [Scilit] [PubMed]
  45. Tian, L.; Zhang, X.; Lau, J.H. MetaTroll: Few-Shot Detection of State-Sponsored Trolls with Transformer Adapters. In Proceedings of the ACM Web Conference 2023 (WWW ’23), Austin, TX, USA, 30 April–4 May 2023; pp. 1743–1753. [Google Scholar] [CrossRef] [Scilit]
  46. Tian, L.; Zhang, X.; Kim, M.M.-H.; Biggs, J.; Rizoiu, M.-A. X-Troll: EXplainable Detection of State-Sponsored Information Operations Agents. In Proceedings of the 34th ACM International Conference on Information and Knowledge Management (CIKM ’25), Seoul, Republic of Korea, 10–14 November 2025; pp. 2874–2884. [Google Scholar] [CrossRef] [Scilit]
  47. Pacheco, D.; Hui, P.-M.; Torres-Lugo, C.; Truong, B.T.; Flammini, A.; Menczer, F. Uncovering Coordinated Networks on Social Media: Methods and Case Studies. Proc. Int. AAAI Conf. Web Soc. Media 2021, 15, 455–466. [Google Scholar] [CrossRef] [Scilit]
  48. Luceri, L.; Pantè, V.; Burghardt, K.; Ferrara, E. Unmasking the Web of Deceit: Uncovering Coordinated Activity to Expose Information Operations on Twitter. In Proceedings of the ACM Web Conference 2024 (WWW ’24), Singapore, 13–17 May 2024; pp. 2530–2541. [Google Scholar] [CrossRef] [Scilit]
  49. Tardelli, S.; Nizzoli, L.; Avvenuti, M.; Cresci, S.; Tesconi, M. Multifaceted Online Coordinated Behavior in the 2020 US Presidential Election. EPJ Data Sci. 2024, 13, 33. [Google Scholar] [CrossRef] [Scilit]
  50. Gabriel, N.A.; Broniatowski, D.A.; Johnson, N.F. Inductive Detection of Influence Operations via Graph Learning. Sci. Rep. 2023, 13, 22571. [Google Scholar] [CrossRef] [Scilit] [PubMed]
  51. Cinus, F.; Minici, M.; Luceri, L.; Ferrara, E. Exposing Cross-Platform Coordinated Inauthentic Activity in the Run-Up to the 2024 U.S. Election. In Proceedings of the ACM Web Conference 2025 (WWW ’25), Sydney, Australia, 28 April– 2 May 2025; pp. 541–559. [Google Scholar] [CrossRef] [Scilit]
  52. Minici, M.; Cinus, F.; Luceri, L.; Ferrara, E. Uncovering Coordinated Cross-Platform Information Operations Threatening the Integrity of the 2024 U.S. Presidential Election Online Discussion. First Monday 2024, 29. [Google Scholar] [CrossRef] [Scilit]
  53. Bessi, A.; Ferrara, E. Social Bots Distort the 2016 U.S. Presidential Election Online Discussion. First Monday 2016, 21. [Google Scholar] [CrossRef] [Scilit]
  54. Ferrara, E.; Varol, O.; Davis, C.; Menczer, F.; Flammini, A. The Rise of Social Bots. Commun. ACM 2016, 59, 96–104. [Google Scholar] [CrossRef] [Scilit]
  55. Gelman, A.; Loken, E. The Statistical Crisis in Science. Am. Sci. 2014, 102, 460. [Google Scholar] [CrossRef] [Scilit]
  56. Orben, A.; Przybylski, A.K. The Association between Adolescent Well-Being and Digital Technology Use. Nat. Hum. Behav. 2019, 3, 173–182. [Google Scholar] [CrossRef] [Scilit] [PubMed]
  57. Simonsohn, U.; Simmons, J.P.; Nelson, L.D. Specification Curve Analysis. Nat. Hum. Behav. 2020, 4, 1208–1214. [Google Scholar] [CrossRef] [Scilit] [PubMed]
  58. Twitter, Inc. Information Operations. Twitter Transparency Center, 2018–2023. Available online: https://web.archive.org/web/20200822015858/https://transparency.twitter.com/en/reports/information-operations.html (accessed on 22 August 2020).
  59. Ferrara, E. Manufactured Divisiveness: Decomposing the Hostile Content of Seven Social Media Influence Operations. arXiv 2026, arXiv:2607.14491. [Google Scholar] [CrossRef] [Scilit]
  60. Maslov, S.; Sneppen, K. Specificity and Stability in Topology of Protein Networks. Science 2002, 296, 910–913. [Google Scholar] [CrossRef] [Scilit] [PubMed]
  61. Benjamini, Y.; Hochberg, Y. Controlling the False Discovery Rate: A Practical and Powerful Approach to Multiple Testing. J. R. Stat. Soc. Ser. B Stat. Methodol. 1995, 57, 289–300. [Google Scholar] [CrossRef] [Scilit]
  62. Kumar, S.; Cheng, J.; Leskovec, J.; Subrahmanian, V.S. An Army of Me: Sockpuppets in Online Discussion Communities. In Proceedings of the 26th International Conference on World Wide Web (WWW ’17), Perth, Australia, 3–7 April 2017; pp. 857–866. [Google Scholar] [CrossRef] [Scilit]
  63. Tibshirani, R.; Walther, G. Cluster Validation by Prediction Strength. J. Comput. Graph. Stat. 2005, 14, 511–528. [Google Scholar] [CrossRef] [Scilit]
  64. Rivera-Soto, R.A.; Miano, O.E.; Ordonez, J.; Chen, B.Y.; Khan, A.; Bishop, M.; Andrews, N. Learning Universal Authorship Representations. In Proceedings of the 2021 Conference on Empirical Methods in Natural Language Processing (EMNLP); Association for Computational Linguistics: Kerrville, TX, USA, 2021; pp. 913–919. [Google Scholar] [CrossRef] [Scilit]
  65. Poliakoff, S.; Toepfl, F. Prigozhin’s Propaganda Team: The St Petersburg Internet Research Agency (2013–2021). Eur.-Asia Stud. 2026, 78, 91–112. [Google Scholar] [CrossRef] [Scilit]
  66. Orlando, G.M.; Ye, J.; La Gatta, V.; Saeedi, M.; Moscato, V.; Ferrara, E.; Luceri, L. Emergent Coordinated Behaviors in Networked LLM Agents: Modeling the Strategic Dynamics of Information Operations. In Proceedings of the ACM Web Conference 2026 (WWW ’26), Dubai, United Arab Emirates, 13–17 April 2026; pp. 4805–4816. [Google Scholar] [CrossRef] [Scilit]
  67. Schoch, D.; Keller, F.B.; Stier, S.; Yang, J. Coordination Patterns Reveal Online Political Astroturfing across the World. Sci. Rep. 2022, 12, 4572. [Google Scholar] [CrossRef] [Scilit] [PubMed]
Figure 1. The five myths at a glance. For each, we include the folk belief and a representative verbatim framing of it in authoritative news or policy reporting (catalogued in Appendix A), what we tested, the headline finding when scoped to these seven campaigns, and the scoped takeaway. All relationships are associational; every statistic is detailed in the corresponding section.
Systems 14 00970 g001
Figure 2. Myth 1. Observed cross-campaign narrative spanning (and related coordination statistics) against time-matched and degree-preserving nulls. Cross-campaign narrative overlap falls about 27 ×  below chance: the operations are mutually segregated, not a single coordinated army.
Systems 14 00970 g002
Figure 3. Internal co-retweet coordination networks of the two largest operations (top: the IRA; bottom: Iran, January 2019). Nodes are accounts; edges are within-operation co-retweets; node size scales with within-operation degree; node color marks the largest coordination desks (with soft “territory” hulls, and labels derived from each desk’s retweet/reply/link/hashtag behavior and, for the IRA, the Linvill–Warren overlay in Table 4), while smaller desks and unclustered accounts are gray. Layout is force-directed (Fruchterman–Reingold), shown for accounts in connected components of at least eight. The IRA forms one dominant fabric that braids two co-equal desks (the D0/D1 split in Table 4); Iran resolves into functionally distinct cells—the same compartmentalization, organized along a different national playbook. Pseudonymous desk identifiers only; all relationships associational.
Systems 14 00970 g003
Figure 4. Myth 2. Moral-emotional reception (IRR) by operation against the organic anchor and the XYZ letter-count placebo. The contagion law fails to replicate everywhere; Russia sign-reverses, and the placebo predicts engagement as well as morality.
Systems 14 00970 g004
Figure 5. Myth 3, provenance decomposition of top-percentile viral reach by operation. Internally manufactured amplification (manufacture lower bound, 0.1 5.3 % ) versus externally captured reach (capture upper bound, 94.7 % ); the external bound is not “organic”: it mixes genuine users, unrelated bots, and any undetected coordination the archive cannot see. The inset re-plots the manufactured share alone on a 0– 6 % axis, where the Russian hub ( 5.3 % ) stands well above the others (all 0.8 % ). Pseudonymous operation labels; associational throughout.
Systems 14 00970 g005
Figure 6. Myth 3, ignition verdict: the association between within-author seeding synchrony and external reach (incidence-rate ratio per SD, within-author fixed effects). IRR < 1 (IRA, Iran) indicates diffuse post hoc sharing rather than synchronized ignition; the Iranian (Oct-2018) operation is the lone ignition-like positive; the Russian hub is fixed-effect-absorbed (not identified, not a null). Winner-enriched internal amplification is diffuse post hoc sharing, not synchronized manufactured ignition. Pseudonymous operation labels; associational throughout.
Systems 14 00970 g006
Figure 7. Myth 4, pay-off of reception-chasing (reversion). Reversion/persistence coefficient φ for each feedback-consistent cell (regression of next-window on current-window rank-reception, reallocated toward class), with a ≥2000-iteration block-bootstrap CI; φ = 1 marks durable hold-up, φ = 0 full reversion. Every feedback-consistent cell mean-reverts ( φ in [ 0.17 , 0.70 ] , all 95 % CIs below 1): apparent “learning” reflects transient responses to noise, not durable optimization. Associational; pseudonymous/aggregate cell labels; reception is rank of takedown-final counts (snapshot-timing proxy).
Systems 14 00970 g007
Figure 8. Myth 4, pay-off of reception-chasing (trajectory). A top-quantile reception shock and its partial reversion one window later (median ∼52% of the shock reverts within one window). The reception gain does not persist, consistent with transient responses to noise rather than durable optimization. Associational; pseudonymous/aggregate cell labels; reception is rank of takedown-final counts (snapshot-timing proxy).
Systems 14 00970 g008
Figure 9. Myth 5 (confirmed five). Coordination abnormality of IO versus matched organic users by detector and campaign, on a log 2 abnormality-ratio axis (IO statistic/matched-size organic draw, 95 % bootstrap CI, ratio = 1 reference). Detectors: coRT (co-retweet synchrony), tempSync (same-minute co-activity), textSim (copypasta/near-duplicate), coHashtag (pre-registered negative control). Synchrony, copypasta, and co-retweet run many-fold above organic; co-hashtag realizes the pre-registered negative-control null. Aggregate class-level only. Associational, not causal.
Systems 14 00970 g009
Figure 10. Myth 5 (cross-national replication). Frozen-pipeline re-test on twelve new non-corpus country-groups, by detector ( log 2 abnormality ratio, IO versus matched organic; right of the dashed line = IO more coordinated). Black diamonds are random-effects pooled estimates per detector; “→deg” marks degenerate cells (organic statistic 0, IO > 0 ). The coordination abnormality replicates out-of-sample; the null of indistinguishability from real users is rejected in every country.
Systems 14 00970 g010
Table 1. The five myths at a glance: the folk belief, the corrected finding when scoped to these seven campaigns, and one signature statistic. Full evidence and section references follow.
Folk BeliefCorrected Finding (These Campaigns)Signature Statistic
M1: a monolithic troll armyNarratively segregated, thinly staffed desks executing national playbooksspanning ~ 27 × below null; median 3 hands/desk
M2: wins on moral emotionThe moral-contagion law does not replicate; a meaningless placebo predicts as wellRussia IRR 0.848 vs. placebo 1.537
M3: manufactures its viralityTop-percentile reach is externally captured, not internally generatedinternal share 0.10 5.31 %
M4: an optimizing adaptive adversaryScripted; the rare apparent feedback mean-reverts toward baselineGalton ϕ [ 0.17 , 0.70 ] , all CIs  < 1
M5: indistinguishable/a crude 2016 trollLanguage drifted off the 2016 fingerprint, yet coordination stays many-fold above organicsynchrony 7.7 70.3 × ; replicated in 12 countries
Table 2. The seven state-attributed campaigns in the primary corpus (Twitter Information Operations archive). “Released” counts all disclosed accounts; tweet counts are the released totals. “Organic control” indicates whether a matched, never-suspended same-country/period arm is available for the Myth 1/3/5 contrasts.
Operation (Attribution)AccountsTweetsSpanOrganic Control
Russia (IRA)36088,768,6332009–2018Yes
Russia (other)416765,2462010–2018Yes (power-flagged)
Iran (Oct-2018)7701,122,9362010–2018Yes
Iran (Jan-2019)23114,447,0562009–2018Provisional (not pooled)
Venezuela-111968,961,7882010–2018No (descriptive)
Venezuela-2755984,9802015–2018Yes
Bangladesh1526,2142009–2018Below network power floor
Total907125,076,8532009–20185 usable + 1 provisional
Table 3. Mapping from each myth to its estimand, null hypothesis, test, outcome variable, baseline, and decision rule. Tier orders the evidentiary strength of the verdict: matched-baseline (strongest), decomposition with bounds, placebo-gated temporal, placebo-anchored (weakest). All tests apply Benjamini–Hochberg control within their pre-registered family; full specifications in Appendix B.
MythEstimand (Outcome Variable)Null HypothesisTestBaseline/TierDecision Rule
M1 (army)Cross-campaign overlap lift (shared narrative clusters, domains, retweet targets); validated cell structure; operator count k ^ per deskOverlap ≥ chance (one army implies convergence); desks are richly staffed crowdsPermutation lift vs. time-/popularity-matched nulls; degree-preserving rewiring; joint style–behavior clustering with prediction-strength k ^ Resampled nulls; matched organic crowds for k ^ /matched-baseline (staffing arm)Segregation if lift < 1 with observed count below the null interval, q < 0.05 ; staffing contrast one-sided Mann–Whitney at matched sample size
M2 (emotion)Incidence-rate ratio per SD of moral-emotional load on engagementIRR within the organic anchor band 1.13 [ 1.06 , 1.20 ] and above the placeboFixed-effects Poisson (account + year FE, cluster-robust SEs), nine-specification curveXYZ letter-count placebo/placebo-anchored (weakest)Replication requires positive IRR in the anchor band and CI-separated from the placebo; neither holds in any campaign
M3 (virality)Manufactured share of top-percentile viral reach; ignition IRR of external reach on within-author same-minute seeding shareManufactured share substantial; seeding synchrony positively predicts external reachTakedown-snapshot decomposition (clean subtraction, IRA; internal-stripped bound elsewhere); within-author FE PoissonSnapshot decomposition with stated bounds/decomposition tierShares reported as bounds (manufacture lower, capture upper); ignition verdict positive-and-robust = manufactured, negative or null = diffuse sharing
M4 (learning)Summed lead–lag coefficient of past reception on next-window behavior prevalence; Galton ϕ for surviving cellsNo feedback: β past null, or explained by trend/autocorrelationFractional logit with class fixed effects, autoregressive term, and trend; 1000 -draw permutation null per cellFuture-reception placebo/placebo-gated temporalFeedback-consistent only if q < 0.05 , model beats the AR-plus-trend baseline, and  | β fut | < 0.5 | β past | ; durable only if ϕ CI reaches 1
M5 (indist.)Abnormality ratio A d per coordination detector; 49-cue fingerprint sign agreement A d = 1 : operations indistinguishable from matched real usersFrozen detectors on both arms; ten matched-size organic draws; bootstrap CIsMatched organic baseline/matched-baseline (strongest)Abnormal-high iff the 95 % CI of A d excludes 1 and A d > 1 ; co-hashtag pre-registered as a negative control that must not fire
Table 4. Myth 1, convergent validity. Share of each Linvill–Warren [2] hand-labeled IRA category whose accounts fall in the two giant single-“hand” desks recovered here (row %; n = 2604 IRA accounts carrying an external label). Pseudonymous desk IDs; IRA-only; associational.
Hand Label (L&W)D0 (Eng.)D1 (Rus.)Reading
RightTroll61.5%0.0%English partisan → English desk
LeftTroll53.6%0.0%English partisan → English desk
HashtagGamer95.5%0.0%Trend amplifier → English desk
Fearmonger78.4%0.0%English alarm → English desk
NewsFeed27.8%0.0%Mostly smaller automated desks
NonEnglish0.3%74.0%Russian-language → Russian desk
Table 5. Cross-national replication of the coordination abnormality (frozen pipeline, twelve new non-corpus country-groups). Each detector contrasts IO against matched organic users; “abnormal-high” counts country-groups whose ratio exceeds 1 with the confidence interval excluding 1. Pooled ratios are random-effects (DerSimonian–Laird) over the countries with finite estimates. Co-hashtag is the pre-registered negative control, which should not fire, and largely does not.
DetectorAbnormal-HighPooled Ratio (95% CI)Reading
Copypasta text similarity11/12 4.20 ×   [ 2.56 , 6.89 ] replicates
Same-minute synchrony11/12 20.7 ×   [ 6.2 , 69.2 ] replicates
Co-retweet synchrony10/12 376 × (finite k = 4 )replicates
Co-hashtag (negative control)9/12 null-consistent 0.10 0.88 × null reproduces
Disclaimer/Publisher’s Note: The statements, opinions and data contained in all publications are solely those of the individual author(s) and contributor(s) and not of MDPI and/or the editor(s). MDPI and/or the editor(s) disclaim responsibility for any injury to people or property resulting from any ideas, methods, instructions or products referred to in the content.