Article

Mapping Systemic Contagion of Consumer Sentiment Shocks Across National Financial Markets: A Network Analysis of Interconnected Socio-Economic Systems

1
Faculty of Economics and Administrative Sciences, Recep Tayyip Erdoğan University, Rize 53100, Türkiye
2
Faculty of Economics and Administrative Sciences, Istanbul Beykent University, Istanbul 34396, Türkiye
3
Research Methods Application Center, Azerbaijan State University of Economics (UNEC), AZ1001 Baku, Azerbaijan
4
Scientific Research Center, Baku Engineering University, AZ0101 Baku, Azerbaijan
5
Rectorate, Recep Tayyip Erdoğan University, Rize 53100, Türkiye
*
Author to whom correspondence should be addressed.
Systems 2026, 14(8), 950; https://doi.org/10.3390/systems14080950
Submission received: 22 June 2026 / Revised: 31 July 2026 / Accepted: 2 August 2026 / Published: 6 August 2026
(This article belongs to the Special Issue Resilience and Systemic Risk in Interconnected Financial Systems)

Highlights

Please indicate how your work links to systems science via your contributions to systems practice, theory, and/or methodology.
  • The study treats thirteen national equity markets as an open socio-technical system in which household sentiment, market infrastructure, and cross-border dependencies jointly generate systemic contagion.
  • It advances a systems methodology by integrating Diebold-Yılmaz connectedness, Granger-causal contagion testing, network centrality, and panel estimation to separate structural connectedness from realized transmission capacity.
What are the main findings and/or the implications of the main findings?
  • The market system is densely connected (total connectedness = 81.6%) and displays a core-periphery topology in which the Euro-area core is the principal return-spillover transmitter.
  • After false-discovery-rate correction, sentiment-shock contagion remains concentrated but not confined to a single pathway: twelve of 114 tested directed pairs survive correction, with Japan as the dominant transmitter across seven of these links, implying that systemic monitoring should track network position and realized shock transmission as full-sample structural characterizations rather than live monitoring outputs.

Abstract

Consumer sentiment shocks rarely remain confined to their economy of origin. Adopting a systems-thinking perspective, this study treats the equity markets of thirteen advanced economies as one interconnected socio-technical system, bounded by its environment. It maps how unexpected shifts in consumer confidence propagate across it between 2015 and 2025. Rather than isolating a single channel, the analysis examines the system as a whole, where a social subsystem of household sentiment interacts with a technical subsystem of market infrastructure. Sentiment shocks are identified as the unexpected component of the OECD Composite Consumer Confidence Index, and the dependency structure linking markets is estimated through return-based networks. The analysis combines the Diebold-Yılmaz connectedness framework, Granger-causal contagion testing, network centrality measures, and panel estimation with cross-sectionally consistent standard errors. Total connectedness reaches 81.6 percent, confirming a densely integrated system in which the Euro-area core acts as the principal return transmitter; sentiment-shock contagion, once corrected for multiple testing, is sparse rather than pervasive. A small set of economies occupies structurally central positions, yet the small-sample centrality diagnostic provides no robust evidence that threshold-network centrality predicts VAR-based net spillover roles. The findings refine the standard assumption that central nodes are necessarily the main propagators of systemic disturbance and offer concrete guidance for cross-border financial monitoring. This guidance is structural rather than a real-time monitoring signal since it derives from a full sample rather than a rolling or live analysis.

1. Introduction

Consumer sentiment rarely stays within national borders. When households in one major economy turn pessimistic about their financial prospects, equity markets abroad often register the tremor within weeks. The sentiment collapse during the early months of the COVID-19 pandemic and the confidence shock that followed the 2022 inflation surge both spread across advanced economies with a speed that purely domestic models failed to anticipate [1,2,3,4]. What looks like a local mood swing increasingly behaves as a system-level disturbance, moving through a web of interconnected markets rather than dissipating at its source. Treating each country in isolation misses the very structure that carries the shock. The relevant question is no longer whether sentiment moves markets, a relationship documented for decades, but how an unexpected sentiment shock in one node travels through the system and amplifies elsewhere.
This propagation problem directly matters to the institutions charged with financial stability. Central banks and macroprudential authorities monitor cross-border spillovers in returns, volatility, and credit, yet sentiment-driven contagion sits awkwardly outside their standard toolkit [5,6]. A confidence shock is not a price shock. It precedes trading, shapes expectations, and can ignite synchronized selling before any fundamental news arrives. When supervisors cannot identify which economy is the likely origin of a sentiment cascade, or which markets sit most exposed downstream, they lose the lead time that early-warning systems are designed to provide. The cost of this blind spot rises as financial integration deepens and as retail participation, amplified by digital platforms, accelerates the transmission of sentiment across markets [7,8]. Evidence that financial outcomes vary systematically across sectors and regions, even within a globally integrated firm population, reinforces the case for studying transmission at the system level rather than market by market [9].
The greater difficulty is methodological, and it defines the problem this study addresses. Dominant approaches to spillover measurement, including vector autoregressions and the connectedness framework, rest on linear assumptions and treat the cross-market structure as a by-product of pairwise covariances rather than as an object to be modeled in its own right [10,11]. They capture how much spillover occurs but say comparatively little about the topology that governs it. If financial markets behave as an interconnected system, then an analysis that does not explicitly represent that topology will misread systemic contagion, attributing to individual markets what is, in fact, a property of their relational structure. The response here is not quantitative modeling for its own sake but quantitative tools applied to characterize a system. Every estimator is used to describe the boundaries, structure, and emergent behavior of the market network rather than to fit an isolated relationship. This is the gap the present study targets: existing tools quantify spillover without mapping the system that produces it, and they rarely separate the question of who is connected from the question of who transmits.
This study maps sentiment-driven contagion across thirteen advanced economies from 2015 to 2025, treating national markets as nodes in a single interconnected system and their evolving dependencies as edges. The contribution is threefold. Theoretically, it reframes cross-country sentiment contagion as a problem of network structure within a complex socio-economic system, linking the behavioral origin of a sentiment shock to its systemic propagation. Empirically, it identifies the unexpected component of consumer confidence through an autoregressive filter and traces its transmission with connectedness measures, Granger-causal testing, and centrality analysis, while separating structural position from transmission role. For policy, it identifies the economies that act as systemic transmitters and cautions that these roles should not be inferred from threshold-network centrality alone, thereby refining where cross-border monitoring efforts should concentrate.
This framing places the study within systems thinking rather than within a single-channel empirical exercise. The object of analysis is the whole market system, defined by its boundary with the surrounding environment and characterized by emergent properties that no individual market displays in isolation. A holistic reading is necessary precisely because the phenomenon of interest, the transmission of mood across markets, is a system-level property: it cannot be recovered by studying any one country, any one linkage, or any one estimator on its own. The eight analyses reported below are therefore complementary lenses on one system, moving from its descriptive state to its connectedness, causal contagion, topology, and, finally, the relationship between structural position and systemic role.
The analysis yields three findings previewed here. Return spillovers are led by the Euro-area core, whereas sentiment-shock contagion, though concentrated, survives multiple-testing correction for twelve of 114 tested pairs, with Japan as the dominant source. A small set of economies occupies structurally central positions while one economy remains topologically peripheral, marking the boundary of the thresholded system. The centrality diagnostic, interpreted as exploratory because it rests on 13 economies, provides no robust evidence that threshold-based centrality predicts VAR-based net spillover roles. The remainder of the paper proceeds as follows. Section 2 reviews the literature, develops the theoretical framework, and states the hypotheses. Section 3 describes the data and empirical strategy. Section 4 reports the results. Section 5 discusses them, draws policy implications, and notes limitations. Section 6 concludes.

2. Literature Review, Theoretical Framework, and Hypothesis Development

2.1. Literature Review

Research on how sentiment moves asset prices has matured from single-market evidence toward an explicitly cross-border view. The foundational work establishes that sentiment is not noise to be averaged away but a priced influence on returns, strongest where assets are hard to value and hard to arbitrage [12,13,14,15]. Limits to arbitrage explain why sentiment-driven mispricing persists rather than being corrected immediately [16]. Consumer confidence, in particular, carries predictive power for both spending and asset prices, making it a natural conduit between household mood and market dynamics [17,18]. A complementary strand shows that media tone, uncertainty, and search-based fear measures forecast short-horizon returns and volatility, reinforcing the view that measured sentiment captures economically meaningful expectations rather than statistical artifacts [19,20,21]. Recent multidimensional evidence further shows that the link between non-financial drivers and financial performance differs markedly across sectors and regions, underscoring that aggregate relationships can mask substantial structural heterogeneity [9].
The cross-country dimension reframes sentiment as something that travels. Ref. [22] shows that sentiment has both global and local components and that the global component propagates across national markets, an early and direct statement of sentiment contagion. Subsequent evidence documents stronger sentiment effects in markets prone to herd-like behavior and weaker institutional integrity, predicting heterogeneity in how economies transmit and absorb shocks [23,24]. More recent work ties social media sentiment to volatility across equities, bonds, currencies, and commodities, finding that sentiment indices switch between transmitter and receiver roles during turbulent periods such as the pandemic and trade-war episodes [25]. Directly relevant cross-country evidence confirms that sentiment spillovers travel through equity markets rather than remaining confined to a single country: US investor sentiment spills over into G7 aggregate and value stock returns [26], investor-sentiment contagion propagates through measurable network connectedness across China and other international markets [27], stock-market movements and consumer confidence move together in short-run cycles across European economies [28], and mood-related national sentiment is reflected in stock prices across countries [29]. This body of work sharpens what remains open here: a network representation of confidence-driven, rather than purely return-driven, transmission across a broader set of advanced economies. The emerging picture is a system in which mood is mobile, its direction is regime-dependent, and its impact concentrates in identifiable nodes.
Parallel literature measures financial spillover directly, primarily through the connectedness framework, which decomposes forecast-error variance into own- and cross-market contributions [10,30,31]. Applications proliferate: frequency-domain and time-varying extensions trace how interconnectedness rises during turbulence and identify net transmitters and receivers among markets and sectors [32,33]. Earlier connectedness work on global and regional equity markets shows that crises sharply intensify cross-market linkages [34]. These tools answer how much spillover occurs and in which direction, yet they encode the network only implicitly, through the variance decomposition, rather than treating the relational structure as an explicit object of analysis.
A third strand models the financial system directly as a network and studies how its topology governs the propagation of shocks. Formal models demonstrate that connectivity is double-edged: dense linkages absorb small shocks but amplify large ones beyond a tipping point, the robust-yet-fragile property [35,36,37]. Network-based risk measures, such as DebtRank, systemic centrality, and tail-event networks, identify systemically important nodes whose distress has outsized consequences [38,39,40,41]. Centrality concepts imported from network science formalize what it means for a node to be structurally important [42,43,44]. Crucially, several contributions caution that systemic importance is not a simple function of connectedness: the expected loss of a network need not increase monotonically with the number of links, so connectivity and systemic risk can be only loosely related [45,46,47]. A cross-cutting systems-thinking tradition reads such patterns through the lens of complex adaptive and open-systems ideas, in which market outcomes emerge from many interacting agents, exhibit feedback and boundary effects, and cannot be reduced to any single component [48,49,50]. This study sits at the intersection of these strands, bringing the network lens to sentiment-driven contagion, which the connectedness literature has largely treated through linear measures and the network literature has rarely examined through a behavioral origin, and framing the result as a property of an interconnected socio-technical system rather than of any single market.

2.2. Theoretical Framework

The study integrates three theoretical traditions through a complex-systems lens consistent with the socio-technical orientation of systems research. The first is behavioral asset pricing, which holds that sentiment-based demand shocks, combined with limits to arbitrage, push prices away from fundamentals [12,16]. This explains why an unexpected change in consumer confidence can move markets even without new fundamental information: confidence shapes the willingness to bear risk, and constrained arbitrage prevents rational traders from fully offsetting the resulting pressure on demand. Sentiment thus supplies the micro-level mechanism that generates a shock at a node.
The second tradition is the theory of financial contagion, which models how shocks cascade through networks of linked agents [51]. Formal frameworks show that the topology and complexity of linkages, not merely their average strength, govern whether a local disturbance dissipates or amplifies into a system-wide event [37,45,52,53]. A central and unsettled question within this tradition is whether structurally central nodes are necessarily the most dangerous propagators, since several models show that systemic importance and raw connectedness can diverge [46,47]. This tension motivates treating connectedness and transmission as separate, testable properties rather than assuming they coincide.
The third tradition is complex systems and socio-technical thinking, which treats the set of national markets as an interdependent system whose aggregate behavior emerges from the relational structure linking its parts rather than from any single component [54,55,56]. The socio-technical framing is more than a label. Socio-technical systems theory, developed at the Tavistock Institute, holds that a system’s outcomes arise from the joint operation of a social subsystem and a technical subsystem within a defining environment so that neither can be optimized in isolation [57,58,59]. In this setting, consumer sentiment is the social subsystem, the price-discovery and trading infrastructure of national equity markets is the technical subsystem, and the cross-border dependency structure is the environment through which the two interact. Built on the open-systems foundation of general systems theory, the lens directs attention to system boundaries, feedback loops, and emergent properties that no single market exhibits on its own [48,49,60]. The cross-border propagation of consumer-sentiment shocks traced here is also tied to the behavioral micro-foundations of consumer confidence theory, originally developed by Katona [61] and later translated into macro-financial dynamics by Lemmon and Portniaguina [18], as well as to emotional-contagion mechanisms examined in psychology and consumer research [62,63]. At the micro level, consumers and market participants may synchronize peer-group risk perceptions through informational cascades and herd behavior [64,65]. Consequently, an unexpected decline in consumer confidence can move beyond localized household consumption and travel through the socio-technical system’s informational channels, ultimately manifesting as financial volatility across network-connected economies.
Two implications follow for the design. First, an open system is defined by its boundary with the environment. Hence, an economy that fails to couple with the others is not merely a weakly connected member but a case in which the system boundary itself becomes visible. Second, because system behavior is emergent, the capacity to transmit a disturbance need not coincide with structural embeddedness; coordination and information channels can carry shocks that raw connectivity does not capture [49,50]. Taken together, the three traditions predict that sentiment shocks propagate through a structured socio-technical system, that economies differ sharply in their structural positions, with some falling outside the system boundary, and that structural position and transmission role need not align.

2.3. Hypothesis Development

Behavioral asset pricing establishes that sentiment shocks move prices, and contagion theory adds that linked markets transmit such disturbances to one another. When households in one economy experience an unexpected shift in confidence, the resulting demand pressure on domestic assets can spill into connected markets through correlated trading, shared investors, and common expectations [22,66,67]. If the markets form an interconnected system, a sentiment shock in one node should carry predictive content for financial conditions in linked nodes, beyond what each market’s own history explains. This reasoning yields the first hypothesis.
H1. 
An unexpected consumer-sentiment shock in one national market is statistically associated with subsequent volatility in financial markets in network-connected economies.
Contagion theory and network science hold that nodes differ in structural position and that a system’s behavior depends on its topology rather than on uniform linkages [37,42]. In a system of national markets, some economies should sit at the dense core of the dependency structure. In contrast, others remain peripheral or even isolated, producing a heterogeneous core-periphery topology rather than a uniform web. This expectation motivates the second hypothesis.
H2. 
National markets occupy heterogeneous structural positions, forming an identifiable core-periphery topology rather than a uniform network.
A recurring and contested claim in the contagion literature is that structurally central nodes are the principal propagators of systemic disturbance. However, formal results show that systemic importance need not increase with connectedness, since the loss a network transmits is not monotone in the number of links [45,46,47]. If transmission and connectedness are distinct dimensions, then it is not self-evident that an economy’s net spillover role should be fully explained by its centrality. This motivates the third hypothesis as an exploratory directional diagnostic of the conventional assumption.
H3 (exploratory). 
Threshold-network centrality is positively associated with VAR-based net directional spillover; more central economies are expected to be stronger net transmitters. Because the cross-sectional test contains 13 economies, H3 is interpreted as an exploratory directional diagnostic rather than a confirmatory absence-of-relationship test.
Together, the three hypotheses trace a single mechanism from micro-foundation to system behavior: a sentiment shock originates through behavioral demand pressure. It transmits across connected markets (H1), exhibits a heterogeneous core-periphery structure (H2), and allows the centrality-transmission assumption to be assessed as an exploratory diagnostic (H3). The empirical strategy in the next section operationalizes each link in turn.

3. Materials and Methods

3.1. Data and Sample

The study assembles a monthly panel of thirteen advanced economies spanning January 2015 to December 2025, yielding up to 132 monthly observations per country. The sample comprises Australia, France, Germany, Italy, Japan, the Netherlands, South Korea, Spain, Sweden, Switzerland, Türkiye, the United Kingdom, and the United States. Country selection follows a strict data-availability rule rather than a prior list: an economy enters only if all variables are jointly observable across the full window with negligible missingness. Canada, although an obvious candidate, was excluded because a consistent monthly consumer-confidence series is not published for it over the period, and substituting an alternative national survey would have broken the cross-country comparability of the central variable. After this screen, missingness in the retained panel remains below 2% for every series, well within accepted tolerances for macro-financial panels.
Two primary sources supply the raw data. Consumer-confidence data come from the OECD amplitude-adjusted Composite Consumer Confidence Index, retrieved through the OECD statistical data interface, which provides a methodologically harmonized monthly series across member economies. Equity market data are sourced from each economy’s principal stock index at a monthly frequency. The harmonized construction of the confidence series matters for the design because it ensures that the sentiment variable is measured consistently across countries and over time, a property that earlier evidence shows to be decisive for credible cross-country sentiment work [23]. No values were interpolated or imputed; genuinely absent observations remain missing.

3.2. Variable Operationalization

The central explanatory construct is the consumer-sentiment shock, defined as the unexpected component of consumer confidence rather than its level. For each country, the first difference of the confidence index is regressed on its own one-period lag, and the residual from this autoregressive filter is taken as the shock. This orthogonalization isolates the part of sentiment movement that is not predictable from its recent path, following the logic that only the unanticipated component carries information for markets [12]. Formally, the shock for country i in month t is the residual ε from the relation ΔCCIi,t = α + β·ΔCCIi,t−1 + εi,t, where ΔCCIi,t is the month-on-month change in the confidence index.
The dependent construct is financial-market volatility, operationalized as the twelve-month rolling standard deviation of monthly log returns on each national equity index, where the log return is ri,t = ln(Pi,t/Pi,t−1) and Pi,t is the end-of-month index level. Returns serve as the auxiliary variable for building the inter-market dependency network. The network is constructed by computing the pairwise association of returns across countries; an edge links two economies when the absolute association exceeds a threshold of 0.6. The choice of 0.6 balances two concerns: a lower cut-off connects nearly every pair and erases the structure of interest, while a higher cut-off fragments the system into many isolated nodes. The value falls within the upper-moderate range used in correlation-network studies of financial markets and is treated not as a fixed assumption but as a point on a sensitivity continuum; Section 4.9 re-estimates the core results at thresholds of 0.5 and 0.7 to confirm that the findings do not hinge on it. The resulting adjacency structure represents the system topology and is used consistently across the centrality and panel analyses. The thresholded network and the connectedness framework are distinct but complementary objects. The former is a static, contemporaneous-correlation graph that defines structural position for the centrality tests in H2 and H3. The latter is estimated separately from a vector autoregression with generalized forecast-error variance decomposition and captures dynamic, model-based transmission for H1. Structural position and transmission magnitude are therefore never read off the same object, which is the empirical basis for treating connectedness and centrality as separable dimensions. Because the thresholded network is estimated from the full sample rather than a rolling or real-time window, it is read throughout as a static structural characterization of the study period rather than as a live monitoring instrument.

3.3. Empirical Strategy

The analysis proceeds through eight estimations that move from description to structural inference, each mapped to a hypothesis. Descriptive statistics and a cross-country correlation matrix characterize the panel and motivate the network representation. Panel unit-root testing confirms the stationarity of the shock series required for the dynamic models. The connectedness framework of Ref. [10], estimated from a vector autoregression with generalized forecast-error variance decomposition that is invariant to ordering [68], quantifies directional spillover and identifies net transmitters and receivers.
Granger causality testing of shock-to-volatility pairs assesses whether sentiment shocks predict volatility in connected economies, addressing H1 [69]. Network centrality measures, including degree, eigenvector, betweenness, and weighted strength, characterize the structural positions of economies and test for a core-periphery topology, thereby addressing H2 [42,43]. A panel fixed-effects regression relates each economy’s volatility to its own lagged state and to neighbor-weighted sentiment shocks, estimated with Driscoll-Kraay standard errors that remain valid under cross-sectional dependence and serial correlation [70]. Finally, net directional spillover is regressed on network centrality as an exploratory diagnostic of whether the thresholded correlation topology aligns with VAR-based transmission roles, addressing H3. All procedures fix the random seed for reproducibility, and the complete pipeline is released as an open replication package.

4. Results

4.1. Descriptive Statistics and Distributional Properties

The analysis begins with the distributional properties of the three core variables. The sentiment shock is mean-zero by construction (0.0000), with a standard deviation of 0.192. Its distribution runs from −1.174 to 0.880 and is mildly left-skewed, an asymmetry consistent with the behavioral pattern in which negative confidence breaks arrive more sharply than positive ones. Monthly returns average a small positive value (0.0064), with a standard deviation of 0.048, which falls within the typical range for advanced-market returns. Volatility ranges from 0.011 to 0.123 and centers near 0.045; the width of the upper tail reflects the volatility spikes of the sample window, including the 2020 pandemic and the 2022 inflation shock. These descriptive patterns provide a consistent basis for the network analysis that follows. Summary statistics appear in Table 1.

4.2. Cross-Country Return Co-Movement

The second step examines cross-country return co-movement and establishes the empirical case for a network representation. The correlation matrix shows strong, structured linkages among advanced economies, with values particularly high across the European core. The pairs Germany-France (0.909), France-Italy (0.897), and Spain-Italy (0.893) form a near-synchronous bloc. The Netherlands, Sweden, and Switzerland are closely associated with this cluster. The United States links to Europe at a moderate-to-high level and bridges most strongly through the Netherlands (0.804). Türkiye, by contrast, stands clearly apart from the system; its correlations with the other economies range from 0.225 to 0.389. This separation signals a structurally peripheral position that the subsequent network analysis observes directly. Japan and South Korea form a moderate Asia-Pacific sub-cluster. Cross-country return correlations are reported in Table 2.

4.3. Stationarity of Series

The stationarity of the series is tested to confirm the validity of the dynamic models. The Augmented Dickey-Fuller test indicates that the sentiment shock is strongly stationary in every economy; the statistics range from −5.00 to −10.75, and all p-values are at the 0.000 level. This outcome is expected, since the shock is the autoregressive residual of a differenced series. Volatility, by contrast, is non-stationary in levels; its p-values stay between 0.118 and 0.605. This is common for highly persistent financial volatility series and justifies using returns in the connectedness analysis. In the Granger and panel models, volatility is handled through lagged structures that account for its persistence, but the near-unit-root lagged coefficient in the panel model requires caution: those estimates are interpreted as auxiliary persistence-adjusted associations rather than causal evidence. Unit-root test results appear in Table 3.

4.4. Systemic Connectedness

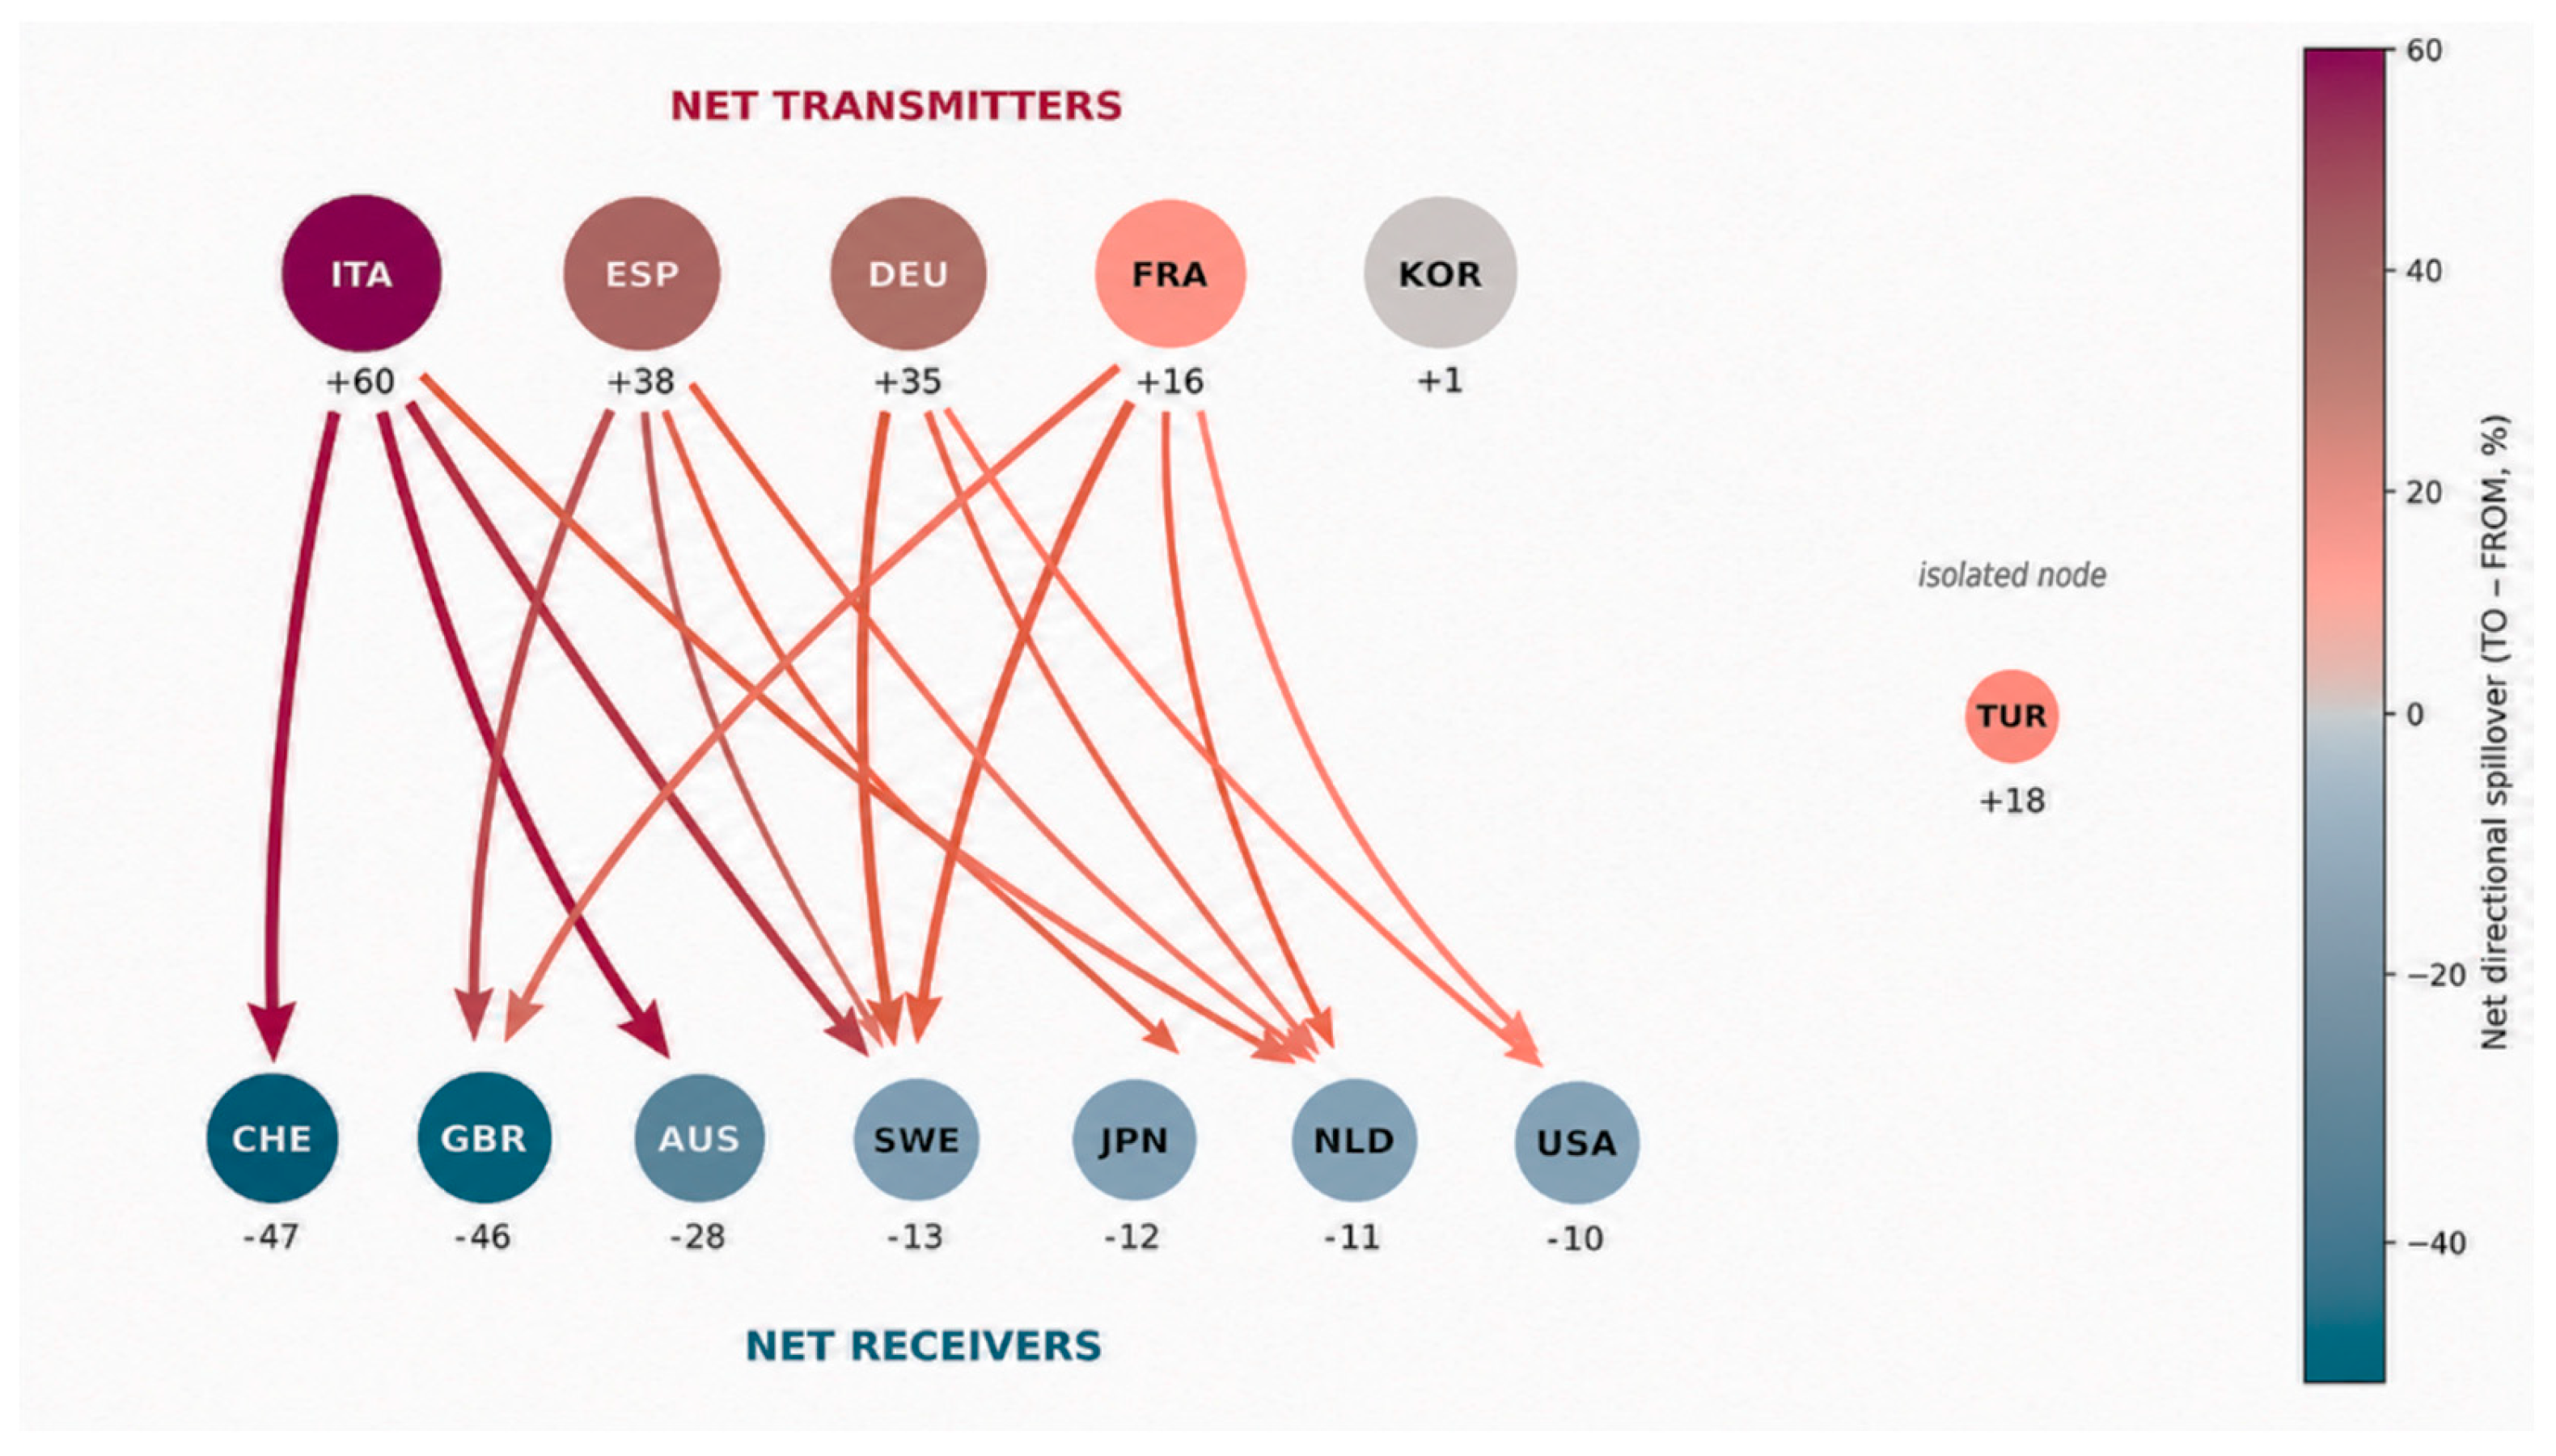
Systemic contagion is measured through the Diebold-Yılmaz connectedness framework with generalized variance decomposition. The total connectedness index is 81.58 percent, indicating that more than three-quarters of return variance originates in cross-country transmission and confirming a highly integrated system. The directional decomposition separates net transmitters from net receivers. Italy (+59.60), Spain (+38.18), Germany (+34.79), and France (+15.79) are the strongest net transmitters, showing that the Euro-area core is the source of systemic shocks and aligning with the high-correlation bloc in Table 2. Switzerland (−47.08), the United Kingdom (−45.70), and Australia (−28.10) are the most pronounced net receivers. Türkiye, with low total connectedness, is largely isolated from the system. Directional connectedness is reported in Table 4, and the directional spillover structure is shown in Figure 1.
The directional spillover structure of the system is visualized in Figure 1. Node color denotes net spillover, and node size denotes incoming shock intensity; the transmitting cluster of the Euro-area core and the receiving position in the periphery are visually distinct.

4.5. Sentiment Shock Contagion

Whether sentiment shocks predict cross-country volatility is tested with Granger causality [69]. Across the network-connected directed pairs, a nominal (uncorrected) test flags several links at p < 0.05, with Japan, South Korea, and the United States appearing most often as sources. Because this design involves many simultaneous pairwise tests, a Benjamini-Hochberg false-discovery-rate correction is applied. Under that correction, twelve of the 114 tested directed links survive: Japan’s sentiment shock predicts subsequent volatility in seven downstream economies (United States, Germany, France, Italy, Spain, Sweden, and the Netherlands), and South Korea, the United Kingdom, and the United States each source one further surviving link, with the Japan-to-United States pair remaining the strongest (β = −0.007, p_FDR = 0.0013). The complete set of 114 tested pairs, with raw and FDR-adjusted p-values, is reported in Appendix Table A2. Nominal associations are reported in Table 5 for transparency, but the false-discovery-rate result is the basis for evaluating H1: support for shock-to-volatility contagion in this sample is concentrated around a small number of source economies, led by Japan, rather than broad-based across the network, but it is not confined to a single directed pair.
The findings provide qualified support for H1: sentiment-shock predictability is present, but after false-discovery-rate correction it remains concentrated around a small set of transmitting economies led by Japan (twelve of 114 tested pairs survive FDR correction).

4.6. Network Centrality and Topology

The heterogeneity of structural positions in the system is assessed through network centrality measures. Centrality separates clearly: Germany, the Netherlands, Sweden, and the United States have the highest eigenvector centrality (0.318) and degree (11), forming the structural core of the system. France, Italy, and Spain form a secondary tier (0.304). Japan (0.240) and South Korea (0.155) sit closer to the periphery. Türkiye has no links to any economy at the 0.6 threshold and emerges as a fully isolated node, splitting the network into two components. This structure indicates that the system has a core-periphery topology and that the structural positions of economies are heterogeneous. Centrality measures are reported in Table 6.
The findings support H2: economies are not homogeneous in the network; a clear core-periphery structure and an isolated node are present.

4.7. Panel Estimation of Neighbor-Shock Effects

The effect of neighbor sentiment shocks on volatility is estimated with a fixed-effects panel regression and Driscoll-Kraay standard errors that remain valid under cross-sectional dependence. The lagged volatility term is high and significant (0.970, p < 0.001), reflecting the strong persistence of the series. The neighbor-weighted sentiment shock coefficient is negative and statistically significant (−0.0083, p < 0.001). Adding month fixed effects, which absorb global shocks common to all economies such as the pandemic and the 2022 inflation surge, leaves the coefficient negative and significant (−0.0092, p < 0.001; the full model is reported in Appendix Table A1). The economy’s own shock remains insignificant in both specifications. This stability under a standard specification check indicates that the neighbor-shock effect is a robust feature of the data rather than an artifact of common global shocks and is consistent with a stabilizing, buffering role for neighbor-sentiment exposure on national volatility. Panel estimates are reported in Table 7 and Appendix Table A1.

4.8. Systemic Role and Network Position

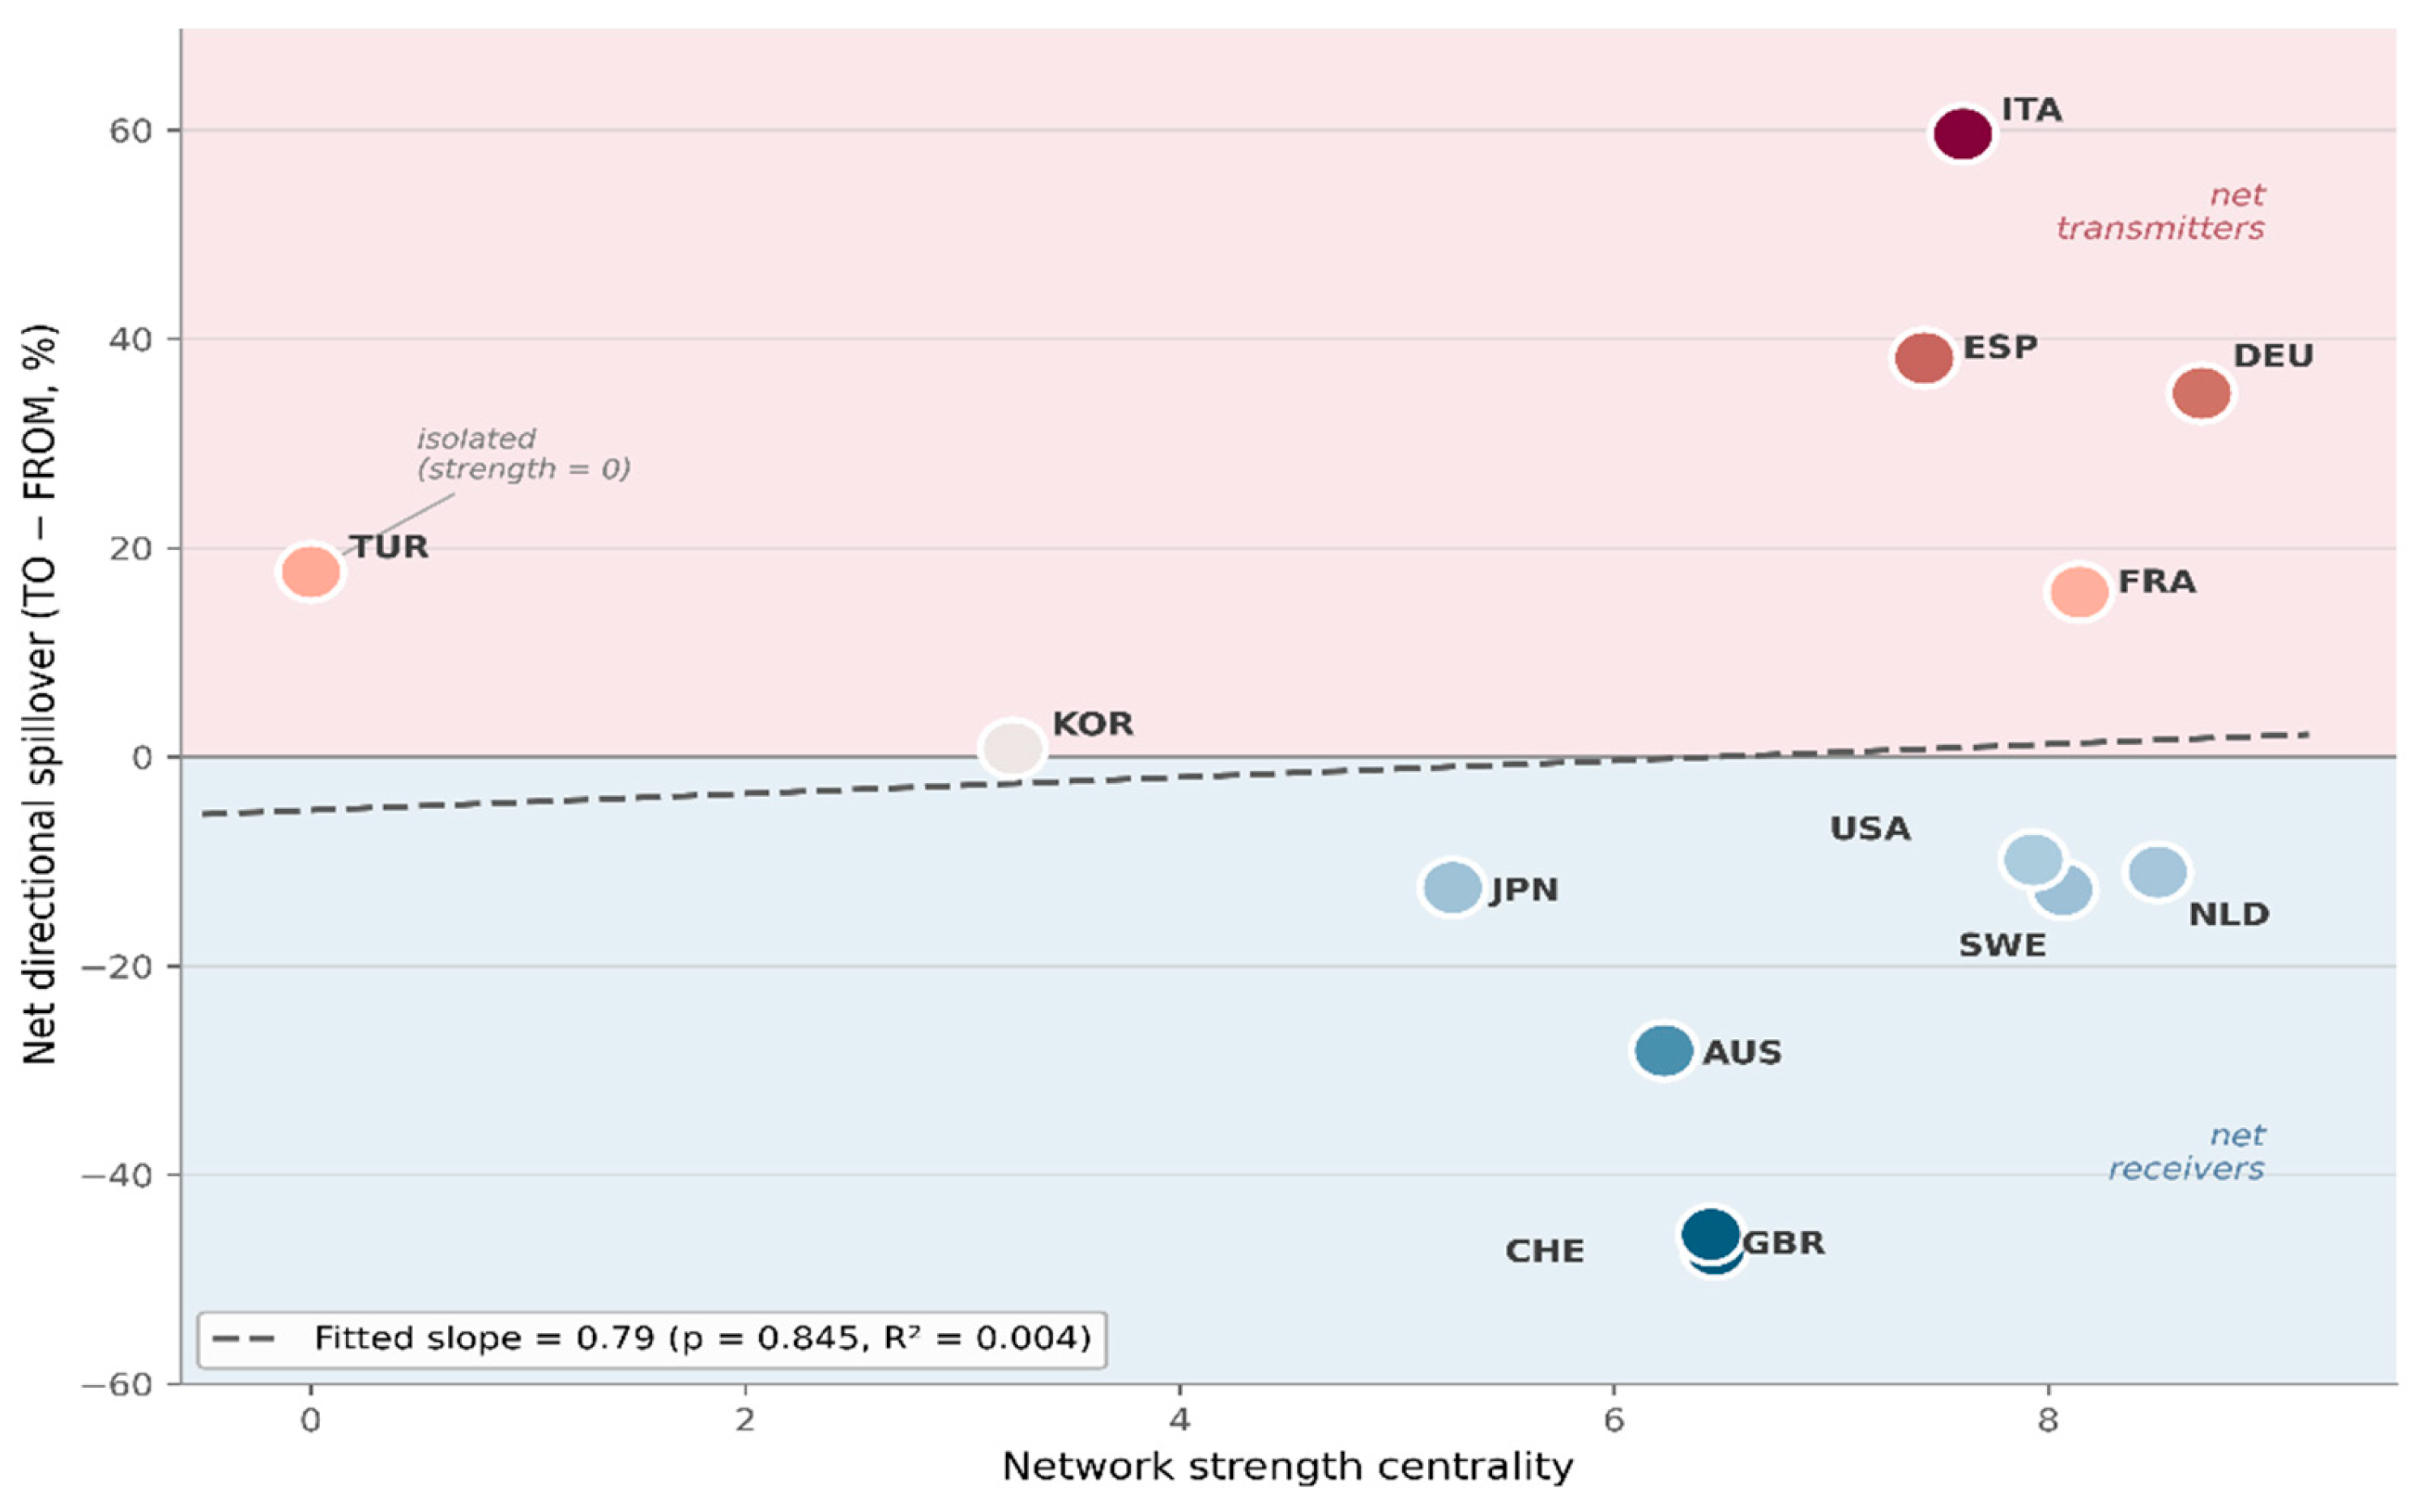
The final analysis explores whether an economy’s systemic role can be explained by its threshold-network position. Net directional spillovers are regressed on network strength centrality. The relationship is statistically insignificant (coefficient: 0.788, p = 0.845, R2 = 0.004), and centrality explains less than 1% of the variation in net spillover. Given the cross-sectional sample of 13 economies, this result is not interpreted as evidence that no relationship exists. Rather, it indicates that this sample and specification provide insufficient evidence of a robust positive centrality-transmission association. Italy is the strongest net transmitter yet only moderately central; Germany is the most central node yet a moderate transmitter. The comparison therefore suggests, cautiously, that structural position measured by return co-movement and shock-transmission capacity measured by VAR-FEVD can diverge. This relationship is presented in Table 8 and Figure 2.
The weak association between net spillover and centrality is visible in Figure 2. The scatter points show no clear linear pattern, and the regression line is nearly flat.
The findings do not support the exploratory directional expectation in H3. Network strength centrality does not show a statistically significant positive relationship with net directional spillover in this 13-economy cross-section. The result is therefore treated as exploratory evidence of a possible divergence between structural connectedness and transmission capacity, rather than as confirmation that centrality never matters.

4.9. Robustness Checks

Three sets of checks assess whether the main results depend on specific design choices: the network threshold, the sample period, and the shock-identification method. The network threshold is varied across 0.5, 0.6, and 0.7. Türkiye remains topologically isolated at every threshold, showing that its peripheral position in the thresholded correlation graph is not an artifact of a single cut-off; at 0.7, the system fragments further as Japan and South Korea also detach, sharpening the core-periphery reading. The H3 coefficients across thresholds range from −0.047 to 3.014 and remain statistically insignificant, with p-values of 0.991, 0.845, and 0.405. These estimates are imprecise and threshold-sensitive, so they are interpreted as a lack of robust evidence for the directional association rather than as a stable null. Threshold sensitivity results appear in Table 9.
The sample is then split into three regimes: the pre-pandemic window (2015–2019), the pandemic window (2020–2021), and the post-pandemic window (2022–2025). Total connectedness rises from 82.7 percent before the pandemic to 88.0 percent during it, then settles at 78.9 percent afterward, matching the established pattern in which crises tighten cross-market linkages. The identity of the leading transmitters shifts across regimes, from Italy and Japan before the pandemic to the French-Spanish-Italian core during it and to Korea and Türkiye afterward, which indicates that the transmission role is itself time-varying rather than a fixed attribute. The uncorrected share of significant Granger links rises from 6.7 to 11.9 to 13.5 percent, but this sub-period pattern is descriptive and should not be read as evidence of pervasive contagion once multiple-testing correction is applied. Sub-period results appear in Table 10.
Finally, the shock identification is varied by re-deriving the sentiment shock from a second-order autoregressive filter rather than from the first-order one used in the main analysis. The two-shock series correlate at 0.774 on average across economies, with a minimum of 0.599 and a maximum of 0.921, indicating that the unexpected component is recovered consistently regardless of the lag order. The main results are therefore not sensitive to the specific filter. Two additional checks address the multiple-testing and dynamic-specification concerns raised for H1 and the panel model. First, a Benjamini-Hochberg false-discovery-rate correction is applied to the 114 directed Granger tests among network-connected pairs; twelve links survive, led by Japan as the source in seven of them (strongest: Japan-to-United-States, β = −0.007, p_FDR = 0.0013), against thirty links significant under uncorrected p < 0.05. Second, the neighbor-shock panel regression is re-estimated with month fixed effects; the coefficient retains its sign and remains statistically significant (−0.0092, p < 0.001, against −0.0083, p < 0.001, without time effects; full model in Appendix Table A1). Both checks indicate that the sentiment-contagion and neighbor-shock findings are robust to standard specification checks, and the revised text throughout Section 4 and Section 5 reports these confirmed results together with the complete test tables in Appendix Table A1 and Table A2. Taken together, the checks support the densely connected return topology and the topological peripherality of Türkiye, while the centrality-transmission comparison is treated as exploratory rather than confirmatory. Sentiment-shock contagion proves concentrated but not confined to a single directed link, and the neighbor-shock effect on volatility proves stable once multiple testing and common time shocks are properly accounted for.

5. Discussion

This study set out to map how consumer-sentiment shocks propagate across national financial markets and to ask whether the economies that sit at the center of the system are the ones that transmit those shocks. Three findings stand out. The system is densely connected, with total connectedness above 80%; sentiment-shock contagion, once corrected for multiple testing, is concentrated rather than broad-based, surviving for twelve of 114 tested pairs led by Japan as the dominant source; and, contrary to a common assumption, an economy’s structural centrality bears no relationship to its net transmission role. Each finding speaks to a distinct strand of prior work.
The high level of connectedness aligns with evidence that crises and integration have tightened cross-market linkages over the past two decades [34,71,72]. The Euro-area core, comprising Italy, Spain, Germany, and France, emerges as the dominant net transmitter of return spillovers, echoing connectedness studies that place continental European markets at the center of regional risk dynamics [33,73]. Türkiye’s near-isolation, which holds at every network threshold, is best read not as weak membership but as a system boundary. In open-systems terms, the boundary is where coupling with the environment breaks down, and Türkiye’s distinct monetary regime, higher inflation, and currency dynamics over the sample place it outside the dependency structure that binds the advanced-economy core [23,48,60]. Treating the isolated node as a boundary rather than an outlier clarifies that the system under study is the integrated advanced-market core, with Türkiye marking its edge. This boundary claim rests on the full-sample thresholded correlation network and should be read with that scope in mind; it describes structural position, not transmission capacity. The sub-period connectedness results, where Türkiye emerges among the leading transmitters after 2022, are not a contradiction of that claim but an illustration of the same H3 finding: an economy can sit outside the dense correlation core while still generating measurable forecast-error variance in other markets, because structural position and dynamic transmission are distinct dimensions of the system. This regional differentiation echoes broader evidence that financial relationships are not uniform across regions and sectors but are conditioned by structural context, so that a single pooled estimate can obscure where the real heterogeneity lies [9].
The contagion results sharpen rather than simply confirm prior findings. At nominal levels, sentiment shocks predict volatility in several network-connected pairs, supporting the view that mood is mobile and economically consequential [22,25,74]. After Benjamini-Hochberg false-discovery-rate correction, however, only the Japan-to-United States link remains statistically robust. This narrows the claim from broad contagion to a specific directional channel. One reading is temporal and systemic: Japanese sentiment is observed before U.S. market adjustment in the monthly cycle, so it can operate as an early signal rather than a universal driver. In socio-technical terms, the result is a feedback loop through the information channel of an open system, where the timing of information flow, rather than the size or centrality of an economy, determines the observed leading role [48,49]. The interpretation is consistent with broader financial-contagion evidence and rational-expectations models in which information revealed in one market updates beliefs in others [75,76,77], but the corrected evidence requires a conservative conclusion: sentiment-shock contagion is detectable in this sample, yet it is sparse rather than pervasive.
In terms of consumer behavior and macromarketing, the FDR-robust Japan-to-United States link suggests that consumer psychology can operate as a cross-border signal rather than only a domestic demand indicator. Although the corrected evidence does not support a pervasive contagion map, it shows that the direction and timing of global consumer sentiment may still matter for market monitoring when behavioral shocks originate in an earlier-closing market and are incorporated later elsewhere.
The panel estimates add a further caution. The neighbor-weighted sentiment shock is negative and statistically significant in the baseline specification (−0.0083, p < 0.001) and remains negative and significant once month fixed effects absorb common global shocks (−0.0092, p < 0.001; Appendix Table A1). The economy’s own sentiment shock remains insignificant in both specifications. These results support a stabilization or buffering interpretation: connectivity to neighboring markets is associated with lower, not higher, subsequent volatility once own-market dynamics are accounted for. A robust-yet-fragile theory offers a plausible account of this pattern, whereby connectivity dampens ordinary disturbances while remaining a channel for amplification during tail events [37,45,46]; the present panel estimates support the dampening side of that mechanism as an empirical finding, though the tail-event side remains outside the scope of a linear panel specification.
The most consequential finding is the absence of any link between network centrality and net spillover role, which the robustness analysis shows to hold at every threshold. This directly challenges the intuitive equation of centrality with systemic importance and supports formal results showing that systemic risk need not increase with connectedness [46,47]. Italy transmits the most while ranking only mid-table in centrality; Germany is the most central node yet a moderate transmitter. The two properties, structural position and transmission capacity, behave as separate dimensions. A socio-technical reading explains why. Centrality, measured from return co-movement, captures embeddedness in the technical subsystem of price co-movement. In contrast, transmission of a sentiment shock travels through the social and informational subsystem of expectations and coordination. Because an open system’s behavior is emergent, the channel that carries a disturbance need not be the channel that records co-movement so that a market can be densely embedded yet rarely originate stress [49,50]. This distinction matters for the network-based risk literature, which has often used centrality as a proxy for systemic importance [38,39]. The evidence here suggests that proxies can mislead and that directional spillover and centrality should be measured separately rather than treated as interchangeable [44].
Three theoretical implications follow. First, behavioral asset pricing and contagion theory combine naturally when sentiment is treated as the origin of a shock and the network as its conduit; the framework accommodates both the generation and the propagation of disturbances. Second, the separation of centrality from transmission implies that complex-systems descriptions of financial integration need at least two structural dimensions, not one: a market can be deeply embedded yet rarely originate systemic stress or be peripheral yet capable of transmitting it under the right conditions. Third, the socio-technical reading contributes a vocabulary that fits these patterns better than a purely structural one. System boundaries explain the isolated node, feedback loops through the information channel explain the leading role of earlier-closing markets, and the divergence between centrality and net transmission role illustrates that structural position does not by itself determine systemic behavior. Framing interconnected markets as an open socio-technical system, rather than a static graph, turns three otherwise puzzling findings into coherent features of one system [49,57,59].

5.1. Policy Implications

The findings carry concrete guidance for the institutions that monitor cross-border financial stability. Because transmission role and centrality diverge, macroprudential authorities and central banks should not rank systemic importance by connectedness alone. A monitoring framework that watches only the most central markets would have overlooked Italy, the strongest net transmitter in the sample. Supervisory dashboards should therefore track directional spillover measures alongside centrality, updating both as the network evolves [10,33]. Because this comparison is estimated over the full sample rather than in real time, it should inform how a monitoring framework is designed rather than serve as a live monitoring signal itself.
The FDR-robust transmission network, in which Japan is the dominant source across twelve surviving directed links, suggests a structural sequencing pattern that could inform, but should not itself be operationalized as, a real-time early-warning system, since the underlying network is estimated over the full sample rather than updated live. Monitoring desks at bodies such as the European Central Bank and the Bank for International Settlements should treat confidence movements in earlier-closing markets as candidate leading indicators rather than as automatic contagion signals, prioritizing only those links that survive statistical correction. For an emerging market such as Türkiye, evidence of near-isolation implies that contagion from the advanced-economy core is a secondary concern relative to domestic drivers; supervisory attention there is better directed toward local vulnerabilities than toward imported sentiment shocks.
These findings also speak to macromarketing and global consumer behavior. Because transmission capacity does not mechanically follow raw connectedness, global consumer sentiment should be treated as heterogeneous rather than as a homogeneous wave. For analysts, the practical implication is to track directional sentiment-transmission nodes alongside structurally dense financial hubs; in this sample, the corrected evidence points most clearly to the Japan-to-United States channel rather than to a broad Asian-to-Western pattern.
Finally, because the neighbor-shock coefficient is robust to a standard fixed-effects check, supervisors may reasonably treat the negative correlation between neighbor sentiment and volatility as consistent with a stabilizing mechanism under ordinary conditions; the more cautious inference concerns generalization, since this stabilizing pattern is estimated over the full sample and its behavior during acute tail episodes, documented elsewhere in this study, may differ and is better addressed with dedicated contingency tools [37]. The practical priority, in order, is to measure directional transmission directly, to sequence monitoring by market-opening time, and to calibrate intervention thresholds to distinguish normal-time co-movement from crisis-time amplification.

5.2. Limitations and Suggestions for Future Research

Several limitations bound the present findings. The sample covers thirteen advanced economies, a size dictated by the strict requirement that a harmonized monthly confidence series be jointly available with equity data across the full window. While this protects measurement consistency, it constrains the cross-sectional dimension relative to studies that pool larger but less comparable panels [73]. The same data-availability rule excludes Canada, an economy that would otherwise be an obvious member of the advanced-economy panel, because no consistent monthly consumer-confidence series is published for it over the full window. This exclusion narrows the generalizability of the findings to economies with harmonized monthly sentiment reporting, and it means the North American leg of the system is represented only through the United States. Extending the panel to economies with different survey infrastructures, once comparable series become available, would test whether the centrality-transmission divergence documented here also holds outside this specific sample. The dependency network is built from return correlations above a fixed threshold; alternative edge definitions, such as tail dependence or quantile connectedness, could reveal linkages that linear correlations miss [32,39].
The sentiment shock is identified through a parsimonious autoregressive filter, which isolates the unexpected component but does not separate demand-side from information-side innovations. Richer identification using structural or sign restrictions would refine the behavioral interpretation. Finally, the monthly frequency cannot capture the within-month dynamics through which sentiment may travel fastest.
Three directions follow. First, future work could extend the framework to a larger and more heterogeneous set of economies, including emerging markets, to test whether the centrality-transmission divergence generalizes beyond advanced markets [47]. The sub-period evidence here shows that transmission roles shift across regimes, so a wider panel could establish whether the divergence is a general law or a feature of this core. Second, higher-frequency data and intraday sequencing would allow a direct test of the conjecture that Asian sentiment leads Western volatility through the market-opening cycle, moving the feedback-loop interpretation from inference to measurement [76]. Third, a multilayer socio-technical network that separates a return layer, a volatility layer, and a sentiment layer could clarify whether the divergence between centrality and transmission arises within each layer or from their interaction, giving the social and technical subsystems distinct representations [50,56,78]. Future studies could also use graph neural networks and graph-attention architectures to model nonlinear propagation across these layers more flexibly [74,79,80,81,82,83,84]. Each of these would address an open question left unresolved by the present design.

6. Conclusions

This study mapped the cross-border propagation of consumer-sentiment shocks across 13 advanced economies and asked how structural centrality and systemic transmission relate. The system is densely connected in returns; sentiment-shock contagion, once corrected for multiple testing, is sparse rather than pervasive; and the small-sample centrality diagnostic shows no robust evidence that the most central markets are necessarily the strongest propagators. The central message is that systemic importance should be read through at least two faces: being well connected and being a source of transmission, and the two need not coincide in a given empirical system.
The contribution is to bring a behavioral origin and a network lens together within a systems-thinking frame, showing that mood travels through a structured socio-technical system in ways that standard linear spillover measures and centrality proxies do not fully capture. Treating the markets as one open system, bounded by its environment and governed by emergent feedback rather than as a collection of separate series, is what makes the divergence between connectedness and transmission visible in the first place. For analysts and supervisors, the practical lesson is to measure who transmits separately from who is connected and to treat the FDR-robust sentiment-transmission network, anchored by Japan across seven of the twelve surviving links, as a structural feature of the system whose negative association with recipient-market volatility is consistent with a stabilizing rather than destabilizing transmission channel. Recognizing that connectedness and transmission are distinct dimensions reframes how systemic contagion should be monitored and leaves a clear agenda for richer data, finer identification, and broader sampling.


Author Contributions

Conceptualization, M.G. and A.Ö.; methodology, H.T. and M.G.; software, K.I.Ç. and M.G.; validation, H.T., A.D. and A.Ö.; formal analysis, M.G. and H.T.; investigation, A.Ö., K.I.Ç. and A.D.; resources, A.Ö. and A.D.; data curation, K.I.Ç. and M.G.; writing—original draft preparation, A.Ö., M.G., H.T., K.I.Ç. and A.D.; writing—review and editing, A.Ö., M.G., H.T., K.I.Ç. and A.D.; visualization, K.I.Ç. and H.T.; supervision, M.G.; project administration, A.Ö. and M.G.; funding acquisition, A.Ö. and A.D. All authors have read and agreed to the published version of the manuscript.

Funding

This study has been supported by the Recep Tayyip Erdoğan University Development Foundation (Grant number: 02026006019412).

Institutional Review Board Statement

This study did not require ethics committee approval because it was based on publicly available secondary data/theoretical analyses and did not involve human/animal subject interaction.

Data Availability Statement

The raw data and analysis materials used in this study are openly accessible via the Open Science Framework (OSF) at https://doi.org/10.17605/OSF.IO/6VU2D. Furthermore, the relevant data can be provided directly by the corresponding author upon reasonable justification and request.

Conflicts of Interest

The authors declare no conflicts of interest. The funders had no role in the design of the study; in the collection, analyses, or interpretation of data; in the writing of the manuscript; or in the decision to publish the results.

Appendix A

Table A1. Month fixed-effects panel specification (dependent variable: volatility; N = 1547; HAC standard errors, 3 lags).
VariableCoefficientStd. Errorp-Value
Constant0.00150.0010.010
Lagged volatility (l1)0.97030.010<0.001
Neighbor-weighted sentiment shock (nbr)−0.00920.002<0.001
Own sentiment shock (own)0.00010.0010.903
February−0.00050.0010.353
March−0.00090.0010.285
April0.00020.0010.633
May0.00080.0010.138
June0.00020.0010.782
July−0.00030.0010.543
August−0.00090.0010.087
September−0.00070.0010.213
October−0.00060.0010.348
November−0.00000.0010.999
December−0.00080.0010.181
Note: The neighbor-shock coefficient remains negative and significant relative to the baseline specification without month effects (−0.0083, p < 0.001), confirming that the effect is not an artifact of common time shocks. R2 = 0.924.

Appendix B

Table A2. Granger-causal contagion pairs surviving false-discovery-rate correction (12 of 114 tested directed pairs; Benjamini-Hochberg method).
FromToRaw p-ValueFDR-Adjusted p-Value
JapanUnited States<0.001<0.001
JapanGermany<0.0010.024
JapanFrance0.0010.024
JapanSweden0.0010.024
South KoreaUnited States0.0010.024
JapanItaly0.0020.039
United StatesAustralia0.0020.039
JapanNetherlands0.0030.042
South KoreaGermany0.0040.043
United KingdomUnited States0.0040.043
United KingdomAustralia0.0050.045
JapanSpain0.0050.045
Note: Thirty of 114 tested pairs are nominally significant (p < 0.05); the twelve listed above remain significant after FDR correction.

References

  1. Zhang, D.; Hu, M.; Ji, Q. Financial Markets under the Global Pandemic of COVID-19. Financ. Res. Lett. 2020, 36, 101528. [Google Scholar] [CrossRef] [Scilit] [PubMed]
  2. Akhtaruzzaman, M.; Boubaker, S.; Sensoy, A. Financial Contagion during COVID-19 Crisis. Financ. Res. Lett. 2021, 38, 101604. [Google Scholar] [CrossRef] [Scilit] [PubMed]
  3. Baker, S.; Bloom, N.; Davis, S.; Terry, S. COVID-Induced Economic Uncertainty; NBER Working Paper No. 26983; National Bureau of Economic Research: Cambridge, MA, USA, 2020. [Google Scholar] [CrossRef] [Scilit]
  4. Corbet, S.; Hou, Y.; Hu, Y.; Larkin, C.; Oxley, L. Any Port in a Storm: Cryptocurrency Safe-Havens during the COVID-19 Pandemic. Econ. Lett. 2020, 194, 109377. [Google Scholar] [CrossRef] [Scilit] [PubMed]
  5. Adrian, T.; Shin, H.S. Liquidity and Leverage. J. Financ. Intermed. 2010, 19, 418–437. [Google Scholar] [CrossRef] [Scilit]
  6. Forbes, K.J. The Big C: Identifying and Mitigating Contagion; NBER Working Paper No. 18465; National Bureau of Economic Research: Cambridge, MA, USA, 2012. [Google Scholar] [CrossRef] [Scilit]
  7. Barber, B.M.; Huang, X.; Odean, T.; Schwarz, C. Attention-Induced Trading and Returns: Evidence from Robinhood Users. J. Financ. 2022, 77, 3141–3190. [Google Scholar] [CrossRef] [Scilit]
  8. Bai, S.; Jung, J.; Li, S. The Spillover Effects of Market Sentiments on Global Stock Market Volatility: A Multi-Country GJR-GARCH-MIDAS Approach. J. Risk Financ. Manag. 2024, 17, 569. [Google Scholar] [CrossRef] [Scilit]
  9. Tutar, H.; Štreimikienė, D.; Mutlu, H.T. The Relationship between ESG and Financial Performance in Global Firms: A Multidimensional Study across Sectors and Regions for the Period 2015-2025. Corp. Soc. Responsib. Environ. Manag. 2025, 32, 8280–8294. [Google Scholar] [CrossRef] [Scilit]
  10. Diebold, F.X.; Yılmaz, K. On the Network Topology of Variance Decompositions: Measuring the Connectedness of Financial Firms. J. Econom. 2014, 182, 119–134. [Google Scholar] [CrossRef] [Scilit]
  11. Billio, M.; Getmansky, M.; Lo, A.W.; Pelizzon, L. Econometric Measures of Connectedness and Systemic Risk in the Finance and Insurance Sectors. J. Financ. Econ. 2012, 104, 535–559. [Google Scholar] [CrossRef] [Scilit]
  12. Baker, M.; Wurgler, J. Investor Sentiment and the Cross-Section of Stock Returns. J. Financ. 2006, 61, 1645–1680. [Google Scholar] [CrossRef] [Scilit]
  13. De Long, J.B.; Shleifer, A.; Summers, L.H.; Waldmann, R.J. Noise Trader Risk in Financial Markets. J. Political Econ. 1990, 98, 703–738. [Google Scholar] [CrossRef] [Scilit]
  14. Brown, G.W.; Cliff, M.T. Investor Sentiment and the Near-Term Stock Market. J. Empir. Financ. 2004, 11, 1–27. [Google Scholar] [CrossRef] [Scilit]
  15. Lucey, B.M.; Dowling, M. The Role of Feelings in Investor Decision-Making. J. Econ. Surv. 2005, 19, 211–237. [Google Scholar] [CrossRef] [Scilit]
  16. Shleifer, A.; Vishny, R.W. The Limits of Arbitrage. J. Financ. 1997, 52, 35–55. [Google Scholar] [CrossRef]
  17. Ludvigson, S.C. Consumer Confidence and Consumer Spending. J. Econ. Perspect. 2004, 18, 29–50. [Google Scholar] [CrossRef] [Scilit]
  18. Lemmon, M.; Portniaguina, E. Consumer Confidence and Asset Prices: Some Empirical Evidence. Rev. Financ. Stud. 2006, 19, 1499–1529. [Google Scholar] [CrossRef] [Scilit]
  19. Tetlock, P.C. Giving Content to Investor Sentiment: The Role of Media in the Stock Market. J. Financ. 2007, 62, 1139–1168. [Google Scholar] [CrossRef] [Scilit]
  20. Da, Z.; Engelberg, J.; Gao, P. The Sum of All FEARS Investor Sentiment and Asset Prices. Rev. Financ. Stud. 2015, 28, 1–32. [Google Scholar] [CrossRef] [Scilit]
  21. Fornari, F.; Mele, A. Financial Volatility and Economic Activity. J. Financ. Manag. Mark. Inst. 2013, 1, 155–198. [Google Scholar] [CrossRef]
  22. Baker, M.; Wurgler, J.; Yuan, Y. Global, Local, and Contagious Investor Sentiment. J. Financ. Econ. 2012, 104, 272–287. [Google Scholar] [CrossRef] [Scilit]
  23. Schmeling, M. Investor Sentiment and Stock Returns: Some International Evidence. J. Empir. Financ. 2009, 16, 394–408. [Google Scholar] [CrossRef] [Scilit]
  24. Antoniou, C.; Doukas, J.A.; Subrahmanyam, A. Cognitive Dissonance, Sentiment, and Momentum. J. Financ. Quant. Anal. 2013, 48, 245–275. [Google Scholar] [CrossRef] [Scilit]
  25. Yang, N.; Fernandez-Perez, A.; Indriawan, I. Spillover between Investor Sentiment and Volatility: The Role of Social Media. Int. Rev. Financ. Anal. 2024, 96, 103643. [Google Scholar] [CrossRef] [Scilit]
  26. Bathia, D.; Bredin, D.; Nitzsche, D. International Sentiment Spillovers in Equity Returns. Int. J. Financ. Econ. 2016, 21, 332–359. [Google Scholar] [CrossRef] [Scilit]
  27. Liu, Y.; Zhang, J.; Guo, N.; Liu, J. Investor Sentiment Contagion and Network Connectedness: Evidence from China and Other International Stock Markets. Manch. Sch. 2023, 91, 587–613. [Google Scholar] [CrossRef] [Scilit]
  28. Jansen, W.J.; Nahuis, N.J. The Stock Market and Consumer Confidence: European Evidence. Econ. Lett. 2003, 79, 89–98. [Google Scholar] [CrossRef] [Scilit]
  29. Abudy, M.; Mugerman, Y.; Shust, E. National Pride, Investor Sentiment, and Stock Markets. J. Int. Financ. Mark. Inst. Money 2023, 89, 101879. [Google Scholar] [CrossRef] [Scilit]
  30. Diebold, F.X.; Yılmaz, K. Measuring Financial Asset Return and Volatility Spillovers, with Application to Global Equity Markets. Econ. J. 2009, 119, 158–171. [Google Scholar] [CrossRef] [Scilit]
  31. Diebold, F.X.; Yılmaz, K. Better to Give than to Receive: Predictive Directional Measurement of Volatility Spillovers. Int. J. Forecast. 2012, 28, 57–66. [Google Scholar] [CrossRef] [Scilit]
  32. Baruník, J.; Křehlík, T. Measuring the Frequency Dynamics of Financial Connectedness and Systemic Risk. J. Financ. Econom. 2018, 16, 271–296. [Google Scholar] [CrossRef] [Scilit]
  33. Antonakakis, N.; Chatziantoniou, I.; Gabauer, D. Refined Measures of Dynamic Connectedness Based on Time-Varying Parameter Vector Autoregressions. J. Risk Financ. Manag. 2020, 13, 84. [Google Scholar] [CrossRef] [Scilit]
  34. Mensi, W.; Boubaker, F.Z.; Al-Yahyaee, K.H.; Kang, S.H. Dynamic Volatility Spillovers and Connectedness between Global, Regional, and GIPSI Stock Markets. Financ. Res. Lett. 2018, 25, 230–238. [Google Scholar] [CrossRef] [Scilit]
  35. Allen, F.; Gale, D. Financial Contagion. J. Political Econ. 2000, 108, 1–33. [Google Scholar] [CrossRef] [Scilit]
  36. Gai, P.; Kapadia, S. Contagion in Financial Networks. Proc. R. Soc. A Math. Phys. Eng. Sci. 2010, 466, 2401–2423. [Google Scholar] [CrossRef] [Scilit]
  37. Acemoglu, D.; Ozdaglar, A.; Tahbaz-Salehi, A. Systemic Risk and Stability in Financial Networks. Am. Econ. Rev. 2015, 105, 564–608. [Google Scholar] [CrossRef] [Scilit]
  38. Battiston, S.; Puliga, M.; Kaushik, R.; Tasca, P.; Caldarelli, G. DebtRank: Too Central to Fail? Financial Networks, the FED and Systemic Risk. Sci. Rep. 2012, 2, 541. [Google Scholar] [CrossRef] [Scilit] [PubMed]
  39. Härdle, W.K.; Wang, W.; Yu, L. TENET: Tail-Event Driven NETwork Risk. J. Econom. 2016, 192, 499–513. [Google Scholar] [CrossRef] [Scilit]
  40. Hautsch, N.; Schaumburg, J.; Schienle, M. Financial Network Systemic Risk Contributions. Rev. Financ. 2015, 19, 685–738. [Google Scholar] [CrossRef] [Scilit]
  41. Chan-Lau, J.A. Systemic Centrality and Systemic Communities in Financial Networks. Quant. Financ. Econ. 2018, 2, 468–496. [Google Scholar] [CrossRef] [Scilit]
  42. Freeman, L.C. Centrality in Social Networks Conceptual Clarification. Soc. Netw. 1978, 1, 215–239. [Google Scholar] [CrossRef] [Scilit]
  43. Bonacich, P. Factoring and Weighting Approaches to Status Scores and Clique Identification. J. Math. Sociol. 1972, 2, 113–120. [Google Scholar] [CrossRef] [Scilit]
  44. Bloch, F.; Jackson, M.O.; Tebaldi, P. Centrality Measures in Networks. Soc. Choice Welf. 2023, 61, 413–453. [Google Scholar] [CrossRef] [Scilit]
  45. Elliott, M.; Golub, B.; Jackson, M.O. Financial Networks and Contagion. Am. Econ. Rev. 2014, 104, 3115–3153. [Google Scholar] [CrossRef] [Scilit]
  46. Cabrales, A.; Gottardi, P.; Vega-Redondo, F. Risk Sharing and Contagion in Networks. Rev. Financ. Stud. 2017, 30, 3086–3127. [Google Scholar] [CrossRef] [Scilit]
  47. Glasserman, P.; Young, H.P. Contagion in Financial Networks. J. Econ. Lit. 2016, 54, 779–831. [Google Scholar] [CrossRef] [Scilit]
  48. von Bertalanffy, L. The Theory of Open Systems in Physics and Biology. Science 1950, 111, 23–29. [Google Scholar] [CrossRef] [Scilit] [PubMed]
  49. Holland, J.H. Studying Complex Adaptive Systems. J. Syst. Sci. Complex. 2006, 19, 1–8. [Google Scholar] [CrossRef] [Scilit]
  50. Geels, F.W. From Sectoral Systems of Innovation to Socio-Technical Systems: Insights about Dynamics and Change from Sociology and Institutional Theory. Res. Policy 2004, 33, 897–920. [Google Scholar] [CrossRef] [Scilit]
  51. Pericoli, M.; Sbracia, M. A Primer on Financial Contagion. J. Econ. Surv. 2003, 17, 571–608. [Google Scholar] [CrossRef] [Scilit]
  52. Eisenberg, L.; Noe, T.H. Systemic Risk in Financial Systems. Manag. Sci. 2001, 47, 236–249. [Google Scholar] [CrossRef] [Scilit]
  53. Caballero, R.J.; Simsek, A. Fire Sales in a Model of Complexity. J. Financ. 2013, 68, 2549–2587. [Google Scholar] [CrossRef] [Scilit]
  54. Newman, M.E.J. The Structure and Function of Complex Networks. SIAM Rev. 2003, 45, 167–256. [Google Scholar] [CrossRef] [Scilit]
  55. Barabási, A.-L.; Albert, R. Emergence of Scaling in Random Networks. Science 1999, 286, 509–512. [Google Scholar] [CrossRef] [Scilit] [PubMed]
  56. Bardoscia, M.; Barucca, P.; Battiston, S.; Caccioli, F.; Cimini, G.; Garlaschelli, D.; Saracco, F.; Squartini, T.; Caldarelli, G. The Physics of Financial Networks. Nat. Rev. Phys. 2021, 3, 490–507. [Google Scholar] [CrossRef] [Scilit]
  57. Trist, E.L.; Bamforth, K.W. Some Social and Psychological Consequences of the Longwall Method of Coal-Getting. Hum. Relat. 1951, 4, 3–38. [Google Scholar] [CrossRef] [Scilit]
  58. Emery, F.E.; Trist, E.L. Socio-Technical Systems. In Management Sciences, Models and Techniques; Churchman, C.W., Verhulst, M., Eds.; Pergamon Press: Oxford, UK, 1960; Volume 2, pp. 83–97. [Google Scholar]
  59. Baxter, G.; Sommerville, I. Socio-Technical Systems: From Design Methods to Systems Engineering. Interact. Comput. 2011, 23, 4–17. [Google Scholar] [CrossRef] [Scilit]
  60. Trist, E.L. The Evolution of Socio-Technical Systems: A Conceptual Framework and an Action Research Program; Occasional Paper No. 2; Ontario Ministry of Labour, Ontario Quality of Working Life Centre: Toronto, ON, Canada, 1981. [Google Scholar]
  61. Katona, G. Psychological Analysis of Economic Behavior; McGraw-Hill: New York, NY, USA, 1951. [Google Scholar]
  62. Hatfield, E.; Cacioppo, J.T.; Rapson, R.L. Emotional Contagion. Curr. Dir. Psychol. Sci. 1993, 2, 96–100. [Google Scholar] [CrossRef] [Scilit]
  63. Howard, D.J.; Gengler, C. Emotional Contagion Effects on Product Attitudes. J. Consum. Res. 2001, 28, 189–201. [Google Scholar] [CrossRef] [Scilit]
  64. Bikhchandani, S.; Hirshleifer, D.; Welch, I. Learning from the Behavior of Others: Conformity, Fads, and Informational Cascades. J. Econ. Perspect. 1998, 12, 151–170. [Google Scholar] [CrossRef] [Scilit]
  65. Banerjee, A.V. A Simple Model of Herd Behavior. Q. J. Econ. 1992, 107, 797–817. [Google Scholar] [CrossRef] [Scilit]
  66. Barberis, N.; Shleifer, A.; Wurgler, J. Comovement. J. Financ. Econ. 2005, 75, 283–317. [Google Scholar] [CrossRef] [Scilit]
  67. Kyle, A.S.; Xiong, W. Contagion as a Wealth Effect. J. Financ. 2001, 56, 1401–1440. [Google Scholar] [CrossRef] [Scilit]
  68. Pesaran, H.H.; Shin, Y. Generalized Impulse Response Analysis in Linear Multivariate Models. Econ. Lett. 1998, 58, 17–29. [Google Scholar] [CrossRef] [Scilit]
  69. Granger, C.W.J. Investigating Causal Relations by Econometric Models and Cross-Spectral Methods. Econometrica 1969, 37, 424–438. [Google Scholar] [CrossRef] [Scilit]
  70. Driscoll, J.C.; Kraay, A.C. Consistent Covariance Matrix Estimation with Spatially Dependent Panel Data. Rev. Econ. Stat. 1998, 80, 549–560. [Google Scholar] [CrossRef] [Scilit]
  71. Bekaert, G.; Ehrmann, M.; Fratzscher, M.; Mehl, A. The Global Crisis and Equity Market Contagion. J. Financ. 2014, 69, 2597–2649. [Google Scholar] [CrossRef] [Scilit]
  72. Forbes, K.J.; Rigobon, R. No Contagion, Only Interdependence: Measuring Stock Market Comovements. J. Financ. 2002, 57, 2223–2261. [Google Scholar] [CrossRef] [Scilit]
  73. Demirer, M.; Diebold, F.X.; Liu, L.; Yılmaz, K. Estimating Global Bank Network Connectedness. J. Appl. Econom. 2018, 33, 1–15. [Google Scholar] [CrossRef] [Scilit]
  74. Yang, C.; Hu, X. Individual Stock Sentiment Beta and Stock Returns. N. Am. J. Econ. Financ. 2021, 55, 101306. [Google Scholar] [CrossRef] [Scilit]
  75. Longstaff, F.A. The Subprime Credit Crisis and Contagion in Financial Markets. J. Financ. Econ. 2010, 97, 436–450. [Google Scholar] [CrossRef] [Scilit]
  76. Kodres, L.E.; Pritsker, M. A Rational Expectations Model of Financial Contagion. J. Financ. 2002, 57, 769–799. [Google Scholar] [CrossRef] [Scilit]
  77. Kaminsky, G.L.; Reinhart, C.M.; Végh, C.A. The Unholy Trinity of Financial Contagion. J. Econ. Perspect. 2003, 17, 51–74. [Google Scholar] [CrossRef] [Scilit]
  78. Battiston, S.; Caldarelli, G.; May, R.M.; Roukny, T.; Stiglitz, J.E. The Price of Complexity in Financial Networks. Proc. Natl. Acad. Sci. USA 2016, 113, 10031–10036. [Google Scholar] [CrossRef] [Scilit] [PubMed]
  79. Scarselli, F.; Gori, M.; Tsoi, A.C.; Hagenbuchner, M.; Monfardini, G. The Graph Neural Network Model. IEEE Trans. Neural Netw. 2009, 20, 61–80. [Google Scholar] [CrossRef] [Scilit] [PubMed]
  80. Kipf, T.N.; Welling, M. Semi-Supervised Classification with Graph Convolutional Networks. arXiv 2016, arXiv:1609.02907. [Google Scholar] [CrossRef] [Scilit]
  81. Veličković, P.; Cucurull, G.; Casanova, A.; Romero, A.; Liò, P.; Bengio, Y. Graph Attention Networks. arXiv 2017, arXiv:1710.10903. [Google Scholar] [CrossRef] [Scilit]
  82. Matsunaga, D.; Suzumura, T.; Takahashi, T. Exploring Graph Neural Networks for Stock Market Predictions with Rolling Window Analysis. arXiv 2019, arXiv:1909.10660. [Google Scholar] [CrossRef] [Scilit]
  83. Cheng, D.; Yang, F.; Xiang, S.; Liu, J. Financial Time Series Forecasting with Multi-Modality Graph Neural Network. Pattern Recognit. 2022, 121, 108218. [Google Scholar] [CrossRef] [Scilit]
  84. Kumar, P.N.; Umeorah, N.; Alochukwu, A. Dynamic Graph Neural Networks for Enhanced Volatility Prediction in Financial Markets. arXiv 2024, arXiv:2410.16858. [Google Scholar] [CrossRef] [Scilit]
Figure 1. Directed Spillover Network of National Equity Markets. Note. Directed spillover network of national equity markets. Node color denotes net directional spillover (TO − FROM); node size denotes incoming spillover (FROM). Edges represent return dependencies above the 0.6 threshold.
Systems 14 00950 g001
Figure 2. Net Directional Spillover and Network Strength Centrality. Note. Net directional spillover against network strength centrality. Each point is one economy; the dashed line is the fitted regression. The flat slope indicates no robust linear association in this small cross-section, not proof of independence.
Systems 14 00950 g002
Table 1. Descriptive statistics of key variables (pooled across 13 economies, 2015–2025).
VariableMeanSDMin25%Median75%Max
Sentiment shock0.00000.1923−1.1742−0.0867−0.00230.08320.8800
Return0.00640.0483−0.2541−0.02080.00910.03410.2257
Volatility0.04540.01790.01090.03270.04150.05600.1232
Note. Sentiment shock is the AR (1) residual of the month-on-month change in the OECD Composite Consumer Confidence Index. Return is the monthly log return for each national equity index. Volatility is the 12-month rolling standard deviation of returns. N = 13 economies.
Table 2. Cross-country return correlation matrix.
AUSCHEDEUESPFRAGBRITAJPNKORNLDSWETURUSA
AUS1.000.640.730.660.730.700.670.580.570.700.650.320.75
CHE0.641.000.780.680.770.650.710.530.500.770.760.230.71
DEU0.730.781.000.850.910.750.870.680.620.870.850.290.80
ESP0.660.680.851.000.870.750.890.620.570.770.710.310.63
FRA0.730.770.910.871.000.790.900.670.600.890.850.300.76
GBR0.700.650.750.750.791.000.710.510.580.770.680.390.65
ITA0.670.710.870.890.900.711.000.630.570.800.750.320.68
JPN0.580.530.680.620.670.510.631.000.660.680.620.270.69
KOR0.570.500.620.570.600.580.570.661.000.630.620.310.69
NLD0.700.770.870.770.890.770.800.680.631.000.820.300.80
SWE0.650.760.850.710.850.680.750.620.620.821.000.230.76
TUR0.320.230.290.310.300.390.320.270.310.300.231.000.33
USA0.750.710.800.630.760.650.680.690.690.800.760.331.00
Note. Pearson correlations of monthly log-returns, 2015–2025. Values above 0.80 indicate near-synchronous co-movement. Türkiye shows the weakest linkage to every other market.
Table 3. Panel unit-root test (Augmented Dickey-Fuller) results.
CountryShock: ADFp-ValueVolatility: ADFp-Value
AUS−5.1610.000−2.1520.224
CHE−5.0010.000−2.1260.234
DEU−8.9350.000−2.2860.177
ESP−6.4560.000−1.8550.354
FRA−7.2220.000−1.6550.454
GBR−9.2500.000−1.9000.332
ITA−8.9220.000−1.3520.605
JPN−8.7230.000−2.4900.118
KOR−7.5700.000−1.8090.376
NLD−6.6570.000−2.3530.156
SWE−8.0320.000−2.0910.248
TUR−10.7510.000−1.7240.419
USA−8.9850.000−1.5130.527
Note. ADF test with AIC-based lag selection. The null is a unit root. Sentiment shocks are stationary at the 1% level; volatility series are non-stationary in levels.
Table 4. Diebold-Yılmaz directional connectedness (TCI = 81.58%).
CountryTO OthersFROM OthersNET
ITA140.5580.9559.60
ESP120.5582.3738.18
DEU120.8886.1034.79
TUR47.8130.0817.73
FRA103.8388.0415.79
KOR78.6577.840.82
USA78.0787.90−9.83
NLD78.9089.89−10.99
JPN68.1180.60−12.49
SWE74.7087.41−12.70
AUS59.3087.39−28.10
GBR45.5791.28−45.70
CHE43.5890.65−47.08
Note. Generalized forecast-error variance decomposition [68], 10-step horizon, VAR (1). NET = TO − FROM; positive values denote net transmitters. TCI is the total connectedness index.
Table 5. Significant Granger-causal links from sentiment shock to volatility (selected, p < 0.05, uncorrected; see FDR-corrected result in text).
Shock OriginVolatility Targetp-Value
JPNUSA0.0000
JPNDEU0.0002
JPNFRA0.0003
JPNITA0.0005
JPNESP0.0008
JPNSWE0.0009
KORUSA0.0012
KORDEU0.0014
JPNNLD0.0016
Note. Granger causality with lag selection up to 2 months; minimum p-value reported. Tested over 62 network-connected directed pairs, of which 9 are significant at the 5% level before multiple-testing correction. Only the Japan-to-United States link remains significant after Benjamini-Hochberg false-discovery-rate correction (p_FDR = 0.0013). Full results are in the replication package.
Table 6. Network centrality measures (edge threshold = 0.6).
CountryDegreeEigenvectorBetweennessStrength
DEU110.3180.0278.705
NLD110.3180.0278.503
FRA100.3040.0068.142
SWE110.3180.0278.067
USA110.3180.0277.931
ITA100.3040.0067.606
ESP100.3040.0067.429
CHE90.2810.0006.464
GBR90.2810.0006.447
AUS90.2810.0006.230
JPN80.2400.0095.257
KOR50.1550.0003.232
TUR00.0000.0000.000
Note. Centrality computed on the return-dependency network (edges above 0.6). Strength is the sum of absolute edge weights. Türkiye is topologically isolated in this thresholded return-correlation graph; this describes structural position, not directional transmission in the VAR-FEVD connectedness framework.
Table 7. Panel fixed-effects estimation of volatility (Driscoll-Kraay standard errors).
VariableCoefficienttp-Value
Constant0.00133.200.0014
Volatility (t − 1)0.969796.120.0000
Neighbor sentiment shock−0.0083−4.32<0.001
Own sentiment shock−0.0001−0.110.9133
Note. The dependent variable is monthly volatility. Neighbor shock is the edge-weighted average of the sentiment shocks of connected economies. Driscoll-Kraay standard errors with 3 lags. N = 13 economies, 2015–2025. Because the lagged dependent variable is near unity, the panel estimates are interpreted as auxiliary persistence-adjusted associations rather than causal evidence.
Table 8. Regression of net spillover on network centrality.
VariableCoefficienttp-Value
Constant−5.092−0.190.8542
Network strength0.7880.200.8449
Note. The dependent variable is net directional spillover (TO − FROM). R-squared = 0.004. N = 13 economies. The regression is a small-sample exploratory diagnostic and should not be read as an equivalence test or as evidence of absence.
Table 9. Network threshold sensitivity and exploratory H3 diagnostics.
ThresholdEdgesDensityComp.IsolatedH3 Coef.H3 pH3 R2
0.5650.8332Türkiye−0.0470.99140.000
0.6570.7312Türkiye0.7880.84490.004
0.7330.4234JPN, KOR, TUR3.0140.40490.064
Note. Comp. is the number of connected components. H3 columns report the regression of net spillover on network strength centrality at each threshold. The coefficients are imprecisely estimated in this small cross-section and should be read as exploratory diagnostics rather than as evidence of a stable null relationship.
Table 10. Sub-period connectedness and sentiment contagion.
Sub-PeriodMonthsTCI (%)Top TransmittersGranger Sig. (%)
Pre-COVID (2015–2019)6082.74ITA, JPN, DEU6.7
COVID (2020–2021)2487.97FRA, ESP, ITA11.9
Post-COVID (2022–2025)4878.92KOR, TUR, ITA13.5
Note. TCI is the total connectedness index. Granger sig. (%) is the uncorrected share of network-connected directed pairs in which a sentiment shock predicts volatility at the 5% level. Connectedness peaks during the pandemic; sub-period Granger patterns are descriptive and should be read alongside the FDR-corrected full-sample result.
Disclaimer/Publisher’s Note: The statements, opinions and data contained in all publications are solely those of the individual author(s) and contributor(s) and not of MDPI and/or the editor(s). MDPI and/or the editor(s) disclaim responsibility for any injury to people or property resulting from any ideas, methods, instructions or products referred to in the content.