Article

Configuration Resilience of Emergency Medical Rescue Networks Under Coupled Disruptions Induced by Extreme Disasters: An Active-Learning-Assisted Optimization Approach

School of Economics and Management, Shanghai University of Electric Power, Shanghai 201306, China
*
Author to whom correspondence should be addressed.
Systems 2026, 14(8), 922; https://doi.org/10.3390/systems14080922
Submission received: 10 June 2026 / Revised: 16 July 2026 / Accepted: 23 July 2026 / Published: 1 August 2026
(This article belongs to the Section Supply Chain Management)

Highlights

What are the main findings?
  • This study examines the configuration resilience of emergency medical rescue networks under disaster-induced coupled disruptions. From a systems perspective, it treats scenario-dependent uncertainties as coupled disturbances and links pre-disaster resource configuration with scenario-adaptive network operations.
  • To operationalize this perspective, the study formulates a two-stage scenario-based mixed-integer programming model. A small-sample active-learning-assisted variable neighborhood search (AL-VNS) algorithm is developed to solve the model efficiently through surrogate-guided screening of candidates for costly exact evaluation.
What is the main implication of the main finding?
  • The study reveals a differentiated resilience structure in which temporary rescue sites provide a stable network backbone, while emergency medical facilities supply flexible surge capacity.
  • The findings support preparedness strategies that combine pre-designated backbone sites with adaptable capacity options to balance spatial coverage, transfer efficiency, and hospital pressure.

Abstract

This study investigates configuration resilience in emergency medical rescue networks under disaster-induced compound disruptions. Major disasters can simultaneously intensify casualty severity, disrupt road networks, restrict response access, and increase hospital surge pressure, turning emergency preparedness into a location–capacity–transfer planning problem under uncertainty. We formulate a two-stage scenario-based mixed-integer programming model that determines the locations and capacity levels of temporary rescue sites and emergency medical facilities and then optimizes scenario-adaptive casualty transfers among affected areas, rescue sites, emergency facilities, and hospitals. The model considers 81 compound disruption scenarios defined by casualty severity, road-network disruption, response-access constraints, and hospital surge pressure. To solve large-scale instances, we develop a small-sample active-learning-assisted variable neighborhood search algorithm (AL-VNS), which combines a committee random forest surrogate with a progressive active-verification strategy to prioritize limited exact CPLEX evaluations, while keeping all accepted and reported solutions exactly evaluated. Numerical experiments show that AL-VNS achieves near-optimal performance in small- and medium-scale instances. Based on three independent runs for each large-scale instance, AL-VNS reduces average runtime by 34.71–63.73% relative to baseline variable neighborhood search (BVNS), while maintaining average objective-value differences of only 0.01–0.12% and requiring approximately 217 exact evaluations per instance. In the Ya’an case and the tested sensitivity settings, temporary rescue sites provide a relatively stable spatial triage-and-transfer backbone, whereas emergency medical facilities offer flexible surge capacity for relieving hospital pressure. The findings support resilience-oriented location and capacity planning for emergency medical rescue networks under uncertain compound disruptions.

1. Introduction

Major disasters rarely affect emergency response systems through a single operational shock. Beyond increasing casualty demand, earthquakes, floods, landslides, and other severe disasters may simultaneously alter injury-severity profiles, degrade road accessibility, restrict rescue access, and strain hospital reception capacity [1,2]. These effects are not independent. Road damage may delay casualty transfer; delayed transfer may increase treatment urgency; and hospital overload may force casualties to be redirected through pre-hospital triage points, temporary treatment facilities, and alternative receiving hospitals [3]. As a result, disaster medical response often operates in a compound disruption environment, where triage, treatment, transfer, and surge-response functions must be coordinated across multiple emergency medical resources. Recognizing these coupled post-disaster disruptions is essential for preparedness planning, because emergency rescue systems must be able to maintain service accessibility, absorb hospital pressure, and adapt casualty-transfer decisions before the exact consequences of a disaster are known [4].
Existing studies on emergency facility location and emergency logistics have provided important foundations for disaster preparedness. Mature modeling efforts have examined demand coverage, response distance, transportation cost, facility capacity, construction investment, and service accessibility, all of which are essential for designing effective response systems [5,6]. These studies show that emergency resource planning is fundamentally a spatial and capacity-allocation problem under limited resources. Related healthcare decision-support research has also extended resource governance beyond physical service capacity to medical insurance supervision. Recent work develops a preference-disaggregation-based multiclass Mahalanobis–Taguchi system to identify heterogeneous patterns of medical insurance fraud, illustrating how learning-based methods can support differentiated supervision of healthcare funds [7]. However, in major disaster contexts, the operating conditions of emergency rescue systems may change through multiple interacting channels rather than through a single planning factor. Demand fluctuations, road-network disruptions, facility-capacity losses, and hospital service pressures may occur simultaneously and jointly affect the feasibility and performance of medical response. For example, changes in casualty demand and injury severity may increase treatment urgency, degraded road accessibility may limit transfer options, and hospital surge pressure may reshape the allocation of casualties across the response system. This suggests that emergency medical resource planning should move beyond isolated representations of uncertainty and account for compound disruptions induced by disasters. A resilience-oriented configuration perspective is therefore needed to support emergency rescue systems in maintaining accessibility, absorbing service pressure, and adapting response operations under uncertain post-disaster conditions.
From this perspective, the key issue is the resilience of emergency response systems’ configuration under disaster-induced compound disruptions. In this study, configuration resilience refers to the ability of a pre-planned medical response network to maintain operational performance when post-disaster demand, transport accessibility, transfer feasibility, and hospital capacity are simultaneously disrupted. It involves two complementary dimensions. The first is robust preparedness, which requires emergency medical resources to be configured before the exact disaster consequences are known. The second is operational absorption and adaptation, which requires the response system to absorb service pressure and adjust casualty-transfer decisions after a disruption scenario is realized. Accordingly, this study develops a resilience-oriented emergency medical resource configuration framework that integrates pre-disaster resource deployment with scenario-adaptive casualty transfer under compound post-disaster disruptions. The main contributions are summarized as follows.
First, we develop a resilience-oriented emergency medical resource configuration framework for disaster-induced compound disruptions. The framework incorporates four disruption dimensions with operationally coupled effects, casualty severity, road-network disruption, response-access constraints, and hospital surge pressure, and links them to the configuration of heterogeneous emergency medical resources. By integrating pre-disaster resource configuration with scenario-adaptive response operations, the framework supports resource preparedness as well as the absorption and adaptation capacities of the emergency rescue system after a disaster occurs.
Second, we design a small-sample active-learning-assisted variable neighborhood search algorithm for the proposed resilience-oriented emergency medical resource configuration problem. The computational challenge arises because each candidate configuration requires expensive scenario-based response evaluation, while time-sensitive emergency planning cannot afford exhaustive exact evaluations. AL-VNS combines a committee random forest surrogate with a progressive active-verification strategy to determine which candidate configurations should be exactly evaluated. In this way, the search is transformed into an evaluation-budget allocation process, in which limited exact evaluations are concentrated on candidates that are promising for improvement or informative for refining the search direction.
Third, we conduct a regional case study to examine the differentiated resilience roles of heterogeneous emergency medical resources. The analysis explores how temporary rescue sites, emergency medical facilities, and existing hospitals support triage, transfer buffering, surge-capacity supplementation, and hospital-pressure mitigation under compound disruptions, thereby providing an empirical basis for the managerial, policy, and practical implications of pre-disaster facility planning and coordinated medical response design.
The remainder of this paper is organized as follows. Section 2 reviews the related literature. Section 3 describes the problem setting and modeling assumptions. Section 4 presents the two-stage scenario-based optimization model and its interpretation. Section 5 introduces the computational-complexity analysis and the BVNS and AL-VNS solution approaches. Section 6 reports the numerical experiments, the Ya’an case study, and the sensitivity analyses. Section 7 presents the managerial, policy, and practical implications. Section 8 concludes the paper and discusses future research directions.

2. Literature Review

In emergency response systems, the siting of medical facilities and the allocation of scarce medical resources are central to maintaining timely and accessible rescue services under uncertain post-disaster conditions [8]. Major disasters may simultaneously affect casualty demand, road accessibility, response feasibility, and hospital capacity, making emergency medical planning a compound disruption problem rather than a routine facility-location task. To position the present study, this section reviews two related streams of the literature: (i) scenario elements and uncertainty in emergency rescue response planning, and (ii) optimization of emergency medical resources.

2.1. Scenario Elements and Uncertainty in Emergency Rescue Scheduling

Emergency medical response after disasters is strongly shaped by scenario-dependent disruptions. Unlike routine healthcare logistics, post-disaster response must be planned under rapidly changing casualty demand, damaged transportation networks, constrained medical capacity, and incomplete operational information. Facility-location and location-allocation studies have therefore moved beyond deterministic coverage models and increasingly emphasized the role of uncertainty in emergency response planning [5]. In particular, robust and stochastic optimization models indicate that casualty demand, travel time, and resource availability may change substantially after a disaster, rendering static demand estimates and fixed-network assumptions insufficient for emergency medical resource planning [9].
Existing studies have examined several key elements of scenarios in emergency medical and humanitarian logistics. On the demand side, casualty numbers, injury severity, and the deterioration of injuries over time have been incorporated into disaster-response models to reflect the urgency and heterogeneity of post-disaster medical needs [9]. On the network side, uncertain travel conditions, road accessibility, and transportation risk have been considered in routing and scheduling models for disaster-response operations [10,11]. On the service side, recent studies have addressed limited facility capacity, facility disruption risk, multiple resource types, and collaborative capacity sharing among medical or relief facilities [6,12,13]. These studies show that post-disaster response uncertainty affects not only the amount of medical demand, but also the accessibility of response routes, the availability of treatment capacity, and the feasibility of casualty transfer [14].
Although these studies substantially improve the realism of emergency medical and humanitarian logistics models, many models still treat demand fluctuations, travel-time uncertainty, facility disruptions, or capacity shortages as relatively separable sources of risk. This treatment supports tractable optimization, but it is less effective at representing disaster-induced compound disruptions in which multiple response conditions change simultaneously. In a major disaster, casualty demand and injury severity may increase with local exposure; road-network disruption may reduce transfer accessibility; response-access constraints may limit feasible rescue and transfer operations; and hospital surge pressure may alter the allocation of casualties across the medical response system [15]. Therefore, emergency medical resource planning requires a scenario representation that jointly captures casualty-demand fluctuations, road-network disruptions, response-access constraints, and hospital surge pressures under compound post-disaster disruptions.

2.2. Optimization of Emergency Medical Resources

Emergency medical response requires the coordinated configuration of multiple types of scarce resources, including medical facilities, temporary treatment points, ambulances, medical staff, hospital beds, and emergency supplies. In the operations research and management science (OR/MS) literature, this problem has most commonly been formulated through facility-location, location-allocation, casualty assignment, vehicle dispatching, capacity planning, and medical-resource allocation models. A broad stream of healthcare facility-location studies has shown that facility siting and demand allocation are central to emergency medical service design, especially when response time, service coverage, and capacity constraints must be balanced [16]. In disaster-response settings, these decisions become more complex because new temporary facilities may need to be opened after the event, and casualties must be assigned to facilities with limited treatment capacity.
More recent work has begun to integrate additional resource types and coordination mechanisms. For example, Salman and Gül (2014) [17] jointly optimized temporary medical center location, casualty allocation, and medical staff planning for the first 72 h after an earthquake. Yang et al. (2023) [6] modeled multi-period humanitarian location-allocation decisions with multiple resource types and capacity levels under distributional uncertainty. Sun et al. (2022) [12] introduced a collaborative casualty evacuation network in which capacity sharing among medical facilities is used to improve response reliability under uncertain medical demand. Fattahi et al. (2023) [18] studied integrated resource allocation, resource sharing, and patient transfer decisions in pandemic-related healthcare planning, while Barbato et al. (2023) [19] examined the relocation of medical staff, beds, equipment, and patients across a hospital network during health emergencies. These studies show that resource coordination can reduce capacity shortage and improve system responsiveness when local medical resources are insufficient.
Although these studies demonstrate the value of resource coordination, the differentiated roles of heterogeneous emergency medical resources are still not fully explicit. Many models emphasize one dominant response layer, such as temporary facility deployment, casualty assignment, ambulance dispatching, hospital capacity sharing, or inter-hospital transfer. Under disaster-induced compound disruptions, however, temporary rescue sites, emergency medical facilities, and existing hospitals are not simply interchangeable capacity providers; they respectively support triage and transfer buffering, surge-capacity supplementation, and definitive treatment. An integrated configuration perspective is therefore needed to represent these complementary roles in emergency medical response.

2.3. Research Gap

Despite these advances, several issues remain to be further addressed [19,20]. First, disaster-induced compound disruptions have not been sufficiently incorporated into emergency medical resource configuration. Existing studies have examined important uncertainty factors such as casualty-demand fluctuations, road-network disruptions, facility-capacity losses, and hospital service pressures, but these factors are often treated as separate sources of uncertainty. In major disaster contexts, casualty severity, transport accessibility, response-access constraints, and hospital surge pressure may occur simultaneously and jointly shape the feasibility and performance of emergency medical response.
Second, the configuration resilience of emergency medical response systems deserves more explicit attention [21]. Related healthcare emergency-planning studies have also shown that congestion and capacity pressure can materially affect resource-distribution decisions [22]. From a resilience perspective, emergency medical resource planning should not only determine robust pre-disaster resource configurations but also support post-disaster absorption and adaptation through coordinated triage, transfer buffering, surge-capacity supplementation, and hospital-pressure mitigation.
Third, scenario-based response evaluation creates a substantial computational burden under time-sensitive emergency planning. For each candidate resource configuration, casualty allocation, transfer decisions, and hospital-overload conditions must be evaluated across multiple disruption scenarios. Repeated exact evaluations can therefore become expensive as the number of candidate facilities, demand areas, hospitals, and scenarios increases. Together, these issues motivate a scalable, learning-assisted configuration framework for emergency medical resource planning under compound, disaster-induced disruptions.

3. Emergency Medical Resource Allocation Problem

Major disasters can generate compound disruptions to emergency medical response systems. After an earthquake, flood, landslide, or other severe event, emergency planners may face not only increased demand for casualties but also changes in injury severity, road accessibility, rescue access, hospital reception capacity, and hospital overload [1,2]. These disruptions jointly affect where casualties can be collected, how they can be transferred, and which medical facilities can receive them. Therefore, emergency medical resource allocation should not be treated as a routine facility-location problem under normal network conditions [5,13]. It requires a resilience-oriented configuration perspective that accounts for both pre-disaster resource preparedness and post-disaster response operations under uncertain compound disruptions.
In such a setting, a hierarchical emergency medical rescue network is needed to reduce treatment delays and relieve hospital pressure [3,23]. The first layer consists of temporary rescue sites that handle casualty aggregation, initial triage, basic first aid, and transfer organization. Their locations should consider road accessibility, spatial coverage of affected areas, and connectivity to downstream medical resources. The second layer consists of existing hospitals, which provide definitive treatment for moderate and severe casualties but may face capacity loss and overload after a disaster. The third layer consists of emergency medical facilities, such as modular emergency treatment units or temporary medical facilities, which can be activated to supplement treatment capacity when the regular hospital system is insufficient. This hierarchical structure provides the practical basis for jointly optimizing temporary rescue-site location, emergency medical facility deployment, and casualty-transfer decisions.
In this hierarchical rescue system, resource competition and operational coupling among temporary rescue sites, emergency medical facilities, and existing hospitals create a complex decision environment [12,23]. Casualty allocation is affected not only by spatial accessibility but also by facility capacity, treatment capability, injury severity, road-network disruption, response-access constraints, and hospital surge pressure. Temporary rescue sites can buffer and organize casualty flows, emergency medical facilities can provide flexible surge capacity, and existing hospitals remain the core providers of definitive treatment [1,17]. These interacting factors make emergency medical resource allocation a coupled location–capacity–transfer problem under disaster-induced compound disruptions. Therefore, an integrated optimization model is needed to coordinate facility deployment and casualty transfer while improving the emergency medical response system’s capacity for absorption and adaptation.
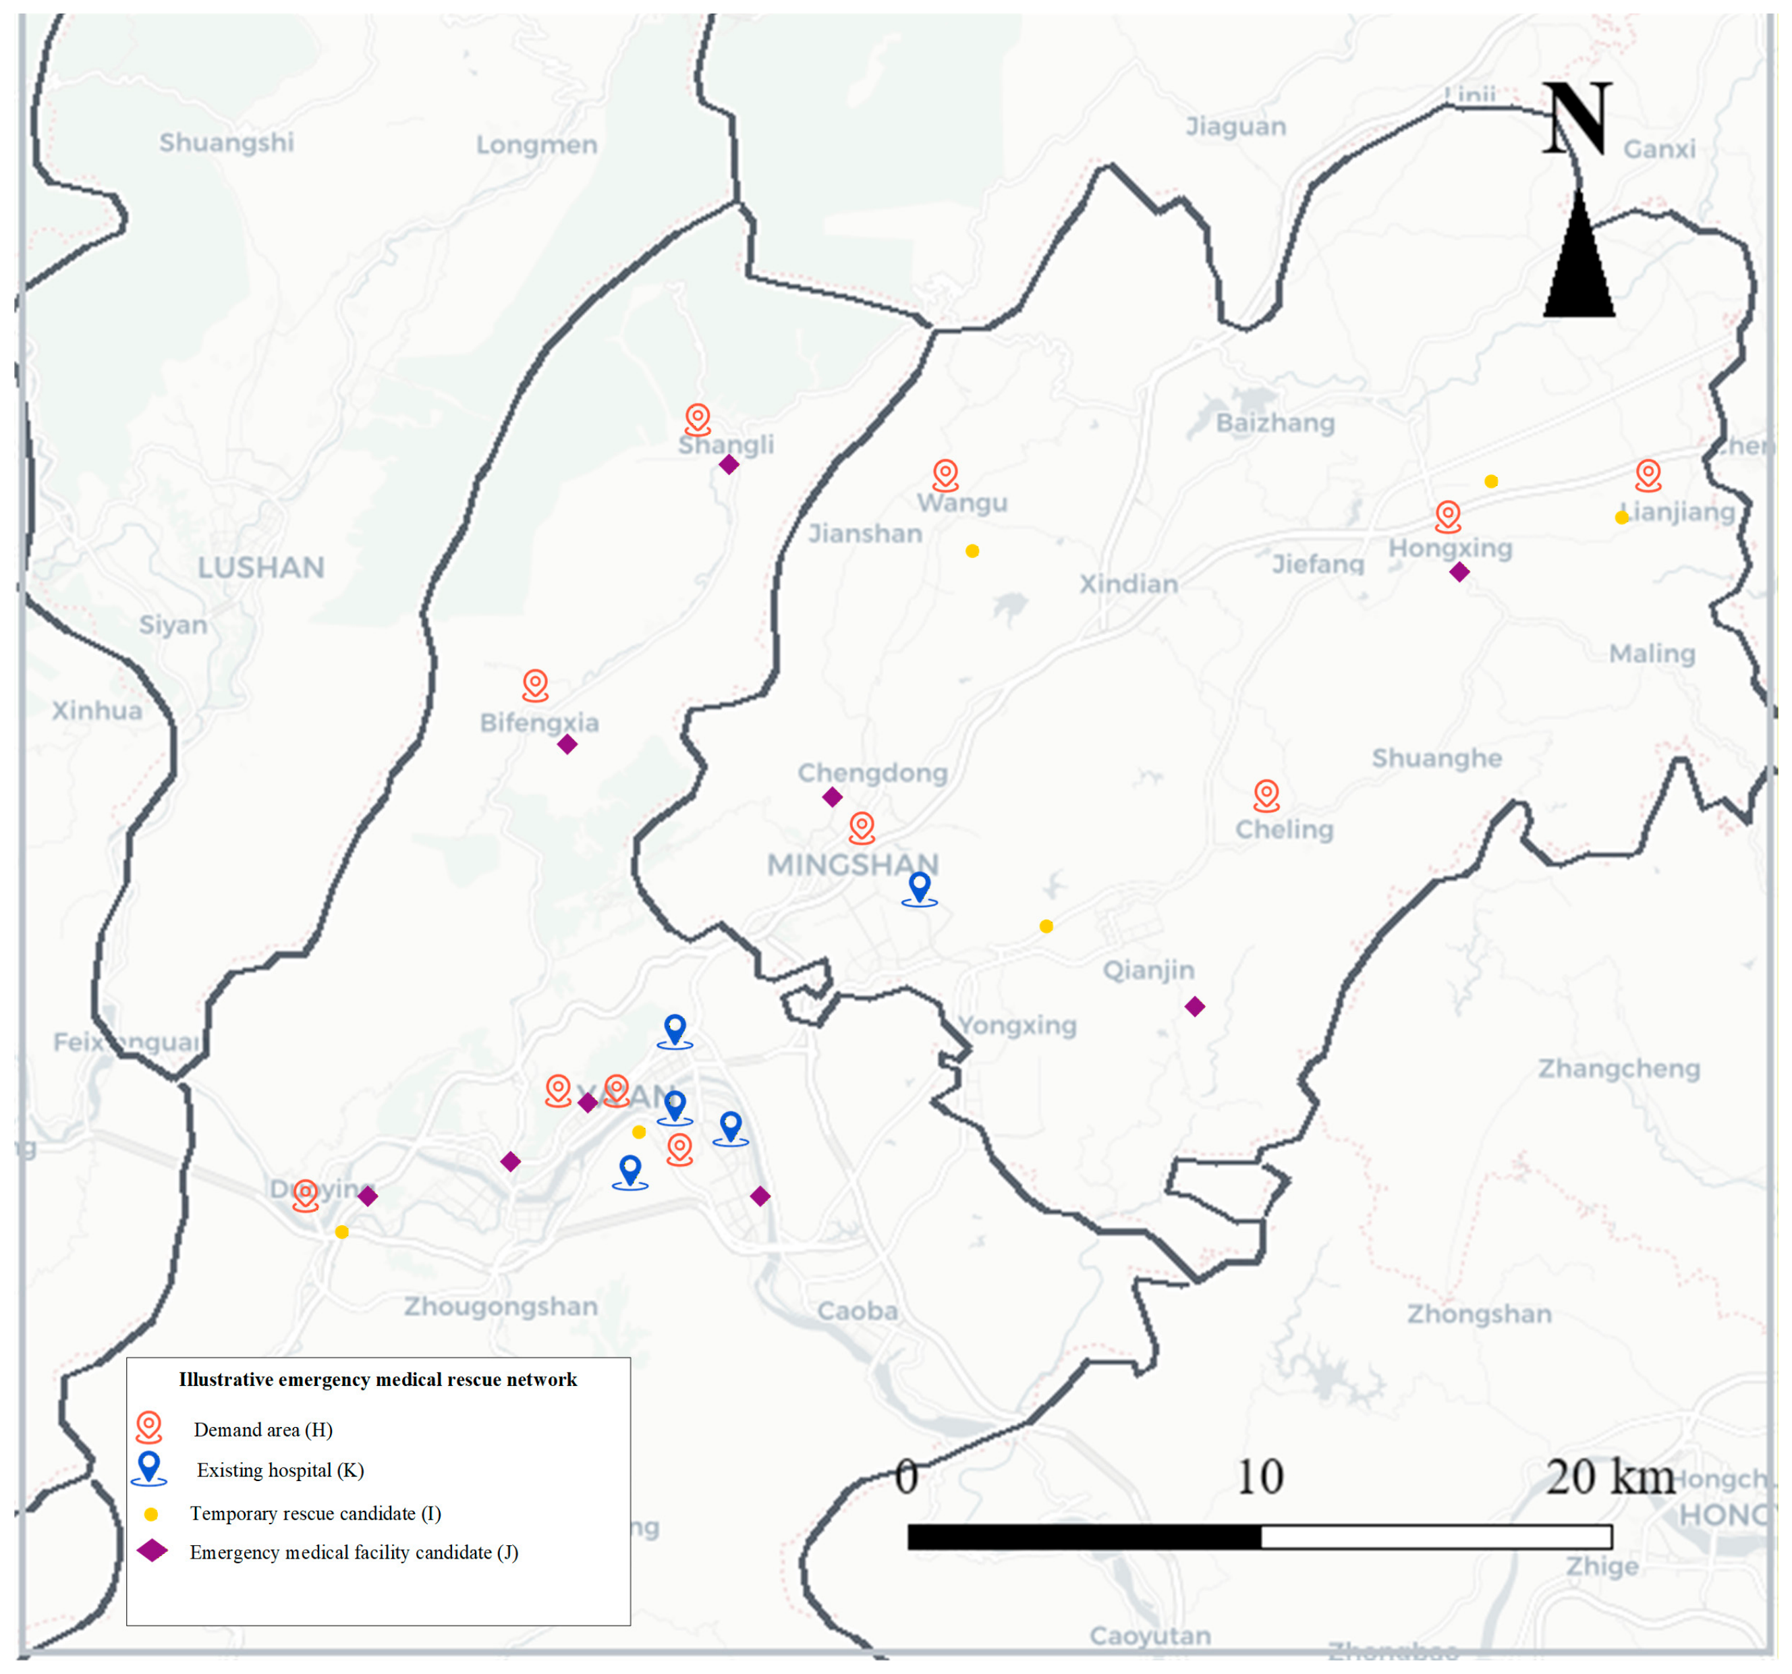
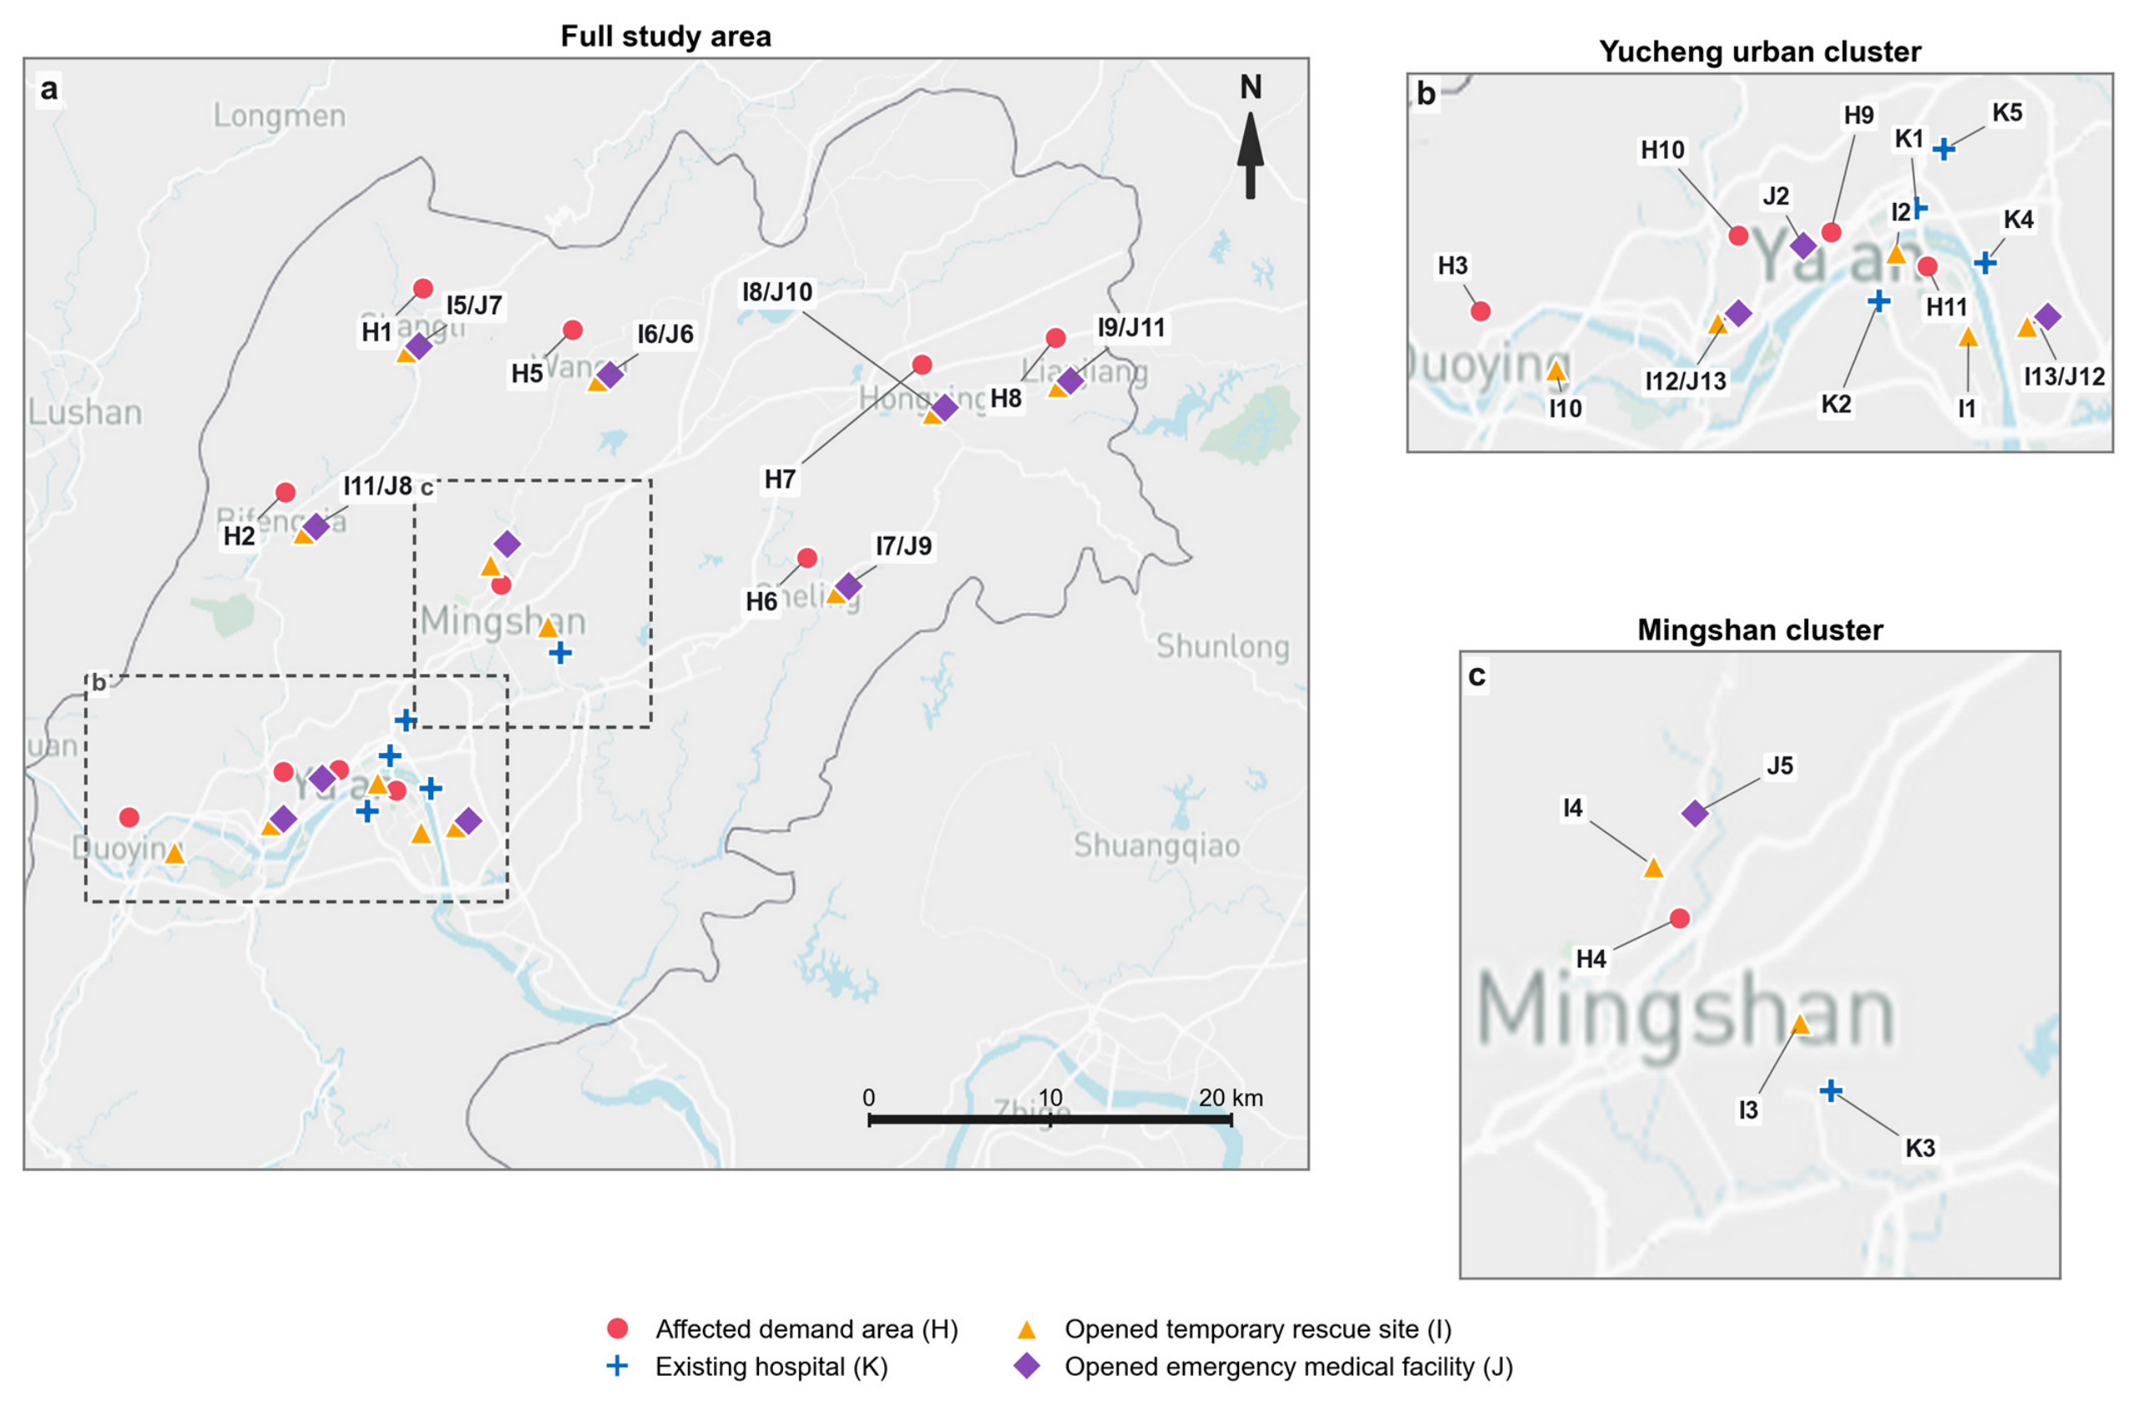
Figure 1 illustrates the emergency medical rescue network considered in this study using the Ya’an area as an example. The network consists of affected demand areas, candidate temporary rescue sites, candidate emergency medical facilities, and existing hospitals. Affected areas are spatially dispersed, whereas existing hospitals are concentrated in urban centers and may face capacity constraints after a disaster. If casualties are transferred directly to hospitals, long transport distances and hospital overload may reduce rescue efficiency. Therefore, temporary rescue sites are established to facilitate casualty aggregation, initial triage, basic treatment, and transfer coordination, while emergency medical facilities are activated when additional treatment capacity is required. The resulting decision problem is to determine which rescue sites and emergency medical facilities should be opened, at what capacity, and how casualties should be transferred amid disaster-induced compound disruptions.
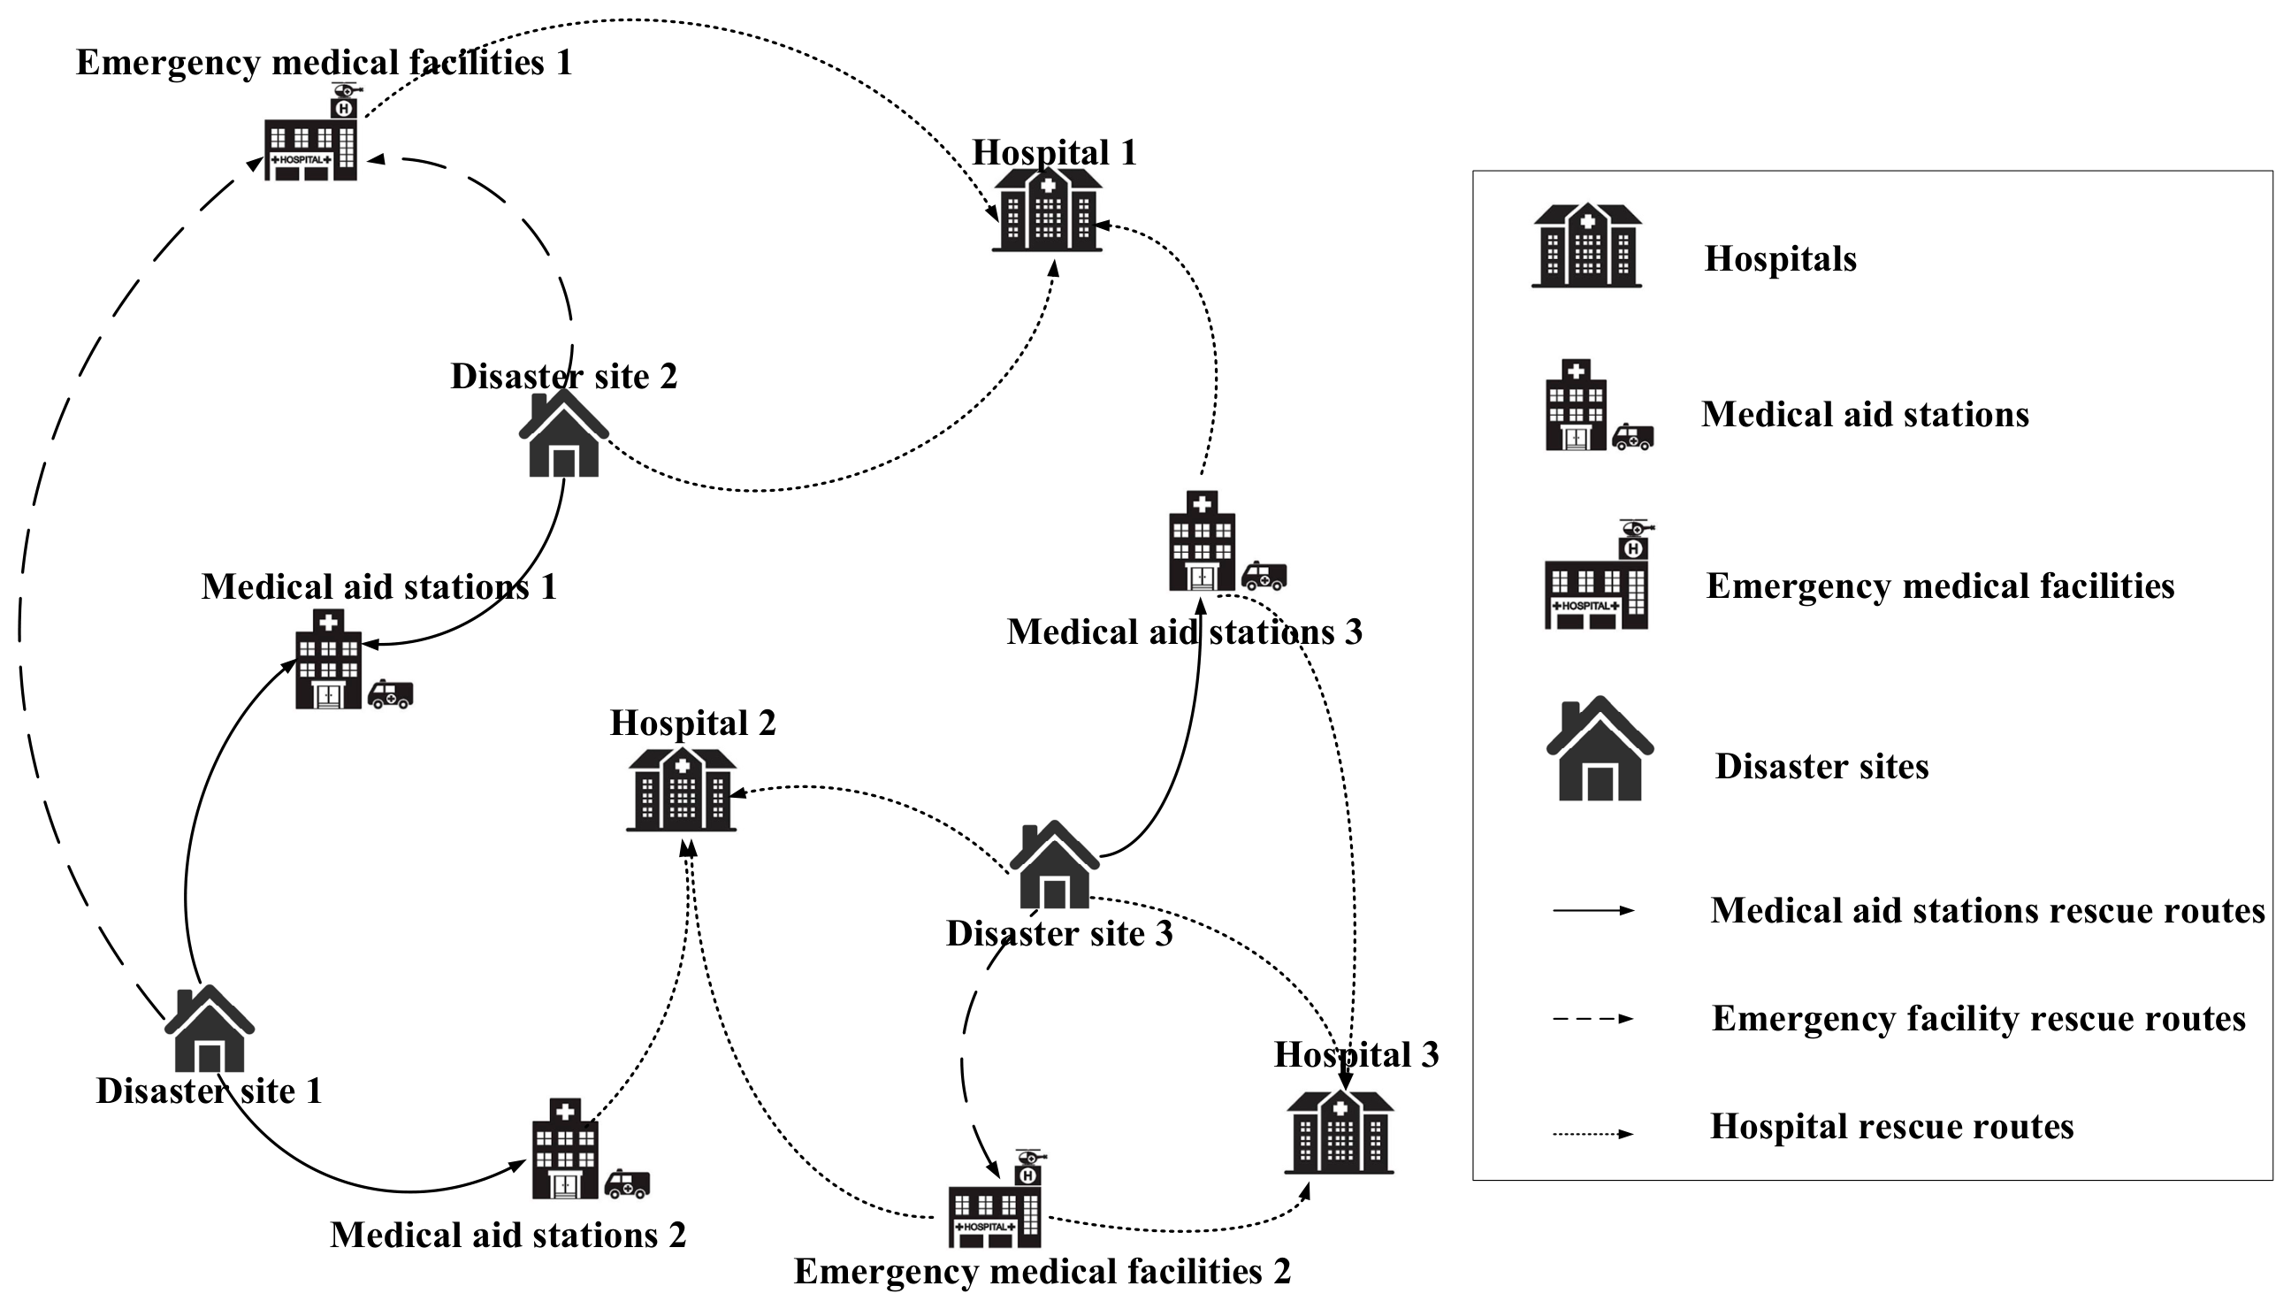
Figure 2 illustrates the casualty transfer process in the proposed emergency medical rescue network. Affected demand areas first send casualties to temporary rescue sites, where casualty aggregation, initial triage, and basic emergency treatment are provided [17]. According to injury severity, treatment capability, facility capacity, road-network conditions, and hospital surge pressure, casualties are then transferred from temporary rescue sites to either emergency medical facilities or existing hospitals for further treatment. In this structure, temporary rescue sites serve as intermediate coordination nodes, while emergency medical facilities provide supplementary treatment capacity when existing hospitals are overloaded or difficult to access [12,13]. The problem studied in this paper is therefore an integrated location–capacity–transfer optimization problem that jointly determines facility opening, capacity levels, and scenario-adaptive casualty-transfer decisions under disaster-induced compound disruptions [6,24].

4. Model Description

This section formulates the emergency medical resource allocation problem as a two-stage scenario-based mixed-integer programming model. The first-stage decisions determine the opening and capacity levels of temporary rescue sites and emergency medical facilities before the realized compound-disaster scenario is known. After a scenario is realized, the second-stage decisions allocate casualties from affected areas to temporary rescue sites and then transfer them to emergency medical facilities or existing hospitals according to casualty severity, facility capacity, treatment capability, road-disruption conditions, and hospital pressure. The objective function balances pre-disaster construction investment, post-disaster casualty-transfer cost, and hospital-overload penalty, so that the model can coordinate facility deployment and casualty movement under multi-hazard uncertainty. The following subsections define the notation, decision variables, objective function, and constraints used in the formulation.

4.1. Model Parameters

4.1.1. Sets

i Index of candidate temporary rescue station.
I Set of candidate temporary rescue stations.
j Index of candidate emergency medical facility.
J Set of candidate emergency medical facilities.
k Index of an existing hospital.
K Set of hospital.
h Index of disaster area.
H Set of disaster areas.
s Index of scenario.
S Set of scenarios.
a Index of wounded type.
A Set of wounded types.
q Index of temporary rescue station size.
Q Set of temporary rescue station sizes.
p Index of emergency medical facility size.
P Set of e emergency medical facilities sizes.

4.1.2. Parameters

x s Probability of occurrence of disaster scenario s .
d h i Distance   from   disaster   area   h   to   temporary   rescue   station   i .
d i j Distance   from   temporary   rescue   station   i   to   emergency   medical   facility   j .
d i k Distance   from   temporary   rescue   station   i   to   hospital   k .
g k The   degree   of   injury   of   the   wounded   acceptable   to   hospital   k .
g j The   degree   of   injury   of   the   wounded   acceptable   to   medical   facility   j .
l a The   degree   of   injury   of   the   wounded   type   a .
v k The   capacity   of   hospital   k to accommodate the wounded.
z Hospital overload capacity factor.
v i q + Maximum   storage   capacity   of   temporary   rescue   station   i   of   size   q .
v j p + Maximum   storage   capacity   of   medical   facility   j   of   size   p .
n h a s The   number   of   wounded   types   a   in   the   disaster   area   h   under   scenario   s .
C i q I Fixed   cos t   of   opening   a   temporary   rescue   station   of   size   q   at   candidate   site   i .
C j p J Fixed   cos t   of   opening   an   emergency   medical   facility   of   size   p   at   candidate   site   j .
C a T Cos t   coefficient   of   per   wounded   types   a person per km for transfer.
BTotal construction budget.
n Cost coefficient of penalty for the number of people exceeds the capacity of the hospital.
η Adjustment coefficient applied to the resource configuration cost.
M A sufficiently large positive number artificially set by user for model use.

4.1.3. Decision Variables

α i q Binary, equals to 1 if temporary rescue station i of size q is established.
θ j p Binary ,   equals   to   1   if   medical   facility   j   of   size   p is established.
β h i a s Binary ,   equals   to   1   if   wounded   type   a   transport   from   disaster   area   h   to   temporary   rescue   station   i   in   scenario   s .
β i j a s Binary ,   equals   to   1   if   wounded   type   a   transport   from   temporary   rescue   station   i   to   medical   facility   j   in   scenario   s .
β i k a s Binary ,   equals   to   1   if   wounded   type   a   transport   from   temporary   rescue   station   i   to   hospital   k   in   scenario   s .
γ h i a s Float ,   quantity   of   wounded   type   a   transport   from   disaster   area   h   to   temporary   rescue   station   i   in   scenario   s .
γ i j a s Float ,   quantity   of   wounded   type   a   transport   from   temporary   rescue   station   i   to   medical   facility   j   in   scenario   s .
γ i k a s Float ,   quantity   of   wounded   type   a   transport   from   temporary   rescue   station   i   to   hospital   k   in   scenario   s .
ο k s Float, excess wounded count of hospital k beyond its normal capacity under scenario s.

4.2. Mathematical Model

Objective function:
M i n   Z = λ R η R C + λ S S C
s.t.
q Q α i q 1   i I
p P θ j p 1   j J
i I γ h i a s = n h a s   h H ,   a A ,   s S
h H , a A γ h i a s q Q α i q v i q +   i I ,   s S
i I , a A γ i j a s p P θ j p v j p +   j J ,   s S
i I , a A γ i k a s z v k   k K ,   s S
i I , a A γ i k a s v k ο k s   k K ,   s S
l a β i k a s g k   i I ,   k K ,   a A ,   s S
l a β i j a s g j   i I ,   j J ,   a A ,   s S
h H γ h i a s = j J γ i j a s + k K γ i k a s   i I ,   a A ,   s S
γ h i a s M β h i a s   h H ,   i I ,   a A ,   s S
γ i j a s M β i j a s   i I ,   j J ,   a A ,   s S
γ i k a s M β i k a s   i I ,   k K ,   a A ,   s S
i I q Q C i q I α i q + j J p P C j q J θ j p B
α i q 0 , 1   i I ,     q Q
θ j p 0 , 1   j J ,   p P
β h i a s 0 , 1   h H ,   i I ,   a A ,   s S
β i j a s 0 , 1   i I ,   j J ,   a A ,   s S
β i k a s 0 , 1   i I ,   k K ,   a A ,   s S
ο k s 0   k K ,   s S
γ h i a s 0   h H ,   i I ,   a A ,   s S
γ i j a s 0   i I ,   j J ,   a A ,   s S
γ i k a s 0   i I ,   k K ,   a A ,   s S
Objective (1) captures two key concerns in emergency medical resource planning: the first-stage cost of pre-disaster resource configuration and the expected second-stage system operating cost under uncertain disaster scenarios. The model seeks a resource configuration that controls deployment investment while maintaining an efficient and robust emergency response system.
Constraints (2) and (3) ensure that each candidate site can select at most one capacity level for a temporary rescue station or an emergency medical facility. Constraint (4) requires all wounded persons of each type in each disaster area and scenario to be transferred to temporary rescue stations. Constraints (5) and (6) impose capacity limits on opened temporary rescue stations and emergency medical facilities; unopened sites have zero available capacity. Constraint (7) limits hospital reception to the allowable overload capacity, and Constraint (8) defines the non-negative hospital-overload variables used in the system operating cost. Constraints (9) and (10) ensure that hospitals and emergency medical facilities receive only wounded patients within their treatment capabilities. Constraint (11) enforces flow conservation at each temporary rescue station. Constraints (12)–(14) link transfer quantities with the corresponding path-activation variables. Constraint (15) imposes the construction budget. Constraints (16)–(24) define the domains of binary and non-negative variables.

4.3. Objective-Function Interpretation

In two-stage stochastic emergency resource allocation models, the objective is commonly organized around pre-disaster configuration decisions and post-disaster recourse operations. The former captures investment decisions made before the actual disaster scenario is observed, whereas the latter evaluates scenario-dependent response performance after casualty demand, accessibility, and capacity conditions are realized [6,25]. Following this logic, this study adopts a system-level perspective. The first-stage objective component measures the configuration burden of establishing the emergency medical response network, including the opening of temporary rescue stations and emergency medical facilities at selected capacity levels. Once this network structure is configured, the second-stage component evaluates how the system operates under each disaster scenario by coordinating casualty-transfer decisions and absorbing capacity pressure across downstream medical resources. Specifically, transfer cost is used to represent the operational burden of moving casualties through the rescue network, while hospital overload cost is used to capture congestion, waiting, and service degradation when hospital demand exceeds available reception capacity [1,23]. Because these two components reflect different cost dimensions, they are normalized and aggregated through a weighted objective, allowing decision makers to balance preparedness investment and post-disaster operating performance [26].
The objective function is constructed from two components: the resource configuration cost and the scenario-weighted system operating cost. The first component, denoted by R C , represents the first-stage resource-configuration decisions before disaster demand is realized. It includes the fixed costs of opening temporary rescue stations and emergency medical facilities at selected capacity levels. This component reflects the investment burden of preparing the emergency response network.
R C = i I q Q C i q I α i q + j J p P C j p J θ j p
The second component, denoted by S C , represents the expected system operating cost after disaster scenarios are realized. It consists of the casualty-transfer cost T C and the hospital-overload penalty O C . The transfer-cost term measures the operating burden generated by moving injured people through the emergency rescue network, whereas the overload penalty captures congestion, waiting, and service degradation caused by excessive demand at hospitals.
S C = s S x s T C s + O C s
T C s = a A C a T h H i I γ h i a s d h i + i I j J γ i j a s d i j + i I k K γ i k a s d i k
O C s = n k K ο k s
Since the construction cost is substantially larger in magnitude than the scenario-weighted operating cost, an adjustment coefficient η is applied to the resource configuration cost before aggregation. The final objective is expressed as Z = λ R η R C + λ S S C , where λ R + λ S = 1 The parameters λ R and λ S reflect the decision maker’s preference between resource investment and post-disaster operating performance. A larger λ R places more emphasis on controlling pre-disaster configuration costs, whereas a larger λ S prioritizes operational efficiency and robustness under uncertain disaster scenarios.
In the proposed model, configuration resilience is operationalized as the ability of a preconfigured emergency medical network to maintain feasible casualty reception and transfer while limiting transfer burden and hospital overload across compound disruption scenarios. The preparedness component comprises the first-stage location and capacity-level decisions for temporary rescue stations and emergency medical facilities, along with the construction-budget constraint. The system’s absorption capacity is reflected in the capacities of these facilities, the allowable hospital reception and overload constraints, and the overload penalty in the second-stage operating cost. Its adaptive capacity is represented by scenario-dependent casualty-transfer decisions, through which casualty flows can be reallocated among temporary rescue stations, emergency medical facilities, and existing hospitals once the disruption conditions are realized. Accordingly, the weighted objective balances the cost of establishing the response network with its expected transfer and overload burden, while the scenario-wise flow-conservation, capacity, treatment-compatibility, and overload constraints maintain an operationally feasible response under each scenario.
The proposed framework retains the here-and-now and wait-and-see structure of a conventional two-stage stochastic location-allocation model, while extending its operational representation in three respects. First, it jointly configures a hierarchical medical response network comprising temporary rescue stations, emergency medical facilities, and existing hospitals, rather than considering only facility opening and direct demand assignment. Second, the compound scenarios jointly modify casualty demand and injury composition, transfer impedance, response accessibility, and hospital reception and treatment capacity. Third, the recourse decisions coordinate severity-specific casualty flows, treatment compatibility, supplementary surge capacity, and hospital overload across the hierarchical network. Configuration resilience therefore emerges from the joint effects of pre-disaster capacity configuration and scenario-adaptive network operations.

4.4. Feasibility and Existence of an Optimal Solution

The planning instances considered in this study satisfy three feasibility conditions. First, at least one combination of temporary rescue-station and emergency-medical-facility capacity levels can be selected within the construction budget. Second, under every scenario, the selected temporary rescue stations provide sufficient capacity and network connectivity to receive casualties from all affected areas. Third, the treatment-compatible capacity of emergency medical facilities and existing hospitals, including the allowable hospital overload capacity, is sufficient to receive the corresponding casualty types through the available transfer links.
Proposition 1.
Under the above conditions, the proposed model has at least one feasible solution and attains a finite optimal solution.
Proof. 
Select a first-stage facility configuration satisfying the construction-budget and capacity-level constraints. For each scenario, casualties can then be assigned from affected areas to connected temporary rescue stations within their available capacities and subsequently transferred to treatment-compatible emergency medical facilities or hospitals. The corresponding path-activation variables are set to one for transfer links carrying positive flows, and the hospital-overload variables are set equal to the excess reception amounts above normal hospital capacity. This construction satisfies the casualty-allocation, capacity, treatment-compatibility, flow-conservation, path-linking, and hospital-overload constraints. □
The set of first-stage binary configurations is finite. For each feasible configuration, casualty flows are bounded by scenario demand and facility reception capacities, while hospital inflows are bounded by the allowable overload limits. Because the objective function is linear and bounded below, a finite minimum is attained over the nonempty feasible set. Therefore, the proposed model has an optimal solution.

5. Solution Approaches

The proposed model has a two-stage decision structure in which strategic resource-configuration decisions and scenario-dependent emergency response decisions are tightly coupled. For each candidate configuration of temporary rescue stations and emergency medical facilities, casualty allocation, transfer-link activation, casualty flows, and hospital overload must be jointly optimized across all compound disruption scenarios.
The size of the deterministic equivalent grows rapidly with the rescue-network and scenario dimensions. Let H , I , K , A , and S denote the numbers of affected areas, candidate temporary rescue stations, candidate emergency medical facilities, hospitals, casualty types, and scenarios, respectively, while Q and P denote the available capacity levels. The model contains
N b = I Q + J P + S A H I + I J + I K
binary variables and
N c = S A H I + I J + I K + S K
continuous variables. The number of constraints is dominated by
O S A H I + I J + I K + S K + I Q + J P
Accordingly, the space required to represent the model grows linearly with the number of scenarios and casualty types, as well as with the number of feasible connections between consecutive network layers. The actual model can be smaller when infeasible transfer links are removed in advance.
From a time-complexity perspective, the proposed problem is NP-hard because it reduces to the capacitated facility-location problem as a special case by considering a single scenario and casualty type and simplifying the downstream transfer structure. Therefore, no polynomial-time exact algorithm is currently known for the general formulation, and a branch-and-bound or branch-and-cut method may require an exponential number of nodes in the worst case. The scenario-expanded recourse structure further increases the computational burden because each candidate first-stage configuration must be evaluated through scenario-dependent allocation and transfer decisions.
Although exact optimization provides a useful benchmark for small- and medium-scale instances, repeatedly solving these scenario-response subproblems becomes computationally expensive as the instance size increases. Therefore, this study develops a problem-oriented variable neighborhood search framework for the proposed two-stage model. A baseline full-evaluation VNS (BVNS) is first designed to search the first-stage facility-location and capacity decisions, with CPLEX used as the exact evaluator. To reduce the number of expensive exact evaluations, an active-learning-assisted VNS (AL-VNS) is further proposed. In AL-VNS, a small-sample committee-based random forest surrogate guides candidate screening, while all accepted and reported solutions are exactly verified by CPLEX. The comparison between BVNS and AL-VNS evaluates whether active verification can reduce the computational burden while maintaining solution quality under the same VNS search structure.

5.1. Initial Solution

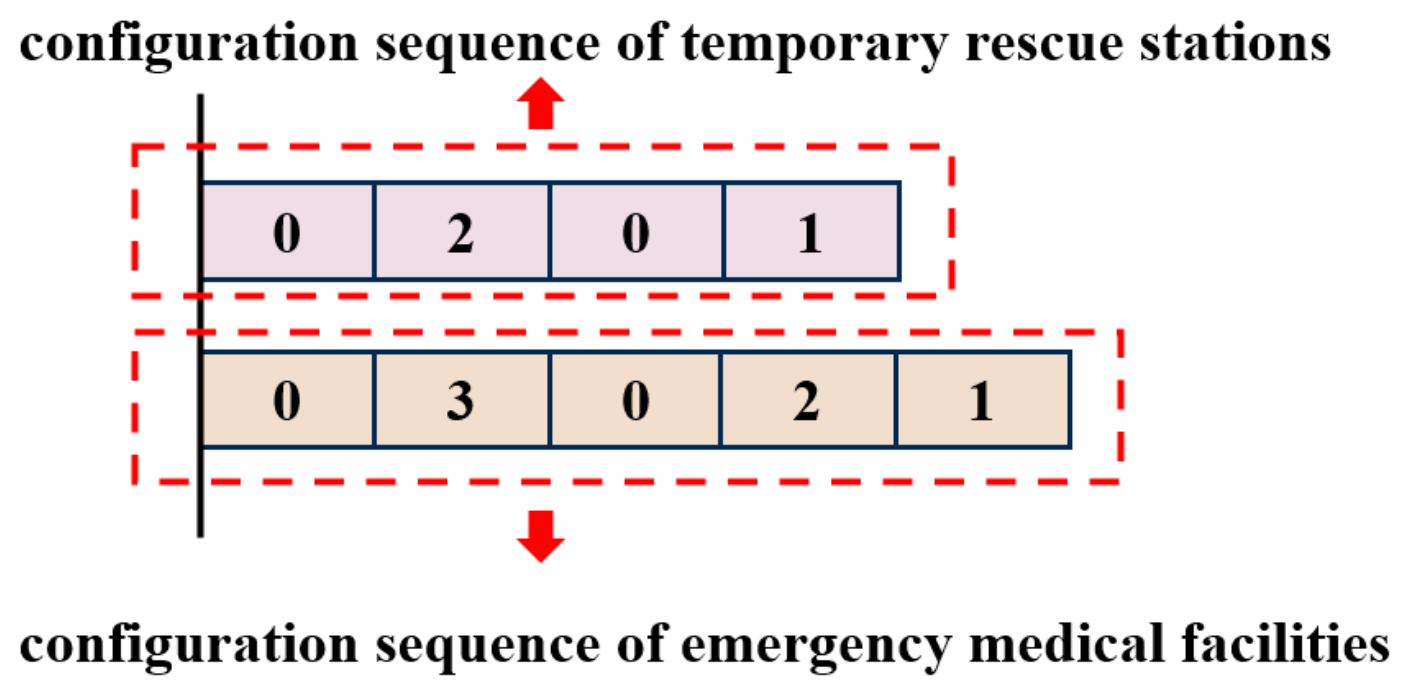
Since the neighborhood search focuses on first-stage resource-configuration decisions, a candidate solution is encoded as two integer sequences, denoted by X = R , E . The first sequence R = r 1 , , r I describes the configuration of temporary rescue stations, and the second sequence E = e 1 , e J describes the configuration of emergency medical facilities. Each element corresponds to one candidate site. A value of 0 indicates that the site is not opened, whereas values 1, 2, and 3 represent small, medium, and large capacity levels, respectively.
This representation is directly linked to the first-stage decision variables in the mathematical model. If r i = q > 0 , the corresponding temporary rescue station variable is fixed to the selected capacity level, while all other capacity levels at the same site are set to zero. The same mapping is applied to emergency medical facilities through e j . Therefore, the initial solution naturally satisfies the restriction that each candidate site can select at most one capacity level.
Figure 3 illustrates the structure of the initial solution. The upper row represents the configuration sequence of temporary rescue stations, and the lower row represents the configuration sequence of emergency medical facilities. Each cell corresponds to a candidate site, and the number in the cell indicates the selected capacity level. For example, a zero-valued cell denotes a closed site, while a positive value indicates the capacity level assigned to that site. The corresponding initial-solution construction procedure is presented in Algorithm 1.
Algorithm 1: Initial solution construction
Input:  I ,   J , P , Q , B , v i q + ,   v j p + ,   C i q I ,   C j p J ,   n ,   g k ,   l a .
Output: initial first-stage configuration X = (R, E).
Systems 14 00922 i001
The procedure is capacity-oriented but weakly randomized. It aims to provide a feasible and informative starting point without embedding an overly strong heuristic before the VNS search. The same construction rule is used for BVNS and AL-VNS so that the comparison focuses on the evaluation mechanism.

5.2. Neighborhood Structures

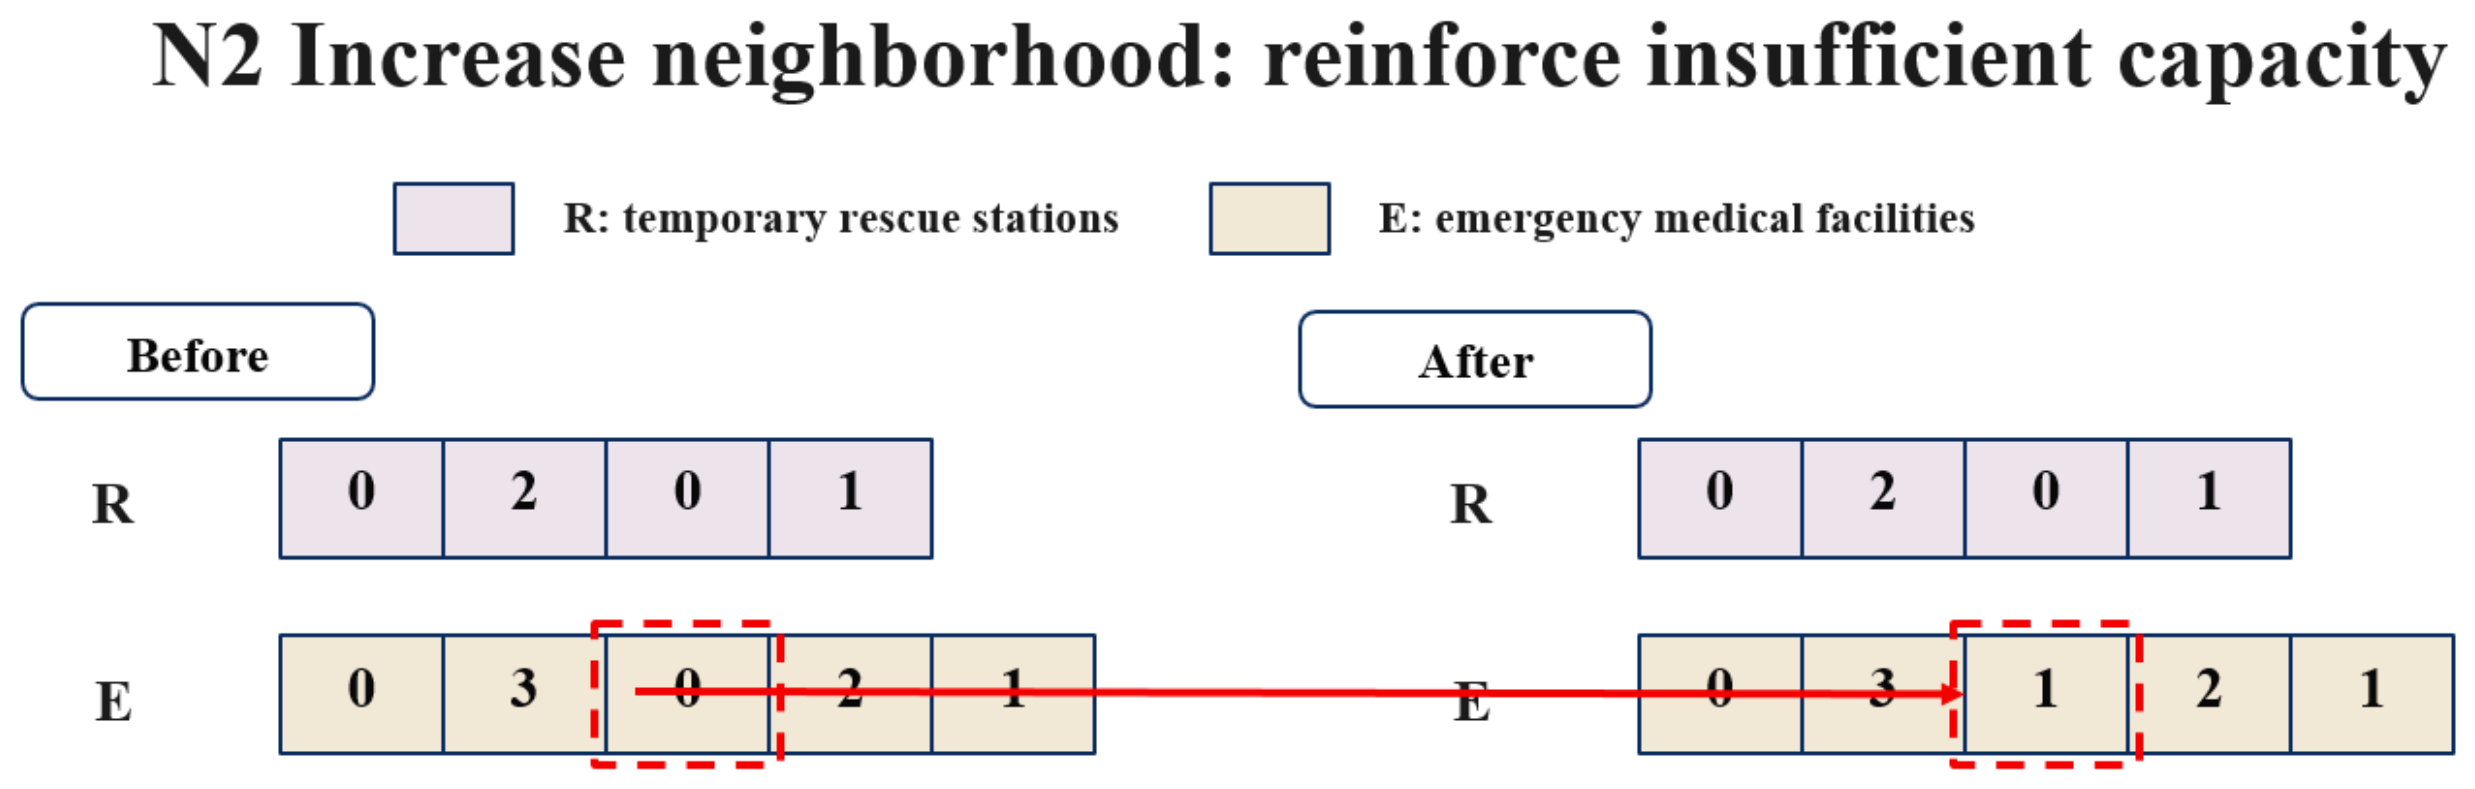
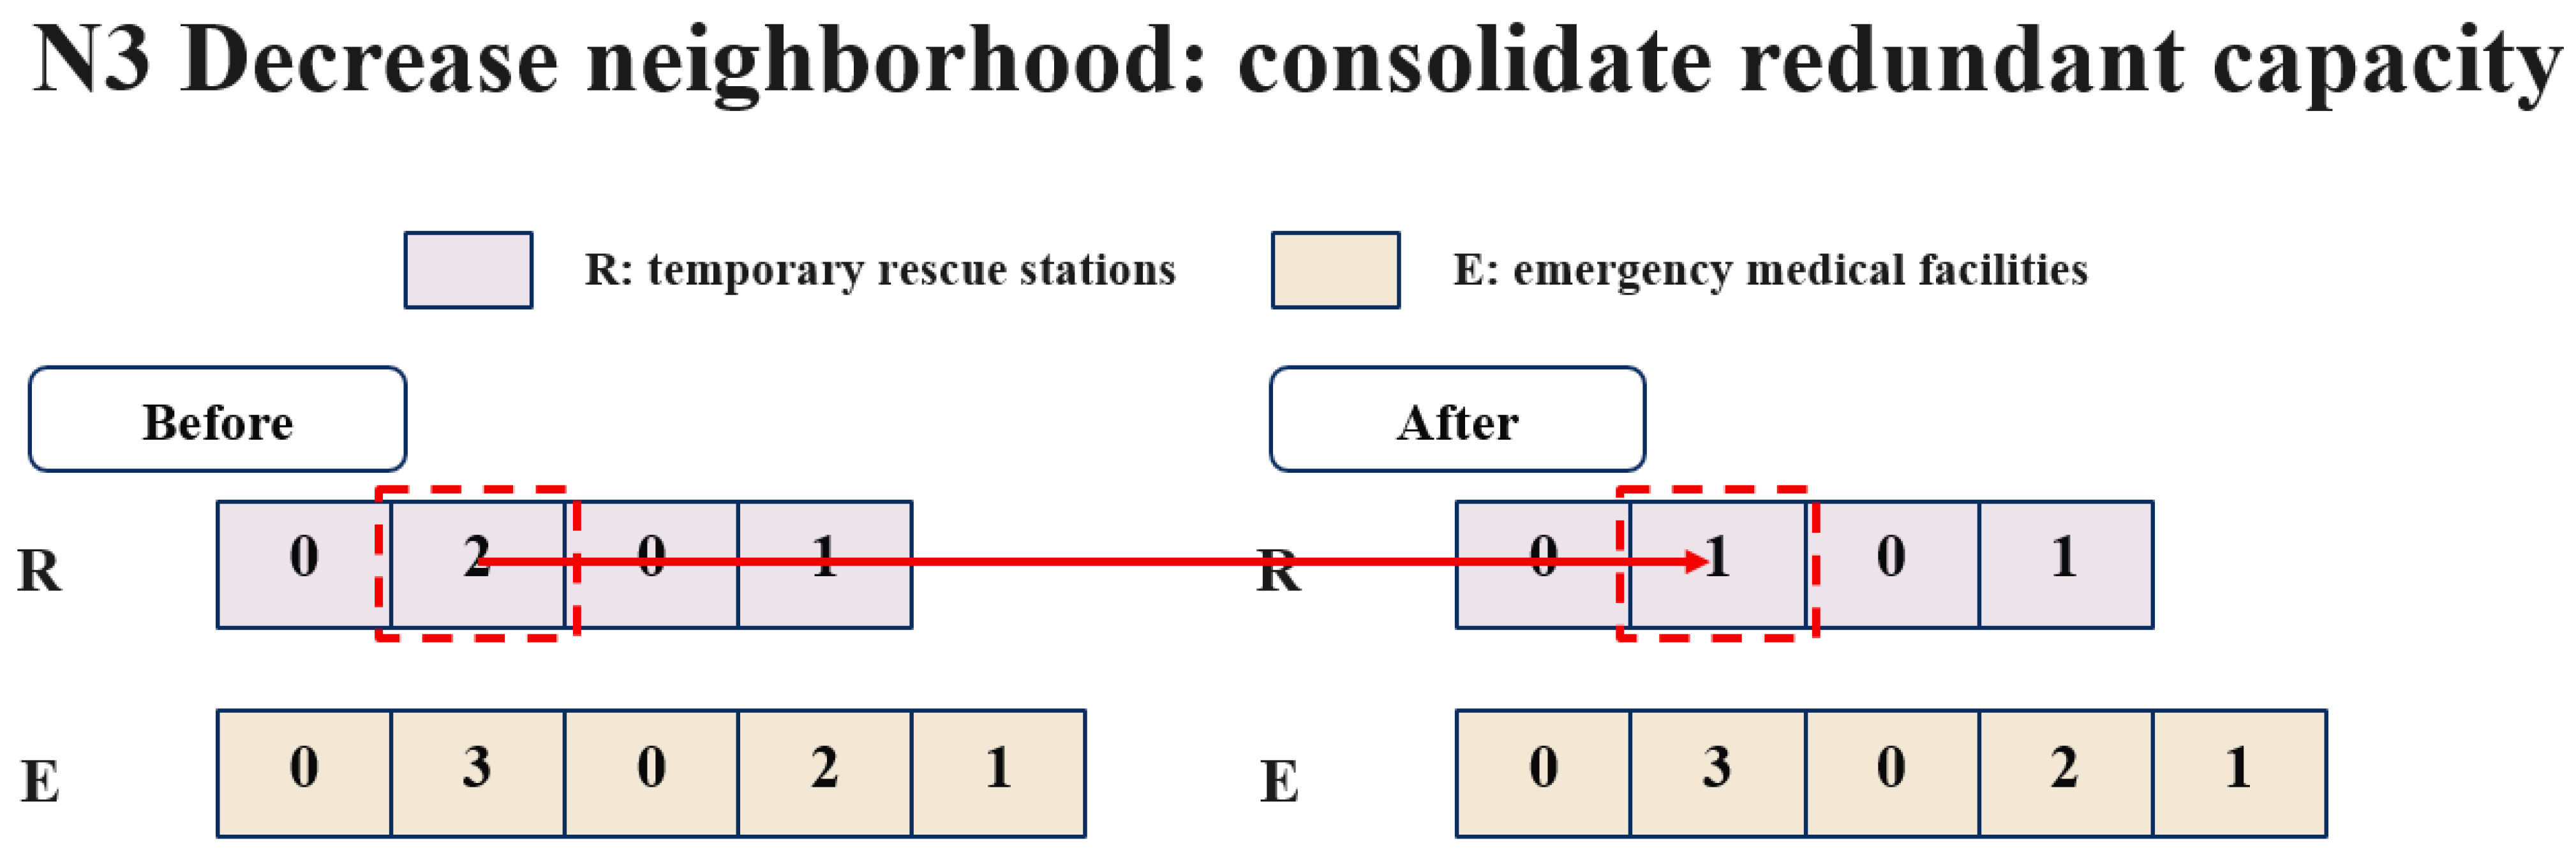
The neighborhood structures are designed to operate directly on the first-stage configuration X = R , E . Since each element in R and E represents the opening status and capacity level of a candidate site, a neighborhood move can be interpreted as a local modification of the pre-disaster resource plan. We consider three complementary neighborhoods: swap, increase, and decrease. Together, they allow the search to adjust the spatial distribution of existing capacity, expand insufficient service capacity, and remove redundant resources.
(1)
Neighborhood structure 1: Swap
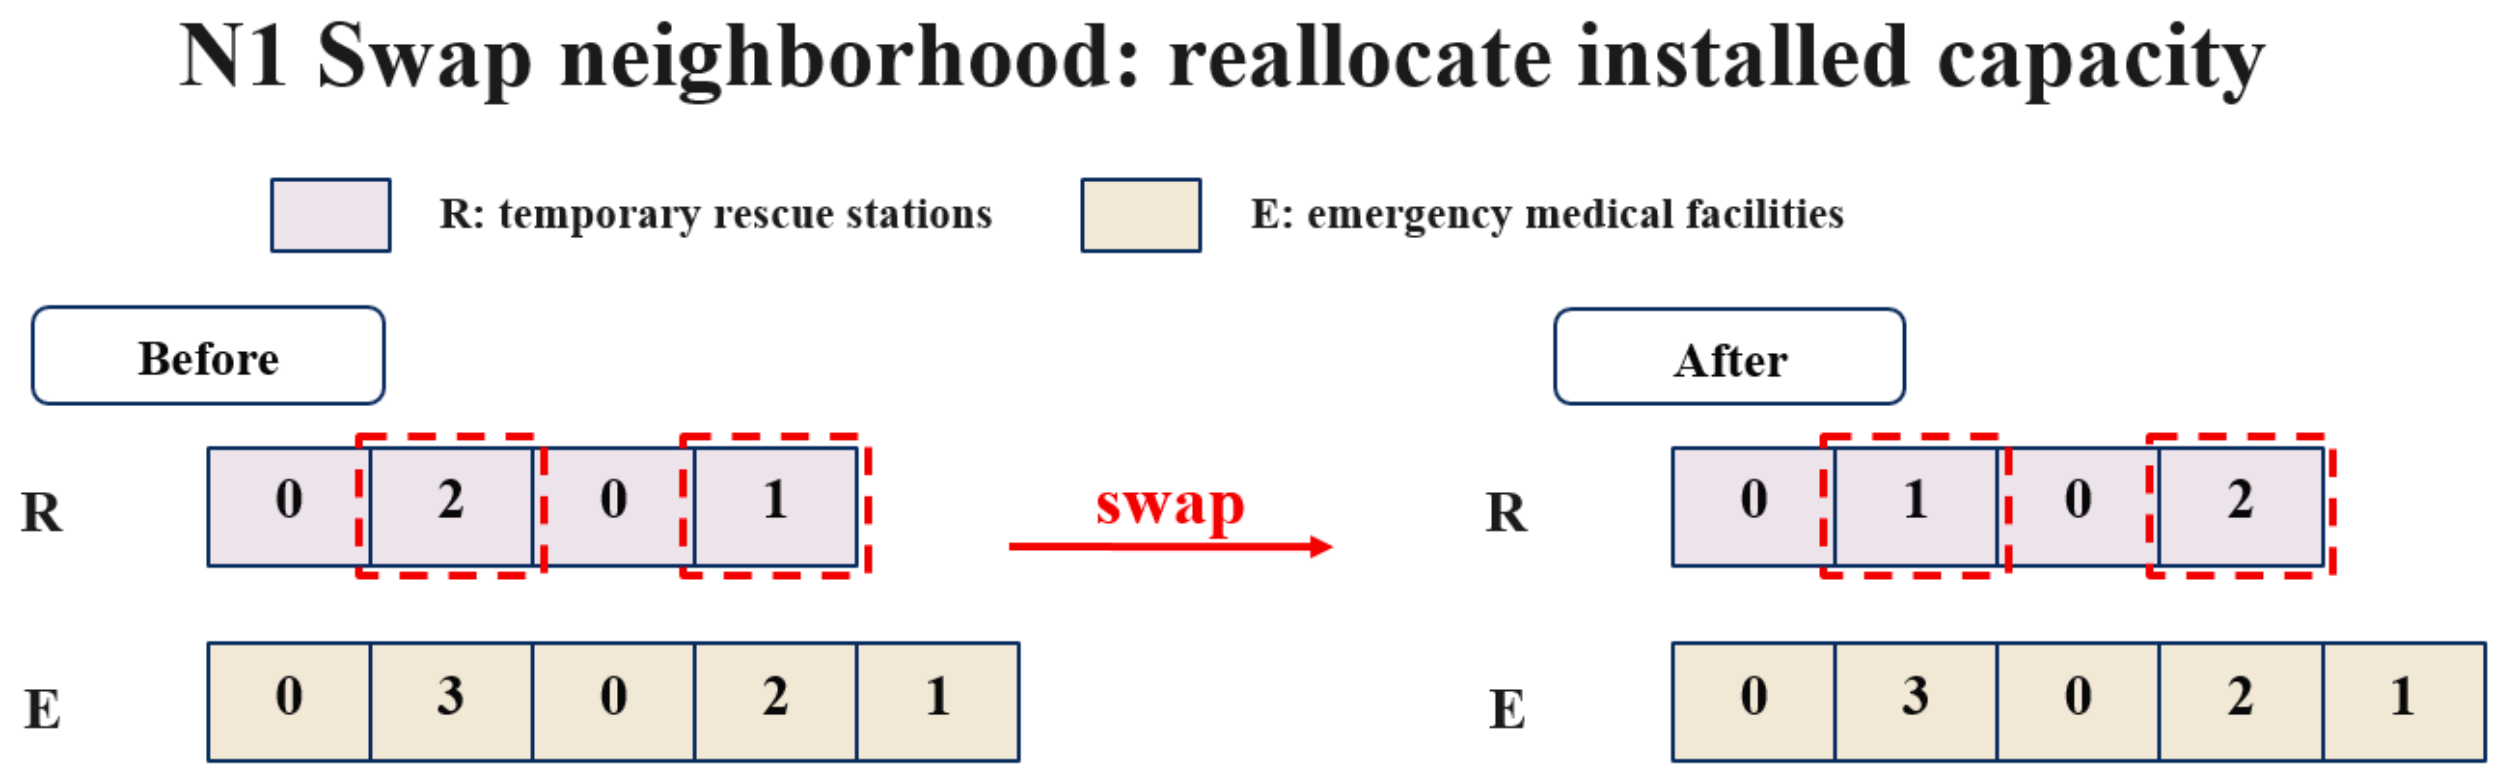
It randomly selects two positions from the same configuration sequence, either R or E, and exchanges their capacity levels. This move preserves the total capacity intensity of the selected facility type but changes its spatial allocation. Therefore, N1 mainly explores alternative layouts under the same resource level and is particularly for improving the spatial matching between demand points, temporary rescue stations, emergency medical facilities, and hospitals. The swap neighborhood is illustrated in Figure 4.
(2)
Neighborhood structure 2: Increase
It randomly selects one candidate site whose current value is smaller than the maximum capacity level and increases its value by one. Thus, a closed site may be opened, or an opened site may be upgraded to a larger capacity level. This move expands the available rescue or treatment capacity and helps the search respond to insufficient coverage, high demand pressure, or hospital-overload risk. Since capacity expansion also increases setup cost, the resulting configuration is evaluated under the construction-budget constraint and the complete objective function. The increase neighborhood is illustrated in Figure 5.
(3)
Neighborhood structure 3: Decrease
It randomly selects one candidate site with a positive capacity level and decreases its value by one. This operation may downgrade an opened facility or close it completely. N3 provides a mechanism for removing excessive or poorly located capacity and for reducing unnecessary setup cost. Although such a move may increase downstream transportation or overload costs, it is essential for balancing resource investment and post-disaster operating performance. The decrease neighborhood is illustrated in Figure 6.
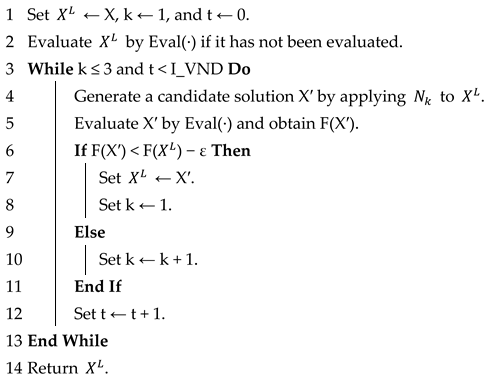
The variable neighborhood descent (VND) procedure is used as the local improvement framework of the proposed algorithm. VND is a deterministic variant of the variable neighborhood search family, in which multiple neighborhood structures are examined sequentially and the search returns to the first neighborhood whenever an improving move is accepted [27]. In this study, three problem-specific neighborhoods are designed. The swap move emphasizes spatial reallocation, the increase move emphasizes capacity reinforcement, and the decrease move emphasizes resource consolidation. These neighborhoods are explored in the order N1, N2, and N3. If no improving solution can be identified in the current neighborhood, the search proceeds to the next neighborhood. Once an improving solution is found, the search returns to N1, allowing the spatial layout to be re-optimized after any change in resource level. The pseudocode of the VND procedure is shown in Algorithm 2.
Algorithm 2: Variable neighborhood descent (VND)
Input:  initial   configuration   X ;   neighborhood   set   N   =   N 1 , N 2 , N 3 ; exact evaluator Eval(·); maximum number of VND iterations I_VND; improvement tolerance ε.
Output:  locally   improved   configuration   X L .
Systems 14 00922 i002

5.3. Shaking Procedure

The local search in VND is designed to improve a given configuration through small modifications of facility locations and capacity levels. Such an intensification mechanism is effective for refining a solution, but it may also keep the search within a limited region of the solution space. In particular, a configuration may have a reasonable aggregate capacity level while its capacity is not well distributed across candidate sites. In this case, further local moves may provide only marginal improvement.
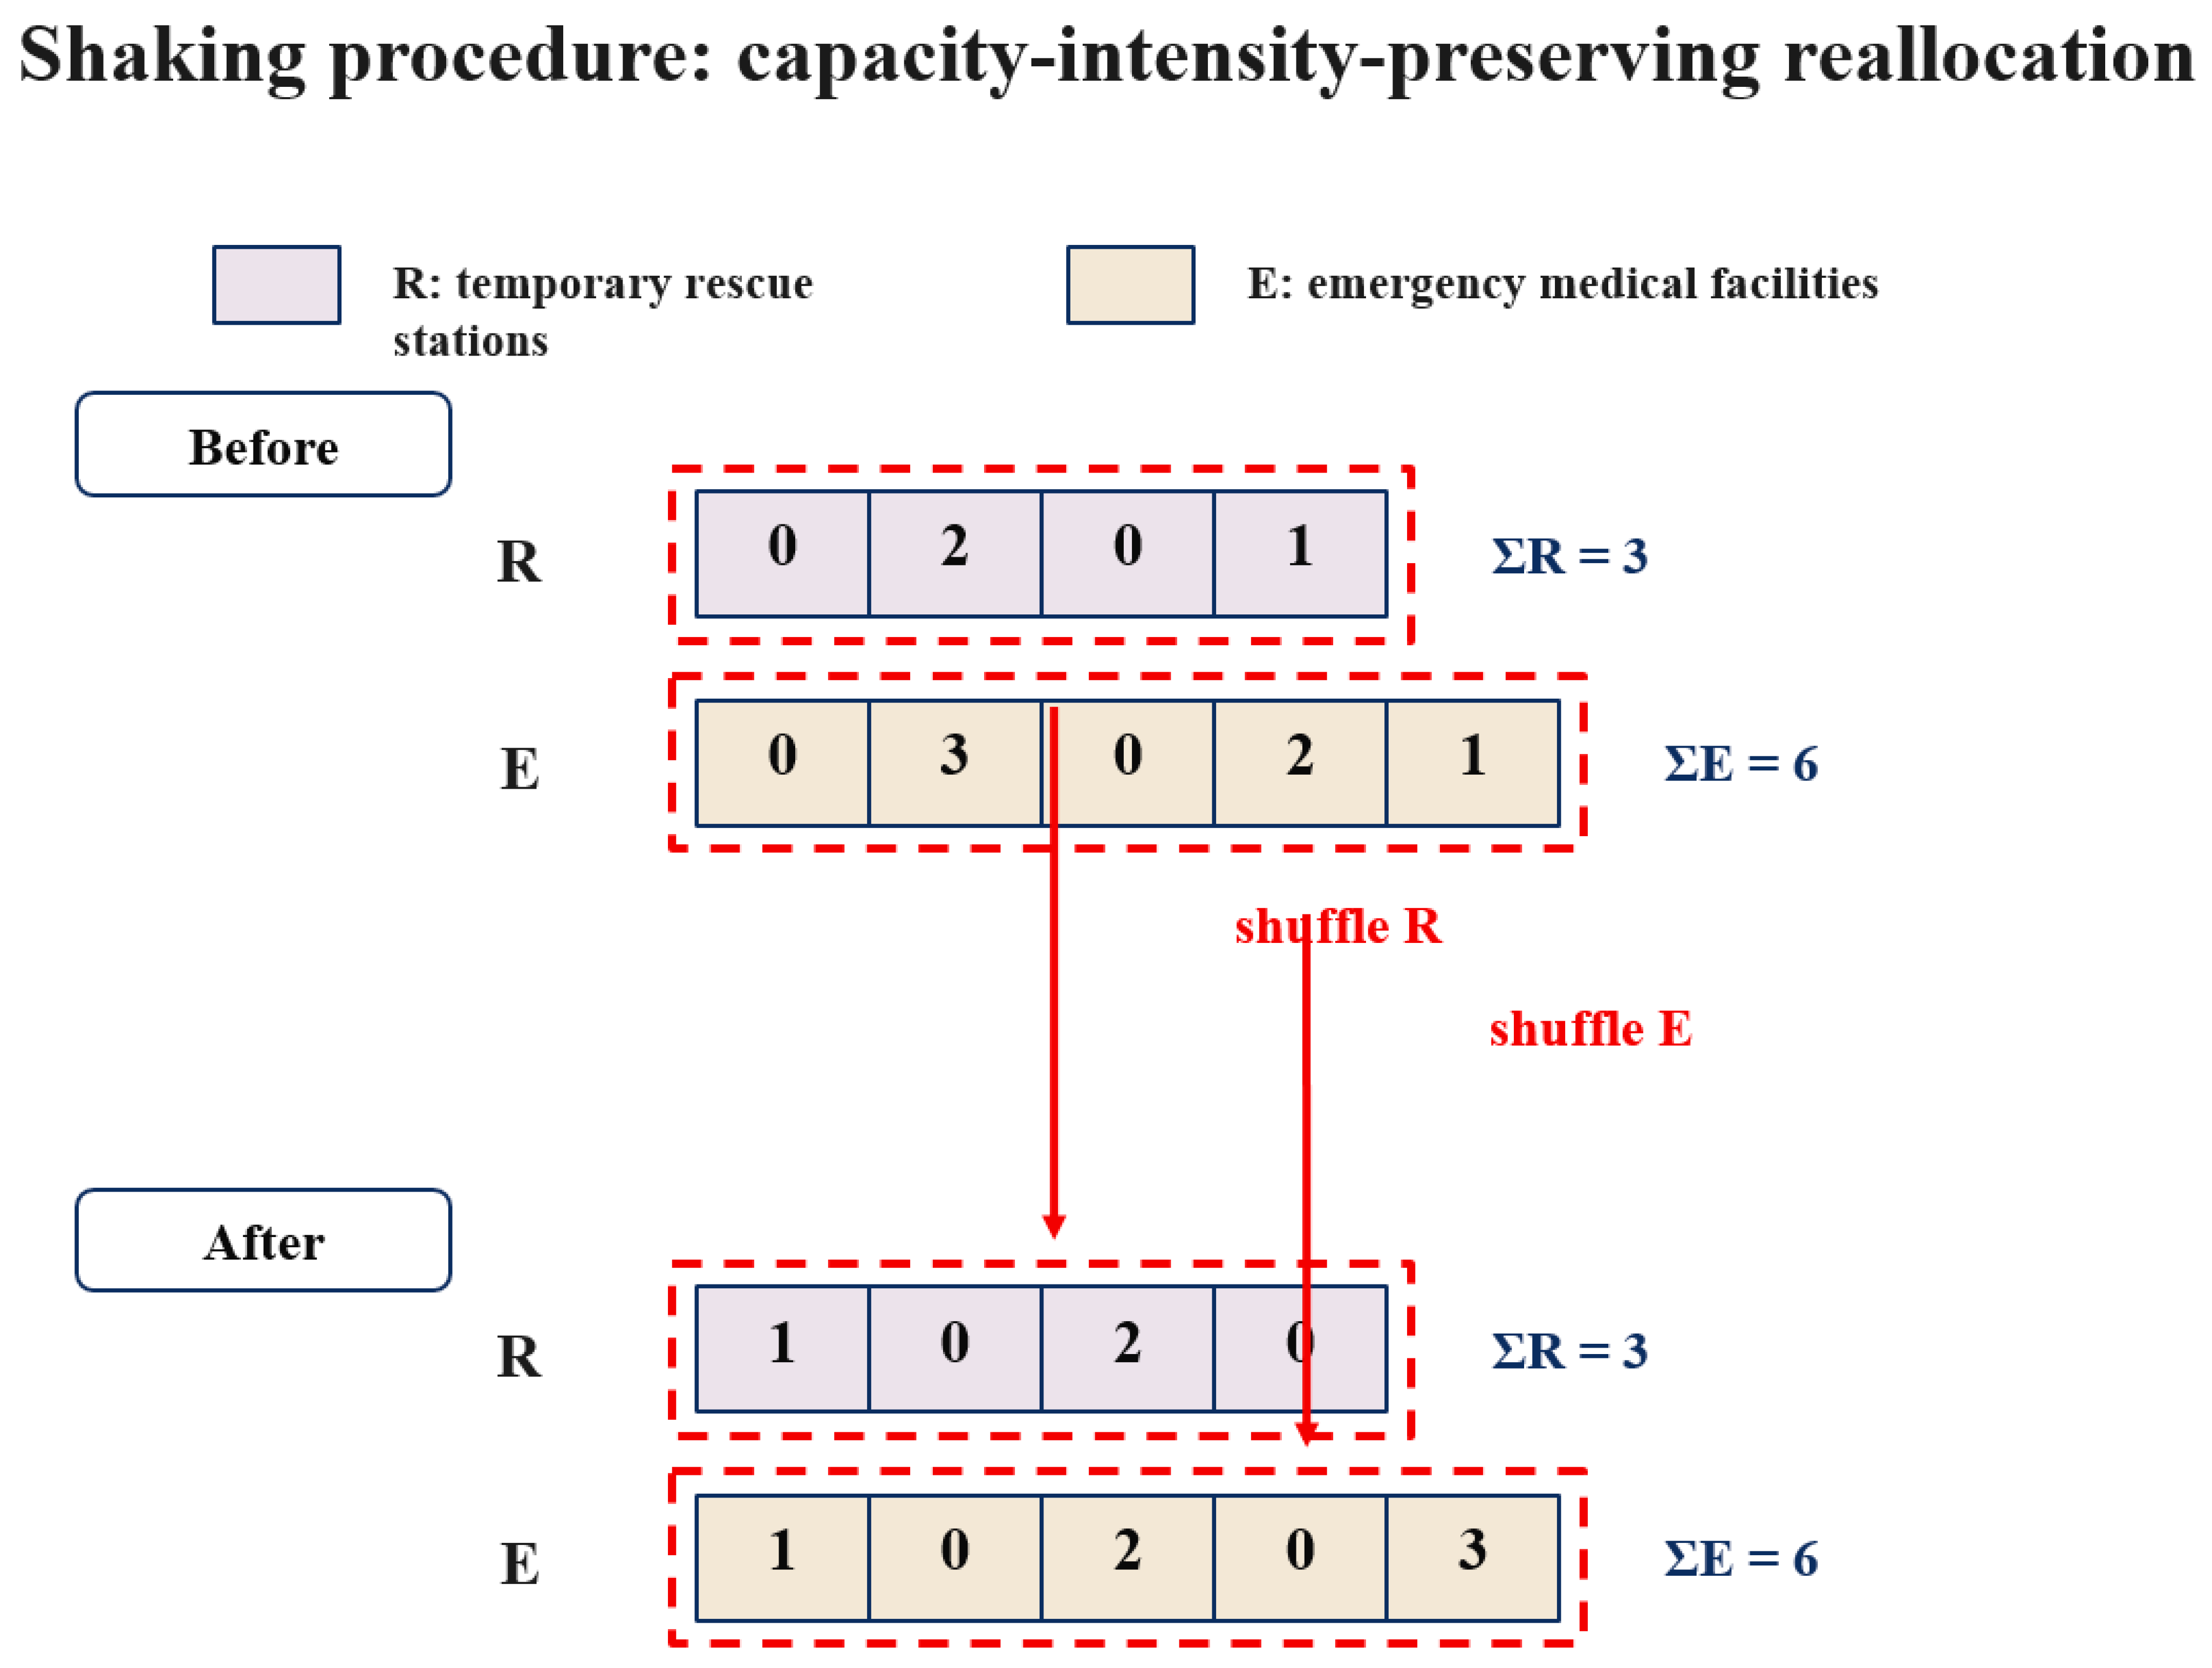
To enhance diversification, we introduce a shaking procedure between two consecutive VNS iterations. The procedure is applied to the first-stage configuration X = R , E . For each sequence, it preserves the total capacity intensity but randomly reallocates the capacity levels among candidate sites. The purpose of shaking is not to arbitrarily expand or reduce resources, but to test whether the same amount of installed capacity can perform better when placed at different locations. After shaking, the perturbed configuration is evaluated and passed to the VND procedure for further local improvement. In this way, the algorithm alternates between diversification through capacity reallocation and intensification through neighborhood descent. The capacity-intensity-preserving shaking procedure is illustrated in Figure 7.

5.4. Baseline Variable Neighborhood Search

The baseline variable neighborhood search (BVNS) integrates the solution representation, neighborhood structures, VND procedure, and shaking mechanism described above. It is used as the full-evaluation benchmark in this study. For each candidate first-stage configuration, the temporary rescue station and emergency medical facility decisions are fixed, and CPLEX is called to solve the corresponding scenario-response problem. The complete BVNS procedure is presented in Algorithm 3.
Algorithm 3: Baseline variable neighborhood search (BVNS)
Input:  initial   configuration   X 0 ;   neighborhood   set   N   =   N 1 , N 2 , N 3 ; exact evaluator Eval(·); shaking operator Shake(·); VND procedure; maximum number of iterations Imax; maximum number of consecutive non-improving iterations Istall; improvement tolerance ε.
Output: best first-stage configuration X* and its exact objective value F(X*).
Systems 14 00922 i003

5.5. Active-Learning-Assisted Local Search

BVNS preserves the two-stage structure of the problem by searching only the first-stage resource configuration and using CPLEX to evaluate the corresponding scenario-response problem. This design keeps the search space interpretable, but it also makes candidate evaluation expensive. As the number of candidate sites, affected areas, hospitals, and disaster scenarios increases, repeatedly solving the recourse problem becomes the main computational bottleneck.
This issue is common in location and emergency planning problems, with expensive evaluations. Sulaman et al. [28] show that surrogate-assisted metaheuristics can reduce the computational burden of facility-location problems that require many costly function evaluations. Xiang et al. [29] report a similar motivation for shelter location under uncertain road networks, where each solution evaluation requires scenario-dependent evacuation distance calculations. These studies suggest that surrogate models can be useful when exact evaluations are informative but too expensive to apply to every candidate solution.
Motivated by this need, we introduce a small-sample, active-learning-assisted local-search mechanism into BVNS. In the proposed resilience-oriented configuration problem, each candidate resource configuration must be evaluated via scenario-based response optimization, which makes exact CPLEX evaluations computationally expensive. Instead of evaluating all neighboring configurations exactly or using a surrogate as a direct replacement for the exact evaluator, AL-VNS treats exact evaluations as limited informative samples. A committee random forest surrogate is trained on a small set of CPLEX-evaluated configurations and is actively updated during the search. It is then used to guide evaluation-budget allocation by selecting candidates for exact verification according to predicted quality, model uncertainty, structural diversity, and random exploration.
The surrogate is used only for active screening and sample selection, not for solution certification. All accepted solutions and reported best solutions are still evaluated by CPLEX. Thus, AL-VNS retains the same representation, neighborhoods, shaking procedure, and acceptance rule as BVNS, while using small-sample active learning to reduce unnecessary exact evaluations and guide the search toward promising or informative regions.

5.5.1. Overall AL-VNS Mechanism

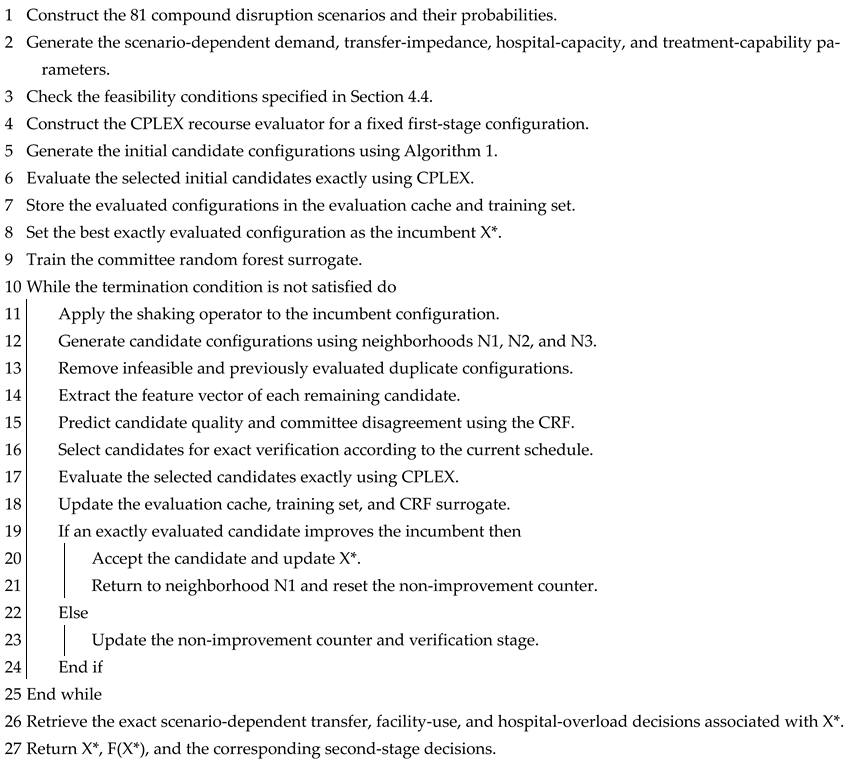
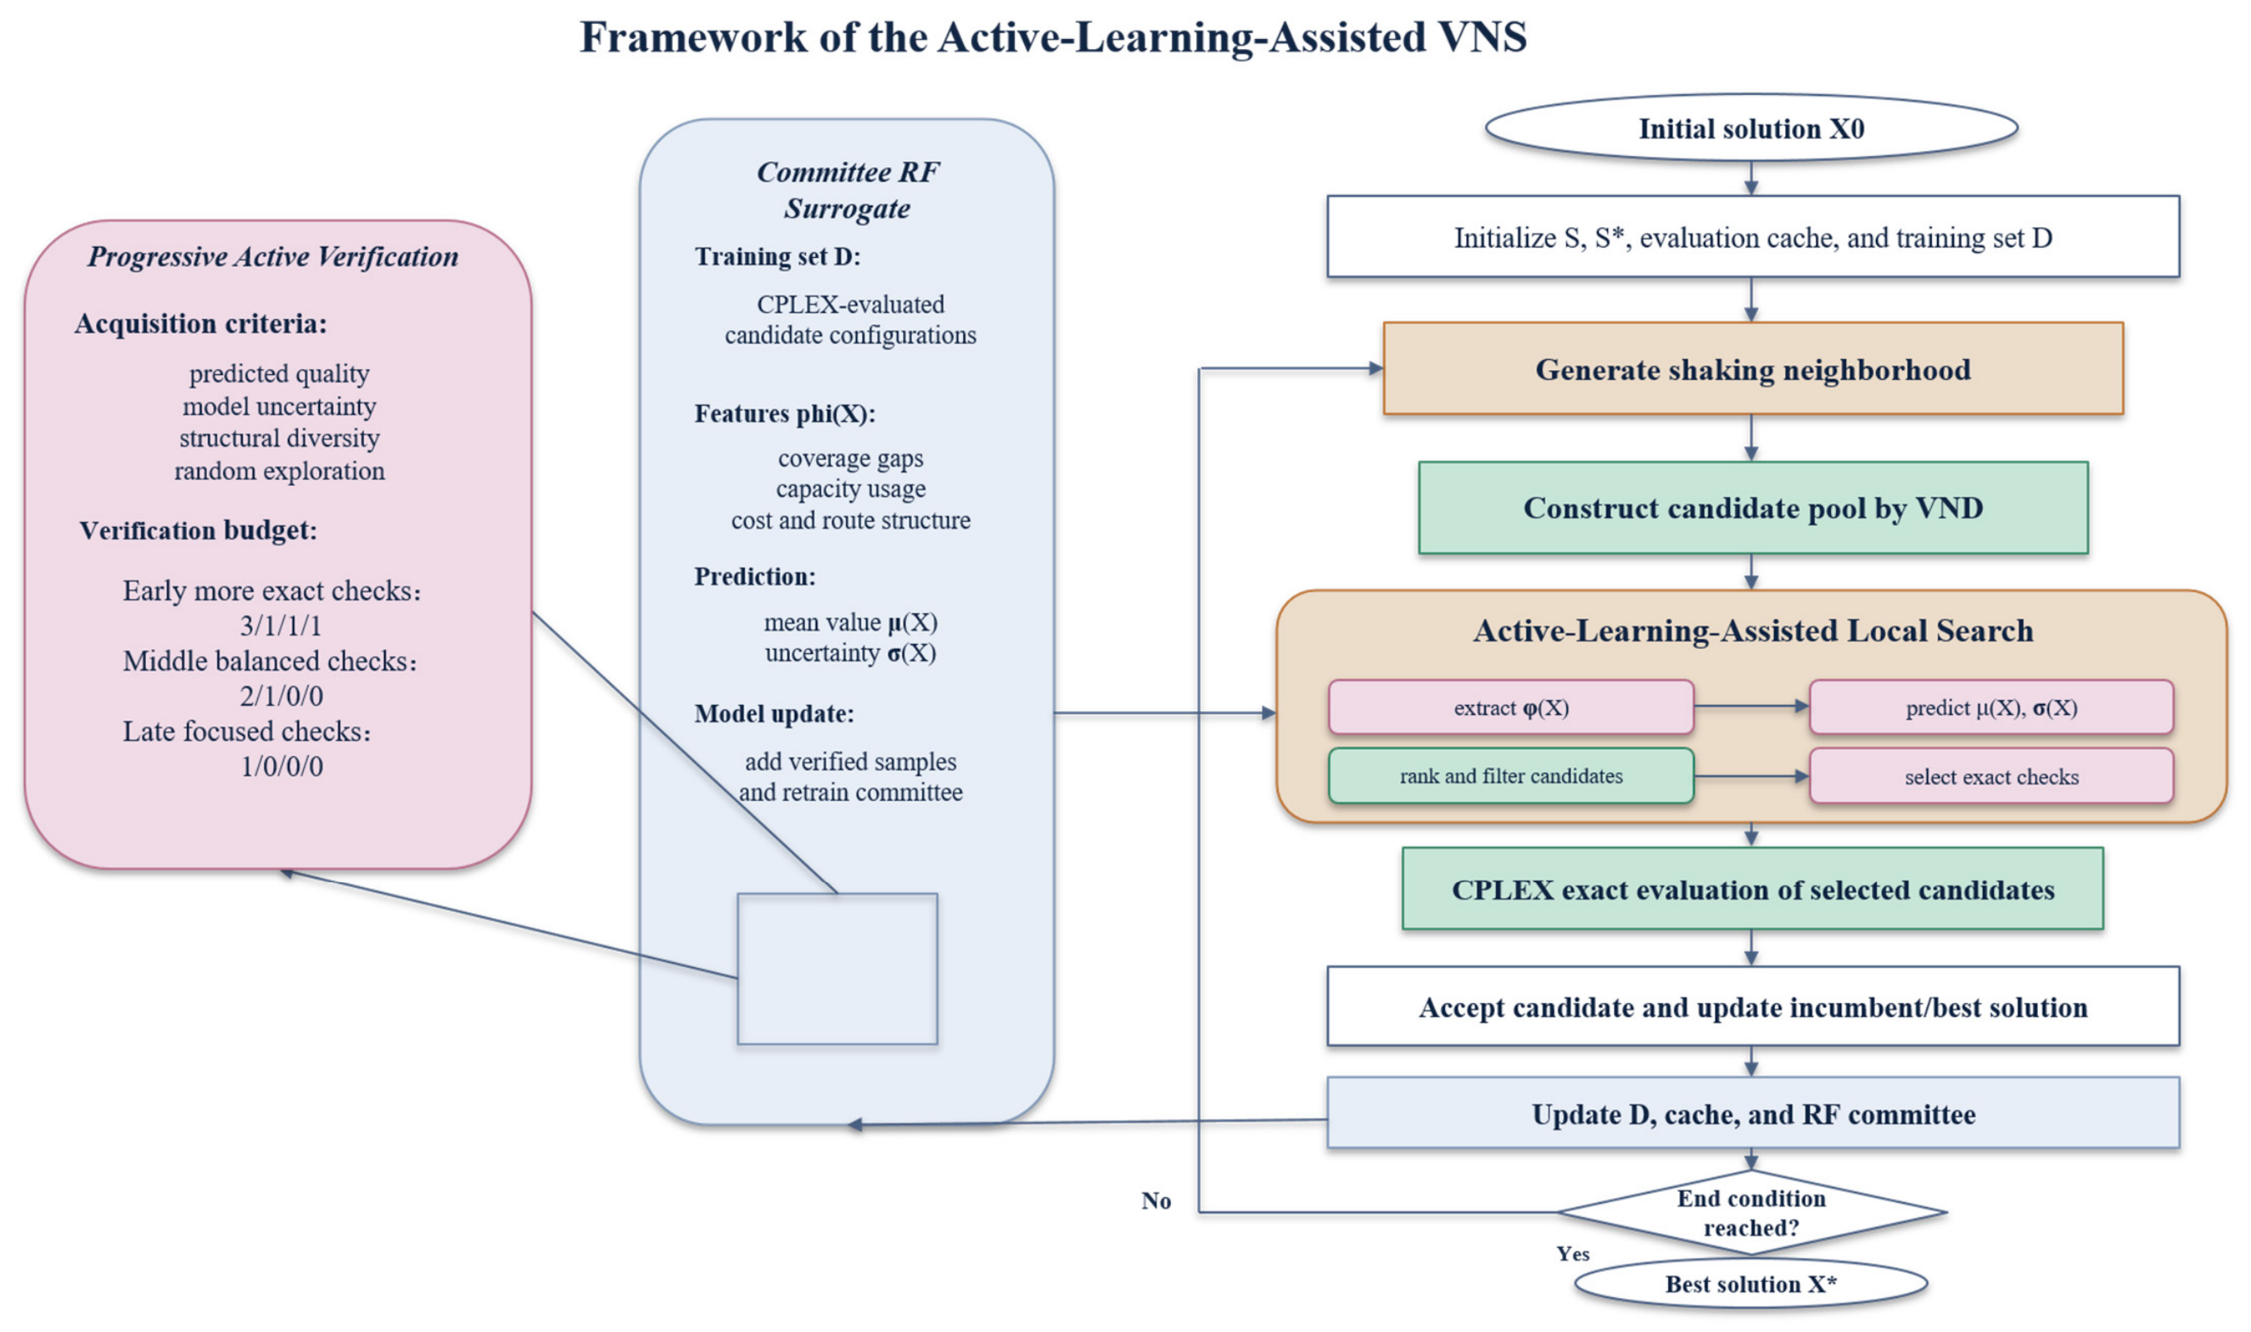
The proposed AL-VNS extends the BVNS framework by introducing an active-learning-assisted evaluation mechanism into the VND-based local search phase. The overall search structure remains consistent with the BVNS, including the initial solution construction, shaking procedure, neighborhood structures, acceptance rule, and termination condition. The key difference lies in the evaluation of candidate solutions generated during local search, where a committee random forest surrogate is used to rapidly estimate solution quality and guide the selection of candidates for exact verification.
Specifically, the surrogate model is employed only to screen and prioritize candidate solutions according to their predicted quality and model uncertainty. It does not replace the exact evaluation of the original optimization model. Whenever a candidate solution is considered for acceptance, the incumbent or best solution is updated, or a new training sample is added to the learning set, CPLEX evaluates the solution. In this way, AL-VNS reduces unnecessary exact evaluations during the search while maintaining the same solution-evaluation standard as BVNS. The algorithmic parameter settings used for BVNS and AL-VNS are summarized in Table 1.
N1, N2, and N3 denote the three neighborhood structures used in the VND procedure. In AL-VNS, the exact-review schedule is reported as exploit/uncertainty/diversity/random. The minimum training sample size is computed as max (0, 50, ceil (2.0 × d)), where d = 36 is the feature dimension. The CRF hyperparameters are reported separately when introducing the surrogate model.

5.5.2. Feature Vector and Training-Set Construction

In AL-VNS, the surrogate model does not directly operate on the full set of second-stage allocation variables. Instead, each candidate solution is represented by a compact feature vector extracted from its first-stage location-scale decision. This design keeps the learning task lightweight while retaining the structural information that is most relevant to the exact objective evaluation.
Let X denote a candidate first-stage solution. The rescue-station decisions are encoded by q X = q 1 , , q I ,where q i in 0 , , Q , and the emergency-facility decisions are encoded by p X = p 1 , , p J , where p j in 0 , , P . A value of zero means that the corresponding candidate site is not opened, while a positive value indicates the selected capacity level. The raw encoding block therefore contains I+J location-scale features.
To help the surrogate capture the global structure of a configuration, two scale-distribution blocks are added. For rescue stations and emergency facilities, respectively, these features are defined as
n q R X = i   i n   I : q i = q , q = 0 , Q
n q E X = j   i n   J : q j = q , q = 0 , P
These count features summarize the global distribution of capacity-level choices across all candidate sites, including non-opened sites. Although such information is implicitly contained in the raw location-sizing code, the aggregate counts provide a more compact and explicit description of the configuration structure. In particular, they help the surrogate model distinguish whether a solution is sparse, capacity-intensive, or dominated by medium- or large-scale facilities.
In addition, eight aggregate descriptors are introduced to improve the learnability of the mapping between a first-stage configuration and its exact objective value. Let C(X) be the construction cost of X and B be the construction budget. Let C a p R X , C a p E X , and C a p S E X denote the total rescue-station capacity, total emergency-facility capacity, and severe-casualty emergency-treatment capacity, respectively. The corresponding target capacities are denoted by C a p R ¯ , C a p E ¯ , and C a p S E ¯ . The non-negative capacity gaps are computed as
G R X = m a x C a p R ¯ C a p R X , 0
G E X = m a x C a p E ¯ C a p E X , 0
G S E X = m a x C a p S E ¯ C a p S E X , 0
The eight aggregate features are therefore C(X), C(X)/B, C a p R X , C a p E X , C a p S E X , G R X , G E X , and G S E X . They summarize budget usage, total service capacity, and residual capacity shortages under severe demand conditions, which are key determinants of the downstream exact evaluation.
The complete feature mapping is written as
φ X = q X , p X , n q R X , n q E X , C X ,   C ( X ) / B ,   C a p R X ,   C a p E X ,   C a p S E X ,   G R X ,   G E X ,   G S E X
Accordingly, the feature dimension is d = I + J + Q + 1 + P + 1 + 8 .
For a 10-10 test instance, where J = 10, I = 10, P = 3, and Q = 3, the resulting feature dimension is d = 36.
The training set is constructed only from exact CPLEX evaluations. When a candidate solution X is selected for exact verification, CPLEX solves the induced allocation problem and returns the exact objective value F^CPLEX(X). The corresponding supervised sample is φ X , y X ,   w h e r e   y X = F C P L E X X . At iteration t, the learning set is therefore D t = φ X m , y X m m = 1 M t , y m = F C P L E X X m .
The learning set contains only configurations evaluated by CPLEX. For each selected candidate X , the induced second-stage allocation problem is solved exactly, and the resulting value F C P L E X X is used as the training label. Surrogate predictions are used solely to rank and screen local-search candidates; they are never used as labels, nor to update the incumbent. Duplicate configurations are handled through an evaluation cache. When CPLEX does not return a feasible objective value, a deterministic penalty based on the worst valid value observed so far is assigned, so that such configurations can still be learned and subsequently avoided. Hence, AL-VNS uses the surrogate only for search guidance, while solution certification remains fully based on exact CPLEX evaluations, preserving the evaluation standard of BVNS.

5.5.3. Committee Random Forest Surrogate

In the VND phase, local search repeatedly compares the current solution with a set of neighboring configurations. The exact acceptance rule is F C P L E X ( X ) < F C P L E X ( X ) ϵ , where ϵ is the improvement tolerance. Hence, no move can be accepted unless the candidate has been evaluated by CPLEX. However, at the preliminary screening stage, it is not necessary to compute the exact objective value of every neighbor. A low-cost surrogate can instead be used to rank candidates and identify those that are most likely to be worth exact evaluation. The surrogate therefore guides the allocation of CPLEX evaluations, while move acceptance, incumbent updates, and best-solution updates remain fully based on exact CPLEX values.
Several regression models can serve as surrogates for expensive optimization, including random forests (RF), extreme gradient boosting (XGBoost), extreme learning machines (ELMs), and Gaussian process regression (GPR). In this study, the input consists of a discrete location-scale encoding augmented with aggregate cost, capacity, and coverage descriptors. Tree-based ensemble models are well suited to this tabular representation, as they can capture nonlinear threshold effects and interactions among discrete site-level decisions without requiring differentiability or smoothness assumptions. Recent surrogate-assisted facility-location studies also provide empirical evidence that RF-type surrogates can be effective in discrete facility-location search [28].
Based on these considerations, AL-VNS adopts a committee random forest (CRF) regression surrogate. The RF component follows the ensemble-learning principle of [30], while the committee structure is consistent with active-learning surrogate management, where both promising and uncertain solutions are selected for exact evaluation [31]. The CRF is trained to predict the exact CPLEX objective value, but in the algorithm, it is used mainly as a ranking and screening device.
Let D t = φ X m , y X m m = 1 M t denote the training set available at iteration t, where y m = F C P L E X X m . A committee of N random-forest regressors is constructed. For member n = 1 , , N , a bootstrap sample D t n is drawn from D t and a random-forest regressor R F n is trained. For a candidate solution X, the n-th committee member produces
f ^ n X = R F n φ X , n = 1 , N
The CRF prediction is the committee mean
μ X = 1 N n = 1 N f ^ n X
and the model uncertainty is measured by the dispersion among committee members
σ X = 1 N f ^ n X μ X 2
A smaller μ X indicates a more promising candidate under the minimization objective, whereas a larger σ X indicates stronger disagreement among committee members and hence a region where the current training set provides limited information. This uncertainty measure should be interpreted as committee disagreement rather than a formal Bayesian posterior variance.
During active-learning-assisted local search, the CRF quickly evaluates all generated candidates and provides two signals: predicted quality and predictive uncertainty. The predicted quality signal is used to identify candidates that are likely to improve the incumbent solution, while the uncertainty signal is used to select informative candidates for model refinement. The CRF hyperparameters used in the numerical experiments are listed in Table 2.
These settings keep the surrogate lightweight relative to CPLEX calls. The committee size is large enough to provide a stable disagreement measure, while the number of trees and leaf constraints limit overfitting under the small-sample training regime. The resulting CRF is therefore designed to favor stable candidate ranking and informative disagreement estimates under limited exact-evaluation samples.

5.5.4. Progressive Active-Verification Strategy

The CRF surrogate provides a low-cost approximation of candidate quality, but a surrogate trained from a limited number of exact evaluations is not sufficiently reliable if it is used in a purely passive manner. In particular, selecting only the candidates with the lowest predicted objective values may repeatedly exploit a narrow region of the search space, reinforce early modeling bias, and provide little feedback for correcting uncertain or under-explored regions. Therefore, AL-VNS adopts a progressive active-verification strategy to determine which candidates should be sent to CPLEX for exact verification during the local search.
The strategy is based on four verification roles.
The exploit role selects candidates with the smallest predicted objective value mu(X), while the uncertainty role selects candidates with the largest committee disagreement sigma(X); both quantities are defined in Section 5.5.3.
In addition, the diversity role is introduced to encourage structural coverage of the training set. For a candidate solution X and the current training set D t , its diversity score is measured by its minimum normalized encoding distance to the previously evaluated solutions:
X , D t = min X m D t δ X , X m
δ X , X m = i I q i q i m + j J p j p j m I Q + J P
A larger X , D t indicates that the candidate is structurally farther from the existing CPLEX-evaluated samples and can therefore expand the surrogate training coverage.
Finally, the random role selects candidates uniformly from the candidate pool after removing those already selected by the other roles. This role provides a small amount of unbiased exploration and reduces the risk of repeatedly sampling only model-preferred regions.
Let B t denote the set of candidates selected for exact verification at iteration t. The selection rule can be summarized as B t = B t e x p B t u n c B t d i v B t r n d , where the four subsets correspond to exploit, uncertainty, diversity, and random verification, respectively. The exact number of candidates assigned to each role changes progressively as the learning process becomes more mature.
The verification stage is determined by two indicators: the maturity of the training set and the pressure caused by search stagnation. These indicators are defined as r D t = D t / M m i n , r N t = n n o i m p r o v e t / N n o i m p r o v e m a x , where M m i n is the minimum number of training samples required by the surrogate, n n o i m p r o v e t is the current number of consecutive non-improving iterations, and N_no-improve^max is the no-improvement limit. In the present implementation, M m i n = m a x ( 0 , 50 , c e i l ( 2 d ) ) .
In the early exploratory verification stage, the surrogate has limited training data and its ranking signal is still uncertain. AL-VNS therefore uses the schedule 3/1/1/1, meaning that three exploit candidates, one uncertainty candidate, one diversity candidate, and one random candidate are selected for CPLEX verification. This stage deliberately combines direct improvement pressure with uncertainty reduction, structural coverage, and unbiased exploration.
When the training set becomes more informative or the search begins to accumulate non-improving iterations, the algorithm enters the trust-building verification stage. The schedule is reduced to 2/1/0/0. At this point, the surrogate is trusted to provide a more useful ranking signal, but one uncertainty-driven verification is still retained to continue correcting regions where the committee members disagree. Diversity and random verifications are removed to save exact-evaluation budget.
In the mature exploitation-dominant verification stage, the schedule becomes 1/0/0/0. This stage concentrates the remaining exact-evaluation budget on the candidate that is most promising according to the surrogate ranking. The transition reflects that the model has either accumulated sufficient evaluated samples or the search is under stronger stagnation pressure, so further broad exploration is less valuable than targeted verification of the predicted best candidate.
The stage-switching rule is given by
  • 3/1/1/1, if r D t < 2.0 and r N t < 0.50
  • 2/1/0/0, if 2.0 r D t < 4.0 and 0.5 r N t < 0.75
  • 1/0/0/0, if r D t 4.0 or r N t 0.75 .
Thus, the active verification mechanism gradually shifts from exploration-oriented learning to exploitation-oriented verification. Rather than passively accepting the CRF ranking, it actively asks CPLEX to evaluate candidates that are promising, uncertain, structurally novel, or randomly sampled according to the current learning stage. The overall AL-VNS mechanism is illustrated in Figure 8.

6. Numerical Experiments

In this section, we evaluate the solution quality and execution efficiency of the two heuristic algorithms through numerical experiments and compare the performance of the commercial software CPLEX with our algorithms under different sizes of arithmetic cases. All experiments are performed on a Windows 10 computer with 16 GB of RAM and an i3-12100F processor. This study also compiles all codes using C# (VS2022) and solves the mixed integer programming model using CPLEX (version 12.7).

6.1. Parameter Settings

6.1.1. Cost Coefficients

Table 3 summarizes the cost coefficients used in the numerical experiments. We adopt a capacity-driven setup cost structure for temporary rescue stations and emergency medical facilities. Specifically, the setup cost of a temporary rescue station is proportional to its casualty-reception capacity, whereas the setup cost of an emergency medical facility is proportional to its bed capacity. This setting avoids assigning arbitrary fixed costs to individual candidate sites and ensures that the construction cost is consistent with the generated facility capacities.
The setup cost for temporary rescue stations is 4500 CNY per casualty-capacity unit. Temporary rescue stations mainly provide casualty aggregation, triage, short-term accommodation, basic first aid, and transfer organization. This setting follows the modeling logic of temporary medical center location studies, where setup costs and expected casualty transportation costs are jointly considered in disaster-response facility planning [25]. The setup cost of emergency medical facilities is set to 35,000 CNY per bed. This coefficient is calibrated with reference to the multi-level emergency medical facility setting in [23], in which primary and superior emergency medical facilities are distinguished according to their treatment functions. In this study, the emergency medical facility is treated as a hybrid facility with higher treatment capability than a temporary rescue station but lower construction intensity than a permanent hospital.
For casualty transfer, we use a distance-based cost coefficient rather than an explicit travel-time cost. The ambulance operating cost is set at 7 CNY per vehicle-kilometer, in accordance with the charging standard of the Beijing Emergency Medical Center [32]. To reflect differences in resource requirements by casualty type, each ambulance is assumed to carry six mild casualties, three moderate casualties, or one severe casualty. Dividing the vehicle-kilometer cost by these equivalent capacities yields type-specific transfer costs of 1.17, 2.33, and 7.00 CNY per person-kilometer for mild, moderate, and severe casualties, respectively.
The hospital-overload penalty is calibrated using official inpatient expenditure statistics. According to the 2024 Statistical Bulletin on Health Development in China released by the National Health Commission of China, the average inpatient expenditure in Chinese hospitals was 9870 CNY per patient [33]. We round this value to 10,000 CNY and use it as the baseline proxy for the hospital resources required to accommodate one excess casualty admitted beyond normal reception capacity. In the model, this penalty represents the additional system pressure associated with the occupation of medical resources, congestion, waiting, service-quality degradation, and reduced operational stability under hospital overload.
Because the resource configuration cost is substantially higher than the scenario-weighted system operating cost, a cost adjustment coefficient is introduced to reduce the scale imbalance between the two components. Based on preliminary computational experiments, it is set to 0.1 throughout the numerical analysis. This fixed coefficient is used only for cost scaling, whereas the relative preferences of decision makers are represented by and are examined separately in the sensitivity analysis.

6.1.2. Demand and Capacity Parameters

The baseline casualty rate is set to 1.2% to define a planning-oriented severe-disaster scenario. The setting is calibrated with reference to the documented casualty burden of the 2008 Wenchuan earthquake, a representative high-impact earthquake disaster. Official disaster statistics reported 69,227 deaths, 374,643 injuries, 17,923 missing persons, and more than 46 million people affected, indicating an aggregate casualty burden of nearly 1% across the affected region [34]. This aggregate burden represents a regional average, while casualty demand in core affected areas is shaped by concentrated population exposure, local vulnerability, building damage, and disaster intensity [35,36]. Therefore, a 1.2% baseline is used to generate high-stress emergency medical demand for the case study. Under this setting, the model evaluates emergency medical resource allocation decisions under a severe-disaster benchmark, while the casualty-rate parameter can be flexibly specified by planners according to managerial expectations and updated statistical evidence to represent different disaster scenarios [25].
Based on this casualty rate, each affected demand area is assumed to represent a baseline exposed population of 22,500 persons, corresponding to 270 casualties under the 1.2% baseline. To reflect spatial heterogeneity in population exposure, building vulnerability, and local disaster intensity, an exposure factor in [0.75, 1.25] is assigned to each affected area. Scenario-specific demand is then generated by multiplying the baseline casualties by a scenario scaling factor in [0.90, 1.15]. The generation rules for the demand and capacity parameters are summarized in Table 4.
The capacities of the three medical-resource nodes are generated from the demand baseline. Existing hospitals are assumed to cover 40% of the baseline casualty demand, reflecting that the regular hospital system cannot fully absorb disaster-induced medical demand. Temporary rescue-site capacities are scaled from the maximum scenario demand so that, if all candidate rescue sites are built at the largest scale, the system has sufficient first-stage reception and triage capacity. Emergency-medical-facility capacities are generated according to the gap between the maximum scenario demand and the normal capacity of existing hospitals. This design ensures potential feasibility under high-demand scenarios while retaining meaningful trade-offs among facility location, scale selection, hospital overload, and construction budget.

6.1.3. Scenario Settings

To represent the uncertainty faced by emergency medical systems under disaster-induced compound disruptions, we construct the scenario set using four post-disaster response dimensions: casualty severity, road-network disruption, response-access constraints, and hospital surge pressure. These dimensions jointly determine scenario-specific casualty demand and injury composition, transfer impedance, feasible rescue and transfer access, effective hospital capacity, and treatment capability.
Each uncertainty factor is classified into three levels: low, medium, and high. Therefore, the total number of compound-disaster scenarios is S   =   3   ×   3   ×   3   ×   3   =   81 . All numerical experiments in this study are conducted based on these 81 scenarios.
The four uncertainty factors are defined as follows. Casualty severity affects total casualty demand and the proportions of severe and moderate casualties. Road-network disruption increases transfer impedance and may worsen injury composition through delayed rescue. Response-access constraints capture operational restrictions on rescue entry and casualty transfer, such as emergency traffic controls, restricted-access zones, vehicle-entry requirements, and public-health measures [37]. Hospital surge pressure reduces the effective capacity for patient reception and treatment in existing hospitals.
Demand uncertainty is represented in two ways. First, the casualty demand at each affected area fluctuates across scenarios through a scenario-specific demand scaling factor. Second, the spatial distribution of demand is reflected by generating affected demand areas at different locations and assigning each area an exposure factor. In a given instance, the locations of demand areas are fixed across the 81 scenarios so that the effect of compound disaster conditions can be isolated; across different instances, however, the demand-area locations are regenerated to test the robustness of the algorithms under different spatial configurations.
The four disruption dimensions operate jointly within the same post-disaster model environment. For each scenario s, their realized levels collectively determine casualty demand and injury composition, transfer impedance, and the effective reception capacity and treatment capability of hospitals. These scenario-dependent parameters enter the same casualty-allocation, flow-conservation, treatment-compatibility, capacity, and hospital-overload constraints. Their combined effects are therefore transmitted through the shared casualty-transfer network and its scenario-adaptive recourse decisions.
This construction produces compound disruption scenarios with operationally coupled effects. For example, higher road-network disruption increases transfer impedance and adds pressure to the severe-casualty share. Reduced hospital capacity then changes downstream casualty allocation and the resulting overload amount. Response-access constraints simultaneously affect transfer conditions, injury composition, and the effective capacity of hospital services. Consequently, the operational outcome of each scenario is determined by the joint realization of all four dimensions within the same rescue network.
The parameter mapping in Table 5 links each disruption dimension to several parts of the recourse model. Casualty demand and injury composition determine the volume and treatment requirements of the transfer flow. Transfer impedance changes the operating cost of feasible movements, while hospital-capacity and capability factors determine downstream reception and treatment conditions. Their joint realization changes casualty routing, emergency-facility use, and hospital overload within each scenario.
Scenario probabilities are assigned at the joint-scenario level through a planning-oriented discrete prior. The marginal level weights place greater probability mass on low and moderate disruption levels while retaining high-level realizations in the scenario set. The four marginal probability vectors are reported in Table 6.
Each scenario encodes the realized level of every disruption dimension as an ordinal value in 0 , 1 , 2 . The corresponding marginal level weight is selected from Table 6. The base weight of a joint scenario is computed as
w s = d = 1 4 p d l d s
The aggregate risk score increases with the realized levels of the four disruption dimensions and is normalized to the interval 0 , 1 :
R s = l 1 s + l 2 s + l 3 s + l 4 s / 4 3 1
A risk-tilt coefficient is then applied to the base weight so that scenarios with higher combined disruption levels receive additional planning weight. The adjusted weights are normalized across all 81 scenarios:
x ~ s = w s 1 + ρ R s , x s = x ~ s / s S x ~ s
The risk-tilt coefficient is set to ρ   =   0.60 . The resulting normalized joint probability is used to weight the transfer cost and hospital-overload penalty in the expected second-stage operating cost.

6.2. Computational Performance of BVNS and AL-VNS

Table 7 and Table 8 report the results for the small-scale instances. Four instance groups, denoted by As1–As4, were generated by gradually increasing the numbers of candidate temporary rescue sites, candidate emergency medical facilities, affected demand areas, and existing hospitals. These instances were designed to validate the correctness of the proposed two-stage formulation and to calibrate the solution quality of the heuristic algorithms against the CPLEX benchmark. For each heuristic algorithm, five independent runs were conducted, and the reported objective values and computational times are the averages over these runs. The coefficient of variation (CV) is used to measure the stability of the objective values across repeated runs.
The results indicate that both BVNS and AL-VNS can obtain solutions very close to those of CPLEX in small-scale cases. Across all instance groups, the average gaps of BVNS and AL-VNS remain very small, with most cases reaching the same objective value as CPLEX or differing only marginally. The low CV values further show that the two heuristic algorithms are stable across repeated runs. These findings confirm that, for small-scale instances where CPLEX can provide reliable benchmark solutions, both BVNS and AL-VNS achieve comparable solution quality, thereby validating the effectiveness of the proposed heuristic framework before it is further tested on larger instances.
Table 9 and Table 10 report the results for the medium-scale instances. Compared with the small-scale cases, the numbers of candidate temporary rescue sites, candidate emergency medical facilities, affected demand areas, and existing hospitals are further increased in Bs1–Bs3. These instances are used to examine whether the proposed BVNS and AL-VNS algorithms can maintain near-optimal solution quality when the problem size becomes larger, while CPLEX is still able to provide benchmark solutions.
The results show that both BVNS and AL-VNS remain close to the CPLEX solutions in all medium-scale cases. The average gaps of BVNS are 0.21%, 0.24%, and 0.28% for Bs1–Bs3, respectively, while those of AL-VNS are 0.35%, 0.36%, and 0.34%. These small deviations indicate that the two heuristic algorithms can preserve high solution quality as the instance size increases. Meanwhile, the computational advantage of AL-VNS becomes more evident: its average running time is 280.99 s, compared with 507.12 s for BVNS and 761.47 s for CPLEX. This suggests that AL-VNS achieves a favorable trade-off between solution quality and computational efficiency in medium-scale instances.
Table 11 and Table 12 report the results for the large-scale instances. Since CPLEX does not return a usable benchmark solution within the 7200 s time limit, the comparison focuses on BVNS and AL-VNS. To obtain a more stable heuristic comparison, each large-scale instance is solved three independent times by both algorithms, and the reported objective values and running times are averaged over the three runs. For AL-VNS, the standard deviation of the objective value and the average number of exact evaluations are also reported. The results show that AL-VNS substantially reduces computational time while maintaining objective values very close to those of BVNS. On average, AL-VNS reduces the running time by 63.73%, 34.71%, and 42.72% for Cs1, Cs2, and Cs3, respectively. The corresponding average objective-value differences relative to BVNS are only 0.12%, 0.09%, and 0.01%, indicating that AL-VNS greatly improves computational efficiency without materially sacrificing solution quality.
At the instance level, the results also demonstrate the search-guidance capability of the active-learning mechanism. AL-VNS obtains slightly better objective values than BVNS for Cs3-1 and Cs3-2, with gaps of −0.05% and −0.09%, respectively. Although these improvements are modest, they indicate that the learned screening mechanism can identify promising candidate configurations while reducing computational time. Across the three instance groups, AL-VNS requires an average of 194.55, 235.89, and 220.89 exact evaluations, respectively, corresponding to approximately 217 exact evaluations overall and roughly one exact evaluation per iteration. With this evaluation effort, AL-VNS achieves objective values that are nearly identical to those of BVNS. These results show that active learning supports both computational efficiency and effective candidate selection in the solution process.
The computational performance of AL-VNS can be explained by the division of roles between the committee random forest (CRF) surrogate and the progressive active-verification schedule. The CRF learns a low-cost approximation of the relationship between first-stage resource configurations and their exactly evaluated objective values. Its committee mean ranks candidates by predicted solution quality, while committee disagreement identifies candidates in insufficiently learned regions. The active-verification schedule combines these signals with structural diversity and random exploration, and progressively shifts from broader sampling to exploitation as the search proceeds. Consequently, only selected candidates are submitted to CPLEX for exact evaluation, which reduces the main computational burden of the BVNS framework. Across the large-scale instance groups, AL-VNS requires approximately 217 exact evaluations per instance on average while obtaining objective values nearly identical to those of BVNS. The near-zero average gaps, together with the slightly better results for Cs3-1 and Cs3-2, indicate that the progressively updated surrogate provides useful adaptive guidance while reducing the number of expensive exact evaluations.

6.3. Case Study: Emergency Medical Resource Allocation in Ya’an, Sichuan

To evaluate the applicability of the proposed model and algorithm in a realistic regional setting, we conduct a simulation-based case study in Ya’an, Sichuan Province, China. The case integrates regional population distribution, affected-area locations, candidate temporary rescue sites, candidate emergency medical facilities, existing hospitals, and road-network distances. Based on these data, we simulate emergency medical resource configuration under disaster-induced compound disruption scenarios involving casualty severity, road-network disruption, response-access constraints, and hospital surge pressure. Compared with synthetic numerical instances, this case study provides a more realistic setting for examining how the proposed framework balances facility activation costs, casualty-transfer costs, and hospital-overload risks, and how heterogeneous emergency medical resources contribute to system resilience amid compound post-disaster disruptions. The schematic diagram is shown in Figure 9.
Candidate locations for temporary rescue sites and emergency medical facilities were screened from public-facility and point-of-interest information in the regional map and Amap data. The candidate pool included schools, stadiums, public squares, and other public facilities with usable open space and road access. The screening considered spatial coverage of the affected areas, road accessibility, connectivity to existing hospitals, and the availability of space for temporary medical operations. Based on these criteria, 13 candidate locations were retained for temporary rescue sites and 13 for emergency medical facilities. Their opening decisions and capacity levels are subsequently determined by the optimization model. The composition of the Ya’an case-study instance is summarized in Table 13.
The Ya’an case study follows the solution procedure summarized in Algorithm 4. First, the regional population, road network, candidate rescue sites, candidate emergency medical facilities, and existing hospitals are converted into the model sets and parameters. Second, the 81 compound disruption scenarios and their scenario-dependent parameters are generated as described in Section 6.1.3. Third, the initial configurations are constructed and exactly evaluated to initialize the CRF training set. AL-VNS then searches the facility-location and capacity decisions, while CPLEX evaluates the selected configurations and determines their scenario-dependent casualty-transfer and hospital-overload decisions. Finally, the best exactly evaluated configuration is used for the case analysis and subsequent sensitivity experiments.
Algorithm 4: Overall AL-VNS solution procedure
Input: Network sets H, I, J, and K; Casualty types A and capacity levels P and Q; Compound disruption scenarios S; Model and algorithm parameters.
Output: Best first-stage configuration X*, exact objective value F(X*) and scenario-dependent casualty-transfer and hospital-overload decisions.
Systems 14 00922 i004
The case-study parameters were constructed using real-world spatial, demographic, and medical-resource data. Node locations and road-network distances were obtained from the Ya’an regional map and the Amap API. Population data were derived from the Seventh National Population Census, while the existing hospitals were selected from major medical institutions in the study area based on publicly available bed-capacity information. The detailed settings of affected-area demand, hospital capacity and treatment capability, and candidate facility capacities are reported in Table 14, Table 15 and Table 16.
In realistic emergency response, casualty demand is spatially uneven because the population is concentrated in urban areas while peripheral towns may suffer from longer transfer distances. Although existing hospitals can theoretically admit additional casualties under overload conditions, such a strategy may lead to excessive transfer costs, congestion, treatment delays, and high overload penalties. Therefore, the case study focuses on the trade-off among facility activation costs, casualty-transfer costs, and hospital-overload risks. This reflects the practical importance of rationally configuring temporary rescue sites and emergency medical facilities under compound disruption scenarios. The resulting Ya’an instance is solved using the AL-VNS procedure presented in Section 5 and Figure 8. The main AL-VNS results for the Ya’an case study are summarized in Table 17. The corresponding facility-opening scheme is reported in Table 18.
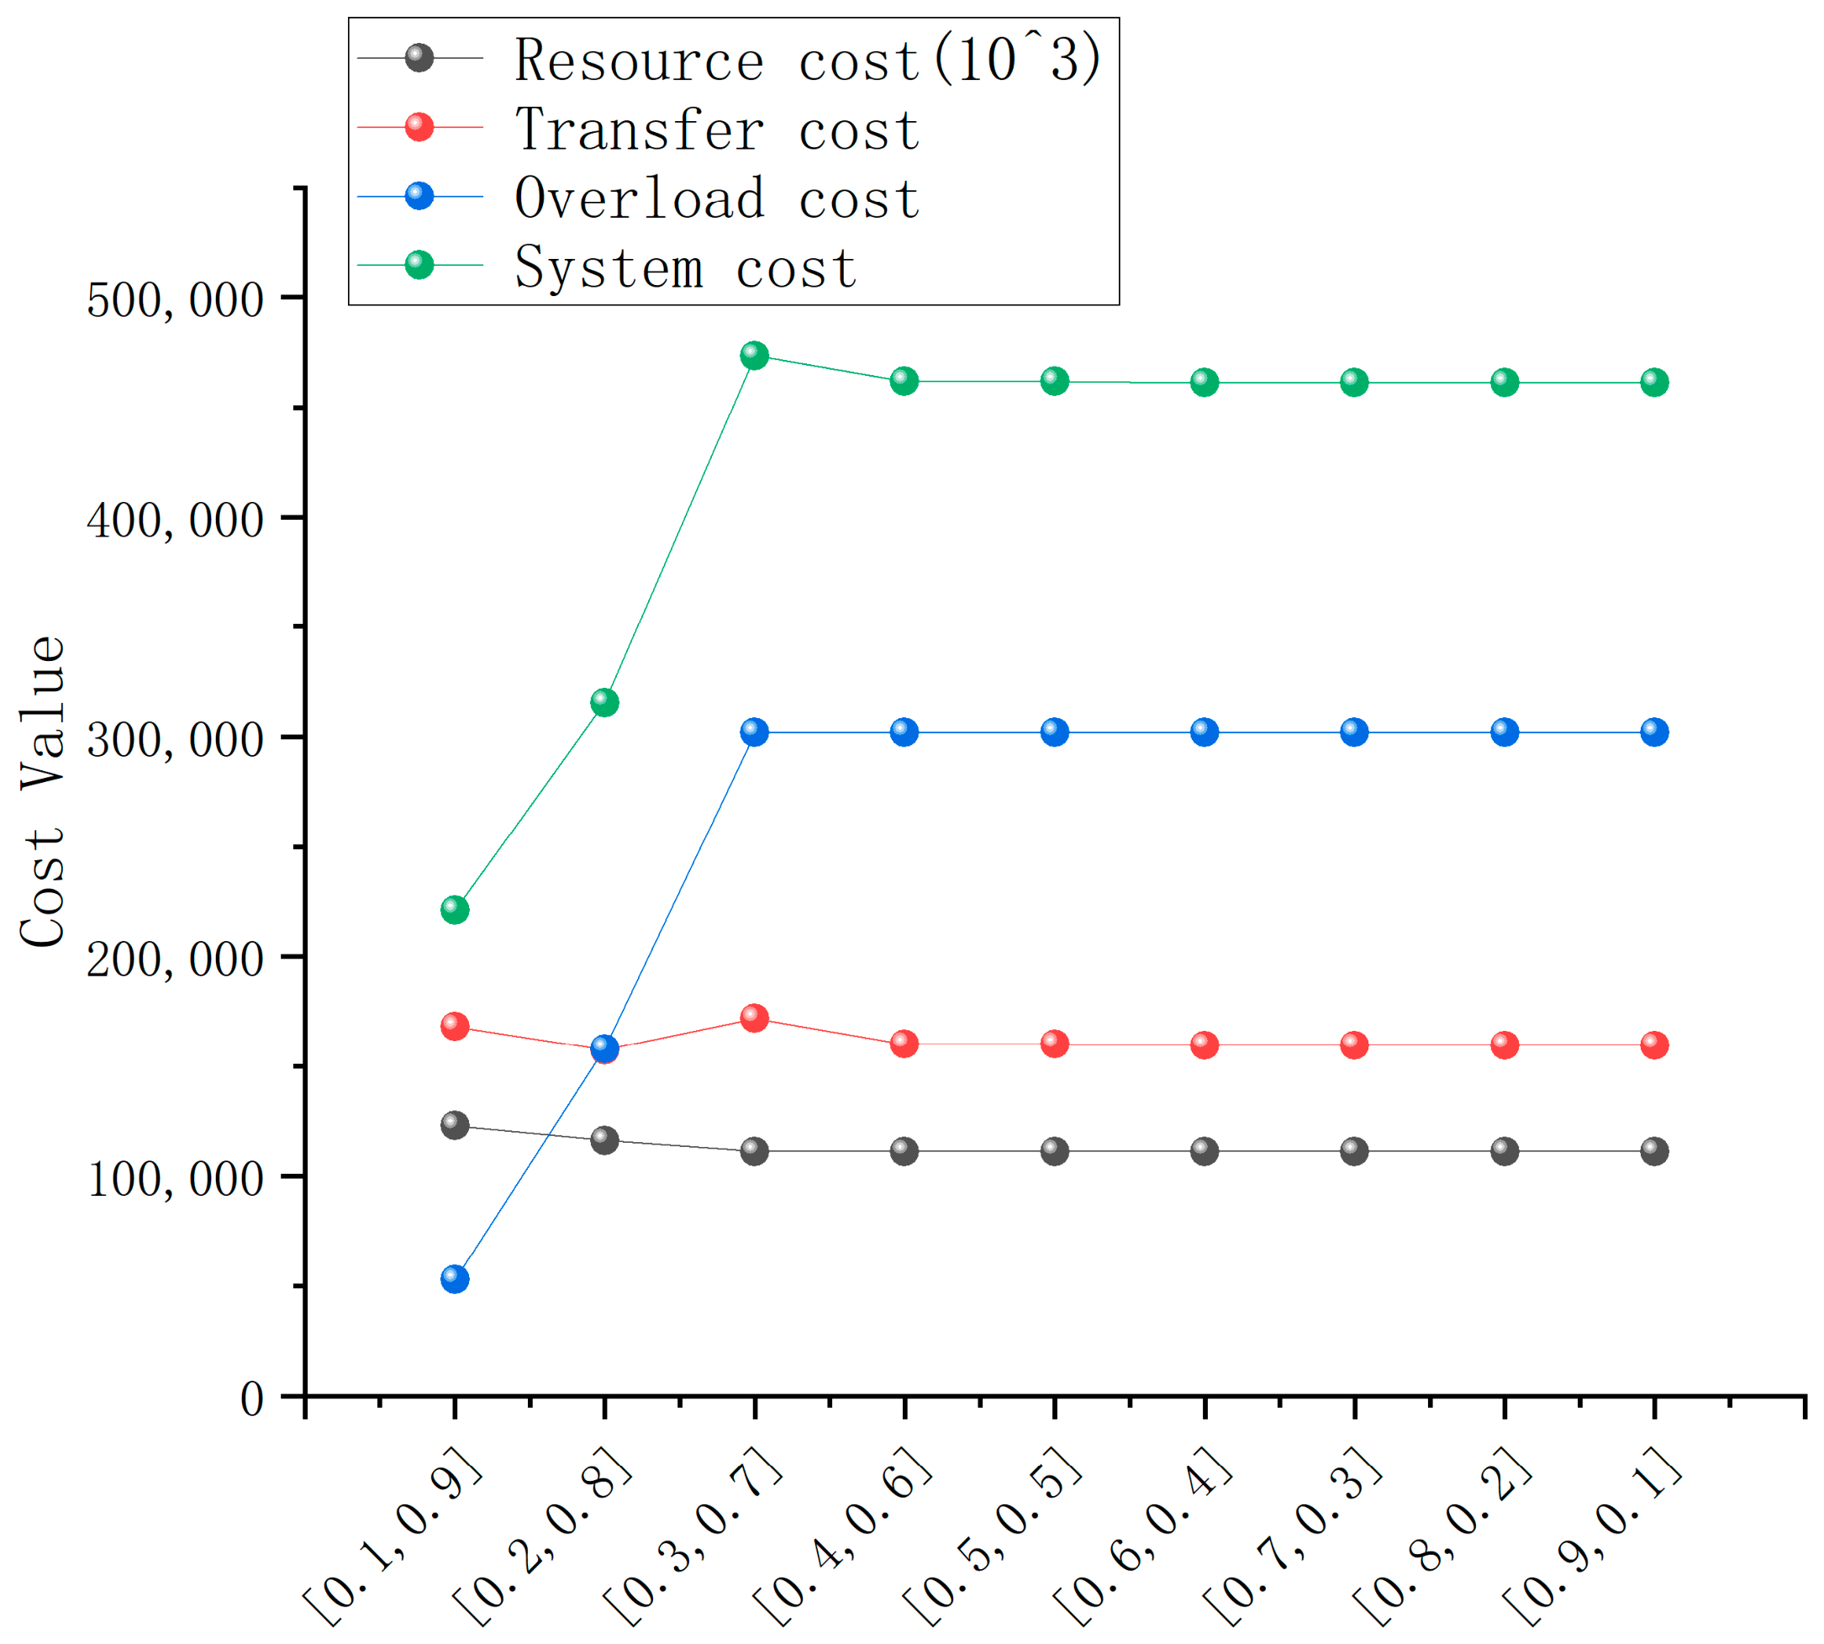
The solution opens all 13 temporary rescue sites, with one small, two medium, and ten large sites, providing a total rescue capacity of 4692. For emergency medical facilities, 10 out of 13 candidates are opened, providing 2576 beds, while J1, J3, and J4 remain closed. This deployment reflects a trade-off between expanding temporary response capacity and selectively constructing high-cost emergency medical facilities.

6.4. Sensitivity Analysis on Decision-Maker Preferences

Building on the Ya’an case study, we further examine how decision-maker preferences affect cost performance and facility deployment strategies. In the objective function, λ R and λ S represent the relative weights assigned to resource construction cost and system operating cost, respectively, with λ R + λ S = 1 . The setting λ R , λ S = 0.5 , 0.5 represents a balanced preference, while 0.1 , 0.9 reflects a stronger emphasis on system operating performance, allowing more resource investment to reduce transfer and hospital overload costs. Conversely, 0.9 , 0.1 reflects a stronger emphasis on controlling construction investment, allowing relatively higher operating costs. Based on this setting, nine preference combinations are tested, as listed in Table 19, and the resulting cost components and emergency medical facility deployment decisions are reported in Table 20. The corresponding changes in the cost components across the nine preference settings are illustrated in Figure 10.
The sensitivity analysis further reveals different responses of temporary rescue sites and emergency medical facilities in the Ya’an case. Temporary rescue sites exhibit a clear structural-locking pattern across the tested preference settings. All candidate temporary rescue sites remain open, although their capacity levels vary slightly. This pattern reflects the combined influence of the spatial distribution of affected areas, road accessibility, basic coverage requirements, and the predefined candidate locations. Consequently, the backbone of the temporary rescue network remains largely stable across the examined preference settings.
By contrast, emergency medical facilities show a stronger substitution relationship with the existing hospital system in the Ya’an case. When greater weight is assigned to system operating performance, the model tends to open more emergency medical facilities or select higher capacity levels, thereby reducing hospital overload. When greater weight is assigned to resource construction cost, the model relies more on the existing hospital network and reduces marginal emergency medical deployment. Within the tested settings, decision-maker preferences therefore do not substantially reshape the main network structure. Instead, they primarily affect the marginal allocation of high-cost emergency medical facilities.
These results indicate that, in the Ya’an case, greater resource investment does not necessarily lead to a completely different network structure. Suitable candidate locations in the study area are constrained by existing infrastructure, including schools, stadiums, squares, and medical nodes. The key locations therefore remain structurally stable across the tested preference settings, while subsequent adjustments mainly concern whether additional emergency medical facilities should be opened or expanded. The structural-locking pattern observed in this case provides a useful planning insight for decision makers: spatial accessibility and capacity coverage requirements shape the basic network structure, whereas decision-maker preferences regulate the marginal trade-off between system operating efficiency and construction cost.

6.5. Sensitivity Analysis of the Hospital-Overload-Penalty Multiplier

The hospital-overload penalty is calibrated as a proxy for the resource burden and service pressure generated by excess casualties beyond normal hospital reception capacity. To examine how different assumptions about overload pressure affect emergency medical resource configuration, we introduce an overload-penalty multiplier η . The baseline penalty is 10,000 CNY per overloaded casualty, and the adjusted penalty is defined as C o v e r η = η × 10000 . Five multiplier levels are tested, namely η = 0.50 , 0.75 , 1.00 , 1.25 , 1.50 , representing lower, baseline, and higher hospital-pressure assumptions. Based on the Ya’an case and its real road-network structure, this sensitivity analysis examines how the emergency medical rescue network adjusts facility deployment, capacity configuration, casualty transfer, and hospital-overload mitigation under different overload-pressure settings. The resulting changes in facility deployment, capacity configuration, transfer cost, and hospital overload are reported in Table 21.
The sensitivity analysis shows that the main rescue-network configuration is robust to the calibration of the hospital-overload penalty. Temporary rescue sites remain almost fully activated across all penalty levels, indicating a stable triage-and-transfer backbone. Emergency medical facilities adjust more at the margin, reflecting their role as flexible surge-capacity resources. Although the overload penalty cost increases as the multiplier rises, the adjusted objective value and resource configuration remain relatively stable. This suggests that the main managerial conclusions are not driven by a single overload-penalty calibration.

7. Managerial, Policy, and Practical Implications

From a managerial perspective, the results suggest that emergency medical resources can be planned by distinguishing between relatively stable network-backbone decisions and flexible surge-capacity decisions. In the Ya’an case, temporary rescue sites remain nearly fully activated across the tested preference and hospital-pressure settings, reflecting their role in maintaining spatial coverage, casualty aggregation, triage, and transfer coordination. Emergency medical facilities respond more strongly to changes in investment preferences and hospital-overload pressure. Regional emergency managers can therefore prioritize the spatial coverage and basic capacity of temporary rescue sites during preparedness planning, while retaining greater flexibility in the activation and capacity expansion of emergency medical facilities. The preference parameters can also be used to generate alternative plans that balance construction expenditure, transfer efficiency, and hospital-pressure mitigation.
From a policy perspective, the observed network pattern highlights the value of pre-designating suitable public facilities as potential emergency medical nodes. Schools, stadiums, public squares, and other accessible public facilities can be screened in advance according to spatial coverage, road connectivity, available space, and links to existing hospitals. Regional preparedness policies can establish graded capacity options and activation conditions for these candidate sites, allowing temporary rescue and supplementary treatment resources to be deployed based on the actual level of disruption. Coordination mechanisms among health authorities, transport agencies, hospitals, and local governments are also important because road accessibility, response-access restrictions, and hospital reception pressure jointly influence casualty-transfer feasibility.
From a practical implementation perspective, the proposed framework can be recalibrated using regional population, road network, hospital-capacity, and candidate facility data. Scenario-level parameters and probabilities can be updated based on local statistics, expert assessments, and the disaster conditions planners consider. Sensitivity analysis using decision-preference weights and hospital-overload multipliers can then produce a portfolio of configuration plans for different investment and service-pressure assumptions. For larger regional instances, AL-VNS provides a computationally efficient planning tool by concentrating exact CPLEX evaluations on selected candidate configurations, while retaining exact verification of all accepted and reported solutions. This supports periodic preparedness assessment and time-constrained plan updating without changing the underlying optimization standard.

8. Conclusions

This study investigates the resilience-oriented configuration of emergency medical resources under disaster-induced compound disruptions. The proposed framework integrates the location and capacity decisions of temporary rescue sites and emergency medical facilities with scenario-adaptive casualty transfer and hospital-overload management. By jointly considering casualty demand and injury composition, road-network disruption, response-access constraints, and hospital surge pressure, the framework supports pre-disaster resource preparedness and post-disaster absorption and adaptation within a unified location–capacity–transfer system.
First, this study develops a resilience-oriented emergency medical resource configuration framework under compound disruptions. In the preparedness stage, the model determines the locations and capacity levels of temporary rescue sites and emergency medical facilities. After a disruption scenario is realized, it reallocates casualties among temporary rescue sites, emergency medical facilities, and existing hospitals according to the realized demand, accessibility, treatment, and capacity conditions. The four disruption dimensions are represented at low, medium, and high levels, forming 81 compound scenarios with planning-oriented probability weights. Within each scenario, these dimensions jointly modify casualty demand and injury composition, transfer impedance, and effective hospital reception and treatment capacity. Their effects are transmitted through the common allocation, flow-conservation, treatment-compatibility, capacity, and hospital overload constraints. Configuration resilience is therefore reflected in the joint effects of pre-disaster capacity configuration and scenario-adaptive network operations.
Second, this study develops a problem-oriented small-sample active-learning-assisted VNS algorithm to reduce the computational burden of scenario-based configuration evaluation. AL-VNS combines a committee random forest surrogate with a progressive active-verification schedule to select promising, uncertain, diverse, and exploratory candidates for exact CPLEX evaluation. All accepted and reported solutions remain exactly evaluated. The small- and medium-scale experiments show that BVNS and AL-VNS obtain solutions close to the CPLEX benchmark, with average optimality gaps below 0.5%. For the large-scale instances, BVNS and AL-VNS were each independently run three times. AL-VNS reduces the average running time by 63.73%, 34.71%, and 42.72% for the Cs1, Cs2, and Cs3 instance groups, respectively, while the corresponding average objective-value differences relative to BVNS are 0.12%, 0.09%, and 0.01%. AL-VNS requires approximately 217 exact evaluations per large-scale instance. These results show that the surrogate-and-active-verification mechanism can reduce the cost of expensive exact evaluations while maintaining solution quality comparable to that of the full-evaluation BVNS.
Third, the Ya’an case study examines the differentiated roles of heterogeneous emergency medical resources in a regional planning setting. Within the tested preference and hospital-pressure settings, temporary rescue sites remain largely stable and form the spatial backbone for casualty aggregation, triage, and transfer coordination. Emergency medical facilities respond more strongly to changes in investment preferences and hospital-overload pressure, providing flexible surge capacity that can substitute for part of the reception burden of existing hospitals. The sensitivity analyses further show that the main network configuration remains relatively stable across different decision preferences and overload-penalty levels, while marginal adjustments are concentrated in the activation and capacity selection of emergency medical facilities. These results provide the empirical basis for the managerial, policy, and practical implications presented in Section 7.
This study also has several limitations that suggest directions for future research. The case study uses aggregated demand areas and scenario-based road impedance rather than real-time traffic and damage information. Future research may incorporate dynamic disaster evolution, real-time road-network updates, multi-period resource relocation, and richer empirical data on hospital surge capacity. More advanced learning-enhanced optimization methods may also be explored to further improve solution quality and computational efficiency for large-scale emergency medical resource allocation problems.

Author Contributions

B.W.: Conceptualization, Data Curation, Funding Acquisition, Writing—Original Draft Preparation, Supervision. Y.G.: Validation, Software, Methodology, Writing—Reviewing and Editing. C.H.: Visualization, Investigation, Validation, Writing—Reviewing and Editing. All authors have read and agreed to the published version of the manuscript.

Funding

This research was supported by the National Social Science Fund of China (CN) under Grant 24BGL285.

Institutional Review Board Statement

Not applicable.

Informed Consent Statement

Not applicable.

Data Availability Statement

Data will be made available on request.

Conflicts of Interest

The authors declare that they have no known competing financial interests or personal relationships that could have appeared to influence the work reported in this paper.

Abbreviations

The following abbreviations are used in this manuscript:
AL-VNSActive-learning-assisted variable neighborhood search
BVNSBaseline variable neighborhood search
VNSVariable neighborhood search
VNDVariable neighborhood descent
CRFCommittee random forest
RFRandom forest
CPLEXIBM ILOG CPLEX Optimization Studio
MILPMixed-integer linear programming
MIPMixed-integer programming
CVCoefficient of variation
CNYChinese yuan
APIApplication programming interface
UNDPUnited Nations Development Program
XGBExtreme gradient boosting
ELMExtreme learning machine
GPRGaussian process regression

References

  1. Ceferino, L.; Mitrani-Reiser, J.; Kiremidjian, A.; Deierlein, G.; Bambarén, C. Effective plans for hospital system response to earthquake emergencies. Nat. Commun. 2020, 11, 4325. [Google Scholar] [CrossRef] [PubMed]
  2. Imatani, A.; Ohashi, K.; Ogasawara, K. Comparison of Emergency Transport Times Affected by Road Closures under Normal Conditions and During an Earthquake Disaster. Disaster Med. Public Health Prep. 2025, 19, e214. [Google Scholar] [CrossRef] [PubMed]
  3. Oksuz, M.K.; Satoglu, S.I. Integrated optimization of facility location, casualty allocation and medical staff planning for post-disaster emergency response. J. Humanit. Logist. Supply Chain Manag. 2024, 14, 285–303. [Google Scholar]
  4. Tippong, D.; Petrovic, S.; Akbari, V. A review of applications of operational research in healthcare coordination in disaster management. Eur. J. Oper. Res. 2022, 301, 1–17. [Google Scholar] [CrossRef] [PubMed]
  5. Wang, W.; Wu, Y.; Yang, C.; Zhang, D.; Liu, Y.; Hu, X.; Li, S.; Chen, J.; Zhao, Q.; Zhou, L.; et al. Emergency facility location problems in logistics: Status and perspectives. Transp. Res. Part E Logist. Transp. Rev. 2021, 154, 102465. [Google Scholar] [CrossRef]
  6. Yang, Y.; Yin, Y.; Wang, D.; Liu, Y.; Chen, X.; Zhang, J.; Li, M.; Zhao, S.; Wu, H.; Sun, P.; et al. Distributionally robust multi-period location-allocation with multiple resources and capacity levels in humanitarian logistics. Eur. J. Oper. Res. 2023, 305, 1042–1062. [Google Scholar] [CrossRef]
  7. Chen, Y.; Li, X.; Wang, H.; Zhang, Z.; Liu, F.; Yang, J.; Wu, T.; Huang, Q.; Zhou, R.; Xu, M.; et al. Preference disaggregation-based multiclass Mahalanobis-Taguchi system applied to medical insurance fraud. Eng. Appl. Artif. Intell. 2026, 167, 113934. [Google Scholar] [CrossRef]
  8. Boonmee, C.; Arimura, M.; Asada, T. Facility location optimization model for emergency humanitarian logistics. Int. J. Disaster Risk Reduct. 2017, 24, 485–498. [Google Scholar] [CrossRef]
  9. Sun, H.; Wang, Y.; Xue, Y. A bi-objective robust optimization model for disaster response planning under uncertainties. Comput. Ind. Eng. 2021, 155, 107213. [Google Scholar] [CrossRef]
  10. Dukkanci, O.; Koberstein, A.; Kara, B.Y. Drones for relief logistics under uncertainty after an earthquake. Eur. J. Oper. Res. 2023, 310, 117–132. [Google Scholar] [CrossRef]
  11. Tarhan, İ.; Koc, U.; Kaya, O.; Yildiz, B.; Demir, E.; Akkaya, G.; Sahin, M.; Karabulut, A.; Uysal, S.; Ozturk, C.; et al. A quadrant shrinking heuristic for solving the dynamic multi-objective disaster response personnel routing and scheduling problem. Eur. J. Oper. Res. 2024, 314, 776–791. [Google Scholar] [CrossRef]
  12. Sun, H.; Li, Y.; Zhang, J. Collaboration-based reliable optimal casualty evacuation network design for large-scale emergency preparedness. Socio-Econ. Plan. Sci. 2022, 81, 101192. [Google Scholar] [CrossRef]
  13. Wang, D.; Yang, Y.; Yin, Y.; Liu, J.; Chen, Z.; Li, Q.; Zhang, H.; Wu, F.; Zhao, T.; Sun, R.; et al. Distributionally robust location-allocation with demand and facility disruption uncertainties in emergency logistics. Comput. Ind. Eng. 2023, 184, 109617. [Google Scholar] [CrossRef]
  14. Jiang, J.; Chen, X.; Wang, L.; Zhang, Y.; Li, H.; Liu, S.; Yang, D.; Wu, P.; Huang, Y.; Zhou, G.; et al. Data-driven collaborative healthcare resource allocation in pandemics. Transp. Res. Part E Logist. Transp. Rev. 2024, 192, 103828. [Google Scholar] [CrossRef]
  15. Rodríguez-Espíndola, O. Two-stage stochastic formulation for relief operations with multiple agencies in simultaneous disasters. OR Spectr. 2023, 45, 477. [Google Scholar] [CrossRef] [PubMed]
  16. Ahmadi-Javid, A.; Seyedi, P.; Syam, S.S. A survey of healthcare facility location. Comput. Oper. Res. 2017, 79, 223–263. [Google Scholar] [CrossRef]
  17. Salman, F.S.; Gül, S. Deployment of field hospitals in mass casualty incidents. Comput. Ind. Eng. 2014, 74, 37–51. [Google Scholar] [CrossRef]
  18. Fattahi, M.; Keyvanshokooh, E.; Pishvaee, M.S.; Tavakkoli-Moghaddam, R. Resource planning strategies for healthcare systems during a pandemic. Eur. J. Oper. Res. 2023, 304, 192–206. [Google Scholar] [CrossRef] [PubMed]
  19. Barbato, M.; Ceselli, A.; Premoli, M. On the impact of resource relocation in facing health emergencies. Eur. J. Oper. Res. 2023, 308, 422–435. [Google Scholar] [CrossRef] [PubMed]
  20. Wang, H.; Ma, Y.; Li, S.; Liu, T.; Zhao, X.; Chen, G.; Huang, J.; Yang, B.; Zhang, K.; Wu, D.; et al. A joint model of location, inventory and third-party logistics provider in supply chain network design. Comput. Ind. Eng. 2022, 174, 108809. [Google Scholar] [CrossRef]
  21. Zheng, S.; Ge, Y.; Fu, X.; Nie, Y.; Wang, L.; Chen, J.; Zhang, Q.; Hu, M.; Lin, C.; Peng, W.; et al. Seaport adaptation to climate change disasters: Subsidy policy vs. adaptation sharing under minimum requirement. Transp. Res. Part E Logist. Transp. Rev. 2021, 155, 102488. [Google Scholar] [CrossRef]
  22. Jahani, H.; Abbasi, B.; Hosseinifard, Z.; Fahimnia, B.; Pournader, M. COVID-19 vaccine distribution planning using a congested queuing system—A real case from Australia. Transp. Res. Part E Logist. Transp. Rev. 2022, 163, 102749. [Google Scholar] [CrossRef] [PubMed]
  23. Liu, H.; Zhang, Y.; Wang, Q.; Li, X.; Chen, S.; Zhao, J.; Wu, R.; Huang, P.; Sun, L.; He, C.; et al. Integrated Emergency Medical Facility Location and Patient Dispatching Under Uncertainty. IEEE Trans. Intell. Transp. Syst. 2025; in press. [CrossRef]
  24. Yin, Y.; Yang, Y.; Wang, D.; Liu, X.; Zhang, L.; Chen, J.; Li, H.; Zhao, Q.; Wu, S.; Sun, M.; et al. Two-stage recoverable robust optimization for an integrated location–allocation and evacuation planning problem. Transp. Res. Part B Methodol. 2024, 182, 102906. [Google Scholar] [CrossRef]
  25. Oksuz, M.K.; Satoglu, S.I. A two-stage stochastic model for location planning of temporary medical centers for disaster response. Int. J. Disaster Risk Reduct. 2020, 44, 101426. [Google Scholar] [CrossRef]
  26. Marler, R.T.; Arora, J.S. The weighted sum method for multi-objective optimization: New insights. Struct. Multidiscip. Optim. 2010, 41, 853–862. [Google Scholar] [CrossRef]
  27. Hansen, P.; Mladenović, N.; Moreno Perez, J.A. Variable neighbourhood search: Methods and applications. Ann. Oper. Res. 2010, 175, 367–407. [Google Scholar] [CrossRef]
  28. Sulaman, M.; Ahmadi, R.; Ebadi, T.; Khosravi, A.; Nabavi, S.; Ghorbani, M.; Hosseini, S.; Moradi, P.; Rezaei, F.; Amini, H.; et al. Surrogate-assisted metaheuristics for the facility location problem with distributed demands on network edges. Comput. Ind. Eng. 2024, 188, 109931. [Google Scholar] [CrossRef]
  29. Xiang, X.; Wang, Z.; Chen, Y.; Liu, H.; Zhang, J.; Li, P.; Wu, Q.; Yang, S.; Xu, T.; Huang, C.; et al. A clustering-based surrogate-assisted multiobjective evolutionary algorithm for shelter location problem under uncertainty of road networks. IEEE Trans. Ind. Inform. 2019, 16, 7544–7555. [Google Scholar] [CrossRef]
  30. Breiman, L. Random forests. Mach. Learn. 2001, 45, 5–32. [Google Scholar] [CrossRef]
  31. Wang, H.; Jin, Y.; Doherty, J. Committee-based active learning for surrogate-assisted particle swarm optimization of expensive problems. IEEE Trans. Cybern. 2017, 47, 2664–2677. [Google Scholar] [CrossRef] [PubMed]
  32. Beijing Emergency Medical Center. Medical Service Price Schedule 2025. Available online: https://www.120beijing.cn/channel/185 (accessed on 9 July 2026).
  33. National Health Commission of the People’s Republic of China. 2024 Statistical Bulletin on Health Development in China; Health Commission of the People’s Republic of China: Beijing, China, 2024. Available online: https://www.nhc.gov.cn/guihuaxxs/c100133/202512/f1c3a3c617484a27a1a26a468afbaeee.shtml (accessed on 9 July 2026).
  34. Fan, X.; Scaringi, G.; Xu, Q.; Zhan, W.; Dai, L.; Li, Y.; Pei, X.; Yang, Q.; Huang, R.; Zhang, J.; et al. What we have learned from the 2008 Wenchuan Earthquake and its aftermath: A decade of research and challenges. Eng. Geol. 2018, 241, 25–32. [Google Scholar] [CrossRef]
  35. Earle, P.S.; Wald, D.J.; Jaiswal, K.S.; Allen, T.I.; Hearne, M.G.; Marano, K.D.; Hotovec, A.J.; Fee, J. Prompt Assessment of Global Earthquakes for Response (PAGER): A System for Rapidly Determining the Impact of Earthquakes Worldwide; U.S. Geological Survey Open-File Report 2009-1131; U.S. Geological Survey: Reston, VA, USA, 2009. [CrossRef]
  36. Spence, R.; So, E.; Scawthorn, C. (Eds.) Human Casualties in Earthquakes: Progress in Modelling and Mitigation; Springer: Dordrecht, The Netherlands, 2011. [Google Scholar]
  37. Bi, H.; Xu, J.; Wang, Y.; Liu, Z.; Zhang, L.; Chen, W.; Yang, H.; Wu, T.; Li, Q.; Zhao, X.; et al. An incentive based road traffic control mechanism for COVID-19 pandemic alike emergency preparedness and response. IEEE Trans. Intell. Transp. Syst. 2022, 23, 25092–25105. [Google Scholar] [CrossRef]
Figure 1. Schematic spatial distribution of network nodes in the Ya’an area.
Systems 14 00922 g001
Figure 2. Network between affected areas, temporary emergency relief stations, emergency relief facilities, and hospitals.
Systems 14 00922 g002
Figure 3. Initial solution representation.
Systems 14 00922 g003
Figure 4. Neighborhood structure 1: swap. The red dashed boxes indicate the two selected entries exchanged during the operation.
Systems 14 00922 g004
Figure 5. Neighborhood structure 2: increase. The red dashed boxes indicate the selected entry whose capacity level is increased.
Systems 14 00922 g005
Figure 6. Neighborhood structure 3: decrease. The red dashed boxes indicate the selected entry whose capacity level is decreased.
Systems 14 00922 g006
Figure 7. Illustration of capacity-intensity-preserving reallocation during shaking. The red dashed boxes delimit the R and E configuration sequences that are independently shuffled while preserving their respective total capacity intensities.
Systems 14 00922 g007
Figure 8. Workflow of the active-learning-assisted local search.
Systems 14 00922 g008
Figure 9. Final facility configuration for the Ya’an case study. Panel (a) shows the full study area, while panels (b) and (c) enlarge the dense Yucheng and Mingshan clusters, respectively. Only facilities opened in the final AL-VNS solution are displayed. Co-located temporary rescue sites and emergency medical facilities are shown as paired I/J markers.
Systems 14 00922 g009
Figure 10. Cost sensitivity under different decision-maker preferences.
Systems 14 00922 g010
Table 1. Algorithmic parameter settings of BVNS and AL-VNS.
ParametersBVNSAl-VNS
Initial solution setting
Initial candidates2020
Exact-reviewed candidates88
Structure Parameters
Maximum iterations200200
No-improvement limit5050
VND Parameters
Neighborhood set N 1 ,   N 2 ,   N 3 N 1 ,   N 2 ,   N 3
VND order N 1 N 2 N 3 N 1 N 2 N 3
Maximum VND iterations5050
AL-specific parameters
Surrogate modelCPLEXCRF + CPLEX
Min training samples-72
Cold-start budget-72
Max exact-eval budget-216
Early-stage exact review-3/1/1/1
Middle-stage exact review-2/1/0/0
Late-stage exact review-1/0/0/0
Trust-stage sample threshold-2.0 × min training samples
Release-stage sample threshold-4.0 × min training samples
Trust-stage no-improvement threshold-0.50 × no-improvement limit
Release-stage no-improvement threshold-0.75 × no-improvement limit
Table 2. CRF hyperparameters.
ParameterSetting
Surrogate typeCRF regression
Committee size N5
Trees per committee member100
Maximum number of leaves32
Minimum examples per leaf3
Feature fraction0.30
Bagging example fraction0.80
Training sample for each memberBootstrap sample from D t
Table 3. Cost coefficients used in the numerical experiments.
Cost ItemValueUnit
Cost of temporary rescue stations4500CNY/casualty-capacity unit
Cost of emergency medical facilities35,000CNY/bed
Ambulance operating cost7CNY/vehicle-km
Type-specific transfer cost1.17, 2.33, 7.00CNY/person-km
Equivalent ambulance capacity6,3,1persons/vehicle
Hospital-overload penalty10,000CNY/person
Table 4. Generation rules for demand and capacity parameters.
ParameterGeneration RuleParameterGeneration Rule
Casualties per affected area 182 , 388 Severe-casualty proportion 0.10 , 0.35
Moderate-casualty proportion 0.25 , 0.45 Mild-casualty proportion1-s-m
Hospital normal capacity 0.40 h N ¯ h Emergency-medical-facility capacity0.45/0.7/1.0 D m a x V k
Hospital overload factor 1.80 Temporary rescue-site capacity 0.45 / 0.7 / 1.0 D m a x
Table 5. Scenario-dimension effects on joint model parameters.
Scenario-Dependent ParameterCasualty SeverityRoad-Network DisruptionResponse-Access ConstraintsHospital Surge Pressure
Demand-scaling adjustment(−0.03, 0, 0.06)(0, 0.03, 0.06)(0, 0.01, 0.03)(0, 0, 0)
Severe-casualty proportion(0.10, 0.15, 0.22)(0, 0.015, 0.030)(0, 0.010, 0.020)(0, 0.010, 0.020)
Moderate-casualty proportion(0.32, 0.35, 0.38)(0, 0.005, 0.010)(0, 0.005, 0.010)(0, 0.005, 0.010)
Transfer-impedance increase(0, 0.02, 0.05)(0.05, 0.20, 0.40)(0.03, 0.12, 0.25)(0, 0.03, 0.06)
Hospital-capacity loss(0, 0.02, 0.04)(0, 0.04, 0.08)(0.05, 0.15, 0.25)(0.05, 0.15, 0.25)
Treatment-capability loss(0, 0.005, 0.010)(0, 0.010, 0.020)(0.010, 0.03, 0.05)(0.01, 0.030, 0.05)
Note: Each cell reports the low-, medium-, and high-level values. The casualty-severity entries for severe and moderate casualties are base proportions; the corresponding entries in the other columns are additive adjustments. Demand and impedance values adjust their baseline multipliers, while capacity and capability losses are deducted from the baseline factor of 1. The mild-casualty proportion is the remaining share.
Table 6. Marginal probability weights for the three disruption levels.
Disruption DimensionLowMediumHigh
Casualty severity0.300.450.25
Road-network disruption0.400.400.20
Response-access constraints0.500.350.15
Hospital surge pressure0.400.400.20
Table 7. Composition of small-scale instances.
Case GroupCandidate Temporary Rescue Sites ICandidate Emergency Medical Facilities JAffected Demand Areas HExisting Hospitals K
As13352
As23383
As344103
As455124
Table 8. Comparison of two heuristics and CPLEX in small-scale problems.
Cases IDCPLEXBVNSAL-VNS
Z C ( 10 3 ) T C Z B ( 10 3 ) T B CV% G A P B % Z A ( 10 3 ) T A C V % G A P A %
As1-12450.911.052450.91 3.400.000.002450.91 3.540.000.00
As1-22623.280.922627.09 5.910.290.152623.28 8.080.000.00
As1-32518.211.332518.21 5.970.000.002518.21 6.400.000.00
As1-42874.581.422877.43 4.730.080.102875.53 7.210.070.03
Avg2616.74 1.182618.41 5.000.090.062616.98 6.310.020.01
As2-13977.96 3.093977.96 5.670.000.003977.96 5.290.000.00
As2-24425.97 4.674425.97 8.520.000.004425.97 8.420.000.00
As2-34237.92 2.184237.92 4.850.000.004237.92 6.010.000.00
As2-43943.45 3.473943.45 6.550.000.003943.45 6.590.000.00
Avg4146.32 3.354146.32 6.400.000.004146.32 6.580.000.00
As3-15234.2210.805234.2223.850.000.005236.9225.620.030.05
As3-25224.7019.655225.2123.720.020.015225.2123.130.020.01
As3-34879.2116.454879.2123.040.000.004879.9218.570.020.01
As3-45170.2310.495170.2322.600.000.005170.2324.490.000.00
Avg5127.0914.355127.2223.300.000.005128.0722.950.020.02
As4-16099.7939.676101.9369.470.030.046118.0744.780.200.30
As4-26212.9524.266228.0256.720.140.246234.8043.730.130.35
As4-35766.5724.945768.7960.310.030.045775.9449.290.200.16
As4-46015.4927.676015.0965.320.000.006023.3545.430.190.13
Avg6023.7029.146028.4662.950.050.086038.0445.810.180.24
Note: (1) Z C ,   Z B ,   Z A denote the objective values solved by CPLEX, BVNS algorithm and AL-VNS algorithm; (2) T C ,   T B ,   T A denote the time consumed by the solution of CPLEX, BVNS algorithm and AL-VNS algorithm; (3) G A P B = Z B Z C / Z C ;   G A P A = Z A Z C / Z C ; (4) C V = s t d / m e a n .
Table 9. Composition of medium-scale instances.
Case GroupCandidate Temporary Rescue Sites ICandidate Emergency Medical Facilities JAffected Demand Areas HExisting Hospitals K
Bs166205
Bs288257
Bs31212257
Table 10. Comparison of two heuristics and CPLEX in medium-scale problems.
Cases IDCPLEXBVNSAL-VNS
Z C ( 10 3 ) T C Z B ( 10 3 ) T B CV% G A P B % Z A ( 10 3 ) T A C V % G A P A %
Bs1-110,762.36145.4010,807.05163.780.180.4210,827.33111.050.120.60
Bs1-210,380.31107.8910,392.86238.300.080.1210,410.12105.560.130.29
Bs1-39967.97188.419976.03221.490.090.089984.10109.400.150.16
Avg10,370.21147.2410,391.98207.860.120.2110,407.19108.670.140.35
Bs2-112,937.97742.2212,969.00503.670.090.2412,991.52257.980.210.41
Bs2-212,766.51800.4812,787.90435.590.050.1712,792.43250.350.050.20
Bs2-312,361.49536.2012,401.42476.780.100.3212,418.50243.280.130.46
Avg12,688.66692.9712,719.44472.010.080.2412,734.15250.540.130.36
Bs3-113,051.591694.6013,087.35894.590.050.2713,108.29460.570.080.43
Bs3-212,623.871118.3712,662.42756.430.030.3112,657.71505.260.050.27
Bs3-312,593.871519.5912,627.11873.490.080.2612,636.02485.430.060.33
Avg12,756.44 1444.19 12,792.29 841.50 0.05 0.28 12,800.67 483.75 0.06 0.34
Note: (1) Z C ,   Z B ,   Z A denote the objective values solved by CPLEX, BVNS algorithm and AL-VNS algorithm; (2) T C ,   T B ,   T A denote the time consumed by the solution of CPLEX, BVNS algorithm and AL-VNS algorithm; (3) G A P B = Z B Z C / Z C ;   G A P A = Z A Z C / Z C ; (4) C V = s t d / m e a n .
Table 11. Composition of large-scale instances.
Case GroupCandidate Temporary Rescue Sites ICandidate Emergency Medical Facilities JAffected Demand Areas HExisting Hospitals K
Cs114143510
Cs215154011
Cs316164512
Table 12. Comparison of BVNS and AL-VNS for the large-scale instances.
Cases IDBVNSAL-VNS
Z B ( 10 3 ) T B Z A Std T A TS% G A P B A % E A
Cs1-117,245.651974.2117,277.188.09842.0457.350.18205.33
Cs1-216,853.592638.8416,863.459.50815.9469.080.06181.33
Cs1-317,929.562728.2917,948.8512.94961.5564.760.11197.00
Avg17,342.93 2447.11 17,363.1610.18873.1863.730.12194.55
Cs2-119,742.682033.3419,755.4914.94908.5855.320.06198.33
Cs2-219,317.111600.2019,347.9020.411196.4825.230.16259.67
Cs2-320,082.381602.6120,090.931.251224.5023.590.04249.67
Avg19,714.051745.3819,731.4412.21109.8534.710.09235.89
Cs3-121,337.271925.1721,326.4520.281143.1440.62−0.05210.67
Cs3-221,934.581921.4621,914.603.791426.0425.78−0.09255.67
Cs3-321,653.593027.4021,686.4719.551157.7161.760.15196.33
Avg21,641.812291.3421,642.5114.541242.3042.720.01220.89
Note: (1) Z B   a n d   Z A denote the objective values obtained by BVNS and AL-VNS, respectively; (2) T B   a n d   T A denote their computation times, respectively; (3) G A P B A = Z B Z A / Z B ; T S = T B T A / T B ; Std denotes the standard deviation of the AL-VNS objective value, and EA denotes the average number of exact evaluations.
Table 13. Composition of case study instances.
Case GroupCandidate Temporary Rescue Sites ICandidate Emergency Medical Facilities JAffected Demand Areas HExisting Hospitals K
Ds1313115
Table 14. Population and baseline casualty demand of affected areas.
NodesPopulationCasualty
D1 Shangli18,540222
D2 Bifengxia18,183218
D3 Duoying15,345184
D4 Mingshan53,380641
D5 Wangu11,471138
D6 Cheling18,776225
D7 Hongxing20,308244
D8 Lianjiang10,080121
D9 Yucheng central64,782777
D10 Yucheng west24,808298
D11 Yucheng east78,326940
Table 15. Effective capacity and treatment capability of existing hospitals.
HospitalK1K2K3K4K5
Bed1000499508505500
Capability0.950.860.780.880.72
Table 16. Capacity levels of candidate temporary rescue sites and emergency medical facilities.
Facility TypeQ1Q2Q3
Temporary rescue site I178277396
Emergency medical facility J144224320
Table 17. AL-VNS results for the Ya’an case study.
IndicatorResult
Adjusted total cost5,794,620.07
Runtime48.70 s
Resource construction cost111,274,000.00
Expected transfer cost159,979.21
Expected hospital overload cost301,860.93
System operating cost461,840.14
Raw total cost111,735,840.14
Budget utilization69.40%
Table 18. Facility opening scheme obtained by AL-VNS.
Facility TypeScale LevelOpened SitesNo. of SitesTotal CapacityConstruction Cost
Temporary rescue siteSmallI11178801,000
Temporary rescue siteMediumI3, I625542,493,000
Temporary rescue siteLargeI2, I4, I5, I7-I1310396017,820,000
Emergency medical facilitySmallJ2, J6, J12343215,120,000
Emergency medical facilityMediumJ1012247,840,000
Emergency medical facilityLargeJ5, J7, J8, J9, J11, J136192067,200,000
Emergency medical facilityClosedJ1, J3, J4300
Table 19. Decision-maker preference settings for sensitivity analysis.
Preference Type λ R λ S
Operation-oriented0.10.9
0.20.8
0.30.7
0.40.6
Balanced0.50.5
Investment-oriented0.60.4
0.70.3
0.80.2
0.90.1
Table 20. Cost components and emergency medical facility deployment under different decision-maker preferences.
PreferenceResource CostTransfer CostOverload CostSystem CostOpened J
0.1, 0.9122,944,000168,01452,938220,95212
0.2, 0.8116,314,000157,411158,032315,44311
0.3, 0.7111,274,000171,781301,861473,64110
0.4, 0.6111,274,000159,979301,861461,84010
0.5, 0.5111,274,000159,979301,861461,84010
0.6, 0.4111,274,000159,479301,861461,34010
0.7, 0.3111,274,000159,479301,861461,34010
0.8, 0.2111,274,000159,479301,861461,34010
0.9, 0.1111,274,000159,479301,861461,34010
Table 21. Sensitivity analysis of hospital-overload penalty.
η Opened TRSsTRS CapacityOpened EMFsEMF CapacityTransfer CostExpected Hospital Overload AmountHospital-Overload Penalty CostObjective Value
0.513.00476510.332576170,68130.22151,0935,740,937
0.7512.67466611.332603199,66526.92201,9195,805,233
1.012.67467210.672613204,33525.65256,4755,855,013
1.2512.67466612.002587185,24128.83360,3975,849,261
1.5012.33464610.002565193,70831.55473,2735,868,174
Values are averages over three independent AL-VNS runs for each η level. TRS = temporary rescue site; EMF = emergency medical facility.
Disclaimer/Publisher’s Note: The statements, opinions and data contained in all publications are solely those of the individual author(s) and contributor(s) and not of MDPI and/or the editor(s). MDPI and/or the editor(s) disclaim responsibility for any injury to people or property resulting from any ideas, methods, instructions or products referred to in the content.