1. Introduction
With global climate change becoming increasingly exacerbated, the detrimental consequences stemming from the associated environmental risks have grown increasingly severe [
1]. High-carbon enterprises such as those in the oil, coal-fired power, and steel sectors are the primary source of carbon emissions, accounting for approximately 60% of global greenhouse gas (GHG) emissions [
2] and reaching as high as 80% in China [
3]. These enterprises are not only facing substantial emission reduction pressure but are also particularly vulnerable to climate risks. On the one hand, the rising frequency of extreme climate events directly threatens corporate asset security and business continuity. On the other hand, climate change transition risks arise from societal and policy responses toward mitigating environmental and climate challenges, inevitably exposing high-carbon enterprises to substantial risks of stranded asset devaluation and a decline in portfolio value [
4]. These dual forms of risk—physical and transitional—not only provoke considerable revaluation of corporate financial holdings, but also propagate into systemic financial risks [
5]. Such implications are especially critical for emerging economies like China, where high-carbon sectors accounted for 38% of the GDP in 2024 [
6], as carbon risks may lead to adverse macroeconomic consequences. Considering the mounting pressure, many high-emission corporations are enhancing their climate awareness and adopting adaptive measures to better respond to climate change.
Given the strong correlation between climate risks and carbon emissions in high-carbon sectors, improved carbon performance has become a crucial measure of their transition toward low-carbon operations. It also reflects the rising demands from various stakeholders concerning the effects of corporate actions on climate change [
5]. Concurrently, the disclosure of climate-related risks has gained increasing attention from market participants, serving as a salient metric for evaluating corporate advancement in low-carbon transformation. Initially introduced by the Task Force on Climate-related Financial Disclosures (TCFD) in 2017, climate risk disclosure has evolved into a set of internationally recognized standards. Major economies including the United States and China have adopted corresponding national or regional frameworks [
7]. Against this backdrop, a growing number of enterprises are disclosing climate-related information. For instance, in 2024, approximately 46% of Chinese A-share listed companies published sustainability reports, representing a 10-percentage-point increase compared to 2022. Of these companies, over 62% reported climate-related risks and opportunities and approximately two-thirds disclosed their GHG emissions [
8]. Theoretically, climate risk disclosure facilitates the transparent reporting of corporate carbon emissions, and climate mitigation and adaptation initiatives, thereby potentially enhancing corporate carbon performance.
Previous studies have extensively examined the economic consequences of climate risks, highlighting how both external threats and internal vulnerabilities necessitate improved climate risk disclosure for effective corporate risk management [
9]. As a crucial metric of low-carbon transition progress, corporate carbon performance is shaped by multiple determinants, including operational behaviors, corporate governance, and regional conditions [
10]. Among these, climate risk disclosure plays a potentially formative role in shaping corporate environmental strategy and specific actions—contributing not only to emission reduction but also to broader sustainability outcomes [
11]. Nevertheless, the empirical literature examining the connection between climate risk disclosure and corporate carbon performance remains limited and nascent. Whether climate risk disclosure strengthens or weakens corporate carbon emission performance remains debatable [
12]. The factors driving this relationship are also fragmented, spanning internal domains like operational management [
13] and external spheres such as government regulation and financial markets [
14]. This raises two central questions: Does climate risk disclosure contribute to improved carbon performance in the face of ongoing climate change? And through which underlying channels might such effects operate? By exploring these questions, this study seeks to extend the micro-level understanding of corporate sustainability management in an era of climate change.
Based on these considerations, this study examines whether and how climate risk disclosure impacts carbon performance in high-carbon enterprises, drawing on evidence from China. Specifically, a systematic textual analysis of the annual reports of Chinese high-carbon listed companies over the period 2006–2022 is conducted. By measuring the frequency of terms associated with climate risk, an annual firm-level index is constructed. This index captures not only overall climate risk disclosure but also its two distinct components: physical risks and transition risks. Subsequently, a fixed-effects panel regression specification is employed to assess the linkage between climate risk disclosure and carbon performance. Beyond examining the direct effect, the potential mechanism of this relationship is investigated from two lenses of green innovation and financial restriction. Finally, a heterogeneity analysis is performed to examine how the impact varies with enterprise size, industry concentration, and geographical location.
This study makes three original contributions to the literature. First, it bridges the two previously disconnected research domains of climate risk assessment and corporate carbon performance drivers. Prior studies have separately investigated the measurement or economic consequences of climate risks and the determinants of firm-level carbon emission performance, but the explicit empirical link between climate risk disclosure and corporate carbon outcomes remains underexplored. By providing robust evidence from China, this study integrates these two strands of literature and advances a more complete understanding of how firms’ disclosure behavior relates to their emission trajectories. Second, this study moves beyond the average effect to identify the mediating channels and boundary conditions. Unlike prior research that centers on the direct financial environmental consequences of climate risk disclosure, this study empirically demonstrates that green innovation and financial constraint alleviation serve as dual mediating pathways, and that these effects are heterogeneous across firm size, industry concentration, and regional location. By uncovering these mechanisms and heterogeneous effects, this study responds directly to recent calls for mechanism-oriented and context-sensitive research on corporate sustainability. Third, while the existing literature draws on broad cross-industry samples, this study focuses specifically on China’s high-carbon enterprises, which simultaneously face severe emission reduction pressure and heightened exposure to both physical and transition climate risks. Within this high-stakes context, we further distinguish between physical and transition risk disclosure for more precise evidence. These findings carry particular relevance for emerging economies, where high-carbon industries remain central to economic structure, and climate disclosure frameworks are still taking shape.
2. Literature Review
The literature associated with this study is mainly concerned with the assessment of climate risk disclosure, the corresponding economic and environmental outcomes, and influencing factors of corporate carbon performance.
The comprehensive identification and disclosure of climate-related risks are essential for enterprises’ survival and sustainable development. The inadequate identification of climate-related risks or delayed strategic adjustment can transmit significant adverse effects to the real economy. Accordingly, a substantial body of literature identifies transparent climate risk disclosure as a critical mechanism for fostering proactive corporate strategies to address climate change. Globally recognized frameworks such as the TCFD and International Sustainability Standards Board (ISSB) encourage businesses to publicly report on climate-related risks and their consequential effects. The recent literature has also highlighted policy measures adopted in leading global economies, notably the United States and China, designed to improve corporate transparency and governance regarding climate risk [
15,
16]. In 2025, the Chinese government introduced a national climate disclosure standard aligned with the ISSB guidelines. Concurrently, the rising environmental expectations of investors and broader stakeholders are reshaping corporate reputation concerns and motivating enhanced disclosure practices [
17]. In terms of measurement, scholars have mainly relied on the textual analysis of corporate documents—including annual reports and earnings call transcripts—to construct firm-level climate risk disclosure indices using keyword frequency counts or dummy variables [
9].
A growing body of literature investigates how climate risk disclosure influences firm behavior and sustainability outcomes. At the financial level, climate-related risks have been shown to cause earnings volatility, weaken debt-servicing capacity, and elevate loan default rates [
18]. At the strategic level, climate risk disclosure stimulates the adoption of more proactive environmental strategies. Enhanced carbon risk disclosure has been linked to accelerated green transformation, with particularly pronounced effects in heavily polluting industries [
19]. This transformation manifests across multiple dimensions, including enhanced green technology innovation, expanded green investment, and improved climate governance [
11,
13]. At the environmental performance level, studies have linked climate risk disclosure to energy intensity [
20], ESG performance [
21], and carbon performance [
12]. However, empirical studies explicitly examining the relationship between climate risk disclosure and carbon performance remain limited, and findings are mixed. Some research suggests that rising climate risk correlates with increased corporate carbon emissions [
22], while other studies indicate that opportunistic or distorted environmental disclosures fail to enhance carbon performance [
23].
A parallel strand of research investigates the determinants of corporate carbon performance. From an external perspective, carbon performance is primarily shaped by energy consumption patterns [
24], industrial structure [
25], technological progress [
26], and international investment flows [
27]. Regional factors such as geographical location, economic development, and government environmental regulations can also impact corporate carbon emissions [
19,
28]. Recent studies also highlight the positive role of digital transformation and AI adoption [
29]. From an internal perspective, firm-level specific characteristics and operational behaviors significantly influence carbon emission efficiency. Notably, enhanced risk awareness and carbon disclosure practices have emerged as potential drivers of carbon performance. Enterprises that actively report climate-related risks tend to channel greater resources into low-carbon development and achieve enhanced carbon management outcomes [
30].
While the existing literature provides important insights, how climate risk disclosure shapes carbon performance requires more in-depth empirical analysis. First, although high-carbon enterprises represent major emission sources and are particularly susceptible to climate risks, empirical research on their climate risk disclosure and low-carbon transition remains limited. Second, the precise interaction between climate risk disclosure and carbon performance has yet to be thoroughly analyzed, and the underlying mechanisms remain unclear. Evaluating how climate risk disclosure affects corporate carbon performance requires careful consideration within the Chinese context, taking into account both external and internal influencing factors. Third, existing climate risk disclosure indices exhibit limitations in their practical applicability and comprehensiveness in measuring firm-level climate risk exposure, while carbon performance metrics lack sufficiently objective and specific indicators. To fill these gaps, this study conducts an empirical analysis using a panel dataset of China’s listed high-carbon enterprises over the 2006–2022 period to investigate how climate risk disclosure affects carbon performance and through what mechanisms. The results are expected to not only assist China in formulating robust sustainable development strategies, but also provide a significant reference for other countries with extensive development modes.
3. Theory and Hypothesis
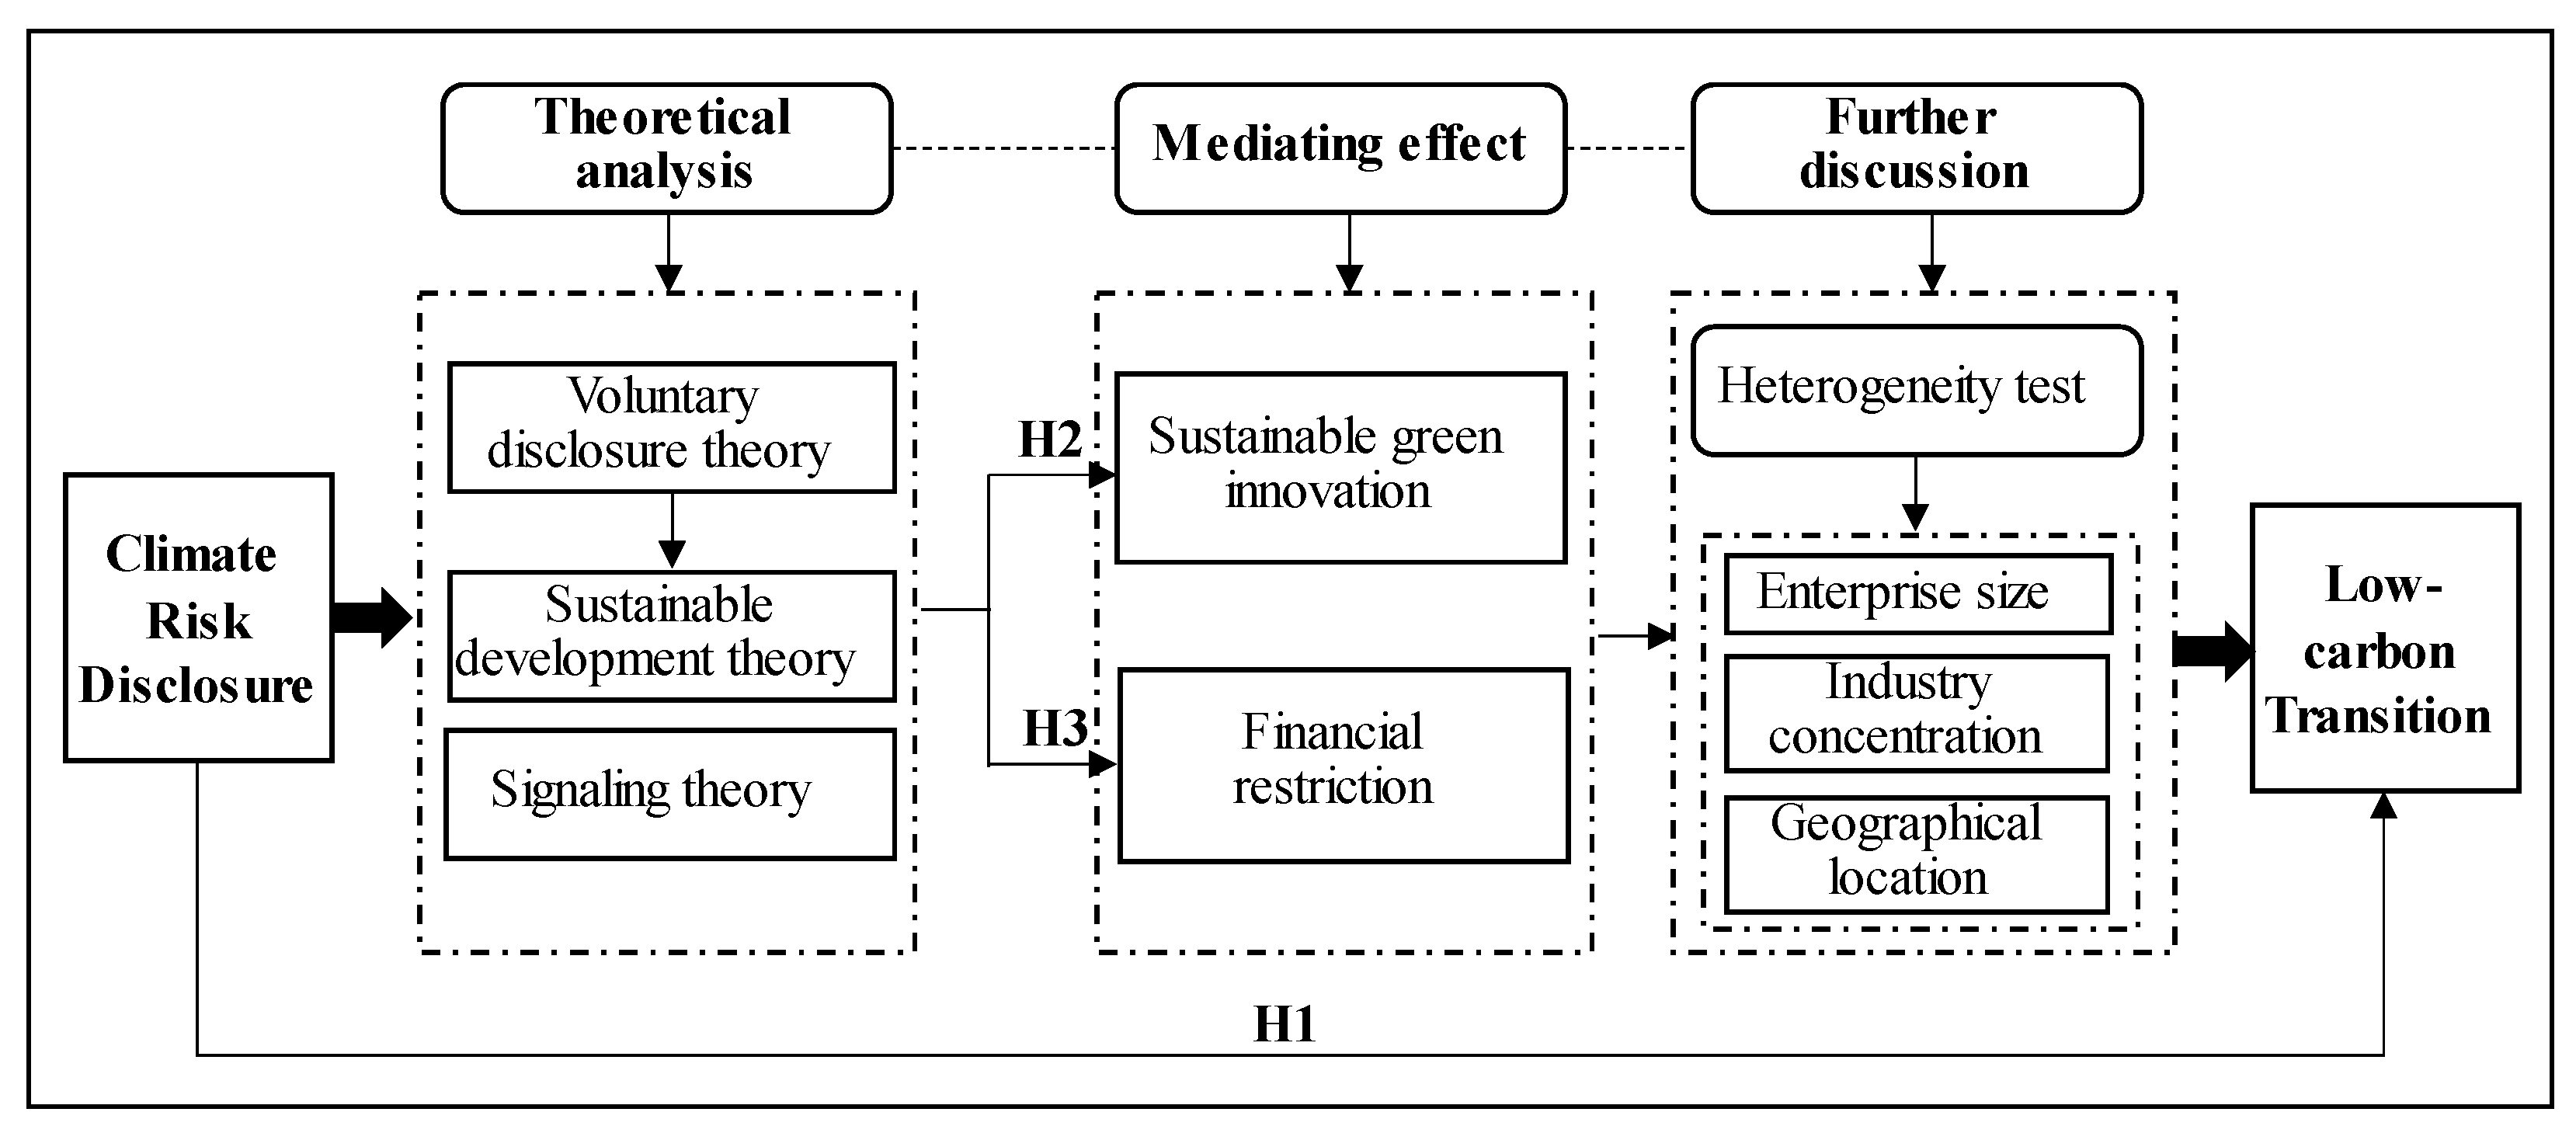
Figure 1 illustrates the theoretical basis used to construct the conceptual framework and influence channels. It further explains the research hypothesis regarding how climate risk disclosure shapes corporate carbon performance.
Voluntary disclosure theory is primarily concerned with the explanation of why firms choose to disclose information in the first place. This theory posits that enterprises often make strategic decisions to include both financial and non-financial details in their annual reports, with the objective of addressing stakeholders’ informational requirements [
31]. This practice enhances transparency by offering stakeholders greater insight into the firm’s long-term sustainability, while also addressing information gaps and easing agency issues between corporate management and investors [
32,
33]. Critically, voluntary disclosure theory does not imply that only firms with superior current performance will disclose; even enterprises with suboptimal carbon performance may have strong incentives to disclose their climate risk exposure, forward-looking transition strategies, and risk management frameworks. By providing decision-useful information about their climate vulnerabilities and planned responses, such firms can signal their commitment to improvement, mitigate agency problems, and build long-term trust [
34,
35]. Indeed, institutional investors increasingly regard climate risk information as equally important as conventional financial statements [
35]. Voluntary disclosure theory thus illuminates the motivational basis for climate risk disclosure.
Once climate risk disclosure is undertaken, sustainable development theory and signaling theory jointly explain how such disclosure can translate into tangible improvements in carbon performance. According to sustainable development theory, it is essential to reconcile economic growth with environmental and resource constraints. Specifically, this entails a shift for firms from conventional production methods—characterized by intensive resource utilization, high energy consumption, and substantial pollution—toward cleaner operational models that enhance economic efficiency while minimizing environmental impact. With growing global climate change concerns and rising climate risks, enterprises will increase green investment to enhance resource efficiency and improve emission performance. Carbon risk consciousness serves as a pivotal impetus for driving ecological modernization and low-carbon innovation [
31]. Enterprises disclosing emission reduction efforts to stakeholders will positively influence their financial performance [
32]. Consequently, for enterprises pursuing long-term value and sustainable growth, it is essential to strengthen carbon risk awareness, adopt sustainability principles into strategic planning, and shift from a narrow focus on economic gains to integrate economic, social, and environmental interests, thereby contributing to society-wide low-carbon transition goals.
Moreover, from the signaling theory perspective, carbon risk disclosure enables enterprises to leverage information transmission mechanisms to facilitate the low-carbon transition. First, by proactively disclosing carbon emission information, enterprises convey positive signals of green transformation to markets. This behavior not only enhances an enterprise’s reputation and social recognition but also helps to gain the trust of investors and stakeholders [
22]. Second, enterprises continuously communicate and cooperate with multiple stakeholders, which can build trust relationships and jointly facilitate green transformation. Through information sharing and collaboration, enterprises can obtain more support and resources, which enhance the impetus for transformation [
33]. Third, enterprises leverage technological innovation to design low-carbon products and environmentally sustainable solutions, thereby enhancing their market competitiveness while simultaneously signaling their dedication to green transformation. This not only helps attract environmentally conscious consumers and investors but also catalyzes broader industrial progress toward sustainable development [
34].
In brief, while voluntary disclosure theory explains why firms, including those with imperfect current carbon performance, choose to disclose climate risk information, signaling theory and sustainable development theory jointly explain how such disclosure translates into improved carbon performance. Building on this integrated theoretical foundation, the following hypothesis is proposed:
H1: Climate risk disclosure promotes firms’ carbon performance.
Green innovation is considered a critical strategic tool for dealing with firms’ climate-related risks [
36]. Therefore, this study supposes climate risk disclosure will motivate firms to facilitate green innovation, thereby continuously improving carbon performance. From an internal perspective, dynamic capability theory holds that enterprises have to identify, integrate, and reconfigure resources to adapt to environmental change [
37]. Climate risk disclosure requires firm-level management to systematically evaluate potential physical and transition risks, thereby embedding green innovation within core strategic planning and steering R&D resources toward green technologies [
38]. The emission reduction targets and associated low-carbon transition pathways disclosed provide R&D teams with clear, actionable guidance, allowing innovation efforts to concentrate more effectively on process optimization, energy substitution, and product designs that directly lower carbon emissions [
29]. From an external perspective, the low-carbon development paradigm is increasingly regarded as a mainstream trend. According to signaling theory, enhancing green innovation enables firms to signal their commitment to sustainability, formulating a favorable reputation among investors and stakeholders [
39]. Simultaneously, growing scrutiny from external stakeholders—including the public, media, regulators, and investors—exerts sustained reputational and regulatory pressure, motivating firms to engage in green innovation [
40]. The low-carbon technologies, patents, and organizational practices developed through green innovation constitute core competitive resources; high-quality climate disclosure enhances the perceived market value and strategic legitimacy of these assets [
41]. Empirical evidence confirms this theoretical logic: firms characterized by greater climate risk exposure and those with more extensive climate risk disclosure are significantly more likely to advance green technological innovation, which subsequently improves their carbon performance [
42]. Building on the above theoretical analysis, the second hypothesis is formulated as follows:
H2: Climate risk disclosure improves carbon performance by facilitating firms’ sustainable green innovation.
Due to climate-related risks, high-carbon enterprises typically face elevated financing costs, as creditors and investors perceive these investments as inherently risky. This study posits that the disclosure of climate risk information can alleviate financing costs, thereby improving carbon performance. Agency theory indicates that information asymmetry between agents (e.g., managers) and principals (e.g., investors) generates conflicts that elevate perceived investment risk [
43,
44]. Firms’ systematic climate risk disclosures signal not only the identification of such risks but also the commitment and capacity to manage them proactively [
45]. Climate risk disclosures are better positioned to diminish such informational gaps by offering detailed insights to stakeholders, thereby reducing the cost of capital and attracting favorable investments [
33]. Furthermore, from the externality theory perspective, industrial manufacturing frequently generates environmental pollution, leading firms to treat environmental investment as both a strategic response to climate risk management and a mechanism for internalizing these external costs [
46]. Investors tend to show preference for companies whose equities demonstrate strong socio-environmental performance, often requiring lower risk premiums for such holdings. Additionally, transparent climate risk disclosure can draw the attention of investors who emphasize environmental responsibility and sustainable development [
17]. These investors typically have longer investment horizons and demonstrate a stronger willingness to support corporate initiatives aligned with low-carbon transitions [
13]. Empirical evidence confirms that firms voluntarily disclosing climate information tend to enjoy higher market valuations and lower capital costs. This leads to the third hypothesis:
H3: Climate risk disclosure improves carbon performance by alleviating financial restriction.
5. Empirical Analysis
5.1. Baseline Regression
Table 3 illustrates the baseline regression results. Column (1) presents the model without any control variables. Column (2) incorporates the control variables for corporate financial characteristics. Columns (3) to (5) introduce all the control variables, including corporate basic features, financial metrics, and management factors. The independent variable in Columns (1) to (3) represents the aggregate corporate climate risk disclosure level, whereas Columns (4) and (5) separately present estimates for physical and transition climate risk disclosure. Each regression includes controls for both firm-level and year-level fixed effects.
The findings reveal that the disclosure of climate-related risks notably enhances the carbon performance of high-carbon enterprises. As shown in Column (3), the estimated coefficient on CLMRK is negative and statistically significant at 5%, implying that carbon risk disclosure can improve corporate carbon performance. Moreover, the result is also economically significant: a one-standard-deviation increase in CLMRK leads to a 7.98-standard-deviation decline (1.452 × 0.693/12.607 × 100%) in CARBON. This result supports Hypothesis H1. Moreover, it bridges two previously distinct research domains—climate risk disclosure and corporate carbon performance. Further analysis differentiating between risk categories indicates that transition risk disclosure (TRANS) exhibits a significant negative coefficient (Column (5)), whereas physical risk disclosure (PHY) shows no statistically meaningful relationship with carbon performance (Column (4)). These findings show that climate risk disclosure, overall, primarily drives corporate carbon performance improvement through the awareness of transition-related risks. In contrast, the impact of physical risk may be more indirect or relatively weaker. This distinction enriches the debate on whether disclosure uniformly affects environmental outcomes.
A primary explanation for the insignificant effect of physical risk disclosure lies in its nature and quality. During the sample period, climate risk disclosure in China is still at an early stage, and physical risk reporting remained largely qualitative, lacking the quantified, financially material detail that would link or stimulate carbon mitigation. Unlike transition risk, which can be tied to concrete metrics like carbon prices, physical risk disclosures may fulfill legitimacy-seeking purposes but offer managers and investors little actionable information. Consequently, they are statistically powerless to explain changes in corporate carbon performance. Furthermore, managers tend to internalize transition risk as endogenous to their emission decisions (directly manageable through mitigation), whereas physical risks are generally perceived as exogenous shocks addressed through adaptation (e.g., insurance, resilient infrastructure) rather than emission reduction.
Meanwhile, within China’s specific institutional context, the national strategy such as “the carbon peaking and carbon neutrality goals” and policy instruments such as the national Emissions Trading Scheme (ETS) have further elevated transition risk as the more immediate, strategically salient concern for high-carbon sectors, creating a powerful incentive for corporate emission reduction. In contrast, physical risk is often treated as a longer-term concern falling under public disaster response, weakening its link to corporate carbon strategy.
The heterogeneity analysis provides further evidence for this distinction (due to limited space, detailed results will be made available on request). Results show that transition risk disclosure significantly improves carbon performance among smaller firms, firms in less concentrated industries, and those in the developed eastern region, where market pressures and incentives are stronger. By contrast, the influence of physical risk disclosure remains largely insignificant except in less concentrated industries. This indicates that when market forces amplify the financial consequence of physical risk exposure, even disclosures perceived as less decision-relevant can trigger carbon performance improvements.
5.2. Endogeneity Test
Despite multiple controls, the regression model may still be subject to endogeneity interference. Climate risk disclosure can stimulate related firms to adjust their management strategy and adopt energy conservation and emission reduction technologies, thereby influencing their carbon emission performance. Meanwhile, carbon performance will possibly affect the climate risk perception [
61]. Firms with high-carbon output tend to encounter greater physical risks from asset concentration and energy dependence and higher transition risks from regulatory pressure than other sectors. Omitted variable bias may further affect estimates. Therefore, this study employs the instrumental variable (IV) method and propensity score matching (PSM) approach to test for endogeneity.
Instrumental variable approach: With reference to Goldsmith-Pinkham et al. [
62], this study constructs a shift-share instrumental variable, also known as a Bartik-style instrument, for
CLMRK. This instrumental variable, denoted as
CLMRK_iv, is calculated by interacting the one-period-lagged core explanatory variable with the growth rate of national carbon dioxide emissions in China. The rationale behind this approach is as follows: On the one hand, the lagged value of the corporate climate risk disclosure index can reflect firm-level inherent risk exposure features, and firms that disclosed more information in the previous period are more likely to maintain a high level of disclosure in the current period, meaning this variable satisfies the correlation requirement for an instrumental variable. On the other hand, changes in national carbon emission levels represent macro-level shocks from climate governance pressures, determined by factors such as macroeconomic growth, energy structure transformation, and national industrial policies. The growth rate is unlikely to be directly influenced by the carbon emissions of individual firms, thereby satisfying the exogeneity requirement for an instrumental variable.
Table 4 reports the results of the instrumental variable approach. Column (1) displays the first-stage estimation results. The estimated coefficient for
CLMRK_iv is positive and statistically significant, indicating the IV is highly positively correlated with the core explanatory variable and thus satisfies the relevance assumption. The results of the
Cragg–Donald Wald F-statistic (above the 10% critical threshold) and the
Kleibergen–Paap rk LM statistic tests indicate that the IV passes the under-identification test and rules out the possibility of a weak instrumental variable. In the second-stage estimation, the instrumental variable
CLMRK_iv replaces the original independent variable
CLMRK in the regression model. Column (2) presents the outcomes of the second-stage estimation, where the estimated coefficient for corporate climate risk disclosure remains negative and statistically significant, verifying the robustness of the baseline results.
Propensity score matching method: Following the approach of Ren et al. [
36], this study further applies the PSM method to address the potential endogeneity arising from sample selection bias. First, we create a dummy variable based on the median of
CLMRK to group the sample: firms with a
CLMRK above the median are assigned a value of 1 and designated as the treatment group; others are assigned a value of 0 and serve as the control group. Then, we perform a logit regression analysis, incorporating the same control variables and fixed effects as in the baseline regression model (Equation (1)). Next, the nearest-neighbor (1:1), radius, and kernel matching methods are applied to obtain the matched samples that satisfy the common support assumption and pass the balancing test. Finally, the matched samples are used to re-estimate the baseline regression model. The results are presented in
Table 5 and show that the estimated coefficients of
CLMRK remain significant and negative across all three matching methods, indicating that corporate climate risk disclosure can improve carbon performance, even after accounting for sample selection bias, and that the baseline conclusions remain robust.
5.3. Robustness Test
5.3.1. Alternative Dependent Variable Specifications
To test the reliability of the findings, this study constructs an alternative measurement of corporate carbon performance for a robustness test. Specifically, carbon performance is recalculated based on firms’ primary business costs and primary business revenues in Equations (4) and (5). The indicator
CARBON_new serves as a proxy for the original dependent variable. Meanwhile, we utilize the 2007–2022 ESG rating data for Chinese listed firms, which is obtained from the
CNRDS database, and conduct robustness tests by calculating the natural logarithms of ESG scores (
lnESG) and E-scores (
lnESG_E) as proxy variables for the dependent variables. Although this database lacks corporate rating data for 2006, given that the sample size for that year accounts for only approximately 3% of the total—a quite low proportion—there is good reason to believe that the robustness test results based on the remaining years are reliable. As shown in Columns (1) to (6) of
Supplementary Materials Table S3,
CLMRK still presents a positive impact on corporate carbon performance, while the effects of
PHY and
TRANS show no significant variation compared with the baseline regression, confirming the reliability of the main findings. (Due to space constraints and given that the test results based on the ESG score and the E-score do not show significant differences, the estimates based on the E-score are not reported here. Further details can be obtained from the authors.) (Please refer to
Supplementary Materials Table S3 for detailed results.)
5.3.2. Adjusting the Sample Period
The benchmark regression period covers two major exogenous shocks which can influence global and corporate operations: China’s incorporation of carbon emission reduction targets into its national strategy in 2009 and the COVID-19 outbreak in December 2019. Therefore, this study restricts the sample period to 2010–2019 and re-estimates the model. In Columns (7) to (9) of
Supplementary Materials Table S3, the coefficients of
CLMRK,
PHY, and
TRANS show no significant variation in comparison to the baseline findings, substantiating the stability of the core conclusions. (Please refer to
Supplementary Materials Table S3 for detailed results.)
5.3.3. Excluding the Interference of Contemporary Policies
To control for potential policy-induced bias during the sample period—such as from China’s carbon emissions trading and energy consumption rights trading pilots—this study introduces two policy dummy variables (
mdid for former and
edid for later) constructed as region–period interactions and incorporates these dummies into the regression model (see
Supplementary Materials S2). As exhibited in
Supplementary Materials Table S4, the coefficient associated with
CLMRK remains consistent in sign, magnitude, and significance after including these concurrent policies, while neither policy dummy is statistically significant, substantiating the reliability of the baseline outcomes. (Please refer to
Supplementary Materials Table S4 for detailed results.)
Furthermore, this research also incorporates multi-level fixed effects (city, industry, city–year, and industry–year) to conduct robustness tests. The results obtained also support the baseline conclusions; due to limited space, detailed results will be made available on request.
5.4. Mechanism Analysis
The aforementioned theoretical framework indicates that climate risk disclosure may exert influence via the following potential pathways: enhanced levels of green innovation and alleviated financing constraints. The analysis follows the three-step mediation framework combined with bootstrap inference, as described in
Section 4.1. The detailed results are presented in
Table 6 and
Table 7.
5.4.1. The Effect of Green Innovation
This study measures firm-level green innovation by calculating the natural logarithm of one plus the total number of annual patent applications for green inventions and green utility models filed by high-carbon firms (
GI). The Green patent data are obtained by retrieving patent applications from the sample companies based on the IPC classification codes and criteria specified by WIPO (World Intellectual Property Organization), followed by matching and collation. As shown in Column (2) of
Table 6, the coefficients of
CLMRK is 0.230 and significant at the 1% level, indicating that high-carbon enterprises that disclose climate-related risks demonstrate a significant improvement in their green innovation capabilities. Results in Column (3) of
Table 6 show that the coefficient of
GI is −0.377 and significantly negative at the 5% level, implying that an increase in corporate green innovation can significantly reduce their carbon emissions intensity. This positive effect creates a favorable environment for carbon emission reduction and green transition at the corporate level, thereby helping to improve carbon performance. Furthermore, to verify the reliability of results, we apply a non-parametric bootstrap method with 5000 replications of random sampling. As shown in
Table 7 Panel A, the 95% confidence intervals for the estimated coefficients of the direct and indirect effects all exclude zero, confirming the mediating effect of green innovation. This mediating channel is consistent with the signaling and dynamic capability theories, lending support to Hypothesis H2.
5.4.2. The Effect of Financial Restriction
Financing constraints significantly influence corporate environmental performance. While substantial investments in green innovation and pollution control are essential for emission reduction, such projects typically involve extended timelines, substantial uncertainty, and considerable entry barriers. Confronted with limited resources, enterprises tend to prioritize short-term profitable projects over emission-reducing transformations. Consequently, financing constraints emerge as a critical impediment for firms to improve carbon performance [
63]. Meanwhile, existing research indicates that alleviating financing constraints contributes positively to enabling enterprises to reduce carbon intensity and enhance carbon neutrality capabilities.
In corporate financing structures, long-term borrowings serve as one of the primary sources of funds, providing crucial support for corporate new investments. Accordingly, following Chen and Zhu [
64], this research calculates the ratio of long-term borrowings to total assets (
FC) to measure the degree of corporate financing constraint. The estimates in Column (4) of
Table 6 indicate that the coefficient of
CLMRK is 0.018 and significant at the 1% level, demonstrating that climate risk disclosure can increase the ratio of long-term borrowings to total assets at the firm level, enabling access to more funding and thus alleviating financing constraints. The results in Column (5) indicate that the regression coefficients for both
CLMRK and
FC are significant, suggesting that financing constraints play a mediating role between climate risk disclosure and corporate carbon performance. Panel B of
Table 7 further shows that the coefficient of the indirect effect is significantly positive at the 1% level, with the 95% confidence interval excluding zero, providing evidence that financing constraints serve as a significant mediator between climate risk disclosure and corporate carbon performance, thereby confirming Hypothesis H3. However, it is observed that the sign of γ
1ω
2 (9.086 × 0.018) is opposite to that of ω
1 (−1.613), suggesting that this mediating mechanism exhibits a masking effect: financing constraints actually weaken the enhancing effect of climate risk disclosure on carbon performance. A possible explanation is that once financing constraints are eased, enterprises tend to prioritize capacity expansion and market share capture. If the newly added capacity still relies predominantly on traditional technologies, the short-term increase in carbon emissions will far outpace the improvement in emission-reduction technologies per unit of output, leading to an increase rather than a decrease in carbon emission intensity. In addition, when financing constraints are severe, firms tend to manage their resources carefully, reducing unnecessary energy consumption, which objectively contributes to improved carbon performance. Once financing constraints are alleviated, firms may relax their cost controls, leading to a decline in energy efficiency and, consequently, a rebound in carbon emission intensity. Given these findings, the proposed mechanism whereby corporate climate risk disclosure improves carbon performance by alleviating financing constraints may lack a practical foundation.
5.5. Heterogeneity Test
The effect of climate risk disclosure may vary within enterprises themselves, as well as in the characteristics of their respective industries and regions. Therefore, a heterogeneity test is conducted at the firm-, industry-, and region-specific level, respectively.
5.5.1. Enterprise Size
Climate change risk can influence large enterprises and small and medium-sized enterprises (SMEs) differently. Large firms derive advantages from more abundant resources and stronger capabilities to mitigate external uncertainties. In contrast, SMEs often confront financial and operational constraints that limit their adaptive capacity.
Using the median value of firm total assets, the sample is categorized into two groups, namely, large enterprises (
LARGE) and SMEs (
SMEs). In
Table 8, Columns (1) and (2) illustrate that
CLMRK has a significant negative effect only for SMEs, with no significant impact for large firms—a difference confirmed by a significant Chow test. This implies that climate risk disclosure improves carbon performance more effectively among SMEs compared to large enterprises.
A plausible explanation lies in the following two aspects: First, SMEs typically face severe financial or technological resource constraints and intense market competition [
65], making them more sensitive to external volatility such as climate-related risks. Corporate awareness of climate risks can thus translate more readily into immediate mitigation actions. Second, SMEs have relatively simpler internal governance structures [
66], which enables climate risk shocks to propagate more directly within the organization, facilitating swifter low-carbon transitions and carbon performance improvements.
5.5.2. Industry Concentration
Industry concentration is associated with discrepancies in enterprises’ resource endowments, competitive mechanisms, risk tolerance, and strategic adaptability, thus influencing corporate decision-making and response to external risks. In highly concentrated industries, dominant enterprises exert greater control over market price and supply chains [
67], face lower competition, and possess better resource allocation flexibility and risk resilience; conversely, the opposite holds true.
Referring to Rossi-Hansberg et al. [
68], this study divides the sample into two groups—high-concentration (
HCG) and non-high-concentration groups (
nHCG)—based on the median value of the Herfindahl–Hirschman Index (HHI). As shown in Columns (3) and (4) of
Table 8,
CLMRK has a significant negative effect on the
nHCG group, whereas its effect is non-significant for the
HCG group; the results are confirmed by a significant Chow test. These findings imply that the conducive effect of climate risk disclosure on carbon performance is more distinctive in less concentrated markets.
A plausible explanation lies in differing industry dynamics. In highly concentrated sectors, firms often face technological inertia and high transition costs, which can delay low-carbon upgrades despite climate risk awareness, limiting carbon performance improvements. In contrast, enterprises in less concentrated industries exhibit greater sensitivity to market signals. Rising climate risk perception under competitive pressure encourages timely sustainability actions, thereby enhancing carbon performance [
69].
5.5.3. Geographical Location
In China, there exist significant disparities in economic development, technological capabilities, and policy environments between eastern and central–western regions. Accordingly, the actual effect of climate risk disclosure could vary under different locations. This study therefore groups firms by province into eastern (
EAST) and non-eastern (
nEAST) regions for the heterogeneity analysis (see
Supplementary Materials S3 for detailed information on regional divisions). Columns (5) and (6) in
Table 8 show that for the
EAST group, the estimated coefficient for
CLMRK is found to be significantly negative, whereas its effect is statistically insignificant for those in non-eastern regions, validated again by a Chow test. This reflects that climate risk disclosure plays a more substantial role in enhancing the carbon performance of enterprises based in eastern China.
A plausible explanation for this result lies in regional developmental differences. Eastern China, characterized by higher economic density, greater innovation capacity, and stronger resource security [
70], is also geographically more exposed to climate risks due to its coastal location. These factors collectively heighten local firms’ sensitivity to climate risks and their motivation to pursue carbon reduction. Moreover, the eastern region shows faster progress in industrial restructuring and upgrading [
71] and can provide a stronger foundation for transitioning toward technology-intensive and better carbon management production, which helps explain why climate risk disclosure has a more discernible impact on carbon performance in eastern China.
6. Conclusions and Policy Implications
6.1. Conclusions
Climate-related risk has emerged as an essential factor influencing corporate decision-making and operations. For high-carbon enterprises, their capacity to achieve green transformation critically affects not only their own viability but also the resilience of industrial systems and sustainable development. Against this backdrop, this study employs a panel data of Chinese-listed high-carbon enterprises between 2006 and 2022 and investigates how climate risk disclosure affects carbon performance, including its underlying mechanisms as well as heterogeneous impacts.
First, climate risk disclosure generates a positive and statistically significant influence on the carbon performance of high-carbon enterprises, which stays valid across multiple robustness checks. This is consistent with the theoretical assumptions derived from voluntary disclosure theory, sustainable development theory, and signaling theory, as outlined in our theoretical framework. Decomposition analysis further reveals a divergent impact: transition risk disclosure (TRANS) exhibits a statistically significant negative coefficient with carbon performance, while physical risk disclosure (PHY) shows no statistically significant association. This implies that it is transition risk disclosure, rather than physical risk disclosure, that drives improvements in carbon performance—a differential effect that has been largely overlooked in prior studies.
Second, mechanism analysis identifies that encouraging green innovation and alleviating financial restrictions are the two primary pathways. The green innovation channel is consistent with signaling theory and dynamic capability theory, with significant direct and indirect effects. The financing constraint channel, meanwhile, operates through reduced information asymmetry. These two mechanisms illustrate a dual-pathway logic: disclosure not only strengthens firms’ internal capacity for innovation but also enhances their external financial viability, establishing a self-reinforcing cycle that accelerates progress in carbon performance.
Finally, the positive effect stands out particularly among smaller-sized firms, enterprises active in less concentrated sectors, and those based in eastern China. The heterogeneous effects across firm size, industry concentration, and region further delineate the boundary conditions under which climate risk disclosure influences carbon performance. These patterns indicate that the disclosure–performance link is not automatic but is moderated by the broader market and institutional context, which calls for context-sensitive policy formulation and regulatory calibration.
6.2. Policy Implications
First, compulsory climate risk disclosure frameworks should be strengthened, with explicit emphasis on transition risk reporting. The baseline regression results demonstrate that both overall climate risk disclosure and transition risk disclosure have significant positive effects on the carbon performance of high-carbon enterprises. Accordingly, regulators should mandate comprehensive climate risk disclosures for all high-carbon enterprises, with specific requirements for transition risk-related information (for example, decarbonization pathways, governance adaptations, and technology roadmaps). Pilot implementation could begin in high-emission sectors such as power generation, steel, cement, and petrochemicals, followed by phased expansion to all material emitters. To ensure accountability and foster continuous improvement, disclosure compliance and data quality should be formally integrated into ESG rating methodologies and green finance eligibility criteria—including green bond issuance and sustainability-linked loan frameworks.
Second, complementary policies should be deployed to activate the green innovation and financing channels. The mechanism analysis of encouraging green innovation and alleviating financial constraints offers dual insights for advancing the low-carbon transition of high-carbon enterprises. Regarding green innovation, as many green technologies remain underdeveloped, a suite of supportive policies is essential, such as enhancing fiscal subsidies and tax incentives for green technology research and development, fostering stronger collaboration among innovation actors, attracting specialized technical talent, and improving the structure of national innovation ecosystems. Regarding financial restriction alleviation, a harmonized transition finance taxonomy must be established to define eligible activities. In addition, designing commercially viable transition finance products, such as transition loans, bonds, insurance, and funds, is essential for providing large-scale financial support.
Third, climate risk management policies should be differentiated according to firm-specific characteristics rather than applied uniformly. Heterogeneity analysis reveals that smaller businesses, firms in low-concentration industries, and high-carbon firms located in eastern regions see particularly strong positive effects from climate risk disclosure. In light of this, for firms showing limited climate risk disclosure effects, targeted strategies should address structural barriers. For example, large firms should elevate climate risk management within corporate governance by refining internal objectives and decision-making processes; enterprises in highly concentrated industries can utilize their market influence to foster industrial sharing, spurring sector-wide climate governance; and central and western regional firms can pursue tailored policy support and collaborate with eastern partners to establish carbon management platforms, mitigating resource limitations.
6.3. Limitations and Research Outlook
This current study enriches the understanding of the interaction between climate risk disclosure and carbon performance. Future research might take this analysis one step further by broadening the sample to include non-listed firms, conducting cross-country or subnational comparative analyses, integrating internal governance structures and resource allocations with external institutional pressures within a unified theoretical framework, and examining the development of integrated carbon management systems and supply chain-wide practices.