Article

Environmental Protection Tax and Corporate Green Innovation Persistence: Evidence from China

1
Business School, Hohai University, Nanjing 211100, China
2
School of Economics, Shanghai University of Finance and Economics, Shanghai 200433, China
*
Author to whom correspondence should be addressed.
Systems 2026, 14(10), 1267; https://doi.org/10.3390/systems14101267
Submission received: 17 August 2026 / Revised: 1 October 2026 / Accepted: 4 October 2026 / Published: 9 October 2026
(This article belongs to the Section Systems Practice in Social Science)

Highlights

Please indicate how your work links to systems science via your contributions to systems practice, theory, and/or methodology.
  • This study conceptualizes corporate green innovation persistence as firms’ ability to maintain green innovation activities across periods under the joint influence of external institutional inputs and internal operational processes.
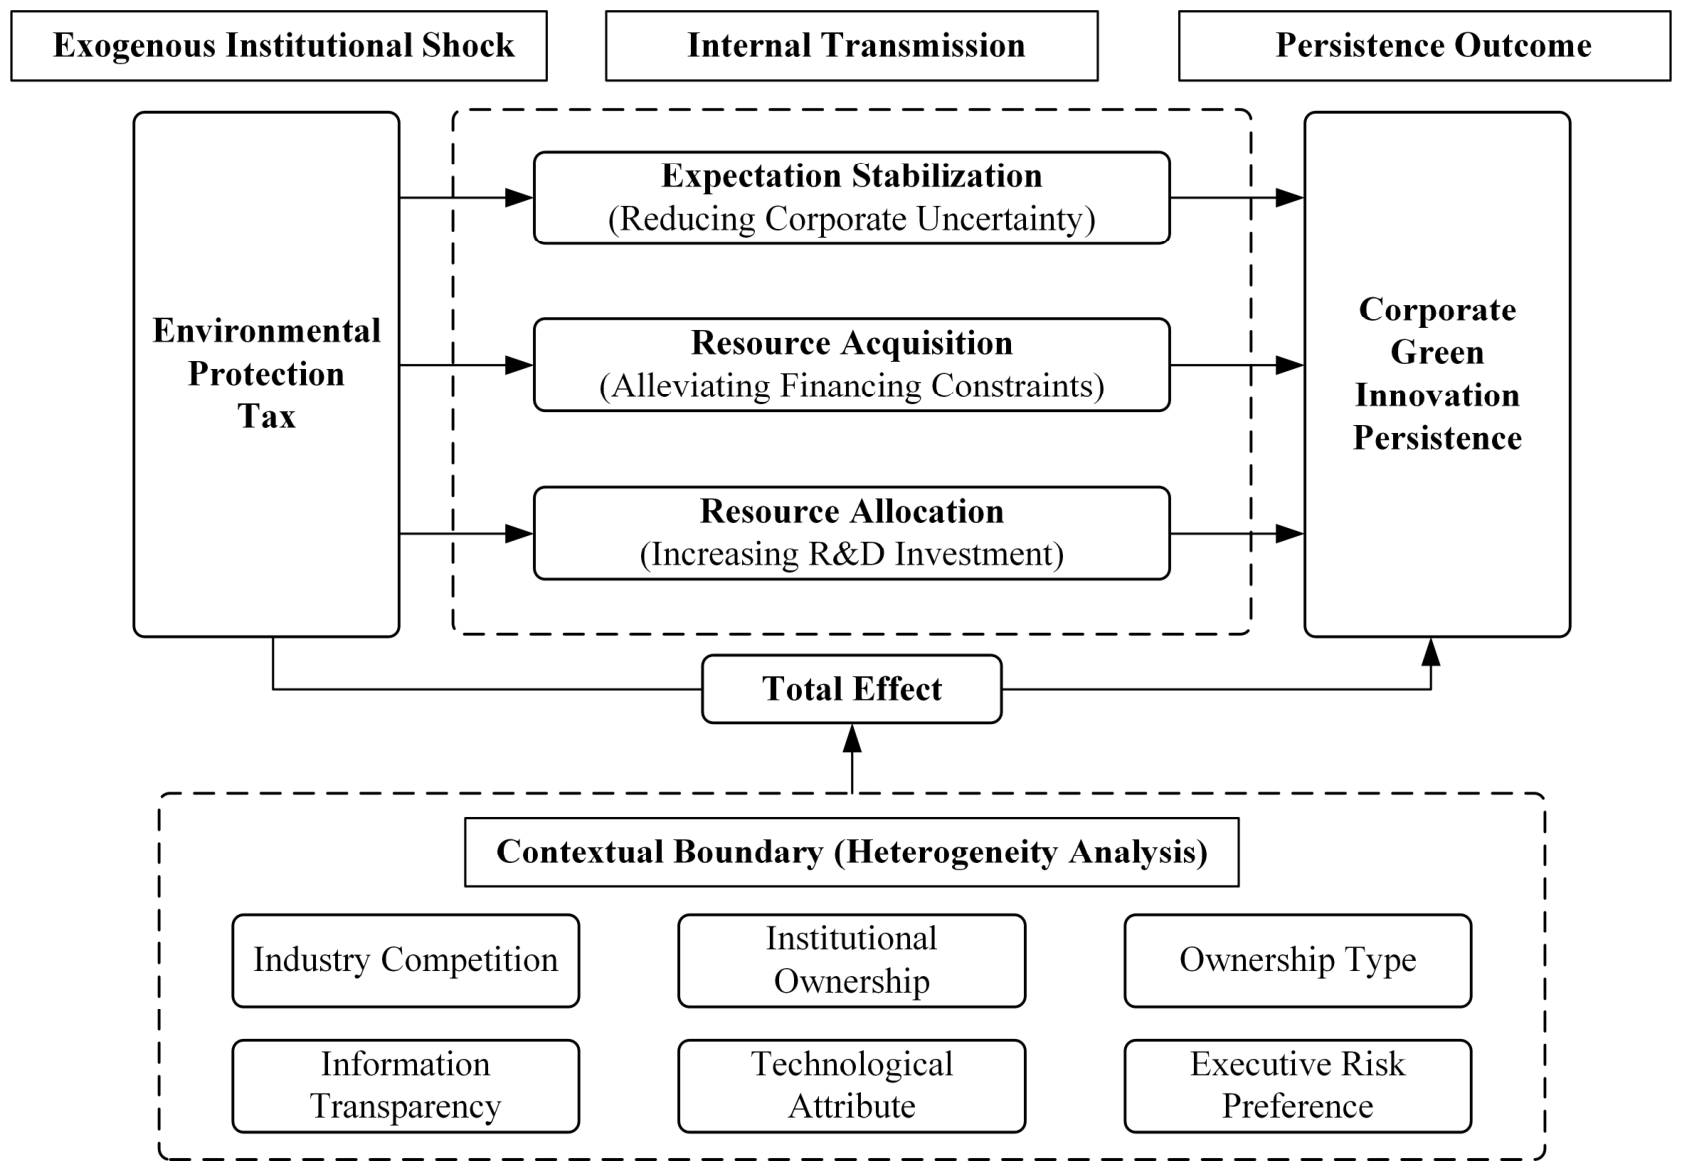
  • It develops a system-oriented analytical framework of “exogenous institutional shock–internal transmission–intertemporal persistent performance–contextual boundaries” to explain how environmental regulation affects firms’ long-term green innovation behavior.
What are the main findings and/or the implications of the main findings?
  • The environmental protection tax (EPT) significantly enhances corporate green innovation persistence. Mechanism tests show that the EPT significantly reduces firm uncertainty, eases financing constraints, and increases R&D investment, providing evidence consistent with the proposed expectation-stabilization, resource-access, and resource-allocation mechanisms.
  • Firms with lower industry competition, greater institutional investor ownership, state ownership, higher information transparency, non-high-tech attributes, and stronger executive risk-taking propensity are more affected by the policy, suggesting the need for differentiated policy support.

Abstract

Enhancing corporate green innovation persistence plays a vital role in shifting economic and social development toward greener, low-carbon models. This study treats the environmental protection tax (EPT) as an external institutional shock to the corporate green innovation system. Using data on Chinese A-share firms listed on the Shanghai and Shenzhen stock exchanges from 2014 to 2023, this study uses a difference-in-differences (DID) approach to estimate the impact of the EPT on corporate green innovation persistence and explore its underlying mechanisms. Corporate green innovation persistence is measured by combining the dynamic change in firms’ green innovation output with the current scale of their green innovation activities. The findings show that the EPT significantly enhances corporate green innovation persistence. Mechanism tests further show that the EPT significantly reduces firm uncertainty, eases financing constraints, and increases R&D investment, providing evidence consistent with the proposed expectation-stabilization, resource-access, and resource-allocation mechanisms. Heterogeneity analysis further reveals that the positive effect is more pronounced among firms facing lower industry competition, firms with greater institutional investor ownership, state-owned enterprises, firms with higher information transparency, non-high-tech firms, and firms whose executives exhibit a stronger risk-taking propensity. These results provide empirical evidence for strengthening the long-term innovation-guiding role of the EPT and offer policy insights into corporate sustainable development from a coordinated perspective of institutions, resources, and firm behavior.

1. Introduction

Amid the global shift toward low-carbon development, green innovation has become a key mechanism through which economic growth and environmental sustainability can be jointly advanced. The Paris Agreement’s emphasis on climate technology development and transfer, together with national policies supporting green technologies for net-zero transitions [1], has made green innovation a key component of global decarbonization. However, the transition to low-carbon development unfolds over an extended period [2]. Firms therefore need sustained green innovation rather than short-term or intermittent efforts to continuously develop and apply green technologies. As the largest economy among developing countries and a key contributor to international climate governance, China must simultaneously maintain economic growth and accelerate its transition to a low-carbon and green economy. Within the national economy, firms account for substantial resource use and pollutant emissions while also serving as important drivers of green innovation. However, statistical evidence shows that green innovation practices in China are characterized by broad participation but insufficient persistence. Among the 3906 listed firms observed from 2014 to 2023, nearly 60% had a maximum continuous green innovation period of no more than four years, while only 19.48% sustained green innovation for eight years or longer. Among firms that had engaged in green innovation, 36.37% experienced at least one innovation interruption. These facts suggest that firms have not yet established stable green innovation mechanisms. Instead, green innovation tends to be episodic or strategically driven [3,4], with clearly insufficient persistence. This constrains the deeper transformation of innovation outcomes and weakens their long-term support for the green and low-carbon transition. Sustainable development theory challenges short-termist environmental practices [5,6] and emphasizes a long-term orientation in sustainability-related innovation [7]. Meanwhile, the theory of time-compression diseconomies in innovation investment suggests that innovation capabilities and knowledge accumulation are process-dependent and cannot be rapidly developed through short-term intensive investment [8]. Therefore, the continuity of innovation investment is more critical than its scale or intensity.
Firms often struggle to pursue green innovation consistently on their own initiative due to its high complexity, lengthy development cycles, and substantial investment requirements [9]. Meanwhile, some firms exhibit a strong tendency toward market speculation, while neglecting long-term benefits and sustainable development goals. Therefore, guiding and supporting firms to sustain green innovation is now a central concern in promoting greener development across the economy. In response, China has undertaken a long process of institutional exploration. Although the earlier pollution discharge fee system achieved certain emission-reduction effects [10], its inconsistent enforcement standards and limited policy incentives [11] weakened its role in encouraging firms to undertake green innovation. China introduced the environmental protection tax (EPT) through legislation enacted on 25 December 2016, with the tax taking effect on 1 January 2018. Grounded in the polluter-pays principle, the EPT uses taxation to address negative externalities arising from economic development [12], combining legal constraints with policy incentives. Its implementation and continuous refinement represent a key step in modernizing China’s environmental governance system and provide institutional support for firms to maintain green innovative activities. However, whether the effects of the EPT persist over time remains insufficiently examined. Accordingly, the EPT reform is used as a quasi-natural experiment, and its effect on corporate green innovation persistence is estimated using a difference-in-differences (DID) design.
Existing studies generally examine corporate green innovation along two dimensions: quantity and quality. In terms of green innovation quantity, scholars commonly use the number of green patent applications [13] or granted green patents [14] as core measures to examine how factors such as environmental regulation [15], digital transformation [16], and ESG performance [17] affect corporate green innovation output. Studies on environmental regulation have produced mixed findings, including the Porter effect [18] and the crowding-out effect [19]. In terms of green innovation quality, existing studies have gradually moved beyond the limitations of quantity-oriented measures. Using indicators such as green patent citations [20,21] and high-value green patents [22], these studies further explore pathways for improving green innovation quality [23], seeking to address the practical dilemma in which green innovation emphasizes quantity over quality [24]. However, most of this literature evaluates green innovation through static outcomes, paying relatively limited attention to whether innovation activities can be sustained over time. Green innovation persistence, by contrast, captures firms’ ability to maintain green innovation activities across periods and thus reflects the continuity of long-term technological accumulation. Recent studies have begun to investigate the determinants of green innovation persistence, highlighting the roles of corporate ESG performance and green finance [25,26]. However, the role of formal environmental regulation as an institutional driver of green innovation persistence remains insufficiently understood. In particular, existing research on the EPT has largely focused on the level of green innovation, leaving open the question of whether the policy can facilitate firms’ transition from episodic green innovation to persistent green innovation.
Based on the above considerations, the empirical analysis draws on a sample of Chinese A-share listed firms on the Shanghai and Shenzhen stock exchanges covering 2014–2023. It examines whether the EPT, as an exogenous institutional shock, can promote firms’ ability to sustain green innovation activities over time. Empirical evidence reveals a significant increase in this persistence following the EPT. Mechanism tests further show that the EPT significantly reduces firm uncertainty, eases financing constraints, and increases R&D investment, providing evidence consistent with the three proposed mechanisms. Heterogeneity analysis shows that firms facing lower industry competition, firms with greater institutional investor ownership, state-owned enterprises, firms with higher information transparency, non-high-tech firms, and firms whose executives exhibit stronger risk-taking propensity are more likely to benefit from the EPT on corporate green innovation persistence.
This study makes three main contributions. First, this study contributes to the literature on corporate green innovation persistence by identifying the EPT as an institutional driver of persistent green innovation. Unlike prior studies focusing on firm-level capabilities and resource conditions [25,26], this study highlights the role of formal environmental regulation in shaping firms’ transition toward persistent green innovation. Second, prior research has mainly examined how the EPT affects corporate performance [27], pollution and carbon emission reduction [28,29], and the level of green innovation [30], with comparatively less attention paid to its influence on firms’ long-term behavior. From a firm-level behavioral perspective, this paper focuses on green innovation persistence to examine whether the EPT can encourage firms to maintain green innovation over the long term. This perspective broadens the literature on the economic consequences of environmental regulation, sheds further light on its lasting implications, and provides additional evidence for policy evaluation. Third, drawing on a systems-thinking perspective on sustainability transformation [31], this study develops a systemic framework linking the EPT as an external institutional shock with firms’ internal responses and persistent green innovation outcomes. Specifically, it examines expectation formation, resource access, and resource allocation as internal transmission dimensions, while identifying heterogeneous firm conditions that shape the effectiveness of the policy.
The remainder of this paper is organized as follows. Section 2 outlines stylized facts on green innovation persistence and derives the research hypotheses. Section 3 describes the data sources and research design. Section 4 reports the baseline estimates together with robustness tests. Section 5 provides further analysis, including the results of mechanism tests and heterogeneity analysis. Section 6 concludes the paper, proposes policy implications, and discusses research limitations and future directions.

2. Stylized Facts and Research Hypotheses

2.1. Stylized Facts on Corporate Green Innovation Persistence

Whether firms can sustain green innovation as a long-term and stable behavior has become an important criterion for evaluating the quality of corporate green innovation [26,32]. To depict the stylized facts of corporate green innovation persistence, this study uses the final sample employed in the empirical analysis. It measures whether a firm engages in green innovation in a given year based on whether the sum of its green invention patent applications and green utility model patent applications is greater than zero.
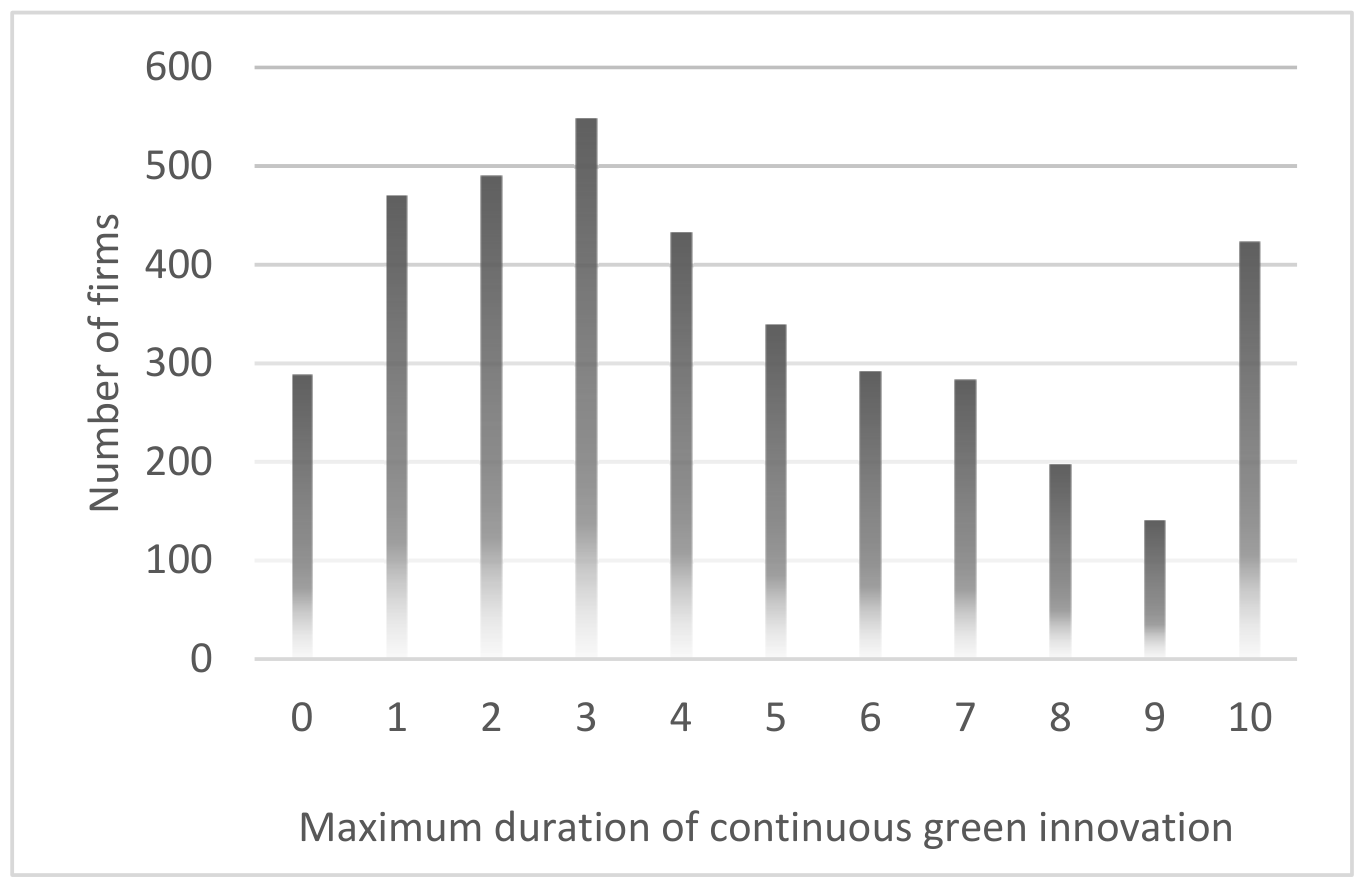
First, in terms of green innovation duration, corporate green innovation is more often characterized by episodic continuity, while firms’ long-term capacity for sustained innovation remains insufficient. The average maximum duration of continuous green innovation among the sample firms is 4.44 years. Furthermore, Figure 1 presents the distribution of the maximum duration of continuous green innovation among the sample firms. As shown in Figure 1, corporate green innovation persistence exhibits substantial heterogeneity: 57.09% of firms have a maximum continuous green innovation period of no more than four years, while only 19.48% sustain green innovation for eight years or longer. This result suggests that although green innovation activities are widely observed among firms, most have not yet developed a long-term and stable capacity for green innovation.
Second, in terms of continuity after firms initiate green innovation, interruptions in innovation activities cannot be overlooked. Among the 3618 firms that had engaged in green innovation, 1316 experienced at least one interruption in green innovation, accounting for 36.37%. Furthermore, among firms that experienced interruptions, the average number of interruptions was approximately 1.24. This finding suggests that even when firms have established a foundation for green innovation, the continuous advancement of their innovation activities still faces substantial instability. Firms may reduce related innovation activities due to resource constraints [33], resulting in insufficient green innovation persistence.
Finally, in terms of temporal distribution, corporate green innovation exhibits a clear intermittent pattern. Focusing on firms with non-continuous green innovation records, the average time span between two green innovation records is 2.44 years, implying an average gap of approximately 1.44 years without green innovation records. This indicates that once firms experience a break in green innovation activities, recovery often requires a certain time interval, and green innovation still shows intermittent characteristics among some firms.
Taken together, the above analysis suggests that green innovation activities among Chinese listed firms are not simply absent. Rather, they are characterized by frequent episodic continuity, insufficient long-term persistence, pronounced interruptions among some firms, and delayed recovery after innovation gaps occur. Compared with one-off green innovation behavior, firms’ ability to maintain green innovation persistence urgently needs to be improved. The above stylized facts characterize corporate green innovation persistence from the perspective of behavioral continuity, focusing on the duration, interruption, and temporal spacing of green innovation activities. They provide an intuitive description of the persistence problem rather than serving as the formal measure used in the subsequent empirical analysis. Therefore, against the current backdrop of green development, investigating the major elements affecting the persistence of corporate green innovation is crucial. In particular, as the environmental governance system continues to improve, whether environmental policies can promote sustained and stable green innovation behavior through institutional pressure or incentive mechanisms has become an important research question.

2.2. Theoretical Analysis and Research Hypotheses

Grounded in open systems theory, institutional theory, and dynamic capabilities theory, this study defines corporate green innovation persistence as a dynamic outcome generated through the interaction between the external institutional environment and firms’ internal operational processes. Open systems theory suggests that firms are not economic entities operating in isolation; rather, they are continuously influenced by inputs from the external environment and generate corresponding behavioral outputs through internal transformation processes [34]. Institutional theory further indicates that formal institutional arrangements can influence firms’ strategic choices through rule-based constraints and legitimacy pressures [35,36]. Dynamic capabilities theory argues that firms must continuously reorganize and allocate resources from both internal and external sources as environmental conditions change to maintain long-term competitive advantage [37]. Accordingly, as an exogenous institutional shock, the EPT promotes the transition of corporate green innovation from episodic behavior to persistent behavior by influencing internal operational links such as stabilizing firms’ expectations, improving resource access, and optimizing resource allocation.

2.2.1. The EPT and Corporate Green Innovation Persistence

The EPT can provide institutional support for corporate green innovation persistence by combining regulatory pressure with policy incentives [38,39]. From the perspective of external pressure, the EPT affects corporate green innovation persistence mainly through environmental cost pressure and stakeholder pressure. According to externality theory, environmental pollution caused by firms’ short-termist behavior generates negative externalities, requiring the government to internalize external costs through taxation [40,41]. Under the EPT, firms’ cost structure extends beyond conventional production expenses to include pollution-related costs, such as environmental governance expenditures and tax payments [42]. Continued reliance on energy-intensive and highly polluting production may generate temporary savings in conventional production costs, but these gains can be offset by higher environmental costs. Over time, such production patterns are therefore likely to increase firms’ overall cost burden and conflict with the objective of profit maximization. Firms consequently have an incentive to pursue green innovation to improve production efficiency and control costs over the long term. According to stakeholder theory, the implementation of the EPT increases the visibility of firms’ environmental performance to stakeholders, thereby strengthening external monitoring. This makes it difficult for firms to obtain long-term support through short-term strategic innovation, thus creating an external pressure mechanism for sustained innovation.
From the perspective of external incentives, the EPT promotes corporate green innovation persistence through regulatory incentives and tax preferences. According to the Porter Hypothesis, environmental regulation and firm competitiveness are not necessarily in a zero-sum relationship. Well-designed environmental regulation can stimulate firms’ innovation activities, thereby achieving both environmental improvement and enhanced competitiveness [43]. In the process of complying with environmental regulations, firms can achieve innovation offsets by improving resource utilization efficiency and reducing pollution emissions, thereby partially or fully offsetting compliance costs. At the same time, firms that respond proactively to regulation and develop innovation advantages may gain first-mover advantages in competitive markets. In addition, the EPT follows the principle of “more emissions, higher taxes; fewer emissions, lower taxes; and no emissions, no taxes,” while also incorporating tax reduction and exemption policies. These arrangements enable firms to obtain long-term policy benefits as they continue to undertake green innovation. Therefore, by integrating regulatory pressure with policy incentives, the EPT provides institutional support for green innovation persistence. Accordingly, the following hypothesis is proposed:
Hypothesis 1. 
The EPT improves corporate green innovation persistence.

2.2.2. Three Proposed Systemic Transmission Mechanisms

The formation of corporate green innovation persistence depends on stable external expectations, sufficient resource support, and efficient resource allocation. From a systems perspective, green innovation persistence emerges from the interplay of multiple forces, including external institutional constraints, the capital market environment, and firms’ internal resource-allocation decisions. Accordingly, this study systematically analyzes how the EPT shapes corporate green innovation persistence via three channels: firm uncertainty, financing constraints, and R&D investment. Firm uncertainty captures the expectation-formation dimension, financing constraints reflect firms’ access to resources for sustained investment, and R&D investment represents the allocation of resources to innovation activities. From an open-systems perspective, these dimensions perform complementary functions within firms’ internal transformation process. Firms form expectations about external conditions, obtain the resources needed for innovation, and allocate those resources to R&D activities. Together, these functions characterize the internal process through which firms respond to external institutional shocks and may shape persistent innovation behavior. They therefore constitute interrelated components of the corporate innovation system.
These dimensions are also theoretically interconnected. Sustainable innovation can be understood as a complex adaptive process in which organizational components interact rather than operate independently [44]. In particular, expectation formation is related to resource access because greater uncertainty can raise firms’ cost of capital and tighten external financing conditions [45]. Resource access is further related to resource allocation because firms’ financing conditions affect their capacity to sustain R&D expenditure [46]. Taken together, these relationships suggest that expectation formation, resource access, and resource allocation constitute interconnected internal responses through which firms adapt to external institutional shocks. Within the systems framework, these links illustrate the conceptual interdependence among firms’ internal responses to external institutional shocks. The empirical analysis that follows examines the three theoretically proposed mechanism dimensions separately by testing whether the EPT affects the corresponding intermediate outcomes.
The sustained implementation of green innovation depends on a stable institutional environment and predictable return prospects [47]. Firm uncertainty refers to uncertainty regarding firms’ future operating conditions, costs, and expected returns, which may arise from multiple sources, including changes in the institutional and policy environment. As uncertainty rises, firms face greater volatility in expected returns, which discourages commitments to long-term innovation projects [47,48]. From a real options perspective, elevated uncertainty increases the value of delaying green innovation investment until additional information becomes available, encouraging firms to adopt a cautious stance [49], thereby weakening corporate green innovation persistence. As an important institutional arrangement in China’s environmental governance system, the EPT can reduce firm uncertainty through the dual mechanisms of institutional stability and policy signaling. On the one hand, the EPT can temporarily raise businesses’ tax obligations and pollution control expenses, but its legalized, standardized, and stable institutional features help reduce uncertainty regarding firms’ future operating conditions and environmental compliance costs. Institutional economics suggests that market participants are concerned not only with institutional constraints themselves but also with the stability and predictability of the institutional environment [50,51]. Compared with administrative environmental regulations that are frequently adjusted or involve substantial enforcement discretion, the EPT legally clarifies firms’ pollution emission costs and the boundaries of their environmental responsibilities. This enables firms to more accurately assess future operating costs and investment returns, thereby reducing uncertainty surrounding future operating conditions and environmental regulation. On the other hand, the policy sends a clear market signal about the government’s continued commitment to ecological and environmental governance. Firms can therefore better anticipate the future direction of environmental regulation and adjust their long-term development strategies accordingly. For the capital market, stable and clear institutional arrangements help reduce investors’ divergent perceptions of firms’ future business prospects and mitigate stock price volatility arising from expectation differences. Greater stability in firms’ expectations encourages the continuous advancement of green innovation activities. Accordingly, the following hypothesis is proposed:
Hypothesis 2a. 
The EPT improves the level of corporate green innovation persistence by reducing firm uncertainty.
Green innovation persistence requires sustained and reliable financial resources that enable firms to seize market opportunities [26]. However, green innovation is characterized by substantial investment requirements, elevated risks, and information asymmetry, which severely constrain firms’ internal and external financing capacity [52]. The EPT can systematically ease financing constraints and establish a financial support mechanism for green innovation persistence. First, it improves access to internal resources and alleviates internal financing constraints. Through the pressure and incentive mechanisms embedded in tax policy, the EPT encourages firms to adopt green production practices. In this process, firms can not only reduce operating costs through tax preferences but also attract green consumers by building a market reputation for environmental compliance, thereby strengthening their capacity for internal profit accumulation [53]. Second, it improves access to external resources and alleviates external financing constraints. The EPT imposes mandatory requirements on firms’ pollutant emission information, effectively reducing the information asymmetry faced by investors and enabling them to more accurately assess firms’ investment value before making investment decisions. In sum, by activating internal resources and attracting external resources, the EPT alleviates firms’ internal and external financing constraints, thereby promoting corporate green innovation persistence. Accordingly, the following hypothesis is proposed:
Hypothesis 2b. 
The EPT improves the level of corporate green innovation persistence by easing firms’ financing constraints.
New growth theory regards technological progress as an important driver of economic growth [54], while technological progress requires firms to invest human and financial resources in R&D activities [55,56]. R&D investment provides an important resource base for innovation activities. Sustained R&D inputs facilitate technological iteration and process improvement, thereby creating favorable conditions for firms to engage in green innovation over the long term [57]. The short-term orientation of resource allocation is a key factor constraining green innovation persistence. Through cost-forcing and benefit-guidance mechanisms, the EPT encourages firms to allocate resources more efficiently and strengthen their R&D resource commitment. First, the EPT imposes additional cost pressure on high-emission and energy-intensive production modes, forcing firms to reallocate resources originally devoted to traditional business activities toward R&D and technological upgrading, thereby strengthening the resource base for sustained green innovation. Second, the technological advantages generated by green innovation can create an innovation compensation effect, which strengthens firms’ willingness to maintain R&D resource commitments. In this process, firms gradually increase their financial and human-resource commitment to R&D, transforming R&D investment from a short-term behavior into sustained strategic commitment and thereby supporting the evolution of green innovation from intermittent activities to persistent practices. Accordingly, the following hypothesis is proposed:
Hypothesis 2c. 
The EPT improves the level of corporate green innovation persistence by encouraging firms to increase R&D investment.
Figure 2 illustrates the logical framework of this study.

3. Methodology

3.1. Data

This study constructs a panel sample of Chinese A-share firms listed in Shanghai and Shenzhen over the period 2014–2023. According to the Guidelines for the Industry Classification of Listed Companies revised by the China Securities Regulatory Commission in 2012, and following the approach of Pan et al. [58], 15 industries are defined as heavy-polluting industries. Firms classified into these industries before the implementation of the EPT form the treatment group, while the remaining firms serve as the control group. The treatment status is kept unchanged throughout the sample period. The raw sample is screened by removing observations with missing data, firms designated as ST, ST*, or PT, and financial firms. All continuous variables are then winsorized at the 1st and 99th percentiles. After all sample restrictions, the final sample consists of 3906 firms, including 877 heavily polluting firms in the treatment group and 3029 non-heavily polluting firms in the control group. Firm-level patent information is mainly obtained from the China National Intellectual Property Administration and the Chinese Research Data Services Platform (CNRDS), while other firm-level data are collected from the China Stock Market & Accounting Research Database (CSMAR).

3.2. Model Setting

The effect of the EPT on corporate green innovation persistence is estimated using the following DID specification:
GIPi,t = α0 + α1Treati × Postt + α2Controlsi,t + γi + μt + εi,t
where GIPi,t denotes the level of green innovation persistence of firm i in year t; Treati is a treatment-group dummy variable that equals 1 if the firm belongs to the treatment group affected by the policy and 0 otherwise; Postt is a policy dummy variable that equals 1 from 2018 onward and 0 otherwise; the core explanatory variable is Treati × Postt, and its coefficient α1 captures the captures the differential effect of the EPT on corporate green innovation persistence between heavily polluting firms and non-heavily polluting firms; Controlsi,t denotes a set of control variables; γi represents firm fixed effects; μt represents year fixed effects; and εi,t is the random error term. Standard errors are clustered at the firm level to account for potential serial correlation and heteroskedasticity within firms over time, consistent with related firm-level DID studies [59,60].

3.3. Variables

3.3.1. Explained Variable

Corporate green innovation persistence (GIP). Building on prior studies on innovation persistence [61,62], this study measures corporate green innovation persistence by combining the dynamic change in firms’ green innovation output with its current scale. This measure is intended to capture the dynamic continuity of green innovation behavior rather than merely whether innovation occurs in consecutive years. The dynamic-change component reflects the maintenance of green innovation relative to previous periods, while the scale component captures the extent of firms’ ongoing green innovation engagement. Specifically, the total number of green patent applications in years t and t − 1 is divided by the corresponding total in years t − 1 and t − 2. This ratio captures the relative change in green innovation output between two adjacent rolling periods. It is then multiplied by the total number of green patent applications in years t and t − 1 to account for the current scale of green innovation activities. The detailed formula is as follows:
GIP i , t = GPAT i , t + GPAT i , t − 1 GPAT i , t − 1 + GPAT i , t − 2 × ( GPAT i , t + GPAT i , t − 1 )
where GPATi,t, GPATi,t−1, and GPATi,t−2 denote the number of green patent applications filed by firm i in year t, year t − 1, and year t − 2, respectively, including both invention patents and utility model patents. When no green patents are recorded in either of the two preceding years, the denominator equals zero; such cases are treated as missing values and excluded from the analysis. Larger GIP values correspond to stronger corporate green innovation persistence.

3.3.2. Explanatory Variable

Implementation of the EPT (Treat × Post). A group dummy variable, Treat, is constructed, which equals 1 if a firm is classified as a heavily polluting firm and 0 otherwise. A year dummy variable, Post, is also constructed, with 1 January 2018 defined as the policy implementation date; Post equals 1 for the implementation year and subsequent years, and 0 otherwise. The explanatory variable for the implementation of the EPT is therefore the interaction term between the group dummy variable Treat and the year dummy variable Post.

3.3.3. Control Variables

Following prior studies, the analysis controls for firm size (Size), operating age (Age), profitability (ROA), capital intensity (Density), firm value (TobinQ), board size (Board), CEO duality (Dual), the proportion of independent directors (Indr), ownership concentration (Top1), and female executives (Gender). Detailed definitions and measurement procedures are reported in Table 1.

4. Empirical Results

4.1. Descriptive Statistical Analysis

Descriptive statistics for the key variables are reported in Table 2. Corporate green innovation persistence takes values between 0.000 and 792.751, with an average of 47.572 and a median value of 0.000. The clear gap between the median and the average suggests a right-skewed distribution. In other words, green innovation persistence remains limited for the majority of firms, whereas a few observations with high values pull up the average. In addition, the standard deviation of this variable is 108.531, exceeding its mean value, which suggests substantial cross-firm heterogeneity in corporate green innovation persistence.

4.2. Baseline Regression Results

Table 3 reports the baseline estimates of the EPT effect on corporate green innovation persistence. Column (1) contains only the EPT term, while firm and year fixed effects are introduced in Column (2), and Column (3) additionally includes control variables. The coefficient on Treat × Post remains positive and statistically significant at the 1% level in every specification. In economic terms, firms affected by the policy experienced a 10.02-unit increase in corporate green innovation persistence, equivalent to 21.1% of the sample mean and 9.2% of the standard deviation. Overall, the evidence confirms a significant positive effect of the EPT and therefore supports Hypothesis 1.

4.3. Robustness Checks

4.3.1. Parallel Trend Test

The model for the parallel trends test is constructed as follows:
GIP i , t = α 0 + ∑ k = − 4 5 β k × Treat i × Period k + α 2 Controls i , t + γ i + μ t + ε i , t
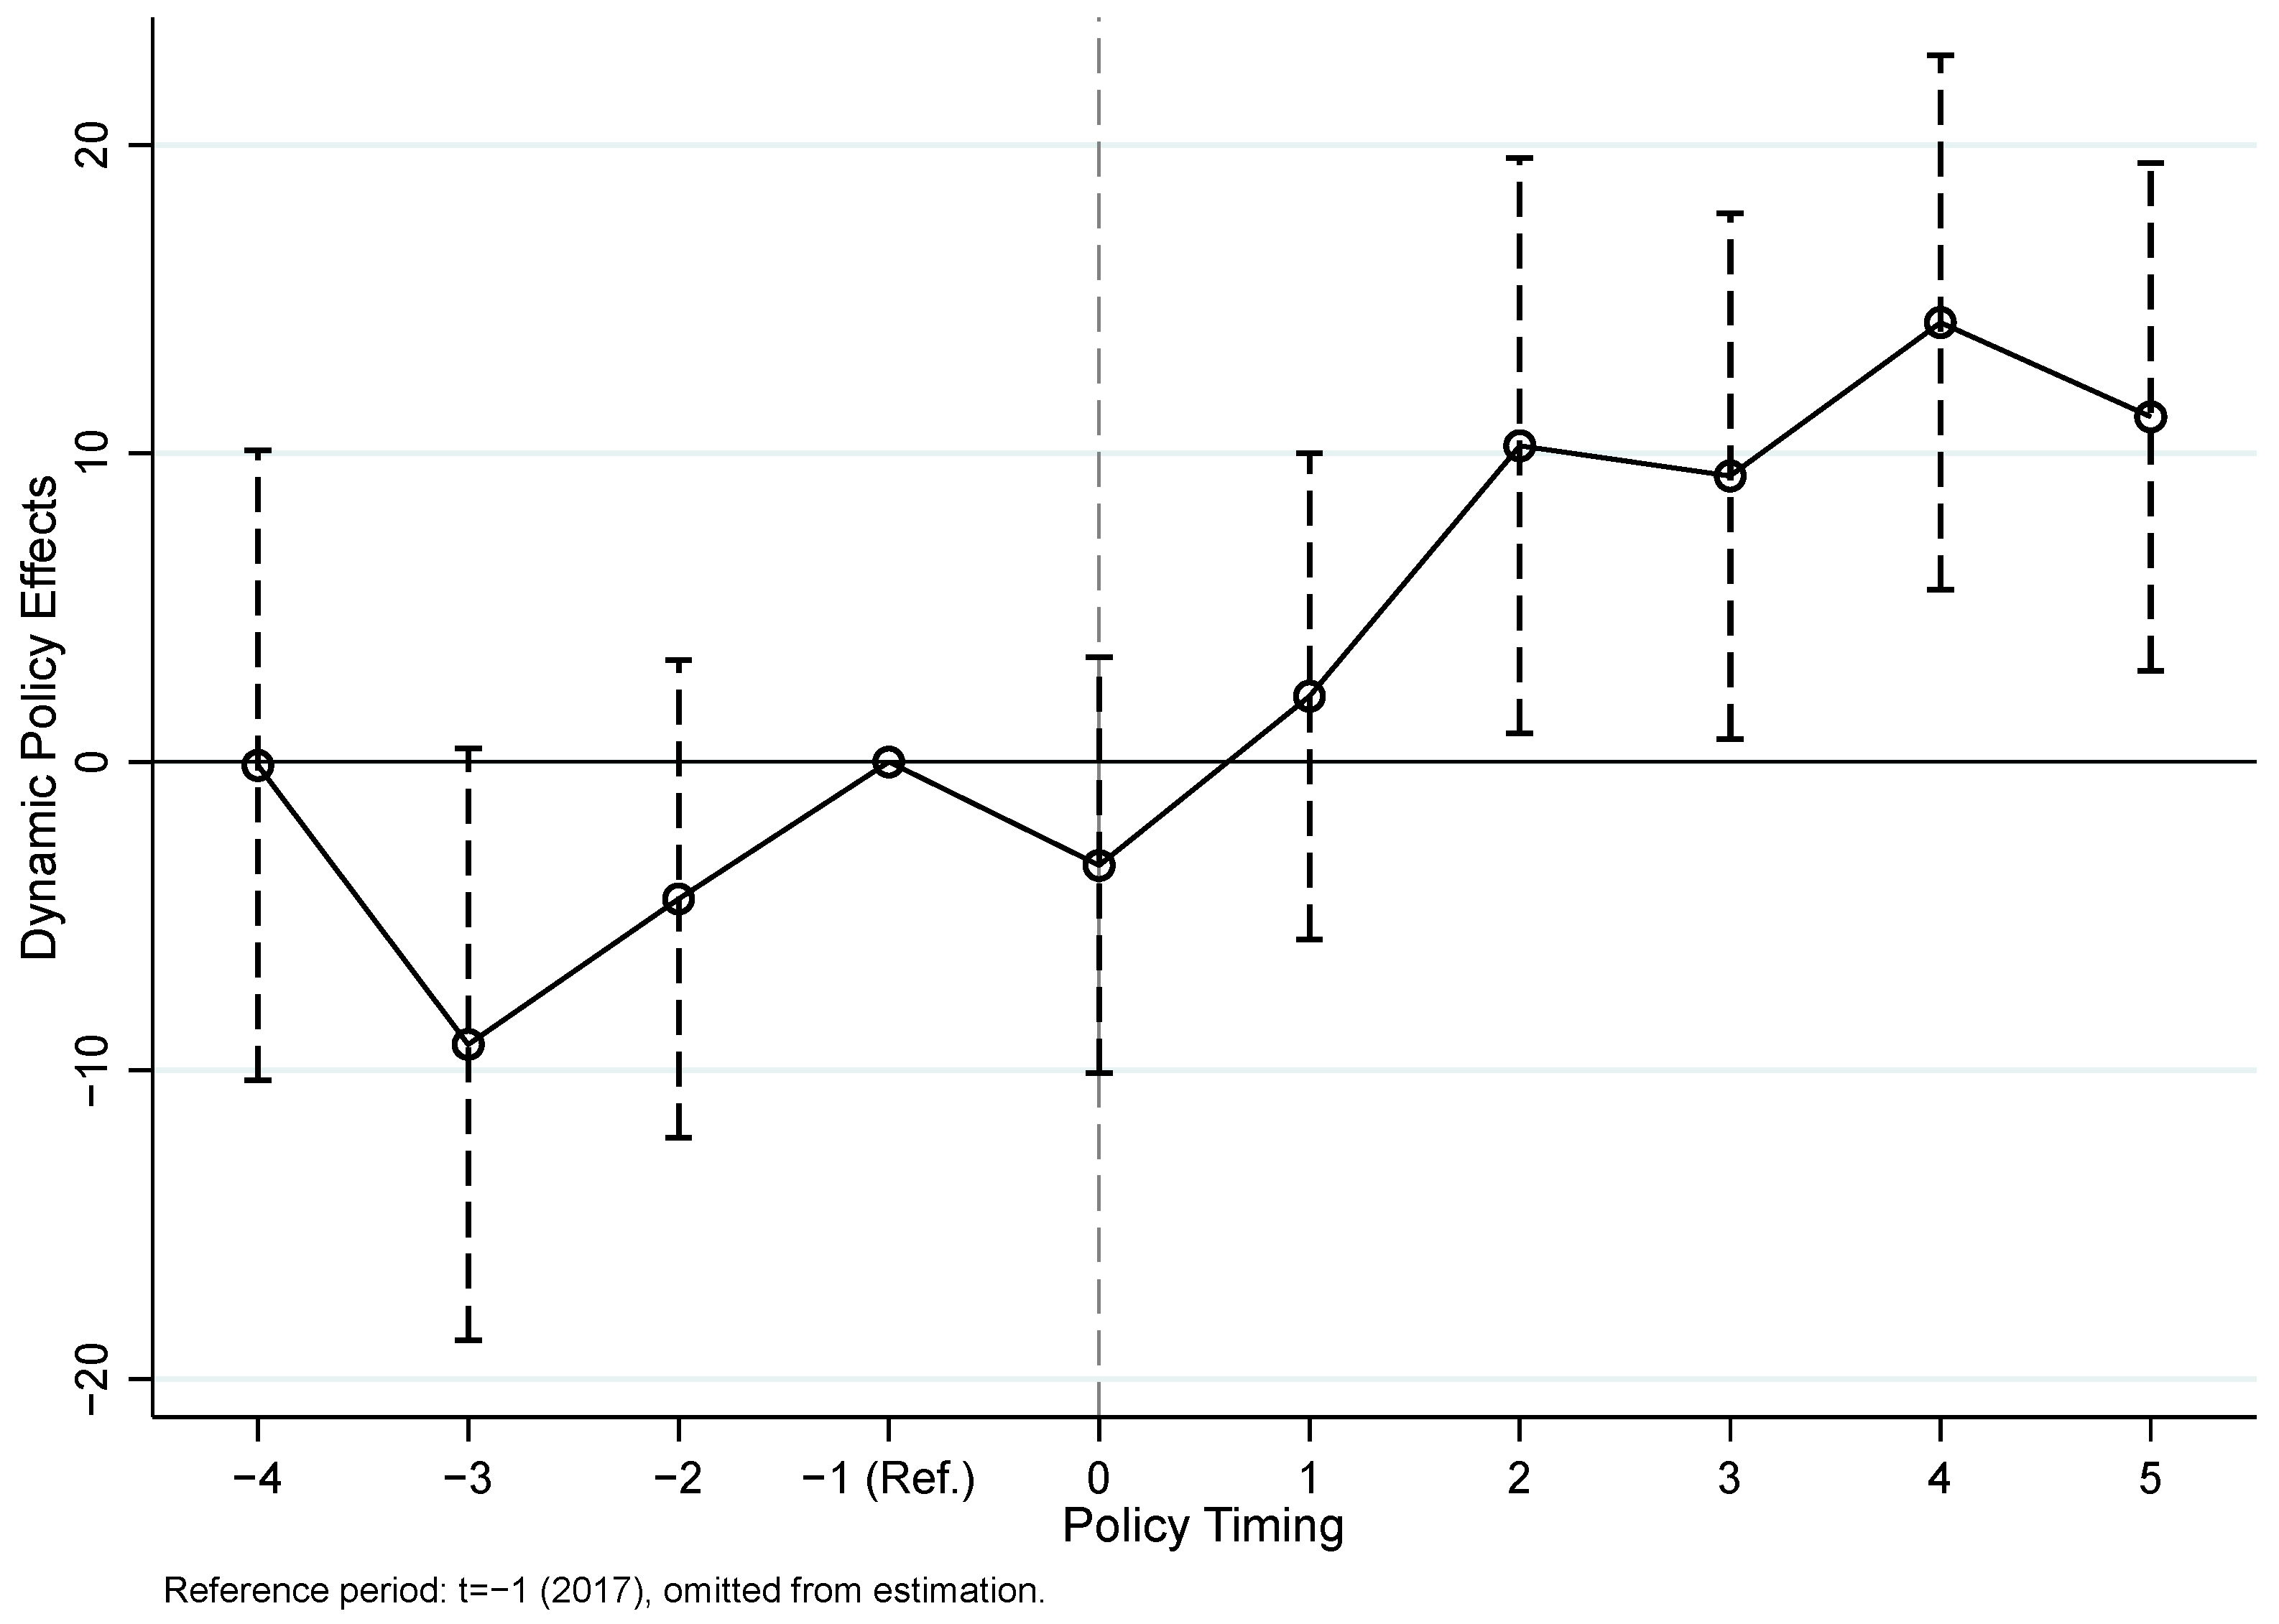
where Periodk denotes a set of event-time dummy variables, covering pre_4, pre_3, and pre_2 before the implementation of the EPT, current in the implementation year, and post_1 to post_5 after policy implementation. The period immediately preceding the EPT implementation (2017, t − 1) is used as the reference period. Treati × Periodk is the interaction term between the treatment group and each event-time dummy. βk captures the average difference between the treatment and control groups in period k. The meanings of Controlsi,t, γi, μt, and εi,t are the same as those in Equation (1). As shown in Figure 3, the estimated coefficients βk for all pre-treatment periods are statistically indistinguishable from zero. A joint F-test also fails to reject the null hypothesis that these coefficients are jointly equal to zero at the 5% level (F (3, 3905) = 2.41, p = 0.0651). Overall, there is no strong evidence of systematic differential pre-trends between the treatment and control groups. In the second year after the EPT was introduced, the estimated coefficient βk becomes statistically significant and remains positive thereafter. This delayed effect may reflect the time required for firms to adapt to the new tax regime and translate regulatory incentives into sustained green innovation activities, in line with previous evidence that environmental regulation may affect innovation with a lag [63,64]. This is consistent with the baseline regression results.

4.3.2. Placebo Tests

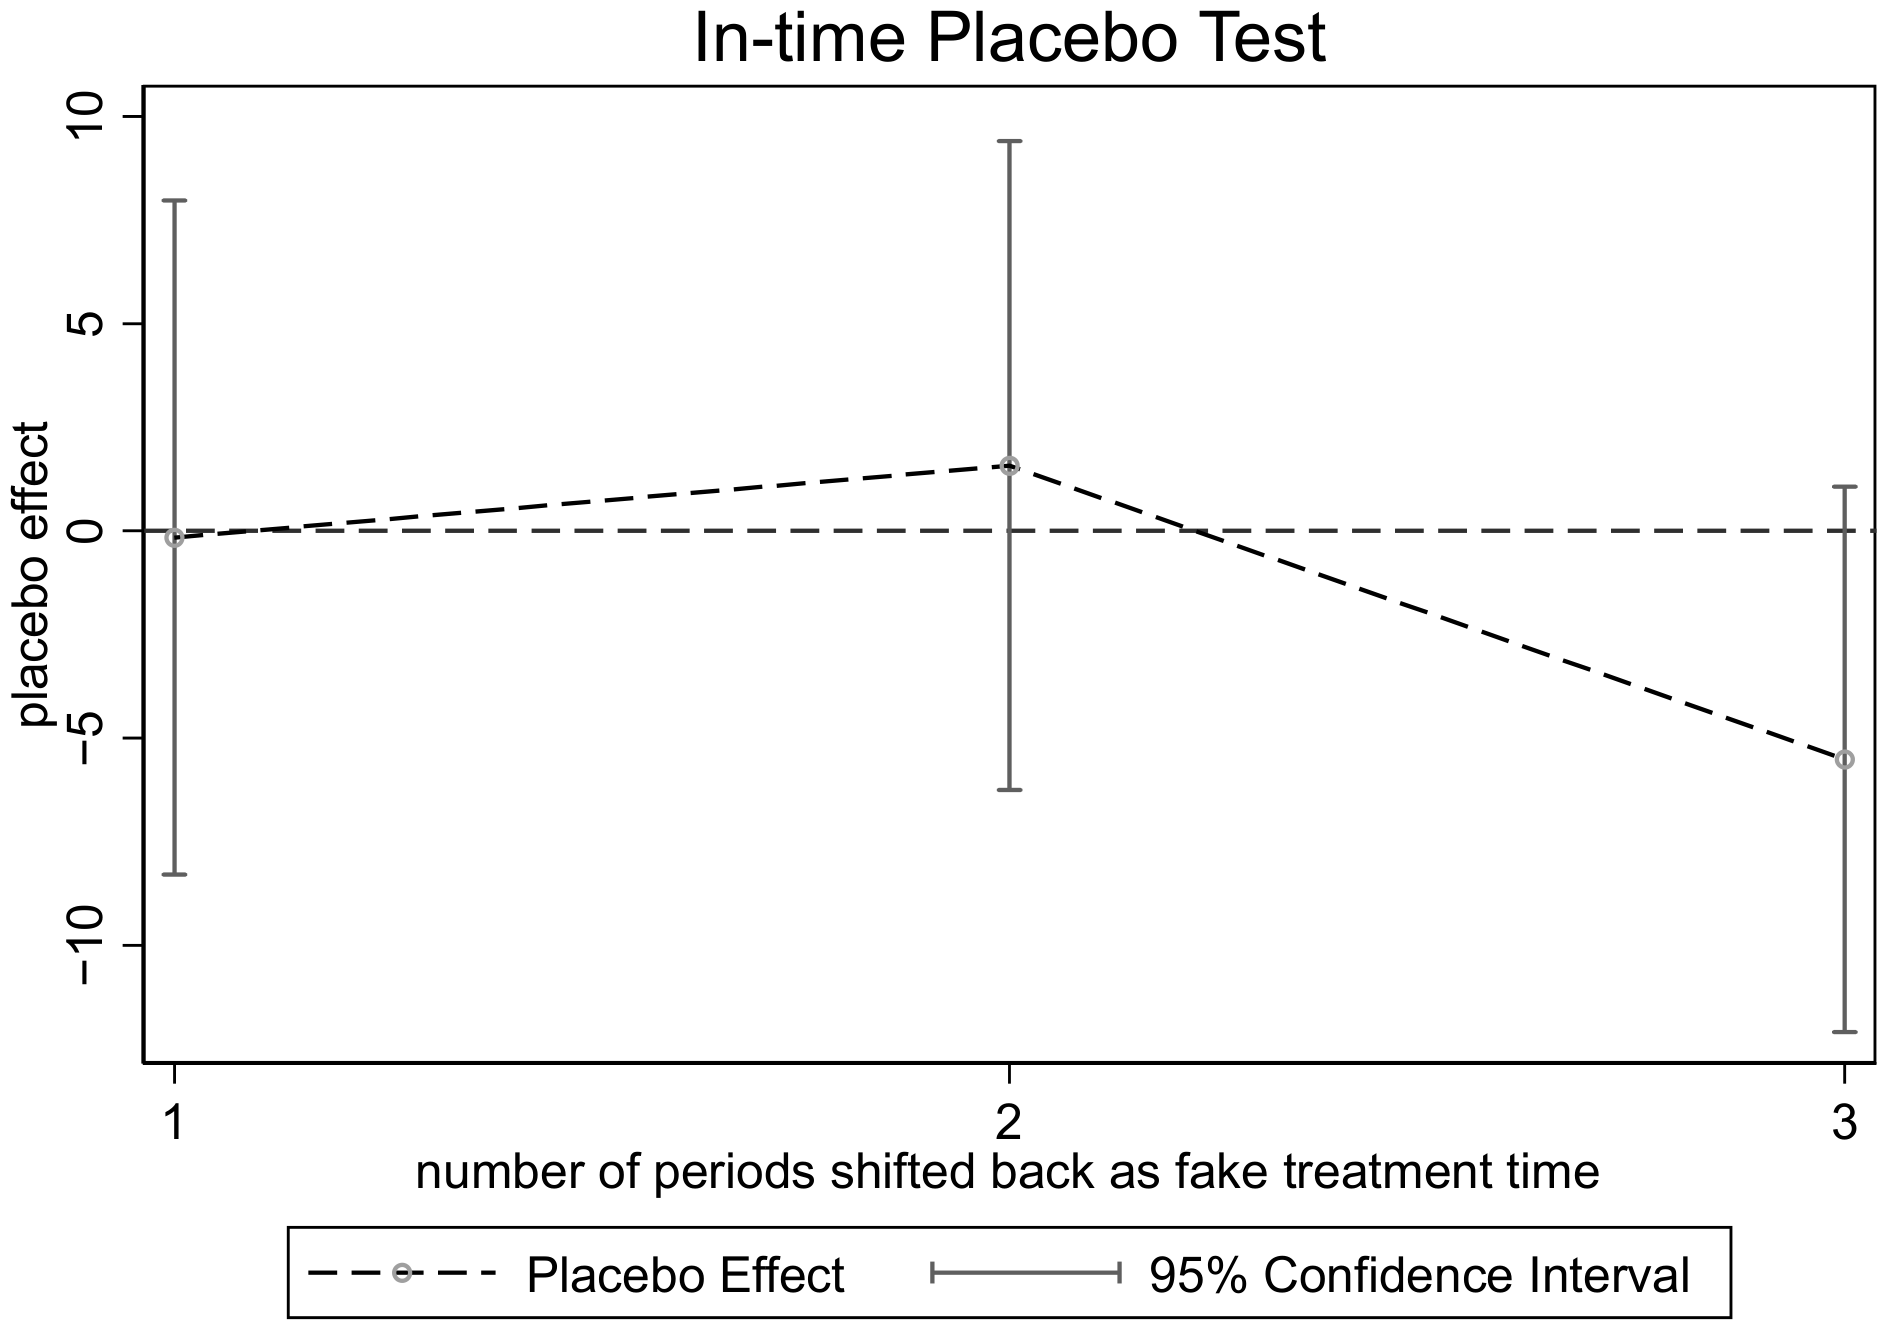
Following Chen et al. [65], this study conducts in-time, in-space, and mixed placebo tests. First, for the in-time placebo test, each pre-treatment periods except the first period are used as a pseudo-treatment period. Specifically, the policy implementation year is artificially set one to three years earlier, with 2015, 2016, and 2017 treated as pseudo-treatment years for DID estimation. Table 4 presents the estimation findings. The estimated placebo effects for all fictitious treatment years are statistically insignificant, indicating that the null hypothesis of no placebo effect cannot be rejected. More intuitively, Figure 4 presents the 95% confidence intervals of the estimates corresponding to each pseudo-treatment year. All intervals include zero, further confirming that the placebo effects are insignificant and that this study passes the in-time placebo test.
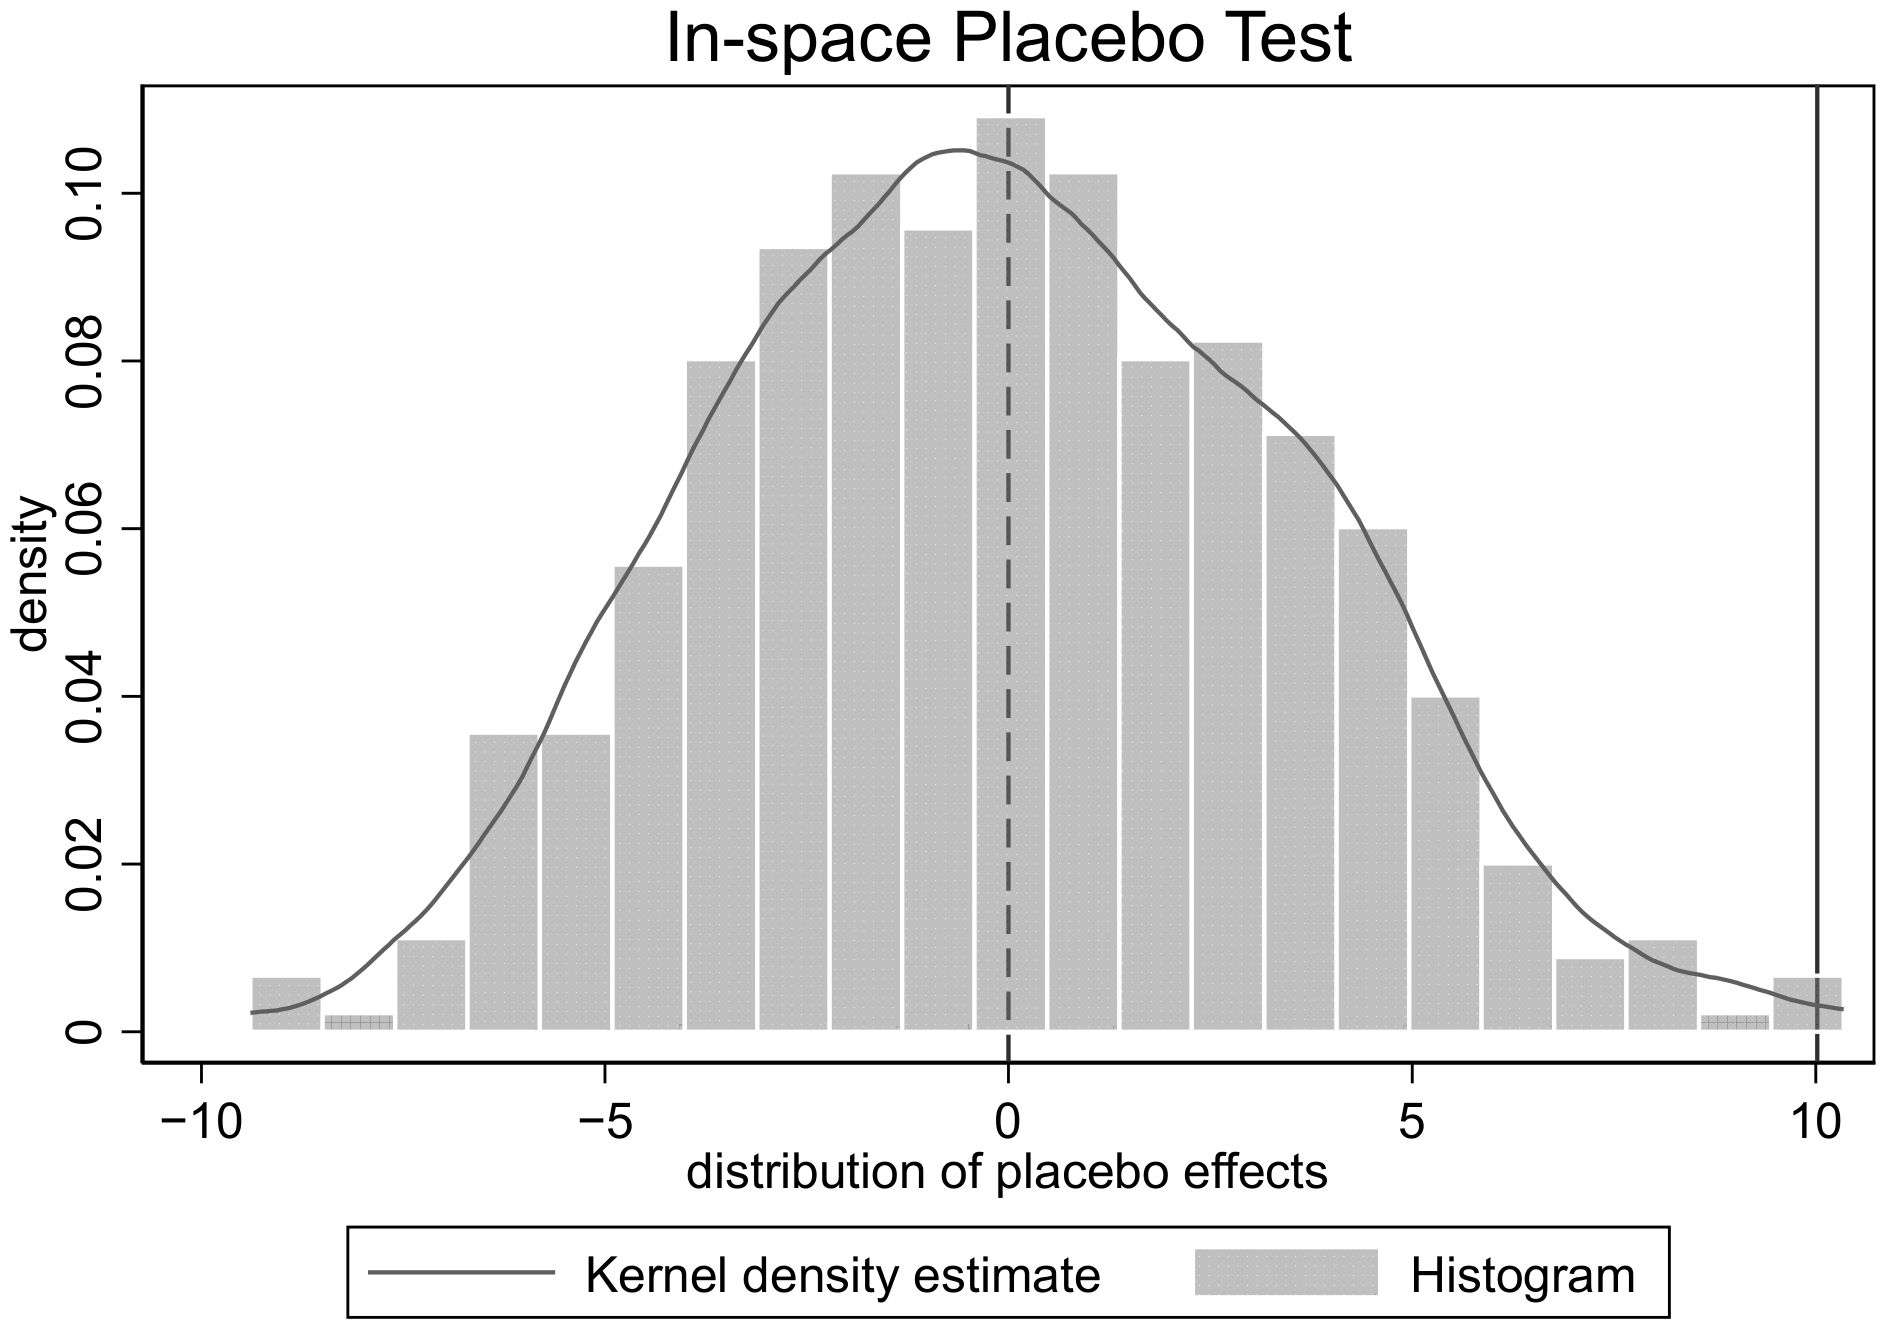
Second, for the in-space placebo test, 876 firms are chosen at random from the 3906 sample firms to form the pseudo-treatment group, leaving the other 3030 as the pseudo-control group. The DID model is then re-estimated under this artificial assignment 500 times to obtain the distribution of placebo estimates. As shown in Figure 5, the actual treatment estimate falls in the extreme right tail of the simulated distribution. Consistently, Table 5 reports both two-sided and right-tail p-values of 0.004, significant at the 1% level, strongly rejecting the null hypothesis of no treatment effect.
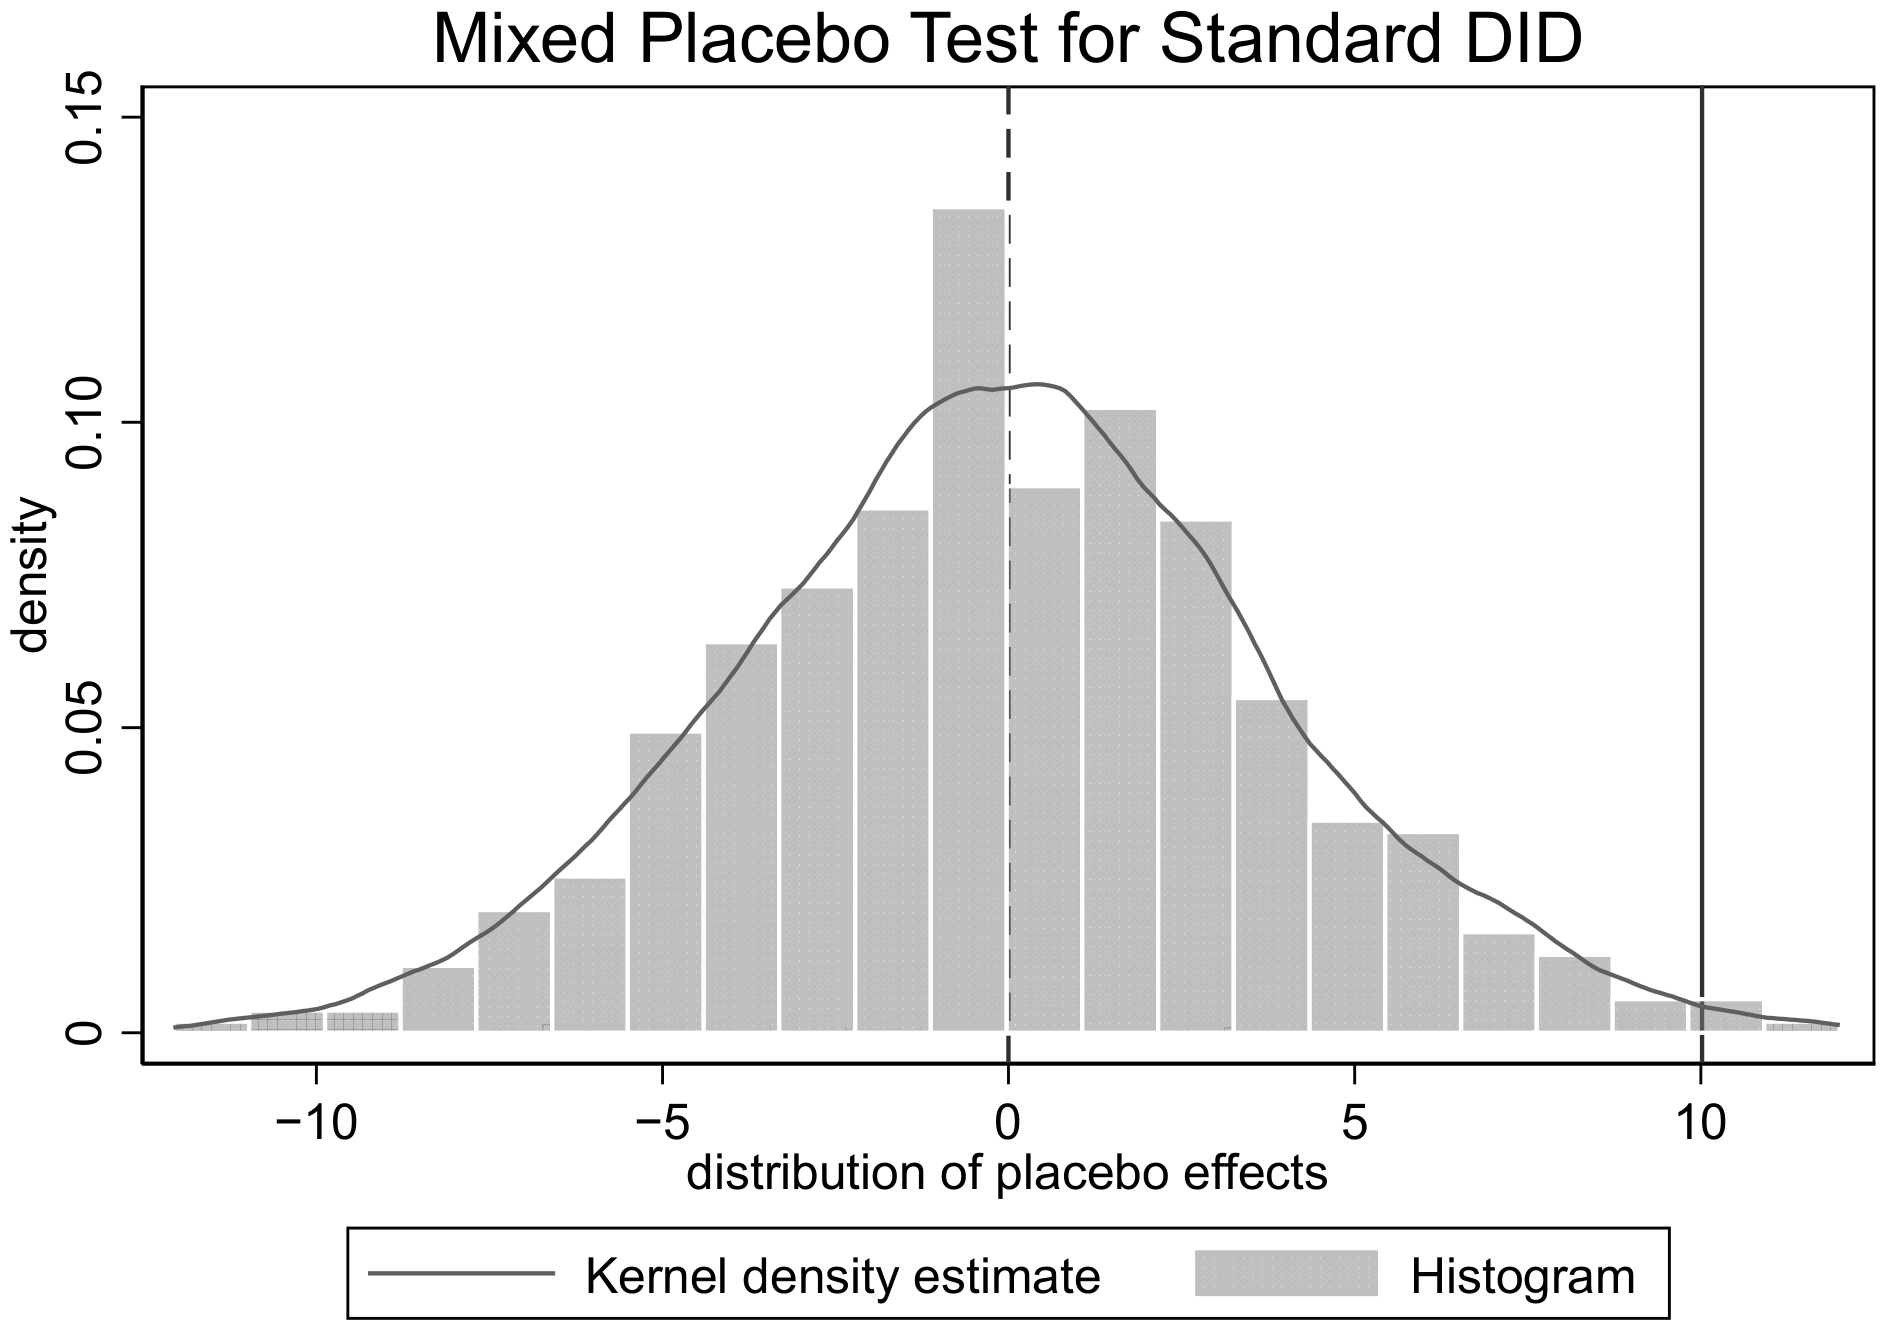
Finally, a mixed placebo test is conducted. In each simulation, both the pseudo-treatment group and the pseudo-treatment timing are randomly assigned. Specifically, 876 firms are randomly selected as the treatment group, after which a unified fictitious policy year is assigned. The DID model is re-estimated under this artificial setting, and 500 replications are used to generate the placebo distribution. Figure 6 plots the resulting estimates, with the actual treatment effect appearing in the right tail of the random distribution. As reported in Table 6, the two-sided and the right-tail p-values are 0.010 and 0.006, respectively; both meet the 1% significance threshold, strongly rejecting the null hypothesis of no treatment effect.

4.3.3. Addressing Sample Self-Selection: Propensity Score Matching and Entropy Balancing

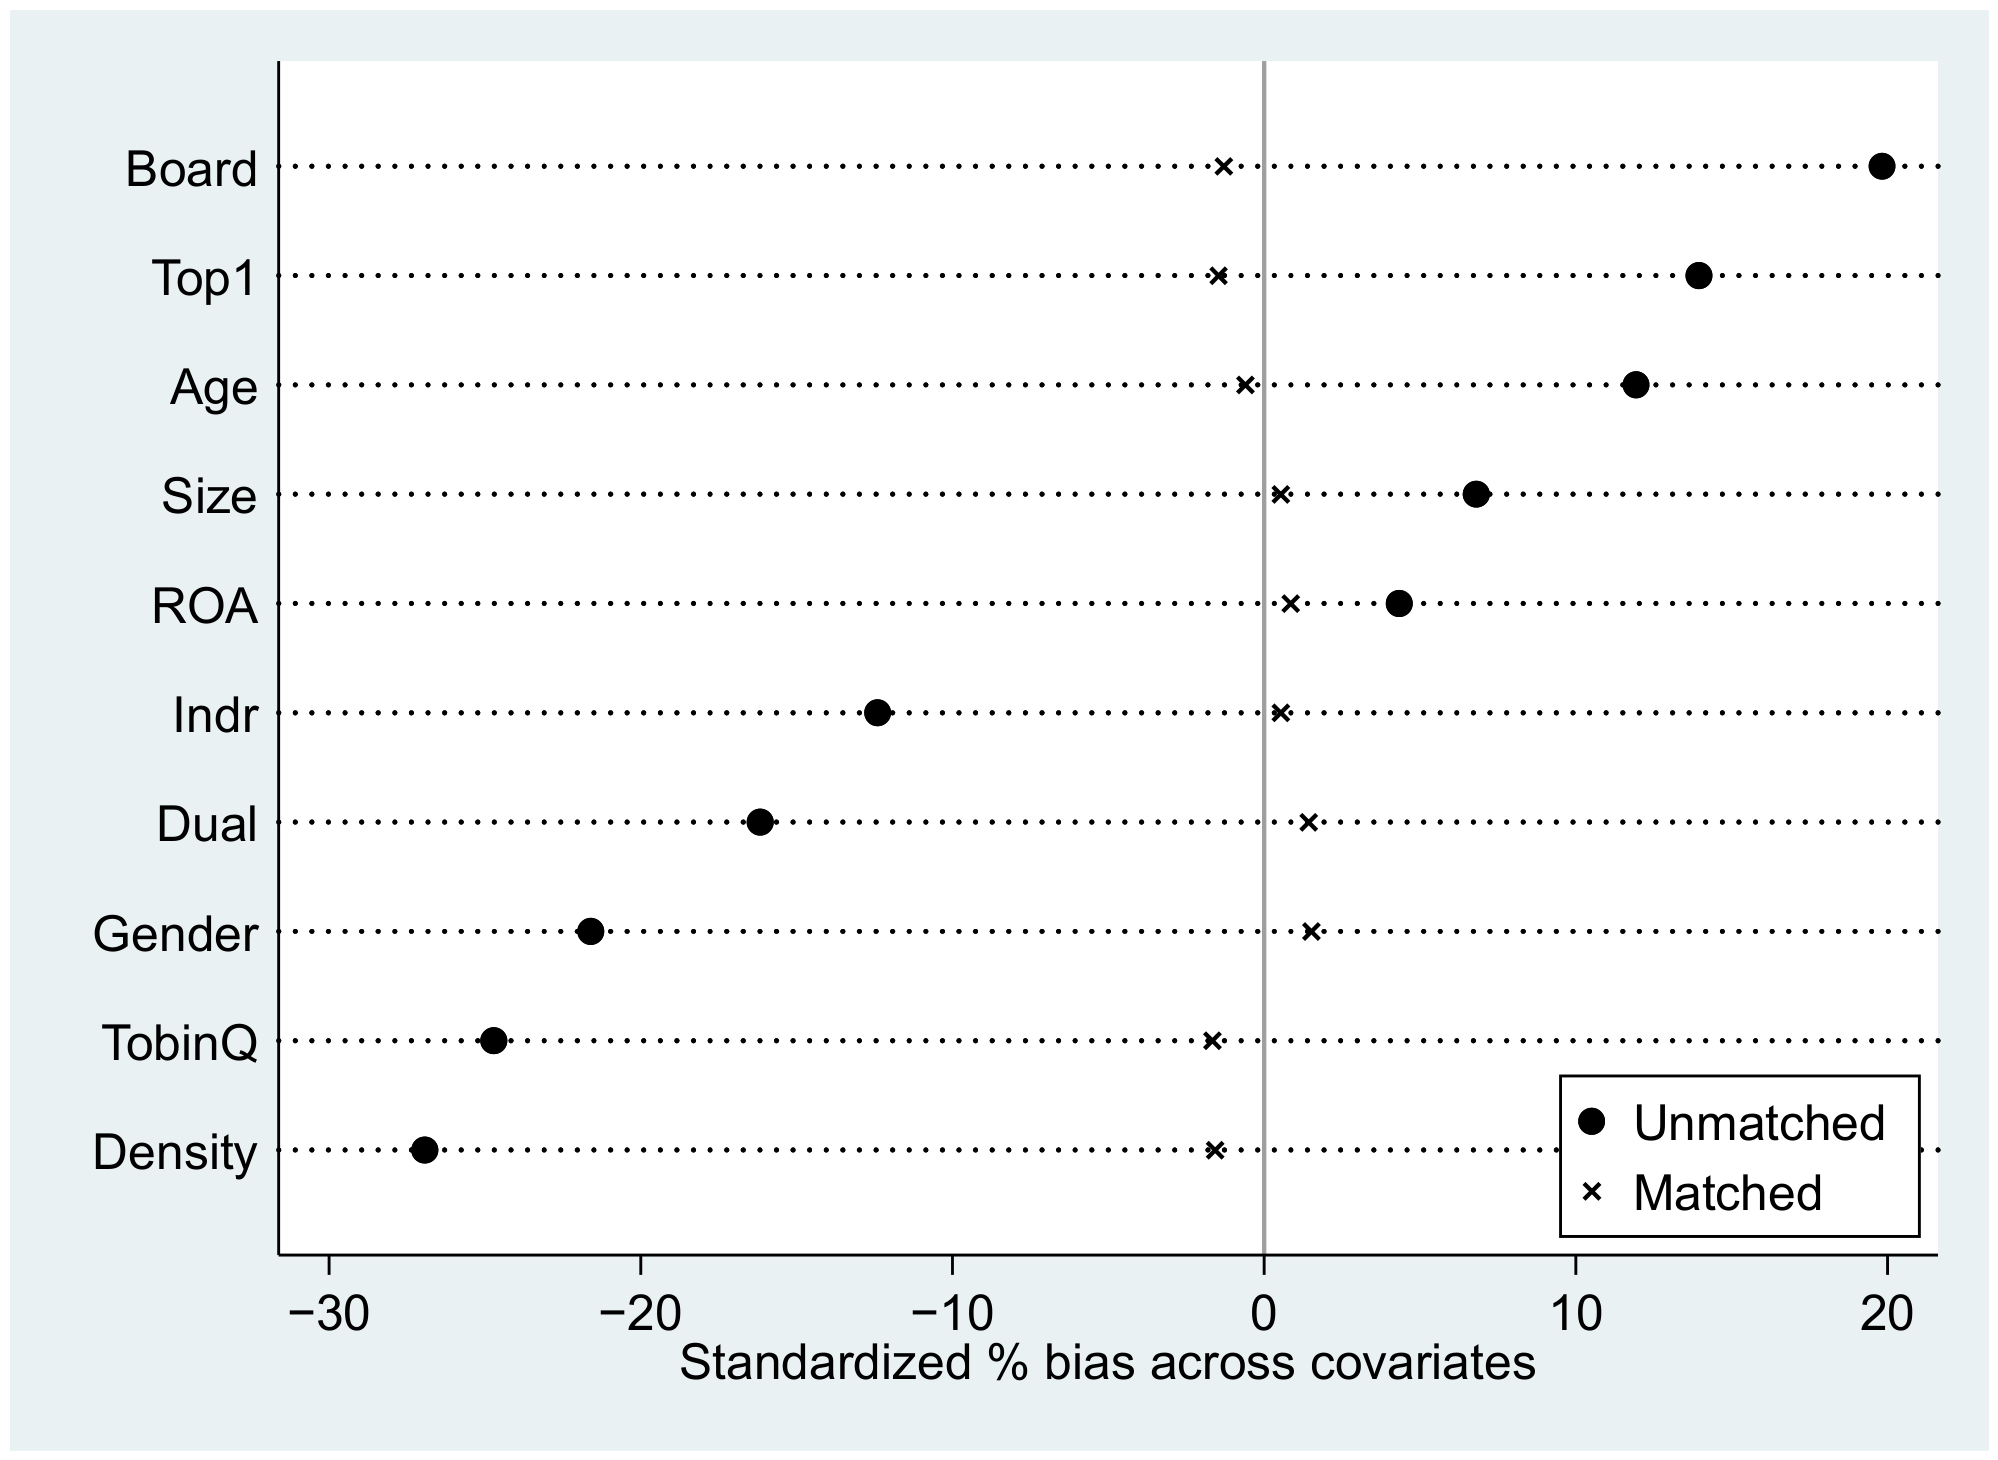
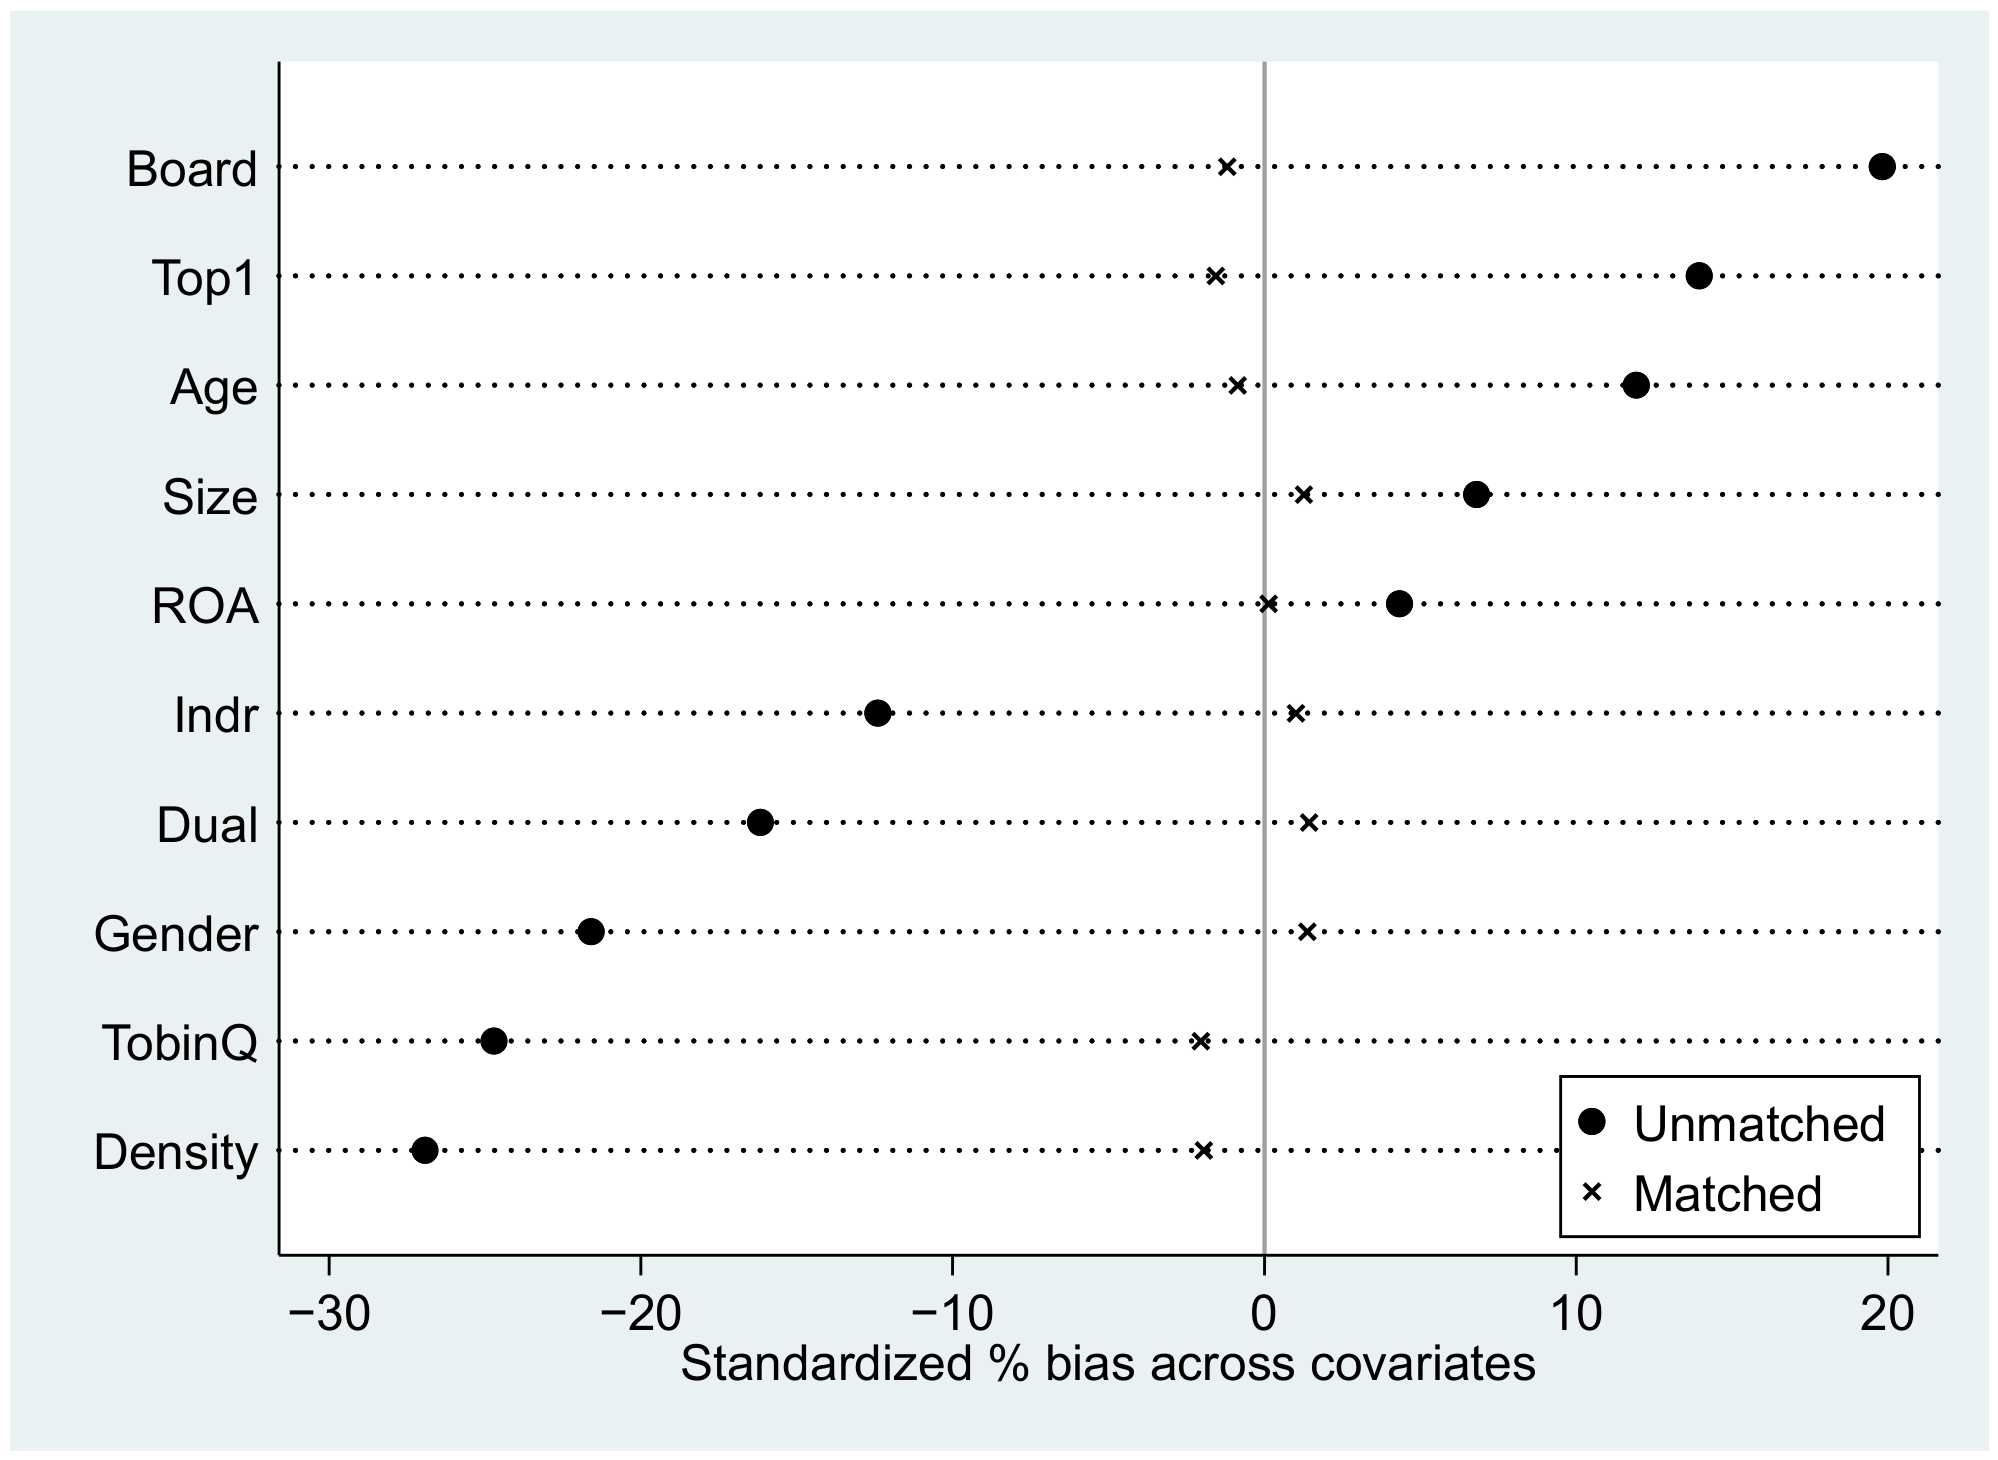
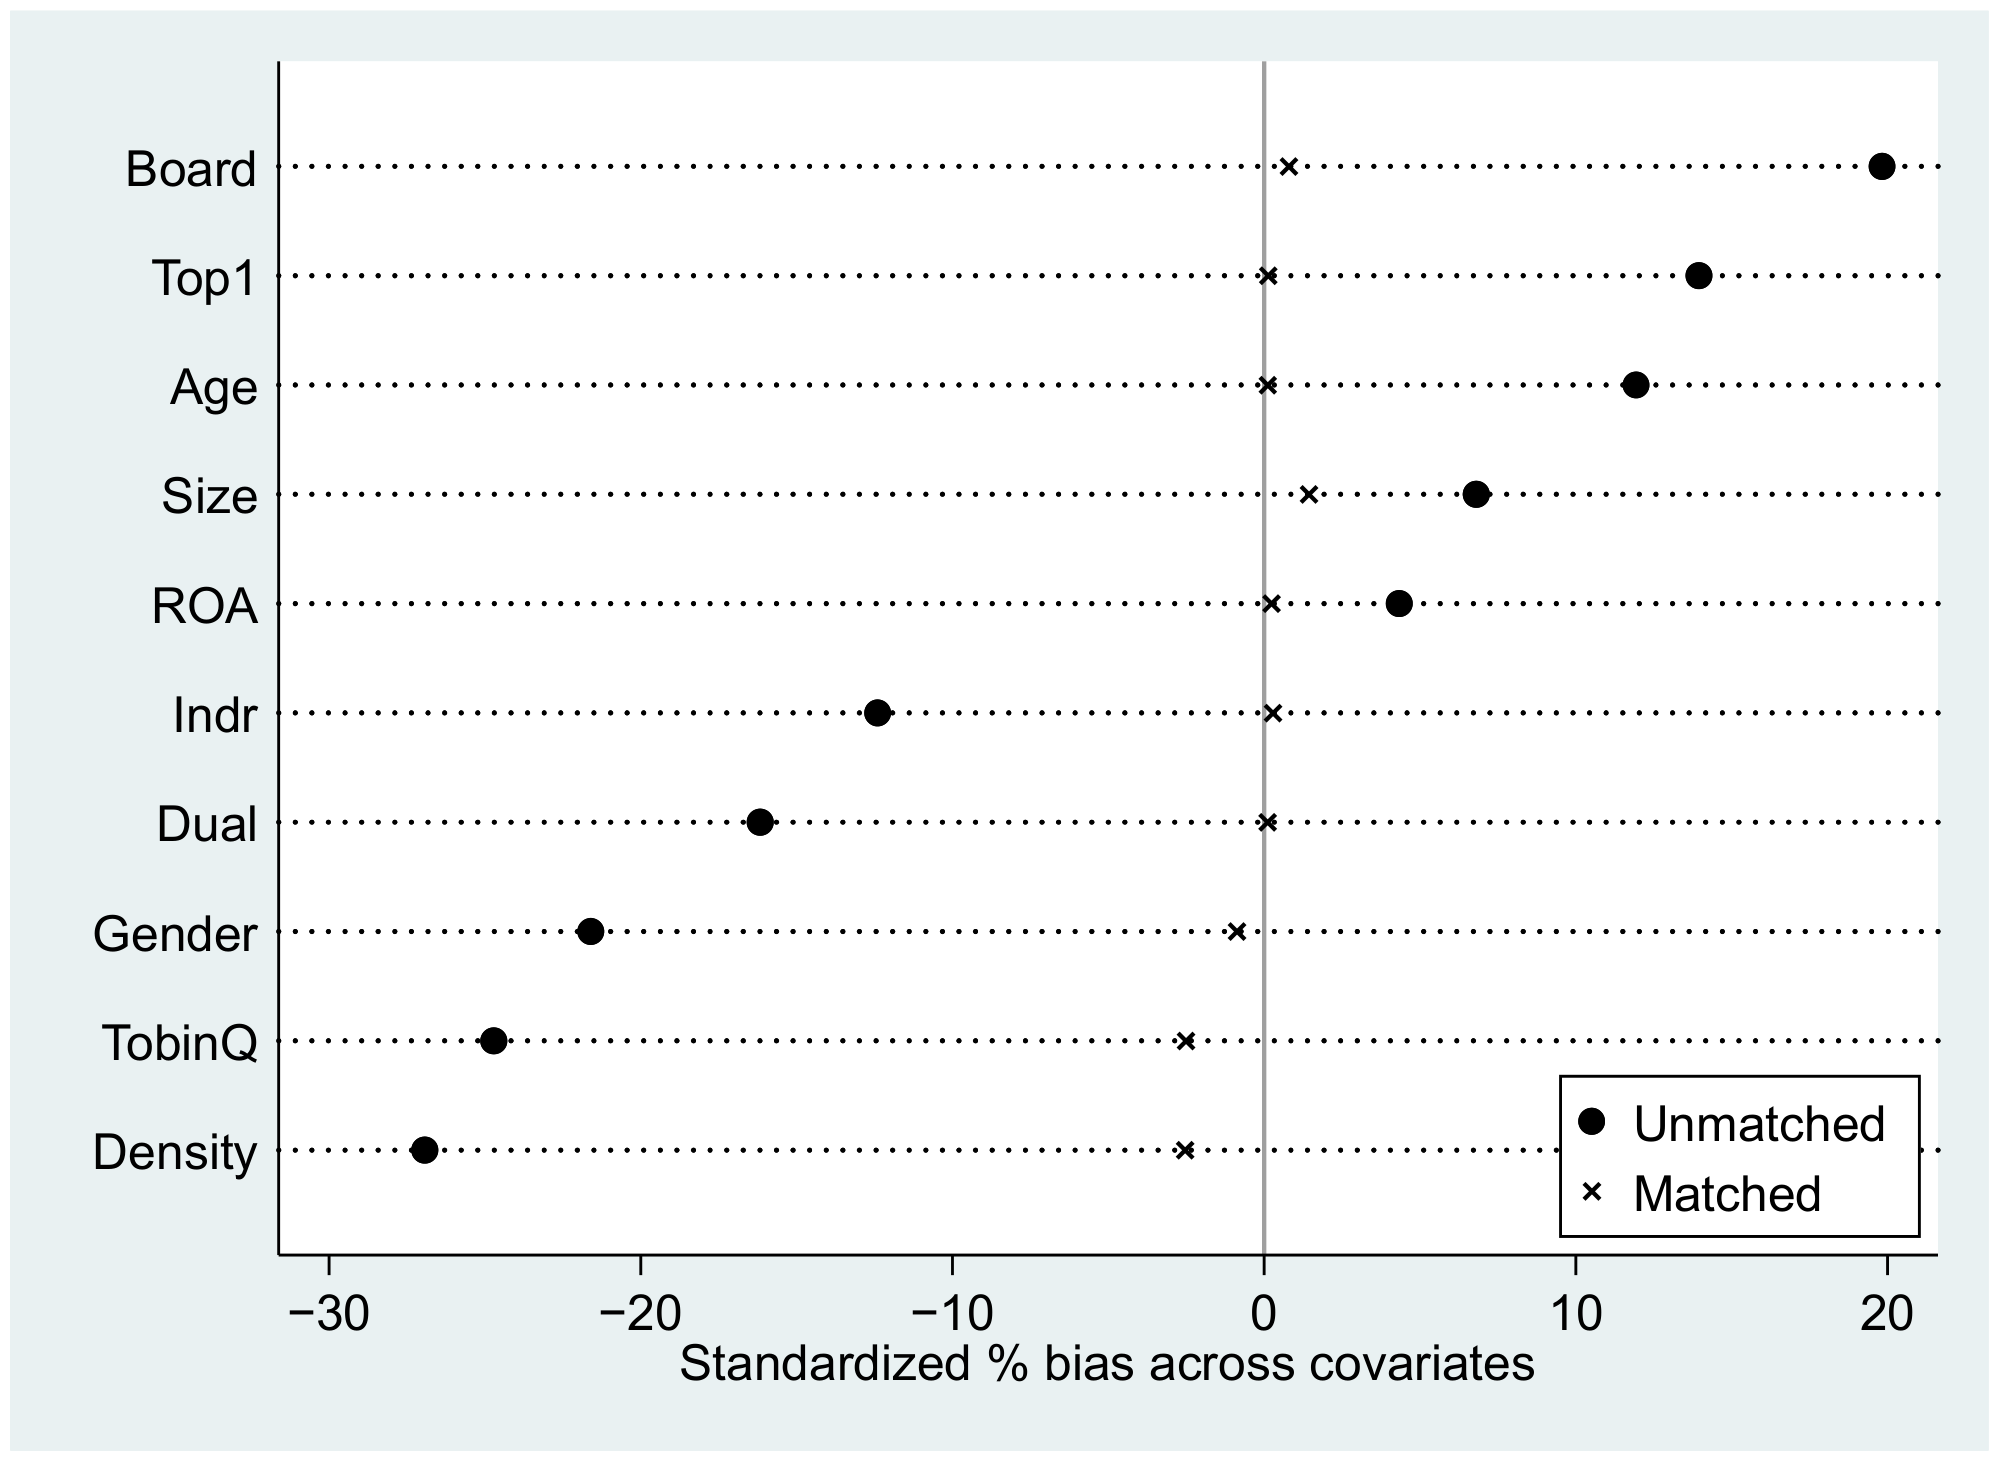
To avoid potential sample self-selection bias, propensity score matching (PSM) and entropy balancing are employed as complementary robustness procedures. In the PSM analysis, the control variables included in the baseline model are used as covariates. Nearest-neighbor, caliper, and kernel matching are then employed to pair treated firms with similar control firms. The balance diagnostics show that the covariate differences between the two groups become statistically insignificant after matching, with the absolute standardized bias of each covariate falling below 10%. The detailed results are provided in Appendix A. Columns (1)–(3) of Table 7 report the DID estimates based on the three matched samples. The Treat × Post coefficients are consistently positive, suggesting that the baseline results are robust. In addition, the DID model is re-estimated using weights generated by entropy balancing. The corresponding result, reported in Column (4) of Table 7, has the same sign and a similar significance level as the baseline estimate. These tests, based on PSM and entropy balancing, further confirm the robustness of the findings.

4.3.4. Alternative Patent-Based Measurement of Green Innovation Persistence

Corporate green innovation persistence is recalculated using granted green patents instead of green patent applications. The resulting indicator is then used as the dependent variable in Equation (1). Compared with patent applications, granted patents better capture formally recognized green innovation outputs. Column (1) of Table 8 shows that the coefficient on Treat × Post is 7.612 and remains statistically significant at the 1% level. Therefore, the positive effect of the EPT persists under the alternative measurement of the dependent variable, further confirming Hypothesis 1.

4.3.5. Duration-Based Measurement of Green Innovation Persistence

Previous studies suggest that innovation persistence can also be characterized by the duration of firms’ innovative activities or innovation spells [66,67]. Therefore, to further validate the persistence effect of the EPT from the perspective of temporal continuity, we construct a duration-based measure of corporate green innovation persistence. Specifically, using all available historical green patent records from 1991 onward, we calculate the number of consecutive years in which firms continuously generate green innovation outputs. A higher value indicates a longer-lasting green innovation spell. The results are reported in Table 8. Column (2) presents the DID estimation using the duration-based measure as the dependent variable. The coefficient of Treat × Post is positive and statistically significant at the 1% level, indicating that EPT significantly extends the duration of firms’ green innovation activities. These findings provide complementary evidence that EPT promotes corporate green innovation persistence from the perspective of temporal continuity.

4.3.6. Addressing the Skewed Distribution of GIP

The descriptive statistics indicate that GIP contains a substantial number of zero values and exhibits a pronounced right-skewed distribution. This pattern reflects the uneven distribution of firms’ green patenting activities. To address potential concerns arising from this distributional feature, we apply the inverse hyperbolic sine (IHS) transformation to GIP and re-estimate the baseline model. The IHS transformation retains zero-valued observations while reducing the influence of the right tail. As shown in Table 8 column (3), the coefficient on EPT remains positive and statistically significant at the 1% level, consistent with the baseline results. This finding confirms that the main conclusion is robust to the skewed distribution of GIP.

4.3.7. Province-by-Year Fixed Effects

To further mitigate concerns that unobserved time-varying regional factors may affect the baseline estimates, we adopt a more stringent fixed-effects specification by replacing year fixed effects with province-by-year fixed effects while retaining firm fixed effects. As reported in Table 8, column (4), the coefficient on Treat × Post remains positive and statistically significant, and its magnitude is close to the baseline estimate of 10.020. These results indicate that the main finding is robust to controlling for time-varying province-specific shocks.

4.3.8. Accounting for Concurrent Environmental Regulations

To isolate the estimated effect of the EPT from other environmental initiatives introduced during the same period, the robustness analysis accounts for two contemporaneous institutional arrangements that could affect corporate green innovation persistence. The first is the central environmental protection inspection. After being piloted in Hebei Province in 2015, the policy was rolled out nationwide over the following three years, reaching all 31 provincial-level regions by 2018. As a top-down supervision mechanism, this policy may affect firms’ environmental governance behavior and innovation activities. Potential confounding from environmental protection inspections is addressed by adding an inspection indicator, did_h, to the regression. did_h equals 1 if the region where the firm is located implemented an environmental protection inspection in year t, and 0 otherwise. The second is the carbon emission trading system. China launched carbon emission trading pilots in seven provinces and municipalities in October 2011, and these pilot regions gradually began formal online trading between 2013 and 2014. Accordingly, a carbon-trading indicator, did_t, is introduced into the model. It equals 1 for firms located in a pilot province or municipality and 0 for firms in non-pilot regions. Third, the supply-side capacity-reduction campaign is considered. Following Hao et al. [68], firms in the steel and coal industries are identified as the policy-exposed group, and a policy indicator is constructed by interacting this group indicator with a post-2015 indicator. Fourth, the Blue Sky Defense Action Plan is controlled for, following Hou et al. [69]. The corresponding indicator equals 1 for firms located in the key policy regions—the Beijing–Tianjin–Hebei region and surrounding areas, the Yangtze River Delta, and the Fen–Wei Plain—in 2018 and subsequent years, and 0 otherwise.
Table 9 reports the results after accounting for these contemporaneous policies. The coefficient on Treat × Post remains positive and statistically significant across all specifications. Although controlling for the Central Environmental Protection Inspection reduces the coefficient from 10.020 to 6.983, suggesting that this policy may account for part of the estimated effect, the estimates for the other three policies remain statistically significant and close to the baseline result.

4.3.9. Accounting for Regional Differences in EPT Rates

To further account for heterogeneous EPT exposure arising from regional differences in tax-rate adjustments, following He et al. [70], this study constructs the variable Region, which equals 1 for provinces where the statutory EPT rate increased relative to the previous pollution-discharge-fee standard and 0 otherwise. Based on the baseline DID specification, the following DDD model is estimated:
GIP i , t = α 0 + α 1 Treat i × Post t + α 2 Treat i × Region i + α 3 Post t × Region i + α 4 Treat i × Post t × Region i + α 5 Controls i , t + γ i + μ t + ε i , t
where Region denotes whether the firm is located in a province with an increased statutory EPT rate. The definitions of the remaining variables are consistent with those in Equation (1). The coefficient of interest is α4, which captures whether the differential effect of EPT on firms in heavily polluting industries varies between regions with increased and unchanged statutory tax rates.
As shown in Table 10, the coefficient on Treat × Post is 11.176 and is significantly positive at the 5% level. The coefficient on Treat × Post × Region is −2.668 and is statistically insignificant, indicating no statistically significant difference in the EPT effect between regions with increased and unchanged statutory tax rates. This result suggests that the baseline finding is not materially driven by regional differences in statutory EPT-rate adjustments.

4.3.10. Alternative Clustering Structure

To assess the sensitivity of statistical inference to the clustering level, we re-estimate the baseline DID model with standard errors clustered at the industry level, which is more closely aligned with the industry-based treatment assignment. As shown in Table 10, the coefficient on Treat × Post remains positive at 10.020 and is virtually unchanged in magnitude, although it is no longer statistically significant at conventional levels. This suggests that the estimated effect is stable in direction and magnitude, while statistical inference is sensitive to the clustering level.

5. Further Analysis

5.1. Mechanism Analysis

Based on the preceding theoretical analysis, firm uncertainty, financing constraints, and R&D investment are considered three theoretically relevant intermediate outcomes associated with the proposed transmission mechanisms. From a systems-thinking perspective, these channels correspond to firms’ expectation formation, resource access, and resource allocation, respectively. The three proposed transmission channels are examined separately in the empirical analysis. Building on the baseline DID model, the following equations are estimated:
Mediatori,t = β0 + β1Treati × Postt + β2Controlsi,t + γi + μt + εi,t
where Mediator denotes the intermediate outcome, including firm uncertainty, financing constraints, and R&D investment, respectively. The coefficient on Treat × Post captures the differential effect of the EPT on each intermediate outcome between heavily polluting firms and non-heavily polluting firms. All other variables are defined as in the baseline specification. These regressions are used to assess whether the EPT affects theoretically relevant intermediate outcomes and are interpreted as evidence consistent with the proposed mechanisms rather than as formally identified causal mediation effects.

5.1.1. The EPT and Firm Uncertainty

Firm uncertainty is proxied by stock price volatility [71]. Specifically, stock price volatility is measured by the variance of individual stock returns [72]. VAR_ADJ is calculated using the observation window from May of year t to April of year t + 1. First, the monthly variance of market-adjusted daily individual stock returns is calculated and multiplied by the number of trading days in that month to obtain monthly stock price volatility; then, the average monthly volatility is multiplied by 100. VAR_RAW is calculated in the same way as VAR_ADJ, but uses raw daily individual stock returns without market adjustment. A larger value indicates higher stock price volatility and greater firm uncertainty. As shown in Columns (1) and (2) of Table 11, the EPT significantly reduces both measures of firm uncertainty. These results indicate that the EPT is associated with lower stock-price volatility, providing evidence consistent with the proposed expectation-stabilization mechanism and the uncertainty-reduction component of Hypothesis 2a.

5.1.2. The EPT and Financing Constraints

Following Kaplan and Zingales [73] and Whited and Wu [74], financing constraints can be measured using the KZ and WW indices. These indices are composite measures constructed from firm-level financial characteristics to capture the degree of external financing difficulties faced by firms. Higher values indicate more severe financing constraints, whereas lower values represent weaker financing constraints. As reported in Columns (3) and (4) of Table 11, the EPT significantly reduces both financing-constraint indices, indicating that the policy eases firms’ financing constraints. This result is consistent with the proposed resource-access mechanism. The EPT may strengthen firms’ environmental compliance reputation and improve information disclosure, thereby enhancing internal resource availability and reducing external financing frictions. Accordingly, the findings provide evidence consistent with Hypothesis 2b.

5.1.3. The EPT and R&D Investment

R&D investment is captured from both financial and human-resource dimensions. RD_Spend is defined as the natural logarithm of R&D expenditure plus one, while RD_Person is defined as the natural logarithm of the number of R&D personnel plus one. As shown in Columns (5) and (6) of Table 11, the EPT significantly increases both R&D expenditure and R&D personnel. These results indicate that the policy encourages firms to expand their financial and human-resource commitments to R&D, providing evidence consistent with the proposed resource-allocation mechanism. Through cost pressure and innovation incentives, the EPT may encourage firms to increase R&D inputs and adjust their resource allocation toward innovation activities. Accordingly, the findings provide evidence consistent with Hypothesis 2c.

5.2. Heterogeneity Analysis

From a systems perspective, policy effects do not occur homogeneously across all firms, but instead depend on the initial state of the corporate green innovation system and the external context [75,76]. Drawing on the three theoretically proposed mechanism dimensions, we examine heterogeneity across firm characteristics related to expectation formation, resource access, and R&D allocation. Industry competition and institutional investor ownership affect the stability of firms’ expectations; ownership type and information transparency influence firms’ resource access capabilities; and technological attributes and executives’ risk preference shape firms’ willingness to allocate resources to R&D. Accordingly, the heterogeneity analysis examines how the estimated effect of the EPT varies across different firm and market contexts, thereby providing empirical evidence on the contextual conditions associated with policy effectiveness.

5.2.1. Uncertainty-Related Heterogeneity: Industry Competition and Institutional Investor Ownership

Industry competition affects the uncertainty of firms’ operating environment and further shapes the effect of the EPT on corporate green innovation persistence. Compared with highly competitive industries, industries with lower competition usually have higher market concentration and a more stable market structure. Firms in such industries face relatively smaller demand fluctuations, profitability pressure, and stock price volatility, and therefore experience lower levels of operational uncertainty. Under these conditions, firms can form more stable expectations about future regulation and compliance costs, enabling them to incorporate the requirements and signals associated with the EPT into long-term green innovation investment decisions. By contrast, in highly competitive industries, greater market uncertainty and short-term operating pressure may weaken the expectation-stabilizing role of the EPT, thereby reducing firms’ willingness and ability to continuously engage in green innovation. Industry concentration is captured by the Herfindahl–Hirschman Index (HHI), which serves as an inverse measure of market competition. Higher HHI values indicate greater industry concentration and less intense competition. Firms are partitioned into low- and high-competition groups according to the median HHI. Table 12 shows that the coefficient on Treat × Post is positive and statistically significant at the 5% level in the low-competition group, whereas no statistically significant estimate is obtained for the high-competition group. The between-group difference is marginally significant (p = 0.074), providing suggestive evidence that the EPT effect tends to be stronger among firms facing lower industry competition.
Institutional investor ownership can influence how firms respond to policy changes. Firms with greater institutional investor ownership generally operate in a more transparent information environment [77], while professional investors possess stronger information-processing capabilities [78]. In the context of the EPT, these informational advantages can facilitate the interpretation of policy signals and reduce uncertainty about policy implementation, thereby fostering more stable policy expectations and encouraging firms to sustain green innovation from a longer-term perspective. By contrast, firms with lower institutional investor ownership tend to face greater information frictions, making policy signals less effectively transmitted and weakening the long-term influence of the EPT. To examine this heterogeneity, the sample is divided at the median level of institutional investor ownership. Table 12 shows that the coefficient on Treat × Post is positive and statistically significant at the 1% level among firms with higher institutional investor ownership, whereas it is statistically insignificant among firms with lower ownership. This suggests that the positive effect of the EPT on corporate green innovation persistence is more evident among firms with higher institutional investor ownership, consistent with the role of information conditions and policy expectations in shaping firms’ responses to environmental policy.

5.2.2. Financing-Related Heterogeneity: Ownership Type and Information Transparency

Ownership structure may shape the extent to which the EPT influences corporate green innovation persistence. Due to state ownership and their closer alignment with government objectives, state-owned enterprises generally face stronger expectations to fulfill social responsibilities [79]. They are also more responsive to mandatory government targets and environmental regulatory requirements [80]. In addition, state-owned enterprises generally enjoy easier access to credit, lower financing costs, and greater government subsidies [81,82]. As a result, they face much weaker financing constraints than non-state-owned enterprises and can provide a stable resource base for long-term green innovation. By contrast, non-state-owned enterprises face tighter financing constraints and greater short-term profitability pressure, and therefore tend to choose avoidance strategies or minimal compliance, which may weaken the policy effect of the EPT. Accordingly, based on ownership heterogeneity, the sample is separated into state-owned and non-state-owned enterprises. Table 12 shows that the coefficient on Treat × Post is positive and statistically significant at the 1% level for state-owned enterprises, whereas no significant coefficient is obtained for non-state-owned enterprises. The positive effect of the EPT on corporate green innovation persistence therefore appears to be concentrated among state-owned enterprises. One possible explanation is that state-owned enterprises generally face weaker financing constraints, which may provide a more stable resource base for sustained innovation and facilitate their response to the EPT.
Information transparency may condition firms’ financing-related responses to the EPT and thereby shape the policy effect on corporate green innovation persistence. Analyst coverage serves as a proxy for corporate information transparency and is calculated as the natural logarithm of one plus the number of analysts tracking the firm. The sample is then classified into high- and low-transparency groups using the median value of this indicator. Table 13 shows that the coefficient on Treat × Post is positive and statistically significant at the 5% level in the higher-transparency group and at the 10% level in the lower-transparency group. Moreover, the p-value for the difference between the two coefficients is 0.029, significant at the 5% level. Thus, the EPT exerts a stronger positive effect on corporate green innovation persistence when firms operate in a more transparent information environment. Firms with higher information transparency face lower information asymmetry and relatively weaker financing constraints, allowing them to maintain a more stable flow of funds for green innovation. By contrast, firms with lower information transparency are constrained by more severe information asymmetry and stronger financing constraints, resulting in a weaker policy effect than that observed among high-transparency firms.

5.2.3. R&D-Related Heterogeneity: Technological Attributes and Risk Preference

Firms’ technological characteristics may shape their existing R&D capacity and, in turn, condition their R&D-related responses to the EPT. According to the Classification of High Technology Industries (Manufacturing) (2017) [83] issued by the National Bureau of Statistics and the Guidelines for the Industry Classification of Listed Companies (2012 Revision) [84] issued by the China Securities Regulatory Commission, this study defines high-technology industries, with the specific industry scope presented in Appendix B Table A4. Table 13 indicates that the coefficient on Treat × Post is positive for non-high-tech firms, but insignificant for high-tech firms. The between-group difference is marginally significant (p = 0.076), providing suggestive evidence that the EPT effect tends to be stronger among non-high-tech firms. One possible explanation is that these firms generally have weaker initial innovation incentives, making the additional pollution costs imposed by the EPT more likely to induce increased R&D investment and technological upgrading in response to environmental compliance pressure. By contrast, high-tech firms already possess stronger R&D capabilities, higher baseline levels of green innovation, and more established R&D investment, leaving less scope for the EPT to generate an additional marginal response.
Executives’ risk preferences play a key role in firms’ R&D investment decisions. R&D projects generally involve long investment horizons and substantial uncertainty. Executives with a stronger risk-taking propensity are more willing to accept the possibility of R&D failure and exploit policy-induced opportunities by committing resources to long-term innovation. More risk-averse executives, by contrast, may limit firms’ exposure to high-risk R&D projects, thereby constraining the resources available for maintaining green innovation over time. Specifically, this study uses principal component analysis to measure executives’ risk preference. It divides the sample into high- and low-risk-preference firms according to the median value of this indicator. The results show that the effect on green innovation persistence is significantly positive at the 1% level for firms with risk-taking executives. In contrast, it is insignificant for firms with risk-averse executives. This pattern is consistent with the view that stronger executive risk-taking propensity may facilitate firms’ R&D responses to the EPT and their sustained engagement in green innovation.

6. Discussion and Implications

6.1. Discussion

The empirical evidence indicates that the EPT strengthens corporate green innovation persistence. This finding is generally consistent with prior research showing that environmental regulation can stimulate corporate green innovation through cost pressure, innovation compensation, and external supervision [85]. Nevertheless, earlier studies have largely evaluated environmental regulation in terms of green innovation quantity, quality, or efficiency [20,86,87]. This study further examines whether firms can maintain green innovation activities over time. For firms, engaging in green innovation during a specific period does not necessarily mean that such innovation behavior can be sustained over time. Only when green innovation activities remain relatively stable across periods can they better reflect the continuity and long-term nature of firms’ green transformation. The evidence suggests that the EPT does more than stimulate firms’ green innovation activities; it also helps sustain such efforts over time. In this regard, this study extends existing research on the innovation effects of environmental regulation by shifting attention toward firms’ long-term responses. Corporate green innovation persistence therefore offers a useful criterion for assessing the enduring consequences of environmental policies.
The mechanism results suggest that the EPT is associated with reduced firm uncertainty, eased financing constraints, and increased R&D investment. From a systems perspective, these responses correspond to three internal dimensions of the corporate green innovation system: expectation stabilization, resource access, and resource allocation. More stable expectations may support firms’ longer-term planning, improved financing conditions may strengthen the resource basis for sustained innovation, and greater R&D commitment may enhance firms’ capacity to maintain innovation activities over time. Taken together, the evidence suggests that the influence of the EPT on persistent green innovation is accompanied by adjustments in multiple internal firm processes rather than by a single isolated response. At the same time, the measurement scope of the mechanism variables should be considered when interpreting these results: stock-price volatility may capture multiple sources of firm uncertainty, while R&D expenditure and R&D personnel reflect firms’ overall R&D activities rather than green-specific R&D. Given the proxy-based nature of these measures, however, these findings should be interpreted as mechanism-consistent evidence rather than as formally identified causal mediation effects.
The heterogeneity analysis further reveals the contextual boundaries of the policy effects of the EPT. The estimated effect of the EPT on corporate green innovation persistence is stronger among firms facing lower industry competition, firms with higher institutional investor ownership, state-owned enterprises, firms with higher information transparency, non-high-tech firms, and firms whose executives exhibit stronger risk-taking propensity. This indicates that the same environmental regulation policy does not produce identical effects across all firms. Firms’ market competition environment, governance structure, ownership attributes, information disclosure foundation, technological conditions, and managerial characteristics may influence how firms respond to the EPT and internalize its incentives. Therefore, whether the EPT can be transformed into sustained green innovation depends not only on the binding force of the policy itself, but also on whether firms possess the internal conditions needed to convert external institutional pressure into long-term innovation behavior.
From the broader perspective of green and low-carbon transition, the findings of this study suggest that promoting corporate green development should focus not only on whether green innovation increases, but also on whether such innovation can be sustained. At present, one of the key challenges facing Chinese firms in their green transformation is not simply the lack of green innovation activities, but the episodic, intermittent, and unstable nature of green innovation behavior among some firms. The empirical evidence suggests that the EPT is associated with adjustments in firms’ uncertainty, financing conditions, and R&D behavior, which are theoretically relevant to the transition from short-term compliance responses toward more sustained green innovation practices. Accordingly, the EPT extends beyond environmental governance by providing institutional support for the sustained operation of firms’ green innovation systems.
Adopting a systems-oriented lens, this study develops an analytical logic of “external institutional shock–internal transmission process–intertemporal persistent performance–contextual boundaries”, highlighting how environmental policies generate long-term behavioral changes through firms’ internal adjustment processes and under specific contextual conditions. The EPT constitutes an external institutional shock faced by the corporate green innovation system; firm uncertainty, financing constraints, and R&D investment represent three theoretically relevant dimensions of firms’ internal responses. The empirical analysis separately examines whether the EPT affects these intermediate outcomes, rather than formally identifying their causal mediation effects on green innovation persistence. Green innovation persistence reflects the intertemporal outcome of the corporate green innovation system, while the heterogeneity results reveal differences in how firms respond to the same policy shock under different contextual conditions. Thus, the systems-oriented framework provides an integrated conceptual interpretation of external institutional inputs, internal firm responses, persistent outcomes, and contextual boundaries, while remaining distinct from the specific relationships examined in the empirical analysis.

6.2. Policy Implications

The empirical evidence supports the following policy recommendations:
First, the EPT framework should be further refined to strengthen its role in supporting sustained green innovation. In policy implementation, greater attention should be paid to the continuity of firms’ green R&D activities rather than only to short-term innovation outputs. Environmental taxation should also be better coordinated with existing innovation-support policies so that firms face more stable incentives for long-term green technology investment.
Second, because the mechanism analysis shows that the EPT is associated with reduced firm uncertainty, eased financing constraints, and increased R&D investment, policy support should focus on improving the stability and predictability of the policy environment, enhancing firms’ access to long-term financial resources, and encouraging sustained R&D investment and technological upgrading. Financial institutions may also place greater emphasis on firms’ long-term innovation activities when allocating financial resources, thereby providing more stable financial support for sustained green innovation.
Third, the heterogeneity results indicate that the effect of the EPT on corporate green innovation persistence varies across firms with different market conditions, ownership and governance characteristics, information environments, technological attributes, and managerial risk-taking. Accordingly, policy implementation should account for these heterogeneous firm characteristics rather than adopting a uniform approach. Greater attention may be given to firms that exhibit relatively weaker responses to the EPT, with supporting conditions adjusted in light of the constraints associated with their market and resource environments, governance and information conditions, technological characteristics, and internal decision-making contexts. Such differentiated implementation can help improve the effectiveness and inclusiveness of the EPT.

6.3. Limitations and Future Research

Four limitations should be acknowledged. First, the empirical sample is restricted to Chinese A-share listed firms on the Shanghai and Shenzhen stock exchanges. The conclusions therefore primarily describe corporate green innovation persistence among listed firms subject to the EPT and may not readily generalize to unlisted firms or small and medium-sized enterprises. Broader firm-level samples could be employed in subsequent research to assess the external validity of the findings. Second, this study constructs the EPT shock mainly based on heavily polluting industries and the timing of EPT implementation. Although the additional DDD analysis accounts for regional differences in statutory EPT-rate adjustments, it cannot fully capture firms’ actual exposure to the EPT. Such exposure may still vary with firms’ pollution levels, local environmental enforcement intensity, and applicable tax reductions and exemptions. Moreover, although the DID framework controls for firm and year fixed effects, unobserved time-varying differences between heavily polluting and other industries may still exist and influence firms’ innovation responses. Future research could further incorporate firm-level EPT payments and pollution-emission data to measure realized policy exposure more directly. Third, the measurement of green innovation persistence and related mechanisms has certain limitations. Although the GIP indicator captures the dynamic evolution of firms’ green innovation activities by combining intertemporal changes in innovation output with current innovation scale, it does not directly measure uninterrupted innovation spells or their duration. Furthermore, as the GIP measure is constructed based on patent applications, it may not fully capture the commercialization, environmental effectiveness, or quality dimensions of green innovation outcomes. Moreover, some proxy variables used in the mechanism analysis may not fully capture the underlying constructs. In particular, stock-price volatility may reflect other sources of uncertainty beyond institutional and policy uncertainty, while R&D expenditure and R&D personnel measure overall R&D inputs rather than green-specific R&D activities. Future research could develop alternative persistence measures and employ more direct indicators to further validate these mechanisms. Fourth, the analysis considers the effect of the EPT on corporate green innovation persistence in isolation. However, firms’ green innovation behavior may also be jointly influenced by multiple policy instruments, such as green finance, government subsidies, and environmental information disclosure. Future research may adopt a policy mix perspective to further analyze the synergistic effects between the EPT and other green policy instruments.


Author Contributions

Conceptualization, Y.Z. and S.W.; methodology, Y.Z., S.W. and Y.S.; software, S.W.; validation, Y.Z., S.W. and Y.S.; formal analysis, S.W.; investigation, Y.Z. and S.W.; resources, Y.Z.; data curation, S.W.; writing—original draft preparation, S.W.; writing—review and editing, Y.Z. and Y.S.; visualization, Y.Z. and S.W.; supervision, Y.Z. and Y.S.; project administration, Y.Z.; funding acquisition, Y.Z. All authors have read and agreed to the published version of the manuscript.

Funding

This research was funded by the National Social Science Fund of China, grant number No. 21BGL289.

Data Availability Statement

The original contributions presented in this study are included in the article. Further inquiries can be directed to the corresponding author.

Conflicts of Interest

The authors declare no conflicts of interest.

Appendix A

Table A1. Covariate balance test results for nearest neighbor matching.
VariableUnmatchedMean%bias%reduct
|bias|
t-TestV(T)/V(C)
MatchedTreatedControltp > |t|
SizeU7.84937.76716.8 4.450.0001.06 *
M7.84937.84290.592.20.280.7771.13 *
AgeU3.01572.980511.9 7.550.0000.83 *
M3.01573.0174−0.694.9−0.320.7490.85 *
ROAU0.041030.038414.3 2.780.0050.92 *
M0.041030.040520.880.50.470.6391.15 *
DensityU1.99982.3872−26.9 −16.830.0000.74 *
M1.99982.0225−1.694.1−0.940.3491.18 *
TobinQU1.77222.039−24.7 −15.480.0000.76 *
M1.77221.7901−1.793.3−1.000.3191.27 *
BoardU8.6238.305219.8 13.050.0001.11 *
M8.6238.6438−1.393.5−0.680.4991.08 *
DualU0.272170.34667−16.2 −10.310.000.
M0.272170.265591.491.20.780.436.
IndrU37.19337.835−12.4 −7.910.0000.87 *
M37.19337.1650.595.70.280.7760.96
Top1U34.69332.67113.9 9.100.0001.04
M34.69334.906−1.589.5−0.760.4490.97
GenderU0.570810.67491−21.6 −14.220.000.
M0.570810.563551.593.00.770.442.
Note: * indicates that the variance ratio is outside the range [0.95, 1.05]. “.” indicates that the variance ratio is not reported for binary variables.
Figure A1. Comparison of covariate standardized biases before and after nearest neighbor matching.
Systems 14 01267 g0a1
Table A2. Covariate balance test results for radius matching.
VariableUnmatchedMean%bias%reduct
|bias|
t-TestV(T)/V(C)
MatchedTreatedControltp > |t|
SizeU7.84937.76716.8 4.450.0001.06 *
M7.84937.83411.381.50.670.5031.12 *
AgeU3.01572.980511.9 7.550.0000.83 *
M3.01573.0182−0.992.8−0.460.6470.86 *
ROAU0.041030.038414.3 2.780.0050.92 *
M0.041030.040950.197.10.070.9441.13 *
DensityU1.99982.3872−26.9 −16.830.0000.74 *
M1.99982.0279−2.092.8−1.160.2461.20 *
TobinQU1.77222.039−24.7 −15.480.0000.76 *
M1.77221.7943−2.091.7−1.220.2221.25 *
BoardU8.6238.305219.8 13.050.0001.11 *
M8.6238.6423−1.293.9−0.630.5301.09 *
DualU0.272170.34667−16.2 −10.310.000.
M0.272170.26561.491.20.780.437.
IndrU37.19337.835−12.4 −7.910.0000.87 *
M37.19337.1411.091.90.540.5860.97
Top1U34.69332.67113.9 9.100.0001.04
M34.69334.92−1.688.8−0.810.4190.98
GenderU0.570810.67491−21.6 −14.220.000.
M0.570810.56421.493.70.700.484.
Note: * indicates that the variance ratio is outside the range [0.95, 1.05]. “.” indicates that the variance ratio is not reported for binary variables.
Figure A2. Comparison of covariate standardized biases before and after radius matching.
Systems 14 01267 g0a2
Table A3. Covariate balance test results for kernel matching.
VariableUnmatchedMean%bias%reduct
|bias|
t-TestV(T)/V(C)
MatchedTreatedControltp > |t|
SizeU7.84937.76716.8 4.450.0001.06 *
M7.84937.8321.478.90.760.4451.12 *
AgeU3.01572.980511.9 7.550.0000.83 *
M3.01573.01530.199.10.060.9540.86 *
ROAU0.041030.038414.3 2.780.0050.92 *
M0.041030.040890.294.70.130.8981.13 *
DensityU1.99982.3872−26.9 −16.830.0000.74 *
M1.99982.0364−2.590.5−1.530.1271.24 *
TobinQU1.77222.039−24.7 −15.480.0000.76 *
M1.77221.7993−2.589.8−1.510.1311.28 *
BoardU8.6238.305219.8 13.050.0001.11 *
M8.6238.61040.896.00.410.6791.10 *
DualU0.272170.34667−16.2 −10.310.000.
M0.272170.27170.199.40.050.956.
IndrU37.19337.835−12.4 −7.910.0000.87 *
M37.19337.1780.397.70.150.8800.96
Top1U34.69332.67113.9 9.100.0001.04
M34.69334.6760.199.10.060.9500.99
GenderU0.570810.67491−21.6 −14.220.000.
M0.570810.57504−0.995.9−0.450.653.
Note: * indicates that the variance ratio is outside the range [0.95, 1.05]. “.” indicates that the variance ratio is not reported for binary variables.
Figure A3. Comparison of covariate standardized biases before and after kernel matching.
Systems 14 01267 g0a3

Appendix B

Table A4. Criteria for classifying high-technology industries.
Industry CodeIndustry Name
C27Pharmaceutical Manufacturing
C39Computer, Communications, and Other Electronic Equipment Manufacturing
C40Instrument and Meter Manufacturing
C26Chemical Raw Materials and Chemical Products Manufacturing
C28Chemical Fiber Manufacturing
C37Railway, Ship, Aerospace, and Other Transportation Equipment Manufacturing

References

  1. Löfgren, Å.; Ahlvik, L.; van den Bijgaart, I.; Coria, J.; Jaraitė, J.; Johnsson, F.; Rootzén, J. Green industrial policy for climate action in the basic materials industry. Clim. Change 2024, 177, 147. [Google Scholar] [CrossRef] [Scilit]
  2. Wimbadi, R.W.; Djalante, R. From decarbonization to low carbon development and transition: A systematic literature review of the conceptualization of moving toward net-zero carbon dioxide emission (1995–2019). J. Clean. Prod. 2020, 256, 120307. [Google Scholar] [CrossRef] [Scilit]
  3. Jiang, L.; Bai, Y. Strategic or substantive innovation?—The impact of institutional investors’ site visits on green innovation evidence from China. Technol. Soc. 2022, 68, 101904. [Google Scholar] [CrossRef] [Scilit]
  4. Hou, X.; Xie, G. ESG divergence and corporate strategic green patenting. Finance Res. Lett. 2024, 67, 105914. [Google Scholar] [CrossRef] [Scilit]
  5. Bansal, P.; DesJardine, M.R. Business sustainability: It is about time. Strateg. Organ. 2014, 12, 70–78. [Google Scholar] [CrossRef] [Scilit]
  6. Lu, Q.; Deng, J.; Chen, S.; Hussain, Y. Managerial myopia and its barrier to green innovation in high-pollution enterprises: A machine learning approach. J. Environ. Manag. 2025, 376, 124477. [Google Scholar] [CrossRef] [Scilit] [PubMed]
  7. Adams, R.; Jeanrenaud, S.; Bessant, J.; Denyer, D.; Overy, P. Sustainability-oriented Innovation: A systematic review. Int. J. Manag. Rev. 2016, 18, 180–205. [Google Scholar] [CrossRef] [Scilit]
  8. Dierickx, I.; Cool, K. Asset stock accumulation and sustainability of competitive advantage. Manag. Sci. 1989, 35, 1504–1511. [Google Scholar] [CrossRef] [Scilit]
  9. Wang, K.; Huang, H.; Yuan, Y. Can CEO’s professional connections drive green innovation of SMEs? Bus. Strategy Environ. 2024, 33, 5975–5995. [Google Scholar] [CrossRef] [Scilit]
  10. Lv, X.; Wang, Z.; Zhou, W. SO2 emissions reduction effect of China’s pollution levy standard adjustment: A short-term and long-term analysis. Sustainability 2024, 16, 2916. [Google Scholar] [CrossRef] [Scilit]
  11. Zhang, Y.; Xia, F.; Zhang, B. Can raising environmental tax reduce industrial water pollution? Firm-level evidence from China. Environ. Impact Assess. Rev. 2023, 101, 107155. [Google Scholar] [CrossRef] [Scilit]
  12. Liu, B.; Ge, J. The optimal choice of environmental tax revenue usage: Incentives for cleaner production or end-of-pipe treatment? J. Environ. Manag. 2023, 329, 117106. [Google Scholar] [CrossRef] [Scilit] [PubMed]
  13. Johnstone, N.; Haščič, I.; Popp, D. Renewable energy policies and technological innovation: Evidence based on patent counts. Environ. Resour. Econ. 2010, 45, 133–155, Erratum in Environ. Resour. Econ. 2017, 68, 441–444. [Google Scholar] [CrossRef] [Scilit]
  14. Zhang, C.; Chen, D. Do environmental, social, and governance scores improve green innovation? Empirical evidence from Chinese-listed companies. PLoS ONE 2023, 18, e0279220. [Google Scholar] [CrossRef] [Scilit] [PubMed]
  15. Liu, Y.; Wang, A.; Wu, Y. Environmental regulation and green innovation: Evidence from China’s new environmental protection law. J. Clean. Prod. 2021, 297, 126698. [Google Scholar] [CrossRef] [Scilit]
  16. Kong, H.; Sun, L.; Zhang, W. Digitization and green technology innovation of Chinese firms under government subsidy policies. Systems 2024, 12, 447. [Google Scholar] [CrossRef] [Scilit]
  17. Zhang, H.; Lai, J.; Jie, S. Quantity and quality: The impact of environmental, social, and governance (ESG) performance on corporate green innovation. J. Environ. Manag. 2024, 354, 120272. [Google Scholar] [CrossRef] [Scilit] [PubMed]
  18. Cui, J.; Dai, J.; Wang, Z.; Zhao, X. Does environmental regulation induce green innovation? A panel study of Chinese listed firms. Technol. Forecast. Soc. Change 2022, 176, 121492. [Google Scholar] [CrossRef] [Scilit]
  19. Zhao, Z.; Zhao, Y.; Lv, X.; Li, X.; Zheng, L.; Fan, S.; Zuo, S. Environmental regulation and green innovation: Does state ownership matter? Energy Econ. 2024, 136, 107762. [Google Scholar] [CrossRef] [Scilit]
  20. Huang, X.; Liu, W.; Zhang, Z.; Zou, X.; Li, P. Quantity or quality: Environmental legislation and corporate green innovations. Ecol. Econ. 2023, 204, 107684. [Google Scholar] [CrossRef] [Scilit]
  21. Tan, Y.; Zhu, Z. The effect of ESG rating events on corporate green innovation in China: The mediating role of financial constraints and managers’ environmental awareness. Technol. Soc. 2022, 68, 101906. [Google Scholar] [CrossRef] [Scilit]
  22. Probst, B.; Touboul, S.; Glachant, M.; Dechezleprêtre, A. Global trends in the invention and diffusion of climate change mitigation technologies. Nat. Energy 2021, 6, 1077–1086. [Google Scholar] [CrossRef] [Scilit]
  23. Huang, H.; Mbanyele, W.; Wang, F.; Song, M.; Wang, Y. Climbing the quality ladder of green innovation: Does green finance matter? Technol. Forecast. Soc. Change 2022, 184, 122007. [Google Scholar] [CrossRef] [Scilit]
  24. Wang, H.; Qi, S.; Zhou, C.; Zhou, J.; Huang, X. Green credit policy, government behavior and green innovation quality of enterprises. J. Clean. Prod. 2022, 331, 129834. [Google Scholar] [CrossRef] [Scilit]
  25. Shan, H.; Zhao, K.; Liu, Y. ESG performance and the persistence of green innovation: Empirical evidence from Chinese manufacturing enterprises. Multinatl. Bus. Rev. 2025, 33, 268–296. [Google Scholar] [CrossRef] [Scilit]
  26. Jing, R.; Liu, R. The impact of green finance on persistence of green innovation at firm-level: A moderating perspective based on environmental regulation intensity. Finance Res. Lett. 2024, 62, 105274. [Google Scholar] [CrossRef] [Scilit]
  27. Wang, D.; Zhang, X.; Kwon, D. Environmental regulation and corporate performance: Evidence from Chinese heavily polluting firms. Systems 2026, 14, 373. [Google Scholar] [CrossRef] [Scilit]
  28. Li, P.; Lin, Z.; Du, H.; Feng, T.; Zuo, J. Do environmental taxes reduce air pollution? Evidence from fossil-fuel power plants in China. J. Environ. Manag. 2021, 295, 113112. [Google Scholar] [CrossRef] [Scilit] [PubMed]
  29. Du, J.; Li, Z.; Shi, G.; Wang, B. Can “environmental protection fee to tax” reduce carbon emissions? Evidence from China. Finance Res. Lett. 2024, 62, 105184. [Google Scholar] [CrossRef] [Scilit]
  30. Cao, G.; She, J.; Cao, C.; Cao, Q. Environmental protection tax and green innovation: The mediating role of digitalization and ESG. Sustainability 2024, 16, 577. [Google Scholar] [CrossRef] [Scilit]
  31. Voulvoulis, N.; Giakoumis, T.; Hunt, C.; Kioupi, V.; Petrou, N.; Souliotis, I.; Vaghela, C.; binti Wan Rosely, W.I.H. Systems thinking as a paradigm shift for sustainability transformation. Glob. Environ. Change 2022, 75, 102544. [Google Scholar] [CrossRef] [Scilit]
  32. Jiang, G.; Peng, J.; Liang, X.; Pan, J. Supply chain digitization and continuous green innovation: Evidence from China. Energy Econ. 2025, 142, 108158. [Google Scholar] [CrossRef] [Scilit]
  33. Zhong, Z.; Wu, S.; Hu, J.; Fang, L.; Li, K. Does financialization alleviate the funding dilemma of green innovation in heavily polluting firms?: Evidence from China’s A-share listed companies. Systems 2025, 13, 192. [Google Scholar] [CrossRef] [Scilit]
  34. Emery, F.E.; Trist, E.L. The causal texture of organizational environments. Hum. Relat. 1965, 18, 21–32. [Google Scholar] [CrossRef] [Scilit]
  35. Meyer, J.W.; Rowan, B. Institutionalized organizations: Formal structure as myth and ceremony. Am. J. Sociol. 1977, 83, 340–363. [Google Scholar] [CrossRef] [Scilit] [PubMed]
  36. Oliver, C. Strategic responses to institutional processes. Acad. Manag. Rev. 1991, 16, 145–179. [Google Scholar] [CrossRef] [Scilit] [PubMed]
  37. Teece, D.J.; Pisano, G.; Shuen, A. Dynamic capabilities and strategic management. Strateg. Manag. J. 1997, 18, 509–533. [Google Scholar] [CrossRef] [Scilit]
  38. Mazaheri, M.; Bonnin Roca, J.; Markus, A.; Walrave, B. Market-based instruments and sustainable innovation: A systematic literature review and critique. J. Clean. Prod. 2022, 373, 133947. [Google Scholar] [CrossRef] [Scilit]
  39. Gebhardt, S.; Hou, Y.; Yarime, M. Directing environmental innovation toward radical clean technologies for sustainable transitions: Market-based vs. command-and-control policies. Res. Policy 2026, 55, 105446. [Google Scholar] [CrossRef] [Scilit]
  40. Knittel, C.R.; Sandler, R. The welfare impact of second-best uniform-Pigouvian taxation: Evidence from transportation. Am. Econ. J. Econ. Policy 2018, 10, 211–242. [Google Scholar] [CrossRef] [Scilit]
  41. Manta, A.G.; Doran, N.M.; Bădîrcea, R.M.; Badareu, G.; Țăran, A.M. Does the implementation of a Pigouvian tax be considered an effective approach to address climate change mitigation? Econ. Anal. Policy 2023, 80, 1719–1731. [Google Scholar] [CrossRef] [Scilit]
  42. Jasch, C. The use of Environmental Management Accounting (EMA) for identifying environmental costs. J. Clean. Prod. 2003, 11, 667–676. [Google Scholar] [CrossRef] [Scilit]
  43. Porter, M.E.; van der Linde, C. Toward a new conception of the environment-competitiveness relationship. J. Econ. Perspect. 1995, 9, 97–118. [Google Scholar] [CrossRef] [Scilit]
  44. Iñigo, E.A.; Albareda, L. Understanding sustainable innovation as a complex adaptive system: A systemic approach to the firm. J. Clean. Prod. 2016, 126, 1–20. [Google Scholar] [CrossRef] [Scilit]
  45. Xu, Z. Economic policy uncertainty, cost of capital, and corporate innovation. J. Bank. Finance 2020, 111, 105698. [Google Scholar] [CrossRef] [Scilit]
  46. Milani, S.; Neumann, R. R&D, patents, and financing constraints of the top global innovative firms. J. Econ. Behav. Organ. 2022, 196, 546–567. [Google Scholar] [CrossRef] [Scilit]
  47. Mirza, S.S.; Xu, N.; Corbet, S.; Scrimgeour, F. Green innovation under financial and policy uncertainty: Evidence from China. Res. Int. Bus. Finance 2025, 76, 102856. [Google Scholar] [CrossRef] [Scilit]
  48. Gulen, H.; Ion, M. Policy uncertainty and corporate investment. Rev. Financ. Stud. 2016, 29, 523–564. [Google Scholar] [CrossRef] [Scilit]
  49. Yu, H.; Chen, H. Economic policy uncertainty and green innovation: Does corporate social responsibility matter? Finance Res. Lett. 2023, 58, 104649. [Google Scholar] [CrossRef] [Scilit]
  50. North, D.C. Institutions. J. Econ. Perspect. 1991, 5, 97–112. [Google Scholar] [CrossRef] [Scilit]
  51. Brunetti, A.; Weder, B. Investment and institutional uncertainty: A comparative study of different uncertainty measures. Weltwirtschaftliches Arch. 1998, 134, 513–533. [Google Scholar] [CrossRef] [Scilit]
  52. Xiang, X.; Liu, C.; Yang, M. Who is financing corporate green innovation? Int. Rev. Econ. Finance 2022, 78, 321–337. [Google Scholar] [CrossRef] [Scilit]
  53. D’Angelo, V.; Cappa, F.; Peruffo, E. Green manufacturing for sustainable development: The positive effects of green activities, green investments, and non-green products on economic performance. Bus. Strategy Environ. 2023, 32, 1900–1913. [Google Scholar] [CrossRef] [Scilit]
  54. Romer, P.M. Endogenous technological change. J. Political Econ. 1990, 98, S71–S102. [Google Scholar] [CrossRef] [Scilit] [PubMed]
  55. Bloom, N.; Jones, C.I.; Van Reenen, J.; Webb, M. Are ideas getting harder to find? Am. Econ. Rev. 2020, 110, 1104–1144. [Google Scholar] [CrossRef] [Scilit]
  56. Bai, Y.; Song, S.; Jiao, J.; Yang, R. The impacts of government R&D subsidies on green innovation: Evidence from Chinese energy-intensive firms. J. Clean. Prod. 2019, 233, 819–829. [Google Scholar] [CrossRef] [Scilit]
  57. Zhao, H.; Wang, J.; Yuan, Y. How can enterprises’ green innovation persist? A study based on explainable machine learning. Sustainability 2025, 17, 10071. [Google Scholar] [CrossRef] [Scilit]
  58. Pan, A.; Liu, X.; Qiu, J.; Shen, Y. Can green M&A of heavy polluting enterprises achieve substantial transformation under the pressure of media. China Ind. Econ. 2019, 2, 174–192. (In Chinese) [Google Scholar] [CrossRef]
  59. Luo, H.; Wu, Y. The unintended consequences of environmental tax for green innovation: Evidence from China. J. Appl. Econ. 2023, 26, 2286566. [Google Scholar] [CrossRef] [Scilit]
  60. Li, H.; Wu, J.; Lu, Z. Signaling role of finance in the relationship between environmental regulation and firm green innovation. J. Environ. Manag. 2025, 394, 127461. [Google Scholar] [CrossRef] [Scilit] [PubMed]
  61. Triguero, Á.; Córcoles, D. Understanding innovation: An analysis of persistence for Spanish manufacturing firms. Res. Policy 2013, 42, 340–352. [Google Scholar] [CrossRef] [Scilit]
  62. He, Y.; Zhang, S. A research on the effect of technological innovation persistence on firm’s performance. Sci. Res. Manag. 2017, 38, 1–11. (In Chinese) [Google Scholar] [CrossRef]
  63. Martínez-Zarzoso, I.; Bengochea-Morancho, A.; Morales-Lage, R. Does environmental policy stringency foster innovation and productivity in OECD countries? Energy Policy 2019, 134, 110982. [Google Scholar] [CrossRef] [Scilit]
  64. Benatti, N.; Groiss, M.; Kelly, P.; Lopez-Garcia, P. The impact of environmental regulation on clean innovation: Are there crowding out effects? Energy Econ. 2026, 161, 109539. [Google Scholar] [CrossRef] [Scilit]
  65. Chen, Q.; Qi, J.; Yan, G. Placebo tests for difference-in-differences: A practical guide. Manag. World 2025, 41, 181–220. (In Chinese) [Google Scholar] [CrossRef]
  66. Cefis, E. Is there persistence in innovative activities? Int. J. Ind. Organ. 2003, 21, 489–515. [Google Scholar] [CrossRef] [Scilit]
  67. Jang, S.-L.; Chen, J.H. What determines how long an innovative spell will last? Scientometrics 2011, 86, 65–76. [Google Scholar] [CrossRef] [Scilit]
  68. Hao, Z.; Tian, M.; Zheng, H.T. How does the green credit policy affect the default risk of enterprises? J. Beijing Univ. Aeronaut. Astronaut. (Soc. Sci. Ed.) 2025, 38, 117–134. (In Chinese) [Google Scholar] [CrossRef]
  69. Hou, Y.; Yi, L.; Zhang, J. Environmental policy and ESG greenwashing. Sustainability 2026, 18, 4524. [Google Scholar] [CrossRef] [Scilit]
  70. He, Y.; Zhu, X.; Zheng, H. The influence of environmental protection tax law on total factor productivity: Evidence from listed firms in China. Energy Econ. 2022, 113, 106248. [Google Scholar] [CrossRef] [Scilit]
  71. Alfaro, I.; Bloom, N.; Lin, X. The finance uncertainty multiplier. J. Political Econ. 2024, 132, 577–615. [Google Scholar] [CrossRef] [Scilit] [PubMed]
  72. Xin, Q.; Kong, D.; Hao, Y. Transparency and stock return volatility. J. Financ. Res. 2014, 10, 193–206. (In Chinese) [Google Scholar]
  73. Kaplan, S.N.; Zingales, L. Do investment-cash flow sensitivities provide useful measures of financing constraints? Q. J. Econ. 1997, 112, 169–215. [Google Scholar] [CrossRef] [Scilit]
  74. Whited, T.M.; Wu, G. Financial constraints risk. Rev. Financ. Stud. 2006, 19, 531–559. [Google Scholar] [CrossRef] [Scilit]
  75. Angrist, J.D. Treatment effect heterogeneity in theory and practice. Econ. J. 2004, 114, C52–C83. [Google Scholar] [CrossRef] [Scilit]
  76. Allcott, H. Site selection bias in program evaluation. Q. J. Econ. 2015, 130, 1117–1165. [Google Scholar] [CrossRef] [Scilit]
  77. Boone, A.L.; White, J.T. The effect of institutional ownership on firm transparency and information production. J. Financ. Econ. 2015, 117, 508–533. [Google Scholar] [CrossRef] [Scilit]
  78. Hendershott, T.; Livdan, D.; Schürhoff, N. Are institutions informed about news? J. Financ. Econ. 2015, 117, 249–287. [Google Scholar] [CrossRef] [Scilit]
  79. Liang, J.; Langbein, L. Are state-owned enterprises good citizens in environmental governance? Evidence from the control of air pollution in China. Adm. Soc. 2021, 53, 1263–1292. [Google Scholar] [CrossRef] [Scilit]
  80. Wang, Q.; Liu, M.; Zhang, B. Do state-owned enterprises really have better environmental performance in China? Environmental regulation and corporate environmental strategies. Resour. Conserv. Recycl. 2022, 185, 106500. [Google Scholar] [CrossRef] [Scilit]
  81. Song, Z.; Storesletten, K.; Zilibotti, F. Growing like China. Am. Econ. Rev. 2011, 101, 196–233. [Google Scholar] [CrossRef] [Scilit]
  82. Harrison, A.; Wang, P.; Zhao, M.; Meyer, M.; Zhao, L. Can a tiger change its stripes? Reform of Chinese state-owned enterprises in the penumbra of the state. Int. J. Ind. Organ. 2026, 104, 103241. [Google Scholar] [CrossRef] [Scilit]
  83. National Bureau of Statistics of China. Classification of High Technology Industries (Manufacturing). 2017. Available online: https://www.stats.gov.cn/sj/tjbz/gjtjbz/202302/t20230213_1902772.html (accessed on 1 October 2026).
  84. China Securities Regulatory Commission. Guidelines for the Industry Classification of Listed Companies (2012 Revision). Available online: https://www.csrc.gov.cn/csrc_en/c102034/c1371375/content.shtml (accessed on 1 October 2026).
  85. Li, Z.; Huang, Z.; Su, Y. New media environment, environmental regulation and corporate green technology innovation: Evidence from China. Energy Econ. 2023, 119, 106545. [Google Scholar] [CrossRef] [Scilit]
  86. Zhou, P.; Song, F.M.; Huang, X. Environmental regulations and firms’ green innovations: Transforming pressure into incentives. Int. Rev. Financ. Anal. 2023, 86, 102504. [Google Scholar] [CrossRef] [Scilit]
  87. Tang, K.; Qiu, Y.; Zhou, D. Does command-and-control regulation promote green innovation performance? Evidence from China’s industrial enterprises. Sci. Total Environ. 2020, 712, 136362. [Google Scholar] [CrossRef] [Scilit] [PubMed]
Figure 1. Distribution of the maximum duration of continuous green innovation across firms.
Systems 14 01267 g001
Figure 2. Logical framework of the paper.
Systems 14 01267 g002
Figure 3. Parallel trend test.
Systems 14 01267 g003
Figure 4. Confidence intervals of the standard DID in-time placebo effect.
Systems 14 01267 g004
Figure 5. Distribution of standard DID in-space placebo effect.
Systems 14 01267 g005
Figure 6. Distribution of standard DID mixed placebo effect.
Systems 14 01267 g006
Table 1. Definitions and measurements of variables.
Variable TypeVariableSymbolDefinition
Explained VariableCorporate green innovation persistenceGIPSee Equation (2)
Explanatory VariableThe environmental protection tax (EPT)Treat × PostInteraction term between the EPT treatment-group dummy and the year dummy
Control
Variables
Firm size SizeNatural logarithm of employee count
Operating ageAgeNatural logarithm of firm age plus one
ProfitabilityROACurrent net profit/Total assets at year-end
Capital intensityDensityTotal assets/Operating revenue
Firm valueTobinQTobin’s Q value
Board sizeBoardTotal number of directors on the board
CEO dualityDual1 if the board chair concurrently serves as general manager, and 0 otherwise
Proportion of independent directorsIndrIndependent directors/Total number of board members
Ownership concentrationTop1Proportion of shares held by the largest shareholder in the total share capital
Female executivesGender1 if the firm has female executives in the sample year, and 0 otherwise
Table 2. Descriptive statistics.
VariableNMeanSDMinP50Max
GIP23,30447.572108.5310.00013.500792.751
Treat23,3040.2370.4250.0000.0001.000
Post23,3040.7370.4400.0001.0001.000
Treat × Post23,3040.1680.3740.0000.0001.000
Size23,3047.7871.2015.3947.66911.277
Age23,3042.9890.3032.0793.0453.611
ROA23,3040.0390.061−0.2250.0400.200
Density23,3042.2961.5030.4581.8949.352
TobinQ23,3041.9761.1240.8351.6247.101
Board23,3048.3801.5865.0009.00014.000
Dual23,3040.3290.4700.0000.0001.000
Indr23,30437.6835.27633.33036.36057.140
Top123,30433.15014.4428.35930.82773.350
Gender23,3040.6500.4770.0001.0001.000
Table 3. Baseline regression results.
Variable(1)(2)(3)
GIPGIPGIP
Treat × Post9.789 ***9.871 ***10.020 ***
(5.15)(2.64)(2.70)
Size 17.459 ***
(6.99)
Age −7.786
(−0.38)
ROA 38.246 ***
(3.97)
Density 0.840
(1.13)
TobinQ 0.690
(0.98)
Board 0.708
(0.51)
Dual −0.530
(−0.34)
Indr −0.276
(−0.88)
Top1 0.144
(0.71)
Gender −0.930
(−0.46)
_cons45.924 ***45.910 ***−71.098
(58.94)(72.84)(−1.07)
Firm/Year Fixed EffectsNoYesYes
N23,30423,30423,304
R20.0010.7410.744
Note: *** indicate significance at the 1% level. The t-statistics in parentheses are calculated using robust standard errors clustered at the firm level.
Table 4. Results of standard DID in-time placebo test.
Lag PeriodsPlacebo EffectCluster-Robust Standard Errorp-Value95% Confidence Interval
1−0.1604.1500.969−8.2947.974
21.5773.9940.693−6.2529.405
3−5.5133.3580.101−12.0951.070
Table 5. Results of the standard DID in-space placebo test.
Treatment EffectIn-Space Placebo Test
Two-Sided p-ValueLeft-Tail p-ValueRight-Tail p-Value
Treat × Post10.0200.0040.9960.004
Table 6. Results of standard DID mixed placebo test.
Treatment EffectMixed Placebo Test
Two-Sided p-ValueLeft-Tail p-ValueRight-Tail p-Value
Treat × Post10.0200.0100.9940.006
Table 7. Regression results of propensity score matching and entropy balancing.
Variable(1)(2)(3)(4)
Nearest-Neighbor MatchingCaliper MatchingKernel MatchingEntropy Balancing
Treat × Post8.788 **10.016 ***10.016 ***8.244 *
(2.14)(2.70)(2.70)(1.92)
Control VariablesYesYesYesYes
_cons−60.933−70.926−70.92659.428
(−0.76)(−1.07)(−1.07)(0.63)
Firm/Year Fixed
Effects
YesYesYesYes
N16,28523,29323,29323,304
R20.7500.7440.7440.759
Note: ***, **, and * indicate significance at the 1%, 5%, and 10% level, respectively.
Table 8. Robustness checks for GIP measurement, distribution, and fixed-effects specification.
Variable(1)(2)(3)(4)
Alternative Green Innovation OutputDuration-Based Measure of GIPIHS-Transformed GIPProvince-by-Year Fixed Effects
Treat × Post7.612 ***0.307 ***0.171 ***9.814 **
(3.10)(2.94)(3.36)(2.57)
Control VariablesYesYesYesYes
_cons−52.7072.131−0.877−82.350
(−1.04)(1.03)(−0.98)(−1.28)
Firm Fixed EffectsYesYesYesYes
Year Fixed EffectsYesYesYes—
Province × Year Fixed Effects———Yes
N21,19523,30423,30423,303
R20.7580.8930.6870.694
Note: *** and ** indicate significance at the 1% and 5% level, respectively. Province-by-year fixed effects subsume year fixed effects.
Table 9. Accounting for concurrent environmental regulations.
Variable(1)(2)(3)(4)
Central Environmental Protection InspectionsCarbon Emission TradingSupply-Side Capacity ReductionBlue Sky Defense Action Plan
Treat × Post6.983 *10.062 ***9.297 **10.018 ***
(1.95)(2.71)(2.55)(2.71)
Control VariablesYesYesYesYes
_cons−72.152−73.874−71.522−71.173
(−1.09)(−1.12)(−1.08)(−1.07)
Firm/Year Fixed EffectsYesYesYesYes
N23,30423,30423,30423,304
R20.7440.7440.7440.744
Note: ***, **, and * indicate significance at the 1%, 5%, and 10% level, respectively.
Table 10. Robustness checks using triple-difference estimation and alternative clustering.
VariableDDDIndustry Clustering
Treat × Post11.176 **10.020
(2.19)(1.36)
Treat × Region−3.239
(−0.22)
Post × Region0.294
(0.08)
Treat × Post × Region−2.668
(−0.34)
Control VariablesYesYes
_cons13.434 ***−71.098
(14.45)(−0.90)
Firm/Year Fixed EffectsYesYes
N23,30423,304
R20.7440.744
Note: *** and ** indicate significance at the 1% and 5% level, respectively.
Table 11. Effects of the EPT on firm uncertainty, financing constraints, and R&D investment.
Variable(1)(2)(3)(4)(5)(6)
VAR_ADJVAR_RAWKZWWRD_SpendRD_Person
Treat × Post−0.132 ***−0.139 ***−0.324 ***−0.010 ***0.132 ***0.048 **
(−3.33)(−3.28)(−5.58)(−2.68)(4.09)(2.12)
Control VariablesYesYesYesYesYesYes
_cons13.434 ***15.222 ***−13.170 ***−0.564 ***12.601 ***−0.257
(14.45)(15.61)(−11.91)(−9.53)(26.44)(−0.64)
Firm/Year Fixed EffectsYesYesYesYesYesYes
N23,30423,30423,30423,18423,30421,759
R20.4190.5080.7630.4350.9310.945
Note: *** and ** indicate significance at the 1% and 5% level, respectively.
Table 12. Heterogeneity analysis: industry competition, institutional investor ownership, and ownership type.
VariableDegree of Industry
Competition
Institutional Investor
Ownership
Ownership Type
HighLowHighLowSOEsNon-SOEs
Treat × Post6.02512.259 **18.088 ***2.72621.517 ***−1.229
(1.10)(2.23)(2.75)(0.72)(2.67)(−0.37)
Control VariablesYesYesYesYesYesYes
_cons46.589−1.3 × 10²−1.5 × 10²−4.559−534.085 ***−14.679
(0.50)(−1.14)(−1.25)(−0.08)(−2.79)(−0.26)
Firm/Year Fixed EffectsYesYesYesYesYesYes
N11,55010,76711,38911,430665416,650
R20.6720.7330.7400.4720.8010.652
p-Value for Coefficient Difference0.074 *0.000 ***0.000 ***
Note: ***, **, and * indicate significance at the 1%, 5%, and 10% level, respectively.
Table 13. Heterogeneity analysis: information transparency, technological attributes, and executive risk preference.
VariableInformation
Transparency
Technological
Attributes
Executive Risk
Preference
HighLowHigh-TechNon-High-TechHighLow
Treat × Post19.185 **5.911 *6.44412.434 **17.037 ***3.673
(2.53)(1.78)(1.16)(2.52)(2.69)(1.00)
Control VariablesYesYesYesYesYesYes
_cons−2.1 × 10254.160−121.878−53.299−1.4 × 10²−26.781
(−1.58)(0.91)(−1.48)(−0.57)(−1.27)(−0.31)
Firm/Year Fixed EffectsYesYesYesYesYesYes
N10,91312,391728816,01610,99511,012
R20.7280.5430.6940.7560.7240.658
p-Value for Coefficient Difference0.029 **0.076 *0.002 ***
Note: ***, **, and * indicate significance at the 1%, 5%, and 10% level, respectively.
Disclaimer/Publisher’s Note: The statements, opinions and data contained in all publications are solely those of the individual author(s) and contributor(s) and not of MDPI and/or the editor(s). MDPI and/or the editor(s) disclaim responsibility for any injury to people or property resulting from any ideas, methods, instructions or products referred to in the content.