Article

Real-Time Risk Identification of Rear-End Conflicts at Unsignalized Intersections

School of Traffic and Transportation Engineering, Central South University, Changsha 410075, China
*
Author to whom correspondence should be addressed.
Systems 2025, 13(9), 827; https://doi.org/10.3390/systems13090827
Submission received: 12 August 2025 / Revised: 15 September 2025 / Accepted: 17 September 2025 / Published: 20 September 2025

Abstract

Rear-end collisions at unsignalized intersections remain a persistent issue in urban traffic environments, particularly at stop-controlled junctions. This study develops a real-time predictive model aimed at identifying potential rear-end conflicts, employing Deep & Cross Network Version 2 (DCNV2) to improve prediction accuracy. The methodology comprises three main components: data acquisition, model development, and interpretability analysis. Real-time vehicle trajectory data such as speed, inter-vehicle distance, and interaction behavior are collected and preprocessed before being analyzed using the DCNV2 model to uncover patterns associated with conflict risk. The model integrates cross-feature interactions to enhance predictive performance. Evaluation metrics, including accuracy, recall, and area under the curve (AUC), demonstrate that DCNV2 outperforms conventional classifiers such as logistic regression and support vector machines. To further evaluate model interpretability, SHapley Additive exPlanations (SHAP) are applied, revealing that short following distances, large speed differentials, and high traffic volumes on major roads are primary contributors to rear-end conflict risk. The findings provide actionable insights to inform proactive traffic safety strategies, particularly in urban areas where limited signalization or manual control exposes drivers to increased uncertainty. This predictive framework supports the development of real-time safety interventions and contributes to more effective risk mitigation at critical locations within the traffic network.

1. Introduction

Road safety remains a significant concern across the European Union, with a notable increase in road deaths in recent years, reaching 46 deaths per million inhabitants in 2022 [1]. Urban intersections are particularly hazardous, accounting for a significant portion of road injuries across the region. In Germany, despite a long-term decline in fatalities, there was a 9% increase in 2022, particularly at crossroads and T-junctions, which continue to report the highest accident rates [2]. These types of intersections make up a significant proportion of all accident-prone intersection types in the country. Notably, a considerable number of serious car-to-car accidents with injuries take place at intersections, making them a critical focus for safety improvements. Urban environments, which account for half of intersection-related accidents, are associated with a lower proportion of fatalities. The varying proportions of road fatalities at intersections across the EU underscore the need for focused research [3], especially for unsignalized intersections, which are often underexamined yet present unique risks that must be addressed in future safety assessments and intervention strategies
Among traffic collisions, rear-end collisions at unsignalized intersections have been identified as a significant safety concern, particularly in developing countries like India, where traffic operates in a less regulated and more chaotic environment. These types of collisions are particularly severe due to the high speeds often involved, especially on intercity highways. The study by [4] highlights the role of rear-end conflicts at unsignalized intersections, noting that a combination of traffic violations, unpredictable vehicle movements, and inadequate enforcement of right-of-way rules typically causes such incidents. This unpredictability is exacerbated by mixed traffic conditions, where vehicles of varying sizes and speeds interact in an environment lacking formal signal control. According to the study, rear-end conflicts are especially prevalent at intersections where vehicles on major roads suddenly slow down or stop due to obstructions caused by non-prioritized vehicles, which then lead to secondary collisions. Subsequently, there is an urgent need for proactive safety measures to identify these conflicts before they escalate into crashes, using surrogate safety measures like time to collision (TTC), deceleration rates, and others.
Recently, researchers have explored various statistical [5] and machine learning-based methods for conflicts prediction. Early studies primary employed statistical models including conditional logit and logistic regression [6,7]. While those models offer a foundation, they often rely on restrictive assumptions and struggle with complex data, limiting their ability to capture intricate traffic dynamics. To overcome these limitations, machine learning models, especially deep learning, have gained prominence. These models are capable of handling large and complex datasets, as well as modeling nonlinear relationships between traffic variables [8,9]. Deep learning is particularly well-suited for modeling dynamic traffic states, presenting a promising tool for predicting risk at unsignalized intersections—a critical area that requires further exploration.
To address these limitations, this study presents a novel deep learning framework for predicting rear-end conflicts at unsignalized intersections. From extracted real-time trajectory data, the interaction between vehicles traveling through intersections is captured in detail, allowing for the identification of one-dimensional conflicts. The Deep & Cross Network Version 2 (DCNV2) model is then used to predict the rear-end conflicts probability with Shapley Additive exPlanations (SHAP) to analyze conflict factors. This study makes three distinct contributions to the existing research:
  • Proposing an advanced deep learning framework capable of accurate feature extraction and prediction of rear-end traffic conflicts from accurately extracted features at unsignalized intersections.
  • Developing a data-driven approach for proactive safety management to improve road safety.
  • Employing SHAP (Shapley Additive Explanations) to examine the influence of traffic parameters at lane-level on traffic conflicts at unsignalized intersections in real-time, providing insightful interpretations to city planners and policy makers.
The rest of this paper is structured as follows. Section 2 provides a detailed review of previous research. Section 3 outlines the proposed framework methods along with the deep learning algorithm. Section 4 presents the results and discussion of the findings. Lastly, Section 5 summarizes the main conclusions of the study.

2. Literature Review

2.1. Unsignalized Intersection Safety Research

Intersection safety has been extensively studied in the literature, yet most research has focused on signalized intersections. Early research focused on the safety of signalized intersections from a broad perspective [10,11,12]. More recent studies have employed the bivariate extreme value model and the Peak Over Threshold Approach for estimating road safety and crashes [13]. They integrated different traffic conflict indicators using a bivariate extreme value model to assess road safety, and then validated this model with actual crash data. The results revealed that most estimated crashes fell within the 95% Poisson confidence interval of the observed crashes, suggesting that the bivariate extreme value model is an effective method for road safety estimation.
Although unsignalized intersections play a crucial role and are widely present in traffic networks across countries such as the United States, Germany, India, and Canada, they have not received the same level of research attention as other road segments. Existing research has primarily focused on assessing safety and analyzing driver behavior. As for microscopic safety evaluation, the early studies heavily relied on simulations, which often didn’t fully capture the complexities of real-world unsignalized intersections [14,15,16].
Furthermore, some studies have not examined how drivers behave when crossing uncontrolled intersections with a vehicle traveling through the through lanes, which could be particularly important in SSMs. High-resolution trajectory data [17,18], capturing vehicle movement at a microscopic level, is widely used in analysing microscopic traffic conflicts, particularly in modeling the risks associated with car-following [19,20,21], and lane-changing process [22,23,24], vehicle-pedestrian interactions based on conflict risk measures. Unlike studies that model microscopic vehicle interactions, some researchers have estimated conflict frequency using traffic state [25], frequency and severity [26], and to derive conflict-based safety indicators [27]. Prior research indicates a strong correlation between traffic flow characteristics and rear-end conflicts. These studies are considered aggregate safety research, focusing on identifying locations with a higher likelihood of conflict occurrence.
In conclusion, several gaps persist in the existing research on unsignalized intersection safety. Firstly, there is a notable lack of focus on the local safety of these intersections, which is fundamental to improving overall safety performance. Secondly, while there has been a significant shift towards autonomous driving trajectory planning, research on the microscopic behaviour of human-driven vehicles that still dominate unsignalized intersections, remains limited. Lastly, the reliance on simulation environments in many studies may overlook critical real-world characteristics of these intersections.

2.2. Review of Modified Time to Collision

Previous research has utilized surrogate safety measures (SSMs) to evaluate traffic conflict risks, with Time to Collision (TTC) being the most widely applied. Defined by [28] as the “time to get in a collision with the leading vehicle if the path and speed of both vehicles remain unchanged,” TTC is favored for its simplicity and computational efficiency, making it well-suited for real-time applications. TTC’s ability to consider both vehicle speed and spatial proximity, encompassing the ego vehicle and surrounding objects, allows for effective active safety management. It has been successfully used in various traffic scenarios, including car-following situations [29], unstructured traffic environments [30], and multi-lane weaving areas [31]. However, while TTC offers valuable insights into potential collision risks, it does not account for driver behavior or vehicle dynamics, which are critical factors influencing collision likelihood.
To address the limitations of TTC, researchers have introduced modified indicators, such as the Modified Time to Collision (MTTC), to accommodate more complex traffic situations. TTC is effective only when vehicles are on a collision course, which typically means the following vehicle is faster than the leading one. However, in cases where vehicles are not directly on a collision course but still have the potential for conflicts due to speed changes, [32] introduced MTTC. This modification relaxes the constant speed assumption and incorporates vehicle accelerations. MTTC is increasingly used in conflict measures to estimate intersection accident frequencies and severities [33]. While TTC and PET are commonly used SSMs at unsignalized intersections, they have limitations in predicting the likelihood and severity of accidents based on individual estimates. To address this, MTTC has been incorporated into more advanced SSMs, considering factors such as deceleration rates to capture potential evasive maneuvers.
More recent studies have applied MTTC to enhance conflict prediction models. For instance, Z. [34] utilized MTTC in conjunction with proximal surrogate indicators to analyze the temporal and spatial distribution of traffic conflicts, creating spatiotemporal conflict heatmaps. Their results indicated that conflicts at a signalized T-intersection were most frequent within the initial 10% of the green light phase and within 10 m downstream of the entrance road’s stop line. Furthermore, a comparison of MTTC and the conflict indicator (CI) revealed that conflicts with the same MTTC values could vary in severity, a distinction effectively captured by the CI. This highlights the potential of combining MTTC with other advanced techniques to provide more nuanced insights into the risk and severity of traffic conflicts.

2.3. Modelling Techniques for Risk Prediction (Real-Time Conflict-Based Studies)

Recent studies in real-time traffic conflict prediction have introduced innovative methods using machine learning [35,36] and diverse data sources [37]. Ref. [38] utilized Bayesian deep learning with LiDAR data to predict conflicts at signalized intersections, offering reliable predictions but relying on advanced infrastructure. Ref. [39] improved model transferability by applying deep transfer learning to predict conflicts in merging areas, although it demands high computational resources. Ref. [40] focused on pedestrian safety, developing a real-time conflict prediction model using Extreme Gradient Boosting and ATSPM data, which excels in predicting pedestrian-vehicle conflicts. However, it is influenced by video quality. These studies highlight the potential of data-driven approaches while also facing challenges in infrastructure and scalability.
While numerous studies focus on real-time conflict prediction using individual vehicle kinetics like velocity, distance, acceleration, and deceleration [41,42], traffic flow features have received comparatively less attention. Some research has applied traffic flow variables such as average speed, speed variability, and volume using methods similar to crash-based studies [6,43], but these efforts face limitations like small datasets due to complex data collection from video [44]. Ref. [43] used traffic simulations to address this, but machine learning models often lack explanatory power regarding the relationship between traffic flow and conflict frequency. As traditional crash-based methods are reactive and limited by data scarcity, conflict-based prediction has gained significant attention as a proactive tool to identify potential risks before accidents occur [17,45]. The development of conflict-based models, particularly with advanced technologies, represents a valuable tool for enhancing safety, especially in complex traffic scenarios such as unsignalized intersections.

3. Methodology

As shown in Figure 1, the methodology of this study consists of two parts: constructing a traffic conflict dataset and developing an interpretable deep learning model.

3.1. Data Construction

3.1.1. Trajectory Dataset

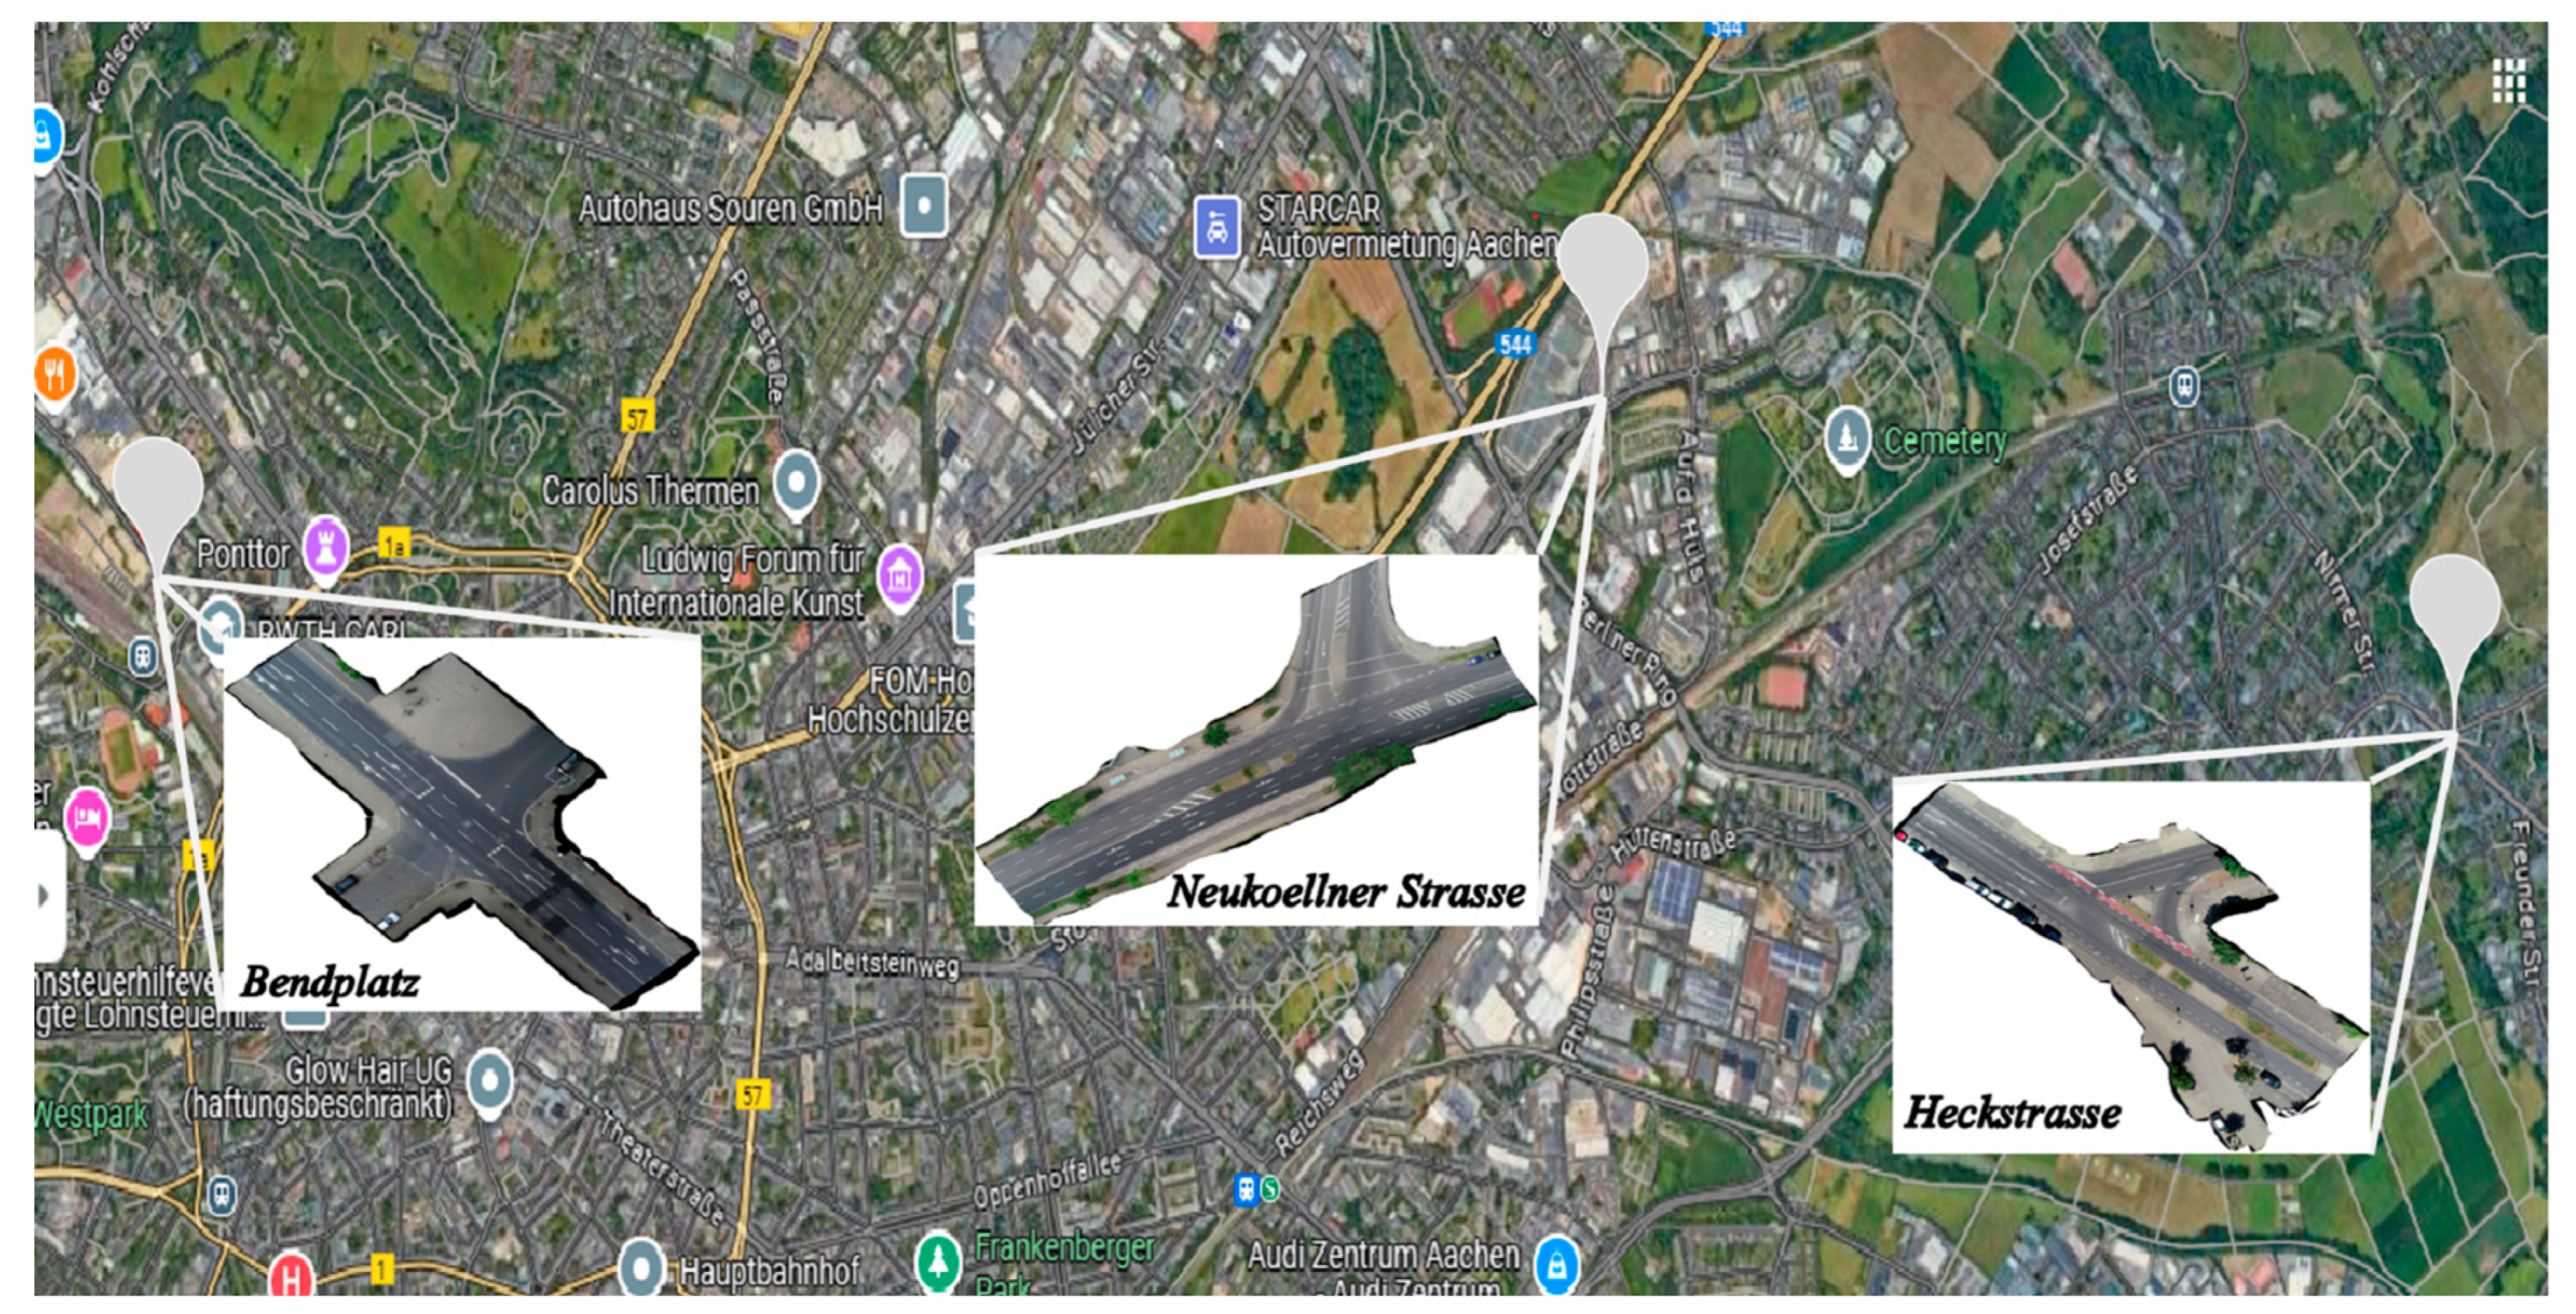
This study makes use of the Intersection Drone Dataset (inD), an open-access empirical dataset introduced by [46]. The inD dataset was chosen for its high-resolution, drone-based trajectories at unsignalized intersections, offering precise measures of vehicles speed, acceleration, and spacing making it very suitable for rear-end conflict analysis. The dataset comprises aerial video recordings captured at 4K resolution (4096 × 2160 pixels) and 25 frames per second using drones operated at 100 m high during stable weather conditions, including sufficient lighting and minimal wind. Data were collected over a span of more than 10 h at four unsignalized intersections in Germany. In total, the dataset includes 11,500 traffic participant trajectories, covering various vehicle types—such as cars, buses, and trucks—as well as more than 5000 trajectories representing vulnerable road users (VRUs), including cyclists and pedestrians. Trajectory extraction was performed using advanced computer vision algorithms, specifically a modified U-Net network for semantic segmentation [47] and Rauch–Tung–Striebel (RTS) smoothing [48] for post-processing. The resulting positional data achieves a spatial accuracy of under 10 cm. Each frame contains structured trajectory information, including attributes such as track ID, classification of road user type, velocity, and acceleration. Figure 2 illustrates the locations from which the data were recorded.

3.1.2. Conflict Identification

Traffic conflicts are defined as interactions between two or more vehicles that significantly increase the risk of collision should their current trajectories continue, as described by [49]. The evaluation of such high-risk interactions is commonly quantified using a risk threshold. Among various safety surrogate measures (SSM), Time-to-Collision (TTC), originally introduced by [28], remains one of the most widely adopted indicators for identifying potential conflicts [33]. This research concentrates on evaluating safety at unsignalized intersections with a view towards practical, real-time applications. Given the computational complexity involved, the study employs the Modified Time-to-Collision M T T C metric proposed by [32]. This metric improves upon the original TTC by incorporating vehicle acceleration and deceleration effects, thereby relaxing the constant velocity assumption inherent in simpler models, to more accurately assess potential conflict situations. The M T T C is computed as follows:
M T T C t = v t ± v t 2 + 2 a t x L , t x F , t D L a t
where v t = v F , t v L , t is the relative speed between leading and following vehicles at time t , and a t = a F , t a L , t is the relative acceleration between leading and following vehicles at time t . The M T T C is determined by two conditions: if both calculated values are positive, the smaller value is selected; if one value is positive and the other is negative, the positive value is chosen. Because a threshold is required to identify potential conflicts when using M T T C , previous studies have proposed various approaches for determining appropriate conflict thresholds [42,43,50].

3.1.3. Traffic Characteristics Extraction

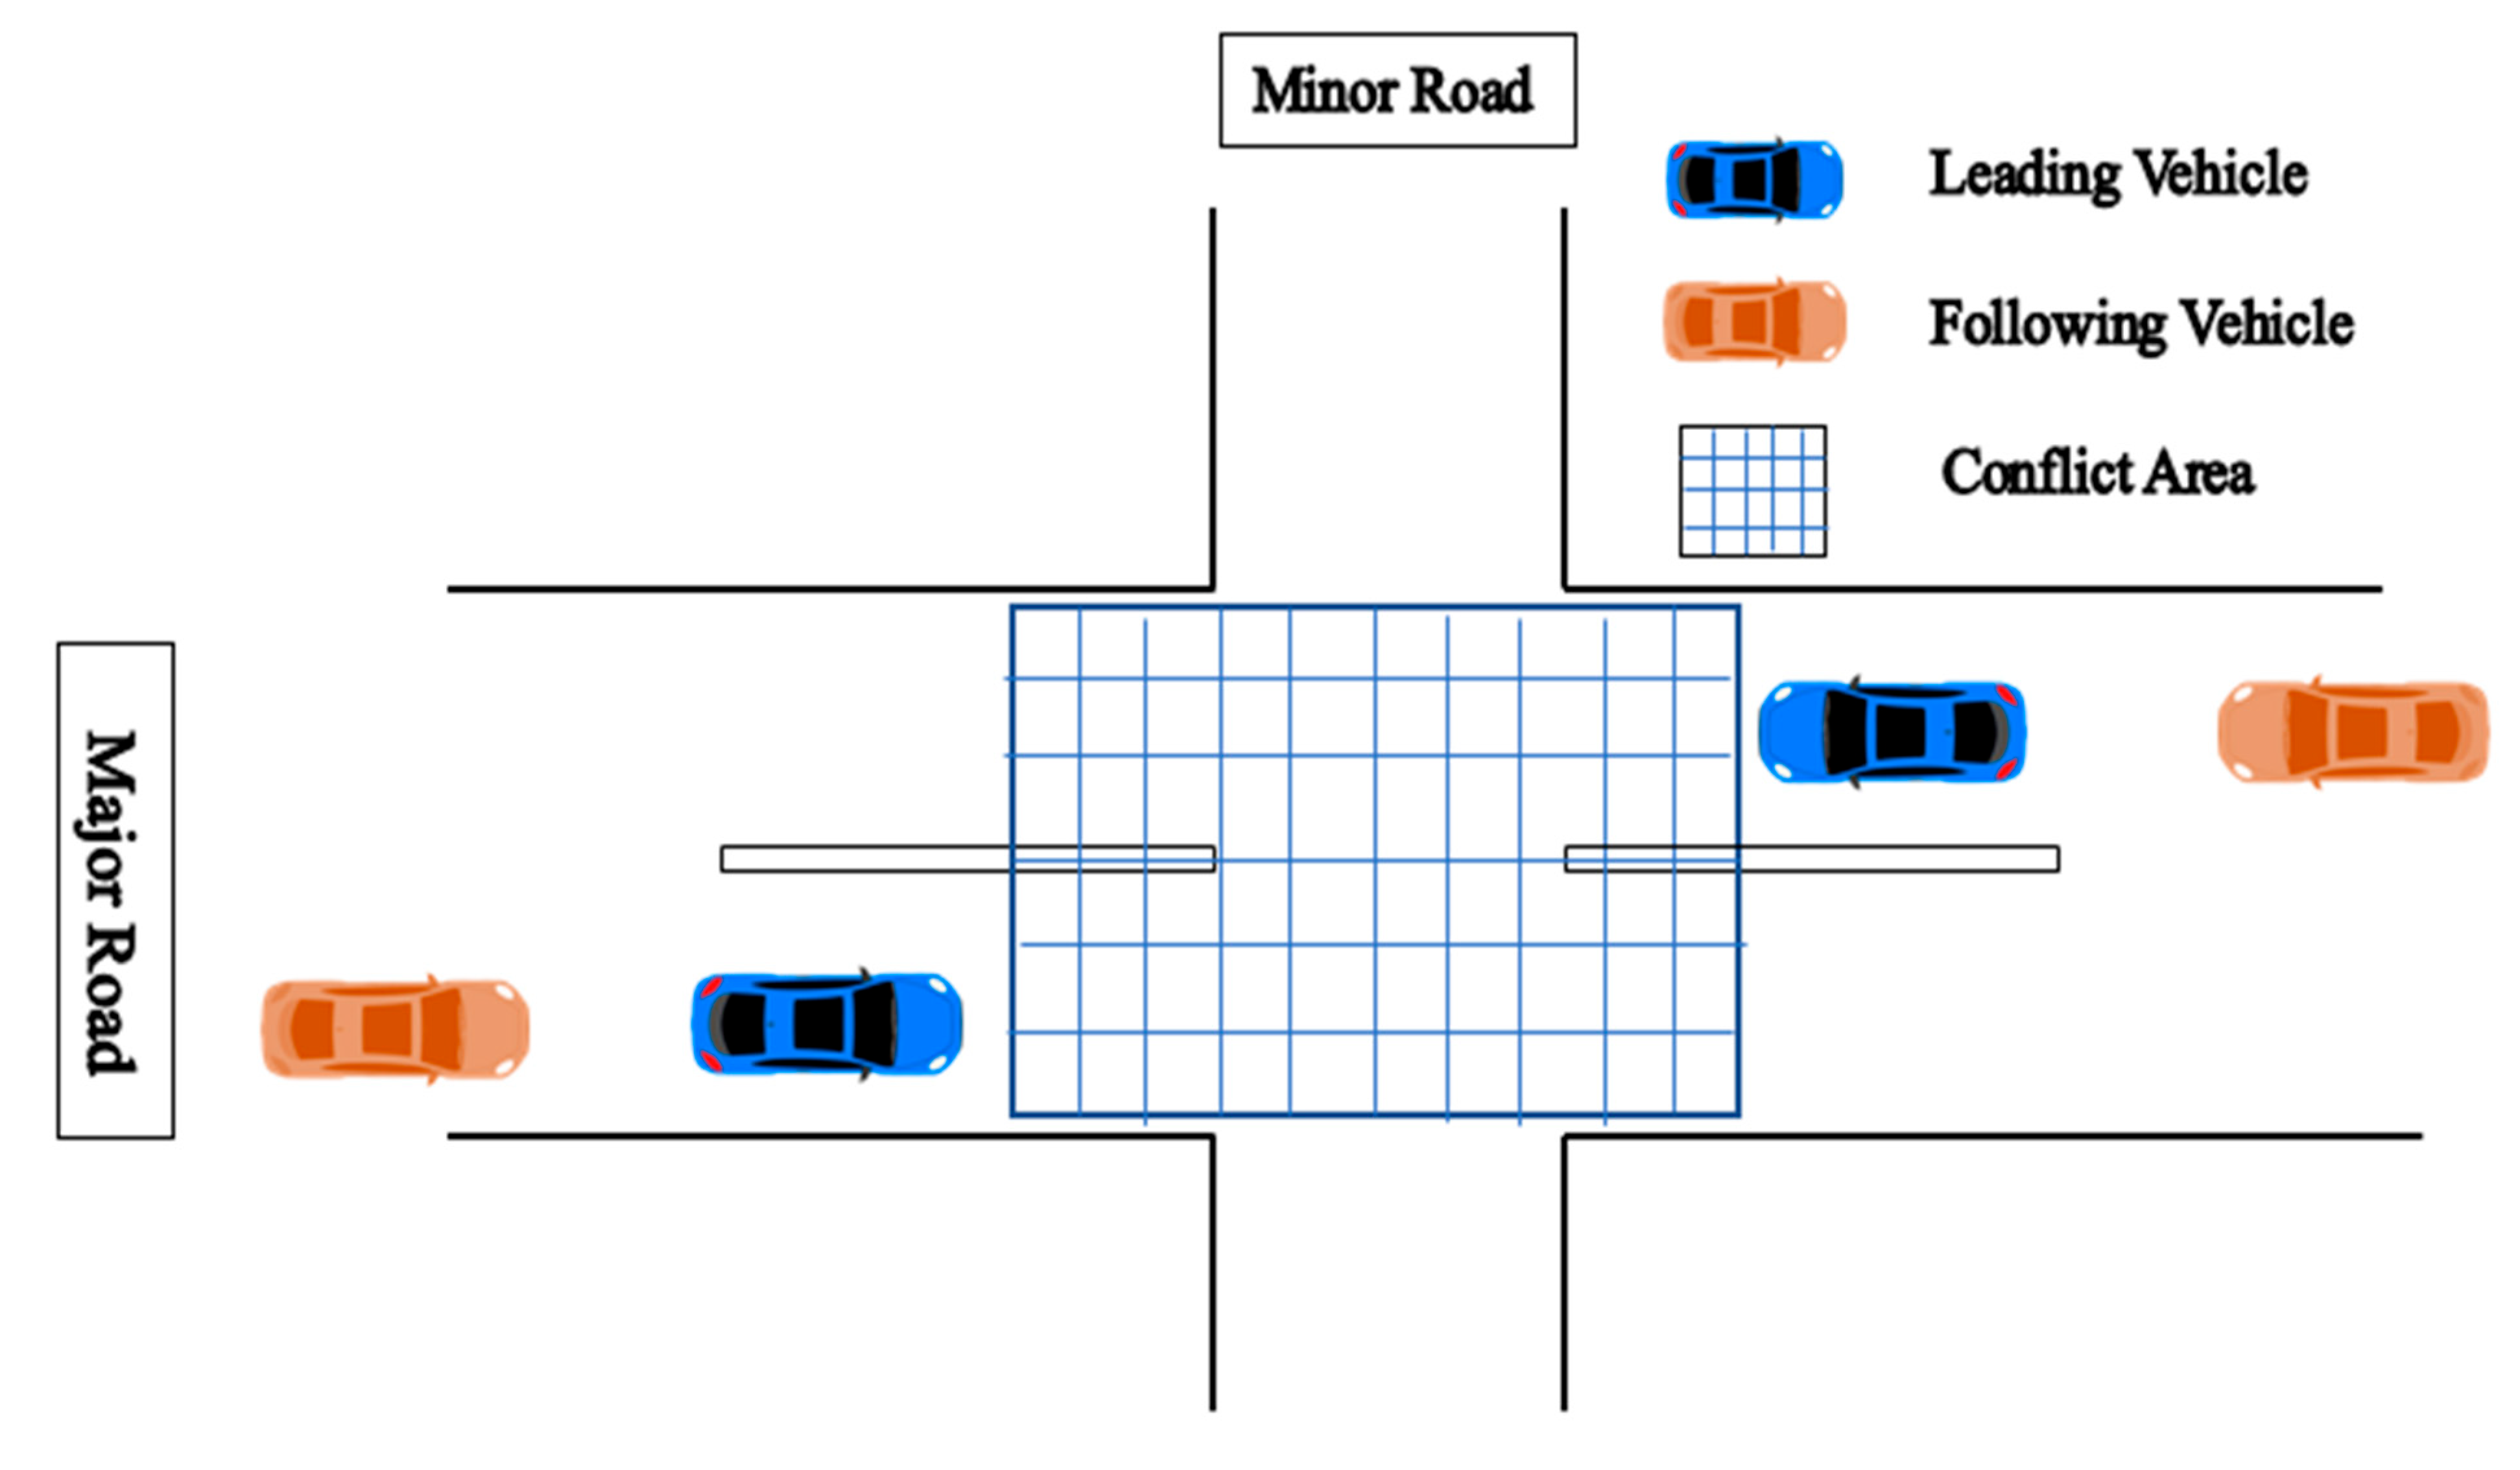
Technology advancements have enhanced the extraction of high-resolution crash data, providing researchers with opportunities to develop effective traffic safety solutions. However, challenges persist in maximizing the utility of this data for practical applications. In crash studies, microscopic variables including velocity, acceleration, and lane occupancy offer critical insights into driver behavior and roadway accidents. Following similar extraction techniques found in [17,51], those studies utilize the microscopic variables to measure rear-end traffic conflicts at three unsignalized intersections (Bendplatz, Heckstrasse, and Neukoellner Strasse) in Germany. As shown in Figure 3, vehicles’ trajectories were analyzed by pairing passing vehicles on the same lane into leading and following groups, then calculating the Modified Time-to-Collision (MTTC) for each frame. Only vehicle pairs traveling straight through the intersection (excluding turns) were included in the analysis. An M T T C threshold of 4 s was selected based on several commonly adopted values in existing studies on intersection safety [13,52] and resulting in 607 vehicle pairs, comprising 210 conflicts and 397 non-conflicts. As shown in Table 1, 15 features were extracted for further examination.

3.2. Interpretable Machine Learning Modeling

A key component of any machine learning model is data splitting. This involves dividing the entire dataset into two parts: one for training and the other for testing. The model is trained on the training subset and assessed using the test subset. The performance on the test set enables comparison of models based on their predictions for data they have not encountered before. Typically, the training and test datasets are split in an 80:20 ratio. In our case, this proportion has been chosen, resulting in a total of 486 vehicle pairs for the training set and 121 for the test set.

3.2.1. Deep Cross Network V2 (DCNv2)

Deep Cross Network V2 (DCNv2) is an advanced deep learning model designed to learn both low- and high-order feature interactions efficiently. This model is particularly effective in handling complex and high-dimensional data, such as vehicle trajectories and microscopic traffic variables used in traffic safety analysis. The DCNv2 architecture consists of two main components: the cross-network and the deep learning network, which are designed to jointly model feature interactions at different levels of complexity.
  • Cross Network Component
The cross network in DCNv2 is used to explicitly model the interactions between features at each layer, making it suitable for learning feature crosses effectively. The cross network is implemented recursively, and each layer transforms the input as follows:
x l + 1 = x 0 w ( l ) T x l + b l + x l
where x ( 0 ) R d is the original input vector, which in this study contains features such as average velocity, acceleration, and other microscopic traffic variables. w ( l ) R d is a weight vector for the l -th layer, representing how much weight is assigned to the interaction between features. b ( l ) R is the bias term for the l -th layer. x ( l ) R d is the output from the previous layer, where l = 0 , 1 , 2 , , L and L is the number of cross layers. The recursive use of the original input vector x ( 0 ) allows each layer to build upon previous cross features, effectively modeling high-order feature interactions without introducing an excessive number of parameters. This is particularly useful for capturing intricate relationships in traffic data, such as those that may arise from interactions between vehicle speed, acceleration, and relative distances.
  • Deep Network Component
In addition to the cross-network, DCNv2 includes a deep network composed of multiple fully connected layers, allowing the model to learn higher-level abstract features. The deep network operates in parallel with the cross network, and each layer is defined by
h l + 1 = σ W l h l + b l
where h ( l ) is the output of the l -th layer. W ( l ) is the weight matrix for the l -th layer. b ( l ) is the bias term. σ ( · ) represents the activation function, typically a ReLU (Rectified Linear Unit) function, which introduces non-linearity. The deep network helps in learning implicit feature interactions and extracting complex representations, which is essential for predicting the occurrence of traffic conflicts with high accuracy.
  • Combined Output
The cross network and deep network outputs are concatenated and passed through a final fully connected layer to make the final prediction. The combined representation is given by
z = x L , h L
where x ( L ) is the final output from the cross network and h ( L ) is the final output from the deep network. The concatenated vector z   is then fed into a fully connected layer to produce the final prediction:
y ^ = σ W o u t z + b o u t
where W o u t and b o u t are the weights and bias of the output layer, and σ represents an activation function such as a sigmoid or softmax function, depending on the task. In this study, y ^ represents the predicted probability of a traffic conflict occurring at the unsignalized intersection.
  • Loss Function
The training of DCNv2 is formulated as an optimization problem, aiming to minimize the prediction error. In this study, since the task is to predict the occurrence of traffic conflicts (a binary classification problem), the binary cross-entropy loss function is used. The loss function for a single training example is defined as
L y ^ , y = y log y ^ + 1 y l o g 1 y ^
where y { 0 , 1 } is the true label, with y = 1 indicating the occurrence of a conflict and y = 0 otherwise. y ^ is the predicted probability of a conflict, as computed by the model. For the entire dataset, the loss function is summed over all training examples:
L t o t a l = 1 N i = 1 N L y ^ i , y i
where N is the total number of training samples. The model parameters are optimized using gradient descent or a variant such as Adam to minimize L t o t a l , thereby improving the accuracy of the conflict predictions. DCNv2 was selected because of its ability to explicitly model both low- and high-order feature interactions with fewer parameters, which is particularly suitable for structured tabular data used in traffic conflict prediction. Unlike CNNs or RNNs, which are more appropriate for image or time-series data, DCNv2 can effectively capture complex interactions between traffic parameters such as velocity, acceleration, and inter-vehicle distance, providing interpretable and high-performing predictions for structured input.

3.2.2. SHapley Additive exPlanations (SHAP)

Although DCNv2 offers high predictive power, its inherent complexity makes it challenging to interpret. To address this issue, this study incorporated SHapley Additive exPlanations (SHAP) as an interpretability tool [53,54,55]. SHAP is a post hoc interpretability method based on cooperative game theory, specifically the Shapley value concept, which ensures that the contribution of each feature to the model output is fairly allocated. This is particularly useful in traffic safety analysis, where understanding the contribution of each feature to the risk of conflict is crucial for decision-making.
The SHAP values are computed for each feature by considering the model’s output difference when the feature is present versus absent, across all possible combinations of features. Given a model f and an input instance x = x 1 , x 2 , , x d , the value of SHAP for the feature x i is defined as
ϕ i = S x 1 , x 2 , , x d x i S ! d S 1 ! d ! f S x i f S
where S represents a subset of all features except x i , | S | is the cardinality of a subset S , and d is the total number of features. The term f S x i represents the model’s prediction when feature x i is included in subset S , while f ( S ) represents the prediction without the feature x i . By calculating SHAP values for each prediction made by the DCNv2 model, it is possible to determine the impact of specific variables, such as vehicle speed, acceleration, or inter-vehicle distance, on the predicted risk of traffic conflicts. This interpretability is critical in understanding how certain driving behaviors or environmental conditions contribute to increased conflict risk.
Interpretable machine learning was employed to ensure that predictive outcomes are transparent and actionable. In particular, SHAP analysis enables the identification of influential features (e.g., acceleration variability, velocity differences), allowing model results to be meaningfully connected to traffic safety interventions and policy design. This combination of predictive power and interpretability strengthens the applied value of the proposed framework.

4. Results and Discussion

4.1. Hyperparameter Configuration of DCNv2

The Deep & Cross Network Version 2 (DCNv2) model was configured to strike a balance between predictive accuracy, computational efficiency, and interpretability. The model architecture comprises a cross-network for explicit feature interactions and a deep network for high-order feature learning. Table 2 summarizes the final hyperparameter settings.
The model employs four cross layers to capture complex feature interactions and four deep layers with 256, 128, 64, and 32 neurons, respectively. The ReLU activation function is used in the deep network, while a linear transformation is applied in the cross network. The Adam optimizer was chosen for its adaptive learning capabilities, with an initial learning rate of 0.001, which is decayed by a factor of 0.96 every 10 epochs to improve stability. The binary cross-entropy loss function was used for classification. A batch size of 64 was used to balance training efficiency and convergence stability. The model was trained for up to 100 epochs, with early stopping implemented to mitigate overfitting. L2 regularization ( λ = 0.0001) and dropout (rate = 0.3) were applied to improve generalization.

4.2. Prediction Performance

  • To validate the validity and sophistication of the model, commonly used algorithms were employed to compare the prediction performance.
  • LR (Logistic Regression): Logistic Regression is a linear model used for binary classification tasks, predicting the probability of a categorical outcome based on one or more independent variables. Optimal performance is achieved when a near-linear relationship exists between the features and the target variable.
  • KNN (K-Nearest Neighbors): K-Nearest Neighbors is a straightforward, instance-based learning algorithm that assigns a class to a data point based on the most common label among its closest neighbors. It is non-parametric and relies on a distance metric, such as Euclidean distance, to measure similarity.
  • DT (Decision Tree): A Decision Tree is a tree-structured model used for classification and regression tasks, where decisions are made by splitting the data into subsets based on specific feature values. It creates a model that represents a series of decisions leading to a predicted outcome, making it interpretable and easy to understand.
  • SVM (Support Vector Machine): Support Vector Machine is a supervised learning algorithm that finds the optimal hyperplane to separate classes in a high-dimensional space, making it an effective classification for linear and non-linear by using kernel functions to transform input features.
  • XGB (Extreme Gradient Boosting): XGBoost is an ensemble learning algorithm that uses gradient boosting to combine multiple weak learners, typically decision trees, into a strong predictive model. It is known for its efficiency, accuracy, and capability to handle large-scale data and complex relationships.
  • DNN (Deep Neural Network): Deep Neural Network is an artificial neural network with multiple hidden layers, capable of learning high-level abstractions from data. It is widely used for complex tasks, such as image recognition and natural language processing, due to its ability to model non-linear relationships.
  • DCN (Deep Cross Network): Deep Cross Network combines both cross-layer and deep neural network components to learn feature interactions at different levels. It is particularly effective for learning both low-order and high-order feature interactions, making it suitable for complex data environments.
  • Accuracy, Recall, and AUC were used as evaluation metrics for predicting outcomes. Accuracy is defined as the fraction of correctly classified instances over all instances in the evaluation set. It is often used to assess a model’s performance across all classes when the dataset has a balanced distribution.
A c c u r a c y = T P + T N T P + F N + F P + T N
where T P , T N , F P and F N are given in the following confusion matrix of Table 3. Recall, also called Sensitivity or True Positive Rate, indicates how effectively the model identifies positive instances. It is crucial in scenarios where minimizing false negatives is important, such as in medical testing, where missing a positive case could have severe consequences.
R e c a l l = T P T P + F N
The AUC metric, or Area Under the Curve, measures the ability of a classification model to differentiate between classes. It specifically refers to the area under the Receiver Operating Characteristic (ROC) curve, which plots the True Positive Rate (TPR) versus the False Positive Rate (FPR) at different threshold levels. When the value of AUC is closer to 1, the model performance is better at distinguishing positive and negative classes.
A U C = 0 1 T P R F P R d F P R
where
F P R = F P F P + T N
T P R = T P T P + F N
Table 4 shows the overall performance of each model used for predicting rear-end conflicts at unsignalized intersections. The DCNv2 (Deep & Cross Network Version 2) outperforms the other models, reaching an accuracy of 0.93, a recall of 0.90, a precision of 0.90, an F1-score of 0.90, and an AUC of 0.92, making it the most reliable for accurate and comprehensive rear-end conflict prediction. DCN is the second-best model, with an accuracy of 0.92, a precision of 0.88, an F1-score of 0.89, and an AUC of 0.91, indicating impressive capabilities for robust prediction. Although the improvement from DCN to DCNv2 in accuracy, precision, and AUC is numerically marginal, the architectural enhancements in DCNv2—such as the use of low-rank matrix decomposition in cross layers—offer better generalization and stability during training, which is especially important when extending to larger or more complex datasets. In safety-critical applications, even small gains in predictive performance can be meaningful in reducing risks. SVM (Support Vector Machine) also performs strongly with an accuracy of 0.91, precision of 0.89, F1-score of 0.88, and an AUC of 0.90, proving it to be an effective model. XGBoost and DNN exhibit good performance with balanced recall and precision values (0.86–0.88) and F1-scores around 0.86–0.87, though their AUCs are slightly lower (0.87), showing they are reliable but not the top performers. LR (Logistic Regression) offers moderate prediction with an accuracy of 0.88, precision of 0.86, F1-score of 0.84, and an AUC of 0.87. DT (Decision Tree) and KNN (K-Nearest Neighbors) are the least effective, with KNN showing the lowest metrics (accuracy 0.81, recall 0.71, precision 0.77, F1-score 0.74, AUC 0.78), indicating that it may not be suited for accurate rear-end conflict prediction.

4.3. Models’ Interpretation

DCNv2 achieves superior predictive performance because of its low-rank cross layers, which efficiently capture high-order interactions among heterogeneous traffic features while reducing parameter complexity. This makes the architecture particularly well-suited for conflict prediction, where subtle feature interactions such as speed variation and spacing are critical.

4.3.1. Variable Importance

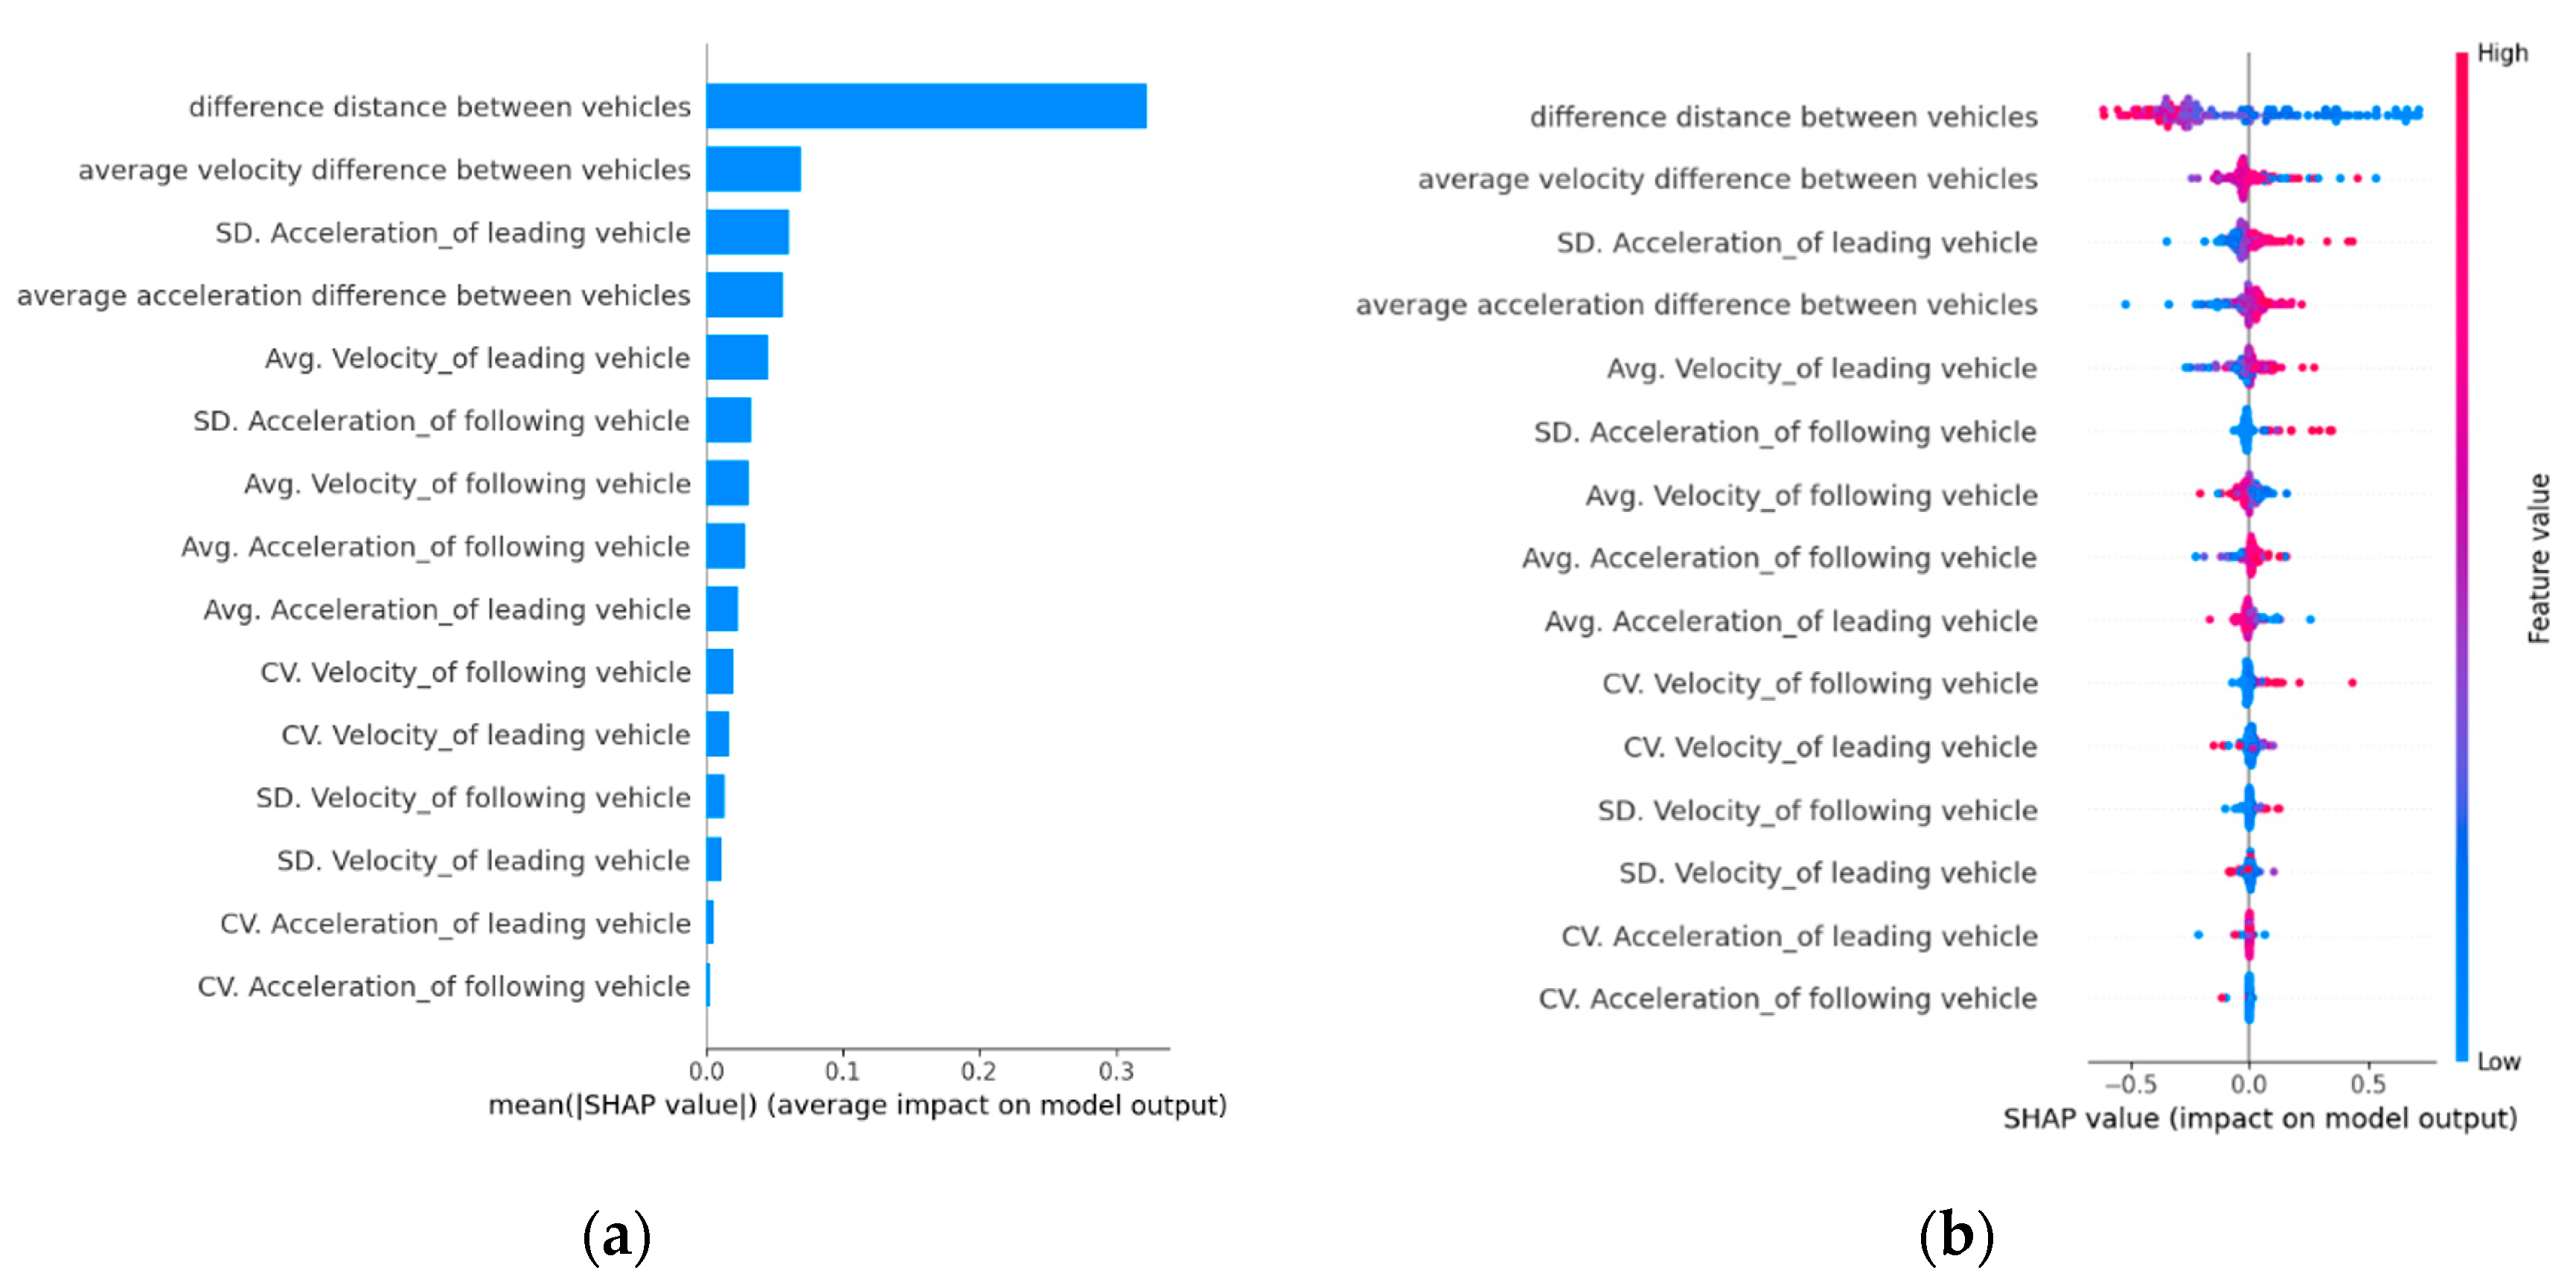
From Figure 4b, the five most influential factors on rear-end conflict frequency in the dataset are the difference in distance between vehicles, the average velocity difference between vehicles, the average SD acceleration of the leading vehicle, the average acceleration difference between vehicles, and the average velocity of the leading vehicle. Figure 4a shows that the distribution of the red portions of these top five features is located within the positive values of SHAP region, suggesting a positive association with the frequency of rear-end traffic conflicts.
Notably, the difference in distance between vehicles has a positive impact on the frequency of rear-end conflicts, suggesting that a lower difference in distance between both leading and following vehicles leads to more rear-end conflict frequency at the intersection. Similarly, the average velocity difference between vehicles also positively impacts rear-end conflict frequency, indicating that decreasing the average velocity difference between vehicles, especially if the following vehicle is traveling faster, raises the conflict possibility. In addition, the inconsistency of SD acceleration of the leading vehicle indicates an abnormal driving or a sudden braking incident. Higher inconsistency can surprise the following vehicle, increasing the likelihood of rear-end conflict if they are unable to adjust their velocity quickly. The average acceleration difference suggests that any mismatch in acceleration between the leading and following vehicles may result in a mismatch in speed, which can lead to an increase in rear-end conflict frequency. In the same way, the average velocity of leading vehicles plays a crucial part in traffic conflicts. The speed affects how fast the following vehicles need to adjust to maintain a safe following distance. Since only vehicles going through (no turning left or right) on the main roads at each intersection are included in the study, they therefore experience higher traffic flow, acceleration, and deceleration. Increased acceleration and deceleration of vehicles on main roads approaching intersections correspond to a higher risk of rear-end conflicts.

4.3.2. Variables Interactions

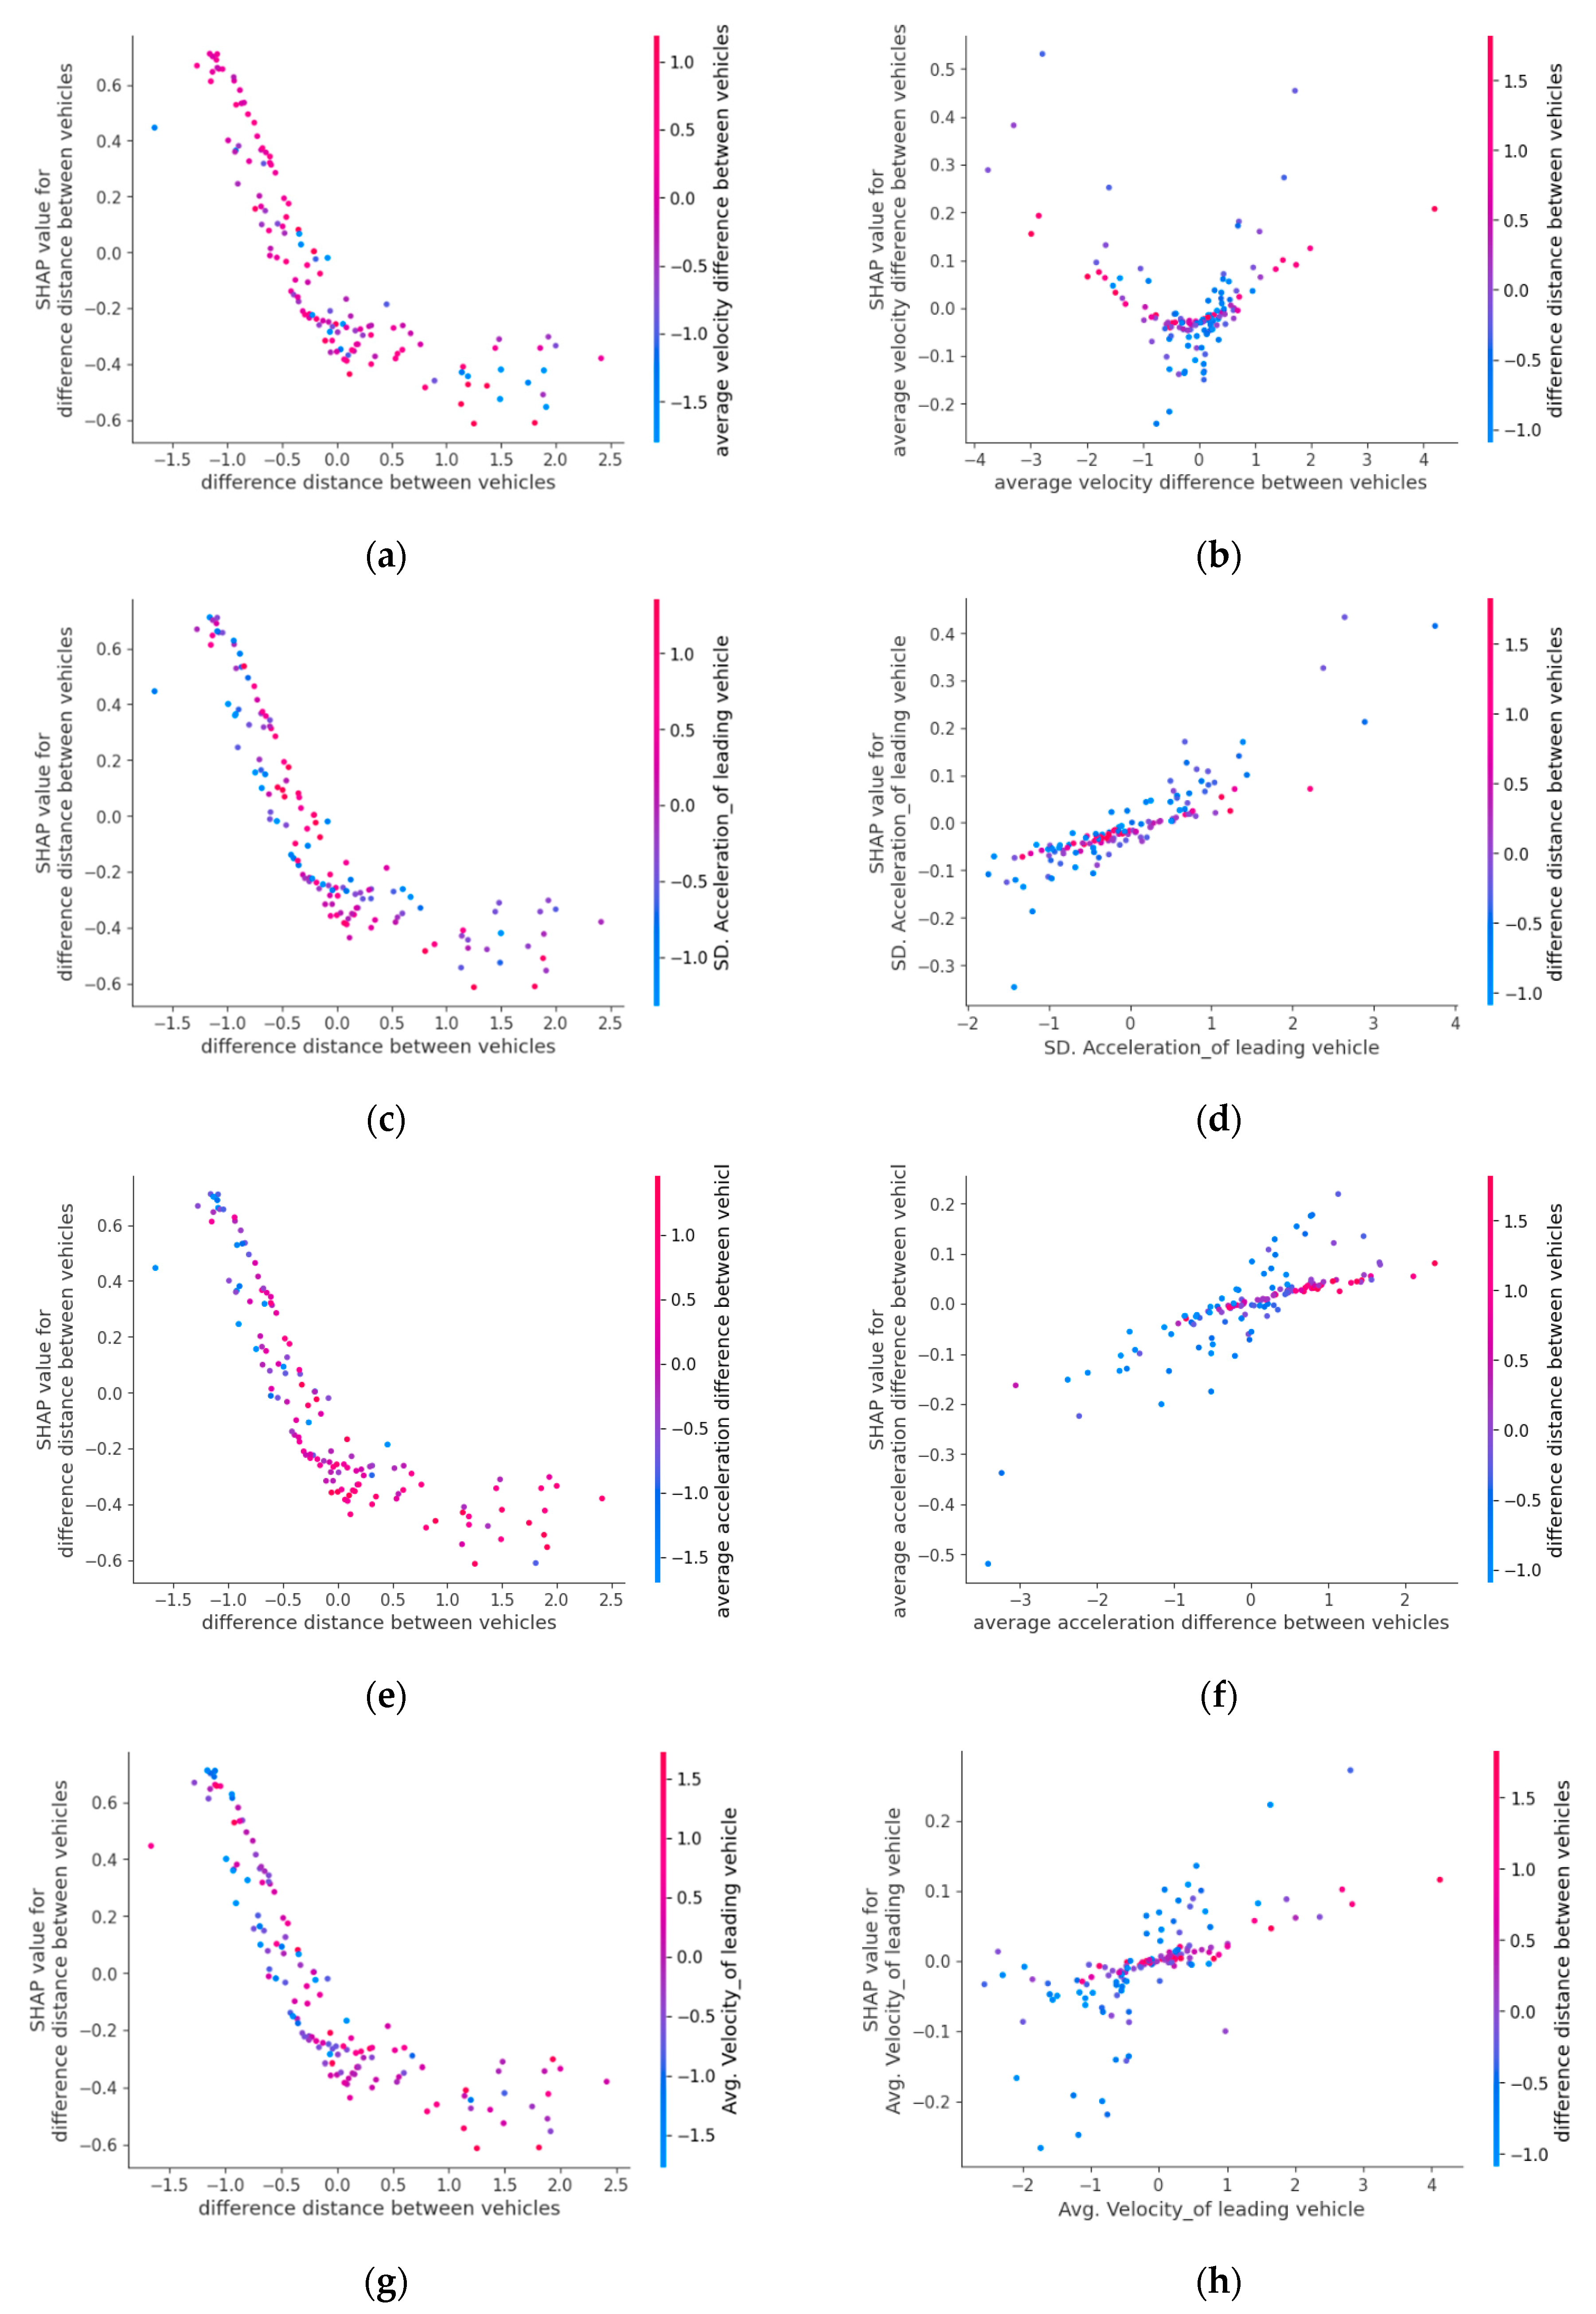
The SHAP analysis provides actionable insights. For instance, abrupt deceleration or high acceleration variability of leading vehicles could be used by traffic managers to design early-warning systems or adaptive intersection control. In connected and automated vehicle environments, these risk indicators could be integrated into collision-avoidance algorithms or adaptive cruise control strategies to reduce rear-end collision likelihood. From Figure 5a, the interaction effect of the difference in distance between vehicles and the average velocity difference between vehicles on conflicts frequency at unsignalized intersections. Furthermore, the red points at the upper left show an increase in the distance difference between vehicles as the SHAP value decreases, indicating that higher velocity difference between vehicles, particularly when the following vehicle is traveling faster than the leading vehicle, combined with a small distance difference, significantly increases the probability of rear-end conflicts. Figure 5b similarly shows the average velocity difference between vehicles on the x-axis and SHAP values on the y-axis, with color representing the distance between vehicles (blue for smaller, pink for larger). SHAP values are near zero when velocity differences are around zero, suggesting minimal impact on rear-end conflict risk. However, larger positive or negative velocity differences increase SHAP values, indicating a higher likelihood of conflict. Smaller distances (blue) appear at both positive and negative SHAP values, implying that significant speed differences at close distances heighten rear-end conflict risk due to limited reaction time.
Figure 5c shows the interaction effect between the difference distance and the standard deviation (SD) of the leading vehicle’s acceleration on rear-end conflict likelihood. A downward trend in SHAP values suggests that larger distances reduce conflict probability, while higher SHAP values at smaller distances indicate greater risk. Points with high acceleration variability of the leading vehicle (pink) cluster at positive SHAP values and smaller distances, implying that close following distances combined with fluctuating acceleration increase the likelihood of rear-end conflicts. Figure 5d shows the interaction effect of the difference in distance between vehicles and the average acceleration difference between vehicles on the likelihood of rear-end conflicts. Acceleration variability of the leading vehicle likely reflects abrupt changes in driving style, such as sudden braking or inconsistent speed adjustments. These maneuvers increase the cognitive workload of following drivers and elevate the probability of rear-end conflicts. The downward trend in SHAP values suggests that as the distance between vehicles increases, the probability of rear-end conflicts decreases. Points in pink, representing larger acceleration differences, are clustered at smaller distances and positive SHAP values, indicating that when vehicles follow closely and there is a significant acceleration difference, the likelihood of rear-end conflicts increases due to the sudden speed changes.
Figure 5e shows the relationship between vehicle distance (x-axis) and SHAP value (y-axis), with color indicating average acceleration difference (pink for higher, blue for lower). A downward trend suggests that larger distances reduce the predicted likelihood of rear-end conflicts, while higher SHAP values at smaller distances indicate increased risk. Points with high acceleration differences (pink) cluster at smaller distances and positive SHAP values, suggesting that close following distances with high acceleration differences raise the risk of rear-end conflicts. Figure 5f shows the relationship between average acceleration difference (x-axis) and SHAP value (y-axis), with color indicating vehicle distance (blue for smaller, pink for larger). A positive trend suggests that greater acceleration differences increase the likelihood of rear-end conflicts. Points with smaller distances (blue) cluster around positive SHAP values, indicating that close following distances and high acceleration differences elevate the predicted risk of rear-end conflicts.
Figure 5g shows that as the distance between vehicles increases (x-axis), the SHAP value (y-axis) decreases, indicating a lower rear-end conflict risk at larger distances. Higher SHAP values are linked to smaller distances, suggesting higher risk. Points with higher leading vehicle velocities (pink) cluster at smaller distances, implying that high speeds of the leading vehicle combined with close following distances raise the predicted risk of rear-end conflicts. Figure 5h shows the interaction effect of the leading vehicle’s average velocity and distance difference between vehicles on rear-end conflicts. Higher SHAP values are observed with increased leading vehicle speed at smaller following distances (blue points), indicating that close following distances, combined with a faster leading vehicle, increase the likelihood of rear-end conflicts.

5. Conclusions

This study developed and evaluated a framework for predicting rear-end conflicts at unsignalized intersections using several modeling approaches, with particular focus on the Deep & Cross Network Version 2 (DCNv2). Among the tested methods, DCNv2 achieved the best overall performance, with an accuracy of 0.93, recall of 0.90, precision of 0.90, F1-score of 0.90, and an AUC of 0.92. Both the original DCN and Support Vector Machine also performed strongly, whereas simpler approaches such as Decision Tree and K-Nearest Neighbors were less effective, highlighting the importance of more advanced methods to capture the complexity of vehicle interactions. The use of SHAP analysis provided further insight into the influence of key variables, showing that shorter following distances, larger speed differences, and fluctuations in the acceleration of the lead vehicle substantially increase the risk of rear-end conflicts. These findings contribute to a clearer understanding of conflict dynamics at unsignalized intersections and point to practical safety applications, such as improved gap management strategies and real-time warning systems in connected vehicle environments.
Despite these contributions, several limitations should be acknowledged. The present study focused only on rear-end conflicts as a first application, whereas other conflict types such as lane-change, pedestrian, and side-swipe events also play a major role in overall safety at unsignalized intersections. In addition, the analysis was based on a relatively small dataset collected under structured traffic conditions in Germany. Traffic conditions in other regions, particularly in Asia and Africa, are often more heterogeneous and include mixed traffic with two-wheelers, bicycles, and pedestrians, along with cultural differences in driving behavior. Future research should therefore expand the framework to cover multiple conflict types and validate it with larger, more diverse, and multimodal datasets to strengthen its reliability and applicability across different traffic environments.

Author Contributions

Methodology, H.A.N. and J.J.; Software, H.A.N. and J.J.; Validation, J.J.; Investigation, H.A.N.; Writing—original draft, H.A.N. and J.J.; Writing—review & editing, H.A.N., J.J. and H.A.E.; Supervision, H.H.; Funding acquisition, H.H. and J.J. All authors have read and agreed to the published version of the manuscript.

Funding

This study was sponsored by the National Key R&D Program of China (No. 2023YFB2504700) and Changsha Major Science and Technology Projects (No. kh2401002).

Data Availability Statement

The authors do not have permission to share data.

Conflicts of Interest

The authors declare no conflicts of interest.

References

  1. ETSC. Ranking EU Progress on Road Safety. Brussels, 2023. Available online: https://etsc.eu/ (accessed on 14 April 2025).
  2. Destatis. Traffic Accidents. 2023. Available online: https://www.destatis.de/ (accessed on 14 April 2025).
  3. Wisch, M.; Hellmann, A.; Lerner, M.; Hierlinger, T.; Labenski, V.; Wagner, M.; Feifel, H.; Robescu, O.; Renoux, P.; Groult, X. Car-to-car accidents at intersections in Europe and identification of use cases for the test and assessment of respective active vehicle safety systems. In Proceedings of the 26th International Technical Conference on the Enhanced Safety of Vehicles, Eindhoven, The Netherlands, 10–13 June 2019; pp. 10–13. [Google Scholar]
  4. Das, B.; Paul, M. Development of a Rear-End Conflict Prediction Framework for Unsignalized Intersections along Intercity Highways Using Machine Learning. J. Transp. Eng. Part A Syst. 2025, 151, 4025009. [Google Scholar] [CrossRef]
  5. Jiang, C.; Lu, L.; Chen, S.; Lu, J.J. Hit-and-run crashes in urban river-crossing road tunnels. Accid. Anal. Prev. 2016, 95, 373–380. [Google Scholar] [CrossRef]
  6. Hu, Y.; Li, Y.; Yuan, C.; Huang, H. Modeling conflict risk with real-time traffic data for road safety assessment: A copula-based joint approach. Transp. Saf. Environ. 2022, 4, tdac017. [Google Scholar] [CrossRef]
  7. Xing, L.; He, J.; Abdel-Aty, M.; Wu, Y.; Yuan, J. Time-varying Analysis of Traffic Conflicts at the Upstream Approach of Toll Plaza. Accid. Anal. Prev. 2020, 141, 105539. [Google Scholar] [CrossRef] [PubMed]
  8. Miglani, A.; Kumar, N. Deep learning models for traffic flow prediction in autonomous vehicles: A review, solutions, and challenges. Veh. Commun. 2019, 20, 100184. [Google Scholar] [CrossRef]
  9. Zeng, Q.; Huang, H.; Pei, X.; Wong, S.C. Modeling nonlinear relationship between crash frequency by severity and contributing factors by neural networks. Anal. Methods Accid. Res. 2016, 10, 12–25. [Google Scholar] [CrossRef]
  10. Zheng, L.; Sayed, T. Comparison of Traffic Conflict Indicators for Crash Estimation using Peak Over Threshold Approach. Transp. Res. Rec. 2019, 2673, 493–502. [Google Scholar] [CrossRef]
  11. Fu, C.; Sayed, T. A multivariate method for evaluating safety from conflict extremes in real time. Anal. Methods Accid. Res. 2022, 36, 100244. [Google Scholar] [CrossRef]
  12. Arun, A.; Haque, M.M.; Bhaskar, A.; Washington, S.; Sayed, T. A bivariate extreme value model for estimating crash frequency by severity using traffic conflicts. Anal. Methods Accid. Res. 2021, 32, 100180. [Google Scholar] [CrossRef]
  13. Zheng, L.; Sayed, T.; Essa, M. Validating the bivariate extreme value modeling approach for road safety estimation with different traffic conflict indicators. Accid. Anal. Prev. 2019, 123, 314–323. [Google Scholar] [CrossRef]
  14. Liu, P.; Qu, X.; Yu, H.; Wang, W.; Cao, B. Development of a VISSIM simulation model for U-turns at unsignalized intersections. J. Transp. Eng. 2012, 138, 1333–1339. [Google Scholar] [CrossRef]
  15. Caliendo, C.; Guida, M. Microsimulation approach for predicting crashes at unsignalized intersections using traffic conflicts. J. Transp. Eng. 2012, 138, 1453–1467. [Google Scholar] [CrossRef]
  16. Wu, Z.; Yang, J.; Huang, L. Study on the Collision Avoidance Strategy at Unsignalized Intersection based on PreScan Simulation. Procedia-Soc. Behav. Sci. 2013, 96, 1315–1321. [Google Scholar] [CrossRef]
  17. Yuan, C.; Li, Y.; Huang, H.; Wang, S.; Sun, Z.; Li, Y. Using traffic flow characteristics to predict real-time conflict risk: A novel method for trajectory data analysis. Anal. Methods Accid. Res. 2022, 35, 100217. [Google Scholar] [CrossRef]
  18. Li, J.; Ling, M.; Zang, X.; Luo, Q.; Yang, J.; Chen, S.; Guo, X. Quantifying risks of lane-changing behavior in highways with vehicle trajectory data under different driving environments. Int. J. Mod. Phys. C 2024, 35, 2450141. [Google Scholar] [CrossRef]
  19. Ding, N.; Jiao, N.; Zhu, S.; Liu, B. Structural equations modeling of real-time crash risk variation in car-following incorporating visual perceptual, vehicular, and roadway factors. Accid. Anal. Prev. 2019, 133, 105298. [Google Scholar] [CrossRef]
  20. Li, Y.; Wu, D.; Lee, J.; Yang, M.; Shi, Y. Analysis of the transition condition of rear-end collisions using time-to-collision index and vehicle trajectory data. Accid. Anal. Prev. 2020, 144, 105676. [Google Scholar] [CrossRef]
  21. Li, Y.; Wu, D.; Chen, Q.; Lee, J.; Long, K. Exploring transition durations of rear-end collisions based on vehicle trajectory data: A survival modeling approach. Accid. Anal. Prev. 2021, 159, 106271. [Google Scholar] [CrossRef] [PubMed]
  22. Chen, Q.; Huang, H.; Li, Y.; Lee, J.; Long, K.; Gu, R.; Zhai, X. Modeling accident risks in different lane-changing behavioral patterns. Anal. Methods Accid. Res. 2021, 30, 100159. [Google Scholar] [CrossRef]
  23. Chen, S.; Piao, L.; Zang, X.; Luo, Q.; Li, J.; Yang, J.; Rong, J. Analyzing differences of highway lane-changing behavior using vehicle trajectory data. Phys. A Stat. Mech. Its Appl. 2023, 624, 128980. [Google Scholar] [CrossRef]
  24. Zhai, C.; Wu, W.; Xiao, Y.; Zhang, J.; Zhai, M. Jam traffic pattern of a multi-phase lattice hydrodynamic model integrating a continuous self-stabilizing control protocol to boycott the malicious cyber-attacks. Chaos Solitons Fractals 2025, 197, 116531. [Google Scholar] [CrossRef]
  25. Gore, N.; Chauhan, R.; Easa, S.; Arkatkar, S. Traffic conflict assessment using macroscopic traffic flow variables: A novel framework for real-time applications. Accid. Anal. Prev. 2023, 185, 107020. [Google Scholar] [CrossRef]
  26. Arun, A.; Haque, M.M.; Washington, S.; Sayed, T.; Mannering, F. How many are enough?: Investigating the effectiveness of multiple conflict indicators for crash frequency-by-severity estimation by automated traffic conflict analysis. Transp. Res. Part C Emerg. Technol. 2022, 138, 103653. [Google Scholar] [CrossRef]
  27. Jiang, R.; Zhu, S.; Chang, H.; Wu, J.; Ding, N.; Liu, B.; Qiu, J. Determining an Improved Traffic Conflict Indicator for Highway Safety Estimation Based on Vehicle Trajectory Data. Sustainability 2021, 13, 9278. [Google Scholar] [CrossRef]
  28. Hayward, J.C. Near-miss determination through use of a scale of danger. Highw. Res. Rec. 1972, 384, 24–35. [Google Scholar]
  29. Jiao, S.; Zhang, S.; Zhou, B.; Zhang, L.; Xue, L. Dynamic performance and safety analysis of car-following models considering collision sensitivity. Phys. A Stat. Mech. Its Appl. 2021, 564, 125504. [Google Scholar] [CrossRef]
  30. Das, S.; Maurya, A.K. Defining Time-to-Collision Thresholds by the Type of Lead Vehicle in Non-Lane-Based Traffic Environments. IEEE Trans. Intell. Transp. Syst. 2020, 21, 4972–4982. [Google Scholar] [CrossRef]
  31. Xiao, Y.; Wu, W.; Zhai, C.; Zhai, M.; Zhang, J. Analysis of empirical lane-changing rate effect on multi-lane traffic on curved roads. Chin. J. Phys. 2025, 95, 260–274. [Google Scholar] [CrossRef]
  32. Ozbay, K.; Yang, H.; Bartin, B.; Mudigonda, S. Derivation and validation of new simulation-based surrogate safety measure. Transp. Res. Rec. 2008, 2083, 105–113. [Google Scholar] [CrossRef]
  33. Arun, A.; Haque, M.M.; Washington, S.; Sayed, T.; Mannering, F. A systematic review of traffic conflict-based safety measures with a focus on application context. Anal. Methods Accid. Res. 2021, 32, 100185. [Google Scholar] [CrossRef]
  34. Chen, Z.; Chen, W. Traffic Safety Analysis of a Signalized T-Intersection Using Surrogate Safety Measures. In Proceedings of the 24th COTA International Conference of Transportation Professionals, Shenzhen, China, 23–26 July 2024; pp. 2613–2623. [Google Scholar]
  35. Jiang, C.; Yin, S.; Yao, Z.; He, J.; Jiang, R.; Jiang, Y. Safety evaluation of mixed traffic flow with truck platoons equipped with (cooperative) adaptive cruise control, stochastic human-driven cars and trucks on port freeways. Phys. A Stat. Mech. Its Appl. 2024, 643, 129802. [Google Scholar] [CrossRef]
  36. Zhu, L.; Lu, L.; Wang, X.; Jiang, C.; Ye, N. Operational Characteristics of Mixed-Autonomy Traffic Flow on the Freeway With On-and Off-Ramps and Weaving Sections: An RL-Based Approach. IEEE Trans. Intell. Transp. Syst. 2022, 23, 13512–13525. [Google Scholar] [CrossRef]
  37. Jiang, C.; Bhat, C.R.; Lam, W.H.K. A bibliometric overview of Transportation Research Part B: Methodological in the past forty years (1979–2019). Transp. Res. Part B Methodol. 2020, 138, 268–291. [Google Scholar] [CrossRef]
  38. Wu, P.; Wei, W.; Zheng, L.; Hu, Z.; Essa, M. Cycle-level traffic conflict prediction at signalized intersections with LiDAR data and Bayesian deep learning. Accid. Anal. Prev. 2023, 192, 107268. [Google Scholar] [CrossRef]
  39. Hou, Q.; Yang, Y.; Liang, J.; Huo, X.; Leng, J. A deep transfer learning approach for Real-Time traffic conflict prediction with trajectory data. Accid. Anal. Prev. 2025, 214, 107966. [Google Scholar] [CrossRef]
  40. Zhang, S.; Abdel-Aty, M. Real-Time Pedestrian Conflict Prediction Model at the Signal Cycle Level Using Machine Learning Models. IEEE Open J. Intell. Transp. Syst. 2022, 3, 176–186. [Google Scholar] [CrossRef]
  41. Formosa, N.; Quddus, M.; Ison, S.; Abdel-Aty, M.; Yuan, J. Predicting real-time traffic conflicts using deep learning. Accid. Anal. Prev. 2020, 136, 105429. [Google Scholar] [CrossRef] [PubMed]
  42. Yu, R.; Han, L.; Zhang, H. Trajectory data based freeway high-risk events prediction and its influencing factors analyses. Accid. Anal. Prev. 2021, 154, 106085. [Google Scholar] [CrossRef]
  43. Katrakazas, C.; Quddus, M.; Chen, W.H. A simulation study of predicting real-time conflict-prone traffic conditions. IEEE Trans. Intell. Transp. Syst. 2018, 19, 3196–3207. [Google Scholar] [CrossRef]
  44. Caleffi, F.; Anzanello, M.J.; Cybis, H.B.B. A multivariate-based conflict prediction model for a Brazilian freeway. Accid. Anal. Prev. 2017, 98, 295–302. [Google Scholar] [CrossRef] [PubMed]
  45. Li, Y.; Ge, C.; Xing, L.; Yuan, C.; Liu, F.; Jin, J. A hybrid deep learning framework for conflict prediction of diverse merge scenarios at roundabouts. Eng. Appl. Artif. Intell. 2024, 130, 107705. [Google Scholar] [CrossRef]
  46. Bock, J.; Krajewski, R.; Moers, T.; Runde, S.; Vater, L.; Eckstein, L. The inD Dataset: A Drone Dataset of Naturalistic Road User Trajectories at German Intersections. In Proceedings of the 2020 IEEE Intelligent Vehicles Symposium (IV), Las Vegas, NV, USA, 19 October–13 November 2020; pp. 1929–1934. [Google Scholar] [CrossRef]
  47. Ronneberger, O.; Fischer, P.; Brox, T. U-Net: Convolutional Networks for Biomedical Image Segmentation. May 2015. Available online: http://arxiv.org/abs/1505.04597 (accessed on 14 April 2025).
  48. Rauch, H.E.; Tung, F.; Striebel, C.T. Maximum likelihood estimates of linear dynamic systems. AIAA J. 1965, 3, 1445–1450. [Google Scholar] [CrossRef]
  49. Amundsen, F.; Hydén, C. Proceedings of the first workshop on traffic conflicts: (Held September 1977 in Oslo.) Institute of Transfort Economics, Oslo, Norway, 1977; 138pp. Accid. Anal. Prev. 1979, 11, 317–318. [Google Scholar]
  50. Orsini, F.; Gecchele, G.; Rossi, R.; Gastaldi, M. A conflict-based approach for real-time road safety analysis: Comparative evaluation with crash-based models. Accid. Anal. Prev. 2021, 161, 106382. [Google Scholar] [CrossRef]
  51. Nasr, H.A.; Huang, H.; Jin, J.; Zhou, H. Rear-end conflicts analysis at non-signalized intersection based on vehicles trajectory data. Eur. Transp. Res. Rev. 2025, 17, 27. [Google Scholar] [CrossRef]
  52. Arun, A.; Haque, M.M.; Bhaskar, A.; Washington, S.; Sayed, T. A systematic mapping review of surrogate safety assessment using traffic conflict techniques. Accid. Anal. Prev. 2021, 153, 106016. [Google Scholar] [CrossRef] [PubMed]
  53. Jin, J.; Huang, H.; Yuan, C.; Li, Y.; Zou, G.; Xue, H. Real-time crash risk prediction in freeway tunnels considering features interaction and unobserved heterogeneity: A two-stage deep learning modeling framework. Anal. Methods Accid. Res. 2023, 40, 100306. [Google Scholar] [CrossRef]
  54. Zhang, G.; Jin, J.; Chang, F.; Huang, H. Real-time traffic conflict prediction at signalized intersections using vehicle trajectory data and deep learning. Int. J. Transp. Sci. Technol. 2024, in press. [CrossRef]
  55. Jin, J.; Huang, H.; Li, Y.; Dai, J. Collision causal discovery and real-time prediction of freeway tunnels: A novel dual-task approach. Tunn. Undergr. Sp. Technol. 2025, 155, 106216. [Google Scholar] [CrossRef]
Figure 1. The framework of methodology.
Systems 13 00827 g001
Figure 2. The locations of the studied intersections.
Systems 13 00827 g002
Figure 3. A sketch of pairing vehicles at Bendplatz intersection.
Systems 13 00827 g003
Figure 4. The feature importance of DCNV2: (a) Global feature importance; (b) Local feature importance.
Systems 13 00827 g004
Figure 5. The feature importance of DCNV2: (a) dif_dist_between_vehicles and ave_vel_ dif_between vehicles; (b) ave_vel_ dif_between vehicles and dif_dist_between_vehicles; (c) dif_dist_between_vehicles and SD_acc of leading_veh; (d) SD_acc of leading_veh and dif_dist_between_vehicles; (e) dif_dist_between_vehicles and ave_acc_dif between vehicles; (f) ave_acc_dif_between_vehicles and dif_dist_between_vehicles; (g) dif_dist_between_vehicles and ave_vel of leading_vehicle; (h) ave_vel of leading_vehicle and dif_dist_between_vehicles.
Systems 13 00827 g005
Table 1. The descriptions and statistics of traffic features adopted from [51].
VariablesMeanStd. DevMin.Max.
F1:Average velocity of leading vehicle (m/s)12.65 2.68 3.71 23.66
F2:Average velocity of following vehicle (m/s)12.37 2.70 1.15 20.82
F3:Average acceleration of leading vehicle (m/s2)0.31 0.45 −1.98 2.53
F4:Average acceleration of following vehicle (m/s2)1.54 0.56 −0.77 3.96
F5:Standard deviation in the average velocity of leading vehicle (m/s)0.36 0.34 0.10 2.54
F6:Standard deviation in the average velocity of following vehicle (m/s)0.12 0.17 0.00 1.80
F7:Standard deviation in the average acceleration of leading vehicle (m/s2)0.59 0.18 0.17 2.07
F8:Standard deviation in the average acceleration of following vehicle (m/s2)0.05 0.13 0.00 1.04
F9:Coefficient of variation in the average velocity of leading vehicle (m/s)0.03 0.04 0.01 0.53
F10:Coefficient of variation in the average velocity of following vehicle (m/s)0.01 0.02 0.00 0.22
F11:Coefficient of variation in the average acceleration of leading vehicle (m/s2)1.26 11.52 −9.36 18.85
F12:Coefficient of variation in the average acceleration of following vehicle (m/s2)0.21 4.13 −2.83 4.14
F13:Difference in average acceleration between leading and following vehicles (m/s2)1.23 0.53 −0.84 3.89
F14:Difference in average velocity between leading and following vehicles (m/s)0.28 1.49 −8.73 14.88
F15:Gap difference between leading and following vehicles (m)24.21 13.92 0.50 113.16
Table 2. DCNv2 Hyperparameter Configuration.
Hyperparameter Network StructureValue
Cross Layers4
Deep Layers4
Neurons per Deep Layer[256, 128, 64, 32]
Activation (Deep)ReLU
Activation (Cross)Linear
Optimization
Loss FunctionBinary Cross-Entropy
OptimizerAdam
Learning Rate0.001 (decay: 0.96 per 10 epochs)
Training
Batch Size64
Epochs100
L2 Regularization0.0001
Dropout Rate0.3
Table 3. Confusion matrix for the prediction performance of traffic conflict.
True ConditionPrediction Result
CrashNo Crash
CrashTrue Positive (TP)False Negative (FN)
No CrashFalse Positive (FP)True Negative (TN)
Table 4. Prediction performance of different models.
MethodsAccuracyRecallAUCPrecisionF1-Score
LR0.880.830.870.860.84
KNN0.810.710.780.770.74
DT0.820.750.800.780.76
SVM0.910.870.900.890.88
XGB0.900.890.870.860.87
DNN0.890.880.870.850.86
DCN0.920.900.910.880.89
DCNV20.930.900.920.900.90
Disclaimer/Publisher’s Note: The statements, opinions and data contained in all publications are solely those of the individual author(s) and contributor(s) and not of MDPI and/or the editor(s). MDPI and/or the editor(s) disclaim responsibility for any injury to people or property resulting from any ideas, methods, instructions or products referred to in the content.