Article

Multi-Objective Combinatorial Optimization for Dynamic Inspection Scheduling and Skill-Based Team Formation in Distributed Solar Energy Infrastructure

Department of Industrial Engineering, Faculty of Engineering, King Abdulaziz University, Jeddah 21589, Saudi Arabia
Systems 2025, 13(9), 822; https://doi.org/10.3390/systems13090822
Submission received: 15 July 2025 / Revised: 3 September 2025 / Accepted: 9 September 2025 / Published: 19 September 2025
(This article belongs to the Special Issue Advances in Operations and Production Management Systems)

Abstract

Maintaining operational efficiency in distributed solar energy systems requires intelligent coordination of inspection tasks and workforce resources to handle diverse fault conditions. This study presents a bi-level multi-objective optimization framework that addresses two tightly coupled problems: dynamic job scheduling and skill-based team formation. The job scheduling component assigns geographically dispersed inspection tasks to mobile teams while minimizing multiple conflicting objectives, including travel distance, tardiness, and workload imbalance. Concurrently, the team formation component ensures that each team satisfies fault-specific skill requirements by optimizing team cohesion and compactness. To solve the bi-objective team formation problem, we propose HMOO-AOS, a hybrid algorithm integrating six metaheuristic operators under an NSGA-II framework with an Upper Confidence Bound-based Adaptive Operator Selection. Experiments on datasets of up to seven instances demonstrate statistically significant improvements ( p < 0.05 ) in solution quality, skill coverage, and computational efficiency compared to NSGA-II, NSGA-III, and MOEA/D variants, with computational complexity O G · N · ( M + log N ) (time complexity), O ( N · L ) (space complexity). A cloud-integrated system architecture is also proposed to contextualize the framework within real-world solar inspection operations, supporting real-time data integration, dynamic rescheduling, and mobile workforce coordination. These contributions provide scalable, practical tools for solar operators, maintenance planners, and energy system managers, establishing a robust and adaptive approach to intelligent inspection planning in renewable energy operations.

1. Introduction

The unprecedented growth in solar photovoltaic (PV) technology, now exceeding 1000 GW in cumulative installed capacity, with over 20% annual growth, has profoundly reshaped the global energy landscape. This expansion spans utility-scale solar farms often surpassing 100 MW with millions of modules, as well as distributed systems across residential, commercial, and industrial sectors. The resulting infrastructure is highly heterogeneous, encompassing diverse module technologies (monocrystalline, polycrystalline, thin-film), varying environmental conditions, and disparate performance characteristics that necessitate sophisticated maintenance strategies [1,2].
Photovoltaic systems are subject to multiple degradation mechanisms that critically impact their operational efficiency, safety, and economic viability. These include potential-induced degradation (PID) in high-voltage applications exceeding 600 V, thermal cycling stress from daily temperature fluctuations of up to 70 °C, ultraviolet radiation damage to polymeric components leading to encapsulant browning and backsheet deterioration, environmental soiling effects that can reduce system performance by 2–25% annually, and various electrical faults including hot spot formation that pose fire hazards [3,4,5]. The stochastic and spatially heterogeneous nature of these degradation patterns creates substantial operational challenges, as empirical studies indicate crystalline silicon modules typically exhibit annual degradation rates between 0.5 and 0.8%, often following a “bathtub” failure curve with early life infant mortality, stable mid-life operation, and increasing end-of-life failures [6,7].
Traditional reactive maintenance models prove inadequate for the dynamic nature of distributed PV installations, often resulting in delayed fault detection, inefficient resource allocation, and substantial energy yield losses. The complexity of modern PV maintenance is further amplified by the need to coordinate multi-skilled inspection teams across geographically distributed installations while managing diverse technical requirements, including thermal imaging expertise, electrical diagnostics capabilities, mechanical assessment skills, and safety compliance knowledge. Current maintenance strategies typically rely on rigid, time-based scheduling frameworks that fail to adapt to real-time system conditions, leading to suboptimal deployment of technical resources and missed opportunities for proactive intervention [8,9].
The integration of advanced sensing technologies has revolutionized fault detection capabilities, with thermal imaging systems achieving 2–3 °C sensitivity for hot spot detection, smart inverters providing granular electrical performance data, and unmanned aerial vehicles (UAVs) enabling rapid, high-resolution inspections combining visual, thermal, and multispectral sensors [10,11]. These technologies generate vast quantities of heterogeneous data (up to 10 GB per residential system annually) that existing maintenance frameworks struggle to synthesize into actionable scheduling decisions [12]. Machine learning approaches have demonstrated promising results, with supervised models achieving fault prediction accuracies exceeding 90% and deep learning architectures surpassing 95% accuracy through ensemble methods [13,14].
Despite these technological advances, critical gaps persist in developing unified optimization frameworks that can simultaneously address job scheduling across distributed networks and skill-based team formation while incorporating multi-objective trade-offs between cost minimization, fault detection efficiency, and resource utilization optimization. The inspection scheduling problem poses a complex multi-objective optimization challenge involving the minimization of operational costs, the maximization of fault detection efficiency, the reduction in system downtime, and the optimization of resource utilization, compounded by diverse technician skill requirements and geographic dispersion constraints. The absence of adaptive algorithms capable of dynamic reconfiguration based on evolving system states represents a significant barrier to implementing truly intelligent maintenance strategies in large-scale PV deployments.
Addressing these critical gaps in current maintenance practices, this research proposes a comprehensive, two-tiered multi-objective optimization framework for managing inspection operations in distributed solar energy infrastructure. The framework addresses two tightly coupled problem domains: job scheduling and skill-based team formation, with their integration mediated through fault types detected at solar installations. Each inspection job is associated with specific fault types that dictate skill requirements, enabling the job scheduling algorithm to allocate tasks across distributed geographic networks while the team formation algorithm ensures optimal skill mix deployment.
This work contributes rigorous mathematical formulations for both optimization problems, capturing their operational and structural interdependencies. The job scheduling problem is formulated as a five-objective optimization task targeting the minimization of total travel distance, total tardiness, workload imbalance among teams, priority-weighted tardiness, and scheduling imbalance across operational periods. The formulation incorporates realistic constraints, including job precedence relationships, travel-time feasibility, working hour limitations, and job-to-team exclusivity requirements. Complementarily, the team formation problem is modeled as a bi-objective optimization challenge that maximizes intra-team connection costs to encourage cohesive collaboration while minimizing total team size, subject to hard constraints ensuring comprehensive skill coverage and assignment feasibility.
To bridge theoretical modeling with practical experimentation, this research develops a comprehensive synthetic dataset that simulates inspection tasks across geographically distributed solar installations. The dataset incorporates empirically validated fault types, including microcracks, soiling accumulation, hot spot formation, encapsulant delamination, and potential-induced degradation, mapped to skill requirements through expert-informed binary matrices. Each inspection job specification includes precise location coordinates, estimated duration, deadline constraints, fault severity indicators, and specific skill demands, with travel distances computed using haversine formulas and realistic speed parameters to ensure practical validity.
The core algorithmic contribution introduces a novel Hybrid Multi-Objective Optimization with Adaptive Operator Selection (HMOO-AOS) algorithm for team formation optimization. This algorithm uniquely integrates six distinct metaheuristic operators—Differential Evolution (DE), Particle Swarm Optimization (PSO), Variable Neighborhood Search (VNS), Sine Cosine Algorithm (SCA), Grey Wolf Optimization (GWO), and Tabu Search (TS)—within a unified NSGA-II framework. The distinguishing innovation lies in an Adaptive Operator Selection mechanism employing Upper Confidence Bound (UCB) criteria to dynamically identify and deploy the most promising operators at each generation based on historical performance analysis. This adaptive approach enables automatic search behavior adjustment according to problem landscape characteristics, enhanced by implementation-level optimizations including Numba compilation, vectorized computation, and multiprocessing for superior runtime efficiency without solution quality compromise.
The job scheduling component employs multiple state-of-the-art multi-objective optimization algorithms, including NSGA-II, NSGA-III, and MOEA/D variants, enabling extensive comparative analysis across diverse algorithmic paradigms. While the primary algorithmic innovation focuses on team formation, the job scheduling problem provides an essential foundation by generating meaningful input conditions—specifically, fault type distributions and timing constraints—that drive team optimization requirements. The integrated framework supports iterative scheduling and team refinement processes that accurately mirror real-world operational scenarios where evolving fault reports necessitate continuous re-optimization of both task allocation and team composition strategies.
A comprehensive experimental campaign validates the proposed HMOO-AOS algorithm through extensive benchmarking against classical optimization methods and state-of-the-art approaches. Performance evaluation encompasses multiple metrics, including hypervolume indicator, spacing measures, generational convergence analysis, and runtime efficiency assessments. Detailed ablation studies systematically assess individual algorithmic component contributions, particularly quantifying benefits derived from Adaptive Operator Selection mechanisms and hybrid metaheuristic integration. Experimental results consistently demonstrate HMOO-AOS superiority over traditional and contemporary baselines, particularly excelling in skill-coverage efficiency optimization and team compactness achievement under complex multi-objective trade-off scenarios.
To facilitate real-world deployment, this work presents a cloud-integrated system architecture that operationalizes the proposed optimization framework within practical distributed solar management environments. The architecture integrates distributed solar installations equipped with automated fault detection systems (AFDSs), SCADA monitoring modules, and comprehensive sensor arrays that continuously feed real-time operational data to centralized scheduling and team formation engines. The system supports dynamic schedule adjustments responsive to weather conditions, fault urgency classifications, and personnel availability changes, complemented by intuitive web-based dashboards and mobile interfaces that facilitate seamless real-time interaction between management personnel and field inspection crews. This comprehensive architectural integration demonstrates both practical feasibility and real-time responsiveness capabilities essential for large-scale distributed solar infrastructure management.

2. Literature Review

2.1. Photovoltaic System Degradation and Fault Detection

Photovoltaic (PV) systems are subject to diverse degradation mechanisms that critically affect their long-term energy yield, safety, and economic viability. One of the most severe is potential-induced degradation (PID), particularly in systems operating above 600 V, where high-voltage leakage currents promote ion migration through the encapsulant. This phenomenon can result in significant power losses within a relatively short period [3,4,15]. Thermal cycling, driven by daily temperature swings up to 70 °C, induces solder bond fatigue and interconnect degradation [16,17,18]. Concurrently, ultraviolet (UV) radiation chemically degrades polymeric materials such as backsheets and encapsulants, contributing to browning and delamination [19,20]. Environmental soiling—due to dust accumulation, bird droppings, and airborne pollutants reduces irradiance and elevates local temperatures, promoting hot spot formation and yield losses ranging from 2% to 25% annually depending on regional conditions [5,21]. Electrical faults such as hot spots, caused by cell mismatch, shading, or bypass diode failures, pose severe fire and thermal runaway hazards [22,23,24]. These issues not only compromise performance but also represent significant safety threats to both equipment and personnel.
Importantly, the occurrence and severity of degradation are strongly influenced by microclimatic conditions, installation quality, and aging-related material fatigue [6,25,26]. Empirical studies indicate that crystalline silicon modules typically exhibit annual degradation rates between 0.5% and 0.8%, often following a “bathtub” failure curve characterized by early life infant mortality (within 12–18 months), a relatively stable mid-life phase, and increasing failures toward end-of-life [7,27]. Spatial analysis using geographic information systems (GISs) has revealed fault clustering near module edges and areas exposed to higher pollution levels, while seasonal freeze-thaw cycles further exacerbate material stress [21,26].
The stochastic and spatially heterogeneous nature of these faults in distributed photovoltaic (PV) systems introduces substantial operational complexity, undermining the efficacy of conventional maintenance frameworks. Empirical observations indicate that a small yet significant proportion of photovoltaic modules require urgent maintenance each year, with the effectiveness of fault detection closely linked to the frequency of inspections and the sophistication of diagnostic techniques [9]. Rigid, time-based maintenance approaches, while logistically convenient, often lead to inefficiencies, such as premature inspections of functioning modules and delayed identification of concealed but critical defects [8,28,29].

2.2. Maintenance Strategies in Renewable Energy Systems

Traditional reactive maintenance models are particularly ill-suited for dynamically evolving PV assets, often leading to a substantial amount of annual energy yield losses [8,9]. In contrast, condition-based maintenance (CBM) enhances operational performance by leveraging real-time sensor data to identify and localize faults, enabling more precise and timely interventions. This data-driven strategy has been shown to significantly reduce operational costs while substantially improving the accuracy of fault detection [30,31]. Predictive maintenance (PdM), which utilizes machine learning algorithms to anticipate potential failures, offers enhanced optimization by enabling proactive resource allocation and early fault mitigation [9,32,33]. This forward-looking approach has demonstrated substantial gains in both operational efficiency and system reliability. Such advancements highlight the pressing need to transition from rigid, schedule-driven maintenance regimes to intelligent, adaptive frameworks that are responsive to the dynamic and decentralized nature of distributed photovoltaic (PV) systems.
The successful implementation of these intelligent maintenance strategies is underpinned by recent advances in sensing, data acquisition, and autonomous inspection technologies, which collectively enable comprehensive, real-time monitoring of PV system health. Recent advances in sensing and data acquisition have enabled the integration of multimodal monitoring systems. Thermal imaging, with sensitivity around 2–3 °C, detects hot spots and diode failures [10], while smart inverters and module-level power electronics provide granular electrical performance data [34,35]. Automated visual inspections, empowered by computer vision and multispectral imaging, identify surface defects and encapsulant degradation [36,37]. Unmanned aerial vehicles (UAVs) facilitate rapid, high-resolution inspections over large areas, combining visual, thermal, and multispectral sensors with GPS for precise fault localization [11,38]. These technologies generate vast datasets (up to 10 GB per residential system annually) that require advanced data fusion and secure management via edge computing and blockchain technologies [12,39].
The evolution towards predictive maintenance has been further accelerated by advances in Internet of Things (IoT) technologies and wireless sensor networks, enabling continuous monitoring of critical parameters, including module temperature, irradiance levels, electrical characteristics, and environmental conditions [40,41,42]. These distributed sensing systems facilitate early detection of performance anomalies and enable maintenance teams to prioritize interventions based on actual system conditions rather than predetermined schedules. Integration with weather forecasting systems and satellite imagery has enhanced the capability to predict soiling events and plan preventive cleaning operations, thereby optimizing maintenance resource allocation and reducing unexpected performance degradations [33].

2.3. Machine Learning and Artificial Intelligence in PV Systems

Machine learning methods have demonstrated significant promise in predictive fault detection, with supervised learning models achieving fault prediction accuracies exceeding 90% [13,34,37], while unsupervised approaches detect subtle anomalies without labeled data requirements [43,44]. Deep learning architectures utilizing convolutional and recurrent neural networks effectively analyze thermal images and time-series data, with ensemble methods surpassing 95% accuracy [14]. Transfer and federated learning approaches have emerged to mitigate data scarcity challenges in smaller installations [45]. The application of artificial intelligence has expanded beyond traditional approaches to encompass reinforcement learning for adaptive maintenance scheduling, natural language processing for automated analysis of maintenance reports, and computer vision algorithms that identify surface defects and degradation symptoms from high-resolution drone imagery. These AI-driven approaches enable automated module condition assessment and inspection report generation, significantly reducing manual inspection time while improving fault identification consistency [46]. Recent developments in explainable AI have addressed interpretability concerns by providing maintenance engineers with clear insights into fault predictions and risk assessments, enhancing trust in automated systems, while uncertainty quantification techniques enable systems to express confidence levels in predictions, allowing operators to prioritize interventions based on both predicted severity and confidence metrics [47].

2.4. Optimization Techniques for Maintenance Scheduling

Inspection scheduling in distributed PV systems poses a complex multi-objective optimization problem involving the minimization of operational costs, maximization of fault detection efficiency, reduction in system downtime, and optimization of resource utilization. The problem is compounded by diverse technician skill sets spanning thermal imaging, electrical diagnostics, mechanical assessments, and safety compliance, requiring precise matching of competencies to system-specific needs while considering geographic proximity. Advanced condition monitoring technologies, such as smart inverters and UAV-based thermal inspections, generate large volumes of multimodal data that, while facilitating predictive maintenance through machine learning algorithms, remain computationally intensive to synthesize into actionable inspection schedules.
Suboptimal inspection strategies have considerable economic and operational consequences, as undetected faults lead to substantial revenue losses while overly frequent inspections increase expenditure without proportional performance improvements. From a methodological perspective, this challenge can be modeled as a multi-objective variant of the Vehicle Routing Problem with time windows, skill-based constraints, and stochastic demand, requiring advanced heuristic or metaheuristic techniques capable of handling high-dimensional, nonlinear search spaces. The complexity is further intensified by compliance with regulatory standards such as IEC 61215 [48] and IEC 61730 [49,50], which impose additional constraints on scheduling, documentation, and operational procedures.
Despite recent advances in monitoring technologies and optimization techniques, a critical gap persists in the integration of heterogeneous sensor data into unified, adaptive maintenance scheduling frameworks. Many existing systems continue to rely on static scheduling models or narrowly focused data sources, which limit their ability to dynamically prioritize inspections and respond effectively to evolving system conditions [8,9]. To be effective, inspection planning in distributed photovoltaic (PV) systems must address multiple, often conflicting, objectives—minimizing operational costs, maximizing fault detection reliability, reducing downtime, and optimizing the allocation of skilled personnel. This complexity is further exacerbated by the diverse technical requirements of inspection teams, including expertise in thermal imaging, electrical diagnostics, mechanical evaluation, and safety compliance. Additionally, logistical constraints such as geographic dispersion and time-sensitive access windows further complicate the scheduling process. Addressing these intertwined challenges necessitates the development of intelligent, multi-objective optimization frameworks that are capable of real-time adaptation, multimodal data fusion, and context-aware decision-making.
Multi-objective evolutionary algorithms (EMOAs), such as the Non-dominated Sorting Genetic Algorithm II (NSGA-II) and the Multi-Objective Evolutionary Algorithm based on Decomposition (MOEA/D) [51] have demonstrated considerable effectiveness in solving complex maintenance and routing problems [51,52,53,54]. These algorithms are capable of generating diverse Pareto-optimal solution sets that balance competing objectives such as cost, time, and resource constraints [55,56,57]. Variants of the classical Vehicle Routing Problem (VRP) have been adapted to incorporate features relevant to maintenance contexts, including technician skill constraints, time windows, vehicle capacities, and dynamic or stochastic demand [58,59,60,61]. These models have been successfully applied in infrastructure and service management; however, they often lack integration with real-time sensor data and do not dynamically reconfigure teams based on evolving system states. As such, while powerful, these approaches are limited in their applicability to the highly dynamic and data-rich operational environments characteristic of modern solar PV installations.
To address the limitations of static scheduling, recent research has explored dynamic team formation strategies that optimize personnel allocation under multiple constraints. Team formation is a well-studied combinatorial optimization problem that focuses on assembling multi-skilled teams while accounting for skill complementarities, personnel availability, and geographic dispersion [62,63]. Although promising, many existing models assume static skill profiles and do not leverage real-time data for adaptive reconfiguration. Emerging work has begun to integrate machine learning techniques to enable dynamic team adaptation, although this remains an area of ongoing exploration [64]. In parallel, workforce scheduling frameworks developed in domains such as healthcare and technical field services provide transferable insights. These models emphasize skill matching, workload balancing, and compliance with operational regulations, which are equally relevant in the context of PV system maintenance planning [65,66].

2.5. Vehicle Routing and Scheduling Problems

The Vehicle Routing Problem (VRP) and its variants provide foundational frameworks for addressing logistical challenges in distributed PV maintenance operations by determining optimal routes for inspection teams across geographically dispersed installations while respecting technician availability, skill requirements, and operational constraints. Classical formulations include the Capacitated VRP (CVRP) for teams with limited equipment capacity [67], Vehicle Routing Problem with Time Windows (VRPTW) for scheduling constraints [68], Multi-Depot VRP (MDVRP) for multiple service centers [69], Stochastic VRP (SVRP) for uncertainty in travel times and fault probabilities [70], and Dynamic VRP (DVRP) for real-time route adjustments based on emerging conditions [71]. Recent advances have introduced hybrid approaches combining exact optimization with heuristic methods, particularly Large Neighborhood Search (LNS) [72] and Adaptive Large Neighborhood Search (ALNS) [51] algorithms that effectively handle complex maintenance routing scenarios with multiple constraints and objectives, while integration with Geographic Information Systems (GISs) and real-time traffic data has enhanced practical applicability through accurate travel time estimates and dynamic route optimization.
Advanced multi-objective evolutionary algorithms have demonstrated particular effectiveness in solving complex VRP variants for maintenance scheduling applications. The Multi-Objective Evolutionary Algorithm based on Decomposition with Dynamic Resource Allocation (MOEA/D-DRA) adaptively allocates computational resources to promising subproblems during evolution, improving convergence efficiency in high-dimensional objective spaces commonly encountered in maintenance optimization [73]. Similarly, NSGA-II with Dynamic Resource Allocation (NSGA-II-DRA) enhances the classical NSGA-II framework by dynamically adjusting selection pressure and resource distribution based on population diversity and convergence metrics [74]. The Pareto-based Multi-Objective Combinatorial Optimization (P-MOCO) approach specifically addresses discrete optimization problems like VRP by maintaining Pareto-optimal solution sets while efficiently exploring large combinatorial search spaces, making it particularly suitable for maintenance scheduling problems with discrete decision variables such as team assignments and route selections [75,76].

2.6. Team Formation and Workforce Optimization

Team formation optimization represents a critical component of effective maintenance management in distributed PV systems, focusing on assembling groups of technicians with complementary skills and capabilities to address specific maintenance requirements through the team formation problem (TFP). The TFP seeks to identify optimal personnel combinations that maximize team effectiveness while minimizing costs and coordination overhead by matching technician expertise in electrical diagnostics, thermal imaging analysis, mechanical repairs, and safety procedures with specific fault types and maintenance requirements at each installation. Mathematical formulations typically incorporate multiple objectives, including skill coverage maximization [77], communication efficiency optimization [78], and workload balancing among team members [65,66], while geographic considerations [79] account for physical proximity effects on coordination efficiency and travel costs. Dynamic team formation [80,81] approaches have gained increasing attention, utilizing real-time information about fault conditions, technician schedules, and resource constraints to continuously optimize team assignments, with machine learning techniques applied to learn from historical performance data [82,83] and predict optimal configurations for specific maintenance scenarios. The integration of workforce scheduling optimization with team formation creates additional complexity through multi-period formulations that address team reconfiguration over time to accommodate changing maintenance priorities, personnel availability, and skill development initiatives, considering both immediate maintenance requirements and long-term workforce development goals while maintaining consistent service quality across distributed installations.

2.7. Applications in Renewable Energy Maintenance

Within the renewable energy sector, combinatorial optimization techniques have been increasingly applied to enhance maintenance operations by considering environmental uncertainties and equipment failure risks. In wind and solar systems, models have been developed that incorporate weather-dependent accessibility, probabilistic component failure rates, and logistical constraints to improve scheduling accuracy and efficiency [84,85]. In the context of solar PV, multi-objective routing strategies combined with skill-based team assignments have been shown to improve cost-effectiveness and system reliability [86,87], with applications evolving from simple cleaning and inspection schedules to sophisticated predictive maintenance programs that integrate condition monitoring data with optimization algorithms. Large-scale utility installations have implemented advanced maintenance management systems that coordinate multiple inspection teams and optimize resource deployment across extensive geographic areas, while distributed PV systems require scalable approaches to efficiently manage thousands of installations with diverse ownership structures and varying technical requirements. However, many of these frameworks fall short in addressing the full complexity of modern PV operations, as they often overlook the integration of heterogeneous sensor data streams (e.g., thermal, electrical, and visual), lack responsiveness to real-time system behavior, and insufficiently incorporate compliance with regulatory standards such as IEC 61215 [48]/61730 [49,50]. These limitations highlight the need for more sophisticated, adaptive solutions that unify data-driven insights with robust optimization methodologies and standardized maintenance protocols across heterogeneous PV portfolios.

2.8. Research Gaps

Despite significant advances in individual components of PV maintenance systems, substantial research gaps remain in developing integrated, adaptive optimization frameworks that can effectively coordinate all aspects of maintenance operations. Current systems typically address individual optimization problems in isolation, such as fault detection, route optimization, or team formation, without considering the complex interdependencies and feedback loops that exist between these problems in real-world operations. The integration of heterogeneous data sources remains a critical limitation, as while individual sensing technologies have reached high maturity levels, the effective fusion of thermal imaging data, electrical measurements, environmental monitoring, and operational performance metrics into coherent optimization models requires further research. Additionally, uncertainty quantification and risk management represent important areas for future research, as maintenance optimization systems must operate under significant uncertainty regarding system conditions, weather patterns, personnel availability, and equipment reliability.
The scalability of optimization approaches to very large distributed systems remains an open research challenge, as current methods can effectively handle installations with hundreds or thousands of systems, but the emerging trend toward massive distributed PV deployments with millions of individual systems requires fundamentally new approaches to optimization problem decomposition, distributed computation, and coordination among multiple optimization agents. Current optimization approaches typically address uncertainty through scenario-based planning or robust optimization techniques, but more sophisticated probabilistic approaches that can dynamically adapt to changing uncertainty levels would provide improved performance and reliability. The development of standardized data formats, communication protocols, and integration frameworks would facilitate more effective data utilization and enable more sophisticated optimization approaches, while hierarchical optimization frameworks that can coordinate optimization decisions across multiple scales and organizational levels represent important directions for future research.
To address these critical research gaps, this work contributes a unified, two-tiered multi-objective optimization framework that integrates job scheduling and skill-based team formation through fault type mediation, effectively capturing the interdependencies between maintenance problems that current systems treat in isolation. The proposed Hybrid Multi-Objective Optimization with Adaptive Operator Selection (HMOO-AOS) algorithm addresses scalability challenges through dynamic operator selection and efficient implementation techniques, while the comprehensive dataset generation framework with empirically validated fault types enables standardized evaluation and comparison of optimization approaches. Furthermore, the cloud-integrated system architecture addresses data integration limitations by providing real-time sensor data fusion capabilities and supports uncertainty management through dynamic schedule adjustments based on evolving system conditions, weather patterns, and personnel availability.

3. Methodology

3.1. Problem Overview and Multi-Objective Coordination Framework for Distributed Solar Infrastructures Inspection Scheduling and Team Formation

This research addresses the operational complexity of managing inspection and maintenance tasks across geographically distributed solar energy infrastructure. Diverse fault types such as potential-induced degradation (PID), delamination, hot spots, and inverter failures are continuously detected via a combination of SCADA networks, automated fault detection subsystems (AFDSs), and manual field reports. The problem is modeled as a bi-level multi-objective optimization framework consisting of two tightly coupled components: (1) a job scheduling module that assigns fault resolution tasks to available inspection teams over multiple time horizons while accounting for constraints such as fault criticality, accessibility, workload distribution, and travel time; and (2) a team formation module that forms multi-skilled inspection teams by optimally assigning technicians with diverse expertise (e.g., electrical diagnostics, thermal imaging, mechanical repair) to cover the skill requirements inferred from the fault types present in scheduled jobs.
The proposed framework (Figure 1a) is embedded in a cloud-based distributed architecture that facilitates real-time coordination among monitoring infrastructure, optimization engines, field teams, and managerial systems. The data workflow (Figure 1b) begins with continuous ingestion of fault alerts from SCADA, AFDS, and manual inspections. These alerts undergo semantic classification and prioritization, generating structured job requests. The job scheduling algorithm then determines optimal task-to-team allocations, considering temporal-spatial constraints and multi-objective trade-offs. For each team’s job set, a skill vector is extracted based on the fault types associated with the jobs. These vectors are passed to the team formation module, which uses a Hybrid Multi-Objective Optimization algorithm to form efficient, skill-compliant teams. The final schedules and team assignments are deployed via mobile and web applications, allowing field crews to receive instructions, report progress, and adapt to dynamic events like weather or emergencies.
The proposed system is operationalized through a centralized optimization engine hosted in the cloud, which coordinates information flow between distributed solar plants and field teams. Each plant is equipped with AFDS, SCADA, and condition-monitoring sensors that stream fault reports to a central data store. This repository feeds into the scheduling and team formation optimization system, which analyzes incoming tasks based on urgency, location, required skills, and equipment constraints. The scheduling engine employs multi-objective optimization to assign jobs based on skill alignment, workload balancing, and proximity. Real-time changes such as fault escalation or technician availability are continuously integrated into the scheduling process, ensuring adaptability and minimal downtime. A two-way communication system enables teams to receive tasks and update job statuses through mobile apps, closing the feedback loop.
At the organizational level, the architecture facilitates seamless coordination among solar plant operators, regional inspection hubs, mobile crews, and top-level managers. Regional hubs act as dispatch centers, equipped with tools and transportation for mobilizing inspection teams. Technicians are deployed based on skill profiles and geographic proximity and receive schedules through user-friendly mobile apps. Plant operators initiate inspections, while managers access dashboards to monitor key metrics such as team utilization, task completion rates, and schedule adherence. Role-based interfaces and standardized communication protocols ensure that all stakeholders, from operational staff to decision-makers, are synchronized in real time. This end-to-end pipeline enables an intelligent, responsive, and scalable solution for inspection scheduling and workforce coordination in large-scale solar energy networks.

3.2. Mathematical Modeling

To effectively coordinate inspection operations in distributed solar energy infrastructure, we formulate two interconnected multi-objective combinatorial optimization problems: job scheduling and skill-based team formation. These problems are structurally distinct but tightly coupled through shared dependency on fault types and skill requirements. The job scheduling model focuses on the temporal and spatial assignment of inspection tasks to mobile teams across geographically dispersed sites, subject to multiple operational constraints. The team formation model seeks optimal technician groupings that collectively satisfy the skill requirements of scheduled jobs while optimizing team efficiency and cohesion. The upper-level job scheduling problem determines when and where each inspection task should be executed over the planning horizon. Once a candidate schedule is established, the lower-level team formation problem addresses how to assign technicians by constructing feasible teams that possess the necessary skills to perform the scheduled tasks. The feasibility and performance of the upper-level schedule, therefore, depend directly on the outcomes of the lower-level team formation. In turn, the quality of team assignments is evaluated based on the schedule provided from the upper level, and this feedback is used to iteratively refine scheduling decisions. This section presents the detailed mathematical formulations for both problem layers, including objective functions, decision variables, and system constraints.

3.2.1. Multi-Objective Job Scheduling: Problem Description and Mathematical Modeling

The multi-objective job scheduling problem considered in this study arises in the context of large-scale solar energy infrastructure inspections, where geographically distributed inspection jobs must be dynamically allocated to mobile teams operating from designated regional hubs. Each job represents a maintenance or diagnostic task triggered by a specific fault event at a solar plant, and is characterized by location, deadline, estimated duration, and priority level. Inspection teams are constrained by daily working time limits, travel feasibility, and task precedence. The scheduling objective is to construct efficient, balanced plans over multiple days that minimize total travel distance, minimize overall tardiness and priority-weighted delays, balance workloads among teams, and distribute job assignments evenly across schedule days. These objectives are inherently conflicting: minimizing travel distance may increase tardiness if the nearest team cannot meet the job’s deadline; balancing workloads across teams can raise total travel cost; prioritizing urgent tasks may delay lower-priority jobs; and distributing assignments evenly across days may conflict with minimizing tardiness or cost. This problem is formulated as a five-objective combinatorial optimization task subject to operational constraints such as job-team exclusivity, travel-time feasibility, precedence sequencing, and temporal availability.
Let J = { 1 , 2 , , n } denote the set of inspection jobs, and S = { 1 , 2 , , m } represent the set of inspection stations (or mobile teams). Each job j J is associated with an inspection duration t j > 0 , a due date D j , and a priority weight p j > 0 . Travel between locations incurs a distance cost d i j between any two jobs i and j, or between a station and a job. Travel time is computed by dividing the distance by a constant speed v. The scheduling task involves assigning jobs to stations and determining their execution sequence while satisfying temporal and capacity constraints.
The proposed inspection scheduling model utilizes several decision variables to represent job assignments, sequencing, and timing. Let x j s { 0 , 1 } be a binary variable that takes the value 1 if job j is assigned to station s, and 0 otherwise. To capture the relative scheduling order of jobs at each station, π j k s { 0 , 1 } is defined as a binary sequencing variable that equals 1 if job j is scheduled before job k by station s. The variable τ j R 0 denotes the start time of job j, while z j R 0 represents the tardiness of job j, i.e., the non-negative difference between its completion time and due date. These variables collectively enable the formulation of constraints and objectives that address assignment feasibility, temporal consistency, and service-level requirements.
The problem is formulated as a multi-objective optimization model with the following objectives: minimize total travel distance incurred by inspection teams (Equation (1)) and minimize total tardiness across all scheduled jobs (Equation (2)),
min f 1 = s S i J j J x i s · x j s · d i j
min f 2 = j J z j
minimize workload imbalance among inspection stations, expressed as the standard deviation of job counts (Equation (3)), minimize priority-weighted tardiness across all scheduled jobs (Equation (4)),
min f 3 = σ j J x j s , s S
min f 4 = j J p j · z j
and minimize scheduling imbalance in terms of the number of active days required by each team (Equation (5)):
min f 5 = σ D active , s S
The proposed model incorporates several constraints to ensure logical and operational feasibility. First, each job j J must be assigned to exactly one station s S , which is enforced through the assignment constraint s S x j s = 1 . To ensure temporal ordering of jobs at each station, the sequencing constraint π j k s + π k j s = 1 is introduced for all job pairs j k , under the condition that both are assigned to the same station (i.e., x j s = x k s = 1 ). This constraint guarantees that either job j precedes job k or vice versa, but not both. Temporal feasibility is maintained by ensuring that the start time of a job respects the completion time and travel delay from its predecessor. Specifically, for all j , k J and s S , the constraint
τ k τ j + t j + d j k v M ( 1 π j k s )
holds, where t j is the processing time of job j, d j k is the distance between the locations of jobs j and k, v s . is the travel speed, and M is a sufficiently large constant used in the big-M formulation. Tardiness is modeled using the constraint
z j τ j + t j D j ,
which ensures that z j captures any positive deviation between the job’s completion time and its due date D j . Furthermore, to comply with labor regulations or operational policies, the model imposes a daily working time limit for each station. For each day d Days and station s S , the cumulative duration of all assigned jobs, including travel time, must not exceed H max , as represented by
j Day d d j k v + t k H max .
Finally, the decision variable domains are defined as follows: x j s { 0 , 1 } , π j k s { 0 , 1 } , τ j 0 , and z j 0 . These ensure proper variable interpretations as binary or continuous, depending on their roles within the model.
This formulation encapsulates a rich and realistic variant of the multi-objective scheduling problem, incorporating spatial logistics, deadline compliance, resource balancing, and priority management. Given the combinatorial complexity and multi-objective nature of the problem, exact methods are computationally intractable for large instances. Consequently, metaheuristic techniques such as NSGA-II, MOEA/D, or hybrid adaptive evolutionary algorithms are employed to obtain high-quality Pareto-optimal solutions.
Once jobs are temporally and spatially allocated to inspection teams, the next step is to determine the team-specific skill requirements. Each inspection job corresponds to one or more fault types (e.g., microcracks, PID, hotspots), and each fault type implies a set of technical competencies. By aggregating the skills required to resolve all faults assigned to a particular team, a comprehensive skill requirement vector is constructed. This derived skill profile serves as a critical input to the subsequent team formation optimization, ensuring that each team is equipped with the necessary capabilities to carry out its assigned inspections effectively.

3.2.2. Bi-Objective Team Formation: Problem Description and Mathematical Modeling

The skill-based team formation problem aims to construct multiple inspection teams by optimally assigning available employees such that each team satisfies the skill requirements derived from its assigned fault types. Each employee possesses a predefined set of skills, and each team is required to cover a subset of these skills to effectively address the faults assigned to it. The formulation pursues two conflicting objectives: (i) maximizing the total intra-team interconnection cost, which quantifies collaboration compatibility or historical working synergy between team members using a pairwise affinity matrix, and (ii) minimizing the total team size, thereby promoting compact, cost-effective, and manageable team structures.
This combinatorial assignment task is subject to several operational constraints. Most critically, each employee may be assigned to at most one team, enforcing exclusivity and avoiding overutilization [88]. Furthermore, skill coverage constraints mandate that each team collectively satisfies all the skills required for resolving its designated faults [89]. This problem formulation captures the essential trade-off between team cohesion and resource efficiency, while ensuring that fault-specific competencies are not compromised. The optimization framework, therefore, supports the deployment of multidisciplinary teams that are both collaborative and cost-effective for geographically distributed maintenance operations.
Let E = 1 , , N be the set of employees, T = 1 , , M the set of teams, and S = 1 , , K the set of required skills. The binary parameter a e , s indicates whether employee e has skill s, while r t , s specifies whether team t requires skill s. The pairwise parameter c e , e 0 defines the interconnection cost between employees e and e . The binary decision variable x e , t equals 1 if employee e is assigned to team t, and 0 otherwise.
The model enforces two main constraints. The skill coverage constraint ensures that for each required skill of a team, there is at least one assigned employee who possesses it: e E a e , s x e , t r t , s . The employee assignment constraint ensures that no employee is assigned to more than one team: t T x e , t 1 . The first objective is to minimize the total number of assigned employees, and the second objective is to maximize the total interconnection cost across all teams. The model is solved using bi-objective optimization techniques to find a balance between team connectivity and compactness.
minimize x e , t { 0 , 1 } f 2 = e E t T x e , t
maximize x e , t { 0 , 1 } f 1 = t T e E e E e > e c e , e x e , t x e , t
subject to
e E a e , s x e , t r t , s , t T , s S
t T x e , t 1 , e E
x e , t { 0 , 1 } , e E , t T

3.3. Optimization Algorithms

3.3.1. Job Scheduling Algorithms

In this study, a wide range of heuristic and metaheuristic algorithms is utilized to address the multi-objective combinatorial challenges of dynamic inspection scheduling within a distributed solar energy infrastructure. The metaheuristic methods include advanced multi-objective evolutionary algorithms such as MOEA/D and its enhanced variants (HMOEA/D-AS [51], PMOEA/D-ES [90], TMOEA/D-DP [91]), along with Pareto-based approaches like NSGA-II [92] and NSGA-III [93], which are known for their ability to effectively approximate Pareto-optimal fronts in complex optimization scenarios. These are complemented by heuristic techniques, including distance minimization, earliest deadline first (EDF), workload balancing, priority-weighted scheduling, and hybrid multi-objective heuristics that offer fast, interpretable solutions tailored to specific operational goals such as reducing travel time, ensuring fairness, and addressing urgent tasks. A detailed overview of all algorithms, their categories, and targeted objectives is provided in Table 1. Together, this diverse algorithmic portfolio allows for a thorough performance evaluation, balancing solution quality, computational efficiency, and real-world applicability within the dynamic and resource-constrained setting of solar infrastructure inspection management, although the current evaluation is limited to synthetic datasets and benchmark scenarios.

3.3.2. Proposed Team Formation Algorithm: HMOO-AOS

In the proposed inspection framework, the team formation sub-problem is addressed using a novel Hybrid Multi-Objective Optimization with Adaptive Operator Selection (HMOO-AOS) algorithm. The metaheuristic approach is essential due to the NP-hard nature of multi-skilled team assignment, where technicians with heterogeneous expertise (electrical diagnostics, thermal imaging, mechanical repair) must be optimally allocated while satisfying fault-specific skill requirements and capacity constraints [80,81]. This combinatorial problem exhibits exponential search space growth with team size and skill diversity, making exact methods computationally infeasible for real-time deployment [80]. Additionally, the simultaneous optimization of conflicting objectives—including skill coverage efficiency and team coordination overhead—requires Pareto-frontier exploration that conventional optimization techniques cannot deliver within the required operational time frames. The proposed algorithm leverages permutation-based representations to efficiently model team assignments and enhances the proven NSGA-II framework through intelligent Adaptive Operator Selection and hybrid metaheuristic operators, delivering robust, high-quality solutions that excel in dynamic solar maintenance environments where fault priorities and technician availability evolve continuously. This computational complexity and operational dynamism necessitate the metaheuristic approach adopted in HMOO-AOS to ensure both solution quality and real-time responsiveness.
In classical bi-level programming, the lower-level problem is assumed to be solved to exact optimality. This assumption ensures that the leader’s decision is always evaluated against the follower’s true best response and enables strong theoretical properties such as equivalence to KKT reformulations or dual approaches [94,95].
In our setting, however, the lower-level task of team assignment is a large-scale combinatorial problem. Solving it exactly for realistic instances is computationally intractable. Metaheuristics, therefore, provide a practical alternative, allowing high-quality solutions to be obtained within a reasonable time. While these methods do not guarantee strict optimality, they are widely recognized as effective for complex bi-level problems where exact approaches are not feasible [94,96,97].
To ensure adequacy, we validate the metaheuristic solver on small instances with known optimal solutions, perform multiple independent runs to confirm stability, and monitor convergence behavior to avoid premature termination. Through this approach, the upper-level scheduling decisions are evaluated against consistent and near-optimal team assignments, ensuring that the bi-level framework remains both reliable and applicable in practice, in line with established applications of evolutionary bi-level optimization in scheduling and resource allocation problems [96,98].
The HMOO-AOS is designed to handle permutation-based combinatorial representations typical of team construction tasks and optimizes multiple conflicting objectives under strict feasibility constraints. HMOO-AOS extends the standard NSGA-II framework by incorporating an Adaptive Operator Selection mechanism and multiple metaheuristic operators to enhance convergence and maintain solution diversity.
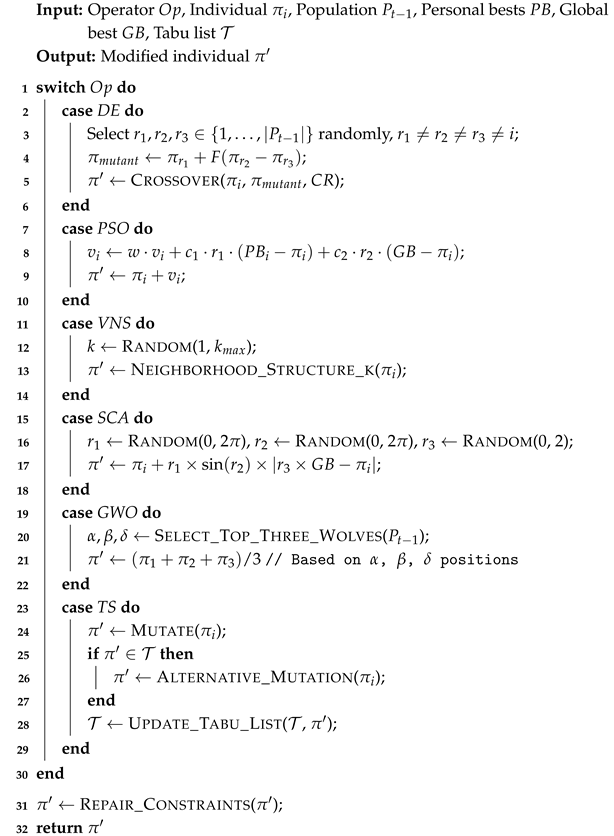
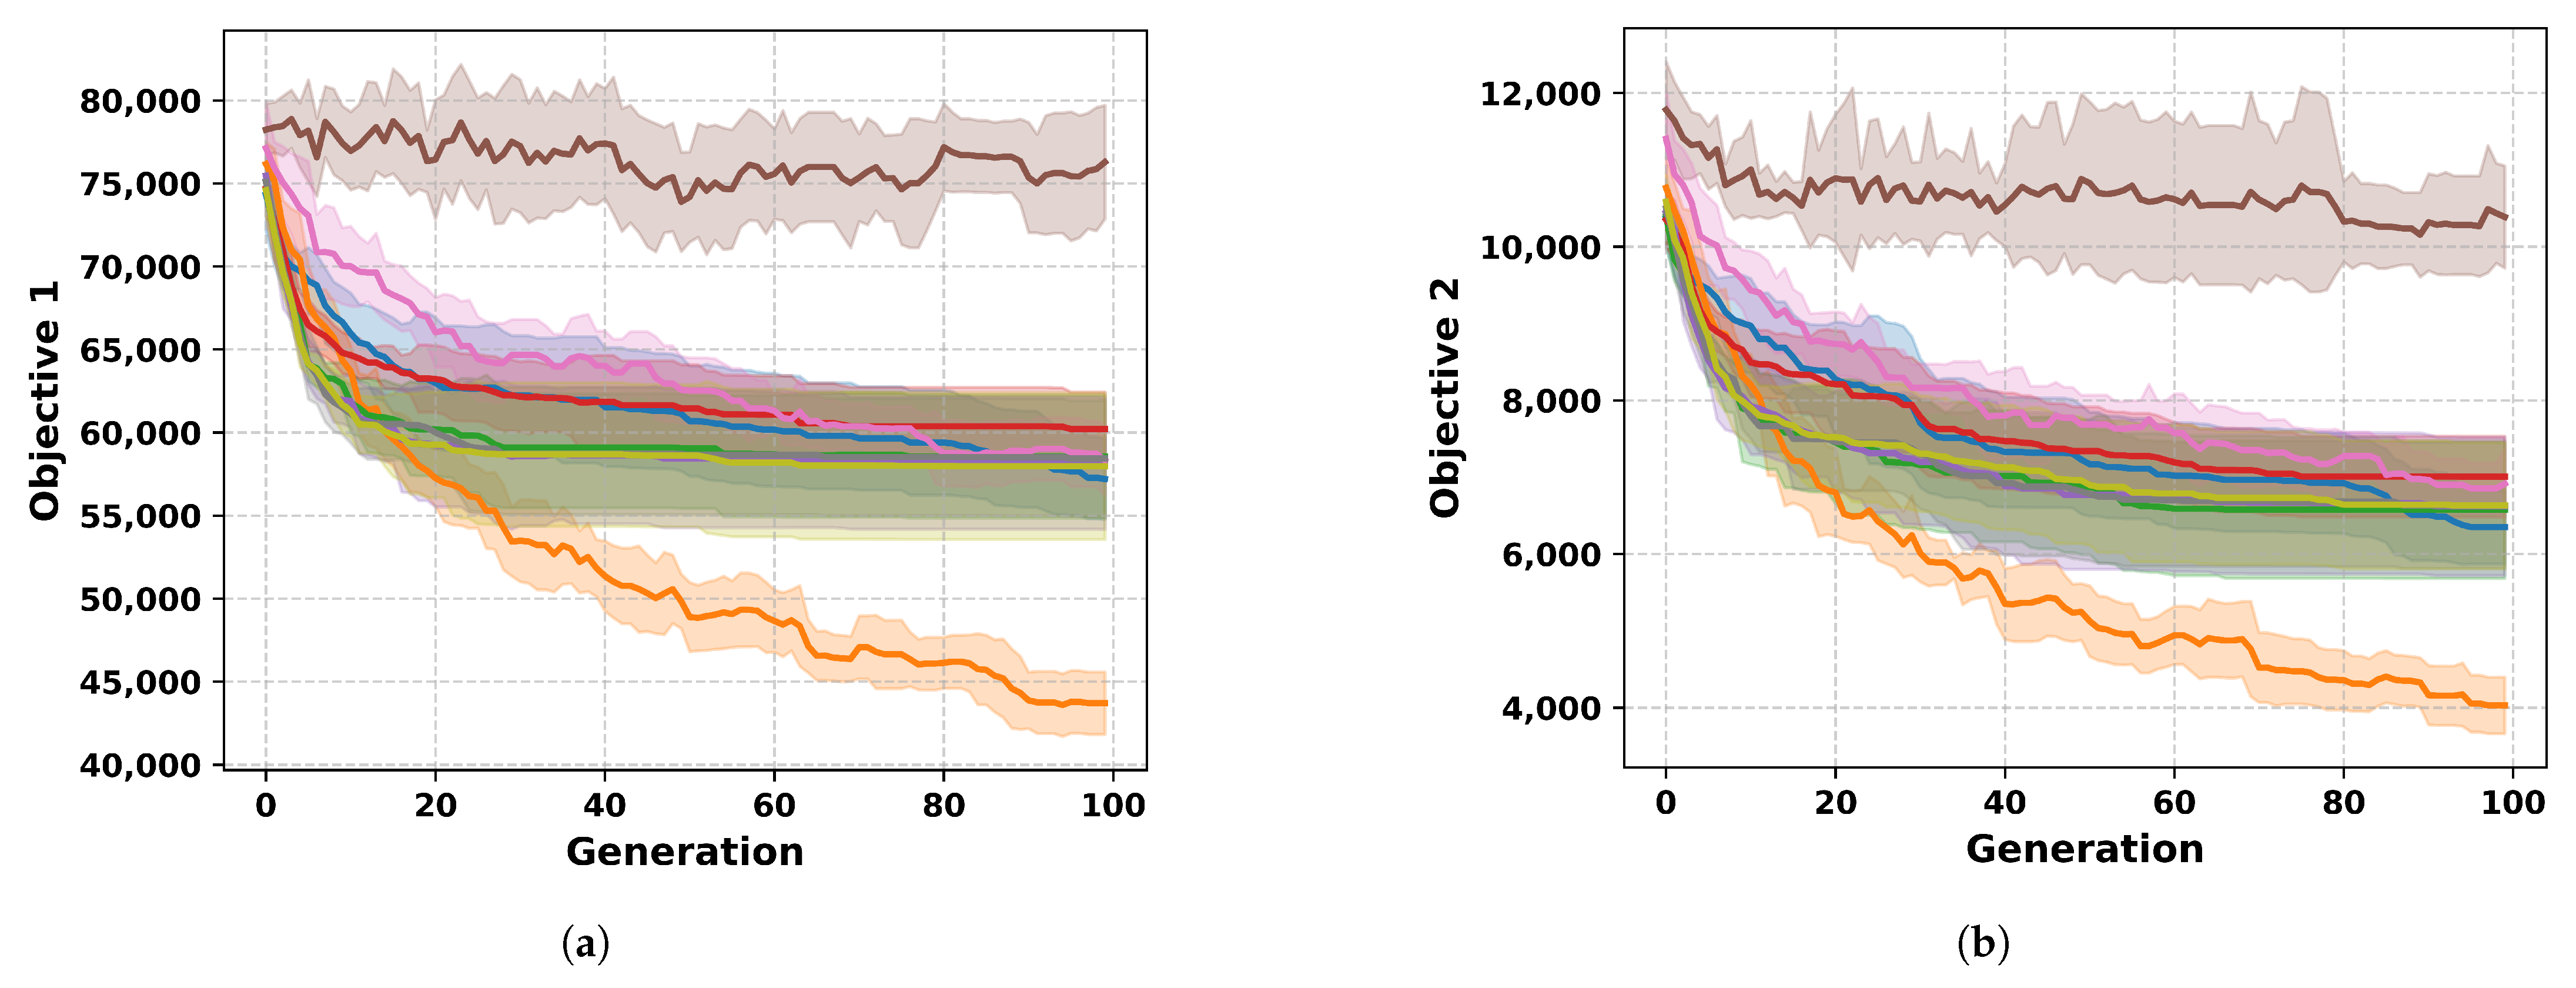
As shown in Algorithm 1, the optimization begins by initializing a population of valid solutions, where each solution represents a feasible team configuration. Fitness evaluation is performed in parallel to reduce computational overhead. The algorithm iteratively evolves the population by selecting operators dynamically through an Upper Confidence Bound (UCB)-based adaptive mechanism. This encourages exploration by rewarding operators that produce better offspring over time. The offspring are evaluated and filtered through a fast environmental selection process based on Pareto dominance and crowding distance.
The proposed HMOO-AOS algorithm differs from existing Adaptive Operator Selection methods, such as MAENS [99] and AdaMOEA [100], by integrating six complementary metaheuristics (DE, PSO, VNS, SCA, GWO, TS) within a unified NSGA-II framework, using UCB criteria tailored for the discrete, constraint-rich team formation and scheduling problems in PV maintenance. Unlike approaches relying on fixed operator strategies (e.g., MAENS [99]), historical offspring dataset–driven methods (e.g., MOEA/D-CTAOS with classification tree learning [101]), or deep reinforcement learning–based selection (e.g., Dual-Centralized Q-Network-Based Reinforcement Learning [75] or AdaMOEA [100]) for general multi-objective optimization, HMOO-AOS dynamically selects operators based on real-time performance against skill coverage, team compactness, and geographic dispersion constraints, explicitly addressing the unique fault-type dependencies and operational realities of distributed solar maintenance—characteristics absent in general-purpose frameworks.
Algorithm 2 illustrates how each metaheuristic operator (DE, PSO, VNS, SCA, GWO, TS) is invoked via the Apply Operator function. Each operator introduces a different search behavior: global exploration, local exploitation, or guided neighborhood movement, contributing to the algorithm’s ability to navigate diverse landscapes. Tabu Search is enhanced with a tabu list T to prevent search cycling.
In the algorithms, we consider a population size denoted by N and the number of generations G. Each candidate solution, represented as π , is an individual permutation evaluated based on the Pareto dominance relation ≻. Throughout the optimization process, personal best ( P B ) and global best ( G B ) solutions are maintained to guide the search. The algorithm utilizes a set of operators O , each characterized by a mean reward μ k and a selection count n k for operator k. Operator selection is performed using the Upper Confidence Bound criterion U C B k . The population is organized into non-dominated fronts F i and assessed using performance metrics such as the hypervolume indicator H V and the spacing metric S. To prevent cycling, a tabu list T is employed. For multi-objective problems, M denotes the number of objectives, while L represents the length of individual solutions.
To ensure practical scalability, HMOO-AOS is implemented using Numba for JIT compilation, vectorized operations for memory efficiency, and Python multiprocessing for parallel evaluations. Table 2 presents the algorithm’s time and space complexity across its core components. The overall runtime complexity is
O N · M + N · log N ,
which is significantly reduced by parallelization and efficient sorting.
Algorithm 1: Hybrid Multi-Objective Optimization with Adaptive Operator Selection (HMOO-AOS).
Systems 13 00822 i001
Algorithm 2: Apply Operator function.
Systems 13 00822 i002
Table 2. Complexity analysis of the HMOO-AOS algorithm.
ComponentTime ComplexitySpace Complexity
Population Initialization O ( N × L ) O ( N × L )
Fitness Evaluation O ( N × M ) O ( N × M )
Non-dominated Sorting O ( N 2 × M ) O ( N 2 )
Crowding Distance O ( N log N ) O ( N )
Operator Application O ( N × L ) O ( L )
AOS Update O ( | O | ) O ( | O | )
Overall O ( G × N × ( M + log N ) ) O ( N × L )

3.4. Datasets Development and Experimental Setup

In the absence of publicly available operational datasets, primarily due to proprietary restrictions and data confidentiality agreements in the energy sector, this study adopts a synthetic yet empirically grounded dataset generation strategy. The motivation is twofold: to ensure reproducibility of experimental results under controlled, transparent conditions, and to enable scalable benchmarking of optimization algorithms across diverse, realistic scenarios. The synthetic dataset is carefully designed to mirror actual operational complexities in distributed solar infrastructure, incorporating spatial distributions, scheduling constraints, and expert-validated fault classifications. By embedding domain-informed assumptions and expert-driven skill mappings, the dataset maintains a high degree of ecological validity while offering the flexibility to vary key parameters such as job density, fault diversity, and team specialization. This enables comprehensive algorithm evaluation and fosters methodological robustness, both of which are critical for advancing deployable, intelligent maintenance systems in utility-scale solar energy environments.

3.4.1. Datasets Design and Expert Knowledge Integration for Solar Plants Inspection

To evaluate scheduling algorithms in distributed solar PV inspection, a synthetic yet empirically grounded dataset was developed to simulate realistic operational constraints, geographic dispersion, job deadlines, fault severity, skill demands, and resource limitations. Plant and station coordinates were sampled within solar-dense regions, and travel times were estimated using the haversine formula adjusted for regional traffic conditions. Each job was defined by location, duration, deadline, priority (based on fault severity), and required inspection skills. Jobs adhere to feasibility constraints, ensuring realistic distances and serviceability.
Each fault type was characterized in terms of fault severity, approximate inspection duration, and the specific skill sets required for resolution. These characterizations were established through a combination of systematic literature review drawing from peer-reviewed sources such as Solar Energy, Renewable Energy, and IEEE Transactions on Sustainable Energy and validated through structured consultations with domain experts actively engaged in solar energy operations. This dual-source methodology ensures that the inspection profiles for each fault type reflect both established scientific understanding and real-world operational practices, thereby enhancing the dataset’s empirical realism and applicability to practical maintenance planning.

3.4.2. Datasets Design and Expert Knowledge Integration for Team Formation

To simulate a realistic environment for team formation in solar power plant reinspection, an expertise dataset was generated to represent the technical capabilities of inspection teams. This dataset reflects the diversity in skills required to identify and diagnose common photovoltaic (PV) system faults and forms a critical foundation for evaluating team-task compatibility. The expertise of each team is modeled with respect to a predefined set of fault types, where each fault type is treated as a distinct area of technical specialization. The selected fault categories include microcracks, soiling, hotspots, delamination, discoloration, potential-induced degradation (PID), snail trails, and cell mismatch—each corresponding to a unique skill domain.
A fixed number of inspection teams was synthesized to mirror real-world variability in workforce composition. For each team, an expertise profile was generated by randomly sampling a subset of fault types from the complete domain. The number of expertise areas assigned to each team was varied randomly within a reasonable range, ensuring the presence of both specialized and generalized teams. Specialized teams were assigned fewer expertise areas, simulating focused diagnostic units, whereas generalized teams were associated with a broader skill set, allowing for greater flexibility in deployment. This design supports a balanced representation of operational scenarios where both narrow and broad skill coverage are relevant.
The expertise profiles were encoded in a binary matrix format, where rows represent individual teams and columns correspond to fault categories. A binary value of ‘1’ indicates that the team possesses the required expertise for that fault type, while a ‘0’ indicates the absence of such expertise. This representation allows for efficient assessment of skill-based compatibility between teams and inspection tasks. Once generated, the expertise matrix was exported in a structured tabular format suitable for integration into team formation algorithms, optimization models, and decision-support systems. The resulting dataset enables controlled experimentation in fault-aware team allocation and contributes to advancing intelligent maintenance strategies in solar energy infrastructure.
The two datasets were created using a modular Python pipeline (NumPy, pandas). All scripts and data will be made available via [GitHub link/DOI placeholder], offering a flexible and realistic testbed for inspection scheduling research.

3.5. Experimental Setup

All experiments were conducted on the Kaggle kernel platform using Python 3.10, leveraging a controlled cloud-based environment with a single-core CPU and up to 16 GB RAM. Due to computational constraints, each algorithm was independently run 20 times per test case to capture stochastic variability and ensure statistical reliability.
For the job scheduling experiments, a synthetic dataset comprising 1000 inspection jobs was generated, spanning 25 geographically distributed solar power plants and serviced by 10 inspection stations, each associated with a corresponding mobile inspection team. These jobs incorporate spatial, temporal, and operational constraints to emulate real-world dispatch scenarios. In parallel, the team formation experiments utilize a separate dataset consisting of 800 employee profiles, designed to supply a diverse skill pool for forming the 10 inspection teams. Each employee is characterized by a binary skill vector aligned with predefined fault-specific competencies. This experimental design ensures sufficient scale and diversity to rigorously evaluate the performance and generalizability of the proposed multi-objective optimization algorithms across both scheduling and team formation domains.
To evaluate scalability and robustness, the job scheduling problem was tested across seven benchmark scenarios (Cases 1–7), with job volumes ranging from 155 to 355. For each case, the specified number of jobs was randomly sampled from the synthetic job scheduling dataset, ensuring diverse and representative evaluation instances. For each mobile inspection team, the set of scheduled jobs defines the list of fault types they must address. These fault types are systematically translated into corresponding skill requirements, ensuring that each team possesses the necessary competencies to resolve all assigned issues effectively.
Table 3 provides a comprehensive summary of the benchmark configurations used to evaluate the performance of the proposed scheduling and team formation algorithms. Each test case (Cases 1–7) corresponds to a progressively larger subset of inspection jobs, ranging from 155 to 355, thereby enabling a scalability analysis under increasing workload conditions. For each case, the average number of fault types allocated to each team and the resulting average number of skills required were computed. These metrics reflect the increasing complexity of coordination and skill matching as job volumes grow. The benchmark settings ensure a consistent and controlled experimental environment, facilitating rigorous comparisons across varying problem scales.
All other input parameters, including travel distances, team configurations, and operational constraints, were held constant across all cases to isolate the impact of job count on algorithmic performance. The detailed configuration of each test scenario is summarized in Table 3.
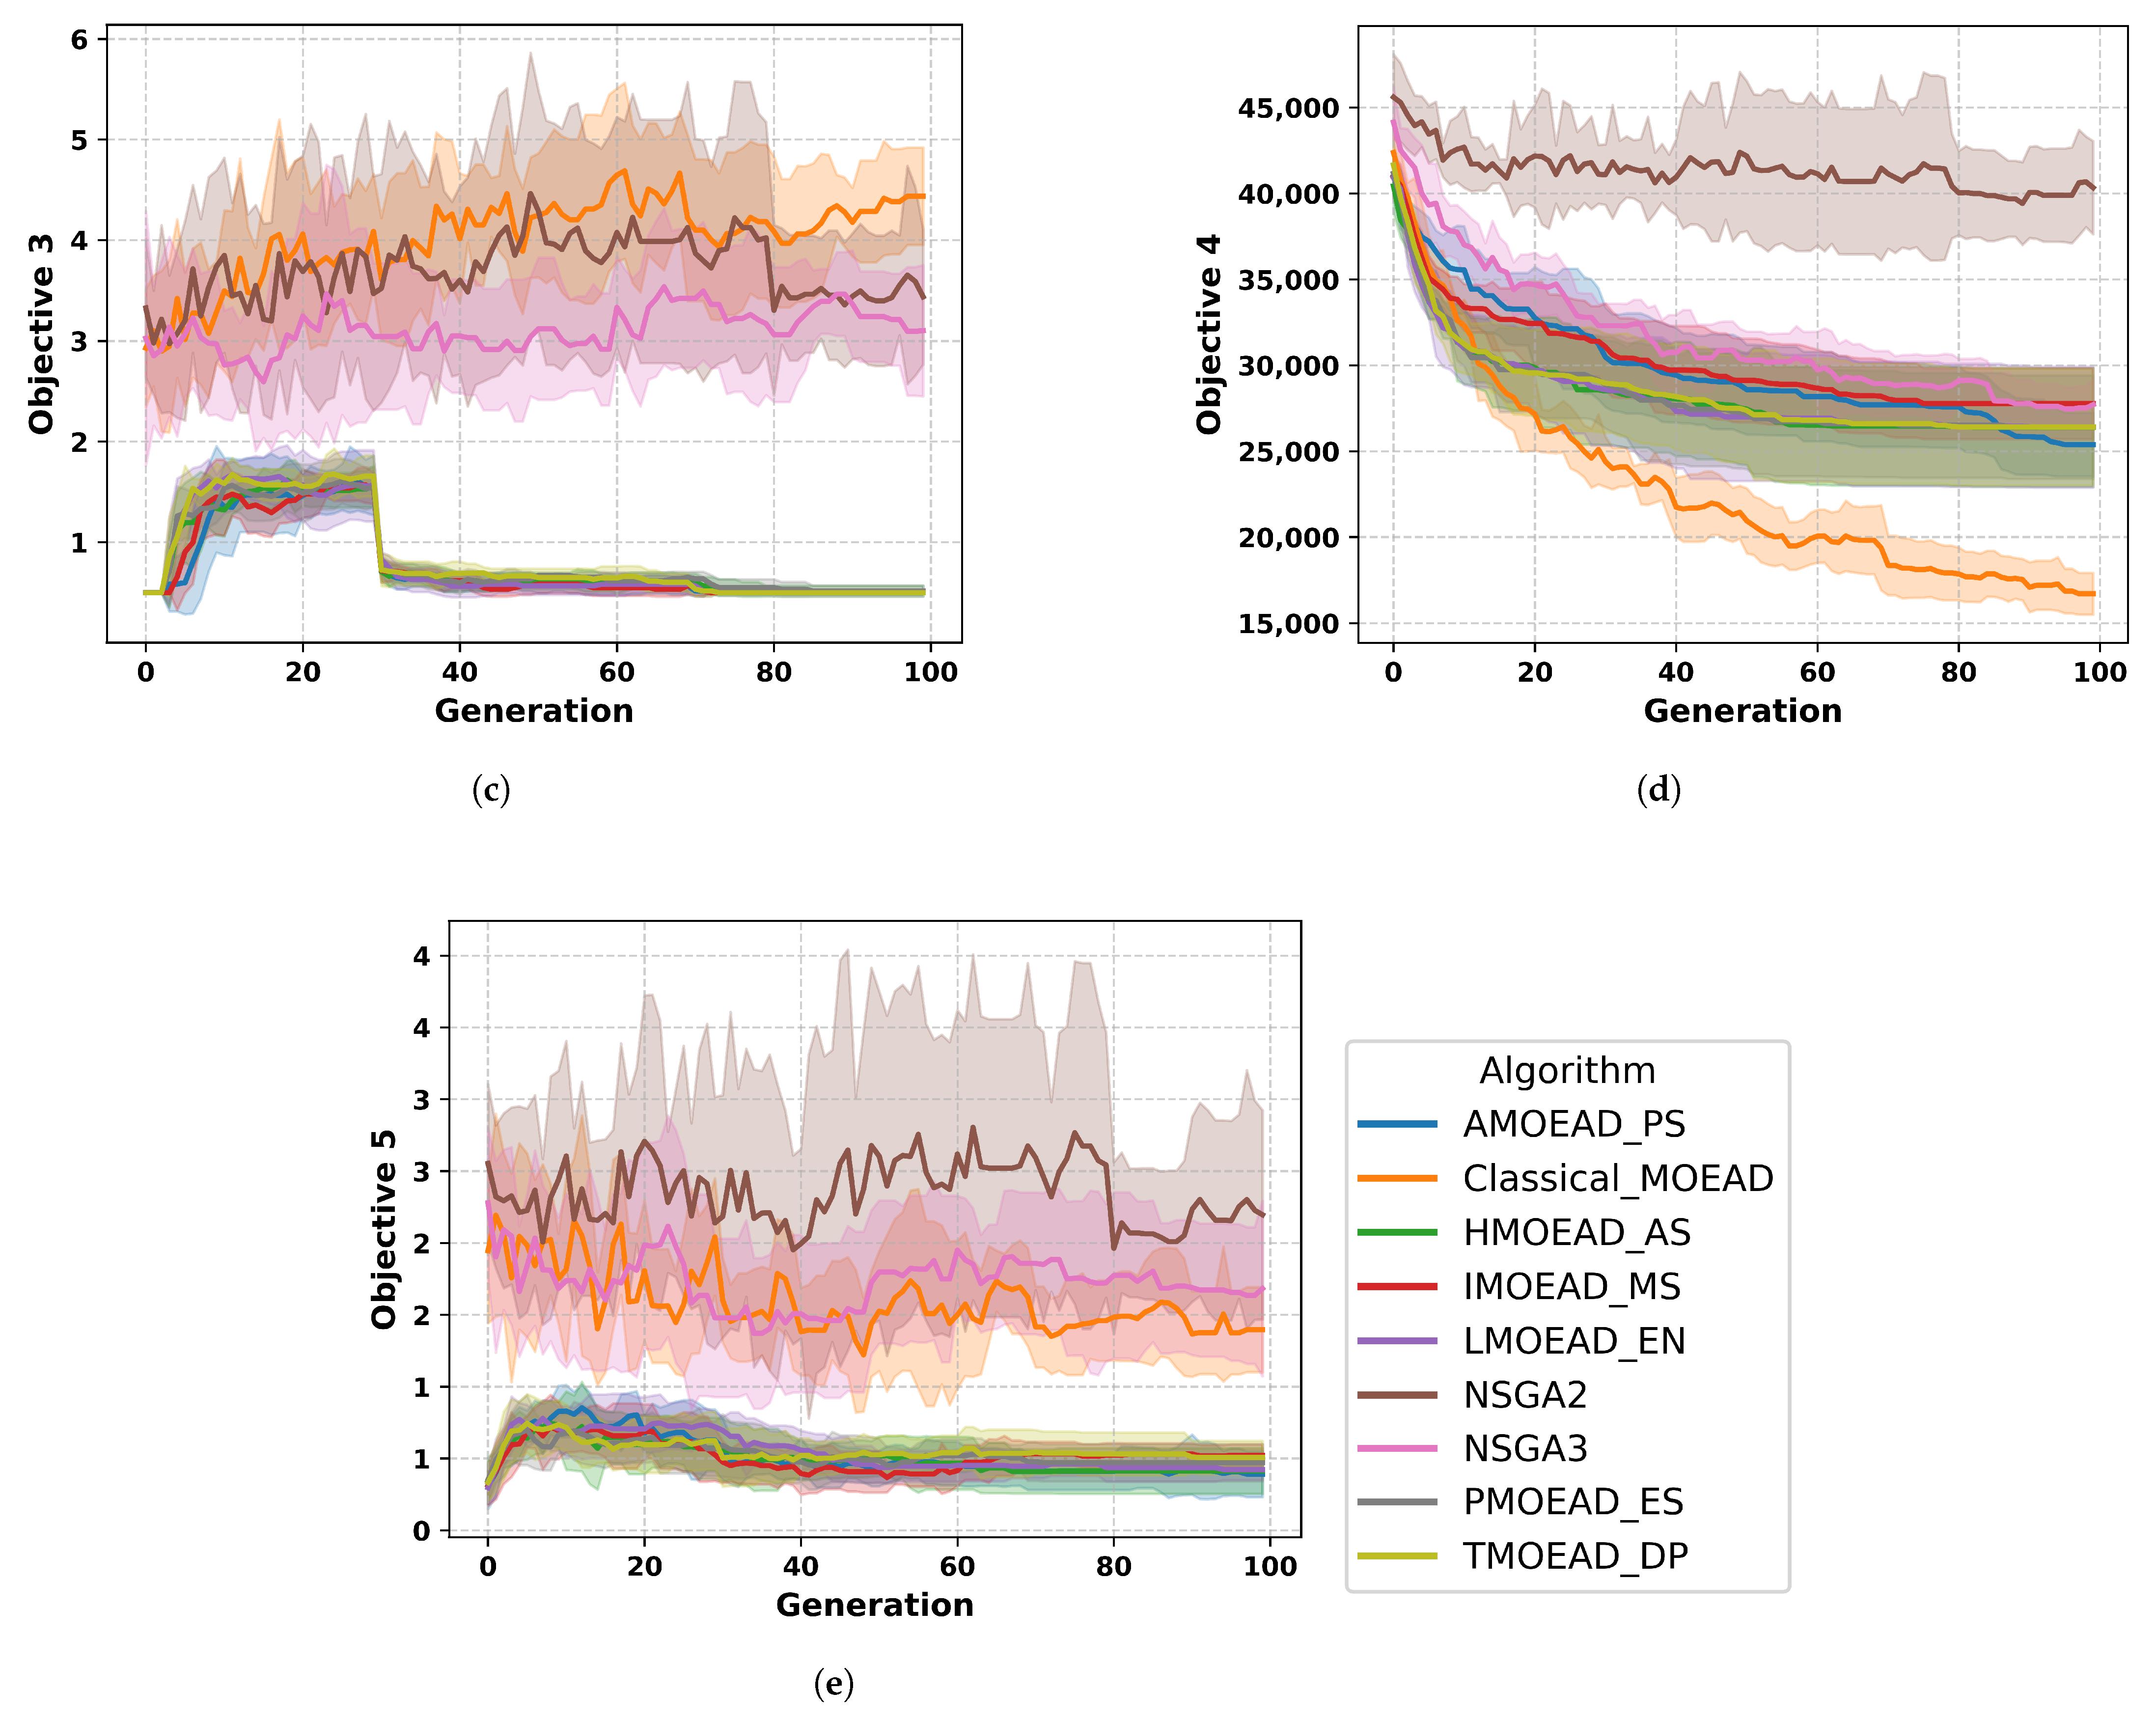
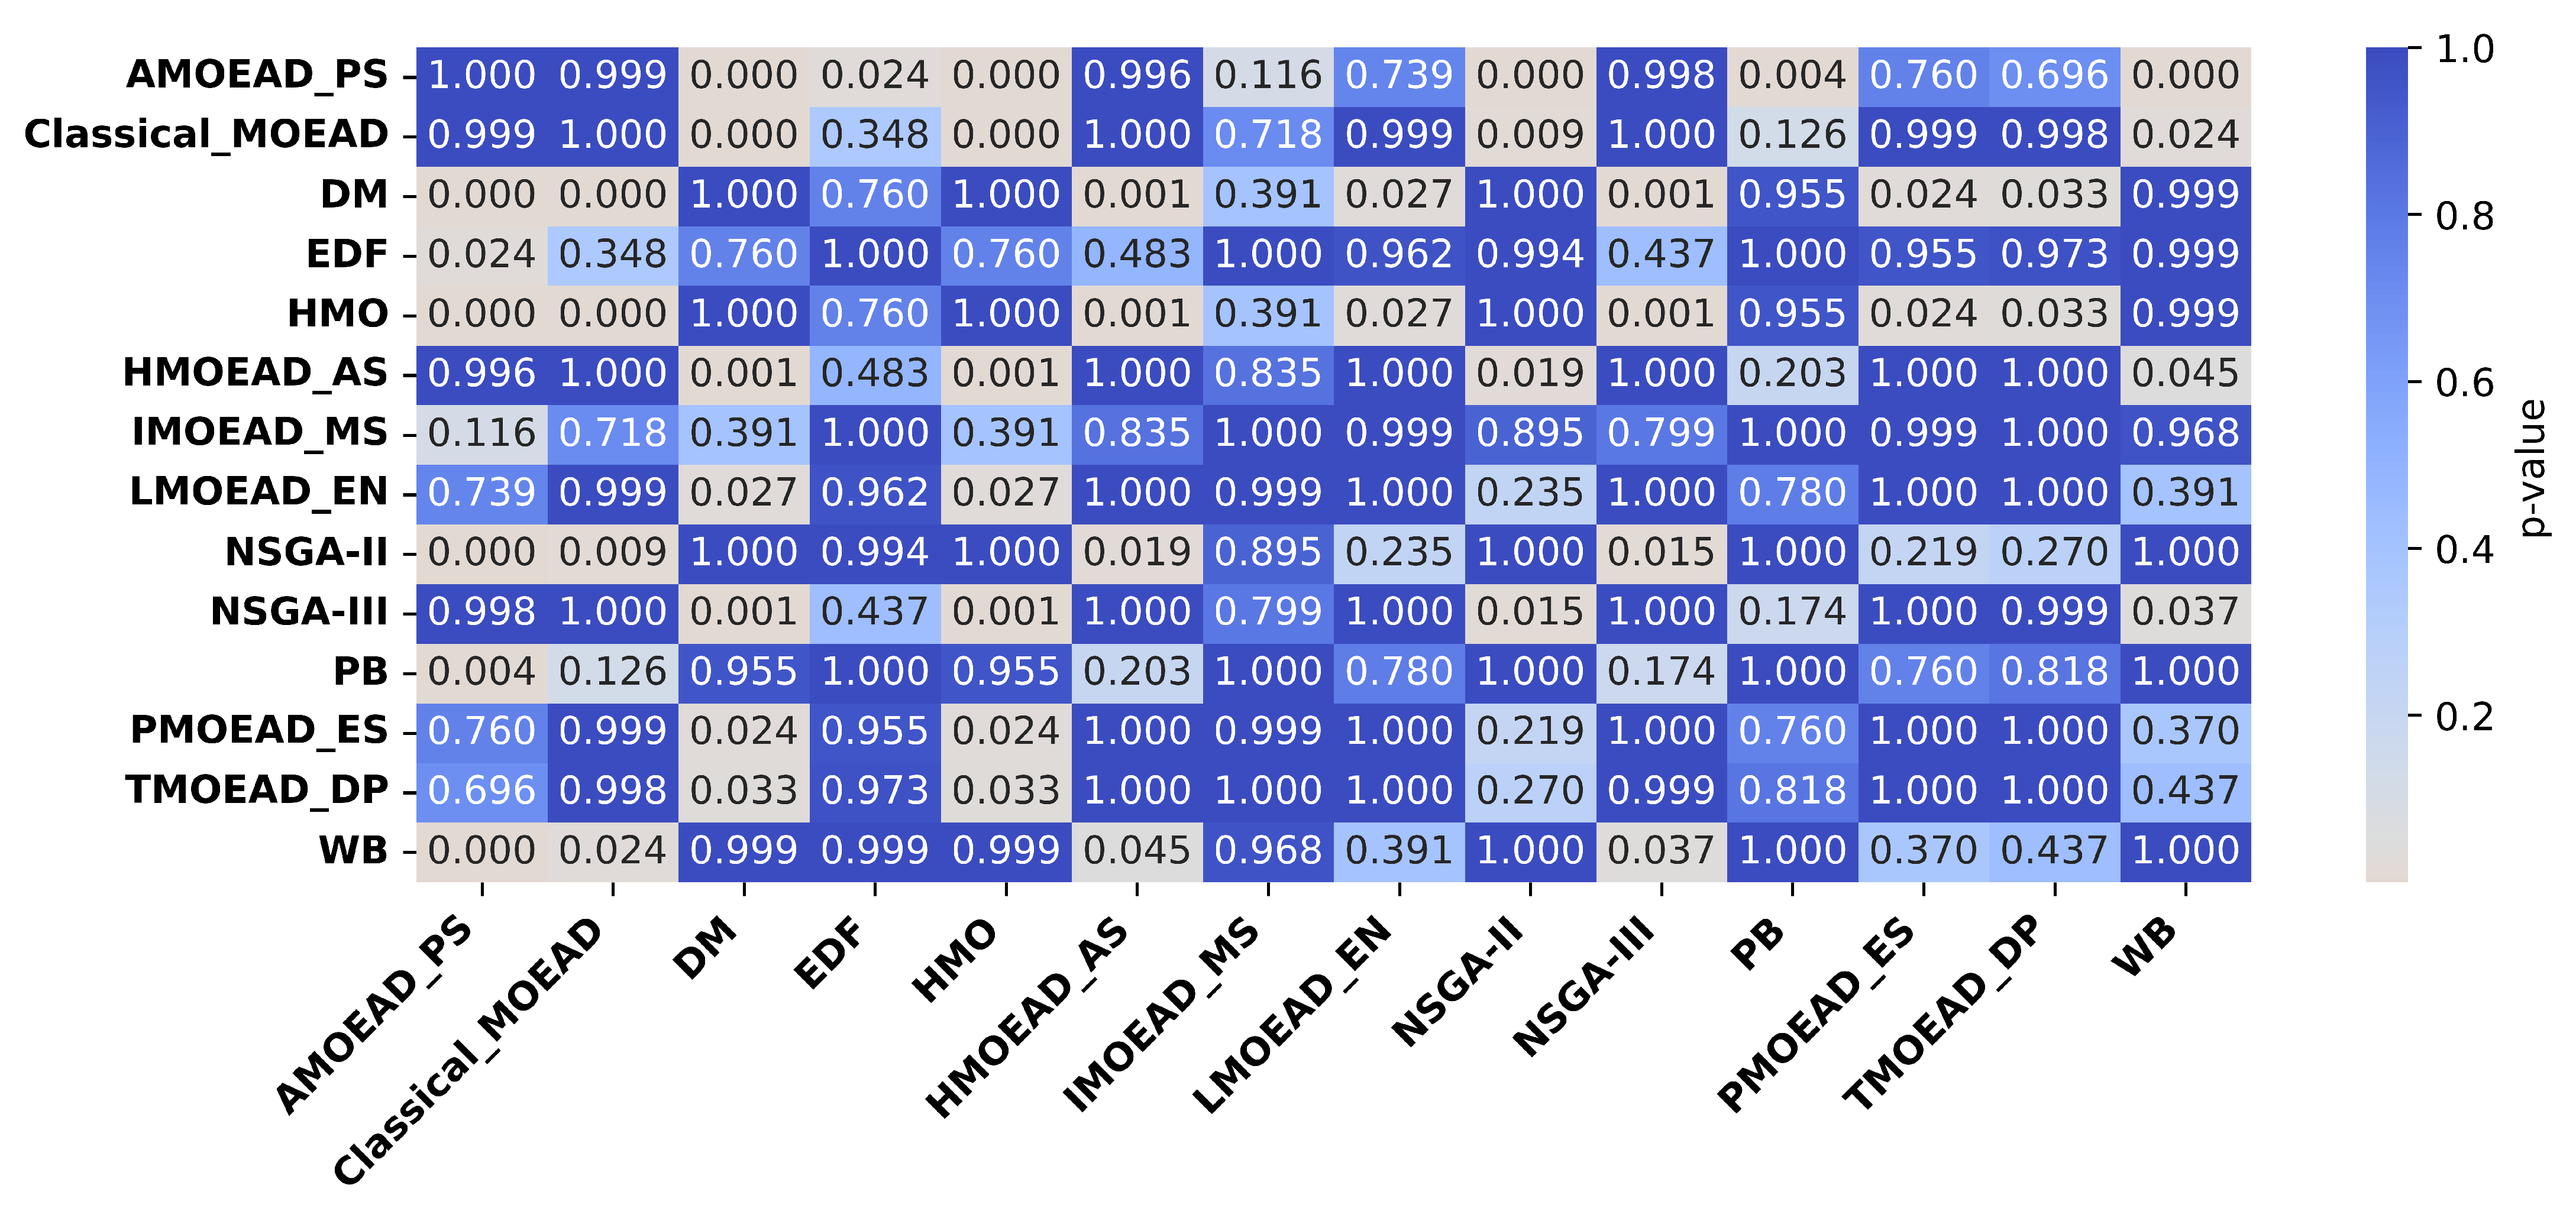
Each algorithm aimed to generate non-dominated schedules optimizing five scheduling objectives and two conflicting team formation objectives, reflecting real-world trade-offs in solar plant inspection/maintenance. Performance was evaluated using hypervolume, IGD, spacing, spreading, and objective-wise comparisons. Statistical significance was assessed via the Wilcoxon signed-rank test at a 95% confidence level, using mean and standard deviation from the 20 runs.
To ensure reproducibility and fairness, all algorithm parameters are provided in Table 4. Visualizations were generated using Matplotlib (3.10.0) and Seaborn (0.13.2), with statistical analysis via NumPy (2.3.2), SciPy (1.16.1), and scikit-posthocs (0.11.4).
It is important to note that while the current setup is limited to a single-core CPU, the proposed HMOO-AOS algorithm is fully compatible with multicore architectures and GPU-based execution. Future work will include experiments on multicore CPUs and GPU platforms to assess runtime scalability in realistic deployment environments.
The parameter settings are justified through the established multi-objective optimization literature and validated through preliminary experimental tuning. The population size of 200 follows standard MOEA recommendations, where NSGA-II requires populations larger than the Pareto front for complete exploration [102], while MOEA/D maintains efficiency with large populations, unlike other EMO algorithms [103]. The mutation rate of 0.1 and crossover rate of 0.9 represent validated baseline values providing optimal exploration-exploitation balance, with high crossover ensuring genetic material mixing and sufficient mutation maintaining population diversity [102,104,105]. These values were confirmed through preliminary experiments testing population sizes (100–500), mutation rates (0.05–0.2), and generation limits (50–300) across 30 independent runs per configuration, evaluated using hypervolume indicator, convergence rate, and computational time to balance accuracy with efficiency. Generation limits of 100 for job scheduling and 200 for team formation reflect domain-specific convergence requirements determined through preliminary analysis, with team formation’s combinatorial complexity requiring extended search periods compared to job scheduling problems that reached satisfactory Pareto approximation faster. Algorithm-specific parameters, including neighbor size (20), tournament size (2), and division numbers (5), follow widely validated configurations demonstrating consistent effectiveness across optimization landscapes [106,107,108].

4. Experimental Results

4.1. Performance Comparison of Job Scheduling Algorithms

4.1.1. Comparative Analysis of Multi-Objective Performance Indicators

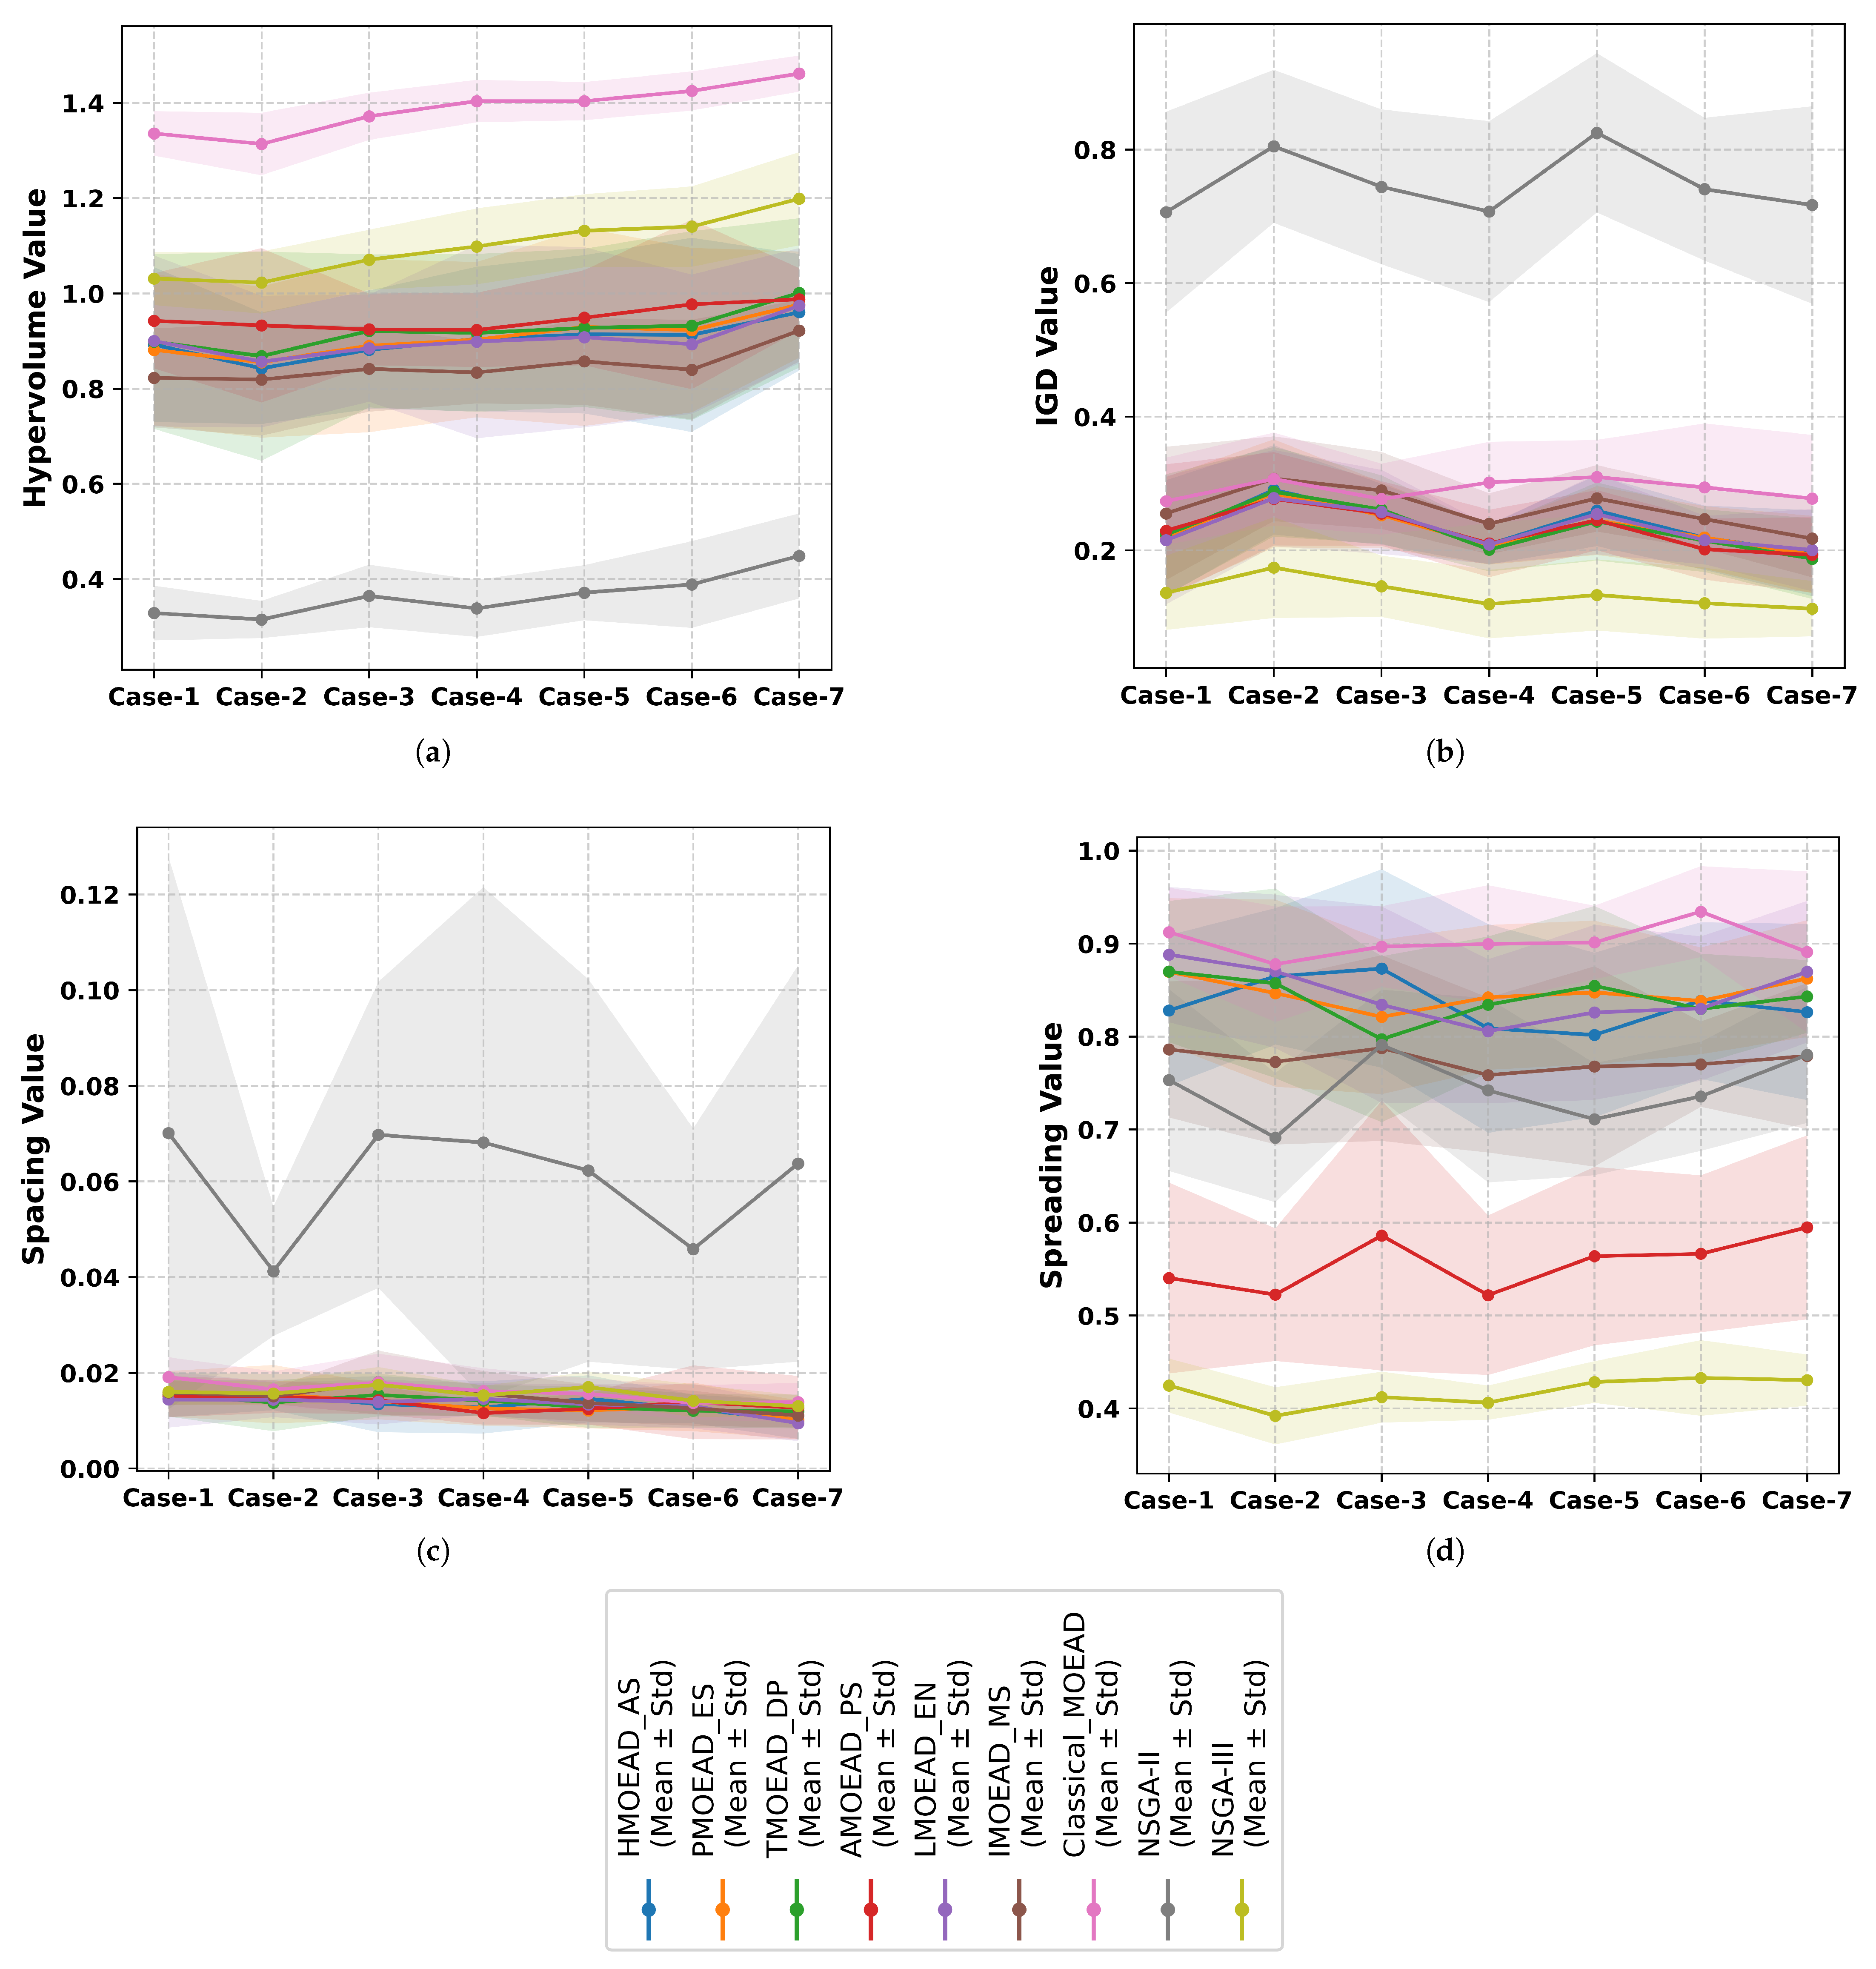
To evaluate the effectiveness of the implemented job scheduling algorithms, we employ a set of widely recognized performance metrics commonly used in multi-objective optimization: hypervolume (HV), inverted generational distance (IGD), spacing, and spreading. These indicators provide a comprehensive assessment of the quality of the obtained Pareto fronts in terms of both convergence to the true Pareto-optimal set and diversity of solutions. Collectively, these metrics offer complementary perspectives on algorithmic performance, enabling rigorous comparisons across different optimization methods and problem instances. The four normalized performance metrics across the evaluated algorithms are illustrated in Figure 2.
Overall, the Classical MOEA/D consistently demonstrates superior performance across all evaluated metrics, attaining the highest normalized hypervolume (HV) and spread values while maintaining competitive inverted generational distance (IGD) and spacing scores. This indicates both strong convergence toward the Pareto front and broad diversity in the obtained solutions. Most MOEA/D variants also exhibit robust performance, with minor variations contingent upon the specific test cases. In contrast, NSGA-II and NSGA-III generally underperform: NSGA-II displays suboptimal convergence and uneven spacing, whereas NSGA-III achieves reasonable convergence but suffers from limited diversity. The AMOEAD PS variant attains competitive HV values but exhibits inconsistent spread, while other variants, including LMOEAD EN and TMOEAD DP, provide balanced performance yet do not achieve best-in-class results.
Hypervolume (HV) quantifies the volume of objective space dominated by the obtained Pareto front, where higher normalized values signify superior convergence and comprehensive coverage of the solution space. In Figure 2a, Classical MOEA/D demonstrates consistent excellence with normalized HV values ranging from 1.3 to 1.47 across test cases, establishing its dominance in overall performance. Conversely, NSGA-II and NSGA-III exhibit suboptimal performance with normalized values below 0.5, indicating limited solution space coverage.
Inverted generational distance (IGD) assesses the proximity of obtained solutions to the true Pareto front, with lower normalized values indicating enhanced convergence quality. The majority of MOEA/D variants and contemporary algorithms maintain normalized IGD values within the 0.2–0.3 range, demonstrating satisfactory convergence characteristics. However, NSGA-II exhibits significantly elevated normalized IGD values (0.4–0.8), revealing substantial convergence deficiencies (Figure 2b).
Spacing evaluates the uniformity of solution distribution along the Pareto front, where reduced normalized values correspond to more homogeneous solution spacing. In Figure 2c, NSGA-II demonstrates critically poor normalized spacing metrics (0.04–0.07) accompanied by high variance, while all remaining algorithms achieve consistently low normalized spacing values (0.01–0.02), indicating uniform solution distributions.
Spreading measures the extent of front coverage, with elevated normalized values facilitating diverse trade-off options for decision-makers. Classical MOEA/D and several variants achieve optimal normalized spreading values (0.89–0.93), providing comprehensive solution diversity, whereas NSGA-III exhibits the most constrained normalized spreading performance (0.39–0.43) (Figure 2d). AMOEAD PS demonstrates inconsistent spreading behavior with substantial variability across test instances. The normalization methodology enables equitable comparison across all performance indicators and algorithmic implementations on a standardized scale.

4.1.2. Algorithm’s Solutions Quality Comparison

To complement the performance indicator-based assessment, a detailed comparison of solution quality is conducted by analyzing the actual objective values obtained from the non-dominated (Pareto-optimal) solution sets. This evaluation focuses on the practical trade-offs achieved among competing objectives such as total travel distance, tardiness, workload balance, and priority adherence across different algorithmic strategies.
Classical MOEA/D consistently outperforms competing approaches, demonstrating superior convergence characteristics (highest HV, lowest IGD) alongside strong diversity preservation (high spreading and uniform spacing). Most MOEA/D variants achieve comparably robust performance, whereas NSGA-II and NSGA-III exhibit notable deficiencies, NSGA-II in both convergence and distribution uniformity, and NSGA-III in solution diversity despite moderate convergence. AMOEAD PS attains high HV values but suffers from inconsistency in spreading, while other variants deliver balanced yet non-dominant results.
For each algorithm, representative Pareto fronts are visualized and compared to assess dominance relations, diversity, and convergence characteristics. Additionally, statistical summaries (e.g., minimum, maximum, and interquartile ranges of each objective) are presented to highlight variations in solution tendencies. This analysis provides actionable insight into how each algorithm navigates the complex objective space and balances conflicting goals in dynamic job scheduling scenarios.
Table 5 presents the results for the five formulated objectives. The table enables a nuanced understanding of trade-offs between conflicting objectives. Table 5 summarizes the performance outcomes over seven benchmark instances (Case 1 through Case 7), reporting the mean and standard deviation for each metric. This tabular format enables direct comparison of solution quality and diversity.
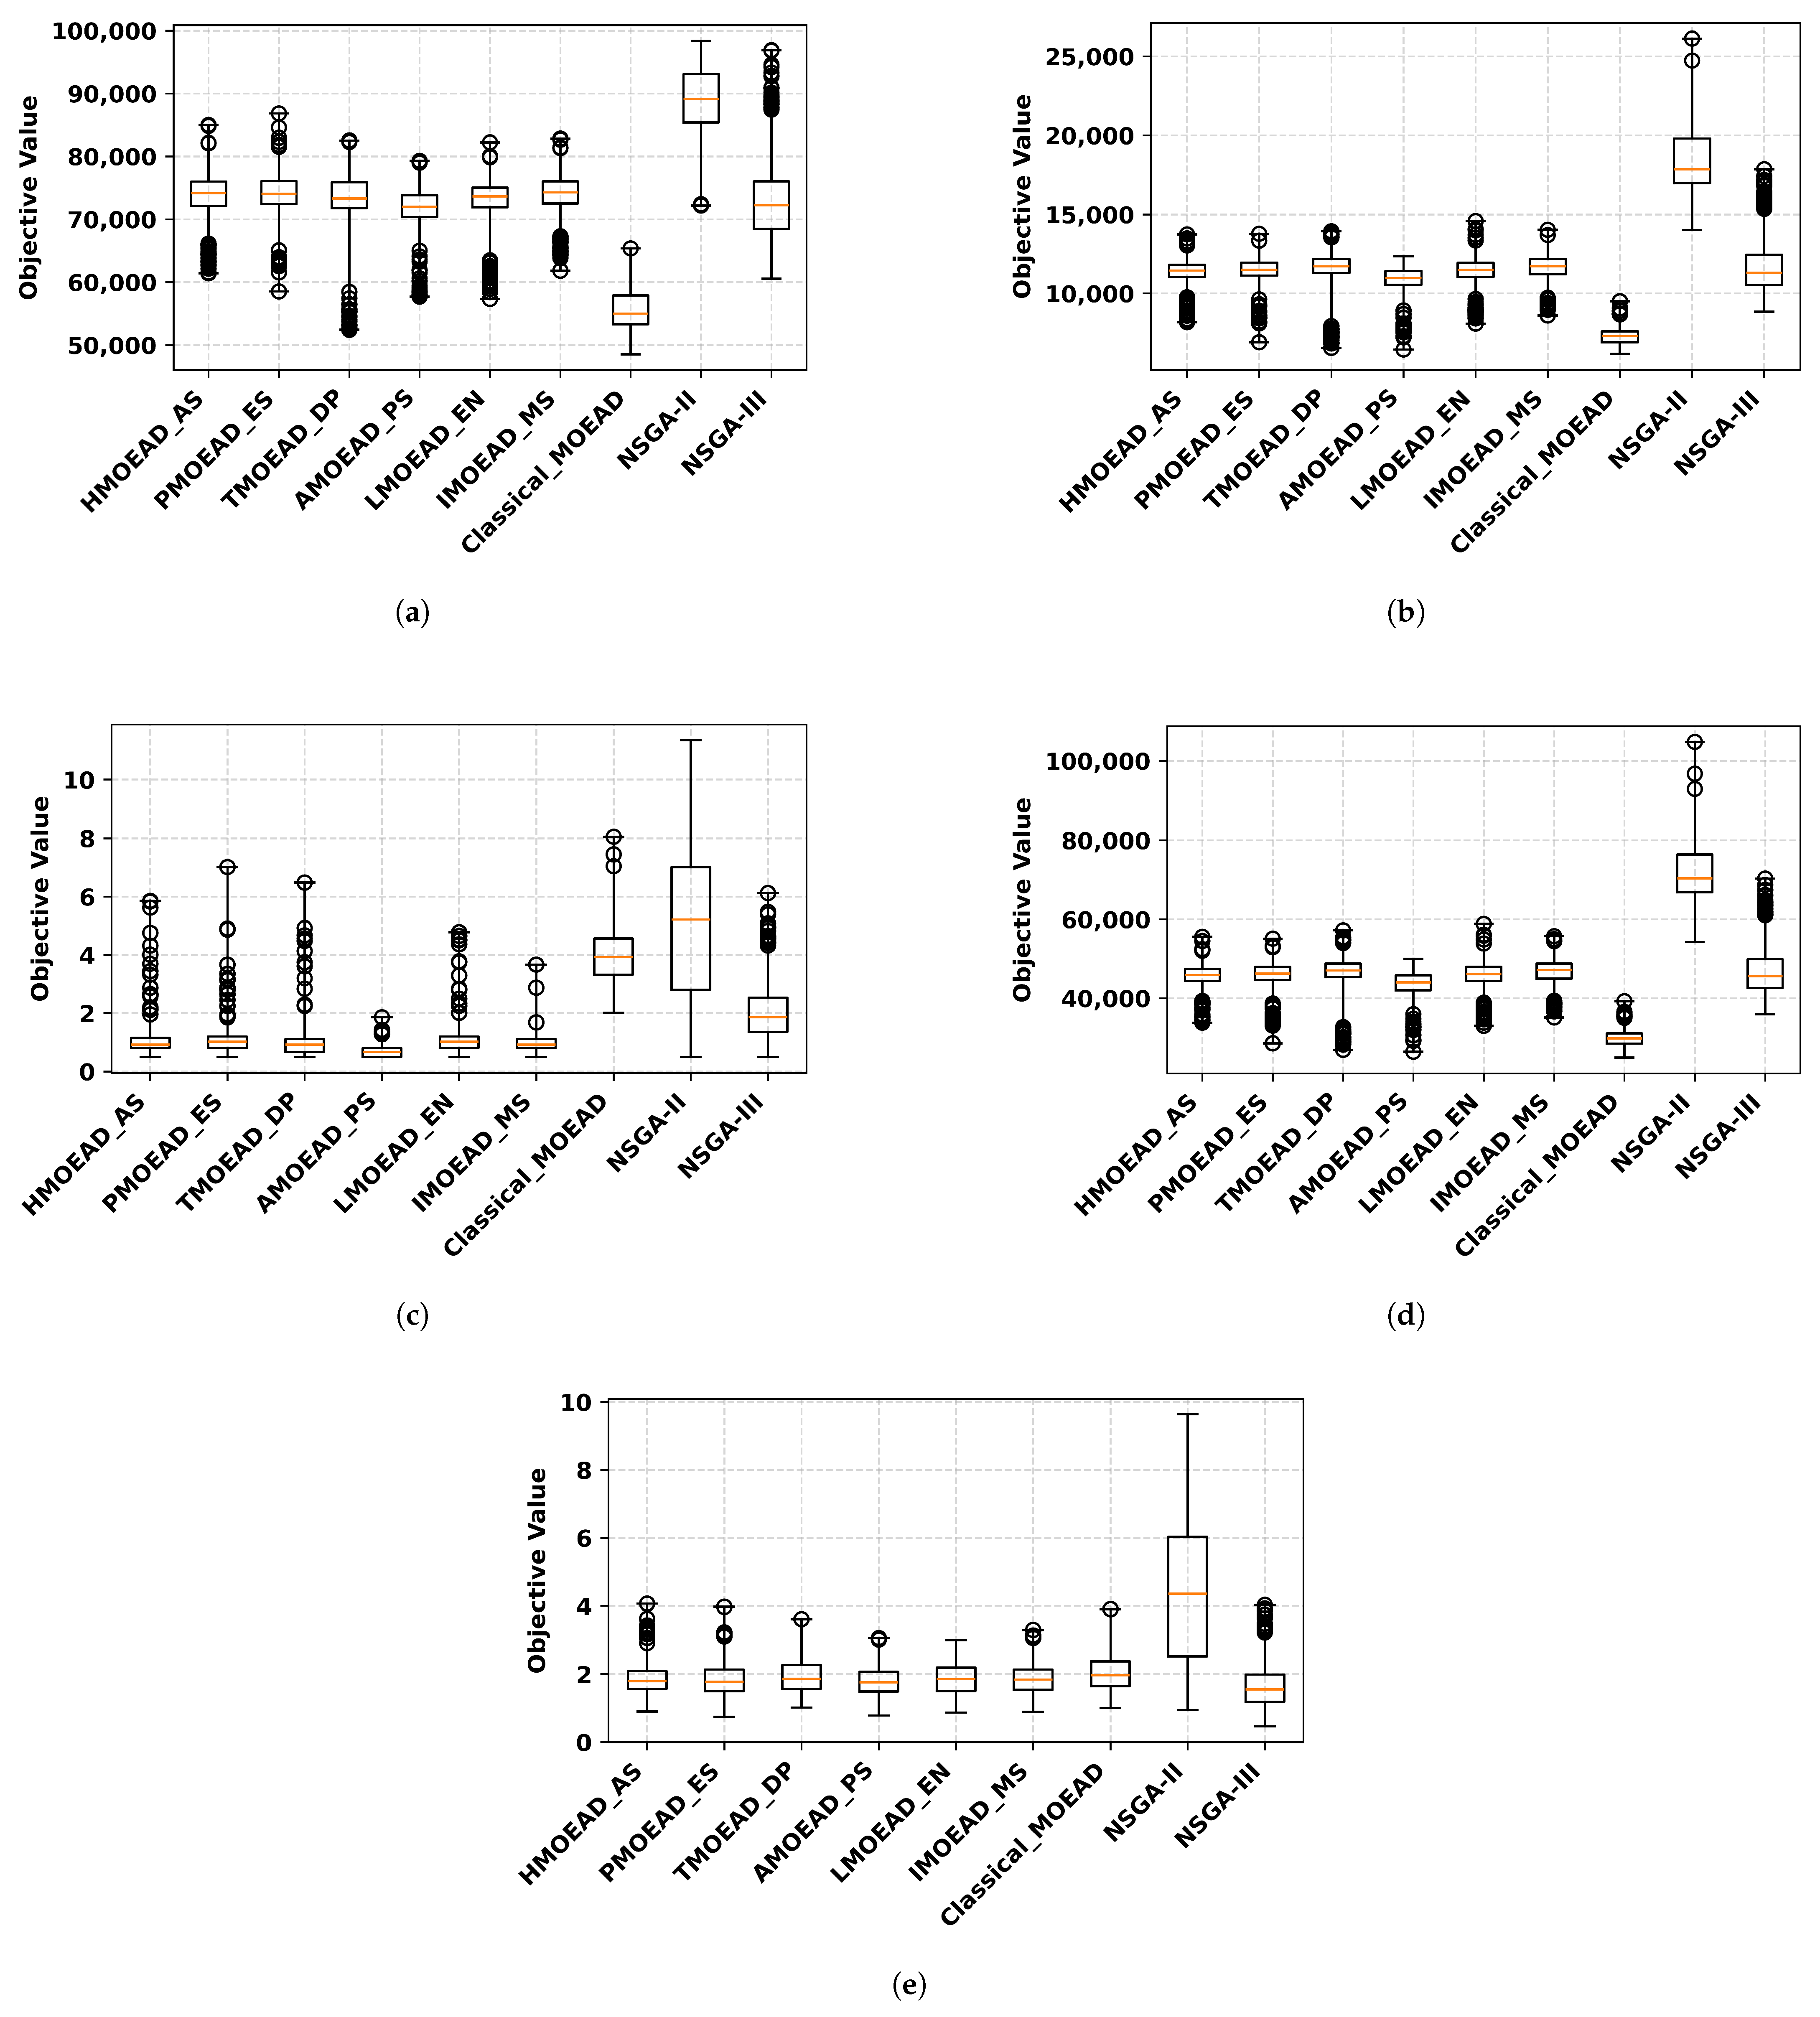
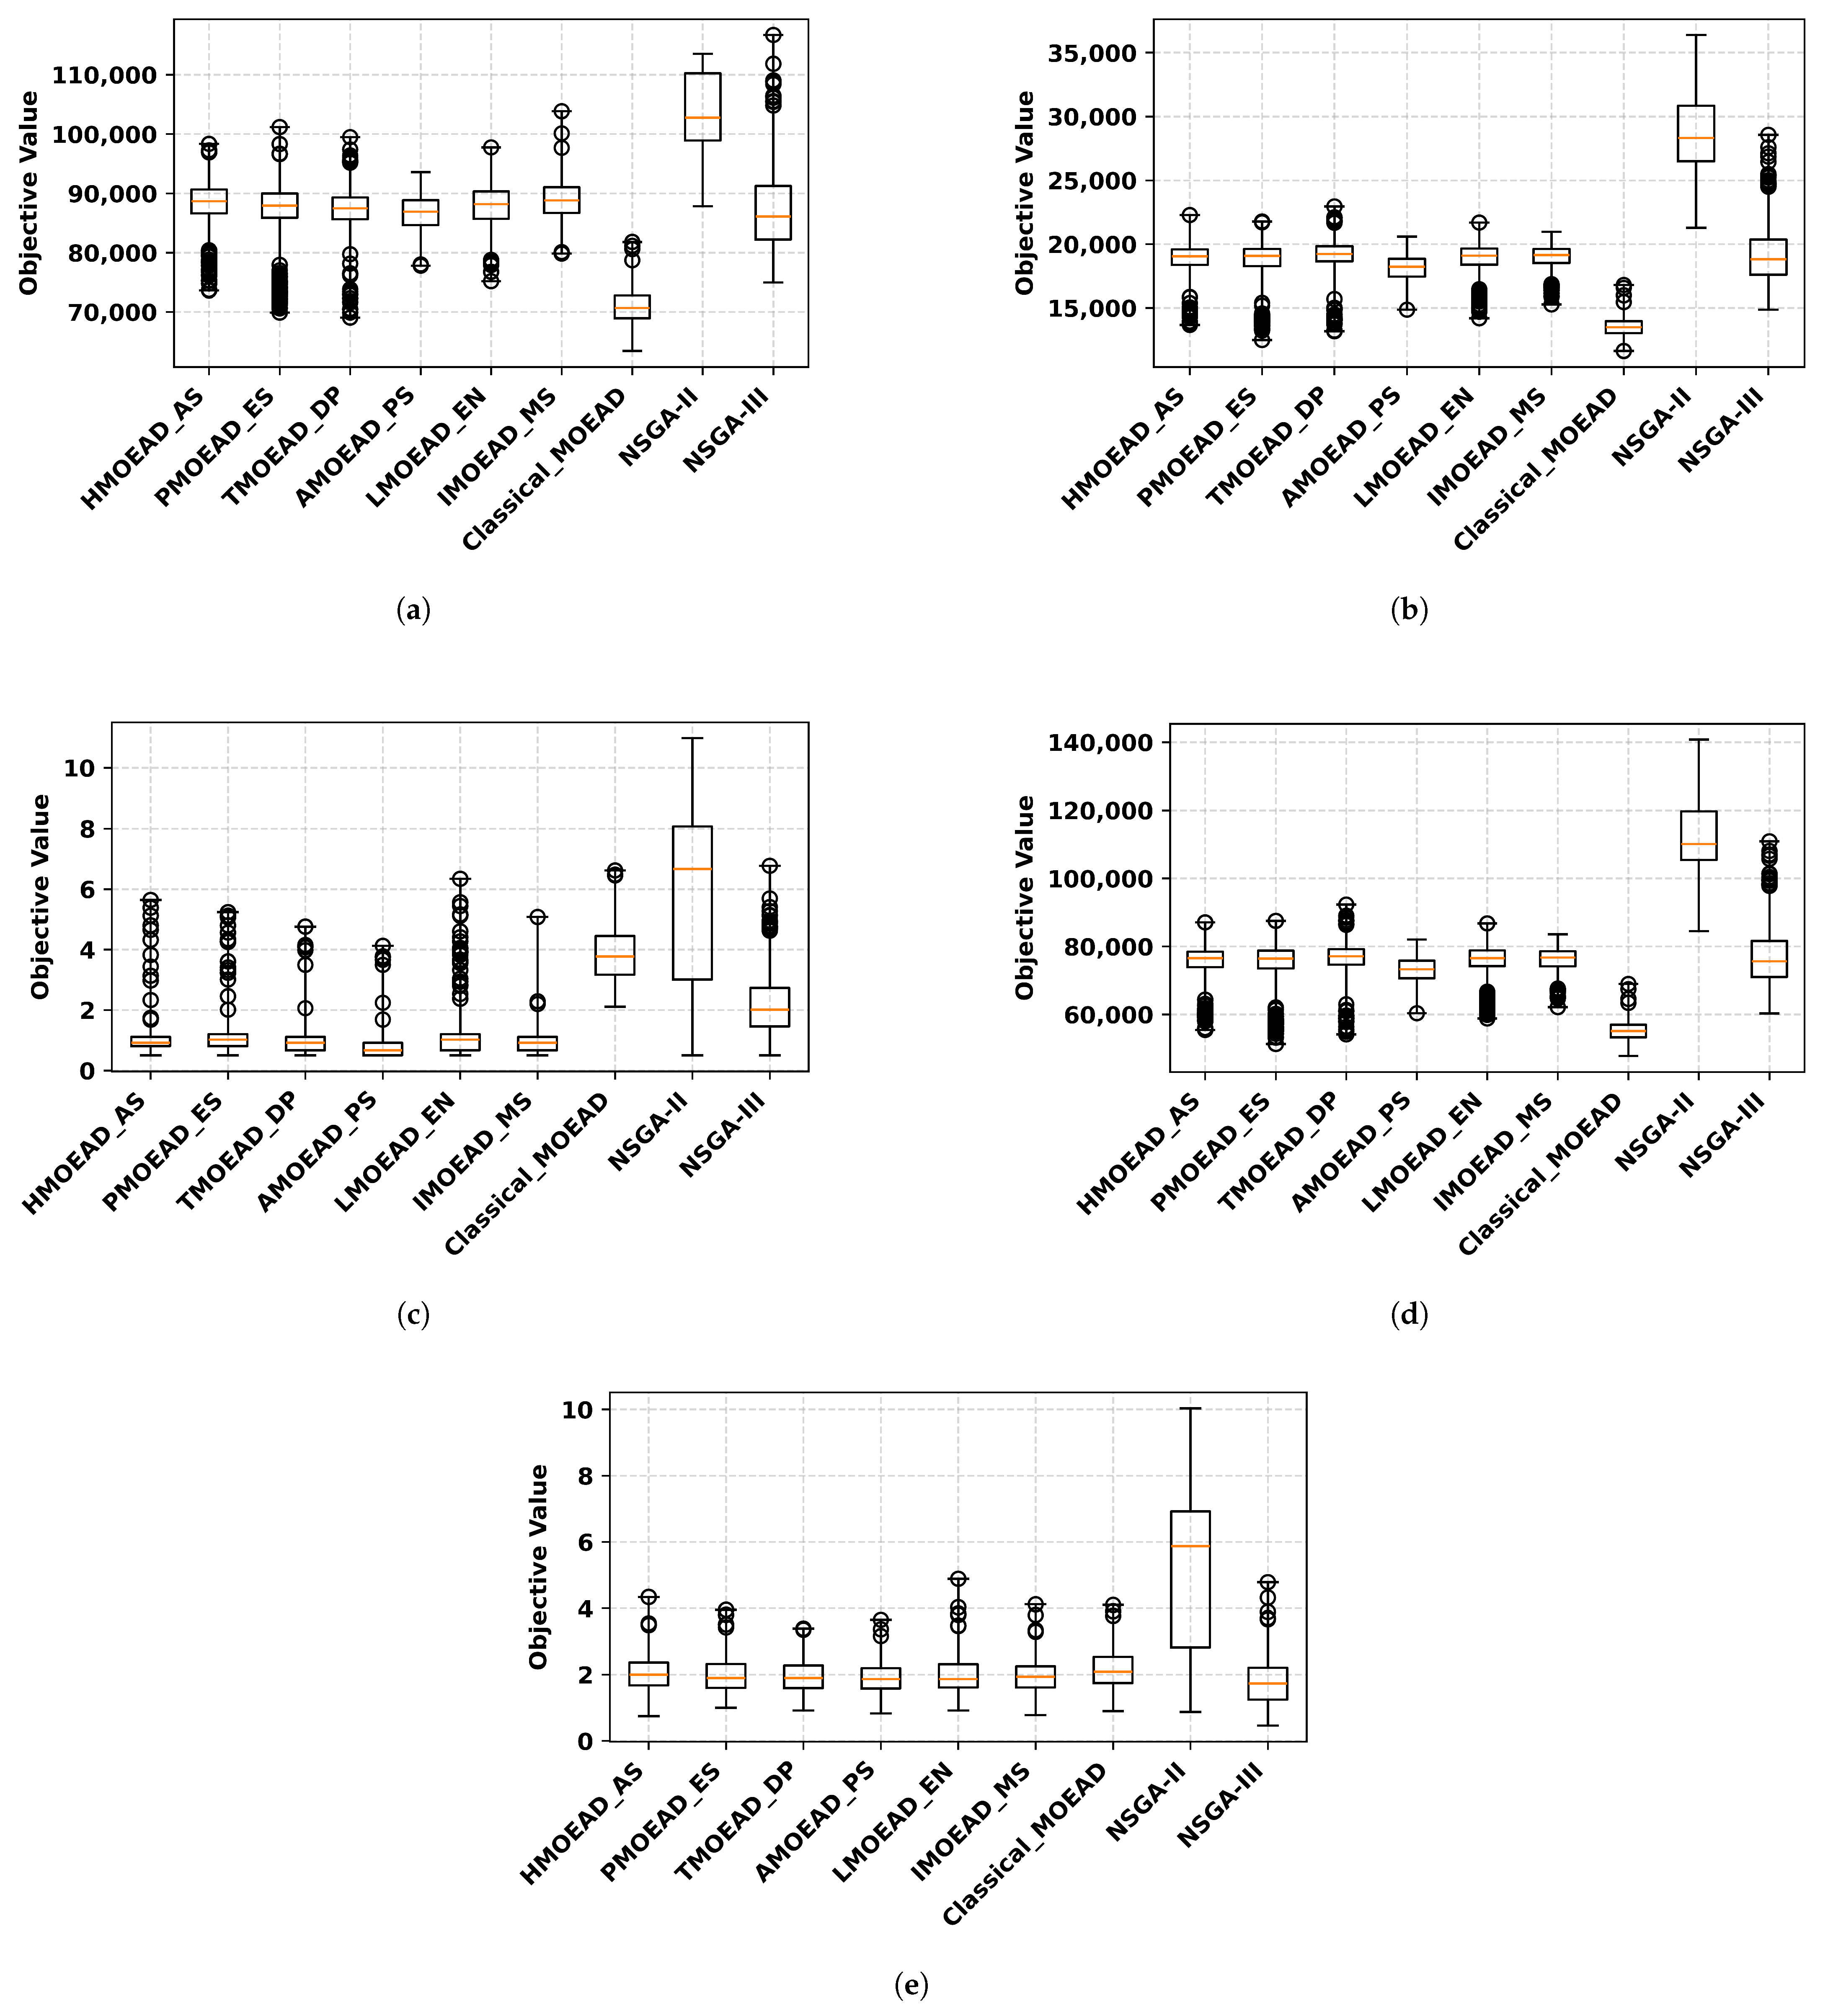
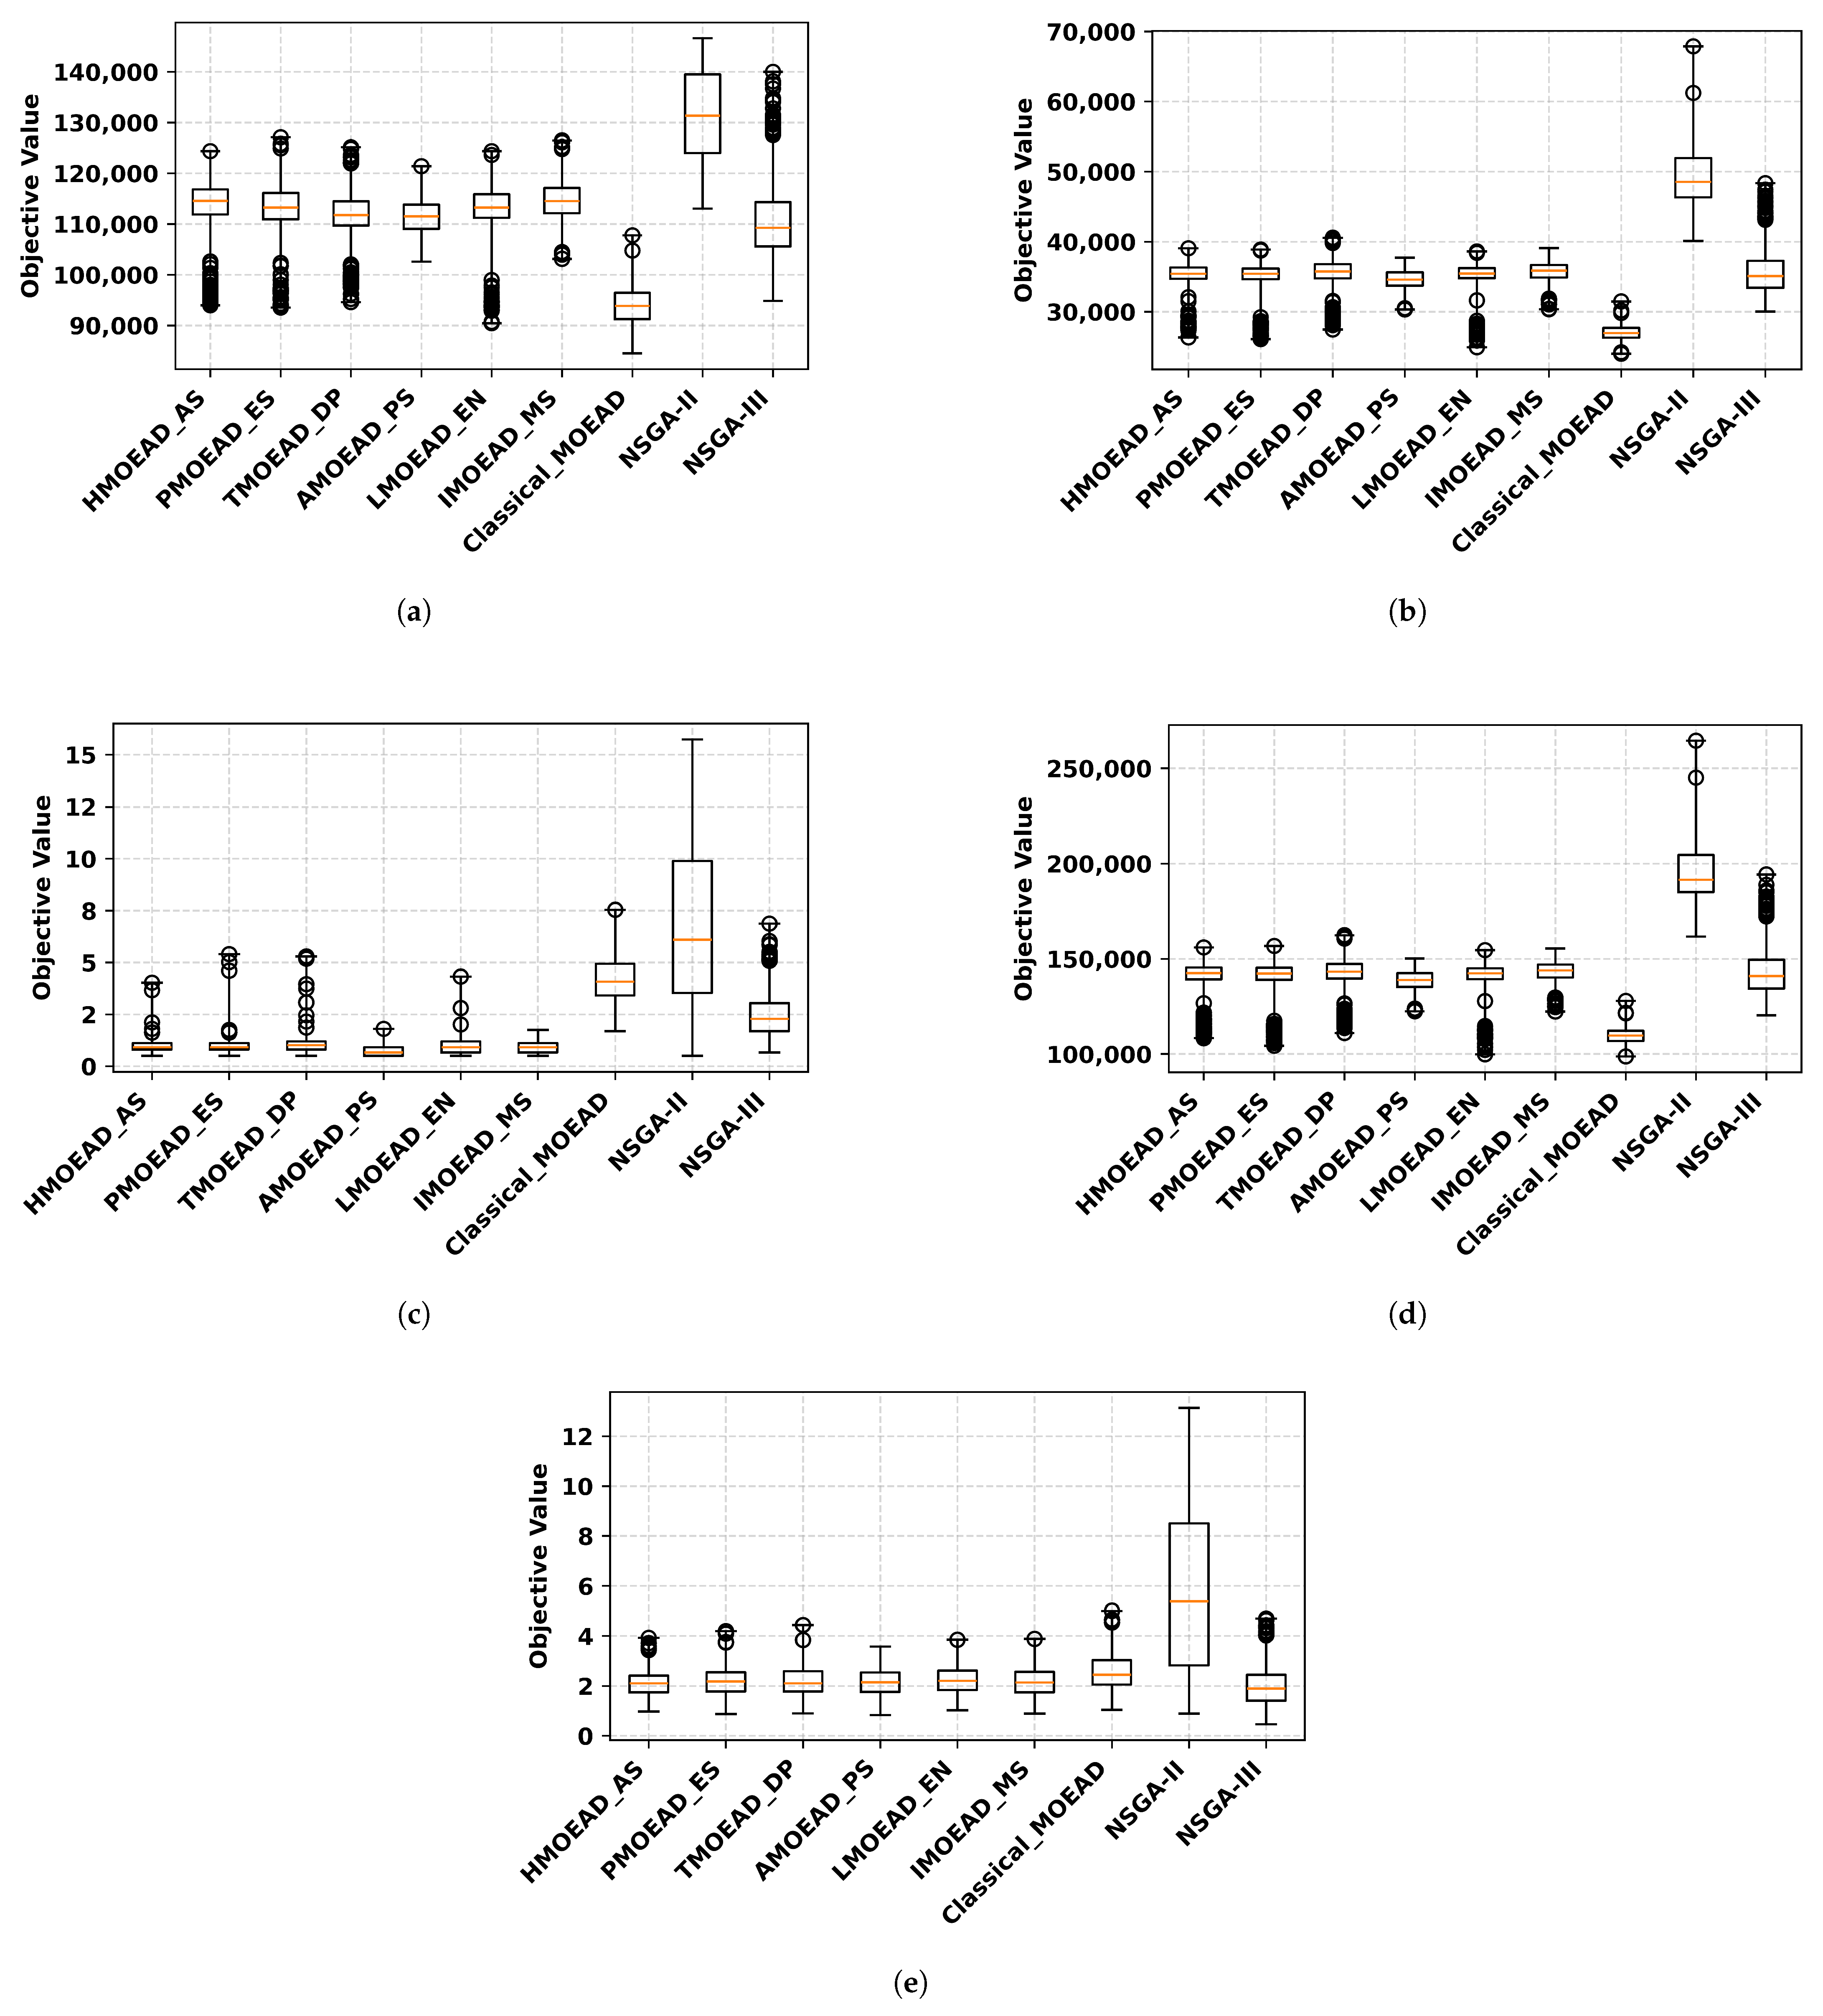
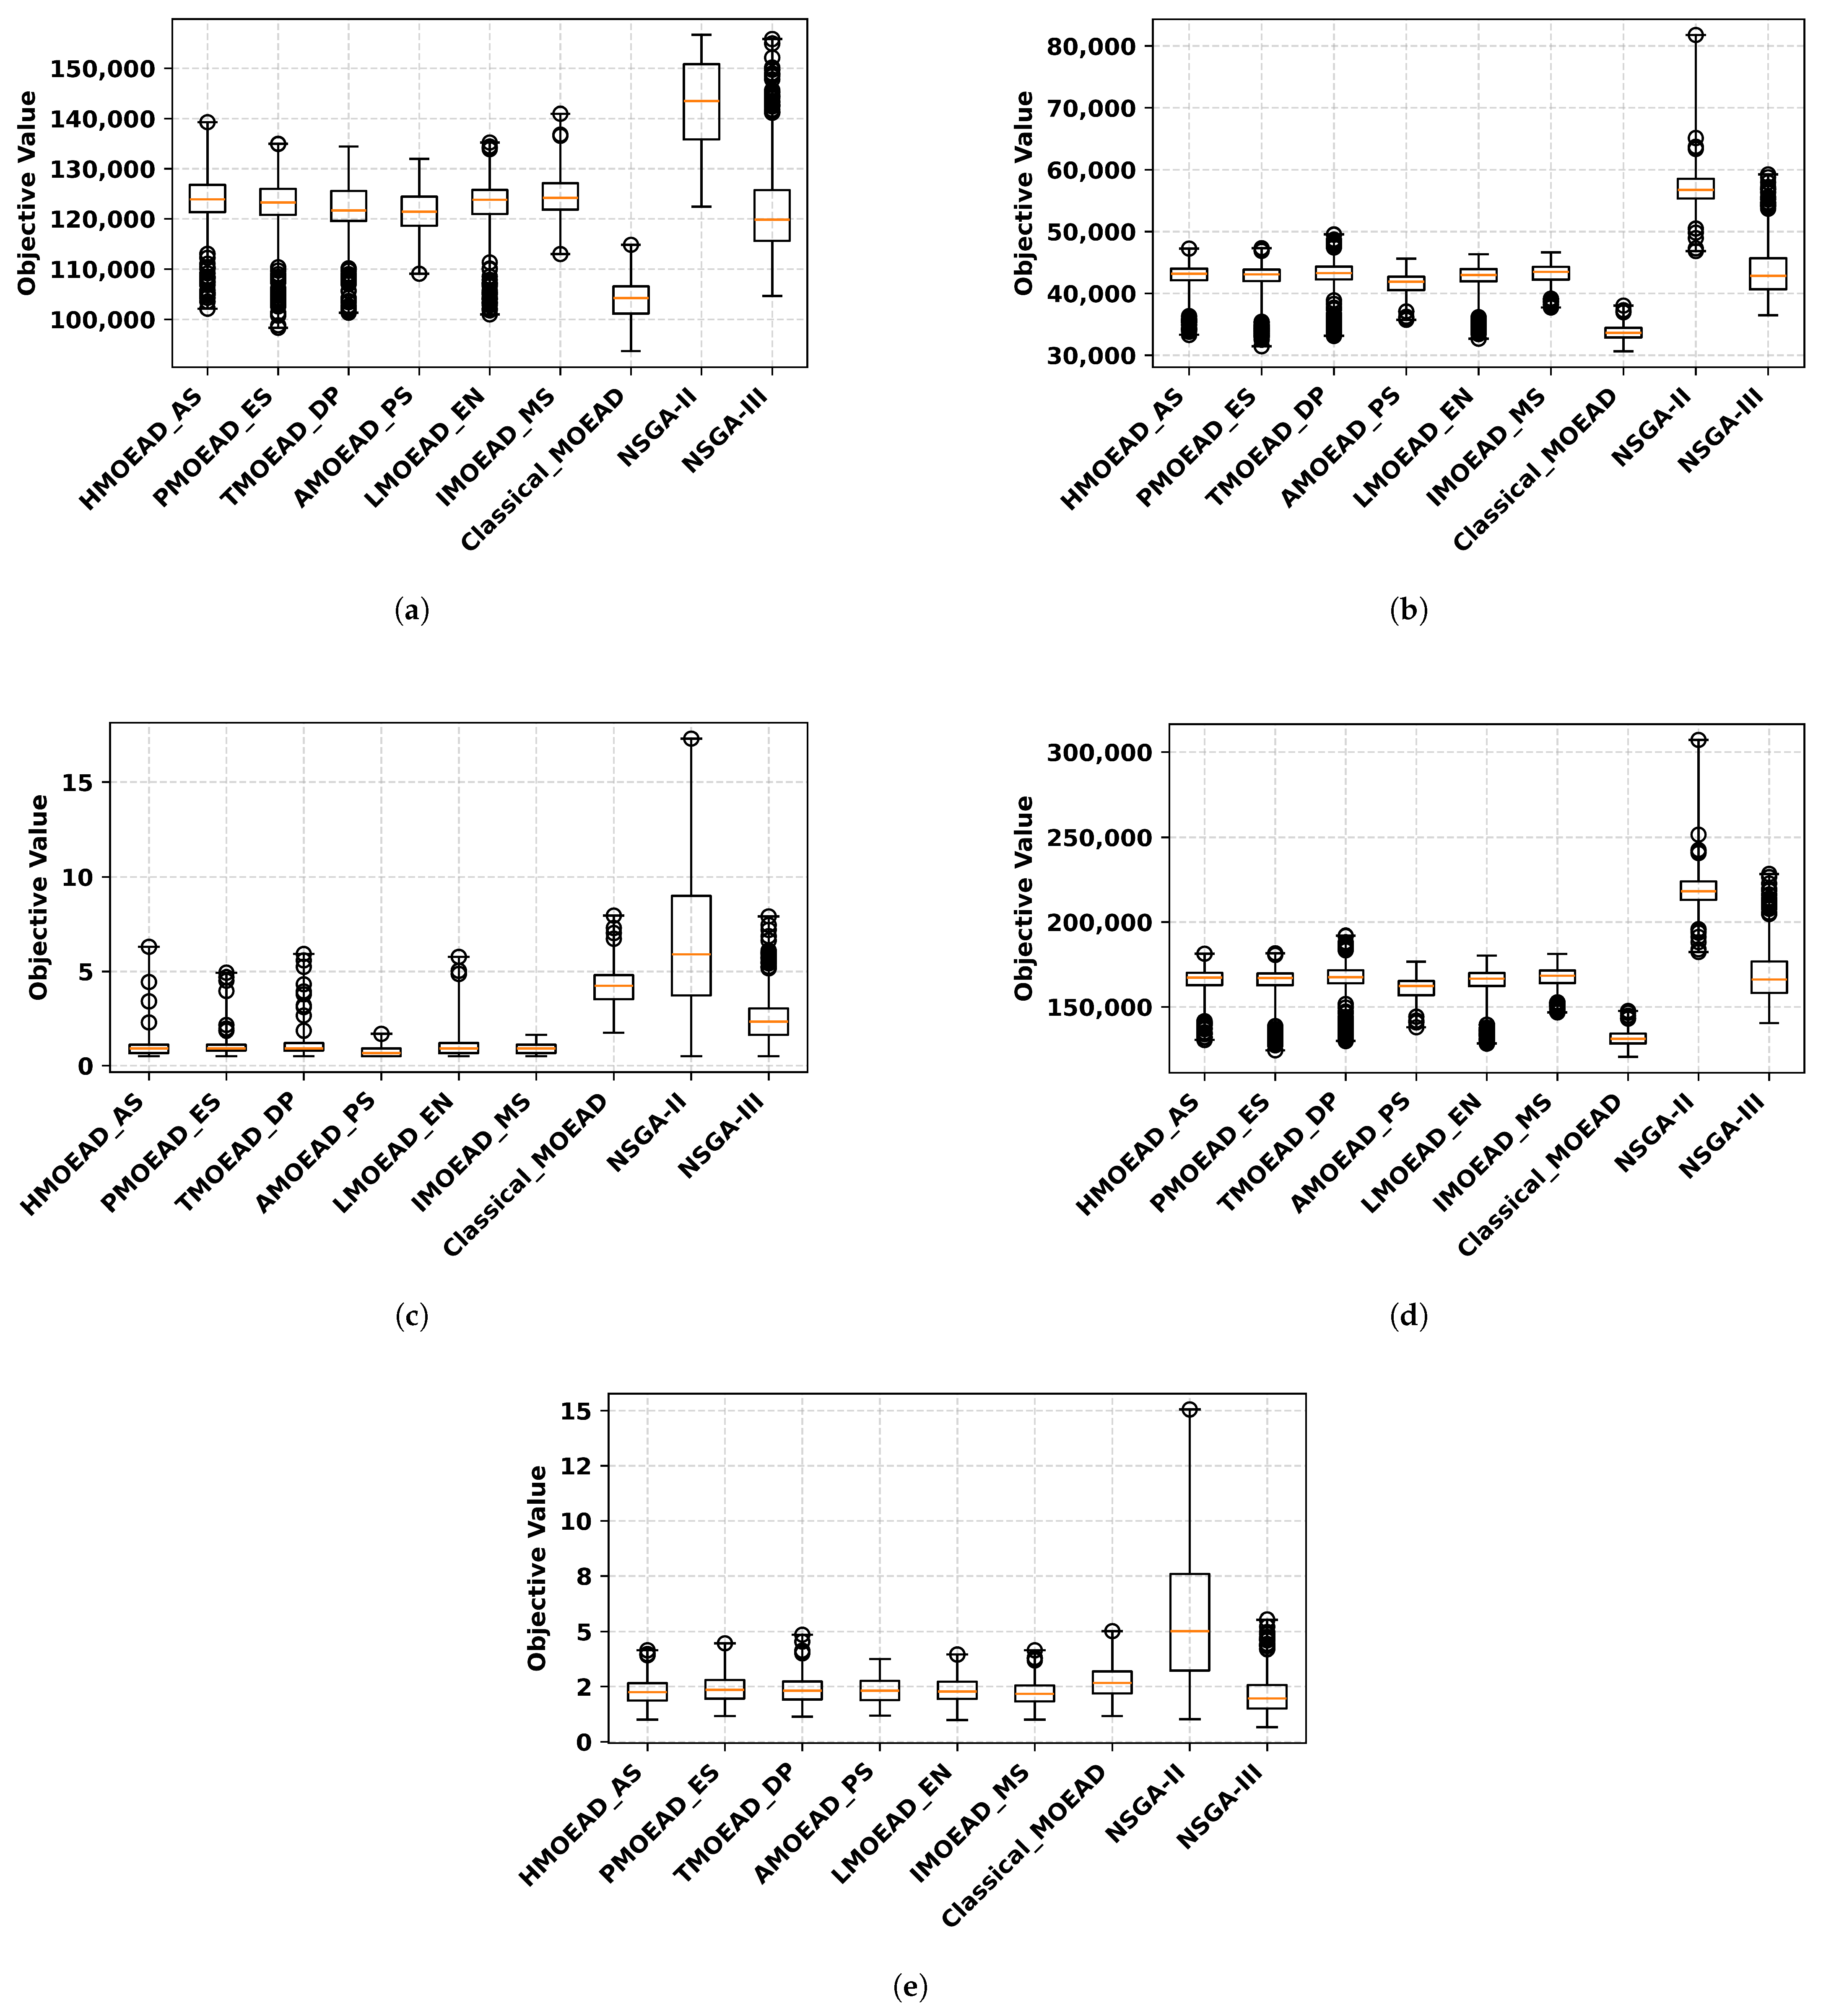
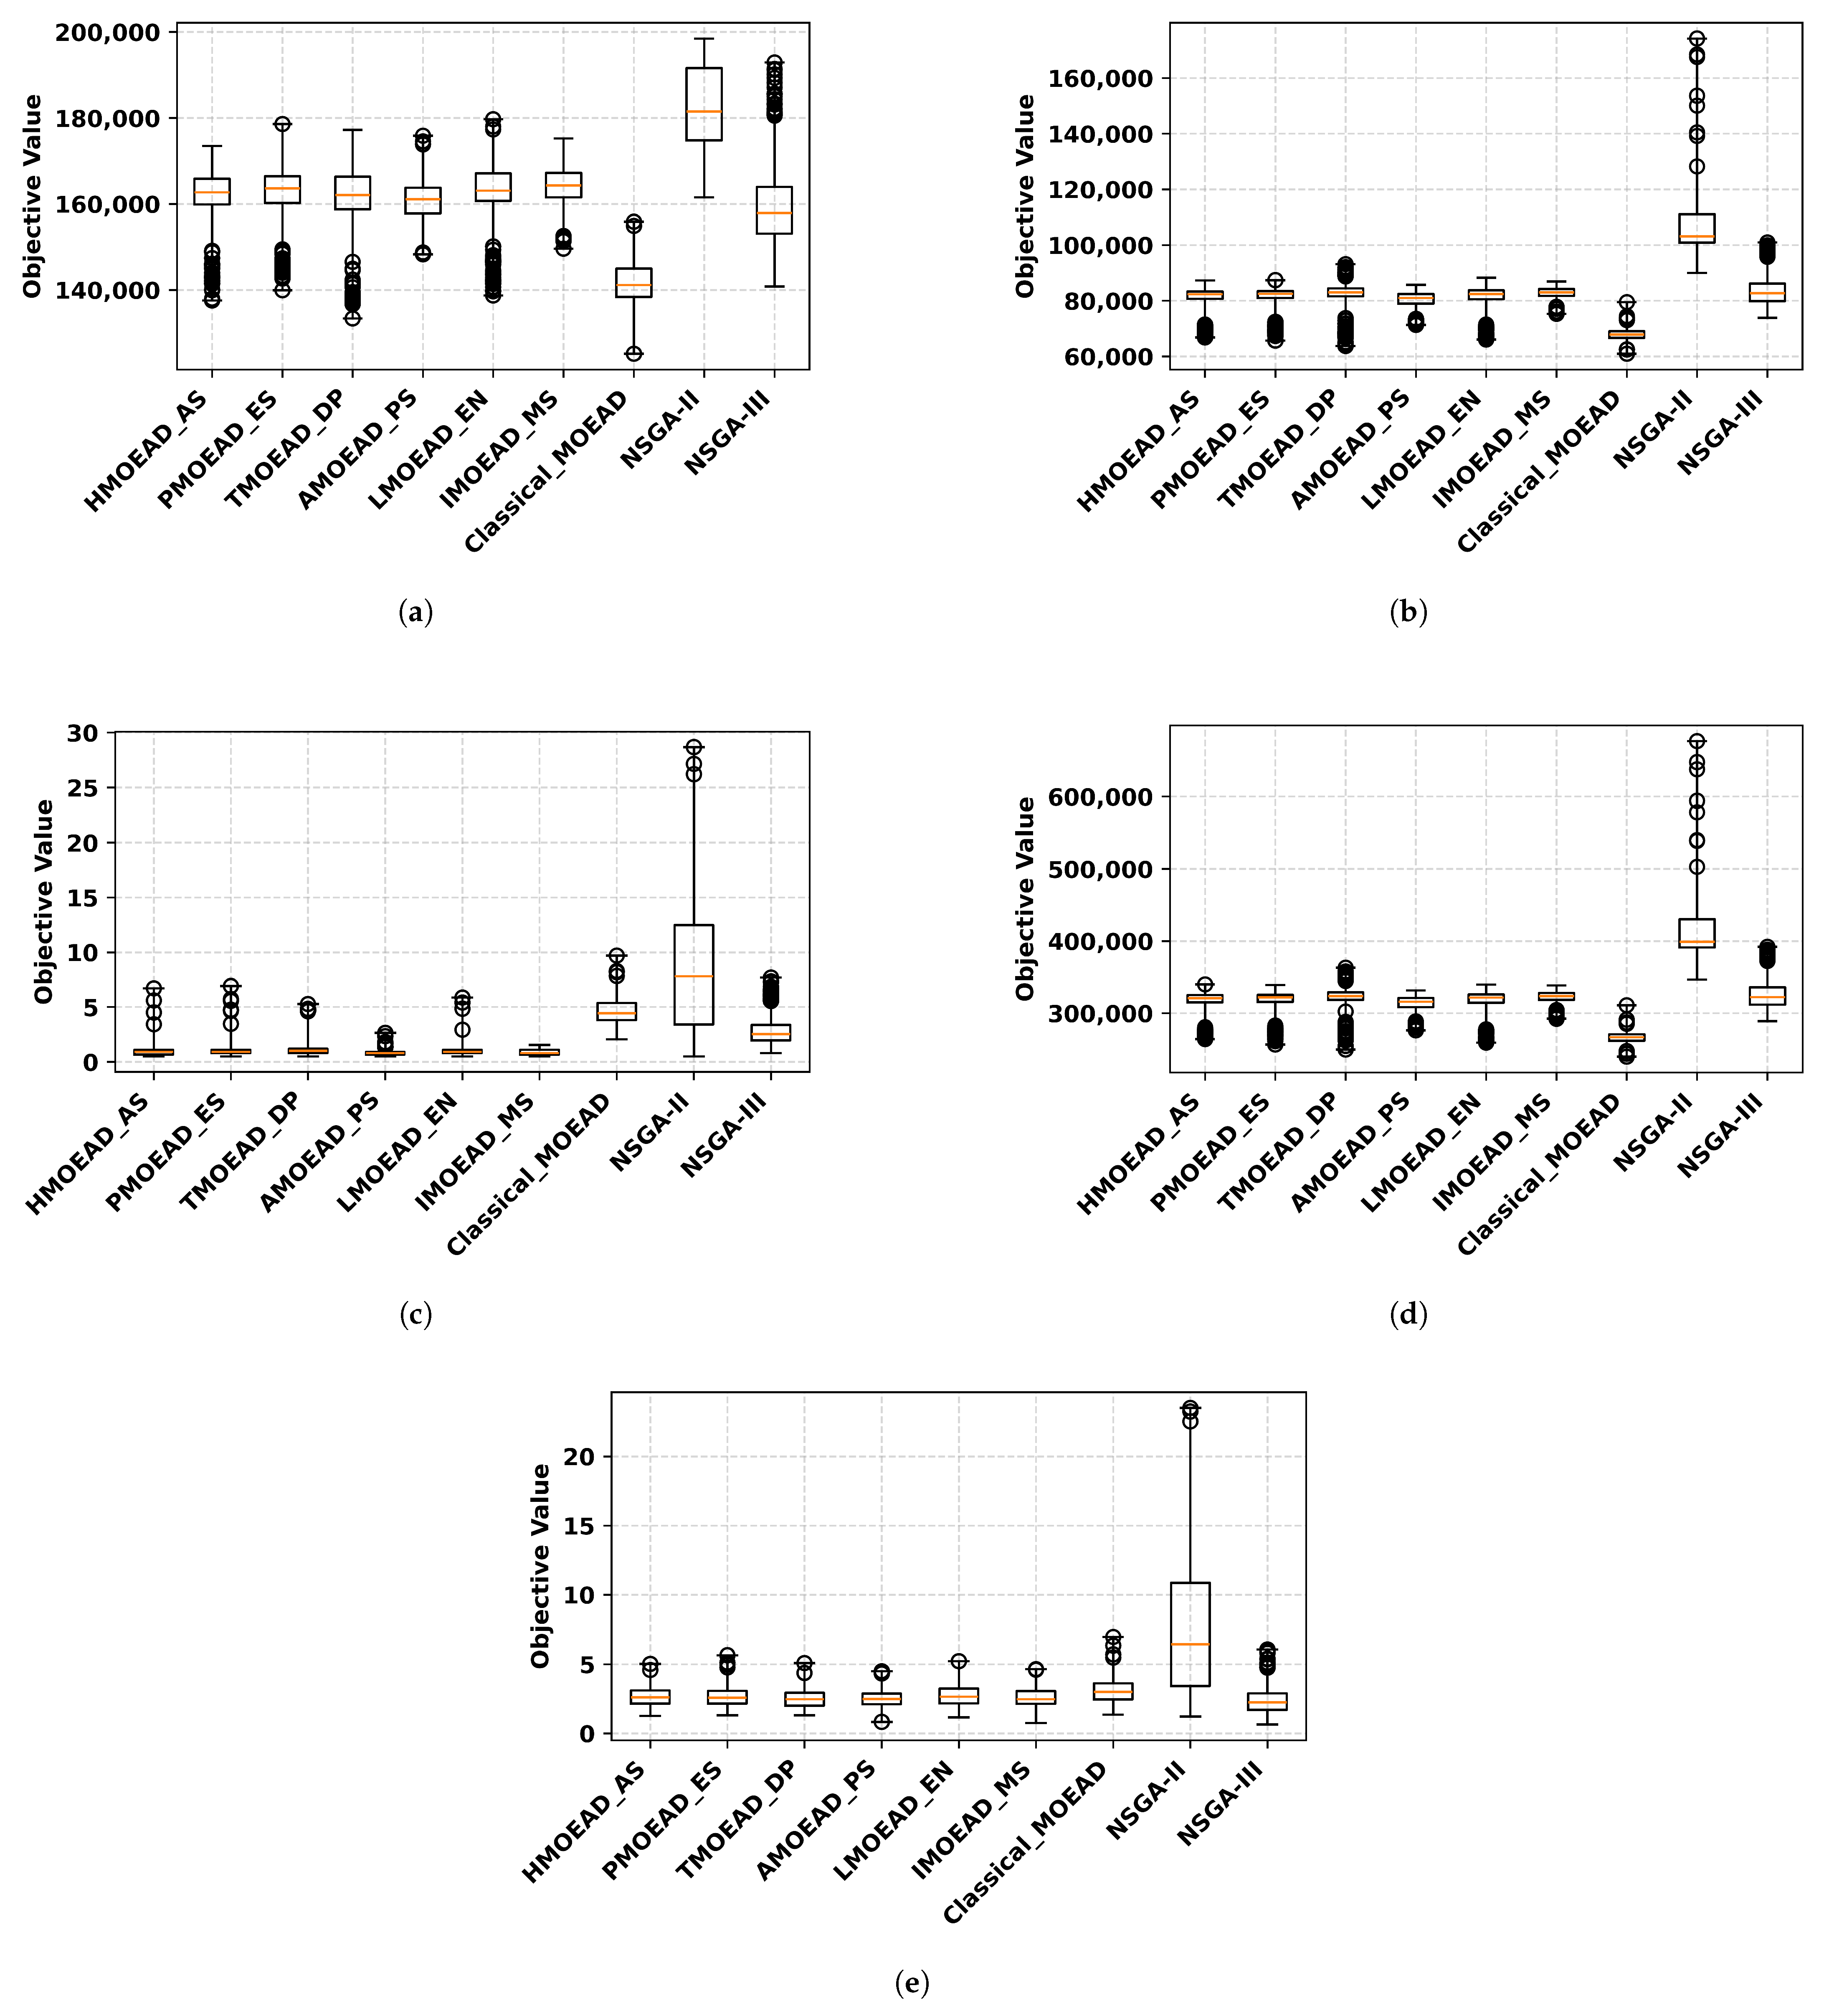
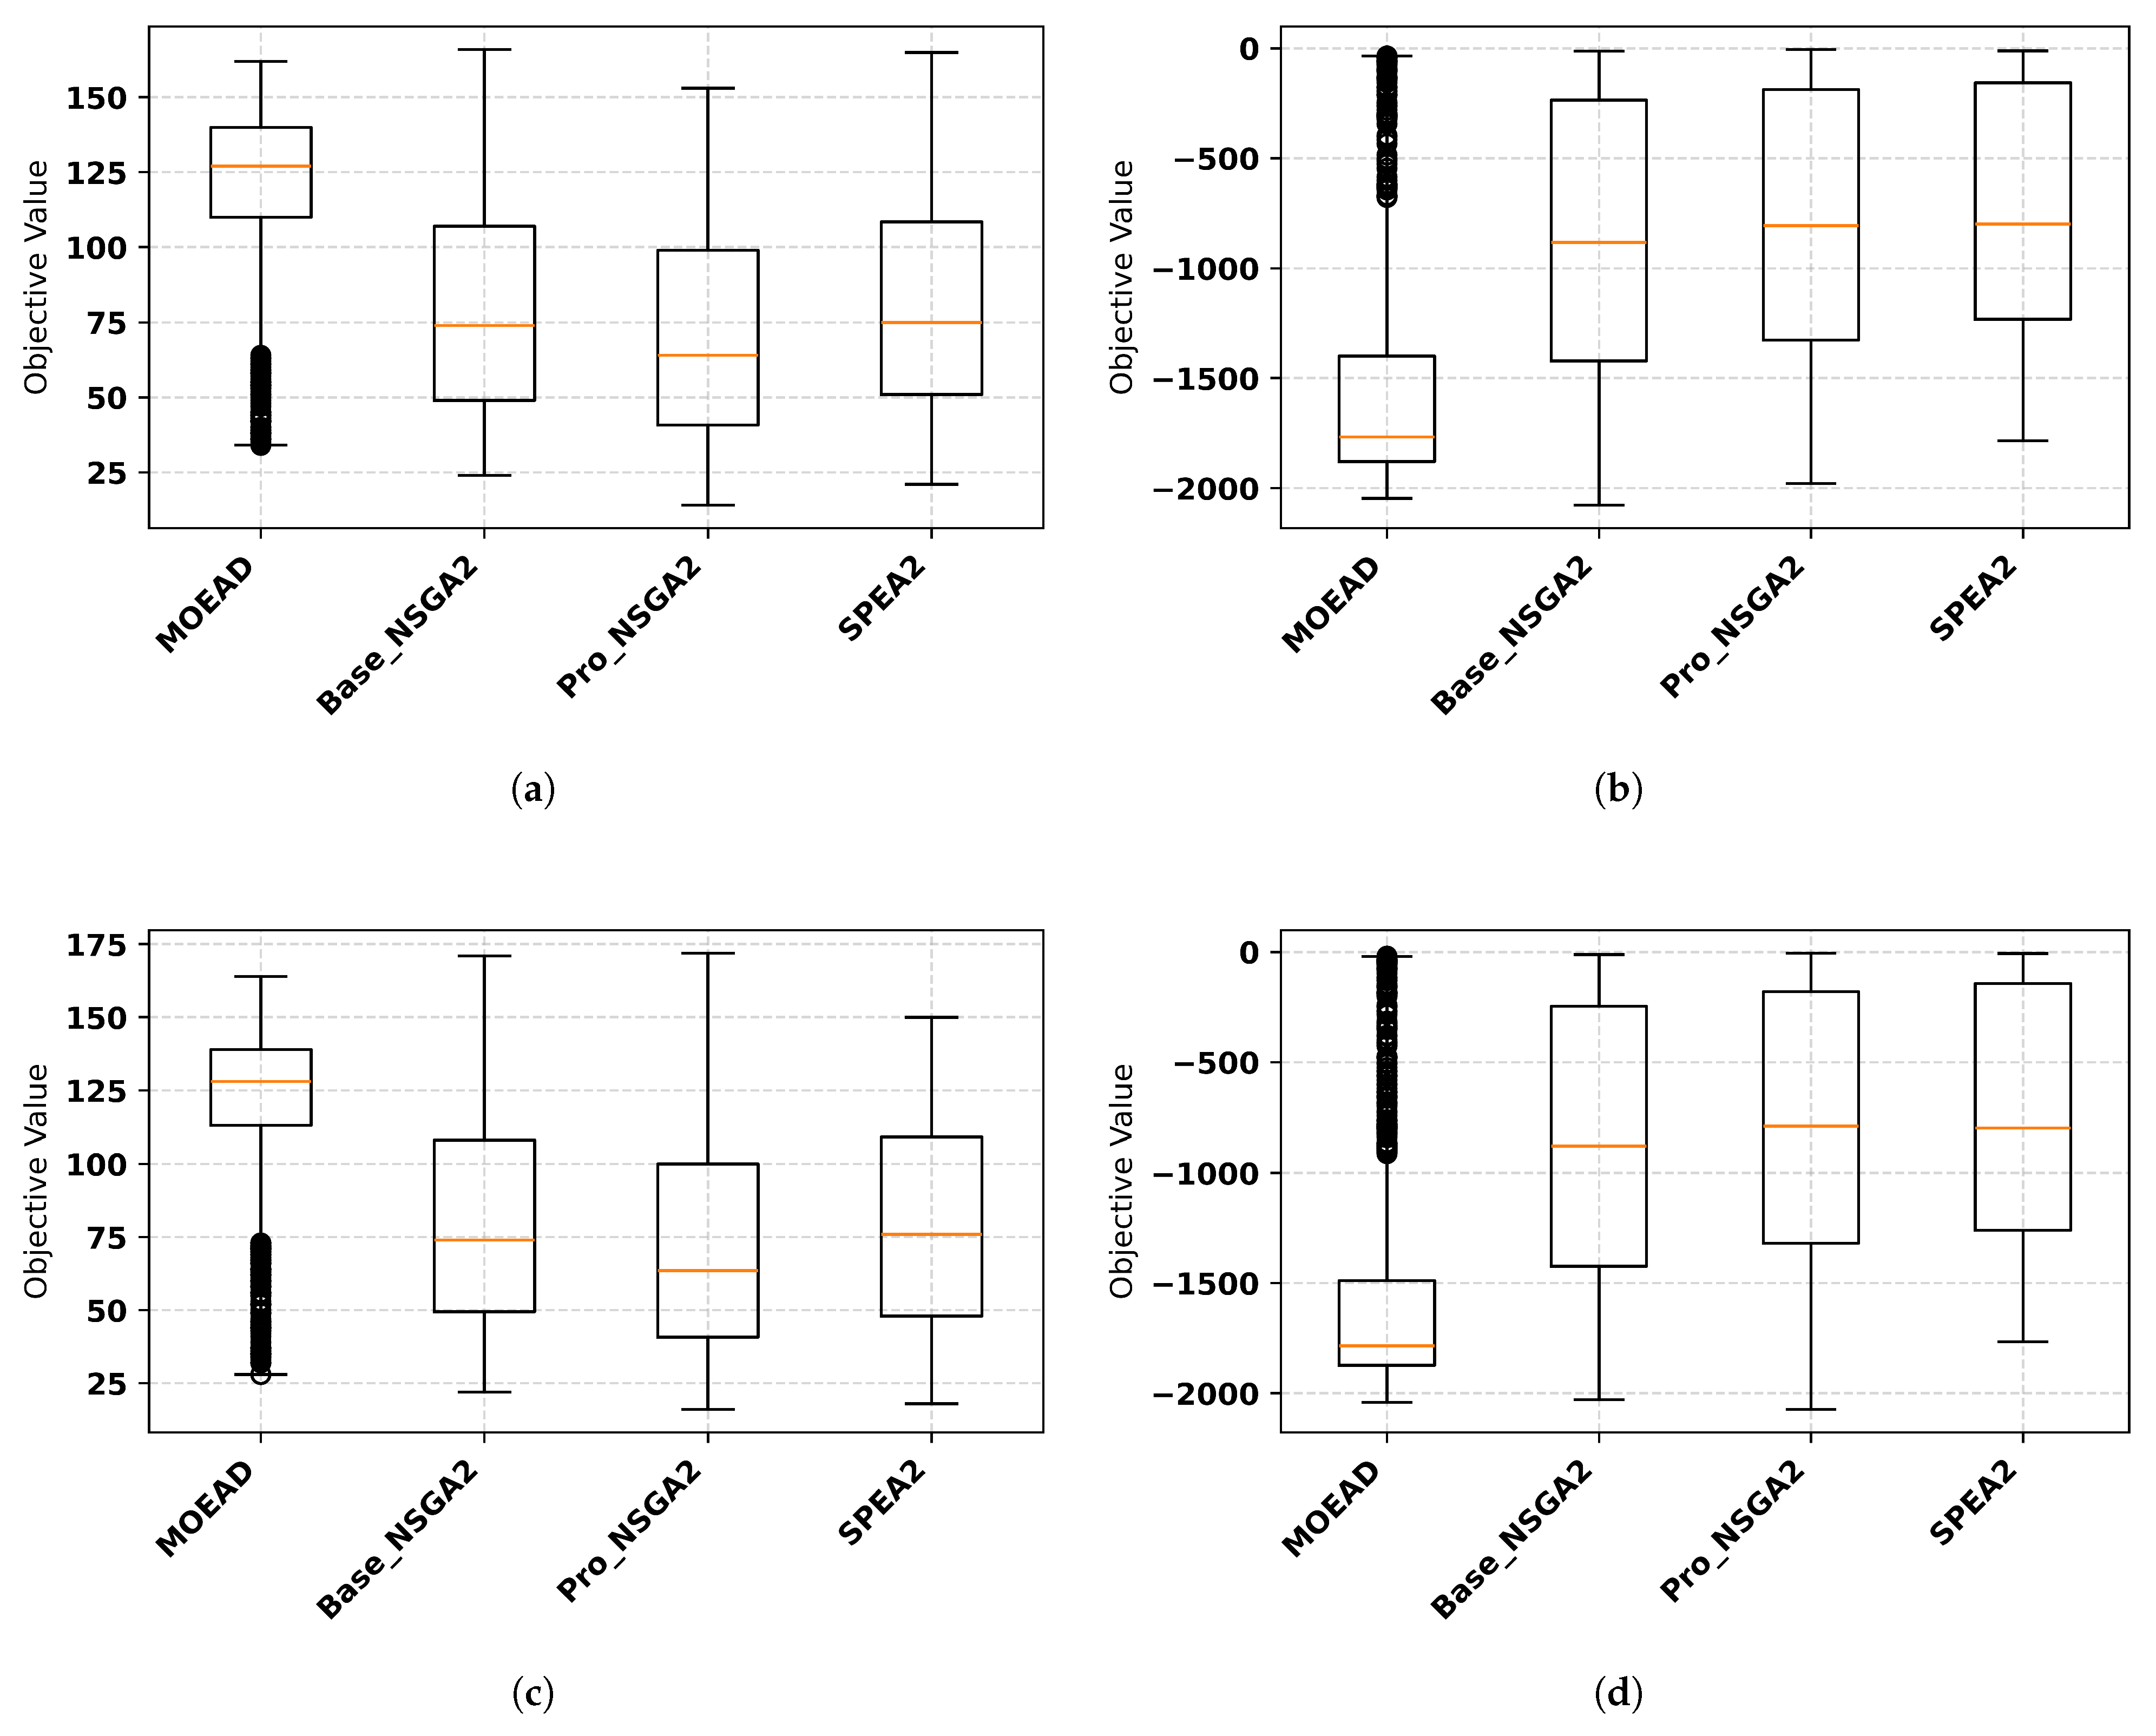
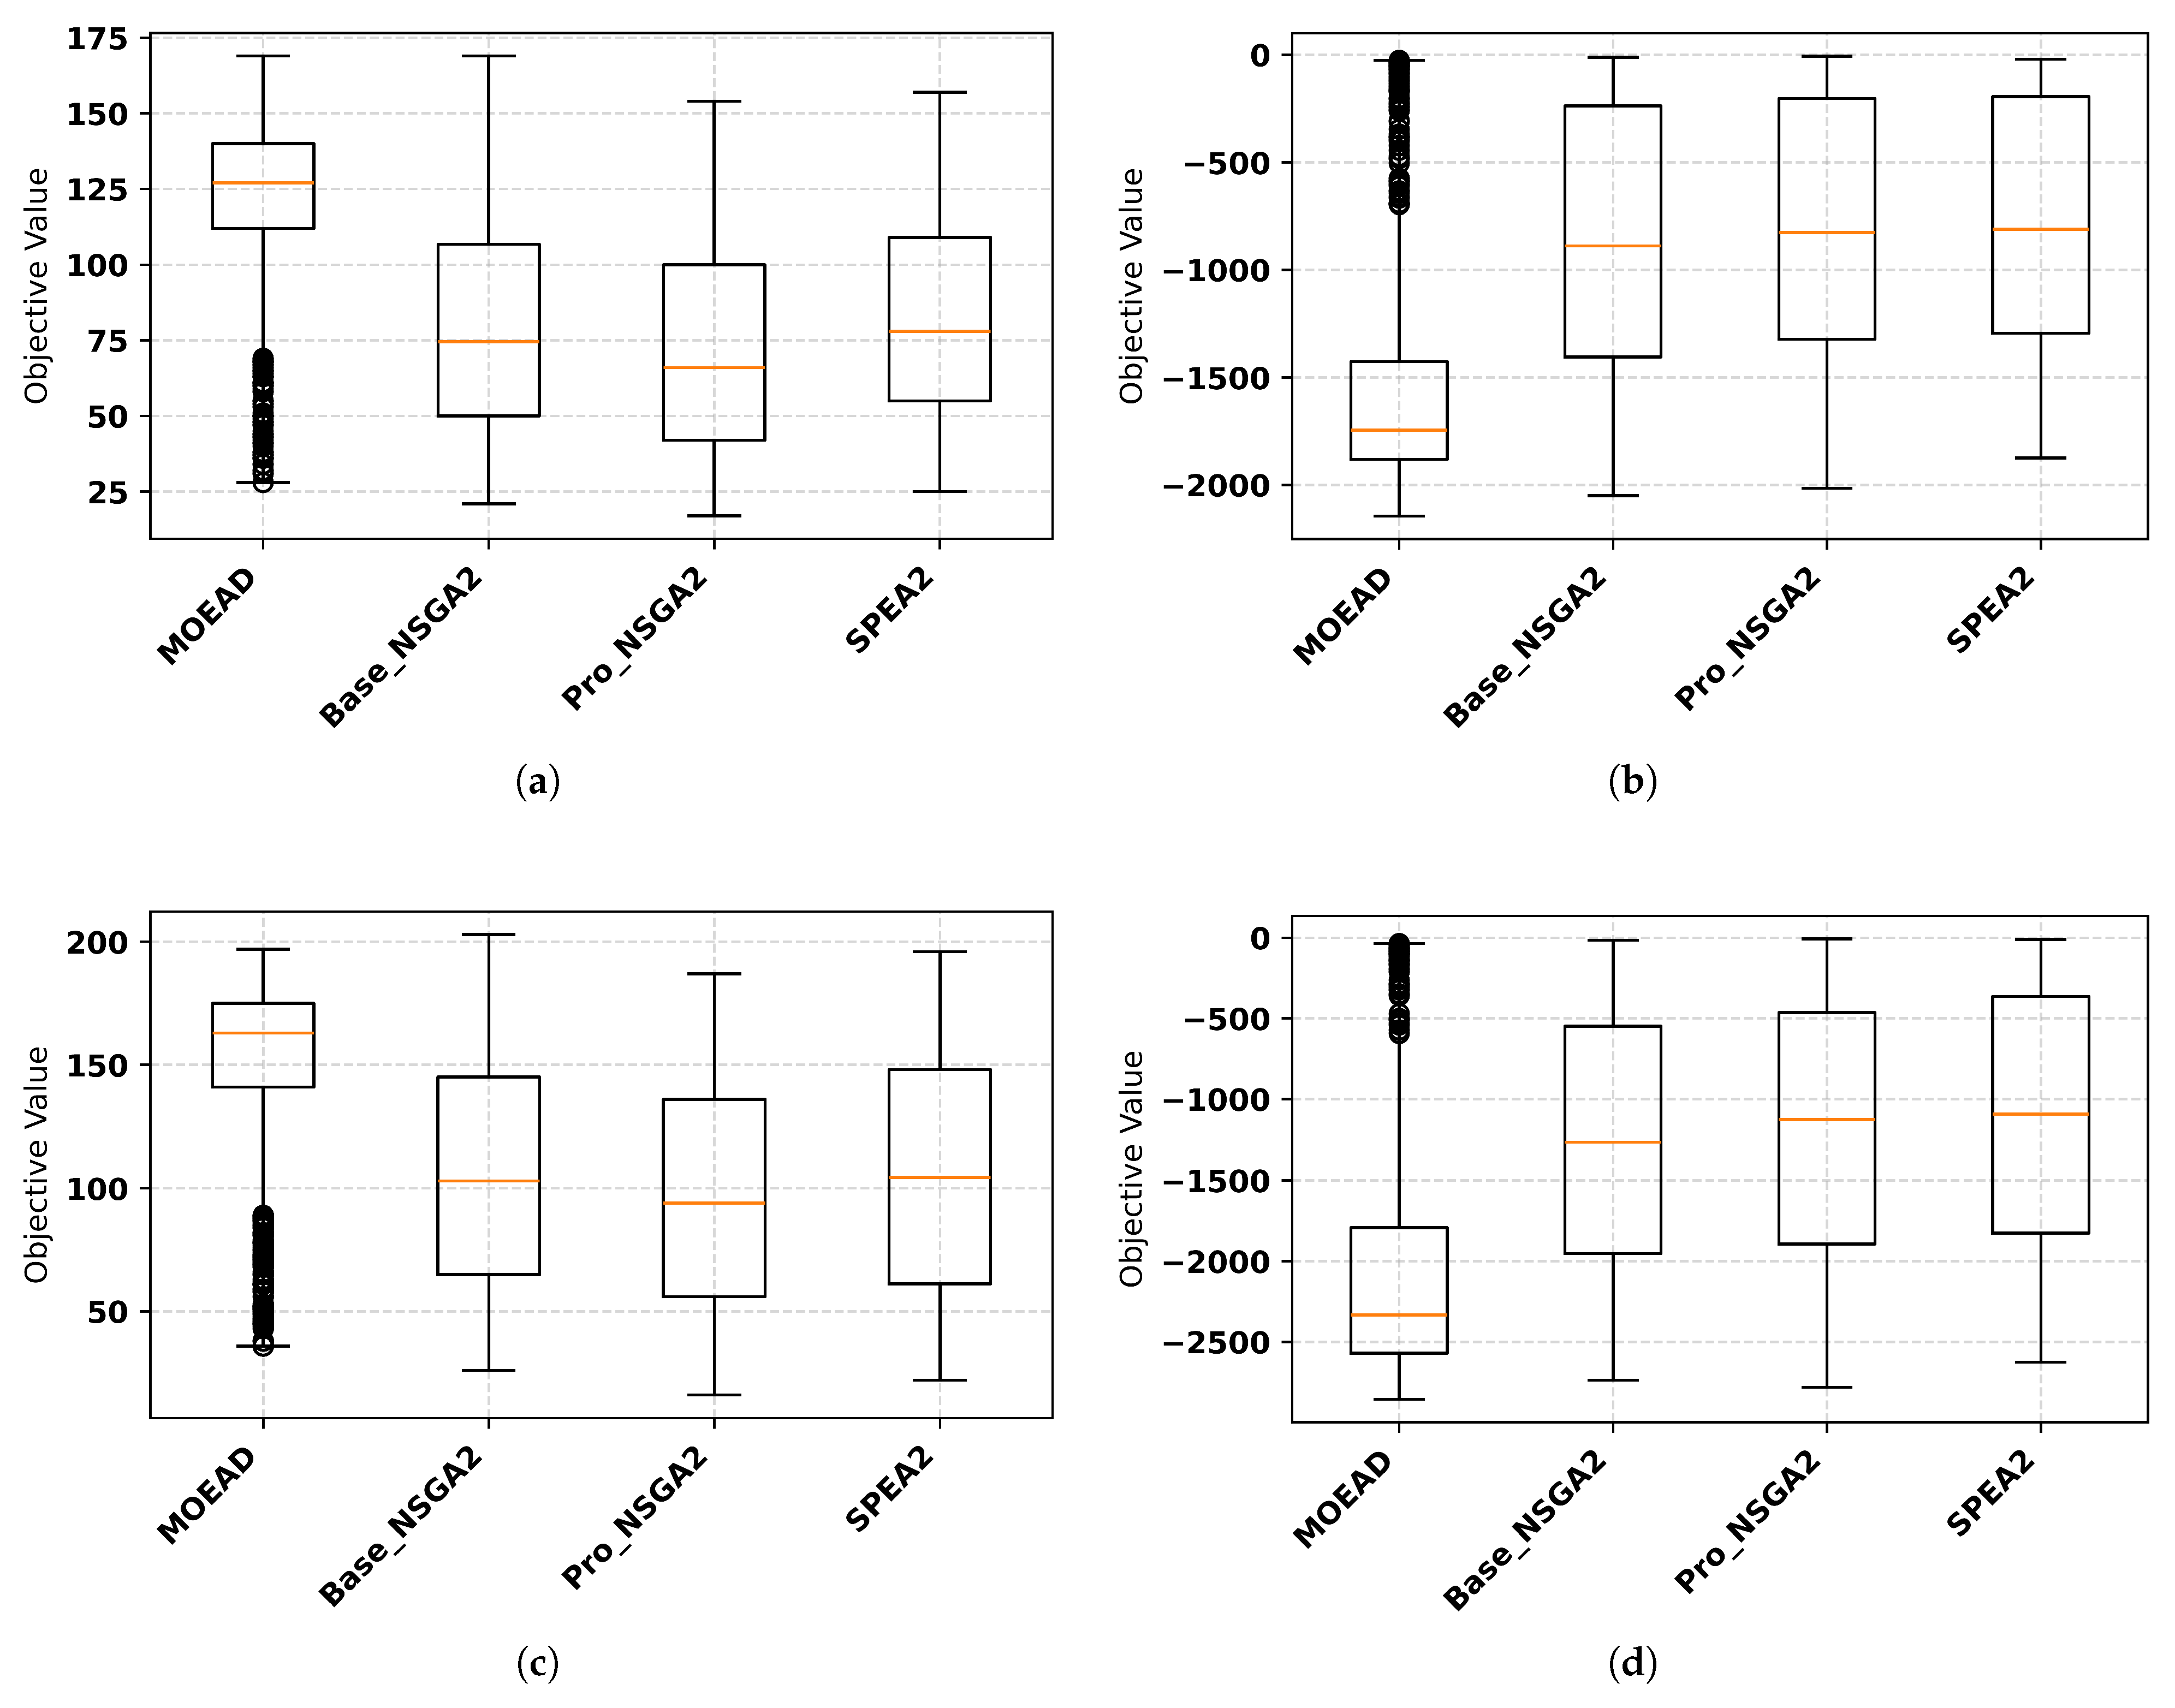
Box plots in Figure 3, Figure 4, Figure 5, Figure 6, Figure 7, Figure 8 and Figure 9 illustrate the performance of each algorithm across the seven cases. Each figure corresponds to a specific case, and the five subplots represent the respective objectives. These visualizations reveal key patterns, such as algorithms that minimize travel distance at the cost of increased tardiness, highlighting trade-off dynamics.
This study provides a detailed comparative evaluation of state-of-the-art multi-objective optimization algorithms across seven diverse inspection scheduling scenarios. The evaluation spans five conflicting objectives: total travel distance (TTD), total tardiness (TT), workload imbalance (WLI), priority-weighted tardiness (PWT), and scheduling imbalance (SI). The performance of each algorithm is systematically assessed through robust statistical measures derived from box plot distributions (from Figure 3, Figure 4, Figure 5, Figure 6, Figure 7, Figure 8 and Figure 9), emphasizing convergence behavior, solution diversity, and objective trade-offs.
Across all cases, MOEAD variants including HMOEAD-AS, PMOEAD-ES, TMOEAD-DP, AMOEAD-PS, LMOEAD-EN, and IMOEAD-MS consistently demonstrate superior performance. These algorithms offer well-balanced Pareto-optimal solutions with compact distributions and low median values across most objectives. Their decomposition-based framework enables effective navigation of complex trade-off landscapes, particularly excelling in workload balancing, scheduling equity, and travel cost minimization. The convergence stability and solution robustness of MOEAD variants mark them as the most reliable algorithmic family for multi-objective inspection scheduling under real-world constraints.
The Classical MOEAD algorithm exhibits strong performance in tardiness and priority-weighted tardiness minimization. In multiple cases, it achieves the lowest median values for these objectives, underscoring its capability in time-sensitive scheduling environments. However, this specialization is often accompanied by limited solution diversity and suboptimal performance in other objectives, particularly travel distance. These characteristics suggest a narrower scope of applicability, with potential risks of premature convergence and reduced flexibility in dynamic problem instances.
NSGA-II, in contrast, presents a highly polarized performance profile. In selected scenarios (e.g., Case 4 (Figure 6)–Case7 (Figure 9)), it achieves exceptional results in travel distance and total tardiness minimization, often with tight interquartile spreads, indicating high convergence precision. Nonetheless, these benefits are undermined by its significant underperformance in workload and scheduling imbalance, where it frequently records extreme median values and outliers. This imbalance reflects a tendency to overly exploit particular objectives at the cost of holistic solution quality. Consequently, while NSGA-II may be effective for problems emphasizing spatial optimization, it lacks the capacity for comprehensive multi-objective scheduling.
NSGA-III maintains a moderate performance across all cases. It neither excels in any single objective nor exhibits catastrophic failures, offering a balanced but unspecialized alternative. While it demonstrates improved performance over NSGA-II in balance-related objectives, it remains less competitive than MOEAD-based methods in terms of convergence quality and overall Pareto front diversity.
The trade-off analysis reveals intrinsic conflicts among objectives. A recurring pattern is observed between travel distance and tardiness, where improvements in one frequently compromise the other. A strong correlation also emerges between workload imbalance and scheduling imbalance, with algorithms performing well in one typically excelling in the other. Furthermore, priority-weighted tardiness minimization proves to be one of the most discriminative objectives, where only a few algorithms, namely Classical MOEAD and MOEAD variants, consistently deliver acceptable performance.
Case-specific outcomes reinforce the overall trends. In Cases 1 (Figure 3) and 3 (Figure 5), MOEAD variants dominate across most objectives, while NSGA-II records consistently inferior results. In Case 2 (Figure 4), Classical MOEAD delivers strong results in key metrics but reveals diversity limitations. In Cases 4 (Figure 6) through 7 (Figure 9), NSGA-II achieves notable performance in travel and tardiness objectives, but its solutions suffer from poor temporal and resource balancing. The MOEAD variants, however, maintain stability across all objectives, showcasing their adaptability and effectiveness in complex scheduling environments.
In conclusion, the results decisively position MOEAD variants as the most effective algorithmic framework for multi-objective inspection scheduling. Their ability to maintain balanced performance across conflicting objectives, combined with convergence robustness and diversity preservation, makes them highly suitable for potential practical deployment in real-world optimization contexts, although this has yet to be validated through field experiments. While Classical MOEAD and NSGA-II exhibit strong performance in isolated objectives, their limited adaptability and trade-off handling render them suboptimal for comprehensive scheduling problems. NSGA-III, though moderate in all respects, does not match the consistency and precision of MOEAD-based approaches. These findings provide clear guidance for algorithm selection in multi-objective scheduling and underscore the importance of decomposition strategies in achieving high-quality Pareto-optimal solutions in complex decision-making environments.

4.1.3. Convergence Characteristics of Multi-Objective JS Algorithms

Figure 10 illustrates the convergence performance of nine multi-objective evolutionary algorithms (MOEAs) on a five-objective inspection scheduling problem over 100 generations. Classical MOEAD consistently outperforms all competitors, achieving superior convergence rates and solution quality across four objectives: total travel distance (43,000 units, 45% reduction), total tardiness (4000 units), priority-weighted tardiness (17,000 units, 60% reduction), and scheduling imbalance (0.8–1.0 units). The algorithm demonstrates sustained improvement throughout the entire optimization process, while competitors typically plateau after generation 40. NSGA2 exhibits consistently poor performance, converging to suboptimal values of 76,000 units for travel distance, 10,500 units for total tardiness, and 40,000 units for priority-weighted tardiness, with minimal improvement after initial generations. Intermediate performance is observed for AMOEAD-PS, IMOEAD-MS, HMOEAD-AS, TMOEAD-DP, NSGA3, PMOEAD-ES, and LMOEAD-EN, typically achieving solutions 25–40% inferior to Classical MOEAD but substantially better than NSGA2. The workload imbalance objective presents significant optimization challenges for all algorithms, characterized by high variance and erratic convergence patterns, indicating potential objective conflicts within the Pareto front. These results suggest that Classical MOEAD’s decomposition-based approach provides superior exploration-exploitation balance and convergence reliability compared to dominance-based methodologies, making it the preferred algorithm for complex multi-objective inspection scheduling problems with conflicting objectives.

4.1.4. Runtime Comparison Analysis

The computational complexity analysis reveals fundamental differences in algorithmic efficiency among multi-objective evolutionary algorithms. MOEA/D variants and NSGA-II demonstrate superior theoretical efficiency, requiring only population size evaluations per generation, resulting in total evaluations equal to population size × max generations (with NSGA-II including an additional final generation evaluation). In contrast, NSGA-III exhibits inherently higher computational cost with double the evaluation requirement (2 × population size per generation), leading to total evaluations of population size × (2 × max generations + final generation evaluation). This theoretical disparity translates directly into practical performance differences, with NSGA-III requiring approximately 5-10 times more computational resources than competing algorithms.
Empirical validation across seven inspection scheduling cases confirms these theoretical predictions in Table 6. Classical MOEA/D consistently achieves the fastest execution times, ranging from 113.87 to 224.99 s, followed by NSGA-II with comparable performance (144.36 to 263.87 s). The majority of MOEA/D variants cluster within a moderate performance range of 260–505 s, while NSGA-III demonstrates significantly degraded performance with runtimes extending from 1326.71 to 2510.93 s. This performance gap widens with increasing problem complexity, indicating poor scalability characteristics for NSGA-III.
The results establish Classical MOEA/D as the most computationally efficient algorithm for multi-objective optimization problems, maintaining consistent performance advantages across varying problem scales. NSGA-III’s doubled evaluation overhead creates a substantial computational bottleneck that limits its practical applicability for large-scale optimization scenarios, despite its theoretical advantages in many-objective optimization contexts.

4.1.5. Performance Ranking and Statistical Significance

The ranking methodology employs a comprehensive dual-criteria evaluation framework that assesses algorithms across both objective performance and behavioral metrics. For objective evaluation, algorithms are ranked across five objectives (min) using three statistical measures (mean, median, and minimum values), creating fifteen individual rankings per case, where rank 1 indicates best performance and ties are resolved using the ’first’ method. Simultaneously, behavioral assessment evaluates four key performance indicators: hypervolume (max), IGD (min), spacing (min), and spreading (min), with individual ranks assigned based on optimization direction. The final integrated ranking combines both assessments by summing all individual ranks to produce total rank scores, where lower values indicate superior overall performance across objective achievement, convergence quality, solution diversity, and distribution uniformity. This dual-framework approach ensures that algorithms demonstrating consistent excellence across both problem-specific objectives and fundamental evolutionary algorithm behaviors achieve better overall rankings, providing a robust assessment that balances practical performance with algorithmic quality metrics.
The Friedman test revealed statistically significant differences between algorithm rankings across all test cases ( χ 2 = 86.186 , p < 0.001 ). This highly significant result ( p = 7.46 × 10 13 ) provides strong evidence that the algorithms exhibit genuinely different performance levels rather than random variation.
The Nemenyi post hoc test reveals distinct performance groupings among the algorithms with several significant pairwise differences (p < 0.05) (Figure 11). Classical MOEA/D variants (AMOEAD-PS, Classical MOEAD, HMOEAD-AS, NSGA-III) form a high-performing cluster with non-significant differences between them (p > 0.05). In contrast, domain-specific heuristics algorithms (DM, HMO) and weight-based (WB) approaches demonstrate significantly different performance patterns, with DM and HMO showing particularly strong statistical separation from most MOEA/D variants (p < 0.01).
Three distinct performance tiers emerge from the statistical analysis. The top-performing group includes Classical MOEAD, AMOEAD-PS, HMOEAD-AS, and NSGA-III, which show no significant differences among themselves but are significantly better than lower-tier algorithms. The middle tier comprises IMOEAD-MS, LMOEAD-EN, PMOEAD-ES, and TMOEAD-DP, while the heuristic algorithms (DM, EDF, HMO, PB, WB) form context-dependent performance clusters with significant variations based on problem characteristics.
The post hoc analysis confirms the Friedman test findings, establishing that observed performance differences represent genuine algorithmic superiority rather than random variation. The critical difference analysis supports evidence-based algorithm selection, with Classical MOEAD and its variants demonstrating statistically superior and consistent performance across multiple test scenarios.

4.2. Team Formation Algorithm (TFA) Performances

4.2.1. Comparative Analysis of Multi-Objective TFA Performance

The proposed NSGA-II algorithm demonstrates superior performance across all evaluated metrics when compared to state-of-the-art multi-objective optimization algorithms, as presented in Table 7. In terms of hypervolume, the proposed algorithm consistently outperforms all baseline methods across seven test cases, achieving values ranging from 0.74 to 0.82, representing improvements of 2.7–5.1% over the base NSGA-II and 8.8–20.6% over MOEAD. The algorithm exhibits particularly strong performance in Cases 2 and 4, where hypervolume values reach 0.82 ± 0.03 and 0.78 ± 0.02 , respectively, (see Table 7), indicating superior convergence to the true Pareto front. Similarly, the inverted generational distance (IGD) results confirm the algorithm’s enhanced convergence capabilities, with consistently lower IGD values across all cases (0.01–0.04) compared to base NSGA-II (0.02–0.05) and MOEAD (0.04–0.05), demonstrating reduced distance to the optimal Pareto front. The diversity metrics are presented in Table 7.
Table 7 further substantiates the proposed algorithm’s effectiveness in maintaining solution distribution quality. Spacing values remain consistently low (0.01–0.02) across all test cases, matching MOEAD’s performance and significantly outperforming SPEA2’s higher spacing values (0.02–0.03), which indicates uniform distribution of solutions along the Pareto front. The spreading metric results show the proposed algorithm maintains comparable performance to the base NSGA-II (0.54–0.65 vs. 0.49–0.59) while significantly outperforming MOEAD’s notably higher spreading values (1.38–1.51), suggesting better extent coverage of the objective space. These comprehensive results, as detailed in Table 7, demonstrate that the proposed hybrid NSGA-II successfully addresses the fundamental trade-off between convergence and diversity in multi-objective optimization, establishing its superiority over established algorithms in the team formation problem domain.
Figure 12, Figure 13, Figure 14 and Figure 15 illustrate the performance of a Proposed Hybrid NSGA-II algorithm against MOEAD, Base NSGA2, and SPEA2 across seven test cases with the objectives each. The empirical evaluation of the proposed Hybrid NSGA-2 algorithm across seven distinct case studies demonstrates consistently superior performance in multi-objective optimization scenarios when compared to established algorithms, including MOEAD, baseline NSGA-2, and SPEA2. For the first objective across all cases, the proposed algorithm achieved optimal median values ranging from 45 (Case 2) to 115 (Case 7), consistently outperforming competitors. MOEAD consistently exhibited the poorest performance with significantly higher median values and extensive solution variability, while baseline NSGA-2 and SPEA2 showed moderate performance levels. The proposed algorithm’s dominance in the first objective was accompanied by enhanced convergence reliability through more compact distributions and reduced presence of statistical outliers.
Performance patterns for the second objective revealed more nuanced competitive dynamics across the case studies. The proposed NSGA-2 achieved median values ranging from −300 (Case 2) to −1550 (Case 7), consistently outperforming MOEAD, which exhibited poor convergence characteristics with extensive solution dispersion. In Cases 4 and 7, the proposed algorithm demonstrated complete dominance by achieving optimal performance for both objectives simultaneously. However, in Cases 1 and 3, baseline NSGA-2 showed slightly superior minimization capability for the second objective, though the proposed algorithm maintained better solution consistency with tighter interquartile ranges and minimal extreme outliers.
The algorithm’s most significant strength lies in its ability to maintain balanced optimization performance across multi-objective landscapes while demonstrating superior solution consistency. However, the evaluation reveals some limitations in the proposed approach. The algorithm’s performance advantage appears to be more pronounced in the first objective compared to the second, suggesting potential bias in the algorithmic modifications. Additionally, while the proposed method consistently reduces solution variability, the improvement margins over baseline NSGA-2 and SPEA2 are sometimes modest, particularly for the second objective in certain cases, raising questions about the practical significance of these enhancements in real-world applications.
The comprehensive analysis across all seven cases reveals that the proposed NSGA-2 modifications consistently deliver predictable, high-quality performance with enhanced algorithmic stability. The algorithm’s ability to achieve optimal or near-optimal results while maintaining tighter distributions and fewer statistical outliers represents a meaningful advancement in multi-objective optimization reliability. This consistency manifests through reduced sensitivity to initialization parameters and improved robustness across diverse problem instances, making it particularly valuable for practical applications where solution reliability is as critical as solution quality.
The proposed NSGA-2 algorithm demonstrates significant advancement in multi-objective optimization through its consistent superior performance across seven diverse case studies. The algorithm successfully balances optimization effectiveness with solution reliability, achieving the best performance for the first objective in all cases while maintaining competitive results for the second objective. Most importantly, the enhanced algorithmic stability and reduced solution variability represent valuable improvements for practical multi-objective optimization applications where both solution quality and algorithmic predictability are paramount considerations.

4.2.2. Convergence Characteristics of Multi-Objective TF Algorithms

Based on Figure 16 showing hypervolume and spacing metrics across generations, the proposed hybrid NSGA-II demonstrates distinct convergence characteristics compared to the other algorithms.
In terms of hypervolume performance, Figure 16a, the proposed NSGA-II shows a more gradual but ultimately superior convergence pattern. While MOEAD and SPEA2 achieve rapid initial improvements in the first 50 generations, reaching plateaus around 165,000 and 160,000, respectively, the proposed algorithm continues to improve steadily throughout the optimization process. By generation 100, it surpasses the base NSGA-II and maintains consistent progress, ultimately achieving the highest hypervolume value of approximately 155,000 by generation 200. This suggests that the hybrid approach provides better exploration capabilities and avoids premature convergence, allowing it to discover superior solutions even in later generations.
The spacing metric reveals another important aspect of the proposed algorithm’s convergence behavior (Figure 16b). Initially, all algorithms except MOEAD exhibit high spacing values, indicating poor solution distribution in the early generations. However, the proposed NSGA-II demonstrates the most effective convergence in terms of solution diversity maintenance. Starting from around 27 at generation 0, it rapidly improves to approximately 18 by generation 25, then continues a gradual but consistent improvement to reach about 12 by generation 200. This convergence pattern is superior to the base NSGA-II, which plateaus at around 15, and significantly better than SPEA2, which maintains relatively poor spacing throughout the optimization process.
The convergence characteristics suggest that the proposed hybrid NSGA-II successfully balances exploration and exploitation. Unlike MOEAD, which achieves excellent spacing (near 0) but sacrifices hypervolume performance, or SPEA2, which shows good hypervolume but poor spacing, the proposed algorithm maintains a favorable trade-off between both metrics. This balanced approach results in solutions that are both high-quality in terms of objective space coverage and well-distributed across the Pareto front, indicating robust convergence properties that make it suitable for complex multi-objective optimization problems.

4.2.3. Runtime Comparison Analysis

The Proposed NSGA-II demonstrates competitive mean runtime performance, closely matching Base NSGA-II across most test cases with mean runtimes ranging from approximately 1500–2500 s (Figure 17). Both NSGA-II variants significantly outperform SPEA2, which shows extreme mean computational overhead (up to 3500+ s), while MOEA/D maintains the best overall mean efficiency. The proposed algorithm achieves a similar mean computational cost to the baseline NSGA2 implementation, indicating that the proposed enhancements do not introduce substantial computational overhead while potentially offering improved solution quality.

4.2.4. Impact of Population Size on Algorithm Performance

The relationship between the proposed Hybrid NSGA-II population size and optimization performance shows a clear pattern of diminishing returns. Hypervolume generally increases with population size (Figure 18a), indicating better solution quality and diversity, but peaks around 700 individuals before leveling off. Conversely, IGD (inverted generational distance) decreases with larger populations (Figure 18b), showing the steepest improvement between 100 and 300 individuals before stabilizing around 400–500. Both metrics converge on the finding that the proposed Hybrid NSGA-II’s optimal performance occurs with population sizes between 400 and 700, where the proposed Hybrid NSGA-II algorithm achieves the best balance of solution quality without the computational overhead of unnecessarily large populations. Beyond this range, additional individuals provide minimal performance gains while significantly increasing computational costs.
The Hybrid NSGA-II algorithm demonstrates robust performance across population sizes from 200 to 1000 for both objectives. For the interconnection cost objective (Figure 19a), mean values remain stable around −800 to −900 with consistent variability, showing only minor fluctuations except at population size 900. The team size objective (Figure 19b) exhibits even greater stability, maintaining mean values around 65–70 across all population sizes with slightly wider standard deviations at the extremes. Both objectives show that the algorithm is not highly sensitive to population size variations, suggesting reliable performance. The results indicate that population sizes between 400 and 800 provide an optimal balance between solution quality and computational efficiency, with the algorithm successfully managing the trade-offs between minimizing interconnection costs and optimizing team sizes in this multi-objective optimization problem.

5. Conclusions and Future Work

This study presents a comprehensive framework for optimizing inspection scheduling and skill-based team formation in distributed solar energy systems, addressing the dual challenges of operational complexity and workforce coordination. The problem is formulated as a tightly coupled bi-level multi-objective optimization model, capturing both temporal-spatial scheduling constraints and skill coverage requirements associated with fault-specific inspection tasks. A novel Hybrid Multi-Objective Optimization with Adaptive Operator Selection (HMOO-AOS) algorithm is proposed for the team formation problem, integrating six metaheuristic operators within an NSGA-II framework and dynamically selecting operators using an Upper Confidence Bound (UCB) criterion. This design enables adaptation to diverse problem landscapes while maintaining high-quality Pareto front approximations. For job scheduling, multiple multi-objective algorithms—including NSGA-II, NSGA-III, and enhanced MOEA/D variants—are applied to allow robust comparative evaluation. Synthetic datasets with realistic fault models, spatial constraints, and skill mappings provide a scalable benchmark for systematic testing, addressing the lack of publicly available solar inspection datasets.
Extensive evaluations using standard multi-objective metrics (HV, IGD, spacing, and spreading), ablation studies, and direct solution comparisons demonstrate the effectiveness of the proposed methods. The HMOO-AOS algorithm consistently outperforms baseline approaches in skill coverage, team compactness, and computational efficiency. Additionally, the cloud-integrated system architecture illustrates the feasibility of real-time deployment in industrial settings.
Despite the demonstrated effectiveness of the proposed HMOO-AOS framework in optimizing inspection scheduling and skill-based team formation across synthetic datasets and benchmark scenarios, several avenues remain for future research and broader applicability. The bi-level structure, while operationally realistic, limits formal guarantees of global optimality, and the current experiments rely on single-core CPU execution, leaving runtime performance on multicore or GPU systems untested. Moreover, a formal convergence proof is not provided, and the ablation analysis does not explore variations in the UCB parameter, operator sets, or NSGA-II variants. Addressing these limitations will involve extending the framework to include real-time uncertainty modeling, cross-team coordination, and scalable parallel implementations, as well as conducting field evaluations in operational solar environments. These efforts will not only validate the framework’s practical performance but also enhance its generalizability beyond the tested scenarios, providing actionable insights and adaptive tools for solar operators, maintenance planners, and energy system managers, thereby facilitating robust and intelligent inspection planning in diverse real-world settings.
A limitation of the proposed framework is that the lower-level team assignment problem is solved using a metaheuristic rather than an exact optimization method. While this approach provides high-quality and stable solutions within practical computational time, it does not guarantee strict optimality. Consequently, the upper-level scheduling decisions are evaluated against approximate rather than exact follower responses. Future work could explore hybrid strategies that combine exact methods for small subproblems with metaheuristics for large-scale instances to further improve solution optimality while maintaining real-time applicability.
Another limitation is that, while the computational complexity of HMOO-AOS has been analyzed, a formal convergence proof is not provided. The algorithm inherits some theoretical properties from its NSGA-II selection framework and UCB-based adaptive operator mechanism; however, establishing convergence guarantees in the context of discrete, constraint-rich, bi-level optimization requires additional assumptions and rigorous mathematical treatment. Future research will investigate sufficient conditions, finite-time bounds, and convergence rate analyses, alongside extending the complexity study to distributed and parallel computing environments.
Finally, the current ablation analysis does not explore variations in the UCB parameter c, the operator sets, or different NSGA-II variants. Extending these studies will improve understanding of algorithm sensitivity, robustness, and generalization to broader problem instances. Collectively, addressing these limitations will enhance the robustness, scalability, and real-world applicability of the proposed framework, further supporting intelligent and adaptive inspection planning in renewable energy operations.

Funding

This research received no funding.

Data Availability Statement

The data and codes presented in this study are available on request from the corresponding author.

Conflicts of Interest

The author declares no conflicts of interest.

References

  1. Obaideen, K.; Olabi, A.G.; Al Swailmeen, Y.; Shehata, N.; Abdelkareem, M.A.; Alami, A.H.; Rodriguez, C.; Sayed, E.T. Solar Energy: Applications, Trends Analysis, Bibliometric Analysis and Research Contribution to Sustainable Development Goals (SDGs). Sustainability 2023, 15, 1418. [Google Scholar] [CrossRef]
  2. Orosz, T.; Rassõlkin, A.; Arsénio, P.; Poór, P.; Valme, D.; Sleisz, Á. Current Challenges in Operation, Performance, and Maintenance of Photovoltaic Panels. Energies 2024, 17, 1306. [Google Scholar] [CrossRef]
  3. Hacke, P.; Terwilliger, K.; Smith, R.; Glick, S.; Pankow, J.; Kempe, M.; Bennett, S.K.I.; Kloos, M. System voltage potential-induced degradation mechanisms in PV modules and methods for test. In Proceedings of the 2011 37th IEEE Photovoltaic Specialists Conference, Seattle, WA, USA, 19–24 June 2011; pp. 000814–000820. [Google Scholar] [CrossRef]
  4. Pingel, S.; Frank, O.; Winkler, M.; Daryan, S.; Geipel, T.; Hoehne, H.; Berghold, J. Potential Induced Degradation of solar cells and panels. In Proceedings of the 2010 35th IEEE Photovoltaic Specialists Conference, Honolulu, HI, USA, 20–25 June 2010. [Google Scholar] [CrossRef]
  5. Sarver, T.; Al-Qaraghuli, A.; Kazmerski, L.L. A comprehensive review of the impact of dust on the use of solar energy: History, investigations, results, literature, and mitigation approaches. Renew. Sustain. Energy Rev. 2013, 22, 698–733. [Google Scholar] [CrossRef]
  6. Jordan, D.C.; Kurtz, S.R. Photovoltaic Degradation Rates—An Analytical Review. Prog. Photovolt. Res. Appl. 2011, 21, 12–29. [Google Scholar] [CrossRef]
  7. Waqar Akram, M.; Li, G.; Jin, Y.; Chen, X. Failures of Photovoltaic modules and their Detection: A Review. Appl. Energy 2022, 313, 118822. [Google Scholar] [CrossRef]
  8. Mellit, A.; Tina, G.; Kalogirou, S. Fault detection and diagnosis methods for photovoltaic systems: A review. Renew. Sustain. Energy Rev. 2018, 91, 1–17. [Google Scholar] [CrossRef]
  9. Bosman, L.B.; Leon-Salas, W.D.; Hutzel, W.; Soto, E.A. PV System Predictive Maintenance: Challenges, Current Approaches, and Opportunities. Energies 2020, 13, 1398. [Google Scholar] [CrossRef]
  10. Manno, D.; Cipriani, G.; Ciulla, G.; Di Dio, V.; Guarino, S.; Lo Brano, V. Deep learning strategies for automatic fault diagnosis in photovoltaic systems by thermographic images. Energy Convers. Manag. 2021, 241, 114315. [Google Scholar] [CrossRef]
  11. Michail, A.; Livera, A.; Tziolis, G.; Carús Candás, J.L.; Fernandez, A.; Antuña Yudego, E.; Fernández Martínez, D.; Antonopoulos, A.; Tripolitsiotis, A.; Partsinevelos, P.; et al. A comprehensive review of unmanned aerial vehicle-based approaches to support photovoltaic plant diagnosis. Heliyon 2024, 10, e23983. [Google Scholar] [CrossRef]
  12. Nascimento, A.; de Souza Ribeiro, L.A.; Oliveira, H.; de Matos, J.G.; Da Silva Santos, O. Development of communication to control photovoltaic system in a microgrid by using Programmable Automation Controller, Raspberry-Pi and open-source software. In Proceedings of the 2023 IEEE Energy Conversion Congress and Exposition (ECCE), Nashville, TN, USA, 29 October–2 November 2023; pp. 6284–6288. [Google Scholar] [CrossRef]
  13. Syamsuddin, A.; Adhi, A.C.; Kusumawardhani, A.; Prahasto, T.; Widodo, A. Predictive maintenance based on anomaly detection in photovoltaic system using SCADA data and machine learning. Results Eng. 2024, 24, 103589. [Google Scholar] [CrossRef]
  14. Amiri, A.F.; Kichou, S.; Oudira, H.; Chouder, A.; Silvestre, S. Fault Detection and Diagnosis of a Photovoltaic System Based on Deep Learning Using the Combination of a Convolutional Neural Network (CNN) and Bidirectional Gated Recurrent Unit (Bi-GRU). Sustainability 2024, 16, 1012. [Google Scholar] [CrossRef]
  15. Badran, G.; Dhimish, M. Potential Induced Degradation in Photovoltaic Modules: A Review of the Latest Research and Developments. Solar 2023, 3, 322–346. [Google Scholar] [CrossRef]
  16. Nam, W.; Choi, J.; Kim, G.; Hyun, J.; Ahn, H.; Park, N. Predicting Photovoltaic Module Lifespan Based on Combined Stress Tests and Latent Heat Analysis. Energies 2025, 18, 304. [Google Scholar] [CrossRef]
  17. Wohlgemuth, J.; Cunningham, D.; Monus, P.; Miller, J.; Nguyen, A. Long Term Reliability of Photovoltaic Modules. In Proceedings of the 2006 IEEE 4th World Conference on Photovoltaic Energy Conference, Waikoloa, HI, USA, 7–12 May 2006; pp. 2050–2053. [Google Scholar] [CrossRef]
  18. Kempe, M. Modeling of rates of moisture ingress into photovoltaic modules. Sol. Energy Mater. Sol. Cells 2006, 90, 2720–2738. [Google Scholar] [CrossRef]
  19. Liu, F.; Jiang, L.; Yang, S. Ultra-violet degradation behavior of polymeric backsheets for photovoltaic modules. Sol. Energy 2014, 108, 88–100. [Google Scholar] [CrossRef]
  20. Julien, S.E.; Kim, J.H.; Lyu, Y.; Miller, D.C.; Gu, X.; Wan, K.T. Cohesive and adhesive degradation in PET-based photovoltaic backsheets subjected to ultraviolet accelerated weathering. Sol. Energy 2021, 224, 637–649. [Google Scholar] [CrossRef]
  21. Ilse, K.; Micheli, L.; Figgis, B.W.; Lange, K.; Daßler, D.; Hanifi, H.; Wolfertstetter, F.; Naumann, V.; Hagendorf, C.; Gottschalg, R.; et al. Techno-Economic Assessment of Soiling Losses and Mitigation Strategies for Solar Power Generation. Joule 2019, 3, 2303–2321. [Google Scholar] [CrossRef]
  22. Baltacı, O.; Kıral, Z.; Dalkılınç, K.; Karaman, O. Thermal Image and Inverter Data Analysis for Fault Detection and Diagnosis of PV Systems. Appl. Sci. 2024, 14, 3671. [Google Scholar] [CrossRef]
  23. Saha, A.; Nipu, N.N.; Khan, M.F. Effect of Partial Shading on the Performance of Solar PV Module and Impact of Bypass Diode in Performance Enhancement. In Proceedings of the 2019 5th International Conference on Advances in Electrical Engineering (ICAEE), Dhaka, Bangladesh, 26–28 September 2019; pp. 891–896. [Google Scholar] [CrossRef]
  24. Dhanraj, J.A.; Mostafaeipour, A.; Velmurugan, K.; Techato, K.; Chaurasiya, P.K.; Solomon, J.M.; Gopalan, A.; Phoungthong, K. An Effective Evaluation on Fault Detection in Solar Panels. Energies 2021, 14, 7770. [Google Scholar] [CrossRef]
  25. Brinkhaus, M.; Jarosch, D.; Kapischke, J. All year power supply with off-grid photovoltaic system and clean seasonal power storage. Sol. Energy 2011, 85, 2488–2496. [Google Scholar] [CrossRef]
  26. Dolara, A.; Lazaroiu, G.C.; Leva, S.; Manzolini, G. Experimental investigation of partial shading scenarios on PV (photovoltaic) modules. Energy 2013, 55, 466–475. [Google Scholar] [CrossRef]
  27. Aghaei, M.; Fairbrother, A.; Gok, A.; Ahmad, S.; Kazim, S.; Lobato, K.; Oreski, G.; Reinders, A.; Schmitz, J.; Theelen, M.; et al. Review of degradation and failure phenomena in photovoltaic modules. Renew. Sustain. Energy Rev. 2022, 159, 112160. [Google Scholar] [CrossRef]
  28. Sohani, A. Time-dependent energy, economic, and environmental assessment of a PV-hydrogen integrated power system. Int. J. Hydrogen Energy 2025, 144, 964–976. [Google Scholar] [CrossRef]
  29. International Energy Agency (IEA). PVPS Task 13: Analytical Monitoring of Photovoltaic Systems; IEA PVPS Task 13 Report; IEA: Paris, France, 2020. Available online: https://iea-pvps.org/research-tasks/performance-operation-and-reliability-of-photovoltaic-systems// (accessed on 1 March 2025).
  30. Ali, A.; Abdelhadi, A. Condition-Based Monitoring and Maintenance: State of the Art Review. Appl. Sci. 2022, 12, 688. [Google Scholar] [CrossRef]
  31. Kabashkin, I.; Perekrestov, V.; Pivovar, M. AI-Driven Fault Detection and Maintenance Optimization for Aviation Technical Support Systems. Processes 2025, 13, 666. [Google Scholar] [CrossRef]
  32. Khan, U.; Cheng, D.; Setti, F.; Fummi, F.; Cristani, M.; Capogrosso, L. A Comprehensive Survey on Deep Learning-based Predictive Maintenance. ACM Trans. Embed. Comput. Syst. 2025, 24, 1–36. [Google Scholar] [CrossRef]
  33. Hamza, A.; Ali, Z.; Dudley, S.; Saleem, K.; Uneeb, M.; Christofides, N. A multi-stage review framework for AI-driven predictive maintenance and fault diagnosis in photovoltaic systems. Appl. Energy 2025, 393, 126108. [Google Scholar] [CrossRef]
  34. Salazar-Peña, N.; Tabares, A.; González-Mancera, A. Performance assessment and dynamic fault detection in photovoltaic systems using artificial intelligence. Energy 2025, 330, 136759. [Google Scholar] [CrossRef]
  35. Triki-Lahiani, A.; Bennani-Ben Abdelghani, A.; Slama-Belkhodja, I. Fault detection and monitoring systems for photovoltaic installations: A review. Renew. Sustain. Energy Rev. 2018, 82, 2680–2692. [Google Scholar] [CrossRef]
  36. de Oliveira, A.K.V.; Aghaei, M.; Rüther, R. Automatic Inspection of Photovoltaic Power Plants Using Aerial Infrared Thermography: A Review. Energies 2022, 15, 2055. [Google Scholar] [CrossRef]
  37. Gerd Imenes, A.; Saad Noori, N.; Andreas Nesvag Uthaug, O.; Kroni, R.; Bianchi, F.; Belbachir, N. A Deep Learning Approach for Automated Fault Detection on Solar Modules Using Image Composites. In Proceedings of the 2021 IEEE 48th Photovoltaic Specialists Conference (PVSC), Fort Lauderdale, FL, USA, 20–25 June 2021; pp. 1925–1930. [Google Scholar] [CrossRef]
  38. Addabbo, P.; Angrisano, A.; Bernardi, M.L.; Gagliarde, G.; Mennella, A.; Nisi, M.; Ullo, S.L. UAV system for photovoltaic plant inspection. IEEE Aerosp. Electron. Syst. Mag. 2018, 33, 58–67. [Google Scholar] [CrossRef]
  39. Voutsinas, S.; Mandourarakis, I.; Koutroulis, E.; Karolidis, D.; Voyiatzis, I.; Samarakou, M. Control and communication for smart photovoltaic arrays. In Proceedings of the 26th Pan-Hellenic Conference on Informatics, PCI 2022, Athens, Greece, 25–27 November 2022; pp. 139–144. [Google Scholar] [CrossRef]
  40. Xu, H.; Ma, K.; Shen, B.; Yang, A.; Zhou, Y.; Li, J.; Han, C.; Mu, H. Research on an IoT-based Smart Monitoring System for Distribution Transformers in Solar PV Plants. In Proceedings of the 2023 IEEE 6th International Electrical and Energy Conference (CIEEC), Hefei, China, 12–14 May 2023; pp. 2377–2381. [Google Scholar] [CrossRef]
  41. Magalhães, R.; Costa, L.; Martin-Lopez, S.; Gonzalez-Herraez, M.; Braña, A.F.; Martins, H.F. Long-Range Distributed Solar Irradiance Sensing Using Optical Fibers. Sensors 2020, 20, 908. [Google Scholar] [CrossRef]
  42. Sun, T.; Shan, M.; Rong, X.; Yang, X. Estimating the spatial distribution of solar photovoltaic power generation potential on different types of rural rooftops using a deep learning network applied to satellite images. Appl. Energy 2022, 315, 119025. [Google Scholar] [CrossRef]
  43. Fazai, R.; Abodayeh, K.; Mansouri, M.; Trabelsi, M.; Nounou, H.; Nounou, M.; Georghiou, G. Machine learning-based statistical testing hypothesis for fault detection in photovoltaic systems. Sol. Energy 2019, 190, 405–413. [Google Scholar] [CrossRef]
  44. Harrou, F.; Dairi, A.; Taghezouit, B.; Sun, Y. An unsupervised monitoring procedure for detecting anomalies in photovoltaic systems using a one-class Support Vector Machine. Sol. Energy 2019, 179, 48–58. [Google Scholar] [CrossRef]
  45. Bounabi, M.; Azmi, R.; Chenal, J.; Diop, E.B.; Ebnou Abdem, S.A.; Adraoui, M.; Hlal, M.; Serbouti, I. Smart PV Monitoring and Maintenance: A Vision Transformer Approach within Urban 4.0. Technologies 2024, 12, 192. [Google Scholar] [CrossRef]
  46. Sarkar, B.; Paul, R.K. AI-Driven Manufacturing Processes. In AI for Advanced Manufacturing and Industrial Applications; Springer Nature Switzerland: Cham, Switzerland, 2025; pp. 19–59. [Google Scholar] [CrossRef]
  47. Shadi, M.R.; Mirshekali, H.; Shaker, H.R. Explainable artificial intelligence for energy systems maintenance: A review on concepts, current techniques, challenges, and prospects. Renew. Sustain. Energy Rev. 2025, 216, 115668. [Google Scholar] [CrossRef]
  48. IEC 61215-1; Terrestrial Photovoltaic (PV) Modules—Design Qualification and Type Approval—Part 1: Test Requirements. International Electrotechnical Commission: Geneva, Switzerland, 2021.
  49. IEC 61730-1; Photovoltaic (PV) Module Safety Qualification—Part 1: Requirements for Construction. IEC: Geneva, Switzerland, 2023.
  50. IEC 61730-2; Photovoltaic (PV) Module Safety Qualification—Part 2: Requirements for Testing. IEC: Geneva, Switzerland, 2023.
  51. Ma, H.; Ning, J.; Zheng, J.; Zhang, C. A Decomposition-Based Evolutionary Algorithm with Neighborhood Region Domination. Biomimetics 2025, 10, 19. [Google Scholar] [CrossRef]
  52. Guo, X. A Survey of Decomposition Based Evolutionary Algorithms for Many-Objective Optimization Problems. IEEE Access 2022, 10, 72825–72838. [Google Scholar] [CrossRef]
  53. Zhan, Z.; Hu, Y.; Xia, P.; Ding, J. Multi-Objective Optimization in Construction Project Management Based on NSGA-III: Pareto Front Development and Decision-Making. Buildings 2024, 14, 2112. [Google Scholar] [CrossRef]
  54. Cerda-Flores, S.C.; Rojas-Punzo, A.A.; Nápoles-Rivera, F. Applications of Multi-Objective Optimization to Industrial Processes: A Literature Review. Processes 2022, 10, 133. [Google Scholar] [CrossRef]
  55. Coello, C. Evolutionary multi-objective optimization: Current state and future challenges. In Proceedings of the Fifth International Conference on Hybrid Intelligent Systems (HIS’05), Rio de Janeiro, Brazil, 6–9 November 2005; p. 1. [Google Scholar] [CrossRef]
  56. Zhang, Q.; Li, H. MOEA/D: A Multiobjective Evolutionary Algorithm Based on Decomposition. IEEE Trans. Evol. Comput. 2007, 11, 712–731. [Google Scholar] [CrossRef]
  57. Sutter, T.; Van Parys, B.P.G.; Kuhn, D. A Pareto Dominance Principle for Data-Driven Optimization. Oper. Res. 2024, 72, 1976–1999. [Google Scholar] [CrossRef]
  58. Praveen, V.; Keerthika, D.; Sivapriya, G.; Sarankumar, A.; Bhasker, B. Vehicle Routing Optimization Problem: A Study on Capacitated Vehicle Routing Problem. Mater. Today Proc. 2022, 64, 670–674. [Google Scholar] [CrossRef]
  59. Carchiolo, V.; Dio, F.D.; Longheu, A.; Mangioni, G.; Trapani, N.; Malgeri, M.; Romeo, A. Pick-up &; Deliver in Maintenance Management of Renewable Energy Power Plants. In Proceedings of the 2020 Federated Conference on Computer Science and Information Systems, Sofia, Bulgaria, 6–9 September 2020; Volume 21, pp. 579–585. [Google Scholar] [CrossRef]
  60. Pekel, E. Solving technician routing and scheduling problem using improved particle swarm optimization. Soft Comput. 2020, 24, 19007–19015. [Google Scholar] [CrossRef]
  61. Gao, X.; Peng, D.; Yang, Y.; Huang, F.; Yuan, Y.; Tan, C.; Li, F. Two-stage graph attention networks and Q-learning based maintenance tasks scheduling. Appl. Intell. 2025, 55, 331. [Google Scholar] [CrossRef]
  62. Takai, S.; Esterman, M. Towards a Better Design Team Formation: A Review of Team Effectiveness Models and Possible Measurements of Design-Team Inputs, Processes, and Outputs. In Proceedings of the ASME 2017 International Design Engineering Technical Conferences and Computers and Information in Engineering Conference, Cleveland, OH, USA, 6–9 August 2017. [Google Scholar] [CrossRef]
  63. Beauchamp, M.R.; McEwan, D.; Waldhauser, K.J. Team building: Conceptual, methodological, and applied considerations. Curr. Opin. Psychol. 2017, 16, 114–117. [Google Scholar] [CrossRef]
  64. Selvarajah, K.; Zadeh, P.M.; Kobti, Z.; Palanichamy, Y.; Kargar, M. A unified framework for effective team formation in social networks. Expert Syst. Appl. 2021, 177, 114886. [Google Scholar] [CrossRef]
  65. Yasmine, A.; Yassine, O.; Farouk, Y.; Hicham, C. Workload balancing for the nurse scheduling problem: A real-world case study from a French hospital. Socio-Econ. Plan. Sci. 2024, 95, 102046. [Google Scholar] [CrossRef]
  66. Szwarc, E.; Golińska-Dawson, P.; Bocewicz, G.; Banaszak, Z. Robust Scheduling of Multi-Skilled Workforce Allocation: Job Rotation Approach. Electronics 2024, 13, 392. [Google Scholar] [CrossRef]
  67. Bronicki, J.; Nowak, P. Standard and RL-Controled Tabu Search Algorithms Comparison in Capacitated Vehicle Routing Problem Solving. In Advances in Dependable Systems and Networks; Springer Nature Switzerland: Cham, Switzerland, 2025; pp. 32–40. [Google Scholar] [CrossRef]
  68. Eltoukhy, A.E.E.; Hashim, H.A.; Hussein, M.; Khan, W.A.; Zayed, T. Sustainable vehicle route planning under uncertainty for modular integrated construction: Multi-trip time-dependent VRP with time windows and data analytics. Ann. Oper. Res. 2025, 348, 863–898. [Google Scholar] [CrossRef]
  69. Lv, H.; Liu, R.; Li, J. A multitasking ant system for multi-depot pick-up and delivery location routing problem with time window. Complex Intell. Syst. 2025, 11, 159. [Google Scholar] [CrossRef]
  70. Vargas-Quintero, A.; Morillo-Torres, D.; Escobar, J.W. Two-stage linear stochastic programming formulations for the Stochastic Vehicle Routing Problem with Backhauls and Time Windows. Int. J. Syst. Sci. Oper. Logist. 2025, 12, 2451223. [Google Scholar] [CrossRef]
  71. Souleymane, B.; Oussama, D.; Fatima Ezzahra, A.; Fouad, R. A Time Window Assignment Strategy for Dynamic Vehicle Routing Problem. Transp. Res. Procedia 2025, 84, 169–176. [Google Scholar] [CrossRef]
  72. Yu, X.; He, C. An Improved Large Neighborhood Search Algorithm for the Comprehensive Container Drayage Problem with Diverse Transport Requests. Appl. Sci. 2025, 15, 5937. [Google Scholar] [CrossRef]
  73. Alagumathi, M.; Thangavelu, S. A Multi-objective Evolutionary Algorithm Based on Decomposition—Dynamic Resource Allocation with Mixture Model. In Advances in Data-Driven Computing and Intelligent Systems; Springer Nature Singapore: Singapore, 2024; pp. 457–469. [Google Scholar] [CrossRef]
  74. Pon Ragothama Priya, P.; Baskar, S.; Tamil Selvi, S.; Babulal, C.K. Optimal Allocation of Hybrid Renewable Distributed Generation with Battery Energy Storage System Using MOEA/D-DRA Algorithm. Int. Trans. Electr. Energy Syst. 2023, 2023, 1–18. [Google Scholar] [CrossRef]
  75. Chen, Y.; Wei, J.; Luo, T.; Zhou, J. Mcaaco: A multi-objective strategy heuristic search algorithm for solving capacitated vehicle routing problems. Complex Intell. Syst. 2025, 11, 211. [Google Scholar] [CrossRef]
  76. Wang, L.; Song, C.; Sun, Y.; Lu, C.; Chen, Q. A Neural Multi-Objective Capacitated Vehicle Routing Optimization Algorithm Based on Preference Adjustment. Electronics 2023, 12, 4167. [Google Scholar] [CrossRef]
  77. Vombatkere, K.; Gionis, A.; Terzi, E. Forming coordinated teams that balance task coverage and expert workload. Data Min. Knowl. Discov. 2025, 39, 19. [Google Scholar] [CrossRef]
  78. Anagnostopoulos, A.; Becchetti, L.; Castillo, C.; Gionis, A.; Leonardi, S. Online team formation in social networks. In Proceedings of the WWW 2012: 21st World Wide Web Conference 2012, Lyon, France, 16–20 April 2012; pp. 839–848. [Google Scholar] [CrossRef]
  79. Chen, L.; Bai, Q. Optimization in Decision Making in Infrastructure Asset Management: A Review. Appl. Sci. 2019, 9, 1380. [Google Scholar] [CrossRef]
  80. Munir, Y.; Umer, Q.; Faheem, M.; Akram, S.; Jaffar, A. Developer Recommendation and Team Formation in Collaborative Crowdsourcing Platforms. IEEE Access 2025, 13, 63170–63185. [Google Scholar] [CrossRef]
  81. Blanco-Fernández, D.; Leitner, S.; Rausch, A. Interactions between dynamic team composition and coordination: An agent-based modeling approach. Rev. Manag. Sci. 2024, 19, 1–37. [Google Scholar] [CrossRef]
  82. Eftekhar, M.; Ronaghi, F.; Saberi, A. Team Formation Dynamics: A Study Using Online Learning Data. In Proceedings of the 2015 ACM on Conference on Online Social Networks, COSN’15, Palo Alto, CA, USA, 2–3 November 2015; pp. 257–267. [Google Scholar] [CrossRef]
  83. Lv, B.; Jiang, J.; Wu, L.; Zhao, H. Team formation in large organizations: A deep reinforcement learning approach. Decis. Support Syst. 2024, 187, 114343. [Google Scholar] [CrossRef]
  84. Merizalde, Y.; Hernández-Callejo, L.; Duque-Perez, O.; Alonso-Gómez, V. Maintenance Models Applied to Wind Turbines. A Comprehensive Overview. Energies 2019, 12, 225. [Google Scholar] [CrossRef]
  85. Wang, T.; Hu, G.; Cho, S.; Tan, S.W.; Chiang, K.L. A reliability-centered maintenance process for equipment in distribution grids based on extended virtual age model. Energy 2025, 328, 135998. [Google Scholar] [CrossRef]
  86. Zhou, J.; Zhang, M.; Wu, S. Multi-Objective Vehicle Routing Problem for Waste Classification and Collection with Sustainable Concerns: The Case of Shanghai City. Sustainability 2022, 14, 11498. [Google Scholar] [CrossRef]
  87. Agudelo Zapata, A.A.; Suarez, E.G.; Villegas Florez, J.A. Application of VRP Techniques to the Allocation of Resources in an Electric Power Distribution System. J. Comput. Sci. 2019, 35, 102–109. [Google Scholar] [CrossRef]
  88. Ssekajja, G. The inter-community domain of commons governance: A framework for analyzing collaborative management of shared environmental resources. J. Environ. Manag. 2025, 389, 126086. [Google Scholar] [CrossRef]
  89. Fan, S.; Wang, S.; Mbanyele, W.; Zhang, Y. Dual-Path Model of Team Communication and Shared Mental Models in Entrepreneurial Education: Enhancing Team Efficacy in Higher Education Using PLS-SEM. Systems 2025, 13, 536. [Google Scholar] [CrossRef]
  90. Han, J.; Watanabe, S. A New Hyper-Heuristic Multi-Objective Optimisation Approach Based on MOEA/D Framework. Biomimetics 2023, 8, 521. [Google Scholar] [CrossRef]
  91. Zheng, W.; Tan, Y.; Fang, X.; Li, S. An Improved MOEA/D with Optimal DE Schemes for Many-Objective Optimization Problems. Algorithms 2017, 10, 86. [Google Scholar] [CrossRef]
  92. Babor, M.; Pedersen, L.; Kidmose, U.; Paquet-Durand, O.; Hitzmann, B. Application of Non-Dominated Sorting Genetic Algorithm (NSGA-II) to Increase the Efficiency of Bakery Production: A Case Study. Processes 2022, 10, 1623. [Google Scholar] [CrossRef]
  93. Zou, Y.; Chen, Z.; Zhu, S.; Li, Y. NSGA-III-Based Production Scheduling Optimization Algorithm for Pressure Sensor Calibration Workshop. Electronics 2024, 13, 2844. [Google Scholar] [CrossRef]
  94. Sinha, A.; Malo, P.; Deb, K. A Review on Bilevel Optimization: From Classical to Evolutionary Approaches and Applications. IEEE Trans. Evol. Comput. 2018, 22, 276–295. [Google Scholar] [CrossRef]
  95. Colson, B.; Marcotte, P.; Savard, G. An overview of bilevel optimization. Ann. Oper. Res. 2007, 153, 235–256. [Google Scholar] [CrossRef]
  96. Camacho-Vallejo, J.F.; Corpus, C.; Villegas, J.G. Metaheuristics for bilevel optimization: A comprehensive review. Comput. Oper. Res. 2024, 161, 106410. [Google Scholar] [CrossRef]
  97. Deb, K.; Sinha, A. An Efficient and Accurate Solution Methodology for Bilevel Multi-Objective Programming Problems Using a Hybrid Evolutionary-Local-Search Algorithm. Evol. Comput. 2010, 18, 403–449. [Google Scholar] [CrossRef]
  98. Talbi, E.-G. Metaheuristics for Bi-Level Optimization; Springer: Berlin/Heidelberg, Germany, 2013. [Google Scholar] [CrossRef]
  99. Chen, T.Y.; Chen, W.N.; Hao, J.K.; Wang, Y.; Zhang, J. Multi-Agent Evolution Strategy with Cooperative and Cumulative Step Adaptation for Black-Box Distributed Optimization. IEEE Trans. Evol. Comput. 2025; Early Access. [Google Scholar] [CrossRef]
  100. Yin, S.; Xiang, Z. Adaptive operator selection with dueling deep Q-network for evolutionary multi-objective optimization. Neurocomputing 2024, 581, 127491. [Google Scholar] [CrossRef]
  101. Sun, J.; Yu, S.; Chu, J.; Liu, R. Maritime Rescue Task Allocation and Sequencing Using MOEA/D with Adaptive Operators and Idle-Time-Aware Decoding Strategy. J. Mar. Sci. Eng. 2025, 13, 1518. [Google Scholar] [CrossRef]
  102. Zheng, W.; Liu, Y.; Doerr, B. A First Mathematical Runtime Analysis of the Non-dominated Sorting Genetic Algorithm II (NSGA-II). Proc. AAAI Conf. Artif. Intell. 2022, 36, 10408–10416. [Google Scholar] [CrossRef]
  103. Ishibuchi, H.; Sakane, Y.; Tsukamoto, N.; Nojima, Y. Evolutionary many-objective optimization by NSGA-II and MOEA/D with large populations. In Proceedings of the 2009 IEEE International Conference on Systems, Man and Cybernetics, San Antonio, TX, USA, 11–14 October 2009; pp. 1758–1763. [Google Scholar] [CrossRef]
  104. Zhang, Z.; Wu, F.; Wu, A. Research on Multi-Objective Process Parameter Optimization Method in Hard Turning Based on an Improved NSGA-II Algorithm. Processes 2024, 12, 950. [Google Scholar] [CrossRef]
  105. Amador-Larrea, S.; Quiroz-Castellanos, M.; Ramos-Figueroa, O. An Experimental Study of Strategies to Control Diversity in Grouping Mutation Operators: An Improvement to the Adaptive Mutation Operator for the GGA-CGT for the Bin Packing Problem. Math. Comput. Appl. 2025, 30, 31. [Google Scholar] [CrossRef]
  106. Cao, T.S.; Nguyen, T.T.T.; Nguyen, V.S.; Truong, V.H.; Nguyen, H.H. Performance of Six Metaheuristic Algorithms for Multi-Objective Optimization of Nonlinear Inelastic Steel Trusses. Buildings 2023, 13, 868. [Google Scholar] [CrossRef]
  107. Pang, L.M.; Ishibuchi, H.; Shang, K. NSGA-II With Simple Modification Works Well on a Wide Variety of Many-Objective Problems. IEEE Access 2020, 8, 190240–190250. [Google Scholar] [CrossRef]
  108. Mei, Z.; Lu, Y.; Lv, L. Research on Multi-Objective Low-Carbon Flexible Job Shop Scheduling Based on Improved NSGA-II. Machines 2024, 12, 590. [Google Scholar] [CrossRef]
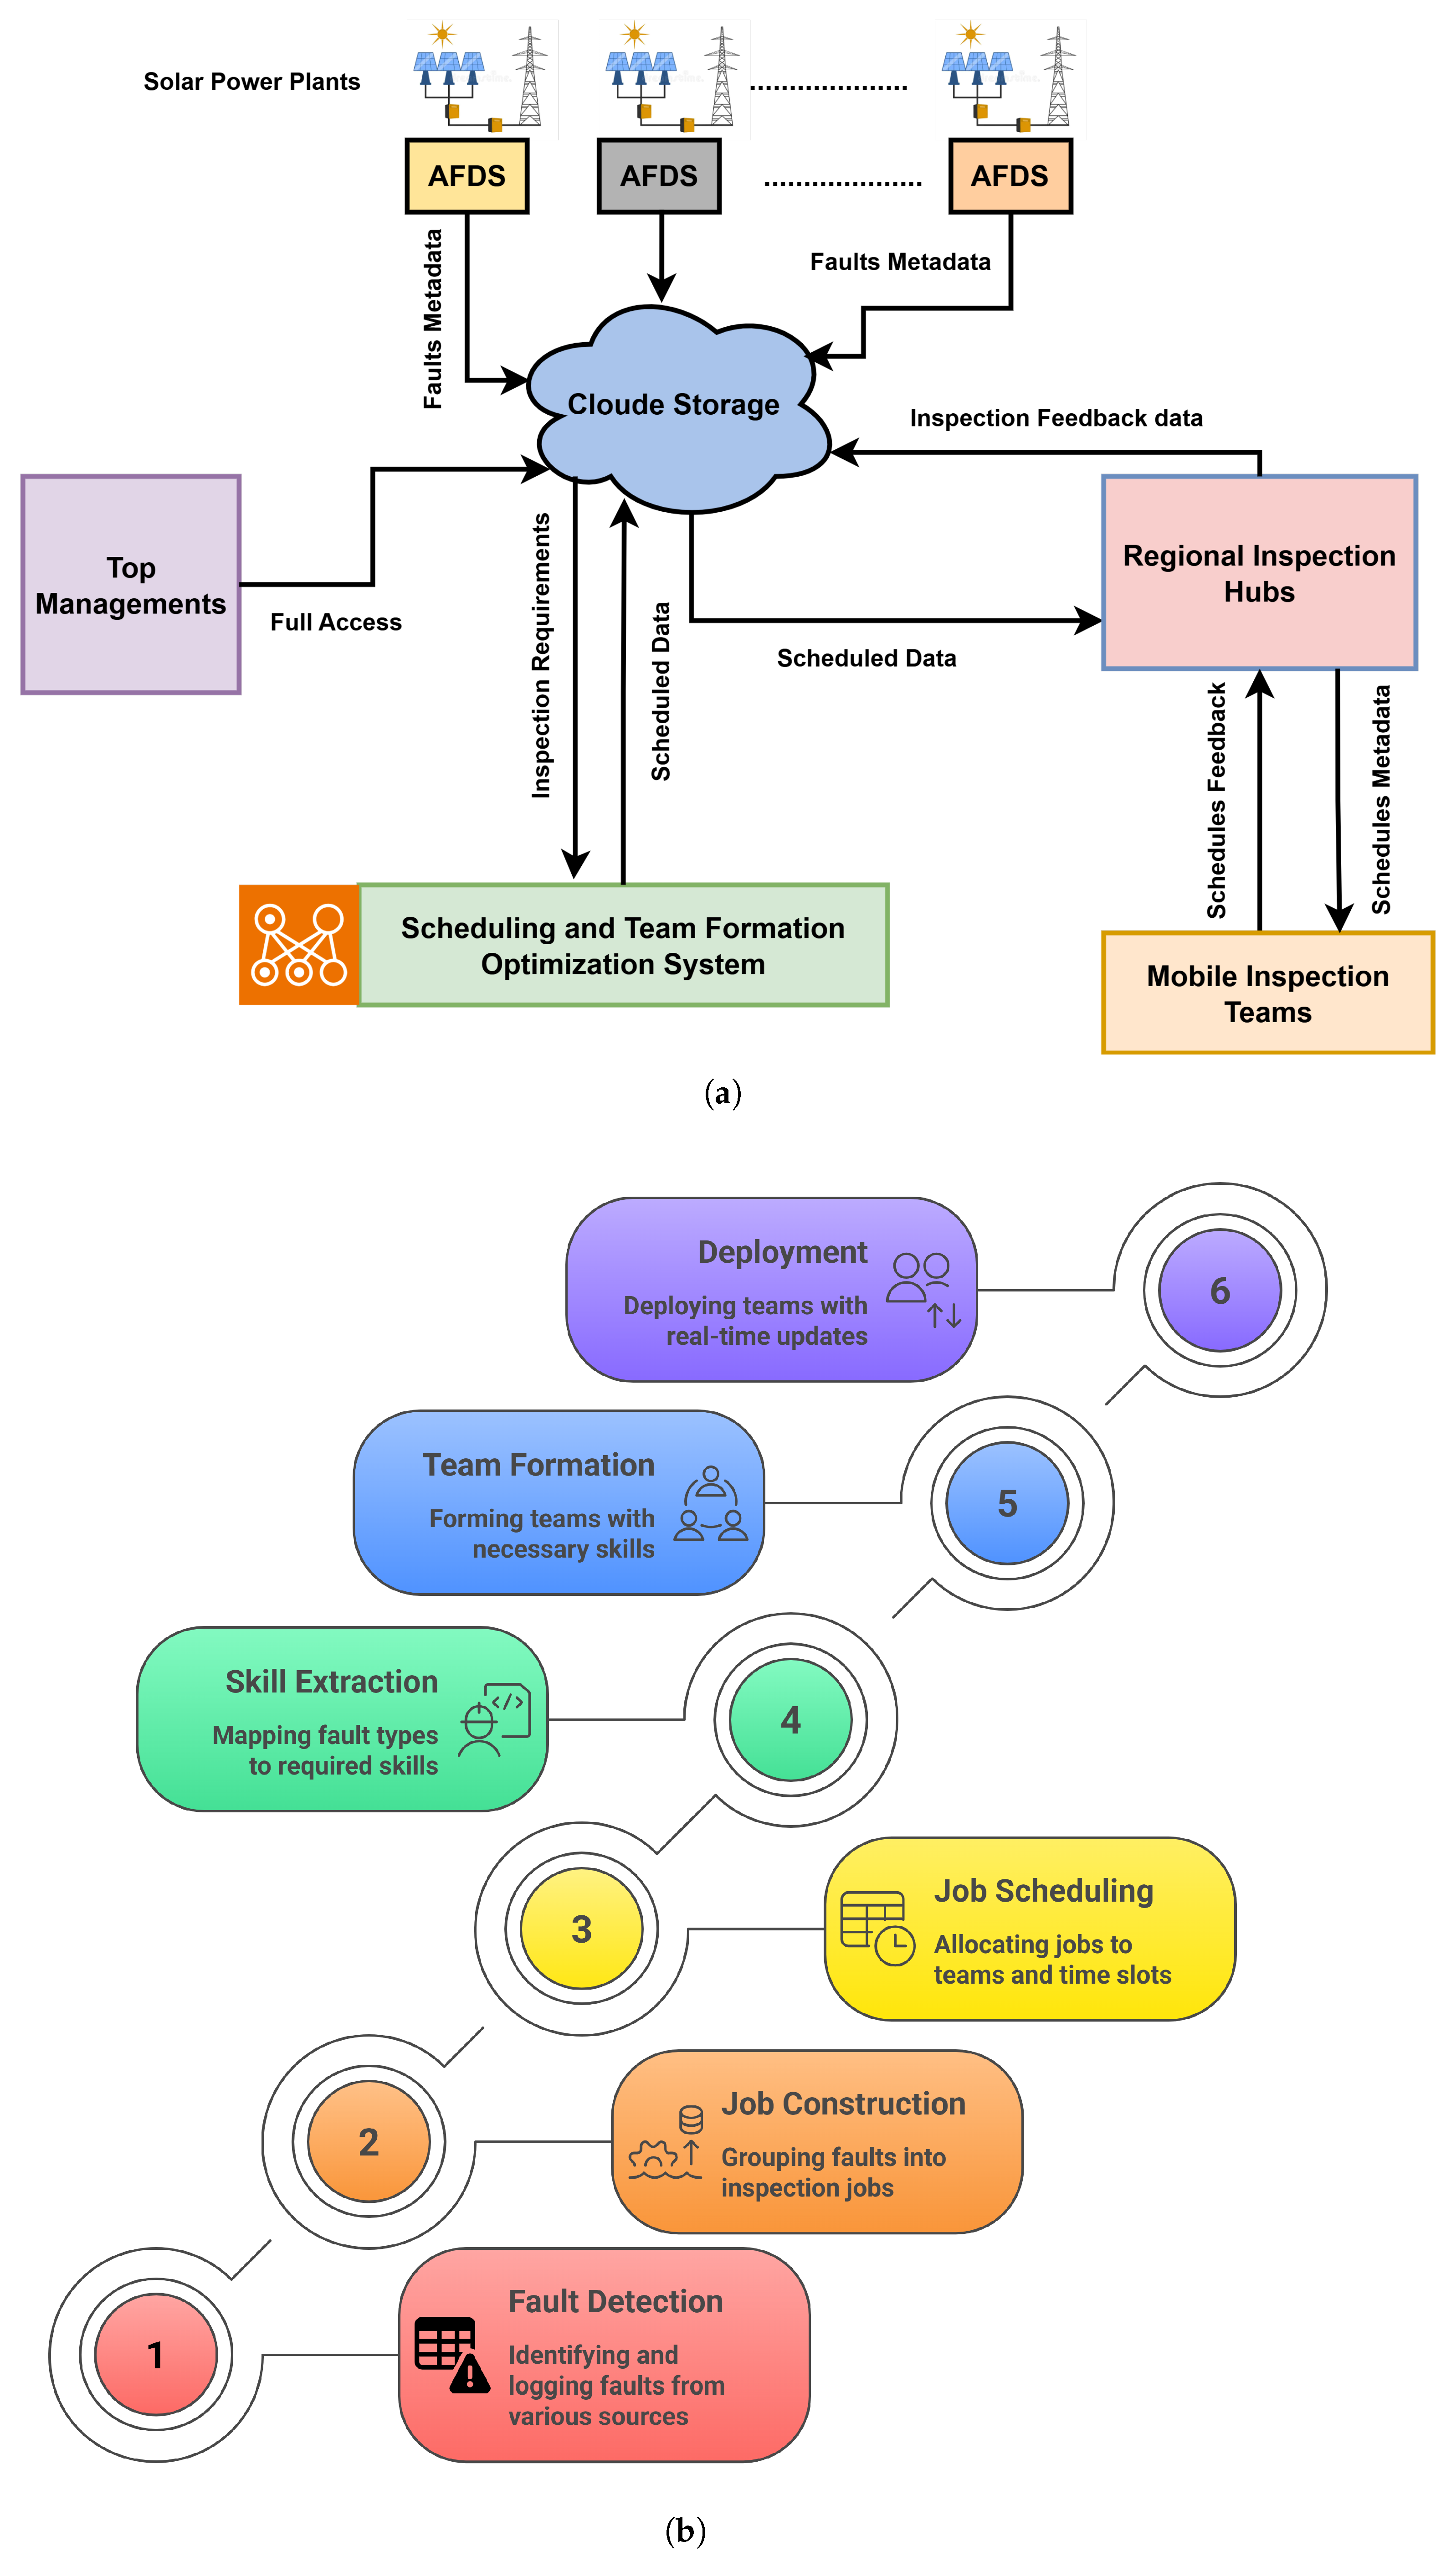
Figure 1. (a) System framework. (b) Detailed data flow pipeline. Integrated system framework and data flow for distributed solar infrastructure inspection scheduling and team formation.
Systems 13 00822 g001
Figure 2. Comparative performance analysis of multi-objective optimization algorithms across seven test cases using normalized performance metrics. Each subplot displays the mean performance with standard deviation bands for all evaluated algorithms. (a) Normalized HV across test cases. Higher values indicate better convergence and coverage. (b) Normalized IGD across test cases. Lower values represent superior convergence quality. (c) Normalized Spacing across test cases. Lower values indicate more uniform solution distribution. (d) Normalized Spreading across test cases. Higher values provide greater solution diversity.
Systems 13 00822 g002
Figure 3. (a) TTD (km). (b) TT (hours). (c) WLI. (d) PWT (hours). (e) SI. Comparative performance analysis of multi-objective scheduling algorithms across five conflicting objectives for Case 1. Box plots display median values (orange lines), interquartile ranges (boxes), whiskers (1.5 × IQR), and outliers (circles) for nine algorithmic variants: six MOEA/D decomposition strategies and three NSGA variants.
Systems 13 00822 g003
Figure 4. (a) TTD (km). (b) TT (hours). (c) WLI. (d) PWT (hours). (e) SI. Comparative performance analysis of multi-objective scheduling algorithms across five conflicting objectives for Case 2. Box plots display median values (orange lines), interquartile ranges (boxes), whiskers (1.5 × IQR), and outliers (circles) for nine algorithmic variants: six MOEA/D decomposition strategies and three NSGA variants.
Systems 13 00822 g004
Figure 5. (a) TTD (km). (b) TT (hours). (c) WLI. (d) PWT (hours). (e) SI. Comparative performance analysis of multi-objective scheduling algorithms across five conflicting objectives for Case 3. Box plots display median values (orange lines), interquartile ranges (boxes), whiskers (1.5 × IQR), and outliers (circles) for nine algorithmic variants: six MOEA/D decomposition strategies and three NSGA variants.
Systems 13 00822 g005
Figure 6. (a) TTD (km). (b) TT (hours). (c) WLI. (d) PWT (hours). (e) SI. Comparative performance analysis of multi-objective scheduling algorithms across five conflicting objectives for Case 4. Box plots display median values (orange lines), interquartile ranges (boxes), whiskers (1.5 × IQR), and outliers (circles) for nine algorithmic variants: six MOEA/D decomposition strategies and three NSGA variants.
Systems 13 00822 g006
Figure 7. (a) TTD (km). (b) TT (hours). (c) WLI. (d) PWT (hours). (e) SI. Comparative performance analysis of multi-objective scheduling algorithms across five conflicting objectives for Case 5. Box plots display median values (orange lines), interquartile ranges (boxes), whiskers (1.5 × IQR), and outliers (circles) for nine algorithmic variants: six MOEA/D decomposition strategies and three NSGA variants.
Systems 13 00822 g007
Figure 8. (a) TTD (km). (b) TT (hours). (c) WLI. (d) PWT (hours). (e) SI. Comparative performance analysis of multi-objective scheduling algorithms across five conflicting objectives for Case 6. Box plots display median values (orange lines), interquartile ranges (boxes), whiskers (1.5 × IQR), and outliers (circles) for nine algorithmic variants: six MOEA/D decomposition strategies and three NSGA variants.
Systems 13 00822 g008
Figure 9. (a) TTD (km). (b) TT (hours). (c) WLI. (d) PWT (hours). (e) SI. Comparative performance analysis of multi-objective scheduling algorithms across five conflicting objectives for Case 7. Box plots display median values (orange lines), interquartile ranges (boxes), whiskers (1.5 × IQR), and outliers (circles) for nine algorithmic variants: six MOEA/D decomposition strategies and three NSGA variants.
Systems 13 00822 g009
Figure 10. (a) Total travel distance (TTD) in kilometers. (b) Total tardiness (TT) in hours. (c) Workload imbalance (WLI). (d) Priority-weighted tardiness (PWT) in hours. (e) Scheduling imbalance (SI). Convergence analysis of nine multi-objective evolutionary algorithms across five objectives in inspection scheduling optimization for Case 1. Classical MOEA/D demonstrates superior convergence across four objectives, while the WLI objective exhibits high variance and difficult convergence behavior. Shaded areas represent confidence intervals over multiple runs.
Systems 13 00822 g010aSystems 13 00822 g010b
Figure 11. Heatmap of p-values from the Nemenyi post hoc test comparing the performance of multi-objective optimization algorithms. Each cell represents the p-value of a pairwise comparison between algorithms. Darker shades indicate lower p-values, suggesting statistically significant performance differences. A p-value below 0.05 (dark blue) denotes a significant difference in performance at the 95% confidence level.
Systems 13 00822 g011
Figure 12. (a) Case 1 Objective 1. (b) Case 1 Objective 2. (c) Case 2 Objective 1. (d) Case 2 Objective 2. Comparative performance analysis of multi-objective team formation algorithms across two conflicting objectives for Case 1 and Case 2. Box plots display median values (orange lines), interquartile ranges (boxes), whiskers (1.5 × IQR), and outliers (circles) for MOEA/D, Base NSGA-II, Proposed NSGA-II, and SPEA2.
Systems 13 00822 g012
Figure 13. (a) Case 3 Objective 1. (b) Case 3 Objective 2. (c) Case 4 Objective 1. (d) Case 4 Objective 2. Comparative performance analysis of multi-objective team formation algorithms across two conflicting objectives for Case 3 and Case 4. Box plots display median values (orange lines), interquartile ranges (boxes), whiskers (1.5 × IQR), and outliers (circles) for MOEA/D, Base NSGA-II, Proposed NSGA-II, and SPEA2.
Systems 13 00822 g013
Figure 14. (a) Case 5 Objective 1. (b) Case 5 Objective 2. (c) Case 6 Objective 1. (d) Case 6 Objective 2. Comparative performance analysis of multi-objective team formation algorithms across two conflicting objectives for Case 5 and Case 6. Box plots display median values (orange lines), interquartile ranges (boxes), whiskers (1.5 × IQR), and outliers (circles) for MOEA/D, Base NSGA-II, Proposed NSGA-II, and SPEA2.
Systems 13 00822 g014
Figure 15. (a) Case 7 Objective 1. (b) Case 7 Objective 2. Comparative performance analysis of multi-objective team formation algorithms across two conflicting objectives for Case 7. Box plots display median values (orange lines), interquartile ranges (boxes), whiskers (1.5 × IQR), and outliers (circles) for MOEA/D, Base NSGA-II, Proposed NSGA-II, and SPEA2.
Systems 13 00822 g015
Figure 16. (a) Convergence behavior with respect to hypervolume (HV). (b) Convergence behavior with respect to spacing. The HV curve illustrates the convergence toward the true Pareto front, while the spacing curve reflects the uniformity of the solution distribution across generations.
Systems 13 00822 g016
Figure 17. Runtime performance comparison of team formation algorithms across seven test cases.
Systems 13 00822 g017
Figure 18. (a) Hypervolume (HV) values increase with population size, reaching peak performance around 700 individuals before plateauing. Shaded regions indicate standard deviation. (b) Inverted generational distance (IGD) decreases with larger populations, showing steepest improvement between 100 and 300 individuals and stabilizing around 400–500. Standard deviation bands are displayed. Performance metrics for multi-objective optimization algorithms across different population sizes for a fixed benchmark problem (Case 1).
Systems 13 00822 g018
Figure 19. (a) Proposed NSGA-II population size vs. total team size. (b) Proposed NSGA-II population size vs. total interconnection cost. Performance analysis of the Hybrid NSGA-II algorithm across different population sizes for a two-objective team formation optimization problem on a fixed benchmark problem (Case 1).
Systems 13 00822 g019aSystems 13 00822 g019b
Table 1. Summary of heuristic and metaheuristic optimization algorithms for dynamic inspection scheduling.
AlgorithmCategoryOptimization Strategy
Distance MinimizationHeuristicMinimizes total travel distance
Workload BalancingHeuristicDistributes workload evenly among teams
Priority BasedHeuristicSchedules tasks based on priority levels
Hybrid Multi-ObjectiveHeuristicCombines multiple heuristic rules for trade-offs
Earliest Deadline FirstHeuristicSchedules tasks according to earliest deadlines
HMOEA/D-ASDecomposition-based Hybrid MOEAAdaptive scalarization + hybrid variation operators
PMOEA/D-ESDecomposition-based MOEAPBI scalarization + enhanced neighborhood search
TMOEA/D-DPDecomposition-based MOEATchebycheff scalarization with dynamic parameter control
AMOEA/D-PSAdaptive MOEASelf-tuning of parameters during search
LMOEA/D-ENScalable MOEALarge population + extended neighborhood scope
IMOEA/D-MSHybrid MOEAMulti-strategy operators (e.g., SBX, DE, mutation)
MOEA/DDecomposition-based MOEAScalar subproblem decomposition
NSGA-IIPareto-based MOEAFast non-dominated sorting + crowding distance
NSGA-IIIReference-point MOEAReference-point based diversity preservation
Table 3. Case configuration details.
Case
Number
Numbers
of Jobs
Average Number of Faults
Allocated for Each Team
Average Number of Skills
Required for Each Team
Case 115512.7501.3
Case 217514.3438.6
Case 320517.3499.4
Case 425520.8502.6
Case 527522.4505.6
Case 630524.0563.4
Case 735528.3624.2
Table 4. Algorithm parameters.
AlgorithmPopulation
Size
Max.
Generation
Mutation
Rate
Crossover
Rate
Others
Job SchedulingBasic MOEAD2001000.10.9Neighbor Size = 20
Replacement Limit = 2
MOEAD Variants2001000.10.9Neighbor Size = 20
Replacement Limit = 2
No. Division = 5
Theta = 0.5
Delta = 0.9
NSGA-II2001000.10.9Tournament Size = 2
Elite Size = 5
NSGA-III2001000.1Tournament Size = 2
No. Division = 5
Team FormationMOEAD2002000.10.9
HMOO-AOS
(Proposed)
2002000.10.9
NSGA-II
(Base)
2002000.10.9
SPEA-22002000.10.9
Table 5. Algorithms comparisons based on objectives collected form Pareto fronts for Case 1 to Case 7.
AlgorithmObjectiveCase 1Case 2Case 3Case 4Case 5Case 6Case 7
AMOEAD-PSTotal Distance Travel60,214.56 ± 3794.5171,564.38 ± 3888.8386,750.55 ± 3161.93111,534.24 ± 3503.28121,097.77 ± 4409.33135,190.42 ± 7533.07160,685.94 ± 4902.91
Total Tardiness (Hours)7142.04 ± 828.2210,805.37 ± 1003.6718,174.38 ± 975.3534,539.95 ± 1346.4041,477.07 ± 1807.2853,859.54 ± 3759.4279,965.45 ± 3459.32
Job Load (std)0.83 ± 0.520.73 ± 0.230.84 ± 0.570.77 ± 0.250.79 ± 0.270.79 ± 0.240.82 ± 0.31
Priority Weighted Tardiness (Hours)28,569.02 ± 3148.4343,441.84 ± 3939.2173,197.56 ± 3830.47138,672.21 ± 5202.42160,668.60 ± 6943.44208,567.92 ± 14,167.74311,668.86 ± 13,214.71
Station Days (std)1.74 ± 0.461.80 ± 0.451.91 ± 0.482.17 ± 0.542.33 ± 0.592.35 ± 0.612.50 ± 0.59
Classical-MOEADTotal Distance Travel47,429.89 ± 3105.7655,587.39 ± 3239.7870,907.73 ± 3025.1093,758.68 ± 3903.39104,060.76 ± 3877.92118,460.16 ± 4499.31141,494.27 ± 4548.28
Total Tardiness (Hours)4627.84 ± 466.357297.01 ± 545.3913,499.30 ± 736.3926,966.35 ± 1017.4933,655.39 ± 1166.5644,887.10 ± 1468.5867,852.85 ± 1987.73
Job Load (std)3.72 ± 0.904.02 ± 0.993.87 ± 0.924.23 ± 1.114.25 ± 1.034.48 ± 1.124.64 ± 1.18
Priority Weighted Tardiness (Hours)18,924.48 ± 1810.5329,976.09 ± 2213.9755,093.28 ± 2934.64109,564.91 ± 4009.22131,295.55 ± 4518.87174,867.58 ± 5568.85266,333.77 ± 7536.64
Station Days (std)1.83 ± 0.482.03 ± 0.512.18 ± 0.592.57 ± 0.762.71 ± 0.712.89 ± 0.783.06 ± 0.86
DMTotal Distance Travel85,636.44 ± 096,598.42 ± 0111,864.17 ± 0136,213.03 ± 0145,582.12 ± 0160,531.82 ± 0184,364.74 ± 0
Total Tardiness (Hours)244,130.40 ± 0313,318.44 ± 0433,433.11 ± 0673,661.94 ± 0783,481.31 ± 0964,400.06 ± 01,308,375.14 ± 0
Job Load (std)46.50 ± 052.50 ± 061.50 ± 076.50 ± 082.50 ± 091.50 ± 0106.50 ± 0
Priority Weighted Tardiness (Hours)864,597.26 ± 01,135,409.75 ± 01,596,836.88 ± 02,531,486.67 ± 02,873,370.76 ± 03,547,763.55 ± 04,875,754.69 ± 0
Station Days (std)42.00 ± 047.40 ± 055.20 ± 068.10 ± 072.90 ± 081.00 ± 093.90 ± 0
EDFTotal Distance Travel85,193.89 ± 096,288.34 ± 0111,805.61 ± 0142,186.04 ± 0154,210.40 ± 0169,690.14 ± 0193,302.60 ± 0
Total Tardiness (Hours)12,114.60 ± 017,079.91 ± 026,466.80 ± 046,339.56 ± 055,330.55 ± 070,624.48 ± 0100,947.77 ± 0
Job Load (std)0.50 ± 00.50 ± 00.50 ± 00.50 ± 00.50 ± 00.50 ± 00.50 ± 0
Priority Weighted Tardiness (Hours)47,862.36 ± 068,054.83 ± 0105,419.27 ± 0185,074.42 ± 0214,126.89 ± 0272,464.55 ± 0392,417.27 ± 0
Station Days (std)1.11 ± 01.17 ± 01.40 ± 01.56 ± 01.56 ± 02.05 ± 02.59 ± 0
HMOTotal Distance Travel99,249.80 ± 0110,547.62 ± 0129,953.20 ± 0164,646.29 ± 0177,829.09 ± 0196,533.21 ± 0230,722.09 ± 0
Total Tardiness (Hours)201,424.46 ± 0267,038.78 ± 0382,108.22 ± 0620,640.89 ± 0731,721.49 ± 0915,200.65 ± 01,266,979.50 ± 0
Job Load (std)40.22 ± 046.21 ± 055.21 ± 070.20 ± 076.19 ± 085.19 ± 0100.19 ± 0
Priority Weighted Tardiness (Hours)715,631.78 ± 0972,338.15 ± 01,414,351.72 ± 02,342,499.19 ± 02,688,523.38 ± 03,372,558.80 ± 04,731,033.56 ± 0
Station Days (std)38.94 ± 044.33 ± 053.03 ± 067.72 ± 073.42 ± 081.52 ± 095.02 ± 0
HMOEAD-ASTotal Distance Travel62,069.14 ± 5157.7773,751.45 ± 3907.3788,126.94 ± 4245.25113,185.19 ± 6398.13123,078.10 ± 5984.80137,519.02 ± 7309.69161,416.52 ± 7192.54
Total Tardiness (Hours)7273.28 ± 1209.1911,322.12 ± 889.2218,702 ± 1551.1734,825.89 ± 2543.5542,480.70 ± 2708.0354,925.44 ± 3746.4580,969.78 ± 4427.12
Job Load (std)1.20 ± 0.811.09 ± 0.741.06 ± 0.690.97 ± 0.380.99 ± 0.520.98 ± 0.450.98 ± 0.59
Priority Weighted Tardiness (Hours)29,079.65 ± 4709.2645,508.63 ± 3427.3475,182.57 ± 5953.68139,840.03 ± 9945.50164,721.96 ± 10,148.19212,651.54 ± 14,407.95315,930.77 ± 16,736.02
Station Days (std)1.73 ± 0.451.86 ± 0.472.05 ± 0.512.12 ± 0.492.30 ± 0.592.43 ± 0.612.65 ± 0.67
IMOEAD-MSTotal Distance Travel64,168.32 ± 2970.3273,884.61 ± 3721.5388,802.62 ± 3778.71114,531.94 ± 4131.77124,476.66 ± 4198.67140,964.09 ± 4265.54164,082.78 ± 4708.81
Total Tardiness (Hours)7813.73 ± 668.9311,623.70 ± 903.4718,917.25 ± 1120.2435,603.96 ± 1609.1643,132.39 ± 1734.2656,580.73 ± 1673.1382,727.12 ± 2175.08
Job Load (std)0.97 ± 0.460.94 ± 0.310.94 ± 0.340.93 ± 0.270.91 ± 0.270.97 ± 0.480.89 ± 0.27
Priority Weighted Tardiness (Hours)31,123.29 ± 2659.6546,672.89 ± 3496.4575,937.53 ± 4280.50142,932.42 ± 6178.19167,102.51 ± 6595.22218,889.95 ± 6267.20322,491.06 ± 8338.28
Station Days (std)1.69 ± 0.391.86 ± 0.431.98 ± 0.502.17 ± 0.552.24 ± 0.552.33 ± 0.592.58 ± 0.67
LMOEAD-ENTotal Distance Travel62,730.87 ± 4621.4272,730.98 ± 4360.2687,957.41 ± 4066.43112,578.11 ± 5865.97122,078.90 ± 6920.10137,730.61 ± 5636.44162,305.77 ± 7743.63
Total Tardiness (Hours)7569.80 ± 929.1111,414.41 ± 993.1118,819.18 ± 1388.0834,973.46 ± 2386.3042,174.44 ± 2980.7855,345.27 ± 2778.2381,059.51 ± 4681.90
Job Load (std)1.07 ± 0.601.09 ± 0.651.22 ± 0.990.97 ± 0.371 ± 0.541.02 ± 0.551.01 ± 0.55
Priority Weighted Tardiness (Hours)30,233.11 ± 3575.4845,849.96 ± 3898.1275,641.57 ± 5308.92140,321.12 ± 9500.82163,420.18 ± 11,444.04214,131.85 ± 10,554.80315,957.51 ± 17,757.29
Station Days (std)1.71 ± 0.451.88 ± 0.461.99 ± 0.572.23 ± 0.552.35 ± 0.572.46 ± 0.652.73 ± 0.70
NSGA-IITotal Distance Travel77,647.53 ± 5716.8788,934.42 ± 5873.15102,838.48 ± 6769131,195.67 ± 8749.76142,609.63 ± 9347.82156,810.84 ± 9262.29182,134.01 ± 9657.12
Total Tardiness (Hours)13,397.55 ± 2734.5318,300.59 ± 2301.0728,378.21 ± 3008.8349,192.22 ± 4307.3357,011.36 ± 3921.2973,903.09 ± 6392.49108,071.42 ± 15,267.13
Job Load (std)4.58 ± 2.764.97 ± 2.705.55 ± 3.106.63 ± 3.876.06 ± 3.447.20 ± 4.368.84 ± 6.40
Priority Weighted Tardiness (Hours)52,181.42 ± 10,783.1871,723.79 ± 8680.47111,180.28 ± 10,888.26194,877.57 ± 16,415.16218,825.19 ± 14,414.5928,3479.77 ± 24,175.24418,379.93 ± 58,269.42
Station Days (std)3.92 ± 2.254.28 ± 2.124.93 ± 2.485.78 ± 3.165.38 ± 2.766.31 ± 3.457.75 ± 5.13
NSGA-IIITotal Distance Travel64,179.73 ± 5810.1072,900.47 ± 5852.5287,345.50 ± 6620.55110,459.11 ± 7108.17121,356.41 ± 8188.82135,493.99 ± 8275.31159,071.89 ± 8411.66
Total Tardiness (Hours)8025.76 ± 1257.3911,617.28 ± 1489.5019,185.52 ± 2139.2235,658.22 ± 3009.5343,562.55 ± 3832.7756,678.67 ± 4096.2883,471.01 ± 4927.85
Job Load (std)1.87 ± 0.792.02 ± 0.872.17 ± 0.932.43 ± 0.992.47 ± 1.082.52 ± 1.052.77 ± 1.14
Priority Weighted Tardiness (Hours)32,067.70 ± 4782.5146,701.08 ± 5736.4677,089.03 ± 8217.13143,184.54 ± 11,594.11168,883.71 ± 14,393.17219,339.34 ± 15,366.82325,480.85 ± 18,578.66
Station Days (std)1.45 ± 0.541.62 ± 0.591.78 ± 0.671.97 ± 0.742.08 ± 0.782.12 ± 0.802.36 ± 0.87
PBTotal Distance Travel85,193.89 ± 096,288.34 ± 0111,805.61 ± 0142,186.04 ± 0154,210.40 ± 0169,690.14 ± 0193,302.60 ± 0
Total Tardiness (Hours)12,114.60 ± 017,079.91 ± 026,466.80 ± 046,339.56 ± 055,330.55 ± 070,624.48 ± 0100,947.77 ± 0
Job Load (std)0.50 ± 00.50 ± 00.50 ± 00.50 ± 00.50 ± 00.50 ± 00.50 ± 0
Priority Weighted Tardiness (Hours)47,862.36 ± 068,054.83 ± 0105,419.27 ± 0185,074.42 ± 0214,126.89 ± 0272,464.55 ± 0392,417.27 ± 0
Station Days (std)1.11 ± 01.17 ± 01.40 ± 01.56 ± 01.56 ± 02.05 ± 02.59 ± 0
PMOEAD-ESTotal Distance Travel62,696.40 ± 3981.1473,931.61 ± 3799.9486,835.12 ± 6012.71112,296.34 ± 6483.35121,931.41 ± 7125.77138,173.25 ± 6344.05162,215.36 ± 7180.61
Total Tardiness (Hours)7628.80 ± 803.6211,438.51 ± 954.8718,498.32 ± 1968.8934,714.13 ± 2722.6042,122.04 ± 3211.8455,569.26 ± 3293.3281,108.98 ± 4402.45
Job Load (std)1.21 ± 0.811.08 ± 0.671.13 ± 0.780.99 ± 0.500.99 ± 0.481.02 ± 0.591.05 ± 0.70
Priority Weighted Tardiness (Hours)30,478.50 ± 3131.0645,864.58 ± 3745.6874,408.44 ± 7680.63139,338.34 ± 10,636.73163,343.13 ± 11,974.92214,821.29 ± 12,552.76316,179.07 ± 16,774.99
Station Days (std)1.78 ± 0.481.84 ± 0.492 ± 0.552.22 ± 0.582.42 ± 0.602.49 ± 0.622.67 ± 0.70
TMOEAD-DPTotal Distance Travel62,201.81 ± 5750.5172,948.29 ± 5657.7286,921.57 ± 4761.33111,464.05 ± 5422.44121,559.17 ± 6145.46137,021.05 ± 6385.76161,319.04 ± 7833.41
Total Tardiness (Hours)7492.65 ± 1110.5811,525.62 ± 1304.9519,038.61 ± 1663.8035,402.34 ± 2491.0642,803.11 ± 3004.3956,142.21 ± 3693.2582,460.16 ± 4864.25
Job Load (std)1.11 ± 0.771.05 ± 0.701.01 ± 0.571.02 ± 0.511.04 ± 0.611.01 ± 0.481.02 ± 0.58
Priority Weighted Tardiness (Hours)29,899.50 ± 4341.1746,299 ± 5086.7776,430.65 ± 6348.45142,059.67 ± 9771.22165,913.89 ± 11,351.88217,302.96 ± 13,975.76321,448.54 ± 18,369.01
Station Days (std)1.80 ± 0.441.93 ± 0.471.98 ± 0.522.20 ± 0.572.37 ± 0.612.48 ± 0.612.55 ± 0.66
WBTotal Distance Travel85,193.89 ± 096,288.34 ± 0111,805.61 ± 0142,186.04 ± 0154,210.40 ± 0169,690.14 ± 0193,302.60 ± 0
Total Tardiness (Hours)12,114.60 ± 017,079.91 ± 026,466.80 ± 046,339.56 ± 055,330.55 ± 070,624.48 ± 0100,947.77 ± 0
Job Load (std)0.50 ± 00.50 ± 00.50 ± 00.50 ± 00.50 ± 00.50 ± 00.50 ± 0
Priority Weighted Tardiness (Hours)47,862.36 ± 068,054.83 ± 0105,419.27 ± 0185,074.42 ± 0214,126.89 ± 0272,464.55 ± 0392,417.27 ± 0
Station Days (std)1.11 ± 01.17 ± 01.40 ± 01.56 ± 01.56 ± 02.05 ± 02.59 ± 0
Table 6. Mean runtime comparison (seconds) of nine multi-objective evolutionary algorithms across seven inspection scheduling cases.
CaseAMOEAD
PS
Classical
MOEAD
HMOEAD
AS
IMOEAD
MS
LMOEAD
EN
NSGA2NSGA3PMOEAD
ES
TMOEAD
DP
1264.51113.87264.92259.76245.87144.361499.07278.40208.59
2294.71125.11293.53288.72273.89155.141679.77309.06237.99
3364.82136.76368.15358.27339.15168.581767.57382.69303.88
4393.52165.50390.72384.94361.46195.121326.71409.21339.30
5346.58176.93346.48343.01320.27209.912153.68362.47299.16
6430.91205.17431.00425.29397.24246.002167.69445.08376.76
7488.38224.99495.20489.68453.29263.872510.93505.94433.51
Table 7. Performance metrics for multiple team formation problem solvers (optimizers).
AlgorithmMetricCase 1Case 2Case 3Case 4Case 5Case 6Case 7
Base NSGA2Hypervolume0.73 ± 0.020.78 ± 0.040.73 ± 0.020.74 ± 0.020.75 ± 0.030.72 ± 0.020.72 ± 0.03
MOEA/DHypervolume0.68 ± 0.020.73 ± 0.040.68 ± 0.020.69 ± 0.020.71 ± 0.020.68 ± 0.020.67 ± 0.03
Pro. NSGA2Hypervolume0.77 ± 0.020.82 ± 0.030.77 ± 0.020.78 ± 0.020.78 ± 0.030.75 ± 0.020.74 ± 0.02
SPEA2Hypervolume0.66 ± 0.020.68 ± 0.030.64 ± 0.010.65 ± 0.020.66 ± 0.040.66 ± 0.020.67 ± 0.03
Base NSGA2Igd0.03 ± 0.010.05 ± 0.010.03 ± 0.010.03 ± 0.010.03 ± 0.010.02 ± 0.010.02 ± 0.00
MOEA/DIgd0.05 ± 0.010.05 ± 0.010.05 ± 0.020.05 ± 0.010.04 ± 0.010.04 ± 0.010.04 ± 0.01
Pro. NSGA2Igd0.02 ± 0.020.04 ± 0.020.02 ± 0.020.01 ± 0.010.02 ± 0.020.01 ± 0.010.01 ± 0.01
SPEA2Igd0.07 ± 0.020.11 ± 0.020.09 ± 0.020.07 ± 0.020.08 ± 0.020.06 ± 0.010.04 ± 0.01
Base NSGA2Spacing0.01 ± 0.000.02 ± 0.000.02 ± 0.000.02 ± 0.000.02 ± 0.010.01 ± 0.000.01 ± 0.00
MOEA/DSpacing0.01 ± 0.000.01 ± 0.000.01 ± 0.000.01 ± 0.000.01 ± 0.000.01 ± 0.000.01 ± 0.00
Pro. NSGA2Spacing0.01 ± 0.000.02 ± 0.010.01 ± 0.000.01 ± 0.010.01 ± 0.010.01 ± 0.000.01 ± 0.00
SPEA2Spacing0.03 ± 0.000.03 ± 0.010.03 ± 0.010.03 ± 0.010.02 ± 0.010.02 ± 0.000.02 ± 0.00
Base_NSGA2Spreading0.55 ± 0.080.59 ± 0.060.55 ± 0.040.58 ± 0.080.55 ± 0.050.49 ± 0.050.50 ± 0.03
MOEA/DSpreading1.48 ± 0.081.51 ± 0.091.47 ± 0.051.49 ± 0.051.50 ± 0.031.41 ± 0.071.38 ± 0.08
Pro. NSGA2Spreading0.55 ± 0.070.65 ± 0.040.54 ± 0.050.57 ± 0.060.57 ± 0.040.51 ± 0.040.54 ± 0.04
SPEA2Spreading0.58 ± 0.080.67 ± 0.050.64 ± 0.070.64 ± 0.090.59 ± 0.070.54 ± 0.070.56 ± 0.05
Disclaimer/Publisher’s Note: The statements, opinions and data contained in all publications are solely those of the individual author(s) and contributor(s) and not of MDPI and/or the editor(s). MDPI and/or the editor(s) disclaim responsibility for any injury to people or property resulting from any ideas, methods, instructions or products referred to in the content.