Abstract
The digital and green transformation (DGT) has emerged as an essential strategy for companies to enhance competitiveness and achieve sustainable development. Current research has primarily concentrated on the effects of either digital or green transformation individually on corporate sustainability performance (CSP), while largely neglecting their synergistic impacts. This study emphasizes that DGT influences CSP mainly through two mechanisms: resource synergy, which alleviates financing constraints and optimizes resource allocation, and innovation synergy, which broadens enterprise knowledge scope and enhances innovation quality. Using data from Chinese publicly listed firms from 2015 to 2023, we adopt a two-way fixed-effects model to analyze the impact of DGT on CSP, the underlying mechanisms, and the moderating role of environmental regulations. The findings reveal the following: First, DGT exerts a significant positive influence on CSP, demonstrating a “multiplier effect” compared to the individual impacts of digital or green transformation alone. Second, environmental regulations positively moderate the relationship between DGT and CSP. Finally, DGT has a more pronounced positive impact on CSP in heavily polluting enterprises, under strong market competition environments, and with high intellectual property protection. This study not only enriches the research on DGT at the enterprise level but also provides empirical evidence from emerging economies for policymakers to formulate relevant strategies.
1. Introduction
The intertwining of the advancement towards global Sustainable Development Goals (SDGs) and the wave of technological revolution has made it a central issue for global policymakers and academia to understand how enterprises can balance economic growth with environmental responsibilities and achieve high-quality sustainable development. As fundamental units of economic activity, enterprises are not only major participants in resource consumption and pollution emissions but also key executors in driving green transformation and technological innovation. Their developmental paradigms directly shape the trajectory of global sustainable development.
Currently, enterprises prioritize digital and green transformation (DGT) to address both ecological limits and disruptive technologies. Digital transformation (DT) leverages advanced technologies to reconfigure core business competitiveness and improve efficiency and innovation capacity. Green transformation (GT), on the other hand, cultivates new growth avenues through eco-friendly practices and green product/service offerings. Together, these two transformations generate synergistic effects that propel enterprises toward sustainable development.
To clarify the focus of this study, we explicitly state the primary research question early in the introduction: How does DGT affect corporate sustainability performance (CSP), through what mechanisms, and under which institutional conditions?
From a theoretical standpoint, DT enhances efficiency and innovation, reduces operational costs, and enables firms to respond rapidly to market changes, thereby strengthening long-term sustainability [1,2,3]. GT improves corporate social responsibility, attracts environmentally conscious consumers and investors and provides long-term support for CSP [4,5,6]. The interaction between these two transformations amplifies their positive impact on CSP through mechanisms such as resource optimization and process integration.
A systematic review of existing studies reveals that scholarly attention toward DGT has intensified in recent years [7,8], yet three critical research gaps persist. First, there are micro-level conceptualization and measurement deficiencies. Current research predominantly adopts macro-perspectives (regional/industry-level analyses), with limited efforts to define and operationalize DGT at the firm level [9,10,11,12]. For instance, Faggian et al. (2025) demonstrated that regions with strong green-digital scientific foundations exhibit higher propensity to generate twin knowledge—characterized by greater volume, superior quality, and enhanced visibility—compared to their counterparts [11].
Second, there is insufficient attention to the synergy of DGT. Existing research either focuses on the one-way empowerment of green transformation by digitalization [13,14] or independently examines the impact of a single transformation on corporate performance [1,2,3,4]. This fragmented approach overlooks potential non-linear interactions between digital and green transformations. Zhu et al. (2023), for example, revealed that AI-driven process optimization reduces transitional resource consumption and pollution emissions through strategic industrial reconfiguration, thereby enhancing both operational efficiency and low-carbon transition velocity [14].
Third, the internal mechanisms and boundary conditions regarding how DGT influences CSP remain unclear. While some studies have examined synergistic effects [6,15,16], they fail to (1) deconstruct the black box of performance enhancement pathways and (2) clarify the moderating role of institutional environments. For example, Ye et al. (2024) showed that digital-enabled green practices (DEG) and green-oriented digital practices (GED) act as complementary mechanisms enabling firms to convert institutional pressures into sustainable performance gains [16].
To address these gaps, this study draws on Strategic Synergy Theory, which posits that enterprises can effectively navigate internal and external environmental dynamics through the integration of multiple strategies, with their synergistic interactions serving as a pivotal driver for enhancing CSP [17,18]. Building on classic perspectives such as the Resource-Based View (RBV) [19,20], dynamic capabilities theory [21], and institutional theory [22], our framework advances a synergistic perspective that differs from prior approaches. While existing frameworks often analyze DT and GT separately or even in competition, our framework develops a synergistic perspective. Specifically, we conceptualize DGT as a unified strategic whole and identify two complementary mechanisms: resource synergy and innovation synergy. Moreover, in contrast to prior research that primarily treats environmental regulation as an external constraint, we view it through the lens of institutional theory and the Porter Hypothesis [23] as a positive moderator that can amplify the benefits of DGT by aligning institutional pressures and incentives with firms’ strategic objectives.
To illustrate these theoretical principles in practice, the Chinese context offers a particularly instructive case. As the world’s largest developing economy, China faces the dual challenge of reducing its dependence on traditional industries and lowering carbon emissions, while simultaneously experiencing rapid growth of its digital economy. According to the National Bureau of Statistics (2025), China’s energy consumption per unit of GDP in 2024 remained about 30% higher than developed countries’ benchmarks, while the value-added of the core digital economy accounted for 10% of GDP [24]. Against this backdrop, examining how Chinese enterprises achieve DGT and how this transformation influences CSP provides valuable insights not only for promoting high-quality development in emerging economies but also for advancing global sustainability objectives.
In light of this, this study selects Chinese listed enterprises spanning from 2015 to 2023 as its sample, incorporates environmental regulation as a moderating variable, and systematically examines the impact of DGT on CSP from a synergistic perspective, along with a thorough exploration of its underlying mechanisms.
This study makes three main contributions. First, it delves into the micro-enterprise level, precisely defines the connotation of DGT by integrating strategic synergy theory, and constructs operational measurement indicators, thereby responding to Ologeanu-Taddei R et al.’s (2025) call for “deepening research on DGT at the firm level” with a more nuanced and actionable framework [25]. Second, it transcends the limitations of a singular transformation perspective by revealing the impact mechanism of DGT on CSP from a synergistic standpoint, thereby filling a critical gap concerning the interactive mechanisms between DGT and CSP. Third, it introduces environmental regulation as a moderating variable to clarify the contextual boundaries within which DGT exerts its effects, providing empirical evidence to inform differentiated and targeted transformation policies.
The reminder of this paper is structured as follows: Section 2 derives the research hypotheses via an exhaustive literature synthesis. Section 3 describes the research framework, including model construction, variable measurement, and data sourcing. Section 4 showcases the empirical outcomes. Section 5 conducts supplementary analyses to enhance the findings’ credibility and scope. Finally, Section 6 synthesizes the main contributions, examines policy implications, and outlines potential directions for subsequent research.
2. Theoretical Analysis and Hypothesis Construction
2.1. The Direct Impact of DGT on CSP
According to the strategic synergy theory, digital and green transformation (DGT) represents a complex process in which enterprises simultaneously advance systematic changes across two dimensions—digitization and greening. Through digitization, firms reconfigure their core business competitiveness by enhancing efficiency, scalability, and responsiveness, while greening enables them to cultivate new growth trajectories based on sustainability-oriented practices and eco-innovation. The synergy between these dimensions allows enterprises to evolve into entities that are both “digitally intelligent” and “environmentally responsible,” thereby sustaining competitiveness in a rapidly transforming business landscape.
However, when examined individually, digital transformation (DT) and green transformation (GT) display distinct implications for corporate sustainability performance (CSP). In the case of DT, many studies suggest it improves CSP by alleviating financing constraints [26], strengthening dynamic capabilities [4], and reducing market concentration [27]. Yet, scholars also caution against the “rebound effect” of digital technologies, whereby excessive digitization raises energy demand, creates redundant digital infrastructure, and increases electronic waste [28]. This paradox highlights the dual-edged nature of DT: it may generate efficiency gains but can simultaneously undermine environmental sustainability if not properly managed.
GT, by contrast, prioritizes environmental stewardship and legitimacy. It encourages firms to reduce pollution, optimize resource use, and develop eco-friendly products and services [29]. Empirical studies highlight the positive impact of green strategic positioning [30], green servitization [31], and green innovation [32] on CSP. Nevertheless, GT is not without limitations. The transition often entails substantial costs, lengthy payback periods, and operational trade-offs that can restrict firms’ competitiveness, especially in resource-constrained settings. Thus, while GT strengthens ecological legitimacy and stakeholder trust, it may hinder growth unless complemented by efficiency-enhancing mechanisms.
Importantly, DT and GT are not only distinct but also mutually reinforcing. On one hand, DT can drive GT by leveraging technological capabilities to enable low-carbon manufacturing, intelligent monitoring, and real-time optimization [33,34]. From a resource-based perspective, digital technologies act as strategic resources, substituting for non-renewables and reducing operational inefficiencies [35,36,37,38]. On the other hand, GT can accelerate DT by creating demand for digital solutions in areas such as smart equipment, carbon footprint tracking, and environmental data management [39,40]. Investments in energy-efficient and low-carbon technologies further lay the foundation for sustainable digital infrastructures [41].
Taken together, these insights suggest that DT and GT, when pursued in isolation, may each yield partial or even contradictory outcomes. DT emphasizes efficiency but risks ecological rebound; GT emphasizes legitimacy but may constrain competitiveness. It is only through their integration in DGT that firms can simultaneously capture efficiency gains and ecological legitimacy, generating synergistic effects that surpass the benefits of either transformation alone [15].
Based on this reasoning, we propose the following hypothesis:
H1:
DGT substantially enhances CSP, with a “multiplier effect” that exceeds the impact of DT or GT when pursued independently.
2.2. The Mechanism of DGT on CSP
DGT can simultaneously bridge corporate financing gaps and optimize resource allocation through the resource synergy channel. Resource synergy refers to the intergration and reconfiguration of heterogeneous resource elements, enabling complementarity, sharing, and balanced allocation between green and digital initiatives. By enhancing the overall efficiency of resources, resource synergy facilitates firm’s progress toward sustainable development [42,43].
The resource synergy effects of DGT are manifested through several critical pathways. First, DGT can both directly and indirectly ease external financing constraints. From the perspective of signaling theory, firms engaging in DGT transmit credible signals to capital markets—such as green certifications or demonstrated digital capabilities—that reduce information asymmetries and attract environmentally and socially responsible (ESG-oriented) investors [44]. From a resource-based view, green patents and digital assets constitute rare and valuable resources that strengthen firms’ legitimacy and credibility, thereby improving access to external capital.
Second, DGT enhance production efficiency and enables more effective resource utilization, leading to more optimal allocation. In production processes, firms increasingly integrate digital technologies into green transformation practices. For example, advanced robotics, sensors, and intelligent manufacturing systems improve operational precision, reduce reliance on human labor, and minimize resource waste [45,46]. Similarly, in resource management, digital tools allow real-time monitoring and control of production waste, lowing disposal costs and supporting circular economy practices such as recycling and reuse [37]. Collectively, these initiatives improve firms’ capacity to maximize resource utilization while simultaneously meeting sustainability objectives.
In addition to resource synergy, DGT enhances CSP through innovation synergy, which arises when internal teams and external partners collaborate to generate, exchange, and integrate knowledge in ways that amplify complementary strengths. This collaborative integration of digital and green technologies produces outcomes that exceed what could be achieved by either transformation in isolation.
Innovation synergy operates through two primary channels. First, it broadens the scope of corporate knowledge. By merging digital and green technologies, firms expand technological frontiers and accelerate the diffusion of structured knowledge across departments. This integration facilitates real-time information exchange, supports collaboration across geographic and temporal boundaries, and enhances firms’ ability to address complex sustainability challenges more effectively [47].
Second, DGT fosters cross-industry and cross-sectoral collaboration. Linking digital tools with environmentally sustainable practices often requires partnerships with diverse stakeholders, including firms from unrelated industries, universities, and government agencies [48]. Such partnerships enrich the corporate knowledge base, not only by expanding its breadth but also by improving its quality. By embedding digital technologies within environmental objectives, firms gain deeper insights into evolving market demands and sustainability imperatives. This enables them to continuously refine products and services, align innovation processes with sustainability targets, and enhance the long-term value of their research and development efforts.
Combined with the resource synergy mechanisms discussed earlier, these innovation-driven advantages offer a full picture of how DGT boosts CSP. This leads to the following hypothesis:
H2:
DGT enhances CSP by alleviating financing constraints, optimizing resource allocation, expanding the breadth of corporate knowledge, and improving innovation quality through resource and innovation synergies.
Resource dependence theory conceptualizes firms as open systems whose strategic behavior is shaped by external environments, particularly institutional and policy contexts. Among these, environmental regulations—defined as government-enacted legal frameworks and policy instruments designed to curb pollution and promote resource efficiency—play a critical role in influencing corporate strategies. The Porter Hypothesis posits that well-designed environmental regulations can stimulate corporate innovation by compelling firms to mitigate environmental impacts through technological upgrading and strategic realignment [23]. In parallel, institutional theory emphasizes regulatory pressure as a driver of organizational conformity, encouraging firms to adopt environmentally responsible practices [49].
Within this framework, environmental regulation can affect DGT in two distinct ways. On the one hand, stringent regulatory requirements may prompt firms to increase investments in digital technologies and adopt proactive green strategies, thereby accelerating the integration of DGT and enhancing sustainability outcomes. On the other hand, such regulations may impose financial and operational burdens that divert resources away from innovation. Nevertheless, supportive policy instruments—such as green subsidies, tax incentives, and carbon trading schemes—can mitigate compliance costs and provide both material resources and institutional legitimacy for firms to advance DGT initiatives. Accordingly, environmental regulation should be viewed not merely as a constraint but also as a potential enabler that amplifies the positive effects of DGT on CSP. On this basis, the study proposes the following hypothesis:
H3:
Environmental regulation acts as a positive moderator in the association between DGT and CSP, such that the efficacy of DGT in enhancing CSP is magnified under more stringent regulatory environments.
Figure 1 outlines the theoretical framework underlying this research.
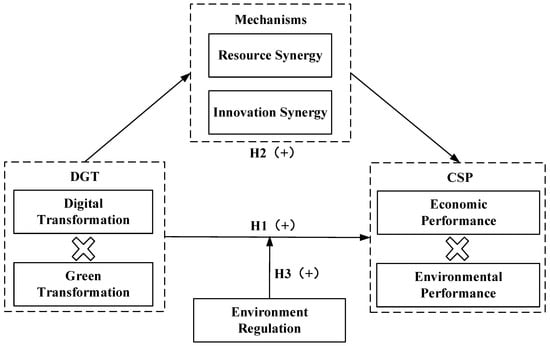
Figure 1.
Theoretical model. Source: Author’s own work.
3. Research Design
3.1. Model Setting
To empirically explore the affect of DGT on CSP, this paper first develops the following benchmark fixed effects model:
In Equation (1), CSPit is the dependent variable, capturing the sustainability performance of firm i in year t. DGTit is the primary explanatory variable, measuring the intensity of digital and green transformation for firm i in year t. Controlit encompasses the control variables, while yeart and cpi control for time-invariant and firm-specific effects, respectively. εit is the residual term. This baseline model tests Hypothesis 1, which suggests a substantial positive correlation between DGT and CSP, reflecting a synergistic “multiplier effect.”
Building upon the benchmark model, this paper further investigates the mechanisms through which DGT affects CSP by constructing the following mediation model:
In Equation (2), represents the mechanism variables, which include proxies for resource synergy (e.g., alleviation of financing constraints and resource allocation efficiency) and innovation synergy (e.g., knowledge base diversity and innovation quality). Other variables retain the same definitions as in Equation (1). This model is designed to empirically test Hypothesis 2, which posits that DGT improves CSP through resource synergy and innovation synergy pathways.
To fortify the analysis’s reliability and explore the mediating role of environmental regulations (ER), this research extends Equation (1) by including an interaction term between DGT and ER, resulting in the following model:
In Equation (3), represents the lagged intensity of environmental regulations in the city where firm i operates, accounting for delayed policy impacts. The interaction term examines whether the institutional environment amplifies or attenuates the influence of DGT on CSP. A strongly positive coefficient would confirm Hypothesis 3, indicating that tighter environmental rules amplify DGT’s beneficial effect on CSP.
3.2. Key Variables and Measurements
3.2.1. Dependent Variable
The key outcome measure examined is corporate sustainability performance (CSP). Building on previous research frameworks [50,51], this paper applies the entropy method to measure CSP from financial and environmental perspectives.
For financial performance, we follow Bai et al. (2024) and use return on assets (ROA) as the main indicator [51], as it reflects a firm’s efficiency in utilizing assets. Considering that return on equity (ROE) captures shareholders’ returns and the firm’s ability to generate profits through equity utilization [52], we further employ ROE to reconstruct CSP in robustness tests.
For environmental performance, three approaches are identified in the literature: third-party ratings [53], CO2 emissions and intensity [54], and self-constructed evaluation systems [55]. Given the subjectivity of self-constructed systems, we adopt third-party ratings as the primary measure, complemented by carbon emission intensity for robustness. Specifically, we employ the environmental scores from Huazheng ESG rating system (HZ ESG), which (1) integrates international frameworks with domestic practices through a comprehensive structure of 5 first-level and 17 second-level indicators; (2) provides extensive coverage and frequent updates, widely recognized in empirical research [56,57]; and (3) avoids the subjectivity of self-developed metrics. To further mitigate potential rating bias, robustness checks are also conducted using Bloomberg’s ESG environmental scores and CNDRS’s ESG environmental scores.
3.2.2. Independent Variable
The independent variable is digital and green transformation (DGT), representing a complex process with two interrelated subdimensions: corporate digital transformation and corporate green transformation. A review of the literature indicates that existing studies have not directly developed an indicator system for firm-level DGT, typically measuring either digital or green transformation in isolation. Digital transformation has been assessed mainly by the proportion of digital intangible assets to total intangible assets [58] or through text-based analysis of digital-related keywords in annual reports [59]. Green transformation, in contrast, has been measured via green patent counts [60], textual disclosures in annual reports [61], or composite indicators integrating environmental performance and green innovation [62]. However, single proxies or text-based measures may fail to capture the full complexity of transformation and are susceptible to strategic disclosure bias, such as exaggeration of initiatives to enhance stock market perception. To address these limitations, this study constructs a multidimensional indicator system for both digital and green transformation at the firm level, encompassing strategy [63,64,65], technology [66,67], actions [68,69], and resources [70], and covering the full transformation process from cognition to action to outcome (see Table 1). Dimension weights are determined using the entropy method.

Table 1.
Comprehensive evaluation system for DGT.
Digital and green transformations are mutually supportive and reinforcing strategic initiatives. To capture their overall effectiveness and synergistic interactions, this study employs the Coupling Coordination Degree Model (CCDM). The firm-level DGT indicator is derived from the coupling coordination degree between DT and GT, both measured using the entropy method. Based on the calculation process of CCDM, this paper defines the calculation formula of coupling degree of DGT as:
where and denote digital and green transformation degrees, respectively.
Subsequently, the coordination degree T of DGT is calculated, from which the coupling coordination degree D is derived, as detailed in Equations (5) and (6). D is used as the firm-level DGT indicator.
In Equation (6), the weights of the two subsystems are set equally (a = b = 0.5), which is justified both theoretically and empirically. From a sustainable development perspective, digital transformation optimizes resource allocation through data-driven processes, such as intelligent production reducing energy waste [14], while green transformation creates environmental value through low-carbon innovations, such as technologies reducing carbon emissions [38]. Existing research highlights that these dimensions are complementary rather than hierarchical in the DGT process [6,71,72], and prioritizing one may lead to imbalanced transformation. Moreover, equal weighting is widely adopted in coupling studies when the subsystems are theoretically equivalent and no prior evidence indicates differing importance [73], as both digital and green transformations are core drivers of integrated “digital economy + green economy” development.
To further validate this specification, we conducted an entropy-based robustness test. The empirical results show that the aggregate weights of digital transformation (0.5056) and green transformation (0.4944) are nearly identical, with similar patterns across high-tech and non-high-tech subsamples (see Appendix A, Table A3 and Table A4), supporting the equal-weighting assumption.
3.2.3. Mechanism Variables
To empirically test the resource synergy pathway of DGT’s effect on CSP, this study selects two key indicators: total factor productivity (TFP) and financing constraints.
- 1.
- Total Factor Productivity (TFP):
TFP captures a firm’s comprehensive efficiency in utilizing labor, capital, and technology to generate outputs, serving as a proxy for internal resource allocation efficiency. A higher TFP indicates more effective coordination of inputs, which is a hallmark of successful digital-green integration. Firm-level TFP is calculated following the fixed-effects (FE) approach [74], which controls for unobserved inter-firm heterogeneity.
- 2.
- Financing Constraints:
Financing constraints reflect a firm’s ability to acquire external resources, which directly influences its capacity to implement digital-green transformation strategies. The primary measure used is the Whited–Wu (WW) index [75,76], which integrates cash flow, debt ratios, and firm size. Although originally developed for Western capital markets, these financial indicators are universally relevant and have been widely applied to Chinese listed companies [77], capturing the severity of financing constraints in this context.
To ensure robustness, an alternative proxy, the SA (Size-Age) index, is also used. This index relies solely on firm size and age, avoiding potential weighting issues inherent in the WW index.
Innovation synergy is operationalized via two dimensions: knowledge breadth and innovation quality.
- 1.
- Knowledge breadth:
Knowledge breadth reflects the diversity of a firm’s technological knowledge base. To measure the breadth of a firm’s knowledge base, we calculate a Herfindahl index based on the IPC subgroups to which its patents belong [78]. The IPC subgroup code (e.g., ‘A01B01’ in ‘A01B01/00’) represents a finely delineated technological field. This level of granularity strikes an optimal balance, effectively distinguishing between patents in adjacent technological areas while avoiding the excessive fragmentation that would result from using the complete IPC code.
We define knowledge breadth as follows:
where Zimt is the cumulative number of invention and utility model patents applied for by firm i up to year t in IPC subgroup m, and Zit is the firm’s total cumulative patents across all subgroups. A higher value of KnowBreadthit indicates greater diversification across distinct technological fields, signifying a broader and more diverse knowledge base.
- 2.
- Innovation Quality:
Following prior literature [79], this study measures innovation quality using the number of forward patent citations within one year after application. In the Chinese context, corporate innovation is dominated by incremental and application-oriented patents, which tend to generate recognition and citations relatively quickly. Moreover, given the short policy cycles and strong competitive pressures in digital and green transformation, patents related to digital applications, green technologies, and process improvements are more likely to be cited in the short term. Therefore, the one-year citation window is well-suited to capture the immediate innovation quality relevant to our mechanism analysis.
To further validate this measurement, we conduct robustness checks with extended citation windows of 2, 3, 4, and 5 years. These additional tests confirm the robustness of our findings while also revealing the temporal dynamics of innovation quality.
3.2.4. Regulatory Variable
The moderator in this research is environmental regulation (ER). Following established practices in prior studies [80,81], we measures local environmental regulation intensity using the textual content of municipal government work reports. Specifically, we identify a set of environmental regulation-related keywords that are widely used in the China Environmental Yearbook and regulatory documents issued by the Ministry of Ecology and Environment (see Appendix B, Table A11 for the full list). These keywords have been validated in earlier research as effective proxies for local governments’ environmental policy emphasis [81].
We then apply Python 3.13-based textual analysis to count the number of sentences containing these keywords and calculate their proportion in total word count of the government work report. This proportion captures the relative salience of environmental protection in the policy discourse of each city-year. As documented in previous study [81], this measure correlates strongly with actual enforcement intensity, thus providing assurance that the indicator reflects substantive regulatory pressure rather than symbolic policy rhetoric.
3.2.5. Control Variables
This analysis employs a series of firm-level control variables to mitigate the impact of organizational heterogeneity on CSP, consistent with findings from prior literature [82]. The control variables encompass: firm age (Age), debt-to-equity ratio (Lev), cash flow ratio (Cashflow), firm size (Size), total asset turnover (Ato), growth potential (Growth), and loss status (Loss), which denotes whether a firm is operating at a loss. Table 2 offers detailed definitions and evaluation techniques for the core variables within the study.
Table 2.
Definitions of research variables.
3.3. Sample Selection and Data Sources
The research utilizes Chinese A-share firms listed between 2015 and 2023. To ensure data accuracy and sample representativeness, the following screening criteria were applied: (1) firms operating in the financial sector and those with abnormal operational status (e.g., *ST, ST, PT designations) were excluded; (2) firms with missing values in key variables were removed; and (3) firms with a cumulative listing duration of less than three years within the observation window were excluded. After applying these criteria, the final sample consists of 16,331 firm-year observations from 2616 listed companies, yielding an unbalanced panel dataset. The study drew its figures from several reputable sources, such as CSMAR, CNRDS, WIND, and the financial disclosures of publicly traded companies. To minimize distortion from extreme values, the highest and lowest 1% of all continuous data points were winsorized.
To evaluate the representativeness of the sample, we report the distribution of firms by industry, region, ownership, and size (Appendix A, Table A1). The sample covers a wide range of sectors, including primary, secondary, and tertiary industries. Manufacturing firms constitute 81.5% of the sample, which is consistent with the structure of Chinese listed companies and aligns with our research focus, as manufacturing is the core arena for digital–green transformation.
The sample is evenly split between large enterprises (50.0%) and small-to-medium-sized enterprises (50.0%), while state-owned and private firms account for 26.9% and 73.1%, respectively, reflecting the composition of China’s listed firms. Regionally, 75.6% of firms are located in eastern China, with 15.4% and 8.9% in central and western China, mirroring the geographic distribution of capital markets. Overall, the sample can be considered broadly representative, providing a solid foundation for empirical analysis.
4. Empirical Analysis
4.1. Descriptive Statistics and Correlation Analysis
This study conducts descriptive statistics and correlation analysis for the primary variables in the benchmark model, with comprehensive results presented in Table 3 and Table 4.
Table 3.
Descritive statistics.
Table 4.
Correlation analysis and VIF value.
Table 3 shows a CSP standard deviation of 0.177, ranging from near zero to nearly 1 during observations. The analysis reveals considerable diversity in corporate sustainability outcomes. The mean value of DGT is 0.488, with a minimum close to zero and a maximum of 0.863, suggesting that the overall level of DGT among listed firms is relatively low and exhibits considerable variation across the sample.
Table 4 presents the correlation matrix, showing that the primary variables are significantly correlated at the 1% level. All correlation coefficients have absolute values under 0.5, suggesting that the relationships are moderate and do not indicate severe collinearity. Notably, the correlation between DGT and CSP is significantly positive at the 1% level, offering initial support for DGT’s positive impact on CSP.
Additionally, we conducted variance inflation factor (VIF) analysis to diagnose multicollinearity. Results show the highest observed VIF value is 1.74—far below the widely accepted threshold of 10, a benchmark commonly used in econometric studies. This confirms that multicollinearity is not a major concern in our regression models.
4.2. Benchmark Regression Analysis
Table 5 presents the benchmark regression results examining the effects of DGT, DT, GT on CSP. Columns (1) and (2) show that DGT has a positive and statistically effect on CSP, both before (α = 0.280, p < 0.001) and after including control variables (α = 0.191, p < 0.001), confirming a robust “multiplier effect” compared to single transformations.
Table 5.
Main effects test results.
Columns (3) and (4) report the effects of DT alone, which are positive and significant in the baseline specification (α = 0.151, p < 0.001) but decrease and become statistically insignificant (α = 0.0496, n.s.) after controlling for firm characteristics, suggesting that DT’s impact on CSP may be partially offset by short-term restructuring costs or adjustment pressures. Columns (5) and (6) present the results for GT, which consistently exerts a positive influence on CSP (α = 0.210 and 0.150, p < 0.001), highlighting the importance of green initiatives.
Comparing the magnitude of coefficients after including controls, a 1-point increase in the DT index, GT index, and DGT index corresponds to an increase of 0.0496, 0.150, and 0.191 in CSP, respectively. These values indicate that the combined DGT strategy produces a stronger and more comprehensive effect on CSP than either transformation alone.
Accordingly, the empirical findings lend compelling support to Hypothesis 1, indicating that DGT not only significantly enhances CSP but also achieves a “multiplier effect” by leveraging the synergistic interplay between digital and green transformation.
4.3. Endogeneity Treatment
To address potential endogeneity concerns—such as reverse causality and omitted variable bias—we adopt an instrumental variables (IV) strategy. Following Lei and Wang (2023) [83], we use both lagged and industry-level measures of DGT. Specifically, the instruments include (i) the lagged value of the firm’s DGT index (L_DGT), (ii) the industry-year mean of DGT (IV1), and (iii) the industry-year coupling coordination degree of DGT (IV2). These instruments are theoretically justified: industry-wide adoption pressures are strongly correlated with firm-level DGT (relevance condition) but plausibly exogenous to firm-specific outcomes (exclusion restriction).
Diagnostic tests confirm the appropriateness of the instruments. As shown in Table 6, in the baseline IV estimation, the first-stage F-statistics are 364.77, 394.74, and 394.94 for L_DGT, IV1, and IV2, respectively. The Cragg–Donald Wald F statistics and Kleibergen–Paap rk Wald F statistics are all well above 2000, indicating strong instruments, while the Kleibergen–Paap rk LM statistic p-values are all <0.001, confirming that the instruments are not under-identified. First-stage regressions show strong correlations with firm-level DGT, and second-stage estimates consistently indicate a positive and significant effect of DGT on CSP across all specifications.
Table 6.
Endogeneity Test.
To address concerns about outliers or the influence of dominant firms, we construct alternative instruments—IV1_95%_trimmed, IV1_99%_trimmed, and IV1_median —based on industry-year aggregates. Diagnostic tests confirm the appropriateness of the selected instruments: the Cragg–Donald Wald F statistic and Kleibergen–Paap rk Wald F statistic are substantially above conventional critical thresholds, indicating strong instruments, while the Kleibergen–Paap rk LM statistic p-values confirm that the instruments are not under-identified. First-stage regressions show strong correlations with firm-level DGT, and second-stage estimates consistently indicate a positive and significant effect of DGT on CSP across all specifications. All results are shown in Appendix A, Table A2. These results demonstrate that our IV strategy is both theoretically sound and empirically robust.
4.4. Robustness Tests
To strengthen the empirical results, this study performs robustness checks using varied variable definitions and supplementary controls:
- To gauge the durability of our findings with a different set of sustainability indicators, we first replaced ROA with ROE in the economic performance composite index based on entropy weights. The revised regression results, showcased in Column (1) of Table 7, reveal a notably strong and positive relationship between DGT and CSP (α = 0.146, p < 0.01), reinforcing our initial hypothesis. In addition, we conducted three further robustness checks by replacing HZ ESG environmental scores with Bloomberg ESG environmental scores, CNDRS ESG environmental scores, and firm-level carbon emission intensity. As reported in Appendix A (Table A5), the estimated coefficients of DGT remain consistently positive and statistically significant at the 1% level across all specifications. These results confirm that our main finding is highly robust to alternative measurements of CSP.
Table 7. Robustness Analysis.
- To combat any potential bias due to unaccounted variables at the industry and local levels, we’ve bolstered the baseline model by incorporating industry-specific and city-specific fixed effects. The results from this enhanced model can be found in Columns (2) and (3) of Table 7. The estimated coefficients continue to show a notably positive trend (α = 0.176, p < 0.01; α = 0.202, p < 0.01), reinforcing the reliability of our findings.
Collectively, Table 7 demonstrates that the core conclusion—DGT significantly improves CSP—remains valid across a variety of model specifications, variable definitions, and fixed-effect controls.
5. Mechanism Testing and Extended Analysis
5.1. Testing the Mechanism of Influence
5.1.1. Resource Synergy Mechanism
To empirically examine the resource synergy pathway of DGT’s effect on CSP (Hypothesis 2), we focus on two key indicators: total factor productivity (TFP) and financing constraints. These indicators capture a firm’s internal resource allocation efficiency and external resource acquisition capability, respectively.
- Total Factor Productivity (TFP)—Internal Resource Allocation
TFP reflects the efficiency of input utilization, which is critical for understanding how DGT optimizes internal resources. Using FE-based TFP as the baseline measure, regression results indicate a significant positive effect of DGT on TFP (β = 0.069, t = 2.31), suggesting that digital-green integration enhances firms’ internal resource allocation efficiency.
To address potential measurement concerns and factor misallocation issues, additional analyses were conducted (Appendix A, Table A6). First, when estimating TFP using OLS rather than FE, the effect of DGT remains significantly positive (β = 0.061, t = 2.79), confirming robustness to estimation methods. Second, by introducing an interaction between DGT and state ownership (SOE), results show that DGT × SOE is significantly positive (β = 0.139, t = 3.22). This indicates that the productivity-enhancing effect of DGT is particularly pronounced in state-owned enterprises, where factor endowments and institutional advantages amplify the returns to digital-green integration. Together, these findings demonstrate that DGT improves firms’ internal efficiency even under heterogeneous institutional conditions, while also revealing an important boundary condition of its effect.
- 2.
- Financing Constraints—External Resource Acquisition
Financing constraints determine a firm’s ability to secure external funding, directly shaping its capacity to undertake DGT initiatives. Using the Whited–Wu (WW) index as the baseline measure, we find that DGT significantly alleviates financing constraints (β = −0.0086, t = −2.00), implying that digital-green integration reduces financing frictions and improves access to external capital. Mechanistically, this reflects how DGT enhances transparency and risk control, thereby increasing firms’ credibility and attractiveness to banks and investors.
To ensure robustness, we further employ the SA (Size-Age) index as an alternative proxy for financing constraints. Results remain consistent (Appendix A, Table A6): DGT significantly reduces financing constraints (β = −0.0199, t = −3.05). This robustness check confirms that the mitigating effect of DGT on financing frictions is not sensitive to the choice of proxy. Overall, the evidence supports that DGT enhances firms’ external resource acquisition capability, reinforcing the resource synergy pathway.
Together, these results demonstrate that DGT enhances both internal and external resource coordination, providing strong evidence for the resource synergy pathway in improving CSP.
5.1.2. Innovation Synergy Mechanism
To empirically examine the innovation synergy pathway of DGT’s effect on CSP (Hypothesis 2), we focus on two key indicators: knowledge breadth and innovation quality. These indicators capture the diversity and effectiveness of a firm’s innovative output, respectively.
- 1.
- Knowledge Breadth—Expanding the Technological Scope
Knowledge breadth reflects the diversity of a firm’s technological knowledge base, which is critical for understanding how DGT fosters innovation through cross-domain recombination. A wider distribution of patents across distinct IPC subgroups indicates greater absorptive capacity and a stronger ability to integrate heterogeneous knowledge sources. This, in turn, facilitates the development of comprehensive digital-green solutions.
Regression results confirm that DGT significantly enhances knowledge breadth (β = 0.257, t = 9.77), suggesting that digital-green integration systematically broadens firms’ technological scope. Mechanistically, this expansion increases opportunities for complementary innovations across digital and green domains, reinforcing the innovation synergy pathway. By extending their knowledge boundaries, firms are better positioned to exploit convergence opportunities between digital technologies and green applications, thereby improving CSP.
- 2.
- Innovation Quality—Enhancing Immediate Technological Impact
Innovation quality is measured by forward patent citations within one year after application, reflecting the immediate impact and recognition of technological advances. In the Chinese context, incremental and application-oriented patents dominate, and these are more likely to generate citations quickly. DGT facilitates such innovations by accelerating knowledge diffusion, strengthening process improvements, and promoting market-relevant applications.
Regression results indicate that DGT significantly improves innovation quality (β = 1.204, t = 9.71), demonstrating that digital-green integration enhances the immediate value and recognition of firms’ patents.
To further validate this finding, we extend the citation window to 2–5 years (Appendix A, Table A7). Results reveal a clear temporal pattern: while DGT significantly increases one-year forward citations (β = 1.181, p < 0.01), the effect turns negative from the second year onward and grows in magnitude over years 2–5 (β = −0.645 to −1.347, all p < 0.01). This suggests that DGT primarily promotes incremental innovations with rapid early diffusion, but such effects weaken as technologies lose uniqueness over time.
These temporal dynamics enrich our interpretation of the mechanism: DGT acts as an accelerator of short-term innovation quality but contributes less to sustaining long-term, high-impact innovations. This pattern is consistent with the innovation economics literature on “rapid diffusion” and “substitution effects,” further confirming the robustness and nuance of our mechanism-based findings.
In summary, the mechanism analysis provides strong empirical support for Hypothesis 2. DGT improves CSP through both resource synergy—by enhancing internal allocation efficiency and alleviating external financing constraints—and innovation synergy—by broadening knowledge bases and improving innovation quality. Together, these pathways demonstrate how DGT fosters CSP through complementary resource and innovation effects.
5.1.3. The Regulatory Mechanism of Environmental Regulation
As shown in Column (6) of Table 8, the interaction between DGT and lagged environmental regulation (DGT × ER_L1) is positive and statistically significant (β = 0.247, t = 3.36), indicating that stricter local environmental regulation amplifies the effect of DGT on CSP.
Table 8.
Mechanism Effect Test.
Mechanistically, this suggests that under more stringent regulatory environments, firms are incentivized to leverage digital-green integration to meet compliance requirements and enhance environmental outcomes, thereby strengthening the DGT–CSP link. Figure 2 illustrates this moderating effect: the positive impact of DGT on CSP is more pronounced in regions with high-intensity environmental regulation, whereas it is attenuated under low-intensity regulation.
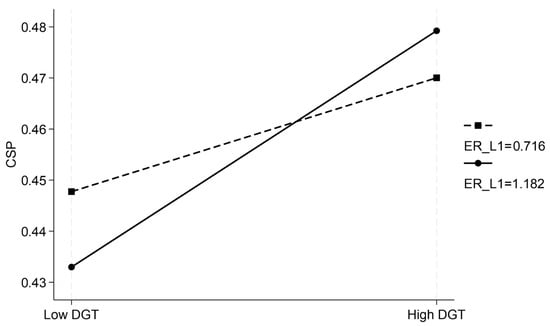
Figure 2.
Regulatory effect of environmental regulations. Source: Author’s own creation.
Together, these findings demonstrate that environmental regulation acts as a key boundary condition, enhancing the effectiveness of DGT in promoting CSP. The results provide robust empirical support for Hypothesis 3 (H3).
5.2. Further Analysis
5.2.1. Heterogeneity Analysis Based on Enterprise Pollution Levels
To further explore whether the impact of DGT on CSP varies across firms facing different environmental pressures, we conduct a heterogeneity analysis based on enterprise pollution levels. High-polluting industries are subdivided into heavily polluting and moderately polluting sectors, following the classification of the China Securities Regulatory Commission (CSRC, 2012), the Ministry of Ecology and Environment’s environmental inspection directory, and prior study [84]. Table A12 summarizes the industries included in each group.
We then perform subgroup regressions for these two samples to assess the differential impact of DGT on CSP. As shown in Columns (1) and (2) of Table 9, the positive effect of DGT on CSP is most pronounced in heavily polluting industries (α = 0.228, p < 0.01). While DGT also has a positive impact in moderately polluting industries, both the magnitude and statistical significance are lower (α = 0.0847, p < 0.1). A Chow test confirms that the difference between the coefficients for the two groups is statistically significant (p < 0.01).
Table 9.
Heterogeneity analysis results.
These findings indicate that the value of DGT is not uniform across all high-polluting firms. Instead, DGT is particularly effective for firms facing the greatest environmental compliance pressures and survival challenges. For these firms, DGT is not merely an optional strategy but a critical pathway for sustaining competitiveness and enhancing CSP.
In summary, our refined heterogeneity analysis highlights that environmental regulatory pressure strengthens the urgency and benefit of DGT adoption, providing more precise insights into the conditions under which digital-green strategies yield the greatest impact on CSP.
5.2.2. Heterogeneity Analysis Stratified by Market Competition Intensity
A company’s commitment to digital and eco-friendly innovation often hinges on how cutthroat its industry is. When competition heats up, companys have a stronger motivation to embrace DGT approaches—not just to stay afloat but to sharpen their long-term edge. Following prior study [85], we measure market competition intensity using the Hirschman–Herfindahl Index (HHI) based on firms’ total assets. The asset-based HHI reflects long-term capital concentration and industry entry barriers, which is highly relevant to the strategic and investment-intensive characteristics of DGT.
To explore heterogeneity in the DGT–CSP relationship across varying degrees of market competition, the sample is stratified into high- and low-competition groups using the median value of the HHI. Group regression results are reported in Columns (3) and (4) of Table 9. In highly competitive markets, the regression coefficient for DGT on CSP is 0.187 (p < 0.01), while in less competitive markets, it is 0.182 (p < 0.01). A Chow test reveals statistically significant coefficient disparities between the groups.
The results imply that market competition amplifies the positive influence of DGT on CSP. In more competitive environments, firms face greater pressure to innovate and differentiate, making DGT a more effective strategic tool for enhancing long-term sustainability outcomes. As a robustness check, we also construct revenue-based HHI to capture product-market competition (Appendix A, Table A8). Both measures yield consistent results, supporting the validity of our competition intensity proxy.
5.2.3. Heterogeneity Analysis Stratified by Regional Intellectual Property Protection Strength
Knowledge width and innovation quality serve as key mechanisms through which DGT influences CSP. However, without effective protection of innovation outputs, the mechanism of innovation synergy may be undermined. Therefore, following existing research [86], this study uses the ratio of provincial-level technology market transaction volume to provincial-level GDP as a proxy for the strength of intellectual property protection (IP_level).
The sample firms are divided into high-IP-protection and low-IP-protection subgroups using the median value of IP_level. Subsequent group regression analyses are conducted. Table 9 Columns (5) and (6) reveal statistically significant, positive 1% level regression coefficients for DGT’s influence on CSP across both subgroups. Additionally, a Chow test reveals a notable difference in coefficients between the two groups, implying that the strength of intellectual property protection modulates the relationship between DGT and CSP.
A side-by-side examination of both subgroups reveals that DGT’s beneficial influence on CSP stands out more clearly in areas with rigorous IP safeguards. This observation implies that when intellectual property rights are well-protected, it amplifies the collaborative advantages of innovation, ultimately strengthening the long-term viability of twin transformation approaches.
As summarized in Table 9, the positive influence of DGT on CSP is more pronounced under specific conditions. Notably, the transformative impact of DGT is significantly enhanced in: (1) Heavily polluting industries, where stricter regulatory pressures drive firms toward transformation; (2) Highly competitive markets, which necessitate innovation to sustain a competitive edge; and (3) Regions with robust intellectual property protection, which bolster firms’ capacity to capture innovation returns and safeguard proprietary knowledge. These results underscore the critical impact of external conditions on DGT’s effectiveness for CSP.
5.2.4. Dynamic Effect Analysis
To examine the temporal heterogeneity of digital transformation (DT) and digital and green transformation (DGT) on corporate sustainability performance (CSP), we adopt an event-study approach. The first year in which a firm reaches a high DGT threshold is defined as the event year (t = 0), and we analyze a [−2, +3] year window to capture dynamic effects before and after the transformation. This framework allows us to distinguish between the short-term input phase and longer-term output phase, providing a detailed understanding of the transformation process.
Our findings indicate that DT alone is associated with short-term costs. The coefficients for DT are negative in the year prior to the event (t − 1), the event year (t), and the first year post-event (t + 1), reflecting the high-cost input phase and temporary disruptions due to organizational restructuring. This suggests that conventional DT involves an adjustment period during which firms may experience operational pressures and short-term declines in CSP.
In contrast, DGT exhibits immediate and sustained benefits. Coefficients for DGT are positive and statistically significant from two years before the event (t − 2) through two years after (t + 2), demonstrating that the integration of digital and green initiatives generates rapid and persistent value creation. This pattern indicates that DGT can effectively bypass the short-term disadvantages observed in DT alone, accelerating improvements in CSP. Overall, these results provide strong evidence for the multiplier effect of DGT, showing that firms combining digital and green strategies achieve faster and more stable enhancements in CSP.
Table 10 presents the detailed event-study regression results, reporting coefficients for both DT and DGT across the [−2, +3] time window. Figure 3 visualizes the temporal dynamics, illustrating the negative short-term effects of DT and the sustained positive effects of DGT on CSP.
Table 10.
Event-study regression of DT and DGT effects on CSP.
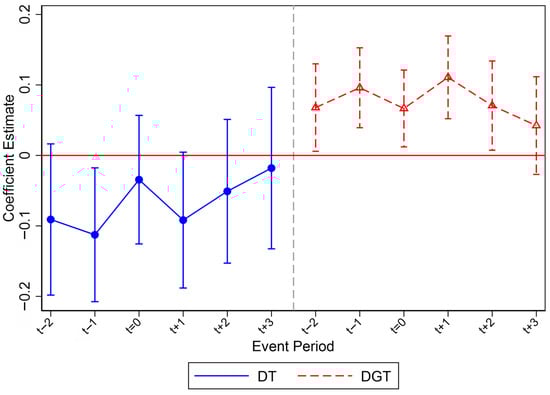
Figure 3.
Dynamic Effects of DT and DGT on CSP. Source: Author’s own work.
6. Conclusions and Recommendations
6.1. Research Conclusions
This research employs the entropy method and the coupling coordination degree model to construct a corporate digital and green transformation (DGT) index. An empirical analysis is conducted to evaluate the impact of DGT on corporate sustainability performance (CSP), explore the underlying mechanisms, and assess the moderating role of environmental regulation. The key findings are summarized below:
First, DGT exerts a statistically significant and sustained positive influence on CSP, with a “multiplier effect” that clearly surpasses the impact of pursuing digital or green transformation alone. While GT consistently shows a robust positive association with CSP, DT’s contribution is more fragile: its positive effect becomes insignificant once control variables are included, and the event-study analysis even reveals short-term negative or insignificant impacts. These findings indicate that DT alone may trigger rebound effects such as rising energy consumption or digital infrastructure burdens, thereby offsetting its efficiency gains. By contrast, GT enhances CSP through environmental legitimacy and stakeholder trust but may be constrained by implementation costs and delayed payoffs. Only when combined as DGT do these transformations generate durable superadditive gains, confirming the theoretical rationale of synergy.
Second, DGT improves CSP by alleviating financing constraints, optimizing resource allocation, expanding knowledge breadth, and enhancing innovation quality through resource and innovation synergy mechanisms. Moreover, two further insights enrich our theoretical understanding. On the one hand, the efficiency-enhancing effect of DGT is more pronounced in state-owned enterprises, suggesting that DGT not only facilitates resource reallocation but also leverages resource advantages to overcome organizational inertia, thereby generating greater efficiency gains. On the other hand, the temporal dynamics of innovation indicate that DGT primarily accelerates short-term innovation quality and diffusion, but contributes less to sustaining long-term, high-impact innovations. This dual mechanism aligns with the literature on rapid diffusion and substitution effects, offering greater operational and theoretical precision to our conclusions.
Third, environmental regulations positively moderate the relationship between DGT and CSP, providing empirical evidence to support local governments in assessing policy effectiveness and formulating targeted regulations. At the same time, the moderating role of regulation may not be uniform across contexts: its effectiveness can vary depending on industry characteristics, firm type, and temporal dynamics of policy implementation. While our empirical models treat regulation as a static factor, actual regulatory impacts may evolve over time, producing differentiated short-term versus long-term effects. This underscores the importance of designing flexible and adaptive regulatory frameworks that can both stimulate firms’ digital-green initiatives and adjust to changing market and technological conditions.
Fourth, the beneficial impact of DGT is more pronounced in heavily polluting industries, highly competitive market environments, and regions with strong intellectual property protection, thereby confirming that contextual factors significantly shape the effectiveness of digital and green transformation strategies.
Fifth, although the positive effect of DGT on CSP is robust across multiple specifications, differences in coefficient magnitudes across models indicate that results can be sensitive to the choice of indicators, control variables, and data structure. This finding highlights the methodological importance of triangulating measures and employing multiple model specifications to ensure the robustness of conclusions.
Sixth, the findings of this study also resonate strongly with the United Nations Sustainable Development Goals (SDGs). By fostering advanced technologies, innovation in production processes, and resilient infrastructure, DGT contributes directly to SDG 9 (Industry, Innovation, and Infrastructure). At the same time, it promotes resource-efficient business models and sustainable value chains, thereby advancing SDG 12 (Responsible Consumption and Production) and SDG 13 (Climate Action). Moreover, the combined digital–green innovation fosters sustainable economic growth and new skilled employment (SDG 8), enhances energy efficiency and the integration of renewable sources (SDG 7), and calls for broad-based collaboration among businesses, governments, and civil society (SDG 17). Positioning DGT within this global framework highlights both its academic significance and its policy relevance for sustainable development.
6.2. Strategic Implications and Practical Recommendations
6.2.1. Firm-Level Strategies for Advancing DGT
(1) Companies are advised to pursue an integrated digital–green strategy. They should leverage DT to accelerate the efficiency and scalability of GT, while allowing GT to direct digital investments toward environmentally meaningful outcomes. Establishing cross-functional digital–green coordination teams, deploying data-driven sustainability monitoring systems, and redesigning workflows around joint digital–green objectives are practical steps to achieve this synergy. These practices, observed in the Chinese corporate context, highlight feasible pathways for improving competitiveness and sustainability. However, their applicability in other institutional or market environments may vary, and thus requires further empirical validation before broader generalization.
(2) To fully combine digital and green transformation, firms may organized systems for allocating resources, aiming to support both Resource Synergy and Innovation Synergy. For instance, companies can experiment with centralized “DGT Resource Hubs” to combine different funding sources (e.g., green loans and digital infrastructure grants) and explore digital-green knowledge-sharing networks with universities and research institutions. Such practices, though primarily identified in China, provide indicative directions rather than prescriptive models for firms in other contexts, where institutional conditions and financial ecosystems may differ significantly.
(3) To respond to evolving environmental rules, companies could consider flexible risk management systems capable of adapting to regulatory shifts. Possible approaches include real-time pollutant monitoring, predictive maintenance of digital equipment, and smart policy analysis tools to track emerging regulations (e.g., carbon border taxes). These measures, though not directly tested in our models, are logically inferred from the observed moderating role of environmental regulation. Their adoption should be treated as exploratory strategies subject to refinement and contextual adaptation.
6.2.2. Policy-Level Strategies and Institutional Support for DGT
The empirical findings provide partial support for designing institutional frameworks to enhance DGT, but the following policy recommendations should be understood as exploratory extensions grounded in logical inference rather than direct causal evidence.
(1) Governments may strengthen top-level design and optimize institutional mechanisms to facilitate the joint implementation of digitalization and green development. Cross-departmental collaboration, targeted incentives, and adoption of digital regulatory tools could enhance supervision and flexibility. However, since our empirical analysis treated regulation as a static factor, these suggestions should be regarded as potential directions for experimentation rather than definitive prescriptions.
(2) Local policymakers could design context-specific policies that align with regional economic and ecological conditions. For example, in areas with high-pollution industries, stronger environmental regulation coupled with advisory support might improve implementation. In regions with intense competition, targeted funds to overcome technological bottlenecks could be beneficial, while robust intellectual property protection may strengthen innovation environments. These proposals resonate with the heterogeneity findings of our study but remain contingent on broader institutional and cultural contexts beyond China, requiring careful adaptation in other regions.
6.3. Limitations and Future Research Directions
Notwithstanding its contributions, this study acknowledges several inherent limitations that also present opportunities for future research. First, the construction of the DGT index relies on publicly available secondary data and eight secondary-level indicators, six of which are numerical and two derived from textual analysis of corporate reports. While the numerical indicators are objective, the textual indicators may be subject to bias, as firms could overstate their digital or green initiatives or the content may not fully reflect actual operational intensity. Such bias may introduce minor measurement error, potentially yielding conservative estimates of DGT’s effect on CSP. Future research could combine textual analysis with surveys, interviews, or internal data to enhance measurement accuracy. Second, the empirical analysis is conducted exclusively on Chinese A-share listed companies. Although this sample is representative of China’s most strategically important and resource-rich firms and allows for high-quality data collection, it excludes the vast population of non-listed firms, which may limit the generalizability of the findings. Importantly, as non-listed firms typically face more severe resource constraints, our results, derived from a sample of less constrained firms, might rather provide a conservative estimate of DGT’s effects, potentially underestimating its true value for firms with optimal conditions. Future research should test the applicability of these findings by investigating non-listed firms and SMEs. Finally, the Chinese context, characterized by strong state guidance and unique institutional pressures, shapes the manifestation of DGT. While this offers valuable insights for other emerging economies with similar governance models, cross-country comparative analyses are needed to disentangle the universal mechanisms of DGT from context-specific factors.
Author Contributions
Conceptualization, Y.Z.; methodology, Y.Z.; software, Y.Z.; validation, C.L. and Y.Z.; formal analysis, Y.Z.; investigation, C.L.; resources, C.L.; data curation, Y.Z.; writing—original draft preparation, Y.Z.; writing—review and editing, Y.Z. and C.L.; visualization, Y.Z.; supervision, C.L.; project administration, C.L.; funding acquisition, C.L. All authors have read and agreed to the published version of the manuscript.
Funding
This work was supported by Shaanxi Provincial Natural Science Basic Research Program Project (2023-JC-YB-609), General Program of the National Natural Science Foundation of China (72572127), and General Program of the National Natural Science Foundation of China (72172123).
Data Availability Statement
Data will be made available on request by the corresponding author.
Conflicts of Interest
The authors declare no conflicts of interest.
Appendix A
Table A1.
Sample Distribution.
Table A1.
Sample Distribution.
| Category | Option | Sample Size (N = 16,331) | ||
|---|---|---|---|---|
| Number | Proportion (%) | |||
| Industry | A (Agriculture, Forestry, Animal Husbandry, and Fishery) | 114 | 0.70 | |
| B (Mining Industry) | 220 | 1.35 | ||
| C (Manufacturing Industry) | C1X (Light Industry and Consumer Manufacturing) | 1048 | 6.42 | |
| C2X (Material Processing and Chemical Industry) | 3606 | 22.08 | ||
| C3X (Equipment Manufacturing and High-End Manufacturing) | 8195 | 50.18 | ||
| C4X (Emerging Manufacturing and Resource Recycling) | 456 | 2.81 | ||
| D (Electricity, Heat, Gas, and Water Production and Supply Industry) | 179 | 1.10 | ||
| E (Construction Industry) | 438 | 2.68 | ||
| F (Wholesale and Retail Industry) | 105 | 0.64 | ||
| G (Transportation, Warehousing, and Postal Services) | 90 | 0.55 | ||
| I (Information Transmission, Software, and Information Technology Services) | 1291 | 7.91 | ||
| K (Real Estate Industry) | 16 | 0.10 | ||
| L (Leasing and Business Services) | 37 | 0.23 | ||
| M (Scientific Research and Technology Services) | 265 | 1.62 | ||
| N (Water Conservancy, Environment, and Public Facilities Management) | 213 | 1.30 | ||
| P (Education) | 4 | 0.02 | ||
| Q (Health and Social Work) | 17 | 0.10 | ||
| R (Culture, Sports, and Entertainment Industry) | 30 | 0.18 | ||
| S (Public Administration, Social Security, and Social Organizations) | 4 | 0.02 | ||
| Region | Eastern China | 12,347 | 75.60 | |
| Central China | 2522 | 15.44 | ||
| Western China | 1462 | 8.95 | ||
| Ownership | State-Owned Enterprises (SOEs) | 4397 | 26.92 | |
| Private Enterprises | 11,934 | 73.08 | ||
| Firm Size | Large-Scale Enterprises | 8165 | 0.5 | |
| Small and Medium-Sized Enterprises (SMEs) | 8166 | 0.5 | ||
Source: Compiled by the authors.
Table A2.
Robustness Tests with Alternative IV Constructions.
Table A2.
Robustness Tests with Alternative IV Constructions.
| (1) | (2) | (3) | (4) | (5) | (6) | (7) | (8) | |
|---|---|---|---|---|---|---|---|---|
| First-Stage | Second-Stage | First-Stage | Second-Stage | First-Stage | Second-Stage | First-Stage | Second-Stage | |
| DGT | CSP | DGT | CSP | DGT | CSP | DGT | CSP | |
| DGT | 1.853 *** | 1.935 *** | 1.854 *** | 1.484 *** | ||||
| (0.244) | (0.163) | (0.245) | (0.260) | |||||
| IV1 | 0.702 *** | |||||||
| (0.057) | ||||||||
| IV1_95%_trimmed | 0.690 *** | |||||||
| (0.056) | ||||||||
| IV1_99%_trimmed | 0.697 *** | |||||||
| (0.056) | ||||||||
| IV1_median | 0.551 *** | |||||||
| (0.049) | ||||||||
| F-test | 394.74 | 394.04 | 394.59 | 393.35 | ||||
| KPL | 1703.119 | 1676.132 | 1698.216 | 1703.214 | ||||
| CDF | 2630.043 | 2546.397 | 2603.495 | 2499.976 | ||||
| KPF | 2567.910 | 2470.480 | 2548.452 | 2522.911 | ||||
| Control | YES | YES | YES | YES | YES | YES | YES | YES |
| Firm FE | YES | YES | YES | YES | YES | YES | YES | YES |
| Year FE | YES | YES | YES | YES | YES | YES | YES | YES |
| Constant | −0.572 *** | −1.164 *** | −0.560 *** | −1.137 *** | −0.568 *** | −1.164 *** | −0.515 *** | −1.287 *** |
| (0.071) | (0.219) | (0.071) | (0.219) | (0.071) | (0.219) | (0.070) | (0.222) | |
| R2 | 0.421 | 0.079 | 0.421 | 0.080 | 0.421 | 0.079 | 0.418 | 0.074 |
| N | 16,331 | 16,331 | 13,005 | 13,005 | 16,331 | 16,331 | 16,331 | 16,331 |
Note: *** p < 0.001, with standard errors in parentheses. KPL represents Kleibergen-Paap rk LM statistic. KPF represents Kleibergen-Paap rk Wald F statistic. CDF represents Cragg-Donald Wald F statistic.
Table A3.
Entropy Weights of Secondary Indicators for Digital and Green Transformation.
Table A3.
Entropy Weights of Secondary Indicators for Digital and Green Transformation.
| Primary Dimension | Secondary Indicator | Weight | Aggregate |
|---|---|---|---|
| Digital Transformation (DT) | Digital Strategy Layout | 0.1254 | 0.5056 |
| Digital R&D Investment | 0.1278 | ||
| Digital Business Management | 0.1274 | ||
| Digital Innovation Upgrading | 0.125 | ||
| Green Transformation(GT) | Green Strategic Planning | 0.1156 | 0.4944 |
| Green Management Investment | 0.1277 | ||
| Green Governance Actions | 0.1245 | ||
| Green Technological Innovation | 0.1266 |
Note: The aggregated entropy weights for DT and GT are 0.5056 and 0.4944, respectively, with an absolute difference of only 0.0056, indicating a nearly equal contribution to the DGT index.
Table A4.
Entropy Weights of Secondary Indicators for High-Tech vs. Non-High-Tech Firms.
Table A4.
Entropy Weights of Secondary Indicators for High-Tech vs. Non-High-Tech Firms.
| Primary Dimension | Secondary Indicator | High-Tech Firms | Non-High-Tech Firms | ||
|---|---|---|---|---|---|
| Weight | Aggregate | Weight | Aggregate | ||
| DT | Digital Strategy Layout | 0.1249 | 0.5025 | 0.1256 | 0.5036 |
| Digital R&D Investment | 0.1266 | 0.1263 | |||
| Digital Business Management | 0.1265 | 0.1262 | |||
| Digital Innovation Upgrading | 0.1245 | 0.1255 | |||
| GT | Green Strategic Planning | 0.1203 | 0.4975 | 0.1191 | 0.4964 |
| Green Management Investment | 0.1267 | 0.1263 | |||
| Green Governance Actions | 0.1246 | 0.1252 | |||
| Green Technological Innovation | 0.1259 | 0.1258 | |||
Note: Even in high-tech firms, where digitalization might intuitively be expected to dominate, the DT entropy weight is only 0.5025—deviating from 0.5 by just 0.0025—indicating that green transformation remains equally critical.
Table A5.
Robustness Tests with Alternative CSP Measurements.
Table A5.
Robustness Tests with Alternative CSP Measurements.
| (1) CSP1 | (2) CSP2 | (3) CSP3 | |
|---|---|---|---|
| ROA × CNRDS ESG | ROA × Bloomberg ESG | ROA × Carbon Emission Intensity | |
| DGT | 0.323 *** (0.070) | 0.364 *** (0.132) | 0.120 *** (0.0259) |
| Control | YES | YES | YES |
| Firm FE | YES | YES | YES |
| Year FE | YES | YES | YES |
| Constant | −2.714 *** (0.486) | −4.106 *** (0.971) | 9.411 *** (0.320) |
| N | 16,331 | 4729 | 13,974 |
| Within-R2 | 0.569 | 0.567 | 0.723 |
Note: Standard errors in parentheses. *** p < 0.01.
Table A6.
Robustness Tests of Resource Coordination Mechanism.
Table A6.
Robustness Tests of Resource Coordination Mechanism.
| (1) | (2) | (3) | (4) | |
|---|---|---|---|---|
| Main Effect | Resource Synergy Mechanism | |||
| CSP | TFP_OLS | TFP_FE | SA Index | |
| DGT | 0.191 *** (6.16) | 0.061 *** (2.79) | −0.00625 (−0.21) | −0.0199 ** (−3.05) |
| DGT × SOE | 0.139 ** (3.22) | |||
| Control | YES | YES | YES | YES |
| Firm FE | YES | YES | YES | YES |
| Year FE | YES | YES | YES | YES |
| Constant | −1.479 *** (−7.19) | −7.668 *** (−65.34) | −6.010 *** (−42.10) | 3.469 *** (99.22) |
| N | 16,331 | 16,331 | 16,331 | 16,331 |
| Within-R2 | 0.129 | 0.898 | 0.815 | 0.868 |
Note: t statistics in parentheses. ** p < 0.05, *** p < 0.01.
Table A7.
Robustness Test of Innovation Quality Measurement (Forward Citations with Longer Windows).
Table A7.
Robustness Test of Innovation Quality Measurement (Forward Citations with Longer Windows).
| Innovation Quality | |||||
|---|---|---|---|---|---|
| (1) | (2) | (3) | (4) | (5) | |
| 1-Year | 2-Year | 3-Year | 4-Year | 5-Year | |
| DGT | 1.181 *** | −0.645 *** | −0.907 *** | −1.083 *** | −1.347 *** |
| (0.124) | (0.157) | (0.179) | (0.201) | (0.213) | |
| Control | YES | YES | YES | YES | YES |
| Firm FE | YES | YES | YES | YES | YES |
| Year FE | YES | YES | YES | YES | YES |
| Constant | −9.388 *** | −14.314 *** | −12.758 *** | −10.476 *** | −9.341 *** |
| (0.832) | (1.284) | (1.372) | (1.451) | (1.515) | |
| N | 16,331 | 14,585 | 13,243 | 11,745 | 10,310 |
| Within-R2 | 0.675 | 0.524 | 0.587 | 0.634 | 0.666 |
Note: *** p < 0.01, with t-values in parentheses.
Table A8.
Heterogeneity Analysis by Industry Competition (Revenue-based HHI).
Table A8.
Heterogeneity Analysis by Industry Competition (Revenue-based HHI).
| (1) | (2) | |
|---|---|---|
| CSP | ||
| high_Compet1 = 0 | high_Compet1 = 1 | |
| DGT | 0.173 *** (0.038) | 0.187 *** (0.048) |
| Control | YES | YES |
| Firm FE | YES | YES |
| Year FE | YES | YES |
| Constant | −0.899 *** (0.278) | −1.990 *** (0.293) |
| N | 8174 | 8157 |
| R2 | 0.108 | 0.164 |
| adj. R2 | 0.107 | 0.162 |
| Chow Test (p-Value) | 4.69 (0.0000) | |
Note: *** p < 0.01, with standard errors in parentheses.
Appendix B
Table A9.
Keywords for Digital Strategy Layout.
Table A9.
Keywords for Digital Strategy Layout.
| Dimension | Keywords | |
|---|---|---|
| Digital Strategy Layout | Application of digital technology | Data management, data mining, data networks, data platforms, data centers, data science, digital control, digital technology, digital communications, digital networks, digital intelligence, digital terminals, digital marketing, digitization, big data, cloud computing, cloud IT, cloud ecosystems, cloud services, cloud platforms, blockchain, Internet of Things (IoT), machine learning |
| Internet business model | Mobile Internet, Industrial Internet, Industrial Internet, Internet Solutions, Interconnected technology, internet thinking, internet action, internet business, internet mobile, internet applications, internet marketing, internet strategy, internet platform, internet model, internet business model, internet ecosystem, e-commerce, e-commerce, internet, internet+, online and offline, online to offline, online and offline, O2O, B2B, C2C, B2C, C2B, 5G, WeChat, intranet, intranet, intranet, intranet | |
| smart manufacturing | Artificial Intelligence, Advanced Intelligence, Industrial Intelligence, Mobile Intelligence, Intelligent Control, Intelligent Terminals, Intelligent Mobility, Intelligent Management, Smart Factories, Intelligent Logistics, Intelligent Manufacturing, Intelligent Warehousing, Intelligent Technology, Intelligent Devices, Intelligent Production, Intelligent Networking, Intelligent Systems, Intelligence, Automatic Control, Automatic Monitoring, Automatic Surveillance, Automatic Detection, Automatic Production, CNC, Integration, Integrated Solutions, Integrated Control, Integrated Systems, Industrial Cloud, Future Factories, Intelligent Fault Diagnosis, Lifecycle Management, Manufacturing Execution System, Virtualization, Virtual Manufacturing, AI, CAD, CAM, Computer-Aided Design, Computer-Aided Manufacturing | |
| informatization | Information sharing, information management, information integration, information software, information systems, information networks, information terminals, information centers, informatization, networking, industrial information, industrial communications |
Table A10.
Keywords for Green Strategy Layout.
Table A10.
Keywords for Green Strategy Layout.
| Dimension | Keywords | |
|---|---|---|
| Green Strategy Layout | Monitoring management | environmental protection effect; Ecological civilization system; Ecological security guarantee mechanism; Ecological risk prevention and control system; Environmental governance system; Environmental protection system; Green technology innovation system; Comprehensive mechanism; Universal governance; Social innovation; Social governance |
| Pollution control | Environmental governance concept; Environmental governance methods; Comprehensive environmental governance; Source prevention and control; Environmental governance model; Environmental pollution governance; Ecological governance; Ecological remediation; Pollution prevention and control; Pollution governance; Pollution prevention; Control; corporate pollution prevention and control; corporate ecological protection; corporate environmental responsibility; Company environmental responsibility; Company ecological governance | |
| Technological innovation | Recycling; Reducing energy consumption; Improving resource utilization rate; Improving recycling level; Energy reduction; Resource recycling; New energy development; Ecological restoration; Recycling; Increasing utilization rate; Emission reduction; Increasing utilization rate; Green innovation; Green technology; Low pollution transformation; Environmental protection technology; Governance technology; Governance level; Ecological technology; Technology; Company upgrade; Company equipment upgrade | |
| Strategic concepts | Green development; Circular development; Low-carbon development; Sustainable development; Low pollution development; Ecological civilization concept; Green development strategy; Green upgrading strategy; Green technology strategy; Green innovation strategy; Ecological protection awareness; Ecological protection strategy; Ecological prevention concept; Low-carbon life; Green life; Green production; Green consumption; Green finance; Green governance; Green construction; Green building; Low-carbon building; Sustainable growth; Green upgrading; Environmental protection awareness; Environmental management |
Table A11.
The related keywords of environmental regulation.
Table A11.
The related keywords of environmental regulation.
| Related Keywords | |
|---|---|
| Environmental Regulation | environmental protection, pollution control, smog, smog control, pollution, energy consumption, pollution treatment, emissions reduction, emissions, ecological environment, ecological protection, ecological destruction, water ecology, low carbon, sulfur dioxide, carbon dioxide, PM10, PM2.5, chemical oxygen demand (COD), scattered pollution, emissions, air, water environment, water quality, clear water, black and odorous water, wastewater, exhaust gases, waste residues, environmental violations, environmental crimes, environmental cases, environmental penalties, environmental governance, environmental quality, blue skies, coal combustion, afforestation, dust, exhaust fumes, VOCs, etc. |
Note: The list of keywords is adopted from prior studies on textual measurement of environmental regulation and authoritative policy documents such as the China Environmental Yearbook and terminology used by the Ministry of Ecology and Environment. This ensures that the classification reflects established concepts in Chinese environmental governance rather than researcher-defined criteria.
Table A12.
Industries and Their Codes by Pollution Intensity Levels.
Table A12.
Industries and Their Codes by Pollution Intensity Levels.
| Pollution Intensity Level | Industries (Industry Code) |
|---|---|
| Heavily Polluting Industries | Coal Mining and Dressing (B06); Ferrous Metal Ore Mining (B08); Non-Ferrous Metal Ore Mining (B09); Textile Industry (C17); Papermaking Industry (C22); Petroleum Processing (C25); Chemical Fibers (C28); Non-Metal Products Manufacturing (C30); Ferrous Metal Smelting and Processing (C31); Non-Ferrous Metal Smelting and Processing (C32); Electricity Generation (D44); Petroleum Extraction (B07); Non-Metal Ore Mining (B10); Agricultural and Sideline Products Processing (C13); Food Manufacturing (C14); Beverage Manufacturing (C15); Leather and Feather Products (C19); Cultural, Educational, and Sports Goods (C24); Pharmaceutical Manufacturing (C27); Plastic Products (C29); Metal Products (C33); Transportation Equipment (C36); Gas Production (D45); Water Production and Supply (D46) |
| Moderately Polluting Industries | Tobacco Processing (C16); Garment Industry (C18); Wood Processing (C20); Furniture Manufacturing (C21); Printing Industry (C23); Rubber Products (C29); General Equipment Manufacturing (C34); Specialized Equipment Manufacturing (C35); Electrical Machinery and Equipment (C38); Communication Equipment (C39); Instruments and Meters (C40) |
References
- Huang, H.; Hao, S. Enterprise Digital Transformation and Sustainable Development Performance: The Asymmetric Roles of Top Management Team Faultlines. Sustain. Dev. 2025, 33, 1670–1685. [Google Scholar] [CrossRef]
- Le, T.T.; Nhu, Q.P.V.; Bao, T.B.N.; Thao, L.V.N.; Pereira, V. Digitalisation Driving Sustainable Corporate Performance: The Mediation of Green Innovation and Green Supply Chain Management. J. Clean. Prod. 2024, 446, 141290. [Google Scholar] [CrossRef]
- Li, L.; Lin, J. Digital Transformation for the Sustainable Development of Firms: The Role of Green Capability and Green Culture. Sustain. Dev. 2024, 32, 1861–1875. [Google Scholar] [CrossRef]
- Le, T.T. How Do Corporate Social Responsibility and Green Innovation Transform Corporate Green Strategy into Sustainable Firm Performance? J. Clean. Prod. 2022, 362, 132228. [Google Scholar] [CrossRef]
- Shahzad, M.; Qu, Y.; Zafar, A.U.; Rehman, S.U.; Islam, T. Exploring the Influence of Knowledge Management Process on Corporate Sustainable Performance through Green Innovation. J. Knowl. Manag. 2020, 24, 2079–2106. [Google Scholar] [CrossRef]
- Christmann, A.S.; Crome, C.; Graf-Drasch, V.; Oberländer, A.M.; Schmidt, L. The Twin Transformation Butterfly: Capabilities for an Integrated Digital and Sustainability Transformation. Bus. Inf. Syst. Eng. 2024, 66, 489–505. [Google Scholar] [CrossRef]
- Diodato, D.; Huergo, E.; Moncada-Paternò-Castello, P.; Rentocchini, F.; Timmermans, B. Introduction to the Special Issue on “The Twin (Digital and Green) Transition: Handling the Economic and Social Challenges”. Ind. Innov. 2023, 30, 755–765. [Google Scholar] [CrossRef]
- Ferreira, J.J.; Fernandes, C.I.; Veiga, P.M.; Caputo, A. The Interactions of Entrepreneurial Attitudes, Abilities and Aspirations in the (Twin) Environmental and Digital Transitions? A Dynamic Panel Data Approach. Technol. Soc. 2022, 71, 102121. [Google Scholar] [CrossRef]
- Bianchini, S.; Damioli, G.; Ghisetti, C. The Environmental Effects of the “Twin” Green and Digital Transition in European Regions. Environ. Resour. Econ. 2023, 84, 877–918. [Google Scholar] [CrossRef]
- Herczeg, B.; Pintér, É.; Bagó, P. How Green and Digital Transformation Shapes Industries: Twin Transition to a Green and Digital Future. Vezetéstudomány-Budapest Manag. Rev. 2023, 54, 51–63. [Google Scholar] [CrossRef]
- Faggian, A.; Marzucchi, A.; Montresor, S. Regions Facing the ‘Twin Transition’: Combining Regional Green and Digital Innovations. Reg. Stud. 2025, 59, 2398555. [Google Scholar] [CrossRef]
- Brueck, C.; Losacker, S.; Liefner, I. China’s Digital and Green (Twin) Transition: Insights from National and Regional Innovation Policies. Reg. Stud. 2025, 59, 2384411. [Google Scholar] [CrossRef]
- Demartini, M.; Evans, S.; Tonelli, F. Digitalization Technologies for Industrial Sustainability. Procedia Manuf. 2019, 33, 264–271. [Google Scholar] [CrossRef]
- Zhu, Q.; Ma, D.; He, X. Digital Transformation and Firms’ Pollution Emissions. Technol. Forecast. Soc. Change 2023, 197, 122910. [Google Scholar] [CrossRef]
- Veugelers, R.; Faivre, C.; Rückert, D.; Weiss, C. The Green and Digital Twin Transition: EU vs. US Firms. Intereconomics 2023, 58, 56–62. [Google Scholar] [CrossRef]
- Ye, F.; Zheng, J.; Li, Y.; Li, L.; Linghu, D. Exploring the Fusion of Greening and Digitalization for Sustainability. J. Clean. Prod. 2024, 442, 141085. [Google Scholar] [CrossRef]
- Lan, L.; Zhou, Z. Complementary or Substitutive Effects? The Duality of Digitalization and ESG on Firm’s Innovation. Technol. Soc. 2024, 77, 102567. [Google Scholar] [CrossRef]
- Chaturvedi, K.; Chataway, J.; Wield, D. Policy, Markets and Knowledge: Strategic Synergies in Indian Pharmaceutical Firms. Technol. Anal. Strateg. Manag. 2007, 19, 565–588. [Google Scholar] [CrossRef]
- Barney, J. Firm Resources and Sustained Competitive Advantage. J. Manag. 1991, 17, 99–120. [Google Scholar] [CrossRef]
- Hart, S.L. A Natural-Resource-Based View of the Firm. Acad. Manag. Rev. 1995, 20, 986–1014. [Google Scholar] [CrossRef]
- Teece, D.J.; Pisano, G.; Shuen, A. Dynamic Capabilities and Strategic Management. Strateg. Manag. J. 1997, 18, 509–533. [Google Scholar] [CrossRef]
- DiMaggio, P.J.; Powell, W.W. The Iron Cage Revisited: Institutional Isomorphism and Collective Rationality in Organizational Fields. Am. Sociol. Rev. 1983, 48, 147–160. [Google Scholar] [CrossRef]
- Porter, M.E.; van der Linde, C. Toward a New Conception of the Environment–Competitiveness Relationship. J. Econ. Perspect. 1995, 9, 97–118. [Google Scholar] [CrossRef]
- National Data Administration of China. Digital China Development Report (2024); National Data Administration of China: Beijing, China, 2025. Available online: https://www.nda.gov.cn/sjj/ywpd/sjzg/0429/20250429185719359511883_pc.html (accessed on 20 July 2025).
- Ologeanu-Taddei, R.; Hönigsberg, S.; Weritz, P.; Wache, H.; Mittermeier, F.; Tana, S.; Dang, D.; Hautala-Kankaanpää, T.; Pekkola, S. The Relationship of Digital Transformation and Corporate Sustainability: Synergies and Tensions. Technol. Forecast. Soc. Change 2025, 210, 123809. [Google Scholar] [CrossRef]
- Cai, C.; Tu, Y.; Li, Z. Enterprise Digital Transformation and ESG Performance. Financ. Res. Lett. 2023, 58, 104692. [Google Scholar] [CrossRef]
- Deng, X.J.; Yuan, M.Q.; Luo, C.Y. Corporate Digital Transformation, Market Competition, and the Environmental Performance—Microevidence from Chinese Manufacturing. Bus. Strateg. Environ. 2024, 33, 3279–3298. [Google Scholar] [CrossRef]
- Péréa, C.; Gérard, J.; de Benedittis, J. Digital Sobriety: From Awareness of the Negative Impacts of IT Usages to Degrowth Technology at Work. Technol. Forecast. Soc. Change 2023, 194, 122670. [Google Scholar] [CrossRef]
- Xi, L.; Wang, H. The Influence of Green Transformation on ESG Management and Sustainable Competitive Advantage: An Empirical Comparison of Companies in the Pearl River Delta and Yangtze River Delta. Sustainability 2024, 16, 7911. [Google Scholar] [CrossRef]
- Asif, M.U.; Bakar, L.J.A. Green Strategic Orientation and Sustainable Performance of SMEs: Moderating Role of Environmental Turbulence. J. Knowl. Econ. 2025, 1–29. [Google Scholar] [CrossRef]
- Oyelakin, I.O.; Yusuf, A.H.; Arbak, S.; Dhar, B.K. Building Resource Capabilities through Green Servitization and ISO 14001 for Sustainable Performance: Perspectives from Manufacturing Firms. Corp. Soc. Responsib. Environ. Manag. 2025, 32, 3770–3784. [Google Scholar] [CrossRef]
- Nguyen, N.T.T.; Nguyen, P.V.; Vrontis, D.; Vo, N.T.T. Enhancing Organizational Sustainable Performance through Green Innovation: The Roles of Knowledge Application, Government Policy, and Green Market Orientation. J. Knowl. Manag. 2025, 29, 870–890. [Google Scholar] [CrossRef]
- Cao, Y.; Li, X.; Hu, H.; Wan, G.; Wang, S. How Does Digitalization Drive the Green Transformation in Manufacturing Companies? An Exploratory Case Study from the Perspective of Resource Orchestration Theory. Manag. World 2023, 39, 96–112. [Google Scholar] [CrossRef]
- Rehman, S.U.; Giordino, D.; Zhang, Q.; Alam, G.M. Twin Transitions & Industry 4.0: Unpacking the Relationship Between Digital and Green Factors to Determine Green Competitive Advantage. Technol. Soc. 2023, 73, 102227. [Google Scholar] [CrossRef]
- Liu, X.; Liu, F.; Ren, X. Firms’ Digitalization in Manufacturing and the Structure and Direction of Green Innovation. J. Environ. Manag. 2023, 335, 117525. [Google Scholar] [CrossRef] [PubMed]
- Wang, B.; Kang, Q. Digital Transformation and Enterprise Sustainable Development Performance. Bus. Manag. J. 2023, 45, 161–176. [Google Scholar] [CrossRef]
- Zhao, S.; Zhang, L.; Peng, L.; Zhou, H.; Hu, F. Enterprise Pollution Reduction through Digital Transformation? Evidence from Chinese Manufacturing Enterprises. Technol. Soc. 2024, 77, 102520. [Google Scholar] [CrossRef]
- Kurniawan, T.A.; Othman, M.H.D.; Hwang, G.H.; Gikas, P. Unlocking Digital Technologies for Waste Recycling in Industry 4.0 Era: A Transformation towards a Digitalization-Based Circular Economy in Indonesia. J. Clean. Prod. 2022, 357, 131911. [Google Scholar] [CrossRef]
- Hao, X.; Li, Y.; Ren, S.; Wu, H.; Hao, Y. The Role of Digitalization on Green Economic Growth: Does Industrial Structure Optimization and Green Innovation Matter? J. Environ. Manag. 2023, 325, 116504. [Google Scholar] [CrossRef]
- Chen, X.; Huang, Y.; Gao, Y. Can Urban Low-Carbon Transitions Promote Enterprise Digital Transformation? Financ. Res. Lett. 2024, 59, 104807. [Google Scholar] [CrossRef]
- Montresor, S.; Vezzani, A. Digital Technologies and Eco-Innovation. Evidence of the Twin Transition from Italian Firms. Ind. Innov. 2023, 30, 766–800. [Google Scholar] [CrossRef]
- Chen, J.L. The Synergistic Effects of IT-Enabled Resources on Organizational Capabilities and Firm Performance. Inf. Manag. 2012, 49, 142–150. [Google Scholar] [CrossRef]
- Wu, H.; Hu, S. The Impact of Synergy Effect between Government Subsidies and Slack Resources on Green Technology Innovation. J. Clean. Prod. 2020, 274, 122682. [Google Scholar] [CrossRef]
- Zhang, Y.; Xing, C.; Wang, Y. Does Green Innovation Mitigate Financing Constraints? Evidence from China’s Private Enterprises. J. Clean. Prod. 2020, 264, 121698. [Google Scholar] [CrossRef]
- Peng, Y.; Tao, C. Can Digital Transformation Promote Enterprise Performance?—From the Perspective of Public Policy and Innovation. J. Innov. Knowl. 2022, 7, 100198. [Google Scholar] [CrossRef]
- Xu, Y.; Yuan, L.; Khalfaoui, R.; Radulescu, M.; Mallek, S.; Zhao, X. Making Technological Innovation Greener: Does Firm Digital Transformation Work? Technol. Forecast. Soc. Change 2023, 197, 122928. [Google Scholar] [CrossRef]
- Wu, L.; Lou, B.; Hitt, L. Data Analytics Supports Decentralized Innovation. Manag. Sci. 2019, 65, 4863–4877. [Google Scholar] [CrossRef]
- Dai, X.; Yang, S. Digital Empowerment, Source of Digital Input and Green Manufacturing. China Ind. Econ. 2022, 9, 83–101. [Google Scholar] [CrossRef]
- Han, Y. Impact of Environmental Regulation Policy on Environmental Regulation Level: A Quasi-Natural Experiment Based on Carbon Emission Trading Pilot. Environ. Sci. Pollut. Res. 2020, 27, 23602–23615. [Google Scholar] [CrossRef]
- Alexopoulos, I.; Kounetas, K.; Tzelepis, D. Environmental and Financial Performance. Is There a Win-Win or a Win-Loss Situation? Evidence from the Greek Manufacturing. J. Clean. Prod. 2018, 197, 1275–1283. [Google Scholar] [CrossRef]
- Bai, F.; Huang, Y.; Zhang, Q.; Shang, M. Unleashing the Power of Green Culture: Exploring the Path to Sustainable Development Performance in Enterprises. Sustain. Dev. 2024, 32, 3226–3247. [Google Scholar] [CrossRef]
- Godbole, M.; Rao, L.M. Does Internationalization and Board Diversity Affect Family Firms’ Sustainable Performance? Empirical Evidence from an Emerging Economy. Bus. Strateg. Dev. 2024, 7, e365. [Google Scholar] [CrossRef]
- Sun, H.; Bai, T.; Fan, Y.; Liu, Z. Environmental, Social, and Governance Performance and Enterprise Sustainable Green Innovation: Evidence from China. Corp. Soc. Responsib. Environ. Manag. 2024, 31, 3633–3650. [Google Scholar] [CrossRef]
- Thomakos, D.D.; Alexopoulos, T.A. Carbon Intensity as a Proxy for Environmental Performance and the Informational Content of the EPI. Energy Policy 2016, 94, 179–190. [Google Scholar] [CrossRef]
- López-Pérez, G.; García-Sánchez, I.M.; Giménez, V.; Zafra-Gómez, J.L. Comparative Analysis of Corporate Environmental Performance in Terms of Eco-Innovation: Developing a Dominance Index (DMI) Approach. Corp. Soc. Responsib. Environ. Manag. 2025. (online). [Google Scholar] [CrossRef]
- Mu, W.; Liu, K.; Tao, Y.; Ye, Y. Digital Finance and Corporate ESG. Financ. Res. Lett. 2023, 51, 103426. [Google Scholar] [CrossRef]
- Luo, X.; Lyu, C. Green Bonds Drive Environmental Performance: Evidences from China. Sustainability 2024, 16, 4223. [Google Scholar] [CrossRef]
- Gao, L.; Huang, R. Digital Transformation and Green Total Factor Productivity in the Semiconductor Industry: The Role of Supply Chain Integration and Economic Policy Uncertainty. Int. J. Prod. Econ. 2024, 274, 109313. [Google Scholar] [CrossRef]
- Jiang, K.; Zhou, M.; Chen, Z. Digitalization and Firms’ Systematic Risk in China. Int. J. Financ. Econ. 2025, 30, 522–551. [Google Scholar] [CrossRef]
- Li, Y. Corporate Green Transformation and Stock Returns: Evidence from Chinese Listed Manufacturing Firms. Appl. Econ. 2025, 57, 3236–3252. [Google Scholar] [CrossRef]
- Tan, W.; Yan, E.H.; Yip, W.S. Go Green: How Does Green Credit Policy Promote Corporate Green Transformation in China. J. Int. Financ. Manag. Account. 2025, 36, 38–67. [Google Scholar] [CrossRef]
- Feng, Y.; Gao, Y.; Hu, S.; Sun, M.; Zhang, C. How Does Digitalization Affect the Green Transformation of Enterprises Registered in China’s Resource-Based Cities? Further Analysis on the Mechanism and Heterogeneity. J. Environ. Manag. 2024, 365, 121560. [Google Scholar] [CrossRef]
- Zhuo, C.; Chen, J. Can Digital Transformation Overcome the Enterprise Innovation Dilemma: Effect, Mechanism and Effective Boundary. Technol. Forecast. Soc. Change 2023, 190, 122378. [Google Scholar] [CrossRef]
- Loughran, T.; McDonald, B. When Is a Liability Not a Liability? Textual Analysis, Dictionaries, and 10-Ks. J. Financ. 2011, 66, 35–65. [Google Scholar] [CrossRef]
- Chen, Y.; Ma, X.; Ma, X.; Shen, M.; Chen, J. Does Green Transformation Trigger Green Premiums? Evidence from Chinese Listed Manufacturing Firms. J. Clean. Prod. 2023, 407, 136858. [Google Scholar] [CrossRef]
- Yang, Z.G.; Wang, H.S.; Yue, Z.Y.; Li, G. Customer Enterprises’ Digital Transformation, Suppliers’ Carbon Emission Reduction and Carbon Information Disclosure Accommodation. China Ind. Econ. 2024, 8, 83–101. [Google Scholar] [CrossRef]
- Wang, L.; Long, Y.; Li, C. Research on the Impact Mechanism of Heterogeneous Environmental Regulation on Enterprise Green Technology Innovation. J. Environ. Manag. 2022, 322, 116127. [Google Scholar] [CrossRef]
- Sun, X.H.; Ma, X.J.; Kong, Y.J.; Yu, T. The Digital Divide in China’s Manufacturing Industry: An Analytical Framework of Access-Application-Conversion. Manag. World 2025, 41, 38–58. [Google Scholar] [CrossRef]
- Zhang, Y.; Deng, Y.; Yang, O.; Xia, D.; Liu, H. Substantive or Symbolic? The Strategic Choice of Sustainable Environmental Strategy for Enterprises Induced by the New Environmental Protection Law. Sustain. Dev. 2024, 32, 7461–7481. [Google Scholar] [CrossRef]
- Liu, G.; Yang, Z.; Zhang, F.; Zhang, N. Environmental Tax Reform and Environmental Investment: A Quasi-Natural Experiment Based on China’s Environmental Protection Tax Law. Energy Econ. 2022, 109, 106000. [Google Scholar] [CrossRef]
- Hammerschmidt, J.; Burtscher, J.; Gast, J.; Kraus, S.; Puumalainen, K. Navigating the Twin Transformation: How Digitalization and Sustainability Shape the Future. Strateg. Change 2025. [Google Scholar] [CrossRef]
- Tabares, S.; Parida, V.; Chirumalla, K. Twin Transition in Industrial Organizations: Conceptualization, Implementation Framework, and Research Agenda. Technol. Forecast. Soc. Change 2025, 213, 123995. [Google Scholar] [CrossRef]
- She, Q.; Qian, J.; He, L. Research on the Relationship of Coupling Coordination Between Digitalization and Green Development. Sci. Rep. 2024, 14, 19569. [Google Scholar] [CrossRef] [PubMed]
- Ding, X.; Sheng, Z.; Appolloni, A.; Shahzad, M.; Han, S. Digital Transformation, ESG Practice, and Total Factor Productivity. Bus. Strateg. Environ. 2024, 33, 4547–4561. [Google Scholar] [CrossRef]
- Ferrier, W.J.; Smith, K.G.; Grimm, C.M. The Role of Competitive Action in Market Share Erosion and Industry Dethronement: A Study of Industry Leaders and Challengers. Acad. Manag. J. 1999, 42, 372–388. [Google Scholar] [CrossRef]
- Chen, M.J.; Su, K.-H.; Tsai, W. Competitive Tension: The Awareness-Motivation-Capability Perspective. Acad. Manag. J. 2007, 50, 101–118. [Google Scholar] [CrossRef]
- Chen, H.; Guo, T.M.; Zhang, Y.; Guo, Q.Y. The Impact of Internal Control on Organizational Resilience of Manufacturing Enterprises: From the Perspective of Enterprise Life Cycle. Nankai Bus. Rev. 2025, 1–28. Available online: https://link.cnki.net/urlid/12.1288.f.20240731.1647.003 (accessed on 20 July 2025).
- Tao, F.; Wang, X.R.; Xu, Y.; Zhu, P. Digital Transformation, Resilience of Industrial and Supply Chains, and Enterprise Productivity. China Ind. Econ. 2023, 5, 118–136. [Google Scholar] [CrossRef]
- Bradley, D.; Kim, I.; Tian, X. Do Unions Affect Innovation? Manag. Sci. 2017, 63, 2251–2271. [Google Scholar] [CrossRef]
- Chen, W.; Zhu, C.; Cheung, Q.; Wu, S.; Zhang, J.; Cao, J. How Does Digitization Enable Green Innovation? Evidence from Chinese Listed Companies. Bus. Strategy Environ. 2024, 33, 3832–3854. [Google Scholar] [CrossRef]
- Shao, S.; Ge, L.M.; Zhu, J.L. How to Achieve the Harmony Between Humanity and Nature: Environmental Regulation and Environmental Welfare Performance from the Perspective of Geographical Factors. J. Manag. World 2024, 8, 88–102. [Google Scholar] [CrossRef]
- Yu, F.F.; Mao, J.Y.; Jiang, Q. Research on the Impact and Action Mechanism of Enterprises’ Digital and Green Transformation Synergy on Their Sustainable Development Performance: An Analysis of the Moderating Effect of Local Low-Carbon Policies. Sci. Res. Manag. 2024, 45, 89–98. [Google Scholar] [CrossRef]
- Lei, Z.; Wang, D. Digital Transformation and Total Factor Productivity: Empirical Evidence from China. PLoS ONE 2023, 18, e0292972. [Google Scholar] [CrossRef]
- Pan, A.L.; Liu, X.; Qiu, J.L.; Shen, Y. Can Green Mergers and Acquisitions Under Media Pressure Promote Substantive Transformation of Heavily Polluting Enterprises? China Ind. Econ. 2019, 2, 174–192. [Google Scholar] [CrossRef]
- Ahmed, N.; Afza, T. Capital Structure, Competitive Intensity and Firm Performance: Evidence from Pakistan. J. Adv. Manag. Res. 2019, 16, 796–813. [Google Scholar] [CrossRef]
- Qayyum, M.; Yu, Y.; Tu, T.; Nizamani, M.M.; Ahmad, A.; Ali, M.; Vasa, L. Relationship between Economic Liberalization and Intellectual Property Protection with Regional Innovation in China: A Case Study of Chinese Provinces. PLoS ONE 2022, 17, e0259170. [Google Scholar] [CrossRef] [PubMed]
Disclaimer/Publisher’s Note: The statements, opinions and data contained in all publications are solely those of the individual author(s) and contributor(s) and not of MDPI and/or the editor(s). MDPI and/or the editor(s) disclaim responsibility for any injury to people or property resulting from any ideas, methods, instructions or products referred to in the content. |
© 2025 by the authors. Licensee MDPI, Basel, Switzerland. This article is an open access article distributed under the terms and conditions of the Creative Commons Attribution (CC BY) license (https://creativecommons.org/licenses/by/4.0/).