Article

The Impact of the “Inclusion of Rehabilitation Services in Basic Medical Insurance” Policy on the Utilization of Rehabilitation Services and Household Healthcare Expenditure Among Older Adults with Disabilities: Evidence from China

1
Vanke School of Public Health, Tsinghua University, Beijing 100084, China
2
Institute for Healthy China, Tsinghua University, Beijing 100084, China
3
School of Media and Communication, Shanghai Jiao Tong University, Shanghai 200240, China
4
Department of Sociology, People’s Public Security University of China, Beijing 100038, China
5
School of Nursing and Rehabilitation, Shandong University, Jinan 250014, China
6
College of General Practice, Southern University of Science and Technology, Shenzhen 518000, China
*
Author to whom correspondence should be addressed.
Systems 2025, 13(9), 812; https://doi.org/10.3390/systems13090812
Submission received: 21 July 2025 / Revised: 4 September 2025 / Accepted: 10 September 2025 / Published: 16 September 2025
(This article belongs to the Section Systems Practice in Social Science)

Abstract

Background: The intersection of aging and disability is an important social issue. The rehabilitation system of older adults with disabilities is a complex social system including various social units. This study aims to investigate the impact of the “inclusion of rehabilitation services in basic medical insurance” (IRSMI) policy on the utilization of rehabilitation services and annual household healthcare expenditure among older adults with disabilities. Methods: Using the data of China Disabled Persons’ Condition Monitoring Survey (2009–2012), this study employed the difference-in-differences method to analyze the impact of IRSMI on rehabilitation services utilization and household healthcare expenditure, and further examined the differential effects of the policy on service utilization across subpopulations with different demographic characteristics, including gender, age, and disability severity. The Heckman two-stage model corrects for sample selection bias caused by the share of households with zero health expenditures. Event-study specification was applied to assess the validity of the parallel trends assumption in the DID framework. Baron & Kenny’s three-step method was used to explore the potential mediating mechanism. Results: (1) IRSMI significantly increased the likelihood of utilizing rehabilitation services among older adults with disabilities (OR = 1.349), but this kind of promotive effect mainly focus on males (OR = 1.530), middle-aged and older disabled individuals (OR = 1.423), and those with mild disabilities (OR = 1.444). (2) The implementation of IRSMI contributed to an approximately 20.3% increase in annual healthcare expenditures for households with older adults with disabilities ( β = 0.185). (3) IRSMI significantly promoted the increase in household healthcare expenditures for high-income older adults with disabilities ( β = 0.181), but had limited impact on low- and middle-income groups. (4) Rehabilitation services utilization played a mediating role in the relationship between IRSMI and household healthcare expenditure, with about 19.0% of the increase in annual household healthcare expenditures attributable to the enhanced utilization of rehabilitation services. Conclusions: In the complex social system of rehabilitation for older adults with disabilities, the IRSMI policy significantly increases the likelihood of rehabilitation services utilization and substantially raises annual household healthcare expenditures. However, the heterogeneous effects across gender, age, disability severity, and income levels reflect structural inequities embedded in the rehabilitation system, underscoring the need for adaptive and equity-oriented interventions.

1. Introduction

The intersection between aging and disability is a prominent feature of China’s demographic and health landscape; as such, rehabilitation is an increasingly vital health service strategy within the tertiary prevention system [1]. Since entering an aging society at the beginning of the 21st century, China has experienced a rapid compression of its three-stage aging process (“mild–deep–severe”). Even when considering the effects of the two-child and three-child policies on demographic transitions, China is still expected to face rapid aging, reaching a severe aging stage by 2033 [2]. Analysis and projections based on national survey data show that the proportion of older adults with disabilities (aged 60 and above) among the total disabled population increased from 39.72% in 1987 to 53.24% in 2006, marking the first time in statistical analysis that older adults with disabilities have comprised more than half of the disabled population. If disability prevention and rehabilitation efforts are not comprehensively implemented, the proportion of older adults with disabilities (aged 65 and above) is expected to exceed 70% by 2050 [2].
Against this demographic backdrop, it is essential to recognize the complexity of the rehabilitation service system as part of the broader health system. A health system is a formal arrangement by which healthcare service is provided and paid for in a country [3]. Rehabilitation, as a subsystem of healthcare, is an inherently complex and social process, characterized by dynamic interactions among diverse actors and institutions [4]. The complexity of rehabilitation is based on three aspects. First, this system consists of various social units, including the users, providers, and payers of rehabilitation services, and each party is multi-level. Providers include general hospitals, specialized hospitals, and community rehabilitation centers. Payers consist of basic medical insurance (BMI), medical aid, and commercial health insurance. Users can be categorized into different groups based on factors such as gender, income, and degree of disability. Second, the three parties within the system interact and influence each other. Providers offer rehabilitation services to users and charge a fee. Users decide whether to pay the fees for the services. Payers can cover a portion of the fees for users who subscribe to corresponding payments (e.g., insurance). Third, the actions of providers and payers have heterogeneous effects on different groups of users. Users can be categorized into groups, and the impact of policies or interventions implemented by providers and payers varies across these different groups. The composition of these parties and their relationships in the rehabilitation system are shown in Figure 1.
However, the utilization rate of rehabilitation services in China is low, with only 8.45% (7.01 million) of 82.96 million disabled individuals receiving rehabilitation training and services, and only 7.30% (6.06 million) receiving the provision of assistive devices [5]. Health insurance is a significant factor influencing individual healthcare utilization [6]. The Chinese government attributes much importance to the development of rehabilitation services, calling for significant improvements [7], and actively promoting the reform of the health insurance payment system for rehabilitation programs. In 2010, the Ministry of Health issued a document named “Notice on the Inclusion of Additional Medical Rehabilitation Services in the Basic Medical Insurance Payment Scope”, which mandated the inclusion of nine assessment and therapeutic rehabilitation projects nationwide (the Rehabilitation Coverage Policy referred to in this study, including physical therapy, comprehensive training for hemiplegic limbs, cerebral palsy limbs, paraplegic limbs, occupational therapy, training for cognitive and perceptual dysfunction, speech therapy, swallowing dysfunction training, and assessment of daily living activities). Since 1 January 2011, these nine rehabilitation projects, covering visual, auditory, speech, limb, intellectual, and mental disabilities, have been funded proportionally by basic medical insurance for urban employees, basic medical insurance for urban residents, and the new rural cooperative medical insurance initiative for rural residents. From a systems-thinking perspective, the inclusion of rehabilitation services in basic medical insurance (IRSMI) represents an intervention policy that modifies the structure and functioning of the health financing subsystem, potentially triggering multi-level effects across individual service utilization patterns and the economic capabilities of households.
From a global perspective, population aging and functional impairment have brought financing rehabilitation to the forefront of policy agendas [8]; the global need for rehabilitation has increased significantly over the past three decades [9]. Many countries now include core rehabilitation assessments and therapies in mandatory benefit packages to reduce unmet needs, avert downstream disability costs, and establish healthcare strategies for aging. IRSMI in China is a natural policy experiment with broad relevance to systems pursuing similar reforms. In April 2000, Japan enacted the long-term care insurance act [10], which covers rehabilitation medical services for the elderly, enabling older adults to live independently in their community for as long as possible [11]. Chile developed and approved the first National Rehabilitation Plan 2021–2030, which established RehabPHC as the central pillar for the delivery of rehabilitation services to the Chilean population, ensuring timely and continuous access to quality rehabilitation services, preventing complications from existing health conditions, reducing disability, and optimizing the population’s ability to function [12]. Germany’s Social Code Book IX and Federal Act on Participation explicitly incorporate rehabilitation services into the statutory health insurance system, which is covered by statutory insurance and encompasses multiple aspects, including service provision and funding guarantees. While the coverage and expansion of these policies are generally associated with shifts in both the level and composition of care needed, their rehabilitation-specific effects—especially among older adults with disabilities—remain under-examined [13]. In the UK, Sweden, and Italy, there is a lack of emphasis on promoting social participation for people with disabilities, and rehabilitation care for people with disabilities lacks prioritization in cross-departmental legislation [14]. In various countries, due to factors such as human and financial limitations, the provision of rehabilitation services is generally low and not a political priority within the health system [15].
Although substantial research has examined the effects of different health insurance schemes and provided important evidence for policy and system improvement, limited attention has been paid to the insurance payment system for rehabilitation. Existing studies primarily link insurance coverage to healthcare utilization and household expenditure; however, the primary focus has been on inpatient and outpatient curative care rather than rehabilitation-specific services [16,17,18]. The coverage of health services can both reduce financial barriers and enable different types of care to be implemented, with net effects on total spending depending on price schedules, supply capacity, and health literacy [12,19]. Thailand’s Universal Coverage Insurance Scheme provides comprehensive coverage including rehabilitation services. Funded through general taxation, this scheme shows that a well-structured financing mechanism can enhance access to rehabilitation services even in resource-limited settings [20]. China’s phased expansion of basic medical insurance and benefit catalogs generated substantial variation in coverage over time and space [21,22]. However, evidence on how effective this scheme is for older adults with disabilities—a group with distinct functional needs and potentially high returns to rehabilitation—remains limited. China has made significant advancements in universal health coverage, with metrics for infectious disease control, service capacity, and accessibility comparable to high-income nations. Related inequalities in the service coverage have also decreased; however, critical gaps remain in chronic disease management, mental health, rehabilitation, and palliative care services [23]. Previous studies mainly analyzed the impact of health insurance on the utilization of general health services; the relationship between health insurances and the utilization of rehabilitation services among Chinese people with disabilities has long been overlooked [24]. The IRSMI reform in 2011 added nine rehabilitation items to the basic package, testing whether coverage induces an uptake in function-oriented services and how this translates into household spending. Two gaps in knowledge remain: (i) the impacts of rehabilitation-specific insurance on older populations with disabilities; (ii) a systems view linking financial changes to healthcare service utilization and household expenditure.
This study posits that a thorough evaluation of the Rehabilitation Coverage Policy’s effects is crucial for improving long-term insurance payments for rehabilitation services. As a direct impact of medical insurance, the primary focus of this study is the influence of the Rehabilitation Coverage Policy on the utilization of rehabilitation services and healthcare expenditures for various disabled individuals and its differential effects. Against the backdrop of aging and disability, this study aims to provide an objective evaluation of the policy’s effects, focusing on older adults with disabilities. Specifically, it addresses three questions: whether IRSMI increases the likelihood of rehabilitation service utilization among older adults with disabilities and whether this effect varies across population subgroups; whether IRSMI raises household healthcare expenditure and whether this effect differs across income groups; and whether the impact on expenditure is mediated by increased participation in rehabilitation. In doing so, this study contributes in three ways. First, it identifies the causal effects of IRSMI on rehabilitation utilization and household healthcare expenditures for older adults with disabilities. Second, it uncovers structural heterogeneity by gender, age, disability severity, and income, pinpointing who benefits under uniform coverage. Third, it clarifies a utilization-mediated pathway regarding financing and household spending, showing how coverage can increase expenditures through adopted services. Together, these contributions offer scientific evidence for policy optimization and the improvement of medical insurance payment systems for rehabilitation services.

2. Materials and Methods

2.1. Data Source

The data for this study is primarily derived from the 2007 to 2013 China National Disability Status Monitoring Survey (CNDSMS) and the 2006 Second National Sample Survey on Disability (SNSSD). SNSSD was mainly used to determine the number, structure, service utilization, and socioeconomic status of various disabled populations in China during the survey years. This survey provided information on levels of disability, gender, urban–rural residence, and regional distribution for this study, indicating that these variables are non-time-varying. The survey employed a stratified, multi-stage, cluster, probability-proportional-to-size sampling method to obtain a representative sample. The total survey population comprised households across the country, covering 734 counties (cities and districts), 2980 townships (towns and streets), and 5964 survey communities sampled, averaging about 420 people per community. In total, 771,797 households and 2,526,145 individuals were surveyed, with a sampling ratio of 1.93‰ [25].
CNDSMS focused on randomly selected disabled individuals from SNSSD samples [26]. The 2007 CNDSMS, based on the SNSSD sample frame, selected one survey community from each of the 734 county-level samples as a national monitoring sample unit, surveying all identified disabled individuals and their household conditions in these communities. The 2008 CNDSMS followed up the 2007 samples, while the 2009 CNDSMS added an additional monitoring community to each of the 734 counties (cities, districts), expanding from 734 to 1467 communities. The 2010 CNDSMS followed up on the 2009 samples, and the 2011 CNDSMS added 12,724 new disabled individuals to the existing sample. The 2012 and 2013 surveys followed up on the 2011 and 2012 samples, respectively. The monitoring survey covered various aspects such as basic information about disabled individuals, living conditions, service utilization, medical security, education level, employment status, income level, and social environment [27].
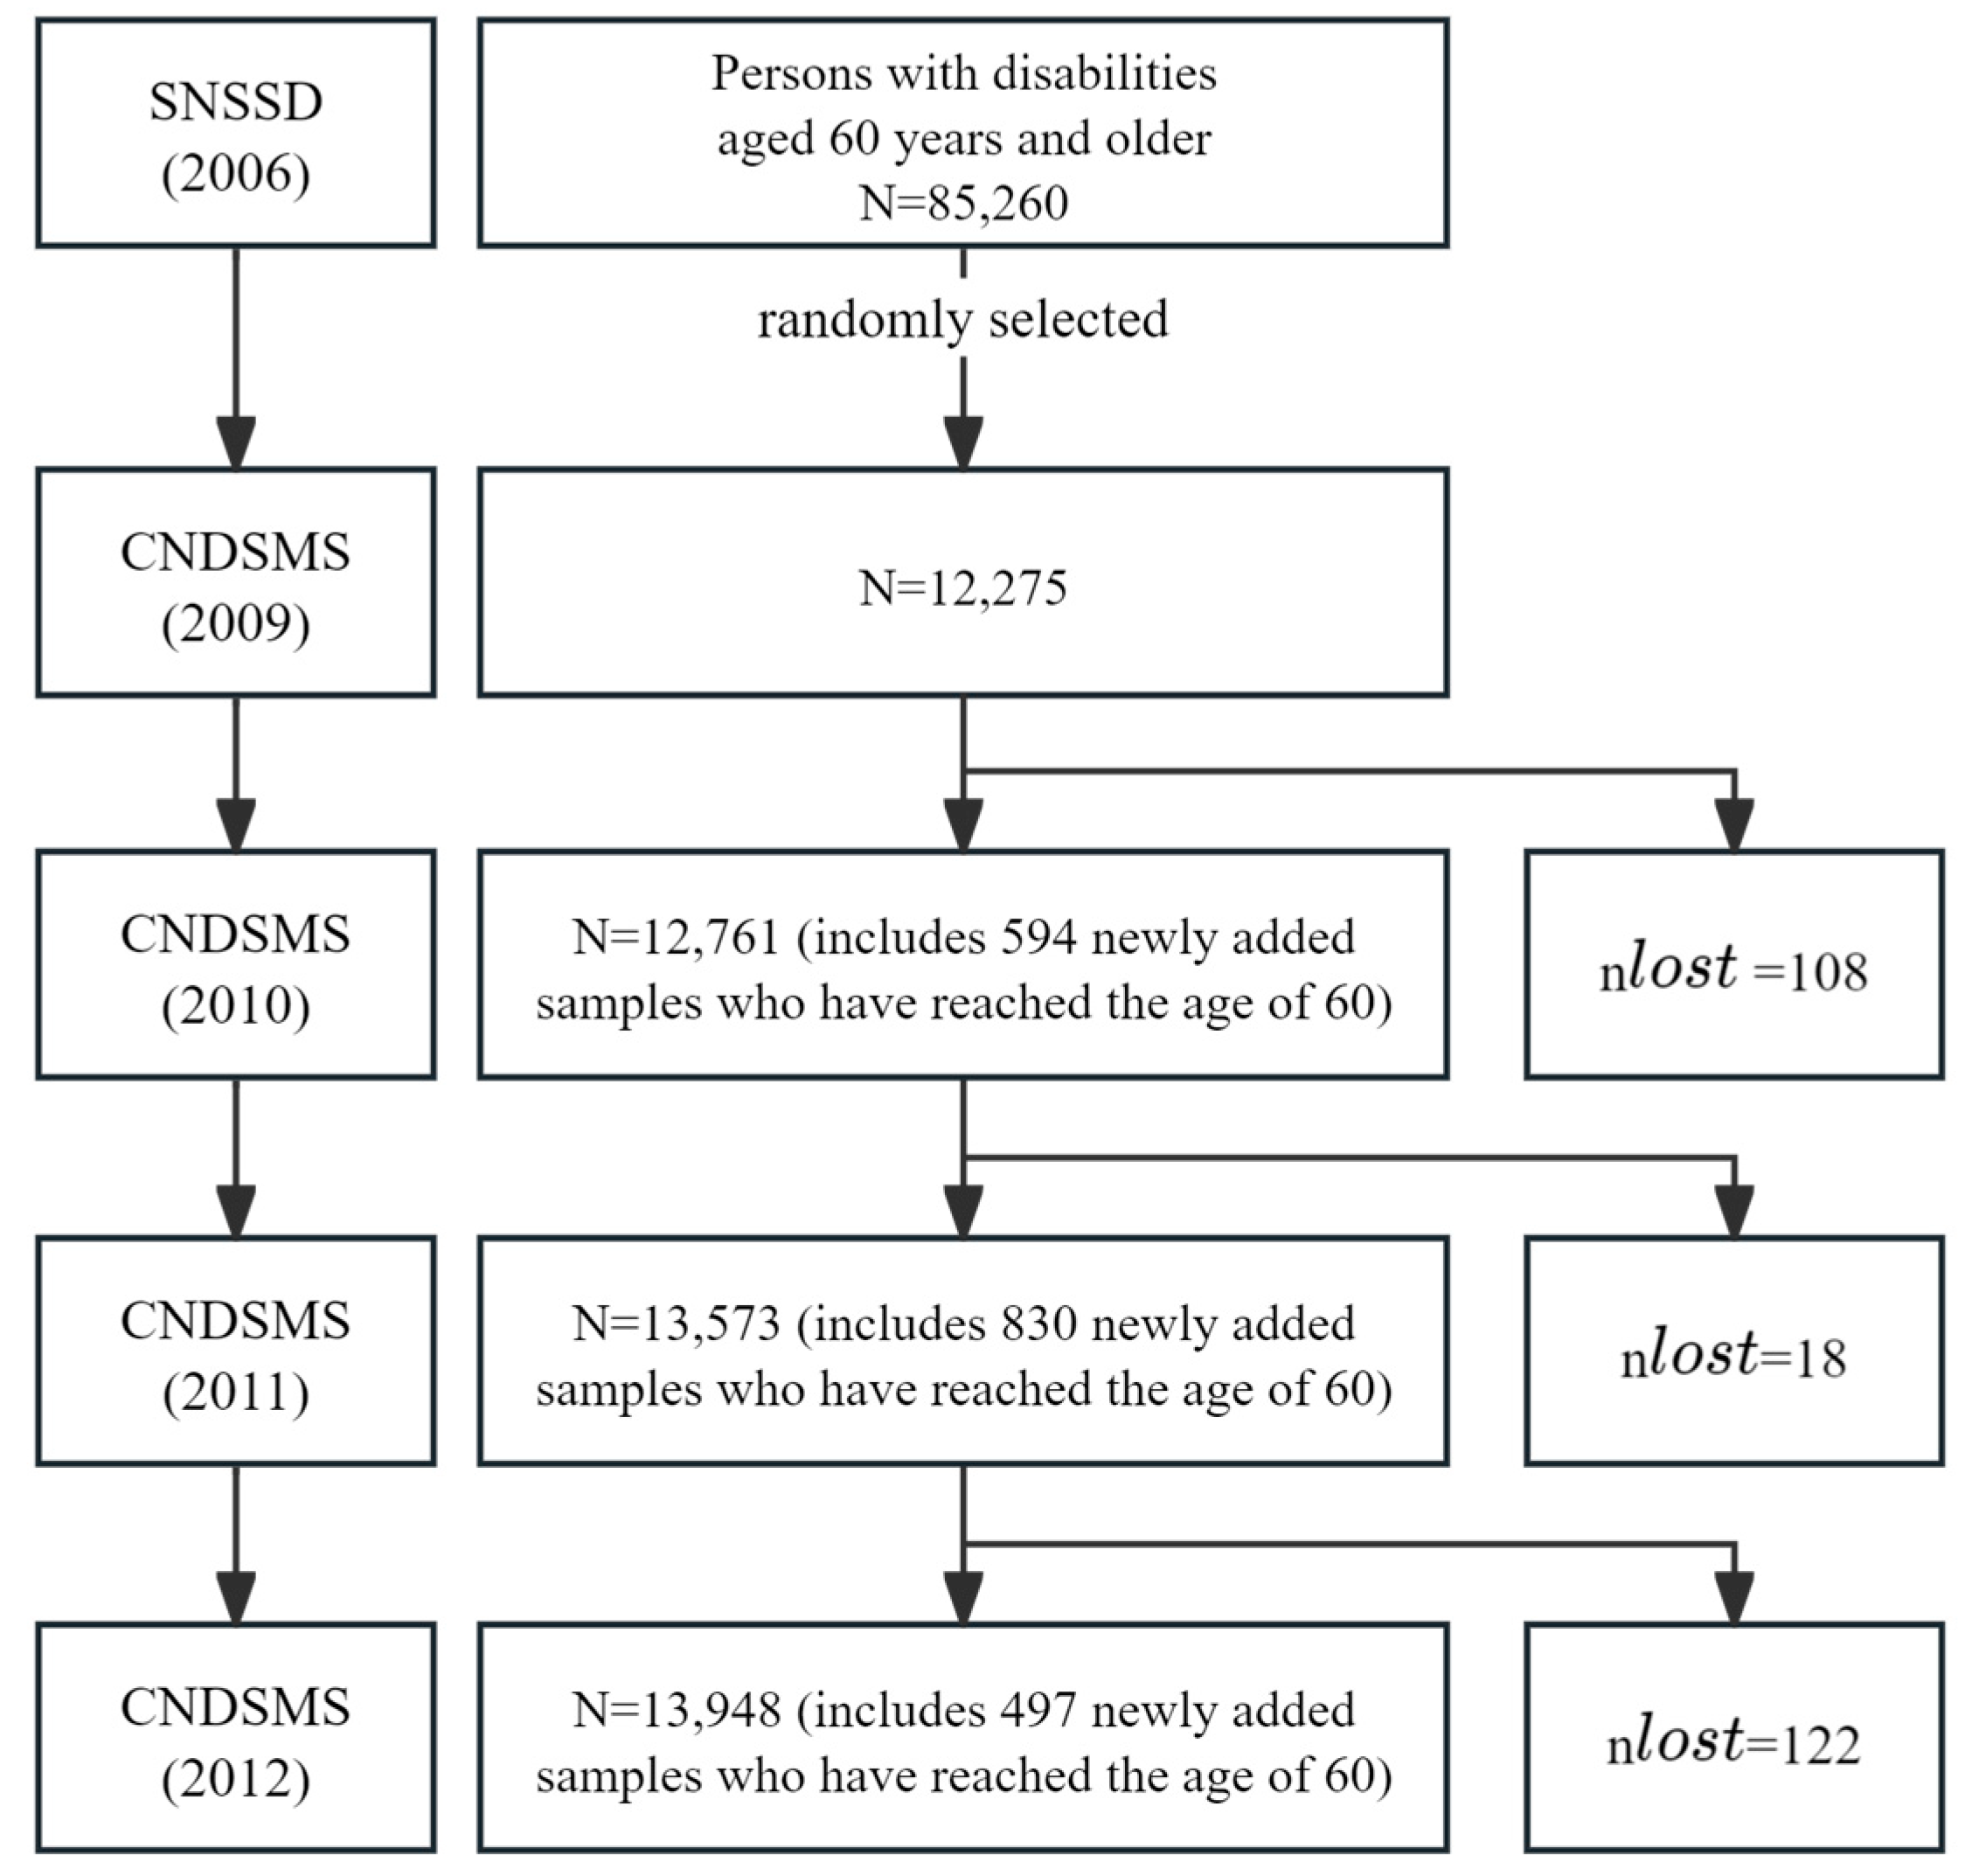
The analysis of this study focuses on 2009–2012 CNDSMS data. In terms of data processing, observations of individuals younger than 60 years were first excluded across survey years. Second, observations corresponding to individuals lost to follow-up in a given survey year—due to out-migration, temporary absence, death, or other reasons—were removed. Third, the dataset for 2010–2012 included new individuals who reached the eligible age bracket during those years. After these steps, the final analytic dataset comprised 52,557 observations of older adults with disabilities, as shown in Figure 2. In addition, to mitigate potential bias from extreme values, household annual healthcare expenditures were winsorized at the 1st and 99th percentiles. This ensured the reliability and robustness of the analytic dataset.

2.2. Core Concepts

2.2.1. Disability

Disability refers to impairments in body structure or function, activity limitations, and participation restrictions. According to the national standard “Classification and grading criteria of disability” (GB/T 26341-2010), disabilities are categorized into visual, hearing, speech, physical, intellectual, mental, and multiple disabilities [28]. Based on severity, disabilities are classified into four levels: Level 1 (very severe), Level 2 (severe), Level 3 (moderate), and Level 4 (mild).

2.2.2. Rehabilitation and Utilization of Rehabilitation Services

Rehabilitation refers to the use of various measures to eliminate or reduce the physical, psychological, and social functional impairments of individuals (such as those who are ill, injured, or disabled), aiming to restore or maintain their optimal level of function, enhance their ability to live independently, reintegrate into society, and improve their quality of life [29]. Although some pathological changes cannot be eliminated, rehabilitation can still help individuals to achieve the best possible level of survival and the highest health standards. Medical rehabilitation, a critical component of rehabilitation, involves medical methods to address functional impairments of individuals who are ill, injured, or disabled, achieving the purpose of rehabilitation [29]. This study defines the utilization of rehabilitation services as the use of medical rehabilitation activities by disabled individuals to improve their physical, psychological, and social functions, facilitating their comprehensive reintegration into work, education, and society as early as possible, and maximizing their quality of life. These activities directly relate to the restoration of physical and mental functions, such as diagnosis, follow-up, assessment, rehabilitation treatment, rehabilitation training, and the provision of assistive devices [27].

2.3. Study Design

This study aims to explore the impact of including rehabilitation services in the basic medical insurance policy (IRSMI) on the utilization of rehabilitation services and household healthcare expenditure among older adults with disabilities. A systemic analytical framework was employed in the research to investigate the influence of IRSMI on rehabilitation utilization and healthcare expenditure. Figure 3 presents the systemic analytical framework and outcome of this research. It outlines the systemic nature of the analytical framework and reflects outcomes based on three aspects. First, this research not only analyzes the overall impact of IRSMI on rehabilitation service utilization and healthcare expenditures, but also systematically discusses the impact of this policy on various groups. For example, the population was divided into different groups, including gender, age, degree of disability, and income, and the effect of IRSMI was systematically compared across different groups. Second, this research not only analyzes the direct effect of IRSMI on rehabilitation service utilization and healthcare expenditure, but also systematically investigates the underlying mechanisms of this effect. This research will prove whether IRSMI increases healthcare expenditure among older adults with disabilities by increasing their likelihood of utilizing rehabilitation services.
From a systemic methodology perspective, this study incorporates both theory-driven variable selection and heterogeneity analysis to capture the structural complexity of rehabilitation service utilization. Specifically, the selection of variables draws upon Andersen’s Behavioral Model of Health Services Use, which considers the multifaceted influence of predisposing factors (e.g., age, gender, marital status, and education), resources (e.g., income level and medical insurance status), and need factors (e.g., disability type and severity). These variables collectively reflect the interactive components of access and demand within the health service system.
The dependent variables are the utilization of rehabilitation services by older adults with disabilities (including whether the individual received rehabilitation treatment, rehabilitation training, or was equipped with assistive devices during the monitoring period) and the household’s healthcare expenditure (the expenditure by the household on healthcare during the monitoring period). To avoid the influence of extreme values, the annual healthcare expenditure of households with older adults with disabilities from 2009 to 2012 was winsorized in this study. The key independent variable is the interaction between the policy dummy variable and the time dummy variable. Control variables include disability type, age, marital status, education level, annual per capita household income, time fixed effects, and individual fixed effects. Annual per capita household income refers to the total household income during the monitoring period—including annual wage income, net annual business income in urban areas, total annual business income in rural areas, property income, transfer payments, income from asset sales, and borrowed funds—divided by the number of household members. Income level is categorized into high, middle, and low tiers based on the tertile distribution of annual per capita household income. The treatment variable is a policy dummy indicating whether an individual underwent intervention. The post variable is a time dummy denoting the pre- and post-policy implementation periods. The policy implementation date is 1 January 2011, with 2009 and 2010 as the two years before policy implementation and 2011 and 2012 as the two years after policy implementation.
Previous studies have indicated that all individuals with functional impairments are potential candidates for medical rehabilitation [30]. From this perspective, all older adults with disabilities who have medical insurance can be affected by the Rehabilitation Coverage Policy, while those without medical insurance are unaffected. Therefore, this study uses “whether the individual has medical insurance” as the criterion for dividing the experimental and control groups. The establishment of the universal medical insurance system in China in 2013 enabled experimental and control groups to be defined based on data from 2009 to 2012. The basic information of the main variables is presented in Table 1.

2.4. Statistical Analysis

This study employed empirical analysis using Stata 18.0. All regression models were estimated with conventional standard errors. Sensitivity checks based on heteroskedasticity-robust standard errors were conducted. Significance thresholds were set at 0.01 and 0.05 levels. The empirical strategy integrates the Heckman two-stage approach, the difference-in-differences (DIDs) design, Baron and Kenny’s three-step mediation framework, and the event-study method, thereby enabling the identification of both direct and indirect policy effects within the system. These econometric approaches were selected because they directly address the analytical challenges posed by the data and the policy setting. Specifically, the Heckman two-stage model corrects for sample selection bias caused by the share of households with zero health expenditures, and the DIDs framework allows for credible and causal inference of policy impacts under a quasi-experimental design. The Baron and Kenny method further enables the decomposition of direct and indirect policy effects through rehabilitation service utilization, thereby clarifying the mechanisms underlying observed changes in expenditure. Alternative methods such as propensity score matching, instrumental variable estimation, and recent machine learning-based approaches for causal inference were considered. However, these methods were less suited to the current context due to constraints in data availability (e.g., the absence of strong instruments and a relatively short panel), as well as the need for transparent, interpretable estimates that can inform policy formulation.

2.4.1. Heckman Two-Stage Method

Due to the presence of zero values in the annual healthcare expenditure of households with older adults with disabilities, we utilized the Heckman two-stage model, based on the method outlined in the existing literature [31], to avoid potential sample selection bias. This approach allowed us to examine the impact of the Rehabilitation Coverage Policy on the levels of household healthcare expenditure experienced by older adults with disabilities.
In the first stage, a selection model analyzes the decisions of households with older adults with disabilities to invest in healthcare, employing a binary probit model. In Equation (1), i represents the observation and h a s _ e x p _ m e d i i t is the binary dependent variable, taking the value of one if the household’s annual healthcare expenditure is non-zero and zero otherwise. x 1 i t represents the relevant explanatory variables, including the policy dummy variable, time dummy variable, the interaction term of the policy and time dummy variables, disability type, disability severity, gender, age, marital status, urban or rural residence, region, education level, annual per capita household income, time fixed effects, and whether the individual received rehabilitation knowledge dissemination. Among these variables, “whether the individual received rehabilitation knowledge dissemination” only influences whether the household has healthcare expenditure and has no direct impact on the expenditure amount. β 0 ,   ε i are the constant term and the random error term, respectively.
h a s _ e x p _ m e d i i t = β 0 + β 1 x 1 i t + ε i
The second stage of the model employs the selected sample where h a s _ e x p _ m e d i i t = 1, using a bidirectional fixed-effects xtreg model for regression analysis. In Equation (2), e x p _ m e d i i t is the dependent variable, representing the annual healthcare expenditure of households with older adults with disabilities; this is then log-transformed. x 2 i t comprises the relevant explanatory variables, including the policy dummy variable, time dummy variable, the interaction term of the policy and time dummy variables, the disability type, disability severity, gender, age, marital status, urban or rural residence, region, education level, annual per capita household income, time fixed effects, and individual fixed effects. β 0 , ε i are the constant term and random error term, respectively, and λ i   is the inverse Mills ratio.
e x p _ m e d i i t = β 0 + β 1 x 2 i t + λ i + ε i

2.4.2. Difference in Differences (DIDs) Method

The DIDs method is widely used in policy evaluation for its ability to mitigate endogeneity issues caused by omitted explanatory variables. Its core principle involves comparing the changes before and after policy intervention between the treatment and control groups to evaluate the policy’s impact [32]. This study designates samples before 2011 as unaffected by the Rehabilitation Coverage Policy and those affected after 2011 as the experimental group, while samples unaffected by the policy throughout are the control group. The distinguishing criterion is whether the individuals in the sample have medical insurance; uninsured individuals are not influenced by the policy, while insured individuals are. Using DIDs, this study assesses the policy’s impact on the likelihood of rehabilitation services being utilized by older adults with disabilities through data analysis before and after the implementation of the policy in 2011. The analysis model is constructed as follows:
r e h a _ s e r v i c e s i t = β 0 + β 1 t r e a t m e n t i t + β 2 t i m e i t + β 3 t r e a t m e n t _ t i m e i t + j = 1 N β j z i t + ε i t
r e h a _ s e r v i c e s i t indicates whether the individual, i , used rehabilitation services during the period t . t r e a t m e n t i t denotes whether the sample is affected by the policy (0 if not and 1 if yes). t i m e t is a time dummy variable (0 for the pre-policy period, i.e., 2009–2010, and 1 for the post-policy period, i.e., 2011–2012). β 3 is the estimated effect of the policy after controlling for time fixed effects, individual fixed effects, and other control variables, which is the main focus of this study. β 0 is the constant term, z i t represents other control variables, and ε i t is the random error term. Statistical analysis was conducted based on the bidirectional fixed-effects xtlogit model.

2.4.3. Baron and Kenny’s Three-Step Mediation Effect Method

This study constructs estimation models for the mediation effect of utilizing rehabilitation services as follows:
e x p _ m e d i c i n e i t = β 0 + β 1 t r e a t m e n t _ t i m e i t + k γ k c o n t r o l i t k + ε i t
r e h a _ s e r v i c e s i t = β 0 + β 1 t r e a t m e n t _ t i m e i t + k γ k c o n t r o l i t k + ε i t
e x p _ m e d i c i n e i t = β 0 + β 1 r e h a _ s e r v i c e s i t + β 2 t r e a t m e n t _ t i m e i t + k γ k c o n t r o l i t k + ε i t
The dependent variable e x p _ m e d i c i n e i t represents “annual healthcare expenditure of households with older adults with disabilities”, and the mediator variable r e h a _ s e r v i c e s i t represents “whether rehabilitation services were utilized.” In Equations (4)–(6), c o n t r o l i t k denotes the k-th control variable, including the policy dummy variable, time dummy variable, disability type, disability severity, gender, age, marital status, urban or rural residence, region, education level, annual per capita household income, time fixed effects, and individual fixed effects. ε i t and   β 0 represent the random error term and the constant term, respectively.

2.4.4. Event-Study Method

The event-study specification was applied to assess the validity of assuming parallel trends in the DIDs framework. A series of leads and lags was included for the treatment indicator with the year immediately preceding policy implementation serving as the reference period. This design allowed for both visual and statistical examination of dynamic treatment effects over time. Non-significant pre-treatment coefficients indicated that the assumption of parallel trends held, whereas significant post-treatment estimates provided evidence of policy impacts and their temporal dynamics. For household healthcare expenditures, the parallel trends test was implemented using the Heckman two-stage framework to account for potential sample selection bias.

3. Results

3.1. Utilization Rates of Rehabilitation Services for Older Adults with Disabilities in the Experimental and Control Groups from 2009 to 2012

From 2009 to 2012, the utilization rate of rehabilitation services among older adults with disabilities in the experimental group increased annually from 13.64% to 29.30%. By contrast, in the control group, the rate fluctuated and rose from 12.81% to 27.17%. Overall, the utilization rate in the experimental group was higher than that in the control group. Other subgroups exhibited similar patterns. The control group showed fluctuating increases in utilization rates across all categories of males, females, mild, moderate-to-severe disabilities, and younger and older age groups. In contrast, the experimental group demonstrated a stable growth trend for each of these subgroups (Table 2, Figure 4).

3.2. Impact of the Rehabilitation Coverage Policy on the Utilization of Rehabilitation Services by Older Adults with Disabilities

Overall, the Rehabilitation Coverage Policy significantly increased the likelihood of utilizing rehabilitation services among older adults with disabilities (OR = 1.349, 95% CI 1.031~1.766). This indicates that after the implementation of the policy, the probability of older adults with disabilities using rehabilitation services was approximately 34.9% higher for those covered by insurance compared to those who were not covered. Sensitivity checks based on heteroskedasticity-robust standard errors confirmed the consistency of the main results ( β = 0.299, 95% CI 0.021~0.578). In terms of gender, the policy had a significant positive effect on insured males with disabilities (OR = 1.530, 95% CI 1.037~2.256), who were 53.0% more likely to use rehabilitation services than their uninsured counterparts. Regarding age, the policy showed a significant positive effect on older disabled persons (OR = 1.423, 95% CI 1.012~2.000), making them approximately 1.4-times more likely to use rehabilitation services compared to their uninsured peers. In terms of disability severity, the policy significantly promoted the utilization of rehabilitation services among those with mild disabilities (OR = 1.444, 95% CI 1.002~2.083), indicating they were about 1.4-times more likely to use rehabilitation services compared to uninsured individuals with mild disabilities (Table 3).

3.3. Annual Healthcare Expenditures for Households with Older Adults with Disabilities in the Experimental and Control Groups, 2009–2012

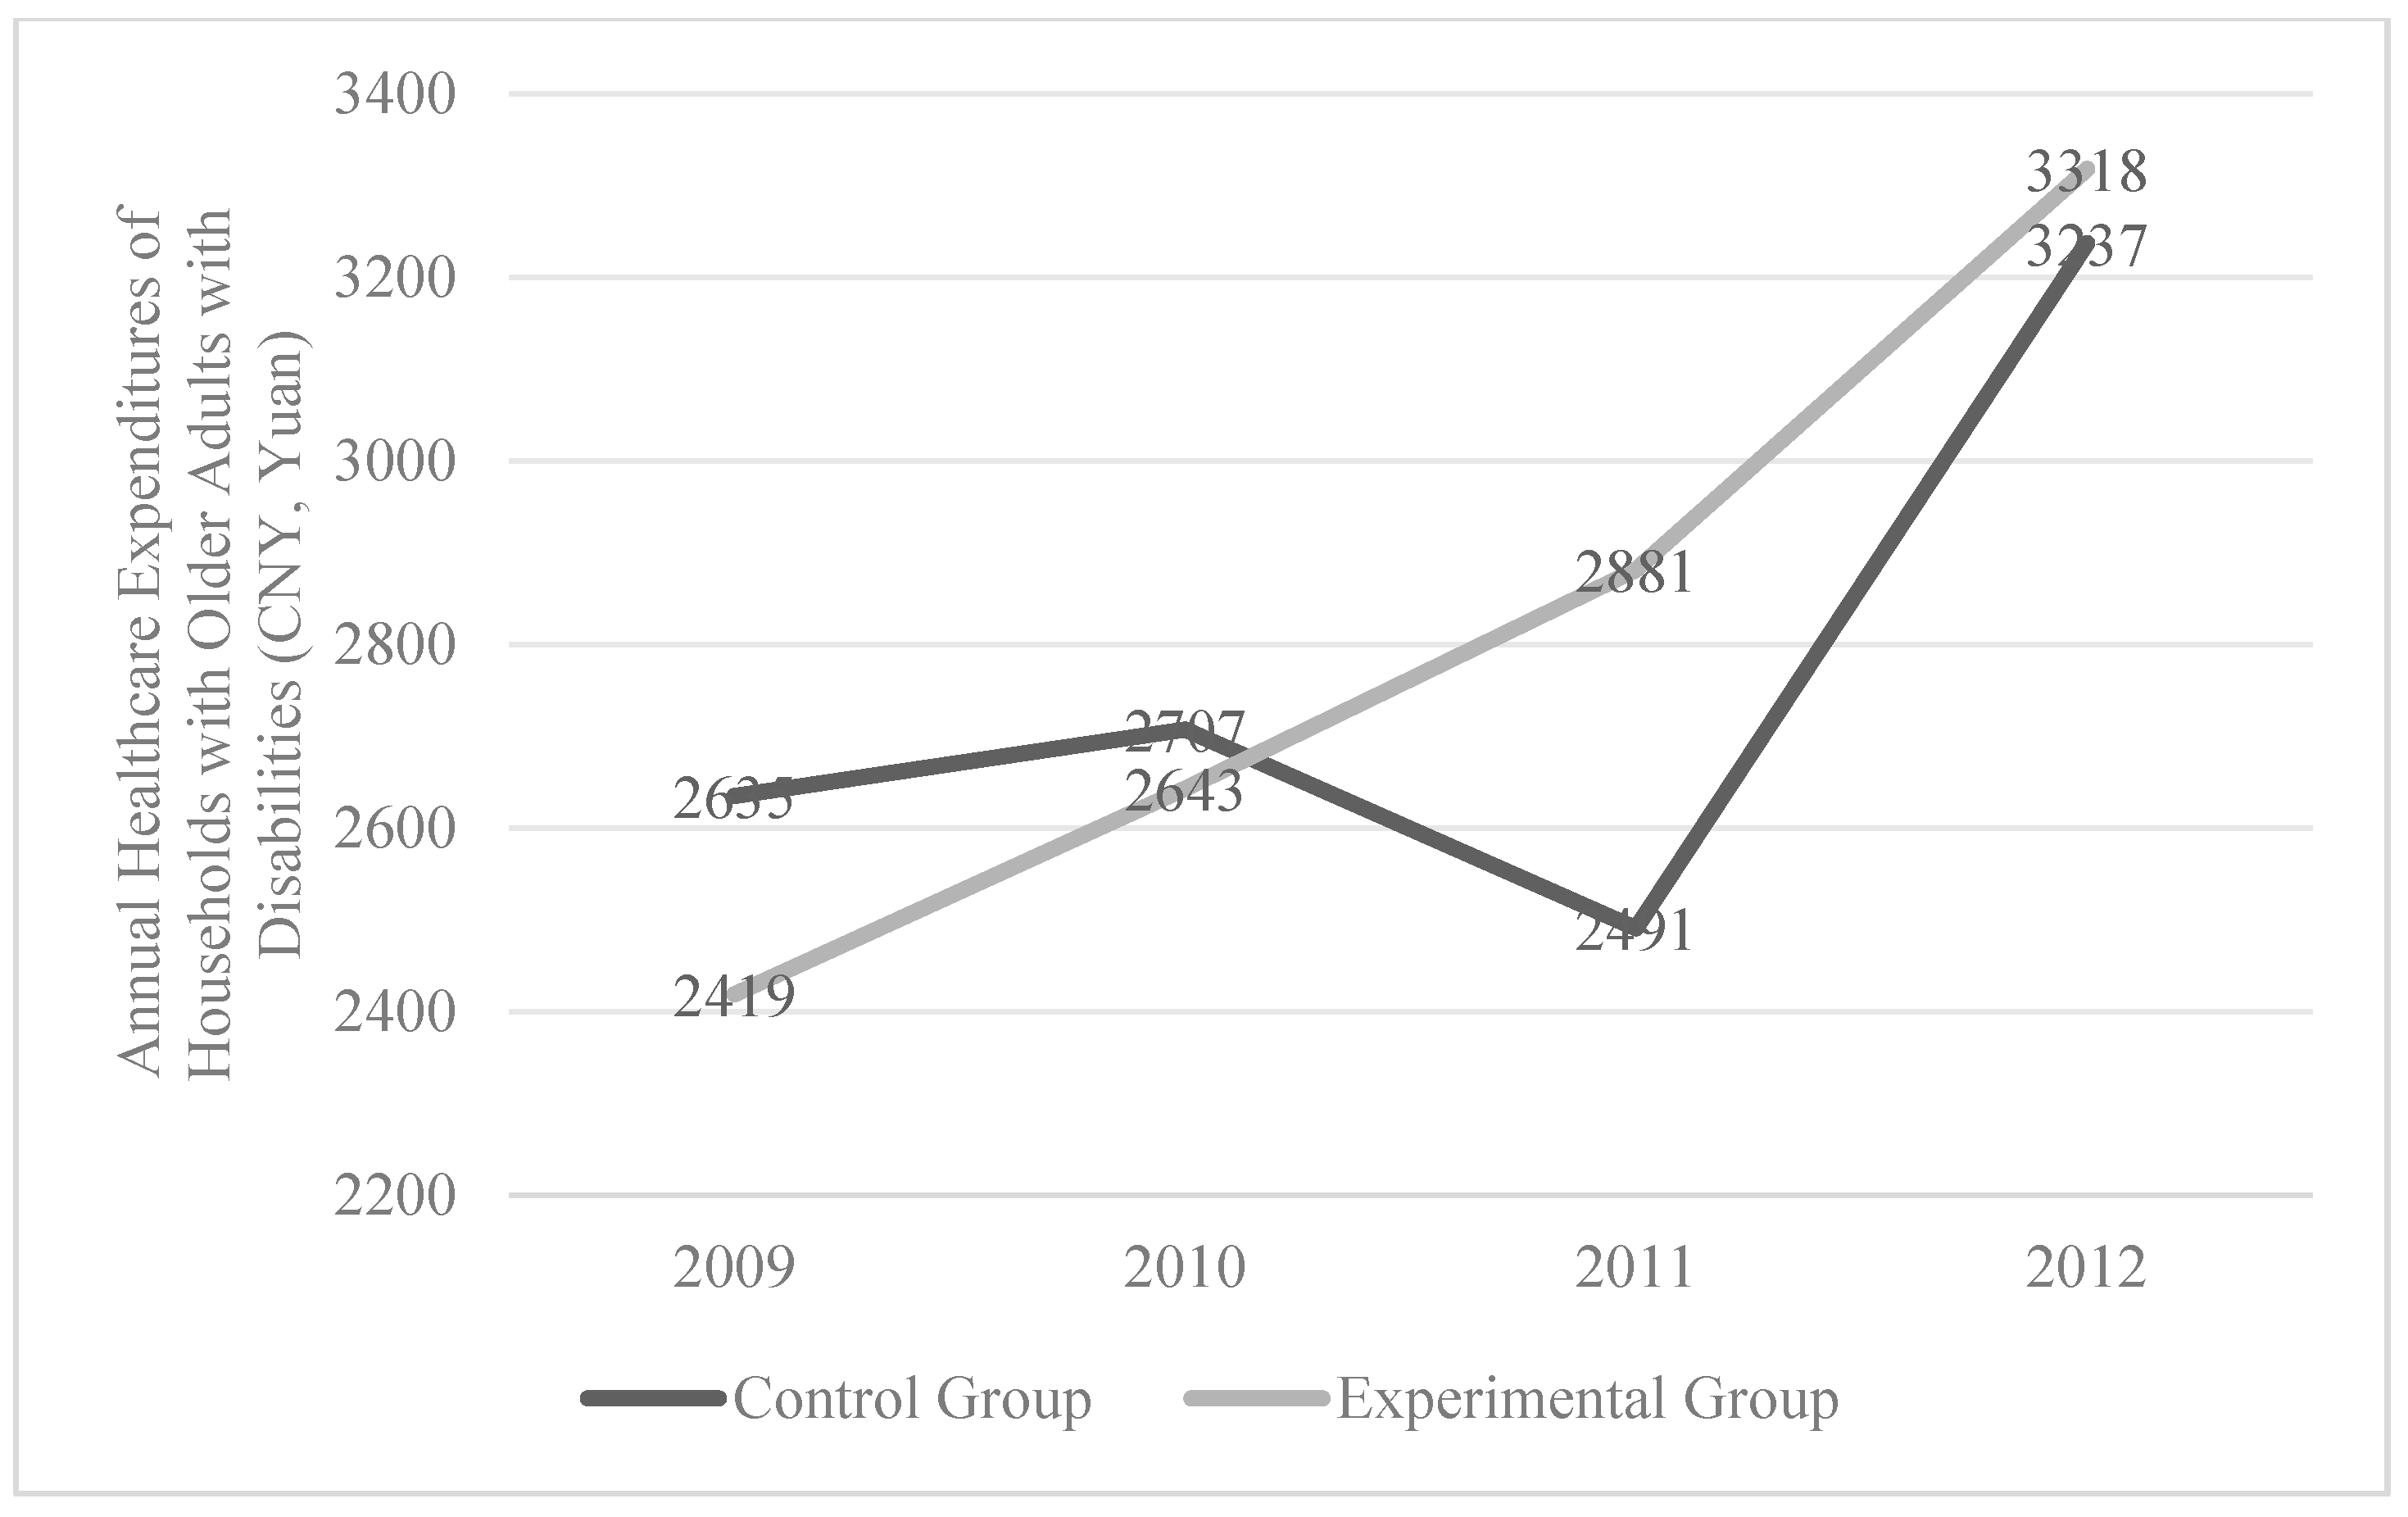
From 2009 to 2012, the mean annual healthcare expenditures for households with older adults with disabilities in the experimental group increased from 2419 yuan (CNY) to 3318 yuan (CNY), while in the control group, expenditures fluctuated and rose from 2635 yuan (CNY) to 3237 yuan (CNY). Overall, the experimental group had higher mean annual household healthcare expenditures compared to the control group, with a higher growth rate. Subgroup analyses reveal consistent patterns with the overall trend: in the low-, middle-, and high-income level categories, households in the control group showed fluctuating increases in annual household healthcare expenditures, while those in the experimental group exhibited a steady growth trend. Except for the low-income subgroup, the experimental group consistently had higher mean annual household healthcare expenditures than the control group from 2009 to 2012 (Table 4, Figure 5).

3.4. Impact of the Rehabilitation Coverage Policy on Annual Household Healthcare Expenditures and the Mediating Effect of Rehabilitation Service Utilization

To avoid sample selection bias, the Heckman two-stage model was used to determine the robustness of the Rehabilitation Coverage Policy’s effects. Models 1 and 2 estimate results using the standard DIDs model and the Heckman two-stage model, respectively.
According to Table 5, the estimated λ value for the sample is 1.549, which is significant at the 0.01 level, indicating the effectiveness of the Heckman model. The traditional DIDs model reveals that the Rehabilitation Coverage Policy significantly increased annual healthcare expenditures for households with older adults with disabilities ( β = 0.214, 95% CI 0.106~0.321), suggesting a 23.8% increase in expenditure post-policy implementation. Adjusted results from the Heckman model indicate that the policy led to an approximately 20.3% increase in annual household healthcare expenditures ( β = 0.185, 95% CI 0.108~0.261). When examining different income levels, the traditional DIDs model shows that the policy significantly increased annual household healthcare expenditures for high-income households with older adults with disabilities ( β = 0.181, 95% CI 0.001~0.361), but no significant changes were observed for low- and middle-income groups. For the high-income group, the Heckman two-stage regression shows that the λ value is not significant, indicating no severe sample selection bias. The β value and significance after the Heckman adjustment are similar to those before the adjustment.
As previously analyzed, the Rehabilitation Coverage Policy significantly promoted the utilization of rehabilitation services among older adults with disabilities. Theoretically, increased utilization of rehabilitation services should lead to higher annual healthcare expenditures for households with older adults with disabilities. This study uses the utilization of rehabilitation services as a mediating variable to analyze its effect on the Rehabilitation Coverage Policy and annual household healthcare expenditures. According to Table 6, the total effect of the core explanatory variable ( t r e a t m e n t _ t i m e i t ) on the dependent variable ( e x p _ m e d i c i n e i t ) is significant ( β = 0.214, 95% CI 0.106~0.321) and the effect of t r e a t m e n t _ t i m e i t on the mediating variable ( r e h a _ s e r v i c e s i t ) is significant ( β = 0.299, 95% CI 0.030~0.569). Controlling for the mediating variable, the direct effect of t r e a t m e n t _ t i m e i t on e x p _ m e d i c i n e i t remains significant ( β = 0.177, 95% CI 0.100~0.253). Controlling for the core explanatory variable, the effect of r e h a _ s e r v i c e s i t on e x p _ m e d i c i n e i t is significant ( β = 0.136, 95% CI 0.109~0.162). Additionally, the effect of t r e a t m e n t _ t i m e i t on e x p _ m e d i c i n e i t is reduced when controlling for r e h a _ s e r v i c e s i t , indicating that the utilization of rehabilitation services mediates the effect of the Rehabilitation Coverage Policy on annual household healthcare expenditures. Specifically, approximately 19.0% of the increase in annual household healthcare expenditure due to the policy is attributable to the increased utilization of rehabilitation services.

3.5. Parallel Trend Test

For the dependent variables “utilization of rehabilitation services” and “annual household healthcare expenditures,” this study employed the event-study method to test the consistency of pre-treatment trends between the experimental and control groups in the full sample, with 2010 serving as the reference year.
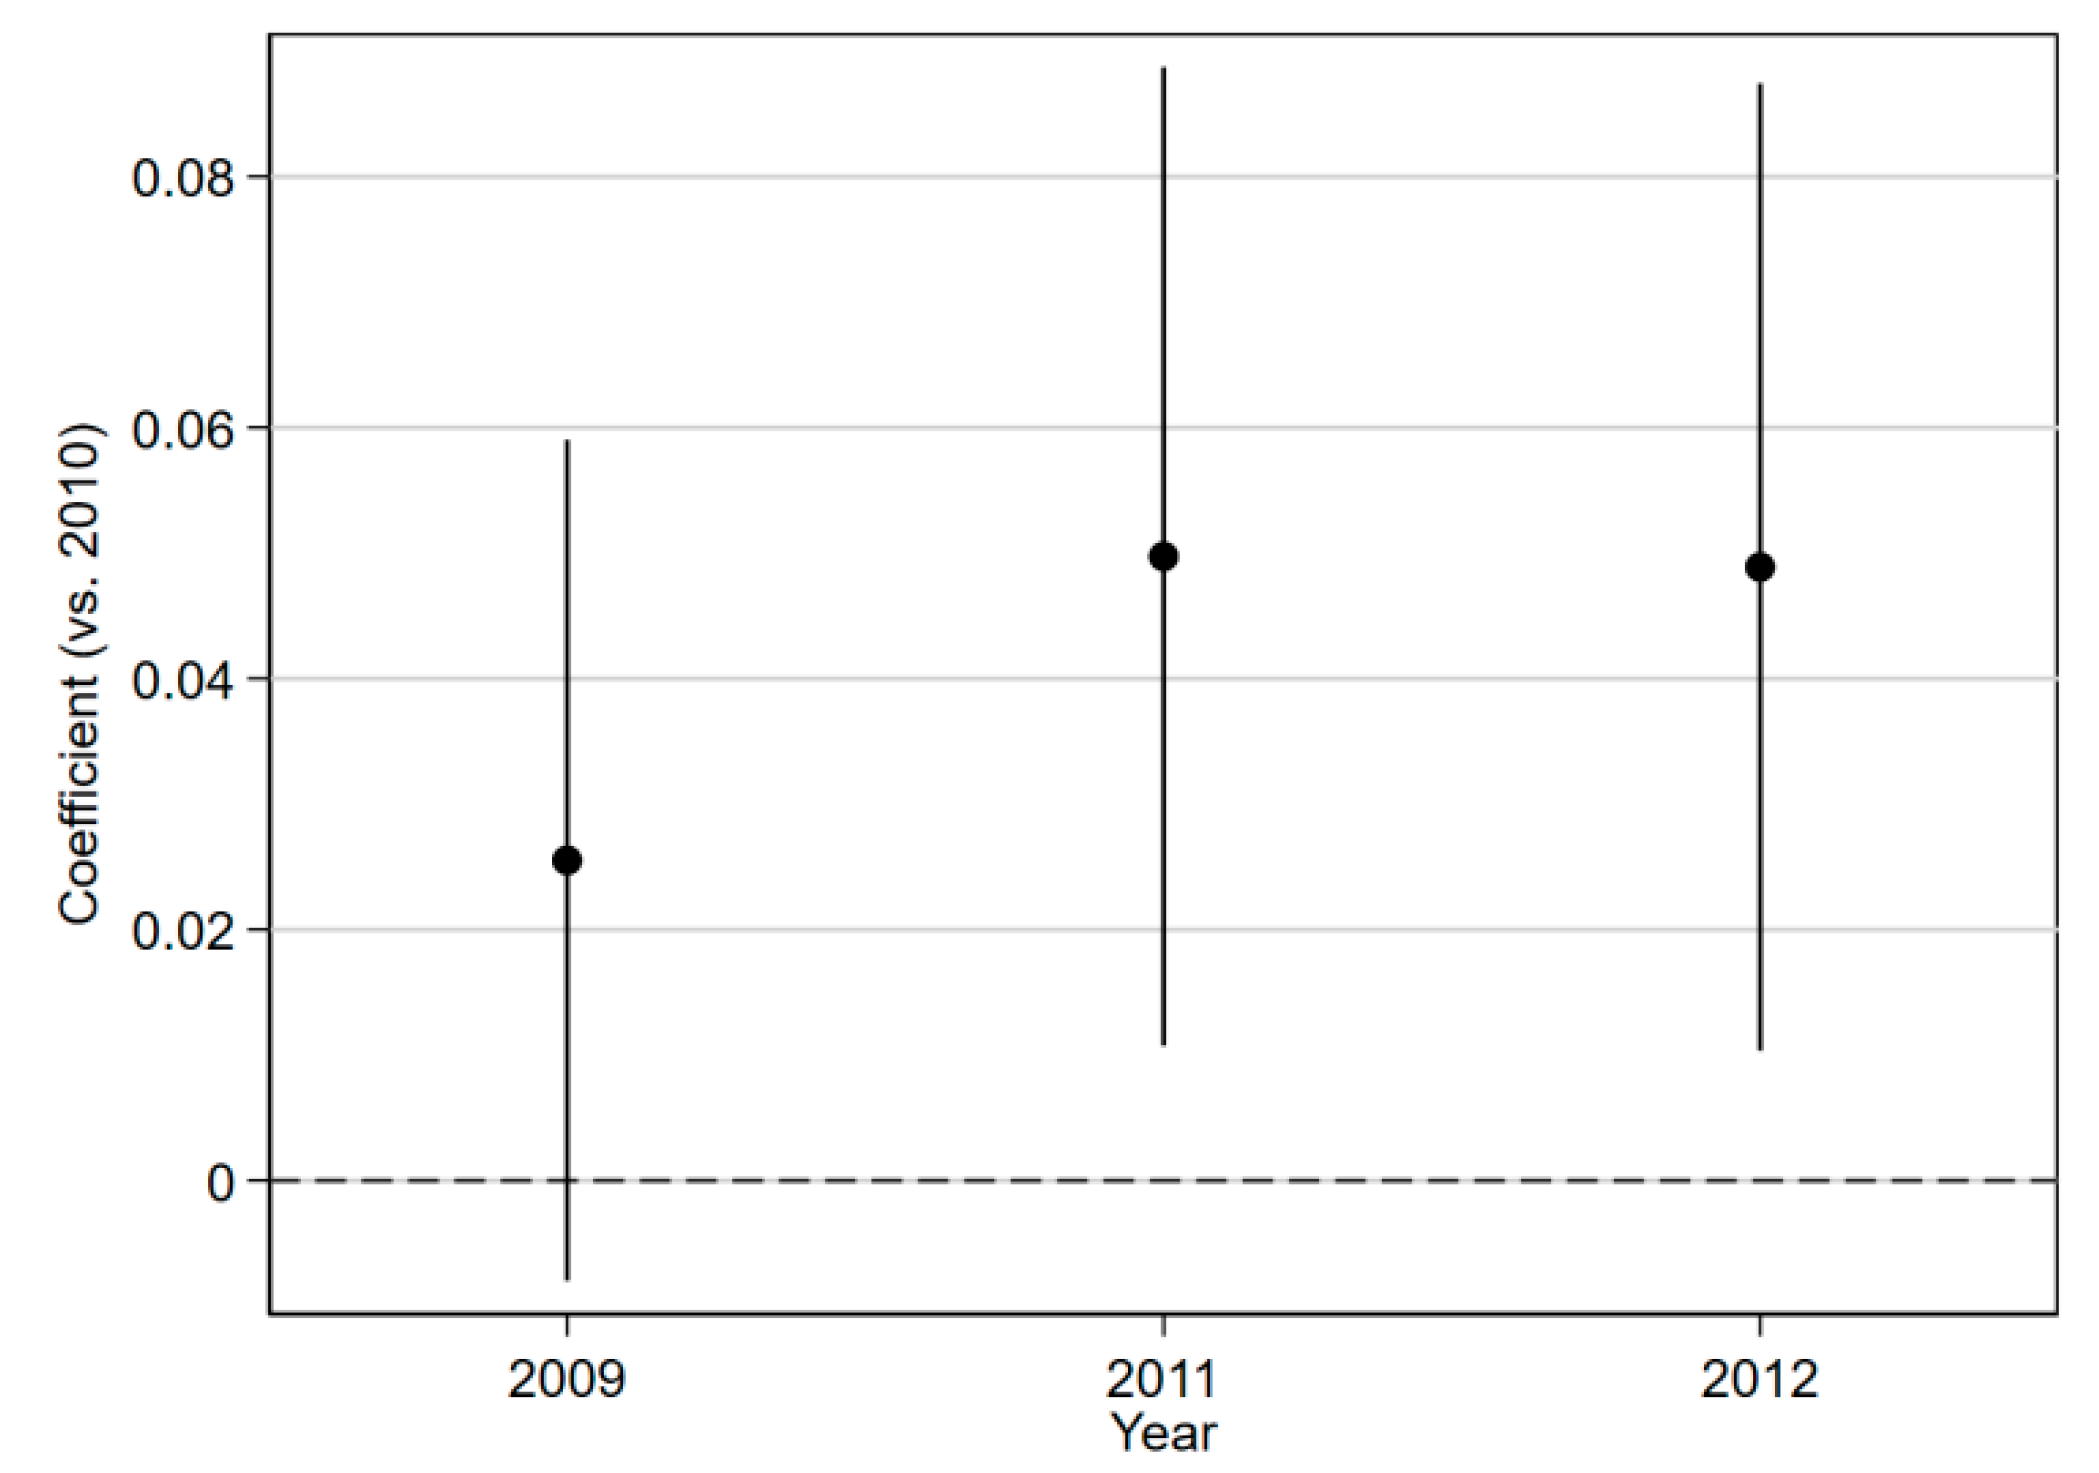
Figure 6 shows that the coefficient for the pre-treatment period (2009) is close to zero and statistically insignificant, suggesting that no systematic difference in trends existed between the treatment and control groups prior to the policy intervention. This supports the validity of assumption of parallel trends. In the post-treatment periods, the estimated coefficients for 2011 and 2012 are positive and their confidence intervals do not include zero, indicating a significant increase in rehabilitation utilization following policy implementation. The results imply that the policy exerted a sustained positive impact on the likelihood of utilizing rehabilitation services.
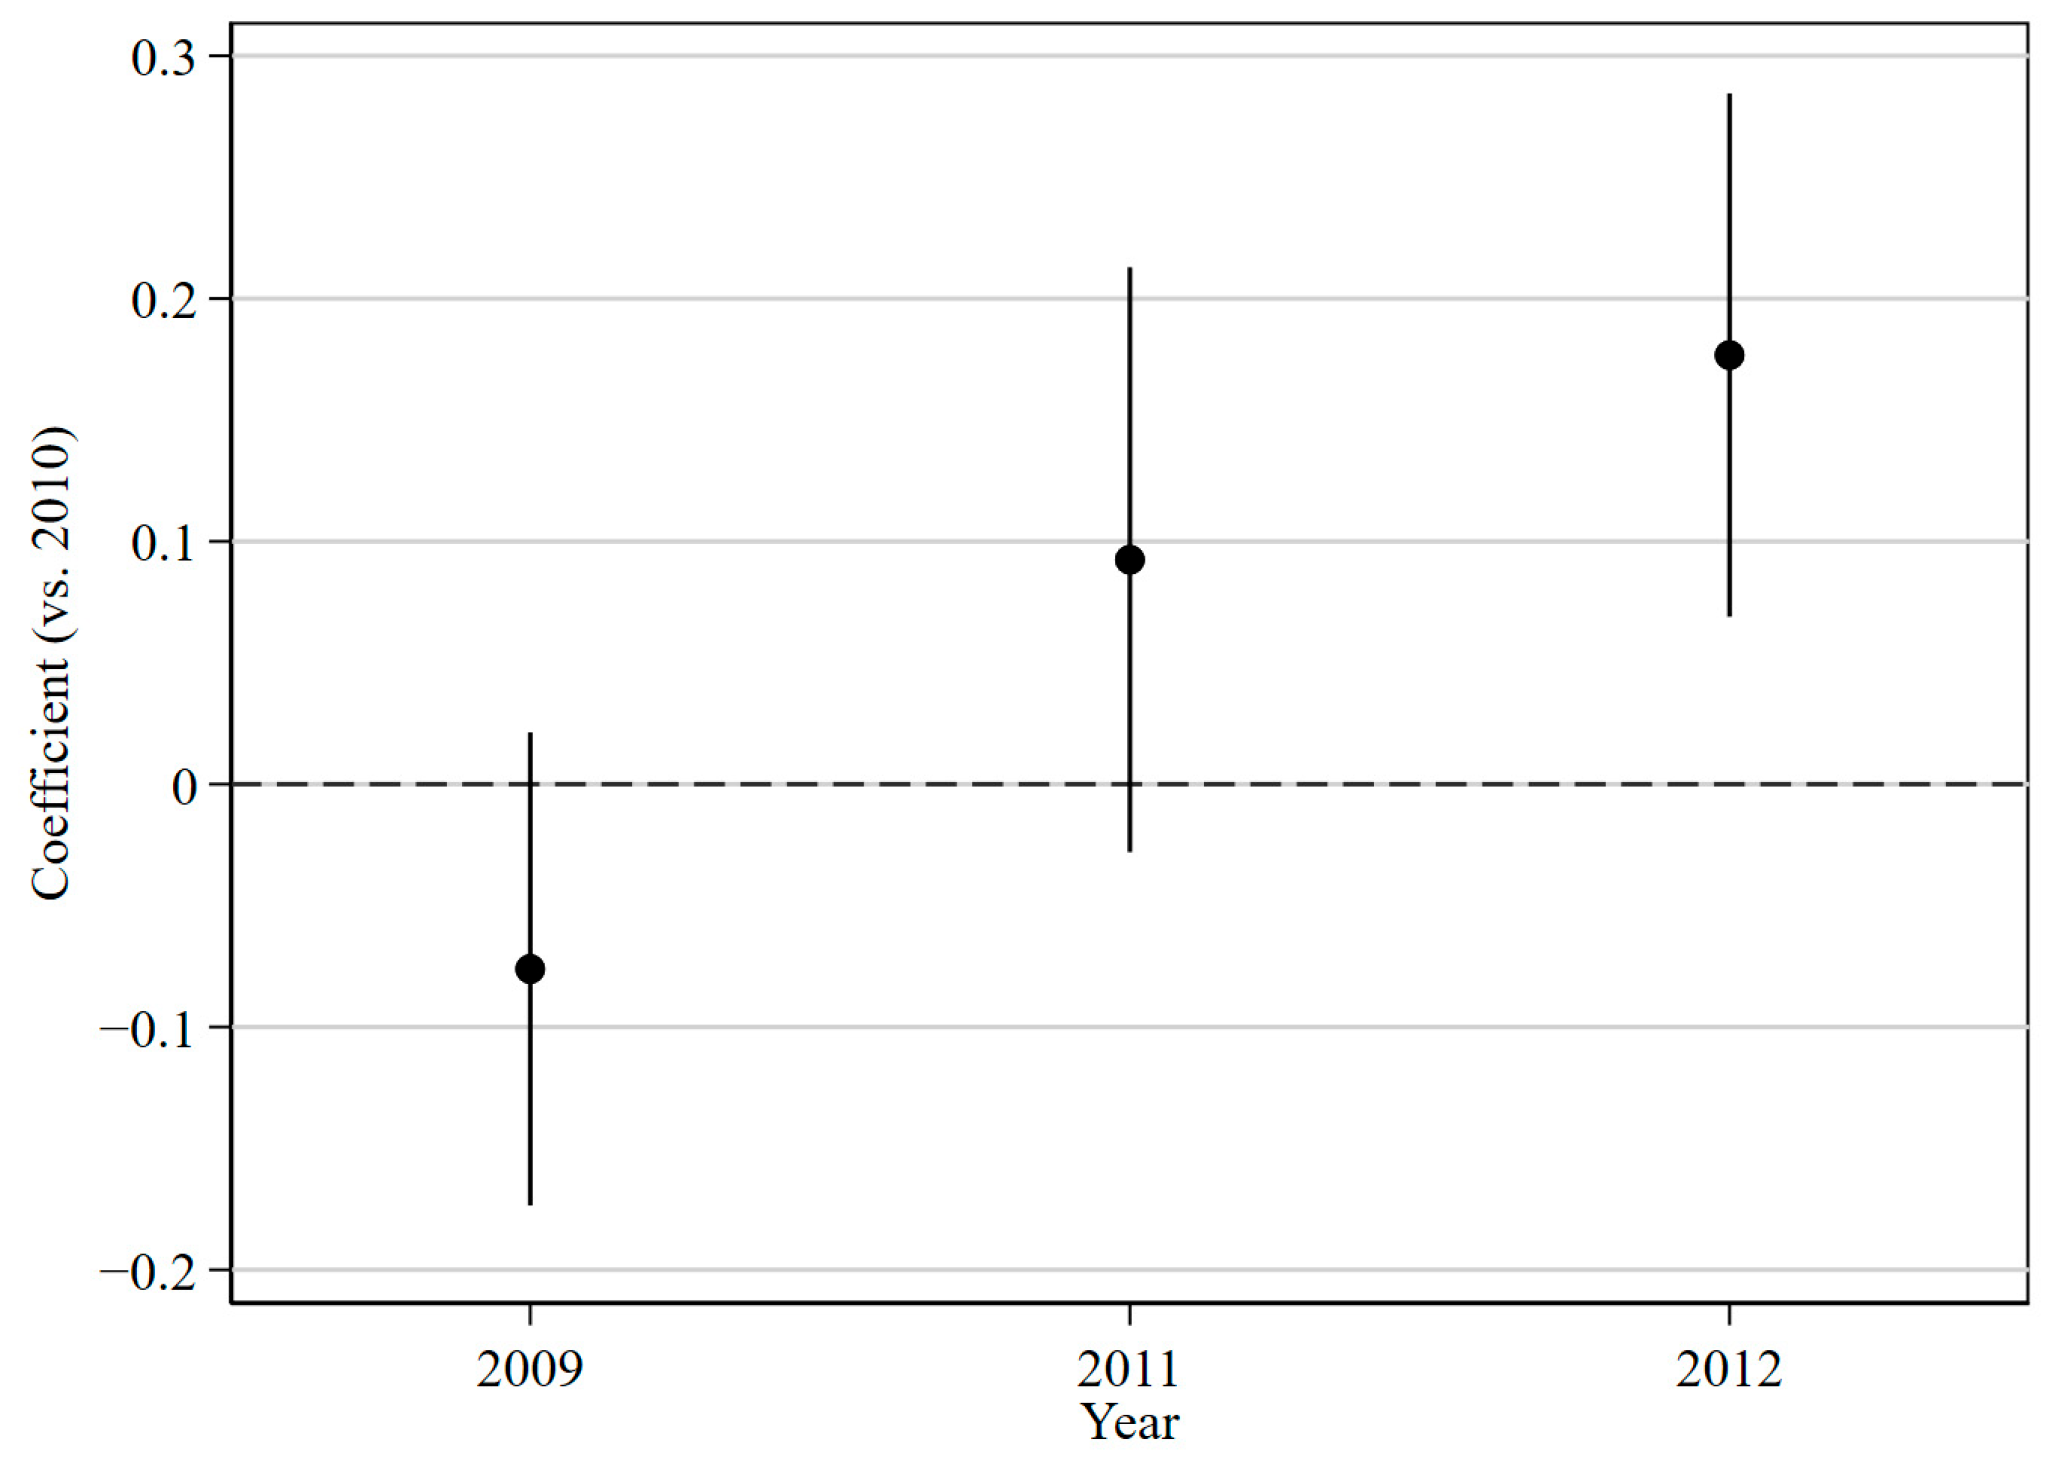
As shown in Figure 7, the coefficient for 2009 is negative but statistically indistinguishable from zero, suggesting no systematic pre-policy difference between the treatment and control groups. This supports the validity of the assumption of parallel trends. In 2011, the estimated coefficient became positive but remained statistically insignificant, indicating an emerging upward trend in household healthcare expenditures, but one that did not reach significance. By 2012, the coefficient was significantly positive, showing that households in the treatment group experienced a clear and sustained increase in expenditures relative to the control group. Taken together, these results confirm that the parallel trends assumption is valid prior to policy implementation and demonstrate that the inclusion of rehabilitation services in basic medical insurance had a delayed but significant impact after the policy came into effect.

4. Discussion

4.1. The Effectiveness of the Rehabilitation Coverage Policy in Promoting Rehabilitation Service Utilization Among Older Adults with Disabilities and Structural Differences Across Demographics

Studies on the effects of the Rehabilitation Coverage Policy are relatively scarce, while extensive research has confirmed the positive impact of health insurance on individual healthcare service utilization [33,34,35,36]. For example, the Urban and Rural Resident Basic Medical Insurance improved access to outpatient and inpatient care among middle-aged and older adults, underscoring the scheme’s role in promoting service utilization for vulnerable groups [36]. Although most of this evidence relates to general medical services, it provides a valuable reference point for understanding the effects of incorporating rehabilitation into insurance schemes. This outcome primarily stems from the increased financial protection provided to patients by the insurance [33,37]. However, the rehabilitation of older adults with disabilities is a complex social issue, including various social units such as individuals, organizations, and the government. Furthermore, at the individual level, the IRSMI policy provided by the government influences older adults with disabilities differently across demographic characteristics. When accounting for individual characteristics in this complex system, the promotion of insurance for the utilization of rehabilitation services results in structural differences across demographic groups [33]. The Rehabilitation Coverage Policy exhibited significant positive effects on men, older individuals, and those with mild disabilities. Conversely, the utilization rate of rehabilitation services among women, younger individuals, and those with moderate-to-severe disabilities remained relatively stable before and after the policy’s implementation. The differential effects for gender, age, and disability severity reflect the heterogeneous capacities of system nodes (individuals) to respond to policy stimuli, shaped by embedded social norms, resource access, and health literacy [27], thereby reflecting the complexity of the social system of rehabilitation for older adults with disabilities. These findings underscore the interdependence, heterogeneity, and non-linearity that characterize complex health systems. Subpopulations demonstrated varied adaptive capacities and feedback mechanisms in response to the same policy intervention, resulting in non-uniform and emergent system outcomes. This reveals the dynamic and adaptive nature of health systems when subjected to structural policy shifts.
WHO surveys indicate significant gender differences in health literacy. In areas where women have limited access to healthcare services, the life expectancy gap between men and women is the smallest. Conversely, in regions where men and women face the same diseases, men are less likely to seek medical attention compared to women [38]. Psychological research supports the notion of gender differences in health literacy. For instance, the Kansas City Study of Adult Life, a pioneering longitudinal study on aging, found that as women age, they tend to become more decisive and self-centered [39]. Analyzing this from the perspective of health literacy and personality traits, older adult females with disabilities are less likely to forgo rehabilitation services due to the absence of rehabilitation insurance compared to men, resulting in relatively stable utilization rates among older adult females with disabilities before and after the implementation of the Rehabilitation Coverage Policy. Culturally, Confucian views in China involve a social order in which men handle external affairs and women manage domestic responsibilities, creating a gendered division of labor [40]. This cultural framework assigns men roles of strength, capability, responsibility, and status [41], making them more resistant to acknowledging their disabilities and less likely to utilize rehabilitation services, which are perceived as forms of passive acceptance. This interaction between limited health literacy and traditional gender norms may enhance the purely positive effects of insurance. By providing economic support to older males with disabilities, insurance could mitigate the impact of rehabilitation costs on their perceived family responsibilities, thus reducing the inhibitory effects of social gender norms on the utilization of rehabilitation services. Some studies support the notion that health insurance significantly promotes the utilization of healthcare services among men [33]. These factors collectively led to a significant change in the likelihood of rehabilitation service utilization among men before and after the policy’s implementation.
Compared to younger elderly disabled individuals, the “return on investment” in health for older elderly disabled individuals is relatively lower. The Health Belief Model suggests that perceived benefits and barriers are crucial determinants of health behaviors [42]. The “high cost–low benefit” dilemma may inhibit the utilization of rehabilitation services among older disabled individuals [27]. Psychologically, the Socioemotional Selectivity Theory (SST) posits that as individuals age, they are more inclined to selectively engage in positive social interactions to promote emotional health [43,44]. For older disabled individuals, not wanting to burden their children economically, and [27] thus avoiding confronting their true health conditions [45], the use of rehabilitation services may provide an opportunity for positive social and emotional choices. Given the high demand for rehabilitation services, combined with the policy’s reduction in service costs, the Rehabilitation Coverage Policy effectively reverses the “high cost–low benefit” dilemma, mitigating the effect of a lower “cost–benefit ratio” on the likelihood of utilizing rehabilitation services [27].
For older adults with mild disabilities, the Rehabilitation Coverage Policy may alter the likelihood of utilizing rehabilitation services due to cognitive and financial burdens. From a cognitive perspective, considering that a quarter of older adults with disabilities have physical disabilities, the 2009 Disability Survey indicated that the proportion of older adults with mild disabilities who believed they did not need rehabilitation services was 19 percentage points higher than that of moderately to severely disabled individuals. The Knowledge–Attitude–Practice (KAP) model emphasizes that health beliefs are crucial in promoting actual health actions. Studies have noted that individuals with mild disabilities may face less social prejudice, and their lower levels of functional impairment may reduce their perceived need for rehabilitation services, thus fundamentally reducing the possibility of utilizing such services [46]. However, after the implementation of the Rehabilitation Coverage Policy, various regions actively promoted rehabilitation services for the disabled, making rehabilitation information more accessible and diverse. The 2011 Disability Survey showed that the proportion of older individuals with mild disabilities who believed they did not need rehabilitation services was 15 percentage points higher than that of moderately to severely disabled individuals; this is a 4-percentage-point decrease compared to 2009. Alongside the policy’s reduction in rehabilitation service costs, it significantly improved the perceived necessity and feasibility of rehabilitation services among older individuals with mild disabilities, thereby stimulating increased utilization.

4.2. The Effectiveness of the Rehabilitation Coverage Policy in Promoting Household Healthcare Expenditures for Older Adults with Disabilities and Structural Differences Across Demographics

IRSMI significantly increases household healthcare expenditures among older adults with disabilities, with particularly pronounced effects for high-income households; however, its impact on low- and middle-income groups remains limited. These findings highlight the importance of designing adaptive and context-sensitive policies that consider not only the direct effects of financing reforms but also the mediated pathways through which these effects unfold. In systems theory terms, IRSMI serves as a leverage point that activates latent demand, particularly among higher-income subpopulations. However, the limited response among lower-income groups suggests a systemic bottleneck, indicating that insurance coverage alone is insufficient to ensure equitable service utilization. This underscores the need for system-level coordination across financing, service delivery, and social support components.
Numerous empirical studies have shown that health insurance significantly reduces out-of-pocket medical expenses [47,48,49,50] Some studies suggest that health insurance has not significantly reduced the burden of household medical expenses [37]. Thus, health insurance may influence personal or household medical expenses through two mechanisms: reducing out-of-pocket costs for already utilized healthcare services [51,52,53] and promoting the use of new healthcare services, thereby increasing out-of-pocket expenses. This study found that the growth in health expenditure among residents affected by the IRSMI policy was 297 yuan (CNY) higher than that of residents not affected by the policy. It also revealed that the utilization of rehabilitation services mediated the relationship between the policy and annual household healthcare expenditures. This is the mechanism through which insurance enhances residents’ ability to pay for health services, which in turn stimulates greater demand and results in higher health-related expenditures. While long-term care insurance generally reduces direct medical spending, extant research observed that, despite significantly lowering medical and healthcare expenditures, insurance substantially increases non-medical healthcare and total household expenditure [54]. Yuan’s findings indicate that enrollment in China’s Basic Medical Insurance significantly increases total healthcare expenditures, while out-of-pocket expenses increase for urban residents [55]. In Yu’s study, the reform of the Urban and Rural Resident Basic Medical Insurance affected both the amount and the share of household consumption. Specifically, the reform resulted in an increase in total household consumption, including both medical and non-medical expenditures. Among these, the proportion of medical costs rose, whereas the proportion of non-medical costs declined [56].
Existing studies suggest that income level is an important moderator of the relationship between health insurance and personal out-of-pocket medical expenses [57]. High income levels play a crucial role in promoting the utilization of rehabilitation services among older adults and disabled populations [58]. It is a key positive factor in preventing households from falling into catastrophic medical expenditure situations [59,60]. This underscores the importance of economic burden in individual health decisions. Among insured Saudi citizens, out-of-pocket expenses for health and medical services increased with rising income levels [57]. Similarly, in China, higher-income groups tend to benefit more from the Basic Medical Insurance scheme; however, low-income households often face financial constraints that limit their capacity to fully utilize these benefits [55]. This study conducted subgroup analyses based on annual per capita household income levels. The results show structural differences in the policy’s effects on annual household and healthcare expenditures across different income groups. The policy significantly increased household healthcare expenditures for older adults with disabilities in high-income households, whereas there was no significant increase for low- and middle-income households before and after the policy’s implementation. This suggests that the policy has a limited impact on the household healthcare expenditures of low- and middle-income groups. Basic medical security for economically disadvantaged groups has always been a priority for the Chinese government. Currently, the medical expense burden on severely disabled individuals and other disadvantaged groups is generally heavy [61,62], and their medical needs are difficult to meet effectively, potentially related to insurance deductibles, caps, and reimbursement rates [63,64]. The extant literature pointed out that “preferential insurance poverty alleviation policies,” centered on appropriate financial subsidies for individual contributions, reducing deductibles, raising caps, and increasing reimbursement rates, can positively alleviate the difficulties faced by economically disadvantaged groups [63]. Given these barriers to insurance utilization, the policy’s implementation may be ineffective in significantly increasing household healthcare expenditures for low-income older adults with disabilities. This also means that the IRSMI policy may need to be supplemented by other complementary policies to benefit all groups (especially vulnerable groups such as low-income older adults with disabilities) in the complex process of extending rehabilitation services to older adults with disabilities.

5. Limitations

First, because the Rehabilitation Coverage Policy was implemented nationwide, this study uses “having insurance or not” to differentiate between the experimental and control groups. However, if insured older adults with disabilities use rehabilitation services due to worsening health conditions or higher health literacy, the control variable of “having insurance or not” may not accurately identify the policy effect. To address this issue, this study included degrees of disability as control variables to account for differences in health service needs and socioeconomic status and control for differences in health literacy. Second, there is an inevitable time gap between the data utilized in this study and the present. The analysis draws on the China Disabled Persons’ Federation Monitoring Survey (2007–2013), which follows a nationally representative baseline sample from the Second National Survey on Disability (2006), with disability status determined according to the national standard Classification and Grading of Disability (GB/T 26341-2010). To maintain a balanced observation window, we focused on the 2009–2012 period, spanning two years before and two years after the implementation of the 2011 policy. Additionally, the accelerated prevalence of disability and functional decline in the aftermath of COVID-19 may have further amplified the importance of rehabilitation coverage. In this sense, the effects identified here are likely conservative, underscoring the need for validation with post-pandemic data. Nevertheless, the findings remain informative, as they reveal structural disparities in the relationship between insurance coverage and rehabilitation service utilization across disability severity, gender, age, and income; in addition, the mechanisms identified whereby insurance lowers financial barriers and promotes rehabilitation utilization remain relevant, thereby offering important insights for ongoing and future policy development.

6. Conclusions

IRSMI effectively increases the likelihood of rehabilitation services utilization among older adults with disabilities; more pronounced effects were identified for men, middle-aged and older individuals, and those with mild disabilities. The policy significantly raises annual household healthcare expenditures for older adults with disabilities, with approximately one-fifth of this increase being attributable to increased rehabilitation services utilization. Due to the complexity of implementing a social system for the rehabilitation of older adults with disabilities, this policy has different effects on different groups. For example, IRSMI significantly promotes an increase in the household healthcare expenditure of high-income older adults with disabilities; however, it has a limited impact on low- and middle-income groups.
From a policy perspective, several actionable implications can be drawn from these findings. First, the heterogeneous effects observed across gender, age, and disability severity highlight the need for equity-oriented interventions. Tailored measures, such as gender-sensitive health literacy initiatives, community-based outreach programs targeting younger and disabled individuals, and financial subsidies for disadvantaged groups, could help to ensure more equitable access to rehabilitation services. Second, the concentration of increased healthcare expenditures among high-income households suggests systemic bottlenecks for low- and middle-income groups. Complementary financial protection measures, such as lowering deductibles, raising reimbursement ceilings, and providing targeted subsidies, could alleviate these barriers and promote more inclusive utilization. Third, as rehabilitation utilization mediates the policy and its effect on household healthcare expenditure, systemic reforms are required to enhance both efficiency and sustainability. Strengthening the disability reporting system, integrating rehabilitation into long-term care insurance and medical aid programs, and expanding community-level rehabilitation delivery represent feasible strategies for optimizing the functioning of the rehabilitation system.
From a research perspective, against the dual backdrop of rapid population aging and increasing disability in China, rehabilitation has become an essential health strategy. Accurately measuring the health benefits of rehabilitation services is of critical importance for informing and advancing policy implementation. Future research should (i) extend the analysis to the post-2013 and post-COVID-19 periods; (ii) integrate provider-side capacity and quality data to better assess supply side constraints and equity implications; (iii) conduct heterogeneity analyses across different types of insurance coverage and disability categories.

Author Contributions

Y.W. and L.T. contributed equally to this work and share first authorship. Conceptualization, Y.W., L.T., X.Z. and T.W.; methodology, Y.W., X.Z. and T.W.; software, Y.W.; validation, T.W.; formal analysis, Y.W., L.T. and T.W.; investigation, Y.W., L.T. and T.W.; resources, L.T.; data curation, Y.W.; writing—original draft preparation, Y.W. and L.T.; writing—review and editing, X.Y., W.L., C.Y. and Y.Z.; visualization, Y.W.; supervision, S.W. and L.W.; project administration, Y.W. and T.W.; funding acquisition, Y.W. and L.W. All authors have read and agreed to the published version of the manuscript.

Funding

This work was supported by China Postdoctoral Science Fund—General Fund [grant number 2024M751590], Shui Mu Tsinghua Scholar Program, Tsinghua Strategy for Heightening Arts, Humanities and Social Sciences Plateaus & Peaks [grant number 2024TSG06402], and China National Natural Science Foundation [grant number 72441022].

Institutional Review Board Statement

The 2006 survey and the follow-up surveys were conducted in all provinces by the Leading Group of the National Sample Survey on Disability and the National Bureau of Statistics. All the above surveys were approved by the China State Council (No. 20051104) and implemented within the legal framework governed by the Statistical Law of China (1996 amendment). Informed consent that covered participation in the survey and the clinical assessment process was signed by all the respondents. The data were deidentified, so a further review of the data analysis was exempted.

Data Availability Statement

The data that support the findings of this study are available from the Institute of Population Research of Peking University (IPR). Restrictions apply to the availability of these data, which were used under license for this study. Data are available with the permission of IPR. Requests to access these datasets should be directed to 00-86-010-62751974.

Conflicts of Interest

The authors declare no conflicts of interest.

References

  1. Qiu, Z.; Guo, J.; Li, L.; Liang, P.; Wu, X.; Chen, D.; Sun, H.; Wang, G.; Zheng, J.; Shi, X.; et al. WHO Rehabilitation in Health System: Background, Framework and Approach, Contents and Implementation. Chin. J. Rehabil. Theory Pract. 2020, 26, 16–20. (In Chinese) [Google Scholar] [CrossRef]
  2. Luo, Y.; Su, B.; Zheng, X. Trends and challenges for population and health during population aging—China, 2015–2050. CCDC Weekly 2021, 3, 593. [Google Scholar] [CrossRef] [PubMed]
  3. Schmid, A.; Freeman, R. Western Europe, health systems of. In International Encyclopedia of Public Health; Quah, S.R., Ed.; Academic Press: Amsterdam, The Netherlands, 2016; pp. 408–416. ISBN 978-0-12-803708-9. [Google Scholar]
  4. Macy, W.; Willer, R. From Factors to Actors: Computational Sociology and Agent-Based Modeling. Annu. Rev. Sociol. 2002, 28, 143–166. [Google Scholar] [CrossRef]
  5. Xinhua News Agency. China Releases the Main Data Bulletin of the Second National Sampling Survey of Disabled Persons. 2007. Available online: http://www.gov.cn/jrzg/2007-05/28/content_628517.htm (accessed on 9 September 2025).
  6. Hu, H. The impact of Urban Residents’ Medical Insurance on health service utilization—Policy effect and robustness test. J. Zhong Univ. Econ. Law. 2012, 5, 21–28. [Google Scholar]
  7. General Office of the State Council of the People’s Republic of China. National Action Plan for Disability Prevention (2021–2025). 2024. Available online: https://www.gov.cn/gongbao/content/2022/content_5669420.htm (accessed on 9 September 2025).
  8. Gimigliano, F.; Negrini, S. The World Health Organization “Rehabilitation 2030: A call for action”. Eur. J. Phys. Rehab. Med. 2017, 53, 155–168. [Google Scholar] [CrossRef] [PubMed]
  9. Cieza, A.; Causey, K.; Kamenov, K.; Hanson, S.W.; Chatterji, S.; Vos, T. Global estimates of the need for rehabilitation based on the Global Burden of Disease Study 2019: A systematic analysis for the Global Burden of Disease Study 2019. Lancet 2020, 396, 2006–2017. [Google Scholar] [CrossRef]
  10. Fukuda, Y.; Nakao, H.; Yahata, Y.; Imai, H. In-depth descriptive analysis of trends in prevalence of long-term care in Japan. Geriatr. Gerontol. Int. 2008, 8, 166–171. [Google Scholar] [CrossRef]
  11. Shinohara, H.; Mikami, Y.; Kuroda, R.; Asaeda, M.; Kawasaki, T.; Kouda, K.; Nishimura, Y.; Ohkawa, H.; Uenishi, H.; Shimokawa, T.; et al. Rehabilitation in the long-term care insurance domain: A scoping review. Health Econ. Rev. 2022, 12, 59. [Google Scholar] [CrossRef]
  12. Seijas, V.A.; Hrzic, K.M.; Neculhueque, X.Z.; Sabariego, C. Improving access to and coverage of rehabilitation services through the implementation of rehabilitation in primary health care: A case study from Chile. Health Syst. Reform. 2023, 9, 2242114. [Google Scholar] [CrossRef]
  13. Gupta, N.; Castillo-Laborde, C.; Landry, M.D. Health-related rehabilitation services: Assessing the global supply of and need for human resources. BMC Health Serv. Res. 2011, 11, 276. [Google Scholar] [CrossRef] [PubMed]
  14. Garg, A.; Skempes, D.; Bickenbach, J. Legal and regulatory approaches to rehabilitation planning: A concise overview of current laws and policies addressing access to rehabilitation in five European countries. Int. J. Environ. Res. Public Health 2020, 17, 4363. [Google Scholar] [CrossRef]
  15. Krug, E.; Cieza, A. Strengthening health systems to provide rehabilitation services. Bull. World Health Organ. 2017, 95, 167. [Google Scholar] [CrossRef]
  16. Takahashi, M. Insurance coverage, long-term care utilization, and health outcomes. Eur. J. Health Econ. 2023, 24, 1383–1397. [Google Scholar] [CrossRef]
  17. Cheng, Q.; Fattah, R.A.; Susilo, D.; Satrya, A.; Haemmerli, M.; Kosen, S.; Novitasari, D.; Puteri, G.C.; Adawiyah, E.; Hayen, Y.; et al. Determinants of healthcare utilization under the Indonesian national health insurance system: A cross-sectional study. BMC Health Serv. Res. 2025, 25, 48. [Google Scholar] [CrossRef]
  18. Zhou, W.Q.; Gao, Y.T.; Wang, Y.; Liu, J.; Wang, Q.Y.; Zhou, L.S. Understanding care needs of older adults with disabilities: A scoping review. J. Multidiscip. Healthc. 2024, 18, 2331–2350. [Google Scholar] [CrossRef]
  19. Busse, R.; Blümel, M.; Knieps, F.; Bärnighausen, T. Statutory health insurance in Germany: A health system shaped by 135 years of solidarity, self-governance, and competition. Lancet 2017, 390, 882–897. [Google Scholar] [CrossRef] [PubMed]
  20. Bachani, A.M.; Bentley, J.A.; Kautsar, H.; Neill, R.; Trujillo, A.J. Suggesting global insights to local challenges: Expanding financing of rehabilitation services in low- and middle-income countries. Front. Rehabil. Sci. 2024, 5, 1305033. [Google Scholar] [CrossRef] [PubMed]
  21. Zhu, K.; Zhang, L.; Yuan, S.; Zhang, X.; Zhang, Z. Health financing and integration of urban and rural residents′ basic medical insurance systems in China. Int. J. Equity Health 2017, 16, 194. [Google Scholar] [CrossRef] [PubMed]
  22. Wang, P.; Li, S.; Wang, Z.; Jiao, M.; Zhang, Y.; Huang, W.; Ning, N.; Gao, L.; Shan, L.; Li, Y.; et al. Perceptions of the benefits of the basic medical insurance system among the insured: A mixed-methods study in a northern city of China. Front. Public Health 2023, 11, 1043153. [Google Scholar] [CrossRef]
  23. Yip, W.; Fu, H.; Jian, W.; Liu, J.; Pan, J.; Xu, D.; Yang, H.; Zhai, T. Universal health coverage in China part 1: Progress and gaps. Lancet Public Health 2023, 8, e1025–e1034. Available online: https://www.thelancet.com/journals/lanpub/article/PIIS2468-2667(23)00254-2/fulltext (accessed on 9 September 2025). [CrossRef]
  24. Zhang, X.; Ma, L.; Liu, X.; Cui, N.; Guo, B.; Zhang, L. Association between health insurance programs and rehabilitation services utilisation among people with disabilities: Evidence from China. Public Health 2024, 232, 201–207. [Google Scholar] [CrossRef]
  25. Luo, Y. Study on Socioeconomic Risk Factors of Severe Mental Disability in Chinese Population. Ph.D. Thesis, Peking University, Beijing, China, 2019. [Google Scholar]
  26. He, P.; Guo, C.; Luo, Y.; Wen, X.; Salas, J.I.; Chen, G.; Zheng, X. Trends in rehabilitation services use in Chinese children and adolescents with intellectual disabilities: 2007–2013. Arch. Phys. Med. Rehabil. 2017, 98, 2408–2415. [Google Scholar] [CrossRef]
  27. Wang, Y.; Liu, Y.; Fan, Y.; Fan, Y.; Zheng, X. Relationship Between Utilization Status of Rehabilitation Services and Socioeconomic Position Among the Elderly with Physical Disabilities. Med. Soc. 2023, 36, 6–12. (In Chinese) [Google Scholar] [CrossRef]
  28. GB/T 26341-2010; Classification and Grading Criteria of Disability. General Administration of Quality Supervision, Inspection and Quarantine of the People’s Republic of China. Standardization Administration of China: Beijing, China, 2011. Available online: http://files.anshan.gov.cn/files/ueditor/ASSCL/jsp/upload/file/20230815/1692067790671006554.pdf (accessed on 14 January 2011).
  29. Huang, X.; Yan, T. Rehabilitation Medicine; People’s Health Publishing House: Beijing, China, 2019. [Google Scholar]
  30. Zhao, C. General Rehabilitation Medicine: Theoretical and Clinical Practice Exploration; China Science and Technology Press: Beijing, China, 2020. [Google Scholar]
  31. Bai, X. Heckman Two-stage Analysis on the R&D Investment Behavior of Enterprises—An Empirical Study Based on the Panel Data of Chinese Industrial Enterprises. J. Bus. Econ. 2014, 05, 85–96. (In Chinese) [Google Scholar] [CrossRef]
  32. Li, Q.; Yang, B.; Chen, Y.; Qiao, H. Impact of the Adjustment of the New Rural Cooperative Medical Scheme on the Utilization of Health Services by Rural Residents. Chin. J. Public Health 2021, 37, 1389–1393. Available online: https://www.zgggws.com/en/article/doi/10.11847/zgggws1128757 (accessed on 1 September 2021).
  33. Hu, H.; Zhang, X.; Zhao, Y. Medical Insurance’s Impacts on Elders’ Health Service Utilization: Based on the Counterfactual Estimation of the Propensity Score Matching. Chin. J. Popul. Sci. 2012, 02, 57–66+111–112. Available online: https://zgrkkx.ajcass.com/Magazine/Show/33991 (accessed on 1 April 2012).
  34. Hu, H.; Luan, W.; Li, J. Medical Insurance, Health Services Utilization and Excessive Demands for Medical Services—The Impact of Medical Insurance on Utilization of Health Service of the Elderly. J. Shanxi Univ. Financ. Econ. 2015, 37, 4–24. (In Chinese) [Google Scholar] [CrossRef]
  35. Yao, Q.; Li, H.; Yang, F. A Scoping Review of the Impact of Medical Insurance Enrollment Location on the Health Service Utilization and Health Status of the Migrants Population in China and Its Countermeasures. Chin. Health Serv. Manag. 2022, 39, 666–671+720. (In Chinese). Available online: https://d.wanfangdata.com.cn/periodical/zgwssygl202209006 (accessed on 28 September 2022).
  36. Chen, R.; Zhang, L.; Fang, Y. Effects of urban and rural resident basic medical insurance on healthcare utilization inequality in China. Int. J. Public Health 2023, 68, 1605521. [Google Scholar] [CrossRef]
  37. Pan, J.; Lei, X.; Liu, G. Does medical insurance promote health—Empirical analysis based on basic medical insurance for urban residents in China. Econ. Res. J. 2013, 39, 130–142+156. [Google Scholar]
  38. WHO. Uneven Access to Health Services Drives Life Expectancy Gaps. 2024. Available online: https://www.who.int/zh/news/item/04-04-2019-uneven-access-to-health-services-drives-life-expectancy-gaps-who (accessed on 4 April 2019).
  39. Hooyman, N.R. Social Gerontology: A Multidisciplinary Perspective; Pearson: Boston, MA, USA, 2008. [Google Scholar]
  40. Bian, H. The Orientation and Significance of Confucian Gender Culture for Women. Open Access Libr. J. 2023, 10, 1–7. [Google Scholar] [CrossRef]
  41. Li, G. Dilemmas and paths of male participation in family care under the universal two-child policy. J Shenzhen Univ. Humanit. Soc. Sci. 2018, 37, 114–122. Available online: https://xb.szu.edu.cn/CN/abstract/abstract578.shtml (accessed on 1 June 2018).
  42. Janz, N.K.; Becker, M.H. The health belief model: A decade later. Health Educ. Q. 1984, 11, 1–47. [Google Scholar] [CrossRef]
  43. Carstensen, L. Socioemotional selectivity theory: The role of perceived endings in human motivation. Gerontologist 2021, 61, 1188–1196. [Google Scholar] [CrossRef]
  44. Yu, J.; Li, J.; Ma, Z.; Niu, Y. Positivity Effect in Older Adults Occurred in the Late Time Window. In Proceedings of the 90th Anniversary Conference of the Chinese Psychological Society and the 14th National Psychology Academic Conference, Xi’an, China, 21 October 2011. [Google Scholar]
  45. Meishan News Network. Why Don’t Elderly People Like to Go to the Hospital. 2024. Available online: https://www.mshw.net/wstt/202001/t20200119_469034.html (accessed on 20 June 2024).
  46. Babik, I.; Gardner, E.S. Factors affecting the perception of disability: A developmental perspective. Front. Psychol. 2021, 12, 702166. (In Chinese) [Google Scholar] [CrossRef]
  47. Fan, V.Y.; Karan, A.; Mahal, A. State health insurance and out-of-pocket health expenditures in Andhra Pradesh, India. Int. J. Health Care Financ. Econ. 2012, 12, 189–215. [Google Scholar] [CrossRef]
  48. Camacho, A.; Conover, E. Effects of subsidized health insurance on newborn health in a developing country. Econ. Dev. Cult. Change 2013, 61, 633–658. [Google Scholar] [CrossRef]
  49. Bernal Lobato, N.; Carpio, M.; Klein, T. IZA DP No. 8213: The Effects of Access to Health Insurance for Informally Employed Individuals in Peru. Available online: https://papers.ssrn.com/sol3/papers.cfm?abstract_id=2649928 (accessed on 25 August 2015).
  50. Levine, D.; Polimeni, R.; Ramage, I. Insuring health or insuring wealth? An experimental evaluation of health insurance in rural Cambodia. J. Dev. Econ. 2016, 119, 1–15. [Google Scholar] [CrossRef]
  51. De, P.K. Impacts of insurance expansion on health cost, health access, and health behaviors: Evidence from the medicaid expansion in the US. Int. J. Health Econ. Manag. 2021, 21, 495–510. [Google Scholar] [CrossRef] [PubMed]
  52. Liu, Y.; Hao, Y.; Lu, Z. Health shock, medical insurance and financial asset allocation: Evidence from CHFS in China. Health Econ. Rev. 2022, 12, 52. [Google Scholar] [CrossRef] [PubMed]
  53. Alemayehu, Y.K.; Dessie, E.; Medhin, G.; Birhanu, N.; Hotchkiss, D.R.; Teklu, A.M.; Kiros, M. The impact of community-based health insurance on health service utilization and financial risk protection in Ethiopia. BMC Health Serv. Res. 2023, 23, 67. [Google Scholar] [CrossRef]
  54. Zhang, T.; Hu, Z.; Zhang, K.; Li, X. The impact of long-term care insurance on household expenditures of the elderly: Evidence from China. PLoS ONE 2025, 20, e0316758. [Google Scholar] [CrossRef]
  55. Yuan, X.; Yang, X.; Zhou, X. The poverty prevention effects of health insurance: Evidence from China’s basic medical insurance program. Front. Public Health 2025, 13, 1576146. [Google Scholar] [CrossRef]
  56. Yu, S.; Ma, X.; Zhan, P. Effects of the Resident Basic Medical Insurance reform on household consumption in China. China World Econ. 2024, 32, 96–129. [Google Scholar] [CrossRef]
  57. Al-Hanawi, M.; Mwale, M.; Qattan, A. Health insurance and out-of-pocket expenditure on health and medicine: Heterogeneities along income. Front. Pharmacol. 2021, 12, 638035. [Google Scholar] [CrossRef]
  58. Fan, Y.; Wang, Y.; Zheng, X. Rehabilitation service utilization and its associated factors among the elderly with disability in China. Chin. J. Health Policy 2022, 15, 31–39. Available online: http://journal.healthpolicy.cn/ch/reader/view_abstract.aspx?file_no=20220505&flag=1 (accessed on 1 May 2022).
  59. Callander, E.J.; Fox, H.; Lindsay, D. Out-of-pocket healthcare expenditure in Australia: Trends, inequalities and the impact on household living standards in a high-income country with a universal health care system. Health Econ. Rev. 2019, 9, 10. [Google Scholar] [CrossRef]
  60. Li, X.; Mohanty, I.; Zhai, T.; Chai, P.; Niyonsenga, T. Catastrophic health expenditure and its association with socioeconomic status in China: Evidence from the 2011-2018 China Health and Retirement Longitudinal Study. Int. J. Equity Health 2023, 22, 194. [Google Scholar] [CrossRef] [PubMed]
  61. Tan, Z. Who took away the dividends of healthcare reform. China Health Insur. 2015, 6, 23–24. (In Chinese). Available online: https://d.wanfangdata.com.cn/periodical/zgylbx201506010 (accessed on 26 July 2015).
  62. Zhou, L. The medical security for disadvantaged groups needs to clarify what the problem is and what the answer is. China Health Insur. 2015, 6, 24–25. (In Chinese). Available online: https://d.wanfangdata.com.cn/periodical/zgylbx201506011 (accessed on 26 July 2015).
  63. Huang, W. Insurance policy and Chinese-style poverty alleviation: Experience, dilemma and path optimization. Manag. World 2019, 35, 135–150. (In Chinese) [Google Scholar] [CrossRef]
  64. Liu, H.; Tao, J. Study on Poverty Reduction Effect and Path Optimization of Inclined Medical Insurance Poverty Alleviation Policy. Soc. Secur. Stud. 2020, 4, 10–20. (In Chinese) [Google Scholar] [CrossRef]
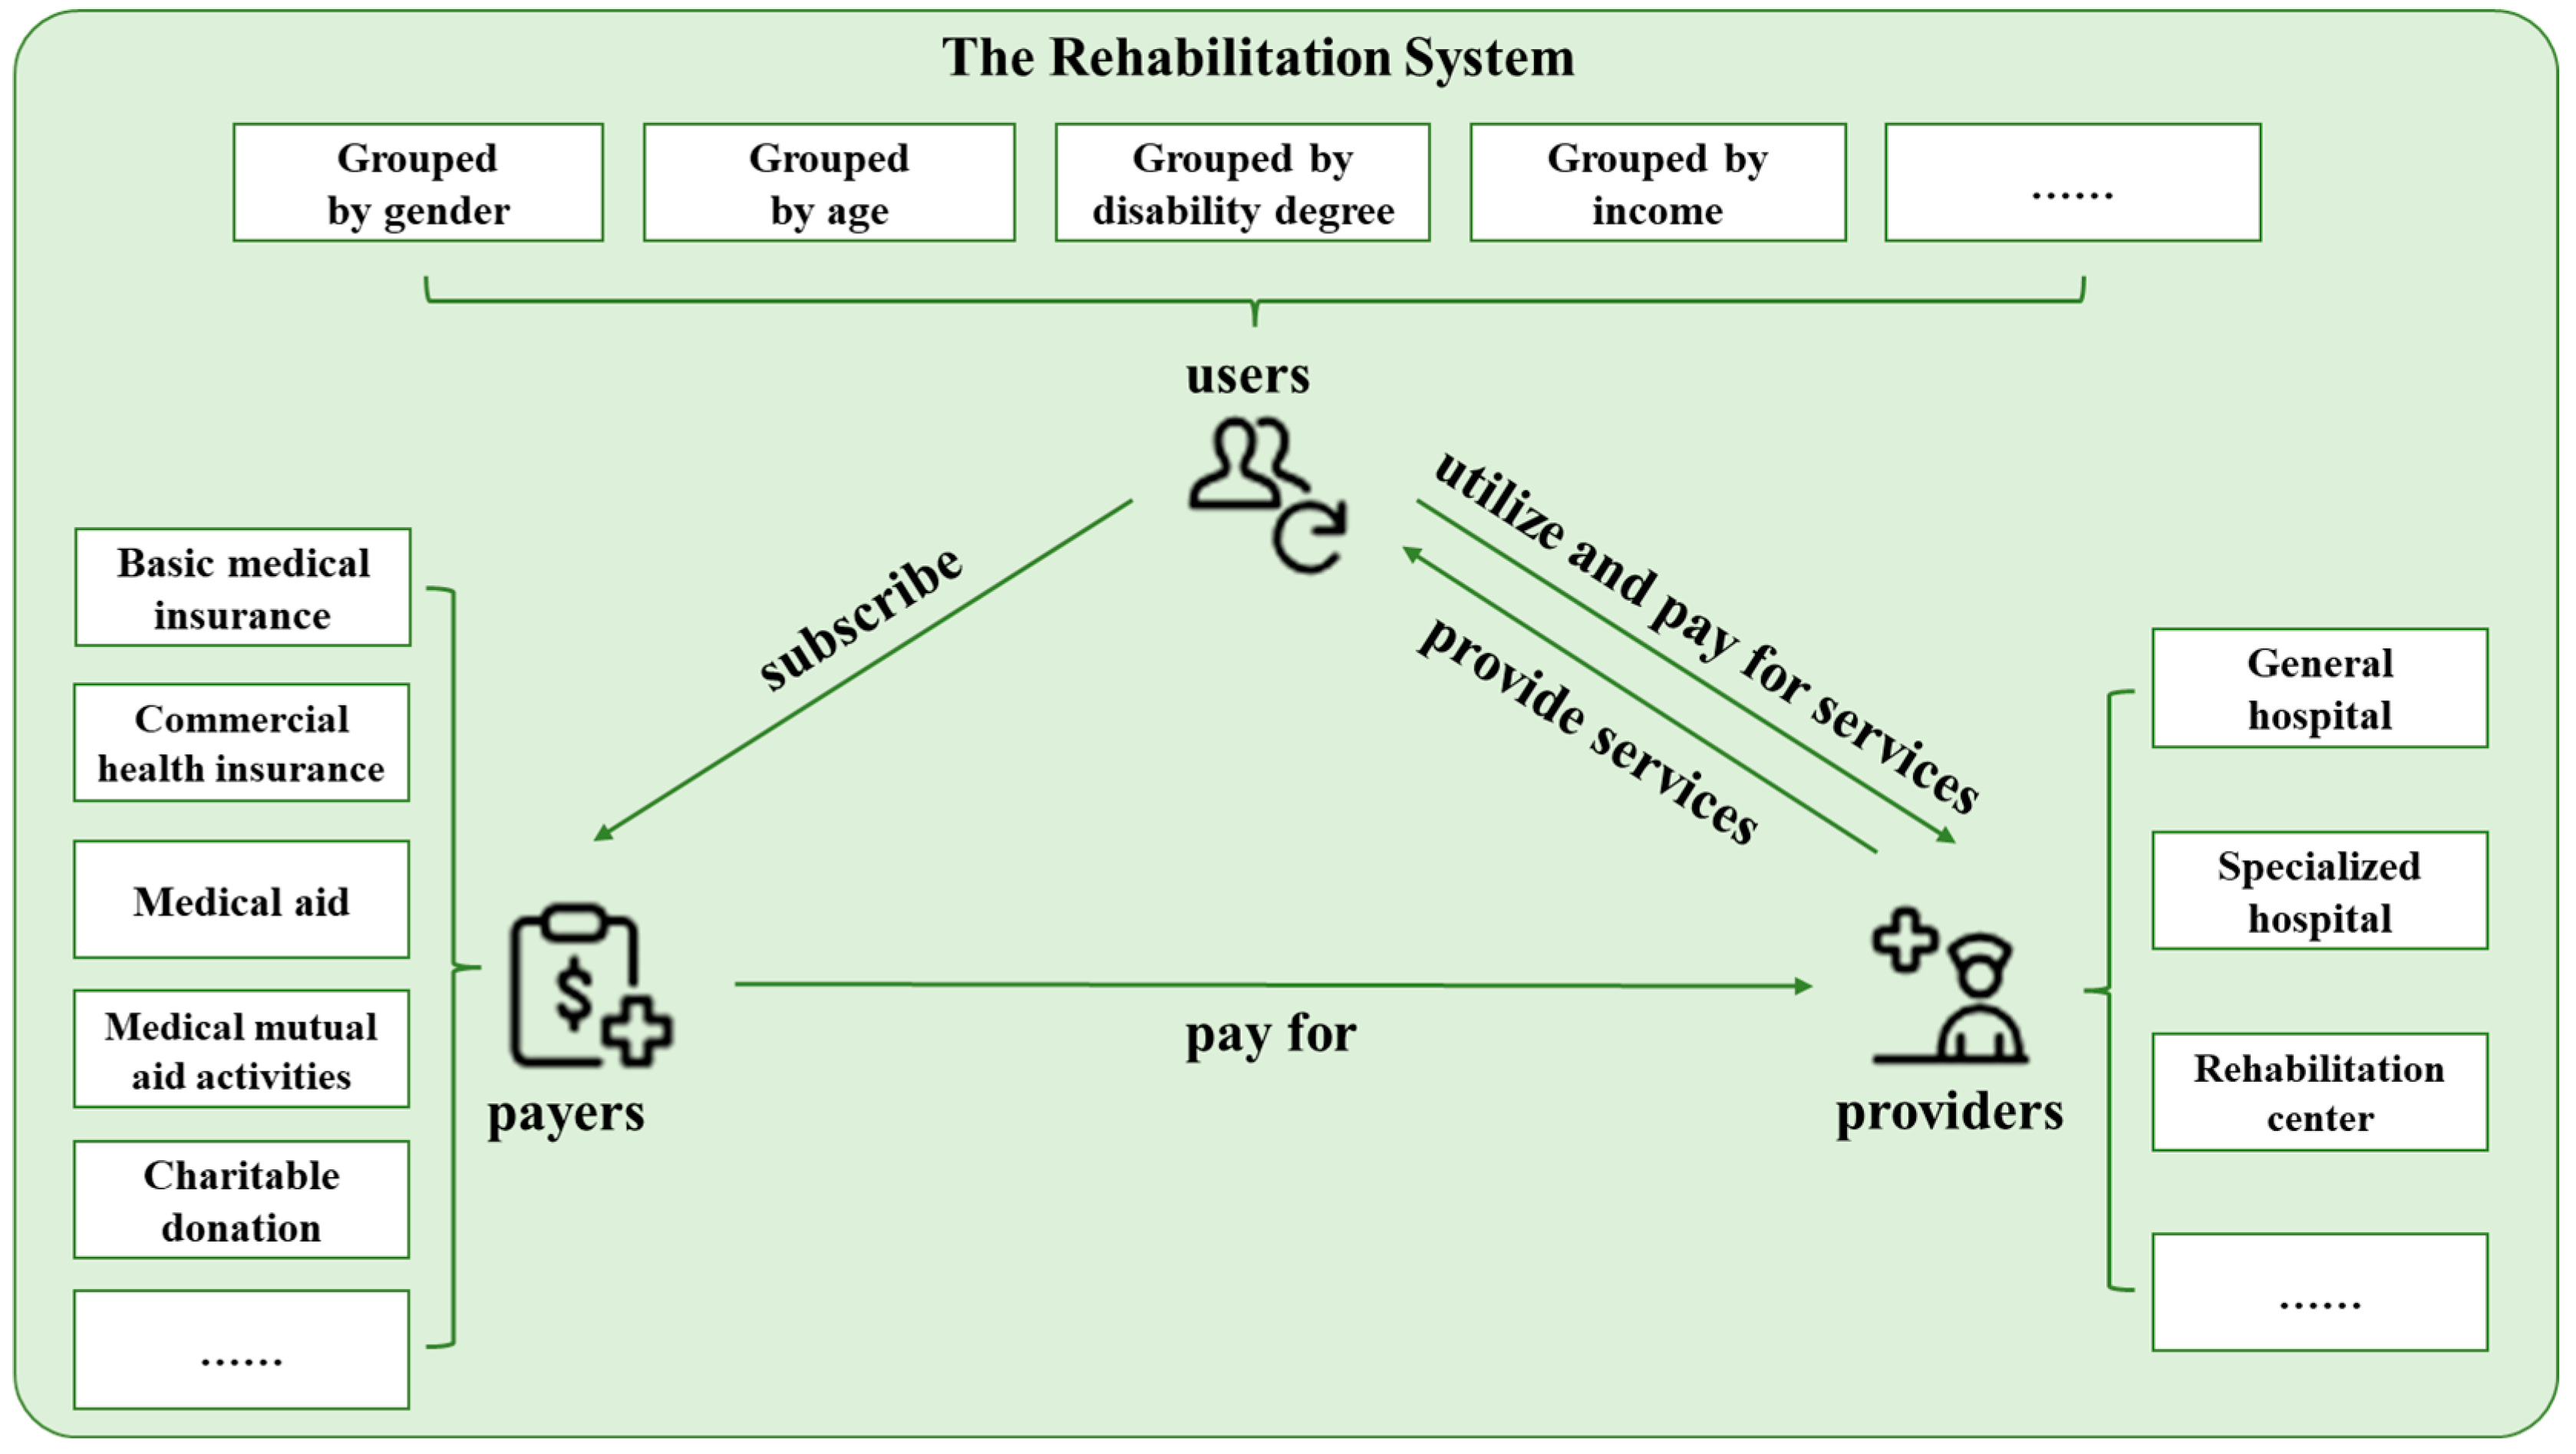
Figure 1. Components and internal relationships of the rehabilitation system.
Systems 13 00812 g001
Figure 2. Observations from 2009 to 2012.
Systems 13 00812 g002
Figure 3. Systemic analytical framework of IRSMI’s influence on rehabilitation service utilization and healthcare expenditure.
Systems 13 00812 g003
Figure 4. Utilization rates of rehabilitation services in the experimental and control groups among older adults with disabilities, 2009–2012.
Systems 13 00812 g004
Figure 5. Mean annual healthcare expenditures for households with older adults with disabilities in the experimental and control groups, 2009–2012.
Systems 13 00812 g005
Figure 6. Parallel trends test of rehabilitation services utilization between treatment and control groups prior to the 2011 implementation of the Rehabilitation Coverage Policy. Note. The dashed horizontal line denotes the counterfactual of no treatment effect relative to the 2010 reference year (coefficient = 0). Point estimates above (below) the line indicate positive (negative) policy effects. Statistical significance is assessed by whether the 95% confidence interval includes zero (i.e., intersects the dashed line).
Systems 13 00812 g006
Figure 7. Parallel trends test of household healthcare expenditure between treatment and control groups prior to the 2011 implementation of the Rehabilitation Coverage Policy. Note. The dashed horizontal line denotes the counterfactual of no treatment effect relative to the 2010 reference year (coefficient = 0). Point estimates above (below) the line indicate positive (negative) policy effects. Statistical significance is assessed by whether the 95% confidence interval includes zero (i.e., intersects the dashed line).
Systems 13 00812 g007
Table 1. Details of variables.
CharacteristicParticipants, n (%)
All
Utilization of Rehabilitation Services
    No41,939 (79.80)
    Yes10,618 (20.20)
Existence of Annual Household Healthcare Expenditure
    No1394 (2.65)
    Yes51,163 (97.35)
Annual Household Healthcare Expenditure (CNY, Yuan) *2831.15 ± 4472.08 (min: 0; max: 29,600)
Treatment
    Not affected3084 (5.87)
    Affected49,473 (94.13)
Post
    Before25,036 (47.64)
    After27,521 (52.36)
Disability Type
    Visual disability10,814 (20.58)
    Hearing disability18,679 (35.54)
    Speech disability520 (0.99)
    Physical disability13,420 (25.53)
    Intellectual disability904 (1.72)
    Mental disability2287 (4.35)
    Multiple disability5933 (11.29)
Disability Degree
    Mild28,250 (53.75)
    Moderate to severe24,307 (46.25)
Gender
    Male24,832 (47.25)
    Female27,725 (52.75)
Age
    60–69 years18,525 (36.49)
    70 years and above32,248 (63.51)
Marital Status
    Without spouse21,239 (40.41)
    With spouse31,318 (59.59)
Education Level
    Attended school26,954 (51.29)
    Otherwise25,603 (48.71)
Annual Per Capita Household Income (CNY, Yuan) *8475.83 ± 8596.57 (min: 0; max: 145,200)
Income Level
    Low level17,499 (33.30)
    Middle level17,536 (33.37)
    High level17,522 (33.34)
Region
    East20,565 (39.13)
    Central14,830 (28.22)
    West17,162 (32.65)
Residence
    Rural37,682 (71.70)
    Urban14,875 (28.30)
* Continuous variable; with results presented as mean and standard deviation (SD).
Table 2. Utilization rates of rehabilitation services for older adults with disabilities in the experimental and control groups, 2009–2012.
GroupUtilization Rate of Rehabilitation Services
for Older Adults with Disabilities (%)
2009201020112012Overall Mean
OverallControl Group12.8118.7913.7727.1718.14
Experimental Group13.6418.4218.8429.3020.05
MaleControl Group14.2518.0410.8326.8117.48
Experimental Group14.4218.3518.3829.3820.13
FemaleControl Group11.6419.3816.2527.5818.71
Experimental Group12.9518.4819.2529.2219.98
Mild DisabilityControl Group12.3819.3014.2924.8417.70
Experimental Group13.7818.5518.8528.3419.88
Moderate-to-Severe DisabilityControl Group13.3218.2113.1730.1118.70
Experimental Group13.4818.2618.8130.4020.24
Younger Age GroupControl Group13.9017.5011.9028.1117.85
Experimental Group15.1118.6918.7829.4320.50
Middle-Aged and Older Age GroupControl Group12.5219.5814.9626.3118.34
Experimental Group12.7918.3718.8829.1619.80
Table 3. Impact of the Rehabilitation Coverage Policy on the likelihood of rehabilitation service utilization among older adults with disabilities in China.
Group.ORS.E.z95% CI
Overall1.349 *0.1852.181.031~1.766
Female1.1830.2270.880.812~1.723
Male1.530 *0.3032.141.037~2.256
Younger Age 1.4160.3731.320.846~3.372
Older Age1.423 *0.2472.031.012~2.000
Mild Disability1.444 *0.2701.971.002~2.083
Moderate-to-Severe Disability1.2410.2531.060.833~1.850
Control VariablesControlled
Individual Fixed EffectsControlled
Time Fixed EffectsControlled
* p < 0.05.
Table 4. Annual healthcare expenditures for households with older adults with disabilities in the experimental and control groups, 2009–2012.
GroupMean Annual Healthcare Expenditures for Households with Older Adults with Disabilities (CNY, Yuan)Overall Growth Rate (%)
2009201020112012Overall Mean
OverallControl Group2635270724913237276822.85
Experimental Group2419264328813318281537.16
Low Income LevelControl Group5268026271190786126.24
Experimental Group1001101011741282111728.07
Middle Income LevelControl Group1813161822802279199825.70
Experimental Group1871213322622560220736.83
High Income LevelControl Group4407475840245238460718.86
Experimental Group4481484352356185518638.03
Table 5. Impact of the Rehabilitation Coverage Policy on annual healthcare expenditures for households with older adults with disabilities.
Estimation Model Model 1Model 2
GroupVariable β S.E.t95% CI β S.E.t95% CI
All t r e a t m e n t _ t i m e i t 0.214 **0.0553.900.106~0.3210.185 **0.0394.720.108~0.261
λ 1.549 **0.4033.840.759~2.339
Low-Income t r e a t m e n t _ t i m e i t 0.1940.1291.51−0.058~0.4460.1410.0861.65−0.026~0.309
λ −1.490 *0.613−2.43−2.691~−0.289
Middle-Income t r e a t m e n t _ t i m e i t −0.0510.115−0.44−0.276~0.1750.1560.0841.85−0.009~0.321
λ −2.1651.365−1.59−4.841~0.510
High-Income t r e a t m e n t _ t i m e i t 0.181 *0.0921.970.001~0.3610.137 *0.0672.040.005~0.270
λ 0.9271.5550.60−2.121~3.974
Control VariablesControlledControlled
Individual Fixed EffectsControlledControlled
Time Fixed EffectsControlledControlled
* p < 0.05, ** p < 0.01.
Table 6. Mediating effect of rehabilitation services utilization in Rehabilitation Coverage Policy and annual healthcare expenditures for households with older adults with disabilities.
Dependent Variable
e x p _ m e d i c i n e i t
Coefficient c
Mediator   Variable   r e h a _ s e r v i c e s i t
Coefficient a
Dependent   Variable   e x p _ m e d i c i n e i t
Upper Coefficient c’, Lower Coefficient b
Variable β S.E.t95% CI β S.E.t95% CI β S.E.t95% CI
Independent Variable
t r e a t m e n t _ t i m e i t
0.214 **0.0553.900.106~
0.321
0.299 *0.1372.180.030~
0.569
0.177 **0.0394.520.100~
0.253
Mediator Variable
r e h a _ s e r v i c e s i t
0.136 **0.01410.010.109~
0.162
Control Variables ControlledControlledControlled
Individual Fixed Effects ControlledControlledControlled
Time Fixed Effects ControlledControlledControlled
* p < 0.05, ** p < 0.01; Coefficient c represents the total effect of X on Y, Coefficient a represents the effect of X on M, Coefficient c’ represents the direct effect of X on Y after controlling for M, and Coefficient b represents the effect of M on Y after controlling for X. Heckman adjustment was not applied to any of the equations.
Disclaimer/Publisher’s Note: The statements, opinions and data contained in all publications are solely those of the individual author(s) and contributor(s) and not of MDPI and/or the editor(s). MDPI and/or the editor(s) disclaim responsibility for any injury to people or property resulting from any ideas, methods, instructions or products referred to in the content.