Article

Does the Optimal Update Strategy Effectively Promote the Low-Carbon Technology Diffusion Among Manufacturers? An Evolutionary Game of Small-World Network Analysis

1
School of Business, Hainan Tropical Ocean University, Sanya 572022, China
2
Institute of Logistics Science and Engineering, Shanghai Maritime University, Shanghai 201306, China
*
Author to whom correspondence should be addressed.
Systems 2025, 13(9), 792; https://doi.org/10.3390/systems13090792
Submission received: 4 August 2025 / Revised: 28 August 2025 / Accepted: 4 September 2025 / Published: 9 September 2025
(This article belongs to the Section Complex Systems and Cybernetics)

Abstract

A complex network topology marked by co-competitive relationships between manufacturing enterprises can meaningfully influence low-carbon technology selection, thereby affecting the low-carbon technology diffusion process. This study develops a small-world network game model based on an optimal update strategy involving the government and manufacturers with co-competitive relationships, and then uses it to assess the evolutionary dynamics of low-carbon technology selection and diffusion among manufacturers. The results indicate that the government should identify the critical threshold for subsidies based on the carbon tax to optimize the regulatory and incentivizing effects of government subsidies. The topological structure of manufacturers’ small-world networks is the key to low-carbon technology selection and diffusion. In favorable conditions, when a small-world network approaches a regular network in terms of structure, the extent of low-carbon technology diffusion is maximized; in unfavorable conditions, diffusion is minimal. Thus, the government can tighten or relax market access restrictions on the manufacturing industry and encourage the development of manufacturing clusters to change the structure of market competition. Compared with the random selection, the optimal update strategy can increase the probability density of low-carbon technology diffusion among manufacturers and rapidly achieve a balanced, stable state.

1. Introduction

As industrialization accelerates, energy consumption rises, which increases carbon emissions and thereby exacerbates global warming. The World Meteorological Organization reported that the global average temperature in 2024 was about 1.55 °C above preindustrial levels, surpassing the 1.5 °C warming limit set by the 2015 Paris Agreement. This trend has not only led to historic high temperatures but also increases in the frequency of extreme weather events, which can have far-reaching effects on human societies and natural ecosystems [1]. Thus, reducing emissions can help mitigate global warming and reduce the frequency and severity of extreme weather events, thus contributing to sustainable development. Against this background, China, which is the world’s largest developing country, announced its “dual-carbon” goal at the 75th United Nations General Assembly, committing to achieving peak carbon emissions by 2030 and carbon neutrality by 2060 [2]. Relatedly, in February 2024, China issued the “Guiding Opinions on Accelerating the Green Development of the Manufacturing Industry”, providing comprehensive, specific guidance for encouraging the green and low-carbon transformation of manufacturing enterprises, and supporting the construction of a modern industrial system and advances new industrialization [3]. It is estimated that over the next 5–10 years, the manufacturing sector will hold the greatest potential for carbon reduction in China. High-energy-consumption manufacturing constitutes over 50% of China’s total energy consumption and nearly 80% of its carbon emissions [4].
With the increasing environmental awareness of consumers, strategies to leverage consumer preferences for low-carbon products to incentivize voluntary emissions reductions by manufacturers are gaining incremental attention [5]. However, among the diverse categories of manufacturing industries, only a limited number—such as automotive and shipbuilding—produce goods with clearly identifiable low-carbon characteristics. In contrast, the majority of manufactured products encountered by ordinary consumers in their daily lives lack prominent low-carbon attributes. From the perspective of the product life cycle, certain manufactured products emphasize energy efficiency and emission reduction as inherent functional attributes, whereas others prioritize the use of low-carbon technologies during the manufacturing process to achieve carbon reduction outcomes. For manufactured products lacking obvious low-carbon characteristics, the absence of carbon labels prevents consumers from distinguishing between those produced using low-carbon technologies and those that are not. Due to the incomplete development of China’s carbon labeling system, even consumers with low-carbon awareness are unable to accurately identify low-carbon products. Considering the above issues, this study focuses on the decision-making behaviors of manufacturers who produce products without obvious low-carbon characteristics.
The continued application and encouragement of low-carbon technologies in manufacturers will remain a strategic priority for China to achieve further carbon reduction as low-carbon technologies continue to advance with policy support. Evolutionary game theory offers a distinct advantage in elucidating complex phenomena such as cooperation, competition, and the formation of social norms, and it has been widely used to study the dynamical evolution of individual strategies in groups. However, evolutionary game theory typically assumes that individuals within a population are either fully interconnected or interact in a completely stochastic manner. This theoretical framework often overlooks the heterogeneity in interpersonal relationships among individuals. In reality, the competitive and cooperative relationships that exist between manufacturers form a complex, dynamic network topology, which influences their selection of low-carbon technology strategies and thus affects the entire low-carbon technology-diffusion process. Therefore, to address these limitations, some studies have employed network structure models to account for individual heterogeneity and have systematically investigated the network structures of these relationships from multiple analytical perspectives [6,7]. With the in-depth study of network structures, scholars have further observed that interpersonal relationships in real-world networks progressively demonstrate Watts-Strogatz (WS) small-world characteristics, particularly manifested in short average path lengths and high clustering coefficients. As a fundamental model in the study of complex networks, it has been extensively used in studies examining decision-making processes within manufacturing enterprises [8]. The selection of low-carbon technologies lays a behavioral foundation for technology diffusion. Low-carbon technology diffusion refers to the evolutionary process by which these technologies are selected and disseminated in the small-world networks formed among enterprises. Selecting low-carbon technologies is a dynamic, complex and long-term process, and the decision-making process is not entirely rational given the constraints imposed by objective conditions. Specifically, manufacturers typically prioritize learning from those with greater influence in their immediate network, and continuously adjust their strategies throughout this process until they identify an optimal strategy [9].
This study seeks to answer several important questions:
  • For those manufacturers who produce products lack of low-carbon characteristics, what impacts do carbon reduction costs, carbon taxes and subsidies have on the adoption of low-carbon technology?
  • How does the topological structure of small-world networks influence the low-carbon technology diffusion among manufacturers?
  • Which primary strategy—that is, random or preferential selection—is best aligned with the mechanisms driving strategic adjustments in manufacturers?
In light of the above, this study investigates the co-evolutionary dynamics between manufacturer behavior and network structure. The primary research contributions are summarized in the following three aspects. (1) Considering the manufactured products lack of low-carbon characteristics, this study investigates how government policy instruments and manufacturer capabilities affect manufacturers’ decision-making in adopting low-carbon technology. (2) Combining complex networks with evolutionary game theory, this study investigates the impact of structural variations in small-world networks on the diffusion dynamics of low-carbon technologies among manufacturers. (3) Considering that manufacturers usually tend to prioritize learning and imitating members with higher influence, this study proposes a priority-based strategy update rule.
The rest of this paper is organized as follows. Section 2 reviews the relevant literature. Section 3 gives an overview of the evolutionary game in small-world networks, including the network structure, game model, and update strategy. Section 4 presents a case study of beer enterprises in China, along with the simulation design and initial parameters. Section 5 provides the simulation results and discussion of small-world networks. Finally, Section 6 summarizes the conclusions and policy implications in addition to pointing out the study’s limitations.

2. Literature Review

2.1. Carbon Taxes and Subsidies

Many countries have implemented carbon pricing mechanisms, such as carbon taxes and carbon trading systems, which encourage low-carbon technology adoption while also defining a strategic direction for developing such technologies. There is still a lack of consensus regarding the efficacy of carbon trading versus carbon taxes. Current discussions of strategies for implementing these mechanisms mainly focus on the national level, underscoring the need to develop industry-specific policies [10]. According to Wittneben [11], a carbon tax may offer a more rapid, cost-effective way to reduce emissions. Krass et al. [12] examined the relationship between carbon tax policies and corporate technology adoption. Xu et al. [13], meanwhile, investigated manufacturers’ production and pricing strategies under carbon trading and carbon tax systems and compared the effects of the two on emissions, corporate profits, and social welfare; they found that neither policy consistently produced higher profits or a marked advantage in reducing carbon emissions. Zhou et al. [14] proposed a new policy with a progressively increasing carbon tax, demonstrating that a tiered structure can balance government revenue and manufacturer burden, thus enhancing policy flexibility. Ahmadi et al. [15] examined the impact of carbon taxes on emissions in British Columbia’s manufacturing sector, showing that such carbon taxes can boost production while cutting emissions. Xia et al. [16] investigated the influence of differentiated carbon tax policies on manufacturers’ strategic decision-making and show that the disparity in carbon tax rates between new and remanufactured products significantly affects the selection of optimal remanufacturing strategies. Collectively, all the above studies demonstrate that the implementation of a carbon tax significantly affects the strategic decisions of manufacturers related to carbon reduction.
A carbon tax is a price control mechanism that sets a fixed price for carbon emissions, improves ease of implementation, and strengthens regulation. Many countries have adopted the carbon tax mechanism. However, China currently operates only a carbon trading mechanism and has no other complementary carbon pricing mandate, such as a carbon tax. In 2021, China launched a national carbon trading market, which expanded for the first time in March 2025 and now covers only four key industries: power generation, steel production, cement manufacturing, and aluminum smelting [17]. Carbon trading establishes a cap on total carbon emissions and enables market mechanisms to determine the price of emissions allowances autonomously. The consolidation process is relatively complex and primarily suited to large state-owned enterprises characterized by high energy consumption and significant carbon emissions [18]. Compared with carbon trading, carbon taxes have lower regulatory costs, are easier to implement and manage, and are more broadly applicable. In China, carbon taxes can serve as a complementary policy instrument to carbon emission rights trading for industries and enterprises not yet participating in the carbon market, thereby ensuring comprehensive coverage of all carbon-emitting entities [19]. Huang et al. [20] compared carbon taxes, carbon trading, and the combined policy of carbon tax and carbon trading, finding that hybrid policies deliver better economic and environmental outcomes than single policies. This study focuses on industries not yet in the carbon market, especially those hard to integrate into its framework. Subsidies are a fiscal tool that mitigates the negative effects of carbon taxes through price controls, serving as a complementary policy. Some studies have factored government subsidies into their studies on manufacturer decision-making. Xu et al. [21], for instance, investigated subsidies for consumers purchasing low-carbon products and carbon taxes on manufacturers of high-carbon goods, and findings showed that combining carbon taxation with subsidies is an effective policy mix for reducing greenhouse gas emissions. Wu et al. [22] compared three policies: a pure carbon tax, a pure low-carbon subsidy, and a hybrid policy that combines both; the findings suggest that the hybrid policy is the most effective in achieving environmental and economic goals.
As consumers’ environmental awareness increases, their purchasing decisions are increasingly influenced by low-carbon preferences. Accordingly, some studies have investigated the decision-making challenges manufacturers face in response to consumers’ low-carbon preferences. Zhang et al. [23], for instance, evaluated the production and input costs associated with low-carbon products to determine the optimal product selection and channel strategies for manufacturers; they found that higher environmental awareness encourages manufacturers to adopt green product strategies. Several studies have incorporated carbon taxes and subsidies into their research. Zhou et al. [24], meanwhile, examined joint pricing strategies for enterprises under carbon tax and low-carbon subsidy policies, aiming to design policies based on environmental objectives, and the finding showed that promoting low-carbon concepts to enhance consumer awareness can strengthen the overall effectiveness of both carbon tax and subsidy policies. Furthermore, He and Sun [25] found that consumers are becoming increasingly environmentally conscious, investigated the impact of carbon taxes on supply chain pricing and carbon emission reduction decisions. Liao and Tan [26] found that consumer preference for low-carbon products is the main factor influencing manufacturers’ decisions on low-carbon practices; they therefore recommended that governments implement targeted carbon tax policies at different stages of industrial development and support these measures through initiatives promoting low-carbon consumption or providing subsidies for low-carbon activities. Most studies assume that low-carbon products and ordinary products are heterogeneous. However, many products manufactured using low-carbon processes are indistinguishable from ordinary products. Without low-carbon labels, consumers cannot identify which products are produced using low-carbon technologies. Given that China has yet to introduce a carbon labeling system, this study departs from the conventional assumption of product heterogeneity between ordinary and low-carbon products. Instead, we consider that ordinary and low-carbon products produced by manufacturers are largely indistinguishable and identify the decision-making challenges manufacturers face under carbon tax and subsidy policies.

2.2. Low-Carbon Technology

Compared with the assumption of complete rationality assumption in classical game theory, the assumption of bounded rationality in evolutionary game theory holds substantial practical relevance. Many studies have used evolutionary game theory to study low-carbon decision-making issues in manufacturers. Hu and Wang [27], for instance, developed an evolutionary game model between the government and manufacturers to examine how consumer preferences influence manufacturers’ decision-making on low-carbon practices; they showed that a bilateral dynamic carbon tax and subsidy policy leads to faster adoption of low-carbon technologies, with consumer preference for low-carbon products significantly shaping manufacturers’ strategy. Zheng et al. [28] explored the evolutionary strategies and interactions between new energy vehicle manufacturers and local governments under both static and dynamic carbon tax frameworks; they showed that a relatively low initial tax rate can effectively encourage new energy vehicle companies to adopt low-carbon production strategies in the early stages of carbon tax implementation. Meanwhile, building upon two-party game models, several studies have developed three-party game models under carbon tax and subsidy mechanisms to examine the equilibrium of behavioral strategies among different participants. Wang et al. [29] established a game model among the government, manufacturers, and retailers to explore the factors that influence each party’s behavior; their findings suggest that substantial subsidies coupled with moderate penalties can effectively incentivize companies to implement low-carbon strategies. Similarly, considering dynamic subsidies and taxes, Liu et al. [30] used a game model to study equilibrium among firms’ low-carbon innovation, government regulation, and public supervision; they indicated that public intervention and oversight can significantly mitigate the risks of governmental misconduct and excessive carbon emissions from enterprises. Furthermore, based on a four-party evolutionary game model, Xu et al. [31] developed a multi-agent framework involving the government, manufacturers, distributors, and consumers to examine strategic interactions in achieving carbon emission reduction goals; the findings show that the government tends to provide incentive-based subsidies to manufacturers to promote low-carbon development in the early stages of technological innovation. The above literature, encompassing two-party, three-party, and four-party game models, consistently employs evolutionary game theory as an analytical framework. However, these studies generally assume homogeneous interactions among individuals, thereby ignoring the potential effects of heterogeneous intra-individual characteristics and behavioral tendencies.
In practice, the competitive and cooperative relationships between manufacturers exist in a complex social system, possessing the topological structure and statistical properties of a complex network. Various network structural characteristics have been employed as carriers to represent the game dynamics among individuals and groups through network topology. The small-world network of manufacturers heavily influences their choice of low-carbon technologies, which affects the diffusion process of these technologies across the industry. Several studies have abstracted intra-diversity and inter-group competitive and cooperative relationships into complex network models, characterizing these relationships as interactions between different nodes. A portion of the existing literature utilizes WS small-world networks as a fundamental framework for conducting research. Based on the Fermi rule, Fan et al. [32] constructed an evolutionary game model in unregulated and regulated conditions; the optimal strategy for government regulation of low-carbon subsidies was examined, along with exploring issues of regulatory efficiency and stability. Similarly, based on the Fermi rule, Liu et al. [33] developed a network game model that integrates three environmental policy mechanisms—cap-and-trade, carbon taxation, and subsidy incentives—and evaluated their impacts across multiple dimensions, including diffusion levels, corporate profitability, consumer surplus, environmental costs, and overall social welfare. Additionally, based on adjacent enterprise learning and the Fermi rule, Lu et al. [34] developed a complex network game model involving the government, energy suppliers, and demand-side enterprises; they found that rising carbon prices call for active government promotion of low-carbon transformation on the supply side to drive demand-side adoption, while falling prices require the supply side to absorb part of the transition costs from the deregulated side and receive additional subsidies to sustain transition momentum. Furthermore, by integrating replicator dynamics with Fermi dynamics, Liu et al. [35] developed a three-layer complex network model involving renewable energy producers, hydrogen producers, and hydrogen users to examine strategic interactions and value co-creation dynamics; they also found that the carbon trading market plays a key role in supporting such collaboration.
Other studies, meanwhile, have employed the Newman–Watts (NW) small-world network. Based on the Fermi rule, Hu et al. [36] developed a complex network game model for electric vehicle manufacturers to examine the short-term and long-term effects of policy interventions on electric vehicle diffusion across networks of different scales; the findings showed that production subsidies from manufacturers have a greater impact on electric vehicle adoption than consumer-targeted purchase subsidies. Similarly, based on the Femi rule, Fan et al. [37] constructed a new-energy vehicle research and development diffusion model considering the emission trading system and studied the effect of consumers’ green preferences and related government policies on the research and development diffusion of new-energy vehicles; the findings reveal that both consumer green preferences and the quota system exert a dual-effect mechanism on the diffusion of research and development. Furthermore, Yang et al. [38], based on the Fermi rule, proposed a dual-regulation framework that combines supply-side and demand-side mechanisms, and simulated how government regulation affects green product diffusion in complex networks; they showed that neither side alone can ensure full diffusion, but together they generate strong complementary effects. The above studies of low-carbon technology diffusion among manufacturers in complex network frameworks have indicated that different government policies and network structures influence manufacturers’ selection of low-carbon technologies. These findings provide a solid theoretical foundation and a key entry point for our study. However, studies of WS and NW small-world networks have rarely examined the effect of network structure. Most existing works have employed the random Fermi strategy update rule, while neglecting the diversity of policy update mechanisms in networked games and their potential for optimization.

2.3. Incremental Contributions

Prior studies have incorporated the topological structure of complex networks into manufacturers’ game processes, providing guidance for low-carbon decision-making. However, there remains room for further exploration. Notably, many studies focus on consumers’ low-carbon preferences without considering that products produced using low-carbon technologies do not differ fundamentally from conventional products, making it difficult for consumers to identify low-carbon products. So, this study focuses on manufactured products that lack distinct low-carbon characteristics but are produced through low-carbon processes. Meanwhile, several studies have used update strategies—including replicator dynamics or Fermi rules, which are typically random—without considering that, in practice, manufacturers often imitate and learn from competitors with similar or stronger capabilities. Therefore, different from traditional random selection update strategies, this study adopts evolutionary game theory on complex networks as its theoretical framework and proposes an update strategy based on optimal selection. In summary, this study investigates the evolutionary dynamics of manufacturers’ adoption and diffusion of low-carbon technologies from two key perspectives: the low-carbon coefficient and variations in network structure. By employing simulation and comparative analysis, the study evaluates how different update strategies influence the evolutionary trajectories of technology adoption and diffusion, thereby elucidating the impact of these strategic rules on the overall process.

3. Network Game Model

The low-carbon technology network game model for manufacturers includes three key components: the network structure, game model, and update strategy. First, the small-world network topological structure is used to characterize the interaction relationships between manufacturers. Second, the game model is established based on research hypotheses to depict the manufacturers’ strategic interactions. Finally, a preferential selection-based update rule is proposed to represent the dynamic strategy adjustment process during the network game.

3.1. Network Structure

Small-world networks are often employed as carriers of complex network structures and are widely used in research on enterprise clusters and networked systems [32,33,34,35,36,37,38]. The WS small-world network is generated from a nearest-neighbor coupled network via “reconnecting edge”, which emulates the characteristics of real-world complex networks, including short average path lengths, high clustering coefficients, exponential degree distributions, and uncertain node connections. The extent of reconnecting edge influences the balance between regularity and randomness in the network structure.
Based on the construction methodology of the WS small-world network model proposed by Watts and Strogatz [39], the procedure is outlined as follows: First, a nearest-neighbor coupled network consisting of N nodes, where each node is connected to its K/2 (K being an even number) nearest neighbors on both sides, is generated. Then, with the probability pw, each edge is randomly rewired to a new target node, ensuring that no self-loops or multiple edges are formed. Here, K represents the degree of connectivity for each node, and   p w denotes the probability of edge reconnection. When p w   =   0 , the network corresponds to a regular nearest-neighbor coupled network; when pw = 1, it becomes a fully random network. By adjusting the value of pw, one can achieve a gradual transition from a regular network to a random network. As   p w increases from 0 to 1, the WS model generates networks that maintain a high clustering coefficient while showing a rapid decrease in the average shortest path length, thereby emulating the key characteristics of real-world networks.
Following the construction rules outlined above and setting the network node degree K = 4, we simulate the generation process of the WS small-world network using MATLAB R2019a, as shown in Figure 1. The WS small-world network model with 20 nodes is presented for probability values pw = 0.1, 0.3, 0.5, 0.7, and 0.9.
The network topological structure formed by the competitive and cooperative relationships between manufacturers is linked to the evolution of their competitive and cooperative dynamics. Low-carbon technology diffusion, which occurs in this network topology, is a macroscopic phenomenon arising from manufacturers’ behavior in choosing low-carbon technologies. Thus, this study extends the two-dimensional game relationship between manufacturers to a multidimensional game at the complex network level. Specifically, it selects WS small-world network models with N = 100 (10 × 10) and N = 400 (20 × 20) nodes as experimental samples to observe the network evolution patterns of low-carbon technology selection and diffusion among manufacturers.

3.2. Game Model

Suppose N manufacturers are present in a certain grid, and the small-world network they form is denoted G = (V, L). Here, V = v 1 , v 2 v N represents the set of manufacturers, and N is the total number of enterprises. L = l 1 , l 2 l M denotes the set of game relationships between pairs of manufacturers, and M is the total number of such relationships [40]. Specifically, l i , j = 1 , i , j N means a game relationship exists between enterprise Vi and Vj, while l i , j = 0 , i , j N   means no such relationship exists. Since the game relationship between manufacturers is mutual, G = (V, L) represents an undirected network graph. Specifically, the edges between network nodes are undirected, and at most one edge is present between any two nodes. The selection of low-carbon technologies by manufacturers is a dynamic, complex, protracted process.
Below, the following section outlines the assumptions and definitions of the relevant model parameters.
Hypothesis 1:
In a specified network region, N manufacturers are engaged in competition. Their products are essentially homogeneous, but the carbon emissions generated during production vary depending on the technology used. Enterprises using original technology have higher emissions, while those adopting low-carbon technologies have lower emissions. The choice of technology influences only the carbon emissions and variable costs of production, not the finished product’s quality or functionality. Manufacturers can achieve technological transformation by choosing low-carbon technologies to improve their competitiveness in the market. Since adopting low-carbon technology increases production costs, we do not consider scenarios where low-carbon technology adoption simultaneously reduces costs.
Hypothesis 2:
A unit product manufactured using low-carbon technology is defined as a low-carbon product, while a unit product produced using original technology is defined as an original product. Suppose the production cost of an original product is denoted by c o , and the production cost of a low-carbon product is denoted by c l . Given that low-carbon production requires added investment, c l > c o > 0 . Next, suppose the carbon emission per unit product is e o , the target carbon emission is e l , and the cost coefficient for carbon reduction is represented by μ 0 μ 1 . Then, the production cost of a low-carbon product can be expressed as c l = c o + μ e o e l .
Hypothesis 3:
Suppose the government levies a carbon tax T on manufacturers that make products using original technologies. The carbon tax T is calculated as the product of the carbon tax rate τ and the carbon emissions per unit product; that is,  T = τ e o . In addition, the government provides subsidies S to enterprises that adopt low-carbon technologies for production. Given the constraints of the government’s fiscal budget, the subsidy amount should be rationally allocated based on carbon tax revenues. Specifically, based on the research of Chen and Hu [41] the subsidy S is defined as S = δ T , where δ 0 δ 1  represents the government subsidy coefficient.
Hypothesis 4:
Suppose the manufactured products made by manufacturers using low-carbon technologies do not exhibit distinct low-carbon characteristics. In other words, the low-carbon products and ordinary products produced by these enterprises are essentially the same, and both product types are sold at the same price  p b . It is assumed that the market demand for both ordinary products and low-carbon products is Q. The profit function for manufacturers producing ordinary products is π o = p b c o Q , and that for producing low-carbon products is π l = p b c l Q .
The parameter symbols involved in the above assumptions are detailed in Table 1.
Based on the above game assumptions, we construct the payoff matrix of manufacturers, as detailed in Table 2.
Based on the analysis of the above payoff matrix, the payoff function U i for a manufacturer choosing low-carbon technology can be expressed as follows:
U i = M i U M j     T M i ,
where M i denotes the game strategy vector of the manufacturer Vi. Specifically, the strategy vector 1 ,   0 represents choosing low-carbon technology, while 0 ,   1 represents choosing ordinary technology. M j     T indicates the transpose of the game strategy vector for the neighboring manufacturer Vj. The matrix U represents the payoff matrix for the game involving manufacturer Vi.
By embedding the above game matrix in small-world network structure, we can derive the total payoff function U i t   ( i = 1 , 2 . N ) for manufacturer Vi choosing low-carbon technology at evolutionary time step t in the small-world network as follows:
U i t = M i t U M j t T = j Ω i M i t π i l + δ T π i l + δ T π i o T π i o T M j t   T = j Ω i M i t p b c o 1 + μ Q + δ T p b c o 1 + μ Q + δ T p b c o Q T p b c o Q T M j t   T ,
where Ω i denotes the set of game neighbors connected to manufacturer Vi in the small-world network. At evolutionary time step t, manufacturer Vi engages in games with all connected manufacturers Vj. M i t is the strategy vector of manufacturer Vi, while M j t T denotes the transpose of the strategy vector of manufacturer Vj, which is connected to and plays games with manufacturer Vi in the same round. The matrix U also denotes the payoff matrix for the game involving manufacturer Vi.

3.3. Update Strategy

Suppose N manufacturers exist in a specified network region, and the number of enterprises choosing low-carbon technology production is n. The proportion P   =   n / N represents the ratio of manufacturers adopting low-carbon technology to the total number of enterprises in the small-world network. This proportion also reflects the probability density of low-carbon technology adoption and diffusion among manufacturers in the small-world network. P t denotes the probability density of low-carbon technology diffusion among manufacturers at evolutionary time step t, while P 0 represents the initial probability density of low-carbon technology diffusion at the initial evolutionary time step (t = 0). The duration of the evolutionary time step t reflects the speed and trajectory by which the economic system reaches equilibrium, and it is primarily used to describe the time interval for strategy adjustments made by economic agents during the evolution process.
Amid complex socioeconomic and environmental issues, individuals usually exhibit bounded rationality. This behavior implies that participants cannot immediately pinpoint the optimal strategy but instead engage in continuous imitation and learning to gradually converge on the best one. Strategy updating is the process where an individual Vi in the game randomly selects a neighbor Vj for a payoff comparison. If the payoff U j of neighbor Vj exceeds the payoff U i of individual Vi, then individual Vi will adopt the strategy of individual Vj with probability p in the next round of the game [35]. In complex networks, all individuals adopt a uniform update strategy, where each strategy update depends only on the result of the previous game. In practice, when selecting imitation targets, game participants tend to prioritize comparisons with neighboring individuals who have greater influence. Therefore, this study proposes an update strategy for manufacturers based on selective imitation, integrating the rules of imitating the best and replicator dynamics. The first step of the selective optimization update strategy is to leverage the influence of game neighbors as the basis for selecting an imitation target. When manufacturer Vi updates its game strategy, it will, based on the probability p i j of the influence of game neighbors (the degree value of network nodes), prioritize choosing a certain game neighbor Vj with greater influence than itself from its game neighbor set.
p i j = k j j Ω i k j
In the second step, manufacturer Vi will adopt the strategy of game neighbor Vj for the next evolutionary time step t   +   1 based on the probability derived from the difference in total game earnings between them at the evolutionary time step t . Namely, if the function payoff U j of game neighbor Vj exceeds its own function payoff U i (i.e., U j > U i ), then manufacturer Vi will imitate the strategy of game neighbor Vj with a probability p M i M j in the next evolutionary time step t = t + 1 .
p M i M j = U j U i D · m a x k i , k j
Here, M i and M j denote the game strategies of manufacturers Vi and Vj, respectively, while U i and U j represent their respective game payoffs. max k i , k j indicates the larger degree value between manufacturers Vi and Vj. D denotes the difference between the maximum and minimum payoffs in the game payoff matrix, ensuring the probability p M i M j remains within the range of 0 1 . Compared with the traditional Fermi rule, the selective preference update strategy more accurately captures the strategy adjustments of game individuals during network evolution. It not only reflects that manufacturers in small-world networks prioritize neighboring enterprises with greater influence when making technological choices but also highlights the inherent uncertainty in the technology selection process.

4. Parameters and Simulation

4.1. Parameters Setting

Based on China’s National Economic Industry Classification (GB/T 4754-2017) [42], the food industry is divided into three major categories: agricultural and sideline product processing; food manufacturing; and alcoholic beverage, nonalcoholic beverage, and refined tea production. The consumption patterns in the food manufacturing industry constitute a multi-dimensional and integrated system that spans the entire production chain, from raw material procurement to the final product leaving the factory. Coal remains the primary energy source for these industries, with electricity and diesel fuel serving as secondary energy inputs [43].
Carbon footprint is an indicator that quantifies total emissions of carbon dioxide and other greenhouse gases from the direct or indirect activities of individuals, organizations, products, or nations over a specific time period. It is typically expressed in carbon dioxide equivalents (CO2e). A product’s carbon footprint is typically calculated using the Life Cycle Assessment (LCA) method [44], which quantifies and evaluates total greenhouse gas (GHG) emissions across the product’s entire life cycle. For fast-moving consumer goods industries, such as the beverage sector, carbon footprint accounting based on LCA serves not only as an essential tool for complying with regulatory requirements and market demands, but also as a key driver for advancing the green transformation of the entire supply chain and fostering sustainable development. The carbon footprint data of the beverage industry from CO2 Everything [45] is shown in Table 3, indicating that producing a 335-milliliter beer generates 250 g of CO2, equivalent to driving a gasoline-powered vehicle for 1.3 km. It is important to note that carbon footprint is influenced by numerous dynamic factors, and the carbon footprint of any individual product may vary, and the figures provided are approximations rather than exact values.
As a trillion-dollar consumer industry, the beer industry’s transition to low-carbon practices has consistently attracted significant public attention. After China proposed the “dual carbon” targets in 2020, the beer industry was identified as a key sector for carbon emission control within the industrial sector. In 2021, the “Guidelines for the Development of China’s Wine Industry during the 14th Five-Year Plan Period” highlighted the need for the beer industry to fully transition toward green and sustainable development. For the first time, the concepts of “zero-carbon production areas” and “zero-carbon factories” were introduced as key construction goals. In 2023, China issued the “Opinions on Accelerating the Establishment of a Product Carbon Footprint Management System”, encouraging leading enterprises to develop robust carbon footprint management frameworks. The initiative aims to promote full life-cycle carbon accounting in the beer industry, from raw material cultivation to production, packaging, and transportation. In 2025, the (GB/T 32151.25-2024) [46] provides a complete accounting framework for beer manufacturing enterprises and covers five key emission categories: fossil fuel combustion, process emissions, wastewater treatment, purchased electricity, and thermal energy. The standard requires enterprises to establish a greenhouse gas data quality management system, apply tiered management to emission sources, and develop quality control plans.
Using carbon dioxide purification technology in beer production not only reduces coal, water, and steam consumption but also shortens the fermentation cycle. If low-carbon technologies were widely adopted across the entire beer industry, nearly one-third of energy consumption could be saved [47]. Unlike other products with distinct low-carbon attributes, products manufactured using low-carbon and non-low-carbon production processes in the food manufacturing sector, including those of the beer industry, are indistinguishable. Therefore, although we take the beer industry as a case study, the results can theoretically be applied to other manufacturing sectors where the final manufactured products do not have clear low-carbon characteristics. Currently, the beer industry lacks a unified mandatory standard for carbon emission values, resulting in significant variations in carbon footprint assessments among enterprises based on product life cycle accounting. In this study, 8.0 °P 500 mL glass bottles of Pure-Snow beer were used as the unit product for analysis. The initial parameter settings are shown in Table 4.

4.2. Simulation Design

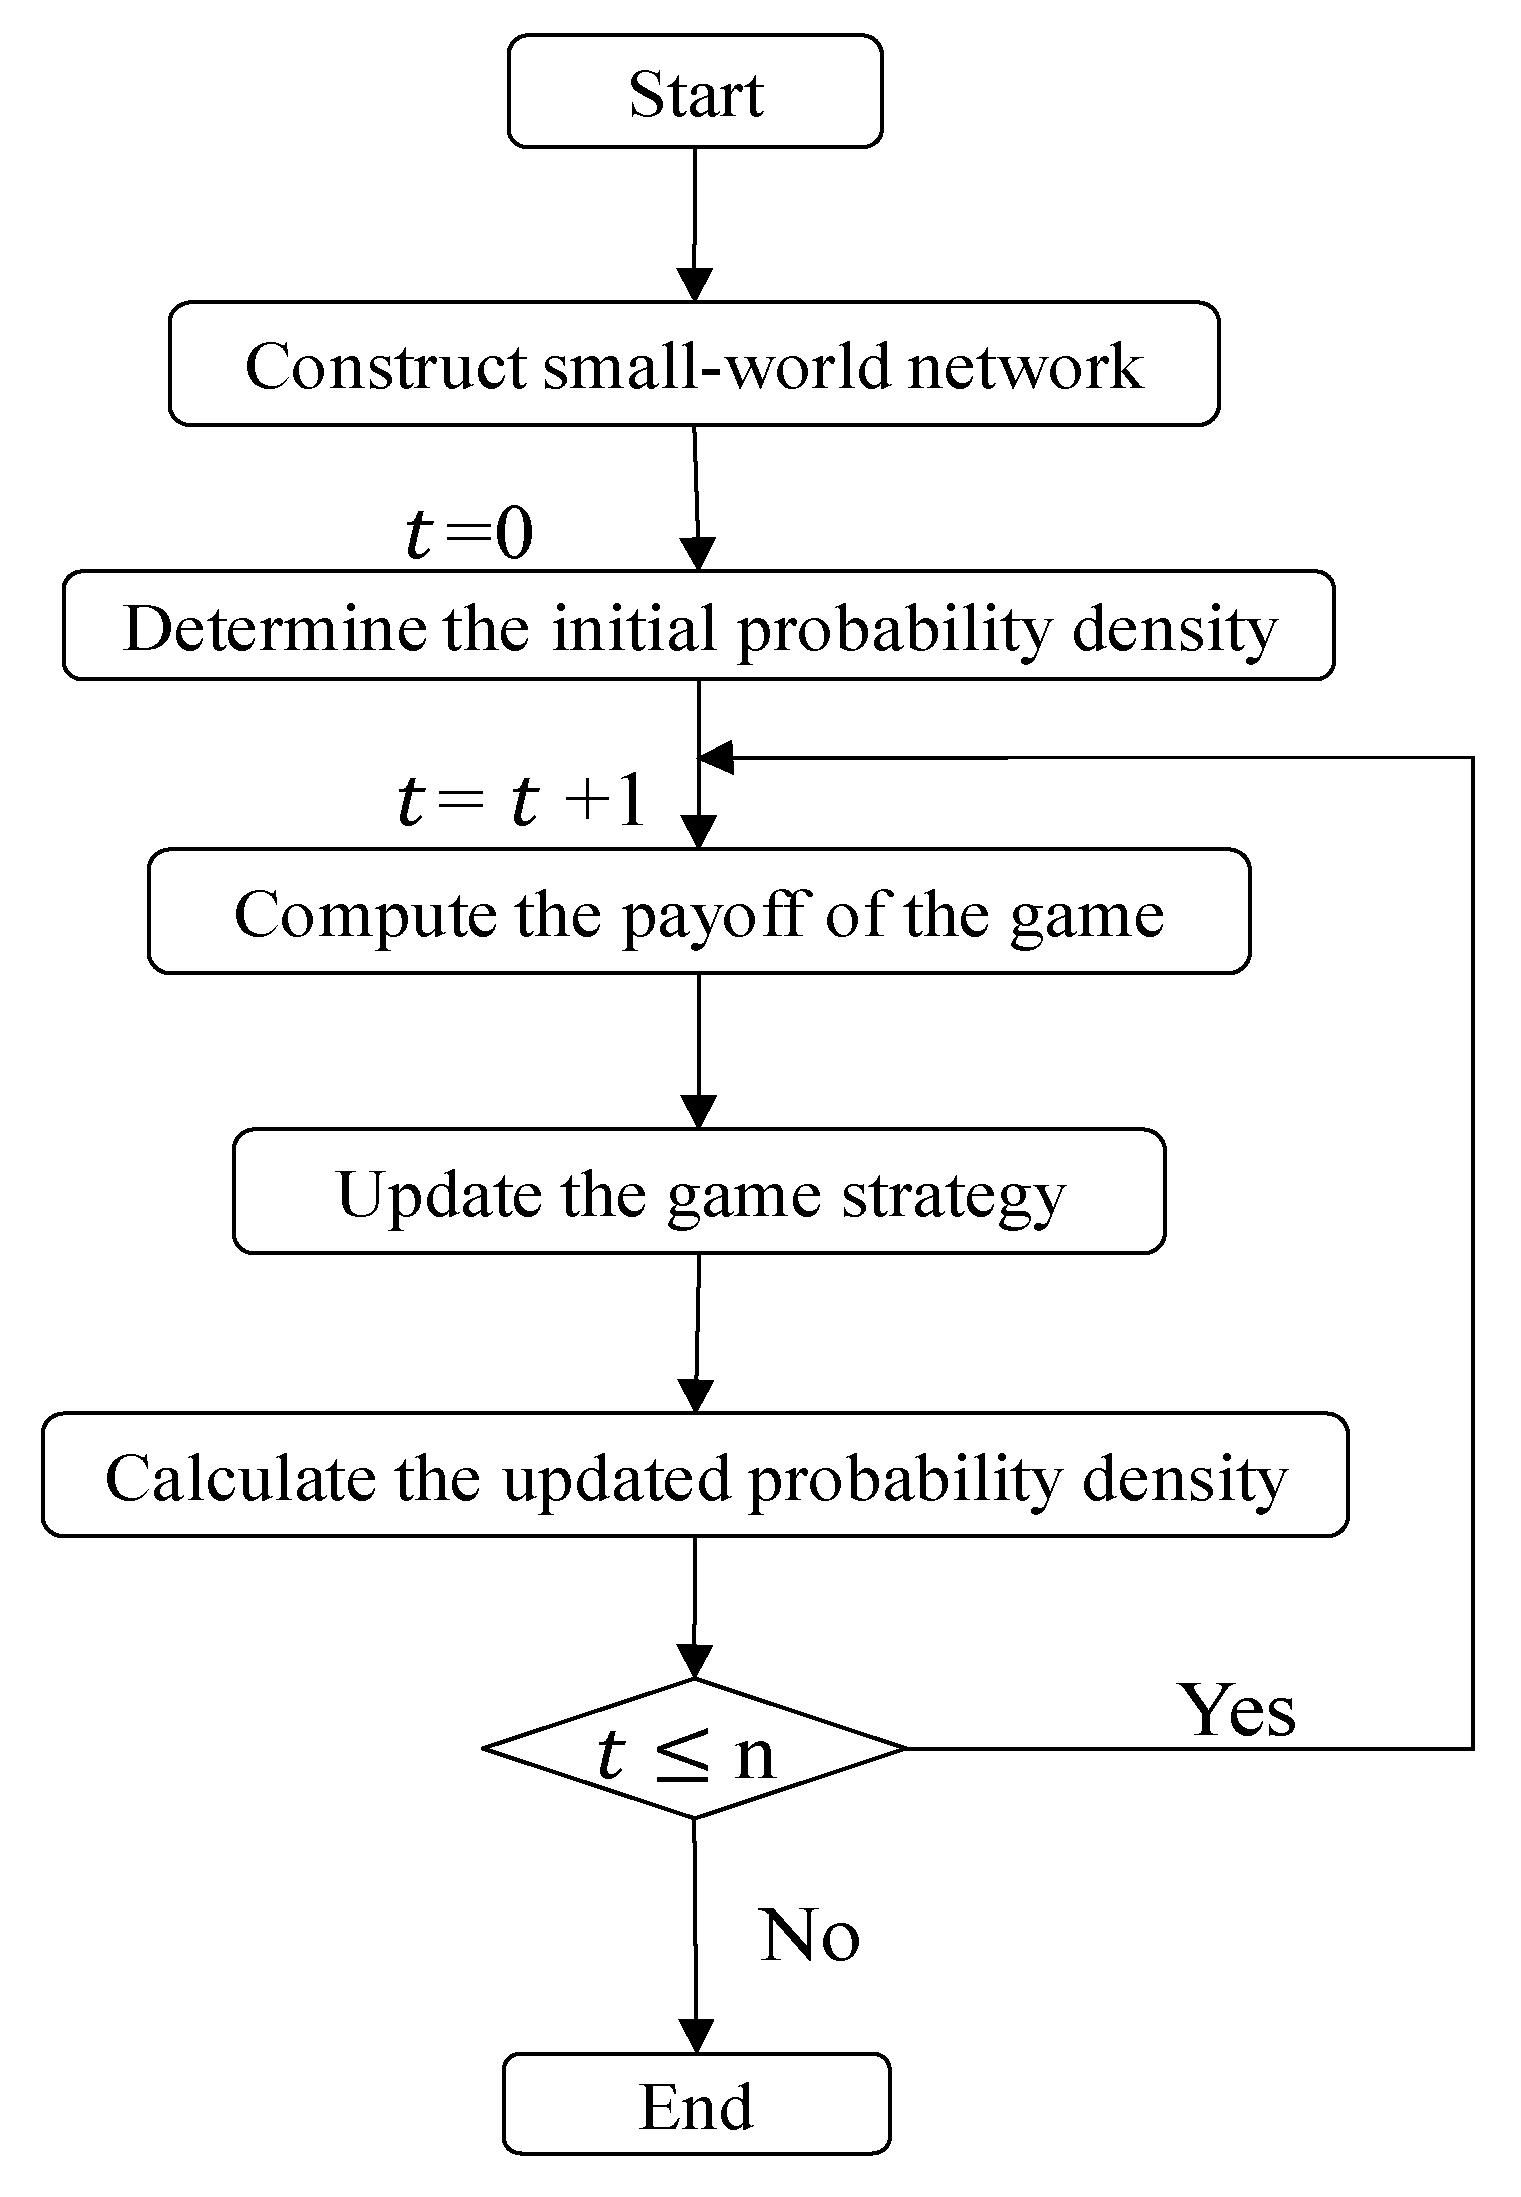
Based on the network game and strategy update rules outlined above, this study conducts simulation experiments on the game model with the initial parameters using MATLAB through the steps below. Note that the results of complex network games show some degree of randomness, leading to the low repeatability of any one experimental outcome under identical parameter conditions. Therefore, the simulation results presented here are based on the average values obtained from 100 repeated experiments performed with the same parameter settings. Theoretically, these simulation results can be applied to various industries where manufactured products do not possess distinct low-carbon characteristics, particularly evident in the food manufacturing industry.
(1)
Small-world networks construction: Based on the WS small-world construction algorithm described in Section 3.1 and following the parameter settings of Liu et al. [35], WS small-world network models with N = 100 (10 × 10) and N = 400 (20 × 20) are constructed using node-networked degree K = 4 and edge reconnection probability p w   =   0.3 .
(2)
Determination of the initial probability density: The time horizon for the network evolutionary game is defined from t   =   0   to t   =   50 . At t   =   0 (i.e., in the first round of the game), the initial probability density of manufacturers adopting low-carbon technology is set to P 0 = 0.3 , and initial strategy for each manufacturer Vi in the small-world network is then randomly assigned based on this initial probability density. It is important to note that the initial probability density only determines the starting point of the evolutionary process and has no influence on the subsequent trajectory or outcome.
(3)
Calculation of game payoffs: For each time step t = t + 1 , the payoffs for each manufacturer Vi in the small-world network are figured using the payoff matrix established in the network game model in Section 3.2.
(4)
Game strategies update: Based on the update rule outlined in Section 3.3, each manufacturer Vi in the small-world network compares its payoff with that of a neighboring enterprise Vj with a higher degree and then updates its strategies simultaneously based on the comparison results.
(5)
Recalculation of the probability density after the update: After one round of the game, the updated strategies of each manufacturer Vi are recorded, and the probability density   P t of manufacturers choosing low-carbon technology at time t is recalculated.
(6)
Iterative process: Steps 3–5 are repeated until the predefined game evolution time step   t   =   n   is reached, at which point the simulation experiment ends.
The simulation design process is shown in Figure 2.

5. Results and Discussion

5.1. Variations in Critical Coefficients

5.1.1. Variations in Low-Carbon Correlation Coefficient

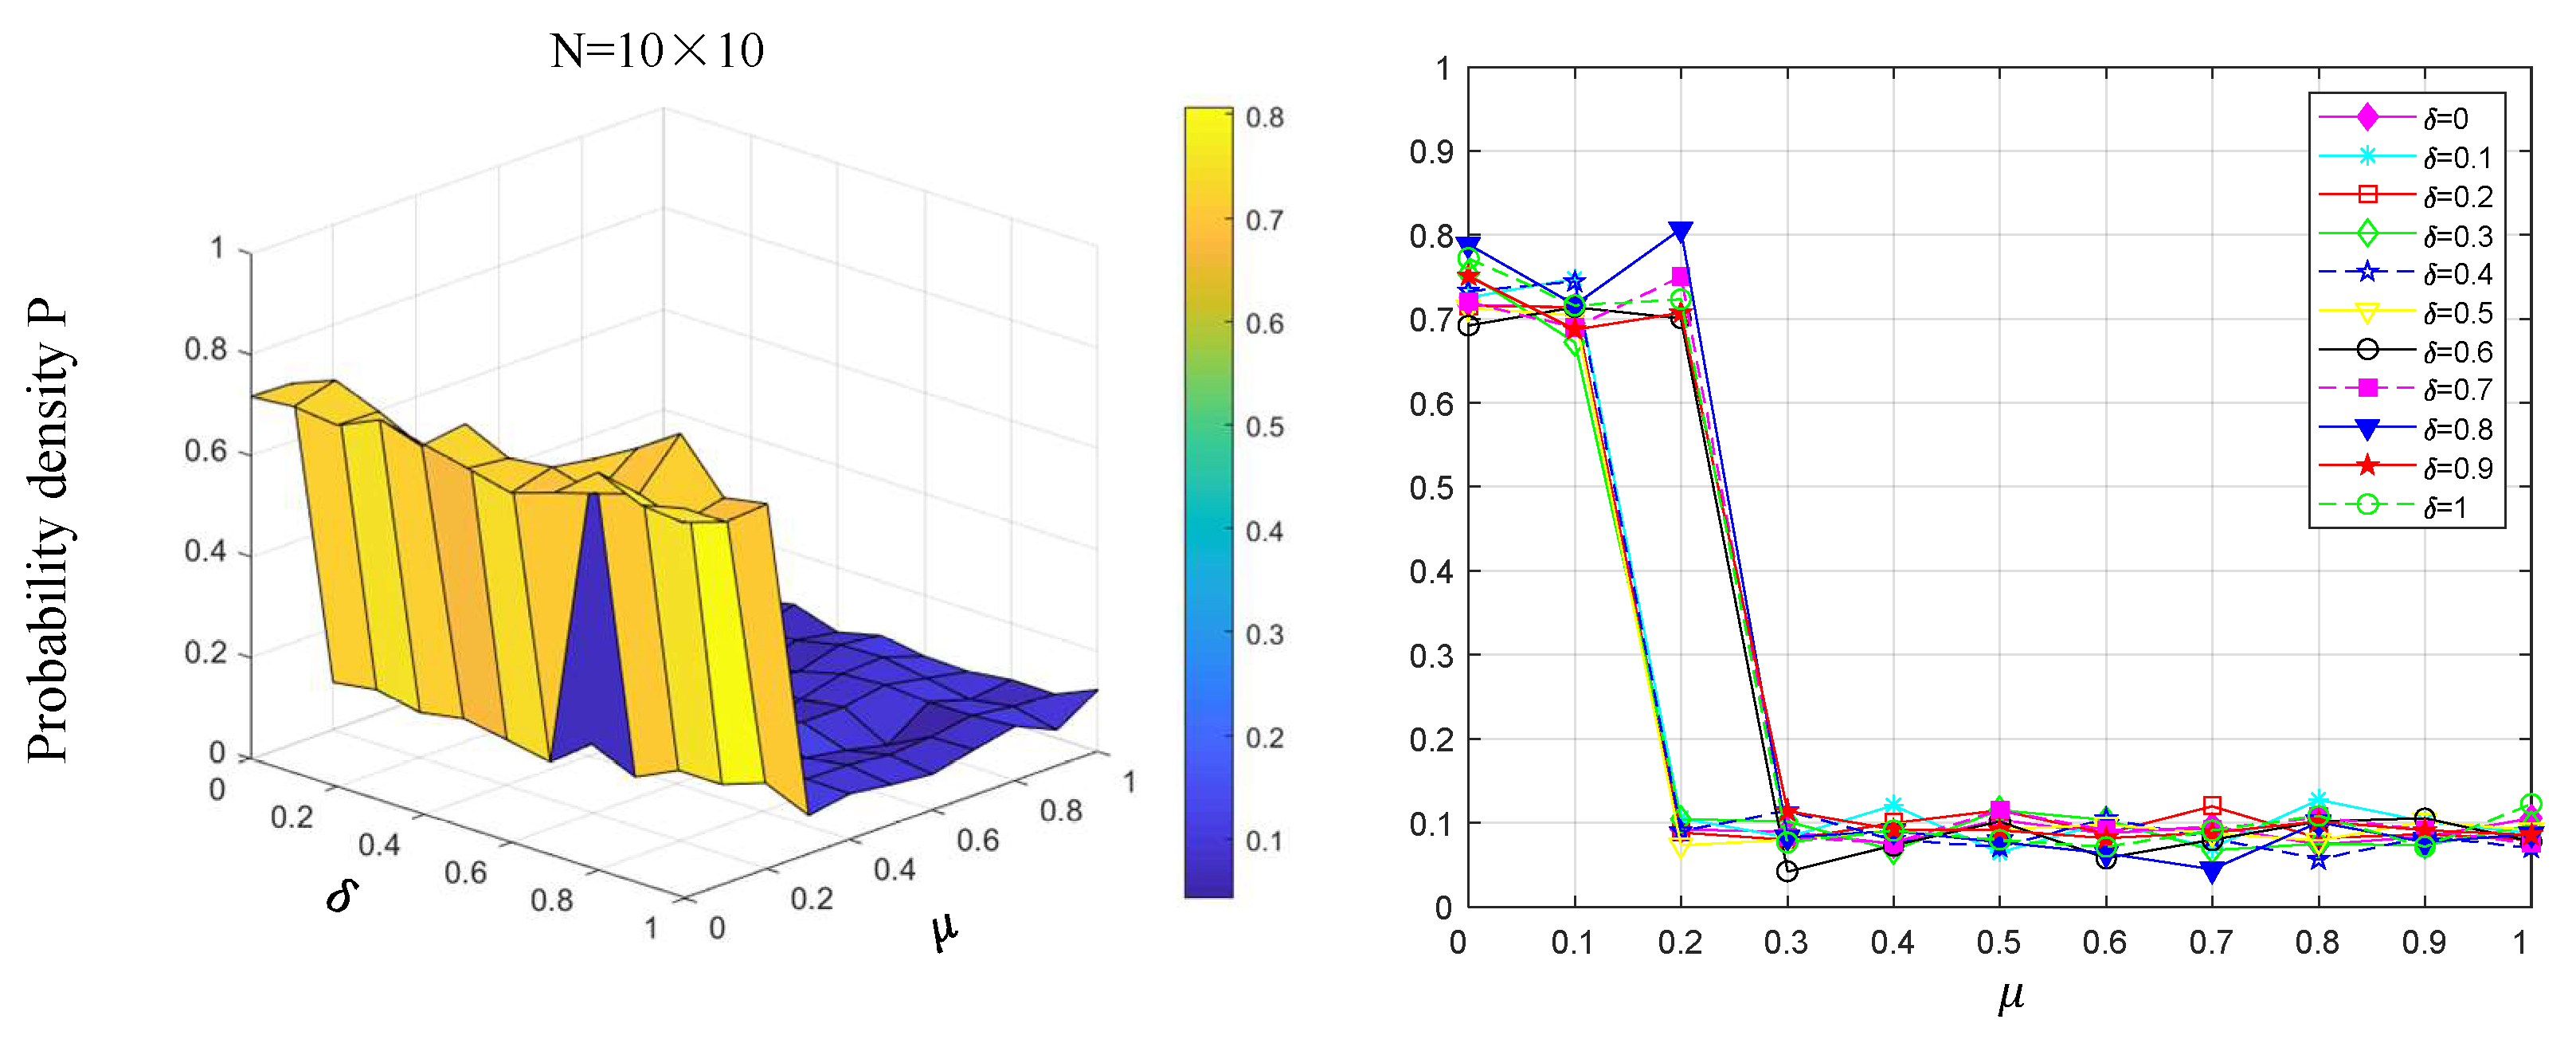
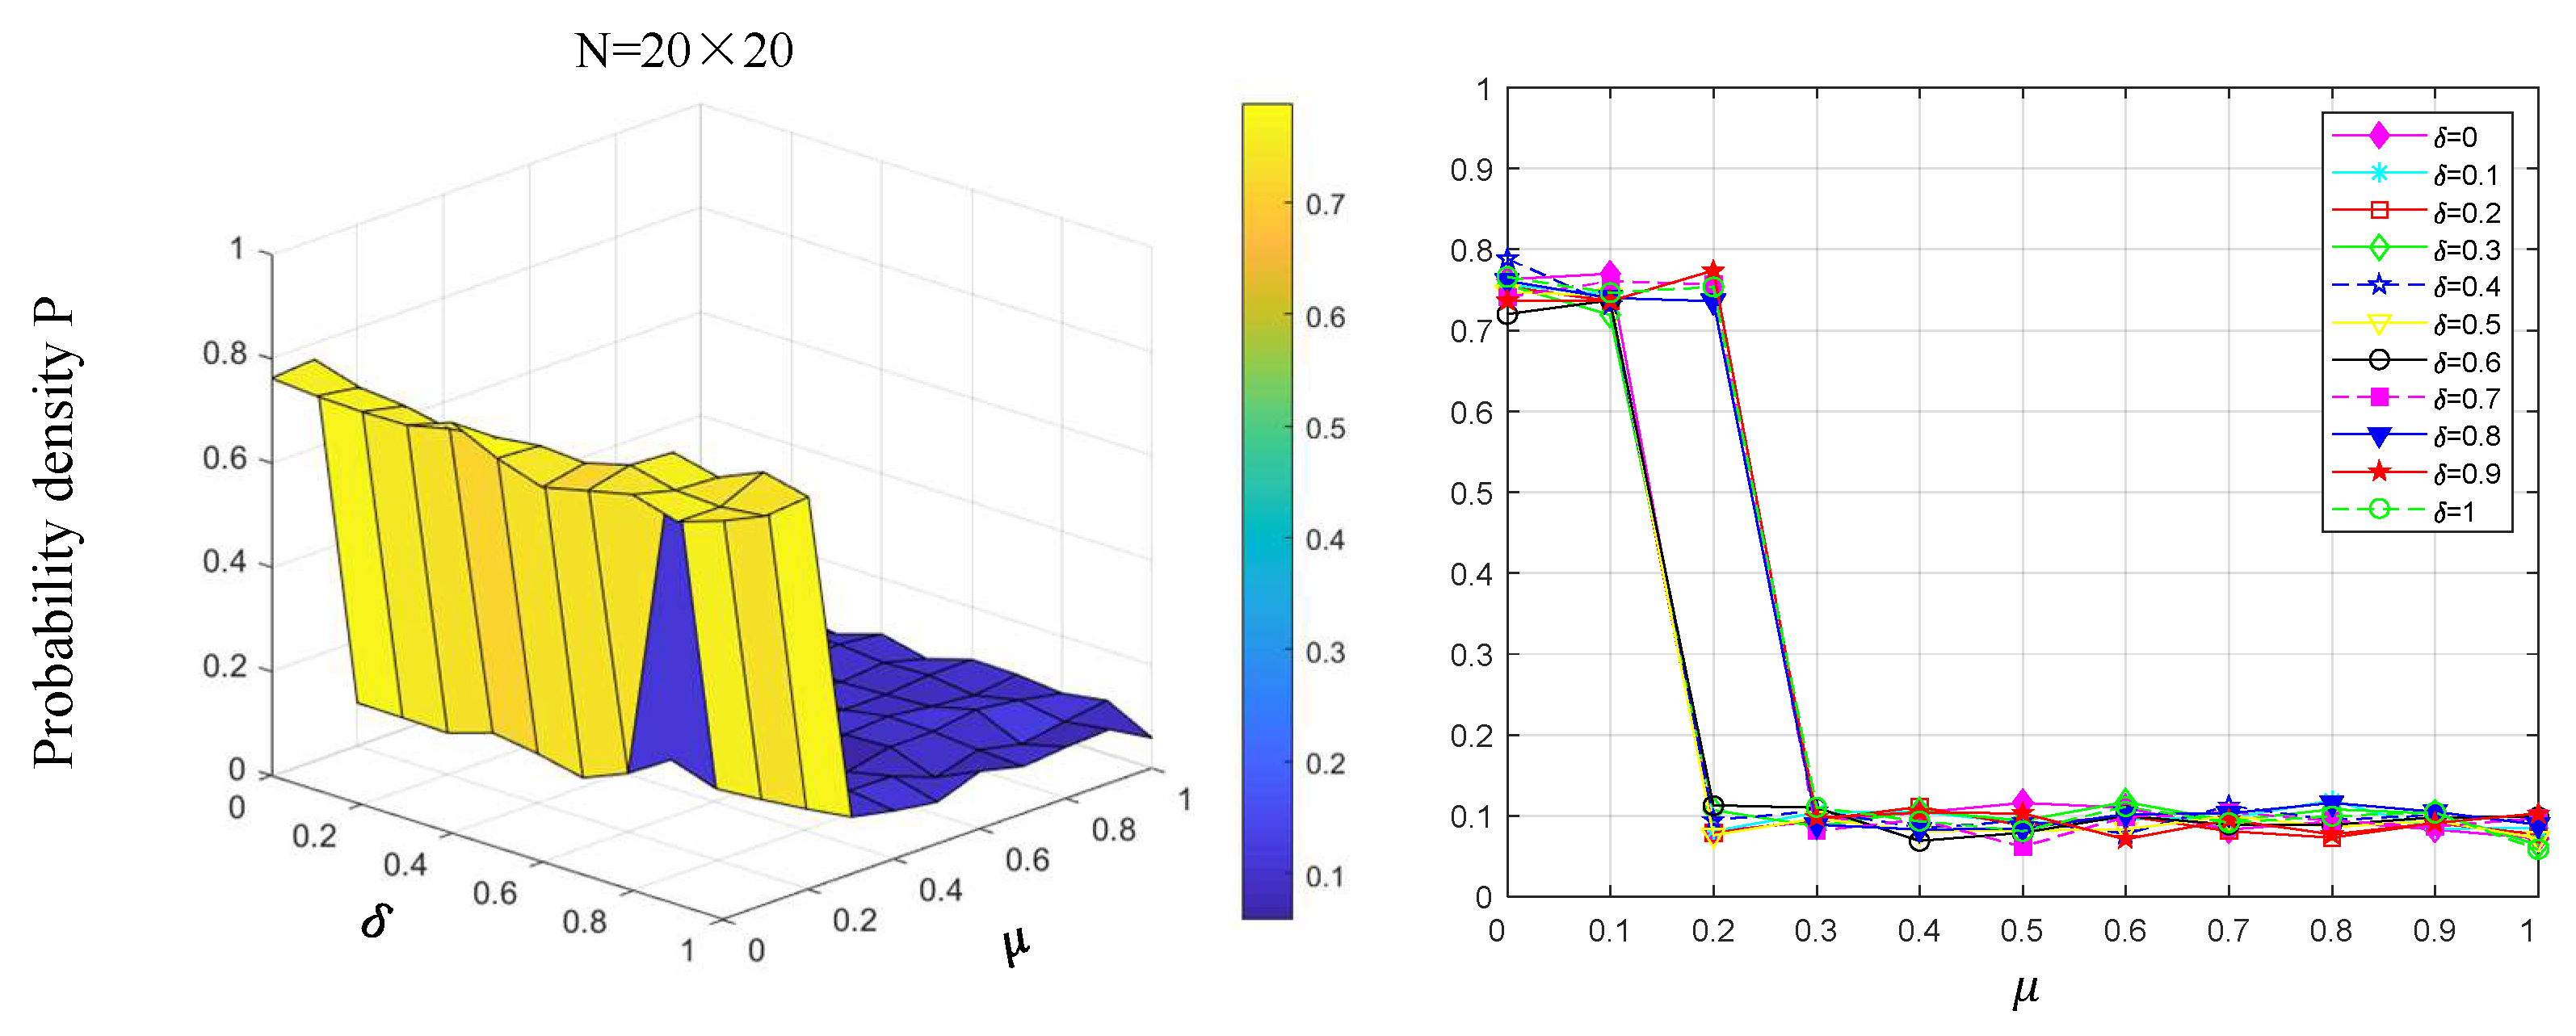
To identify the operational mechanism by which variations in the low-carbon correlation coefficient influence low-carbon technology selection and diffusion among manufacturers, we keep the initial parameters unchanged but set the carbon reduction cost coefficient μ 0 : 0.1 : 1 as the government subsidy coefficient δ 0 : 0.1 : 1 . The aim is to evaluate the impact of variations in these coefficients on the probability density of low-carbon technology selection and diffusion among manufacturers in the small-world network.
As shown in Figure 3, when the number of manufacturers in the small-world network is N = 100, the following observations can be made. When the carbon reduction cost coefficient μ 0 ,   0.1 , regardless of the government subsidy coefficient δ δ 0 ,   1 , the probability density of low-carbon technology diffusion among manufacturers is consistently in the interval of 0.7–0.8. When μ   =   0.2 , if δ 0.6 ,   1.0 , the probability density of low-carbon technology diffusion is also in the interval of 0.7–0.8. However, if δ 0 ,   0.5 , the probability density of low-carbon technology diffusion fluctuates around 0.1. When μ 0.3 ,   1.0 , regardless of the value of government subsidy coefficient, the probability density of low-carbon technology diffusion in the small-world network remains at a low level, fluctuating slightly around 0.1.
As shown in Figure 4, when the number of manufacturers in the small-world network is N = 400, the results are qualitatively similar to those obtained for N = 100 in Figure 3. Similarly, when μ = 0.2, the probability density of low-carbon technology diffusion among manufacturers in the small-world network exhibits a marked shift, reflecting a notable response to the variations in the carbon reduction cost coefficient. However, a critical difference arises: compared to the scenario with N = 100, when N = 400, the probability density of low-carbon technology diffusion exhibits a slight decline. This suggests that, to some extent, an increase in the number of manufacturers in the small-world network hinders the diffusion of low-carbon technologies among them. In contrast, the probability density associated with the selection and diffusion of low-carbon technologies exhibits a tendency to stabilize, which is consistent with the research results of Hu et al. [36].

5.1.2. Variations in Government Subsidy Coefficient

The above simulation results show that when the carbon reduction cost coefficient   μ   =   0.2 , the probability density of low-carbon technology diffusion among manufacturers in the small-world network changes significantly. Therefore, and while keeping other parameters constant, when μ = 0.2, we set δ 0 : 0.1 : 1 to examine the impact of variations in the government subsidy coefficient on the probability density of low-carbon technology selection and diffusion in the small-world network.
As shown in Figure 5, when the government subsidy coefficient δ 0 ,   0.6 , the probability density of low-carbon technology diffusion among manufacturers converges to approximately 0.1. Conversely, when 0.7 ,   1 , the probability density of low-carbon technology diffusion increases to the range of 0.7–0.8. These results further corroborate the above simulation results and indicate that, in a given carbon tax framework, increasing subsidies can significantly increase the probability density of low-carbon technology diffusion. Note, however, that beyond a certain threshold, additional subsidies have diminishing returns and no longer influence low-carbon technology diffusion. As demonstrated in the research of Hu and Wang [27], government subsidies can effectively promote the diffusion of low-carbon technologies. However, excessively high subsidy levels may undermine their incentive effect. The research of Xu et al. [31] also demonstrated that government subsidies can facilitate the diffusion of low-carbon technology, although their marginal benefits tend to decline gradually over time. Moreover, consistent with previous simulations, as the scale of manufacturers’ small-world network increases, the probability density of low-carbon technology diffusion becomes more stable. This result suggests that larger networks produce more homogeneous low-carbon behavior decisions in enterprises, thereby reducing the likelihood of random fluctuations.

5.1.3. Variations in Carbon Reduction Cost Coefficient

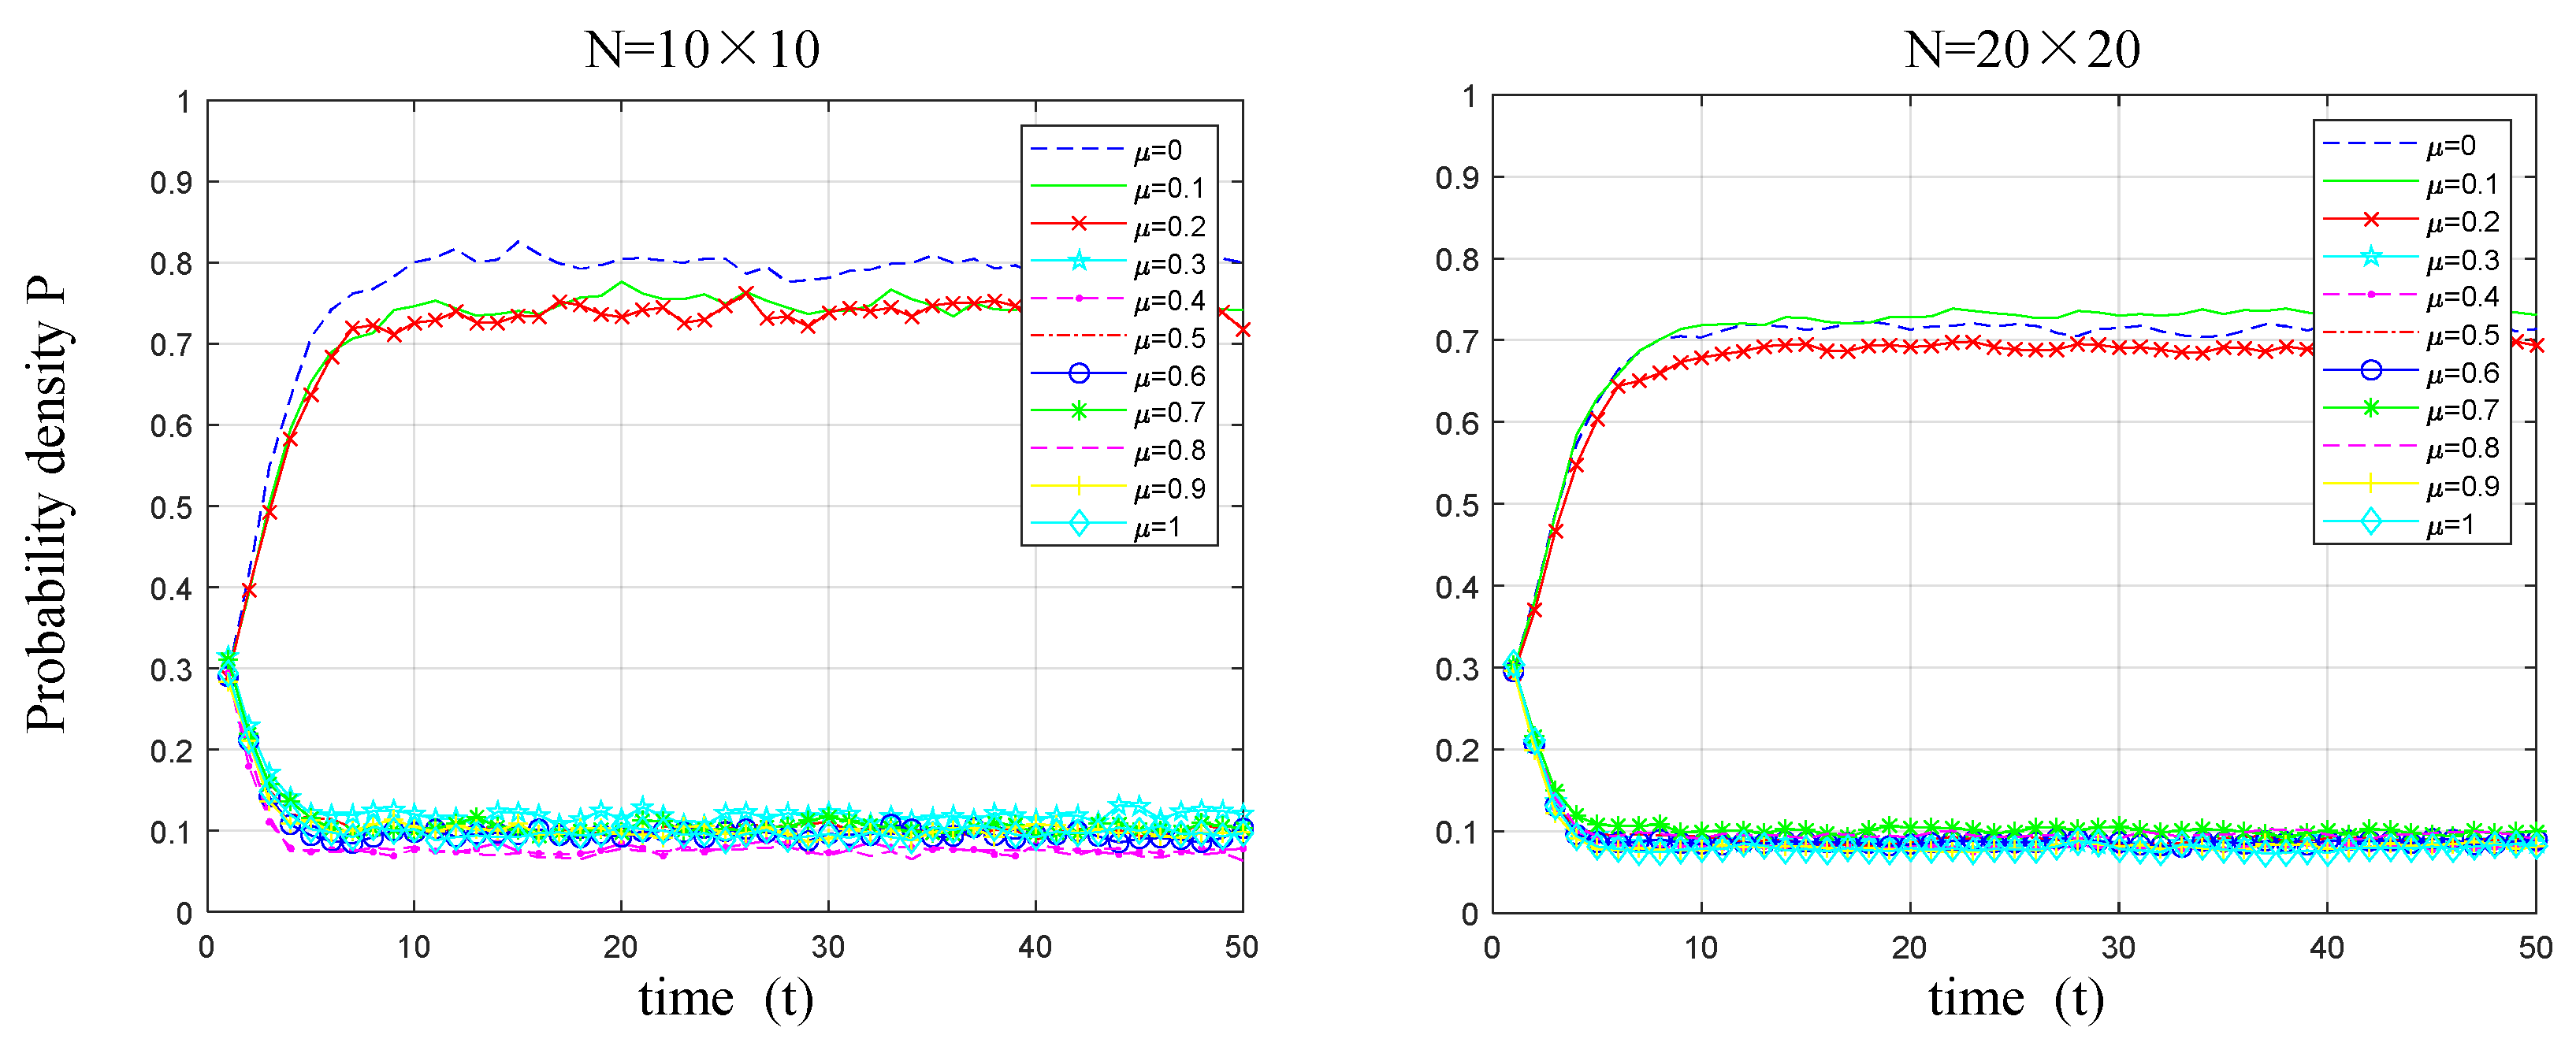
The above simulation results show that when the government subsidy coefficient δ 0 ,   0.6 , the probability density of low-carbon technology diffusion among manufacturers in the small-world network converges to approximately 0.1. Thus, while keeping other parameters constant, when δ = 0.6, we set μ 0 : 0.1 : 1 to assess the impact of variations in the carbon reduction cost coefficient on the probability density of low-carbon technology selection and diffusion in the small-world network.
As shown in Figure 6, when δ = 0.6, the probability density of low-carbon technology diffusion among manufacturers fluctuates slightly around 0.1 when μ 0.3 ,   1 . However, when μ 0 ,   0.2 , the probability density of low-carbon technology diffusion increases to the range of 0.7–0.8. These results prove the validity of the simulation results presented earlier, indicating that, based on a given government subsidy framework, reducing the cost of carbon reduction can enhance the probability density of low-carbon technology diffusion among manufacturers. Consistent with the findings of Guo et al. [50], the diffusion probability of low-carbon technologies is negatively correlated with the cost of carbon emission reduction. Wang et al. [52] also suggest that technological progress can reduce the risks and costs associated with enterprises’ adoption of new technologies. However, our finding further reveals that once a certain threshold level of carbon emission reduction costs is attained, additional reductions in these costs exert minimal influence on the probability density of low-carbon technology diffusion. Similarly, consistent with previous simulations, as the scale of manufacturers’ small-world network expands, the low-carbon behavior decisions of enterprises become more homogeneous, thus reducing the likelihood of random fluctuations.

5.2. Variations in Network Structure

5.2.1. Variations in Reconnecting Edges Probability

To pinpoint the operational mechanism by which variations in network structure affect low-carbon technology selection and diffusion among manufacturers, while keeping other parameters constant, and when δ   =   0.6 and μ   =   0.3 , we set the reconnecting edges probability p w 0 : 0.1 : 1 . The aim is to examine the impact of variations in the edge-reconnection probability on the probability density of low-carbon technology selection and diffusion among manufacturers in the small-world network.
As shown in Figure 7, when δ   =   0.6 and μ   =   0.3 , regardless of the reconnecting edges probability p w in the small-world network, the probability density of low-carbon technology diffusion among manufacturers fluctuates around 0.1. Notably, when p w   =   0 , this probability density stabilizes at 0. As the scale of manufacturers’ small-world network increases, the variation in the probability density of low-carbon technology diffusion remains insignificant. The diffusion of low-carbon technology in the small-world network does not meet expectations when δ   =   0.6   and μ   =   0.3 . As such, we reduce the carbon emission reduction cost coefficient μ = 0.2 , while keeping δ   =   0.6 , to investigate the impact of variations in reconnecting edges probability on the diffusion of low-carbon technology in manufacturers in the small-world network.
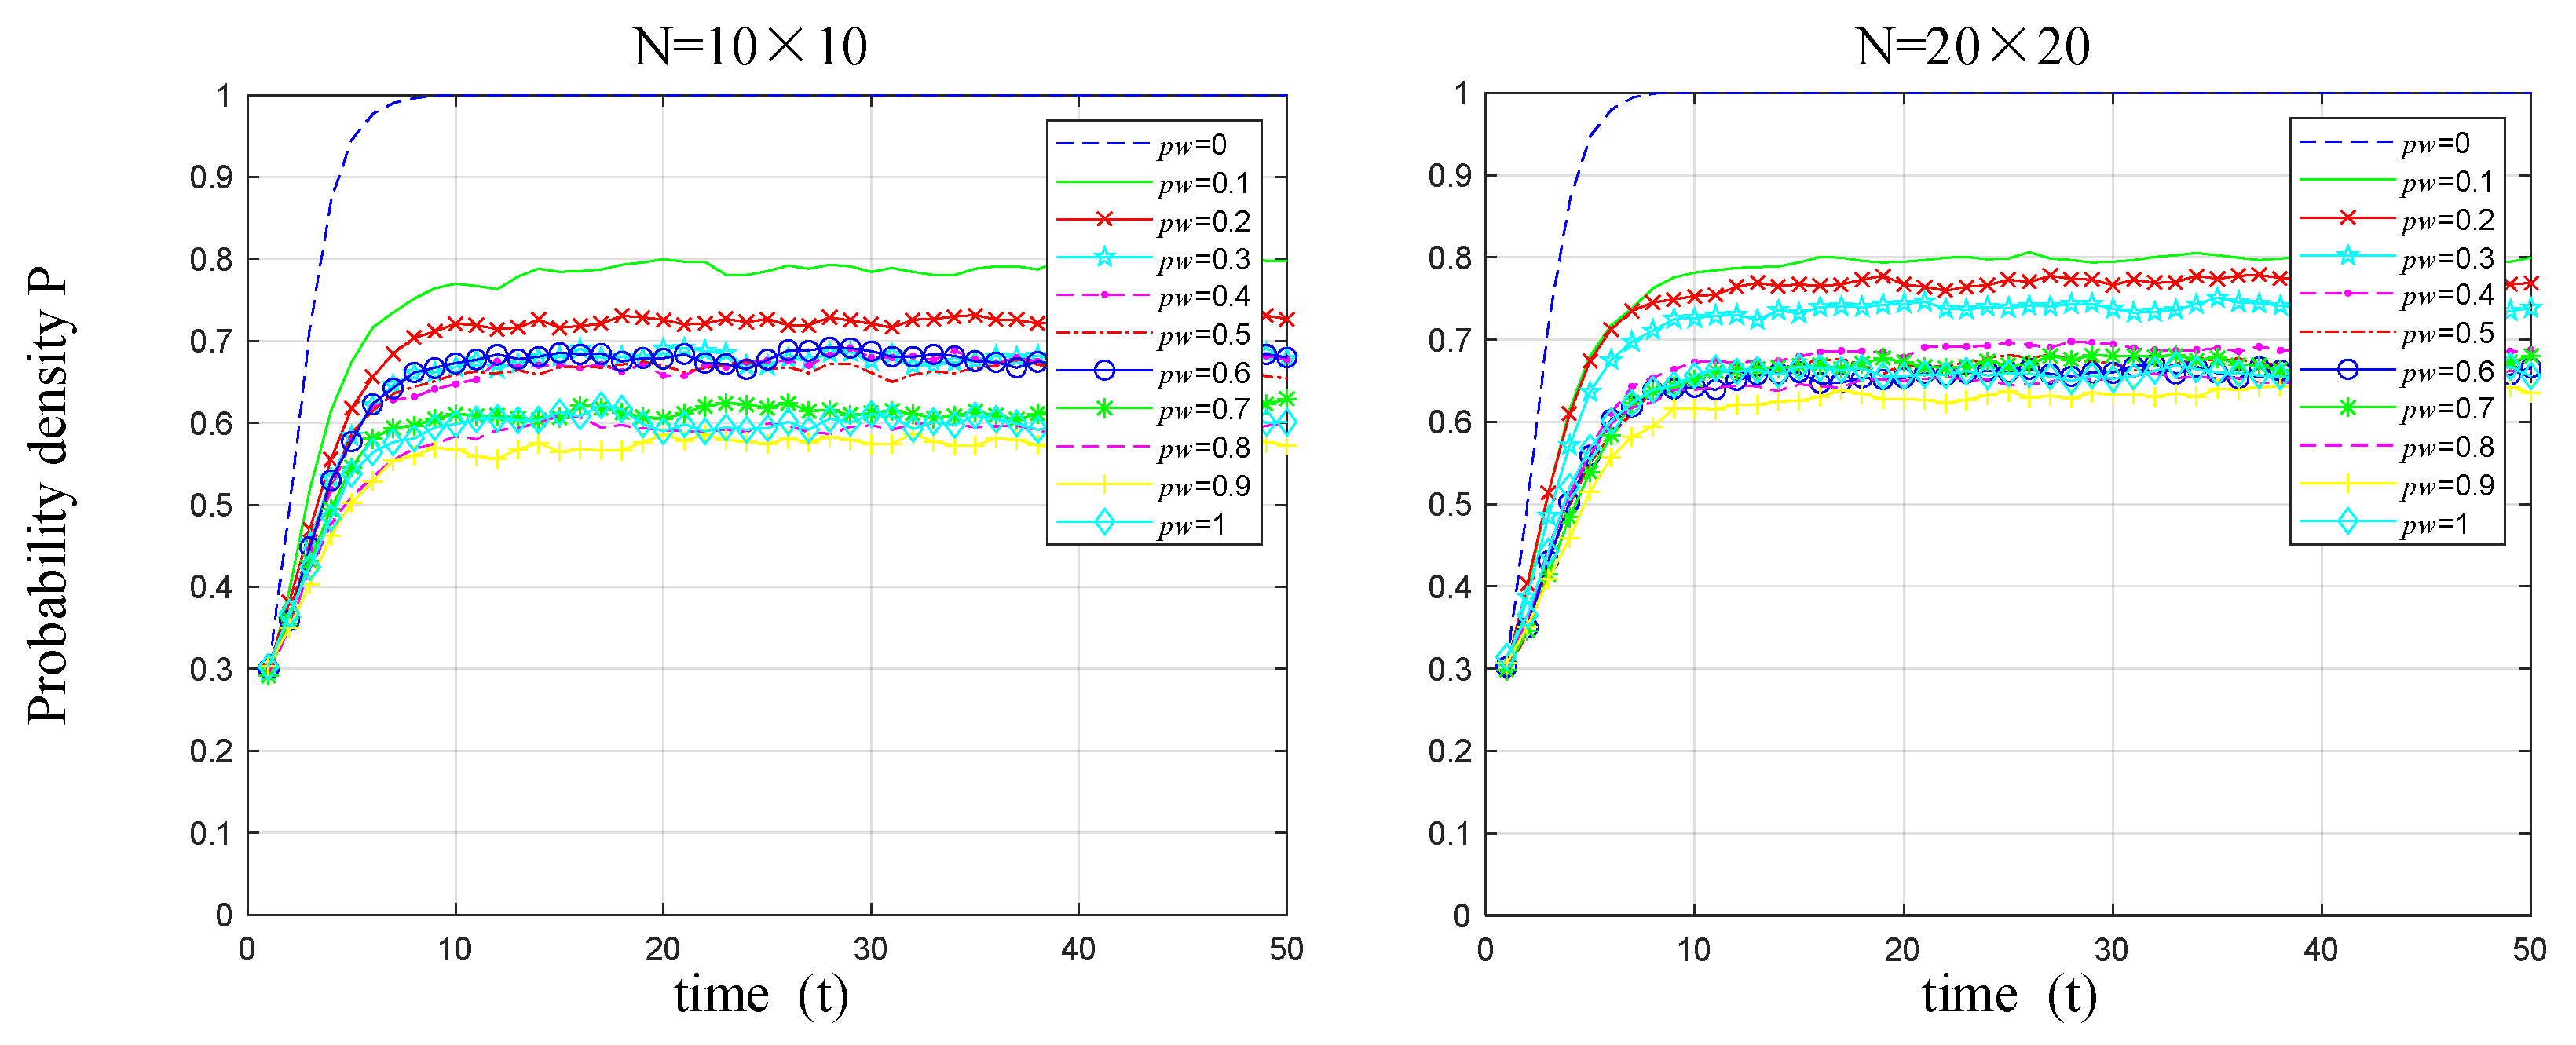
As shown in Figure 8, when δ   =   0.6 , μ   =   0.2 , and   p w   =   0 , regardless of the scale of manufacturers’ small-world network, the probability density of low-carbon technology diffusion among manufacturers in the small-world network reaches 1.0, indicating complete diffusion of low-carbon technologies. When p w   =   0.1 , the probability density of low-carbon technology diffusion can reach 0.8, with a minimal impact from increases in the scale of manufacturers’ small-world network. When   p w   =   0.2 , the probability density fluctuates around 0.75. Notably, when p w   =   0.3 , the probability density decreases slightly from N = 100 to N = 400. Subsequently, when p w     0.4 ,   1 , variations in reconnecting edges probability have no significant impact on low-carbon technology diffusion. From the comparison of evolutionary diagrams for different scales of manufacturer small-world networks, we observe that as the network scale increases, variations in reconnecting edges probability produce more distinct variations in the probability density of low-carbon technology diffusion [36].
The probability of reconnecting edges in the small-world network plays a critical role in determining the extent of low-carbon technology diffusion among manufacturers. According to the characteristics of small-world networks, when   p w   =   0 , the network tends toward a regular lattice; when p w   =   1 , it approaches a random network. By adjusting the reconnecting edges probability p w , we can achieve a gradual transition from a regular lattice to a random network. In favorable conditions ( δ   =   0.6 and   μ   =   0.2 ), when the small-world network tends toward a regular lattice, the extent of low-carbon technology diffusion among manufacturers is maximized. Conversely, in less favorable conditions ( δ   =   0.6 and   μ   =   0.3 ), the extent of low-carbon technology diffusion is minimized. The structure of manufacturers’ small-world network markedly influences the ultimate extent of low-carbon technology diffusion. Compared with random networks, small-world networks display higher clustering properties, making their structure critical for low-carbon technology diffusion among manufacturers.

5.2.2. Variations in Node Degree

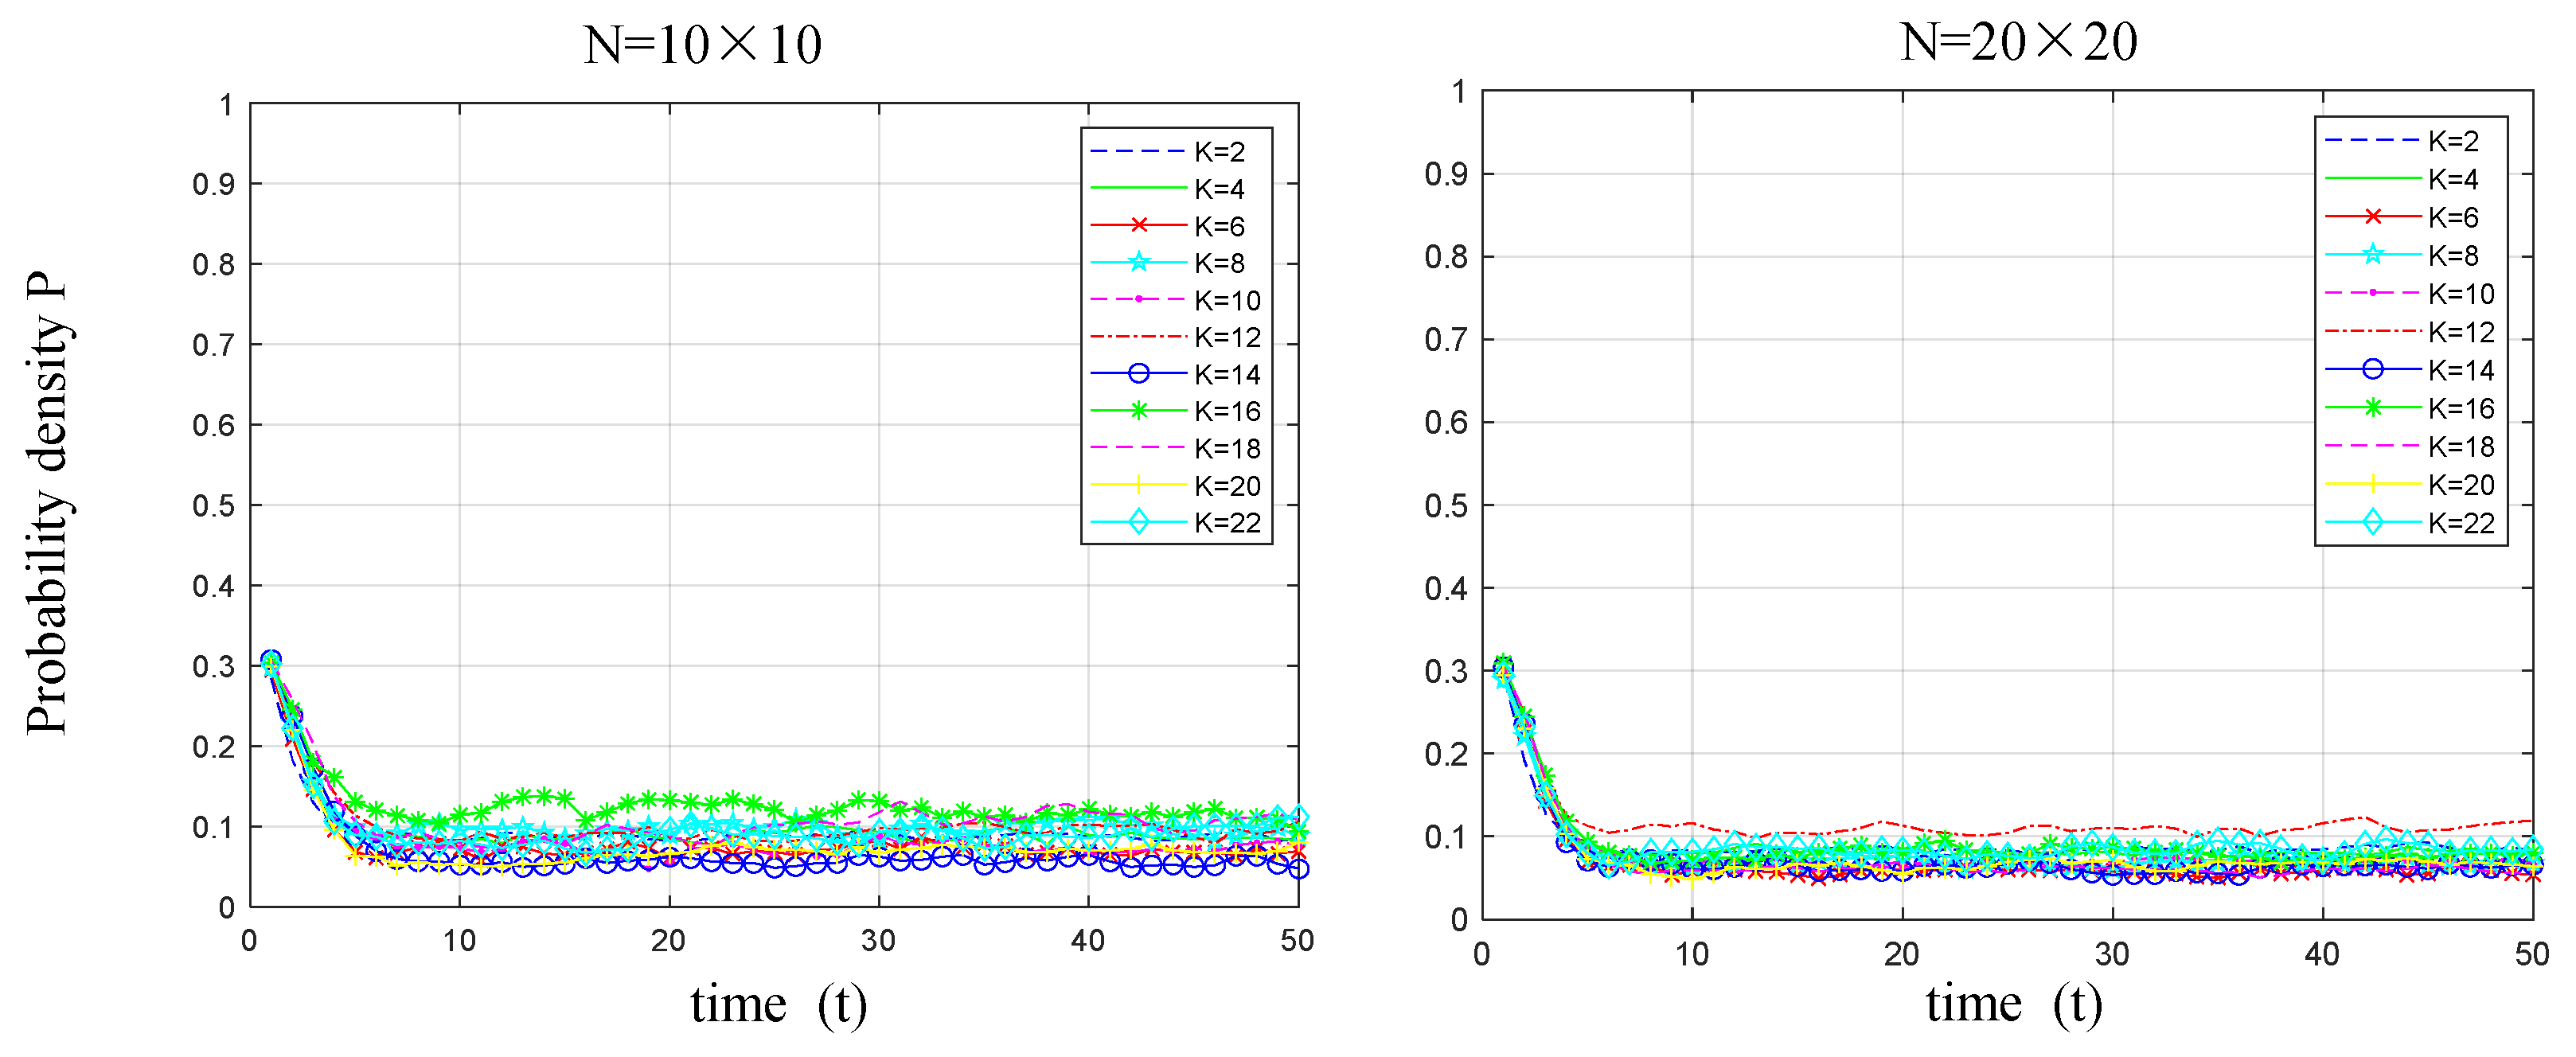
Furthermore, while keeping the initial parameters unchanged, and when δ   =   0.6 and   μ   =   0.3 , we set the node degree K 2 : 2 : 22 to examine the impact of variations in the node degree on the probability density of low-carbon technology selection and diffusion among manufacturers in the small-world network.
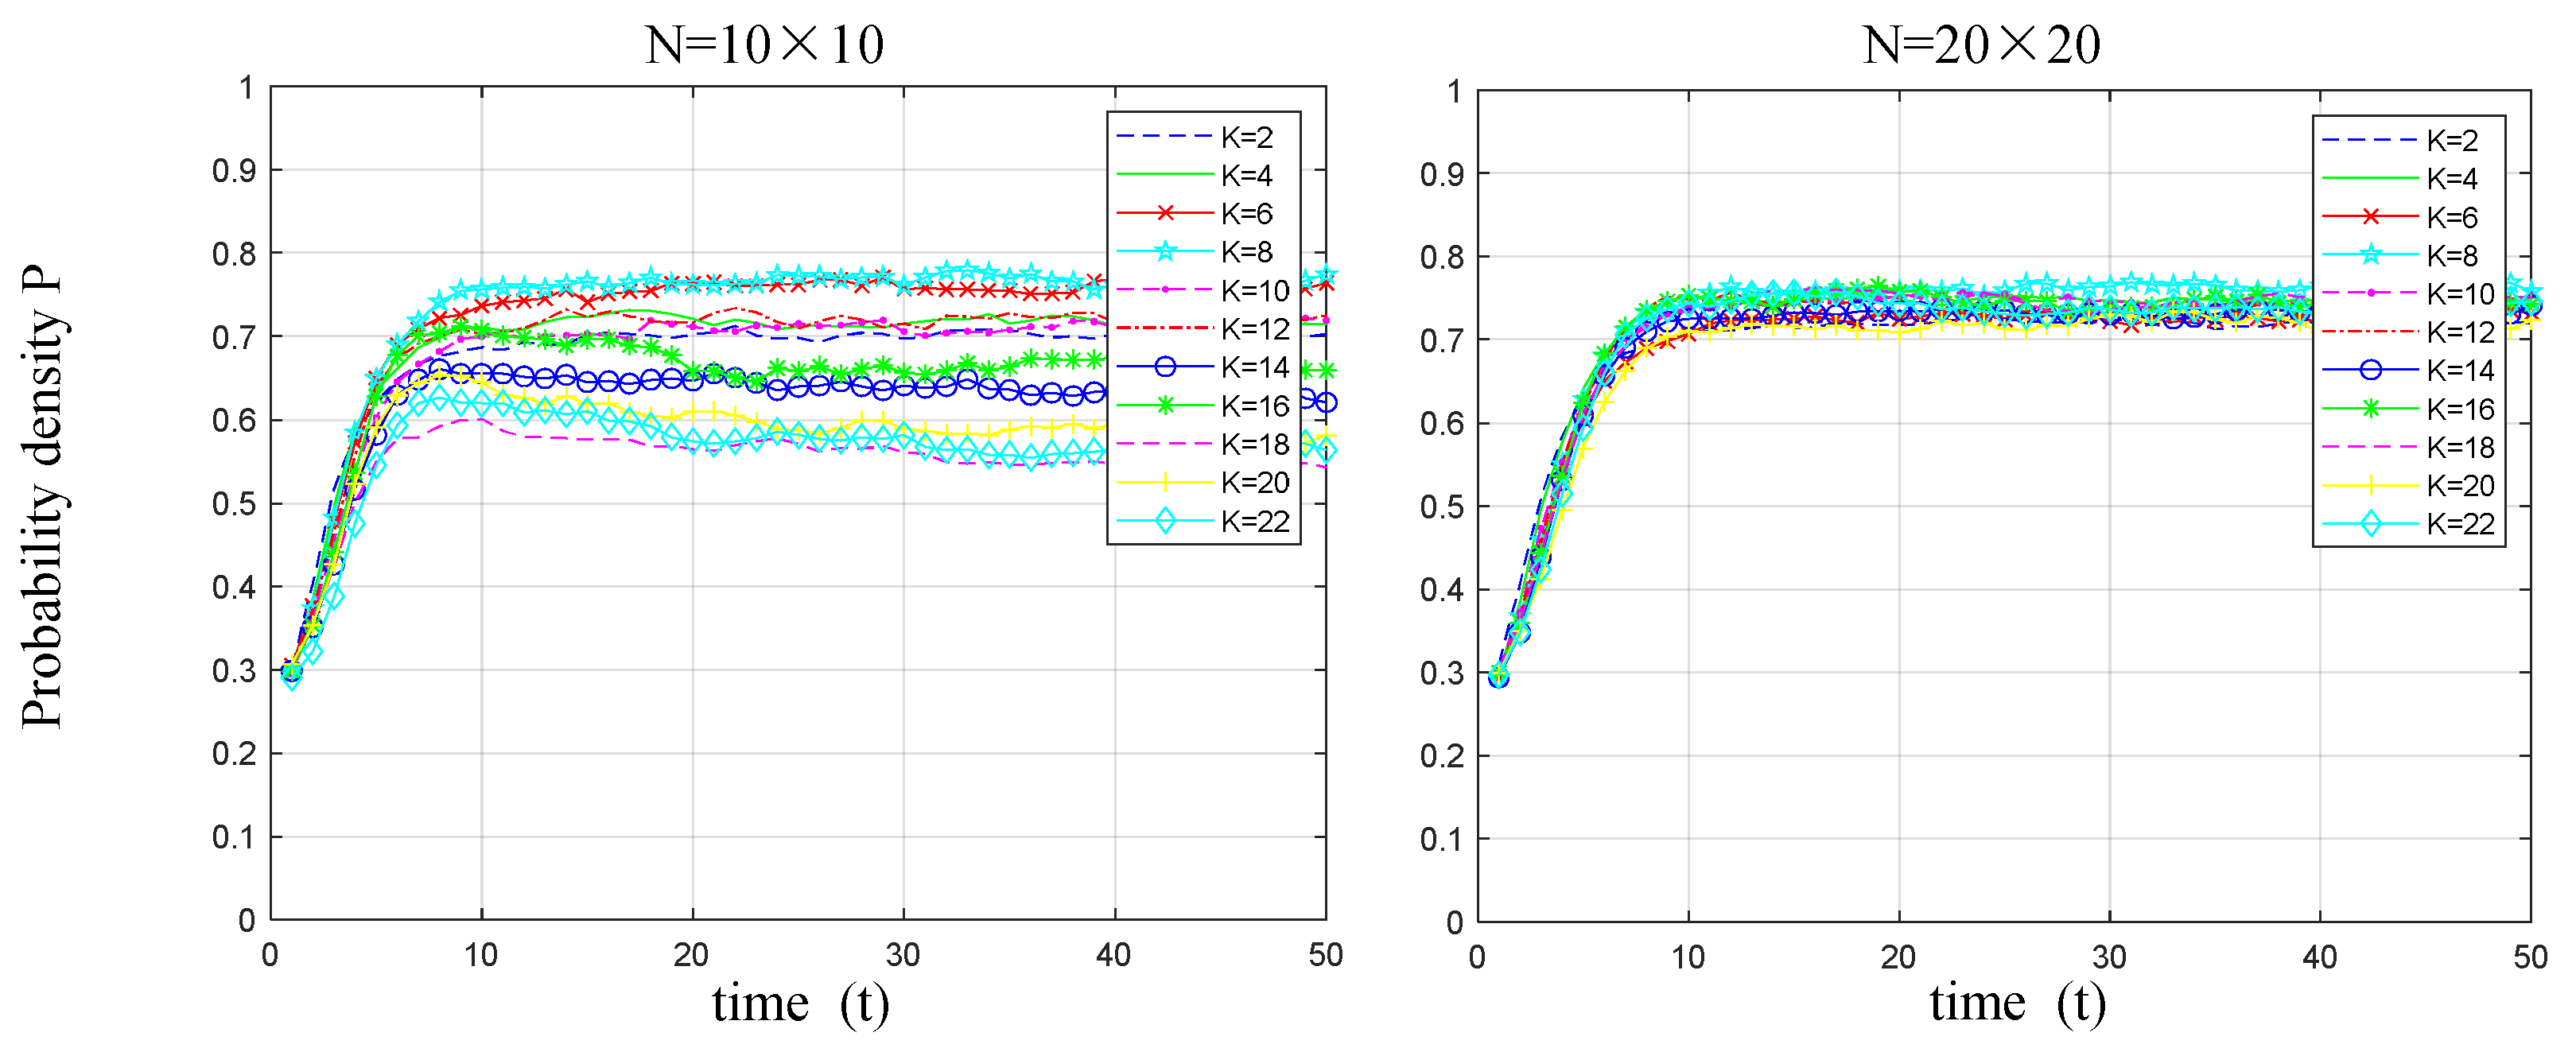
As shown in Figure 9, when   δ   =   0.6 and μ   =   0.2 , regardless of the node degree K in the small-world network, the probability density of low-carbon technology diffusion among manufacturers hovers around 0.1. As the number of manufacturers in the small-world network increases, the probability density of low-carbon technology diffusion does not change much. Similarly, we reduce the carbon emission reduction cost coefficient μ = 0.2 while keeping δ   =   0.6 to investigate the impact of the node degree K on low-carbon technology diffusion in the small-world network. As shown in Figure 10, variations in the node degree K exert a relatively random and insignificant impact on the probability density of low-carbon technology diffusion. Consistent with the previous simulation results, as the number of manufacturers in the small-world network increases, the effect of variations in the node degree K on the probability density of low-carbon technology diffusion becomes more convergent.
The existing literature, such as the studies by Fan et al. [32], Liu et al. [33], Fan et al. [37] and Yang et al. [38], has developed models from diverse perspectives; most studies have considered the impact of network node scales on the diffusion of low-carbon technologies in manufacturing enterprises, as well as the effects of various specific parameters, but they have largely neglected the influence of network structure itself on technology diffusion despite incorporating structural parameters in their models. From the above simulation results, it can be seen that the influence of network structure on the diffusion of low-carbon technologies in manufacturing enterprises primarily stems from the probability of edge reconnection, whereas the node degree appears to have no significant impact on the diffusion process.

5.3. Variations in Update Strategy

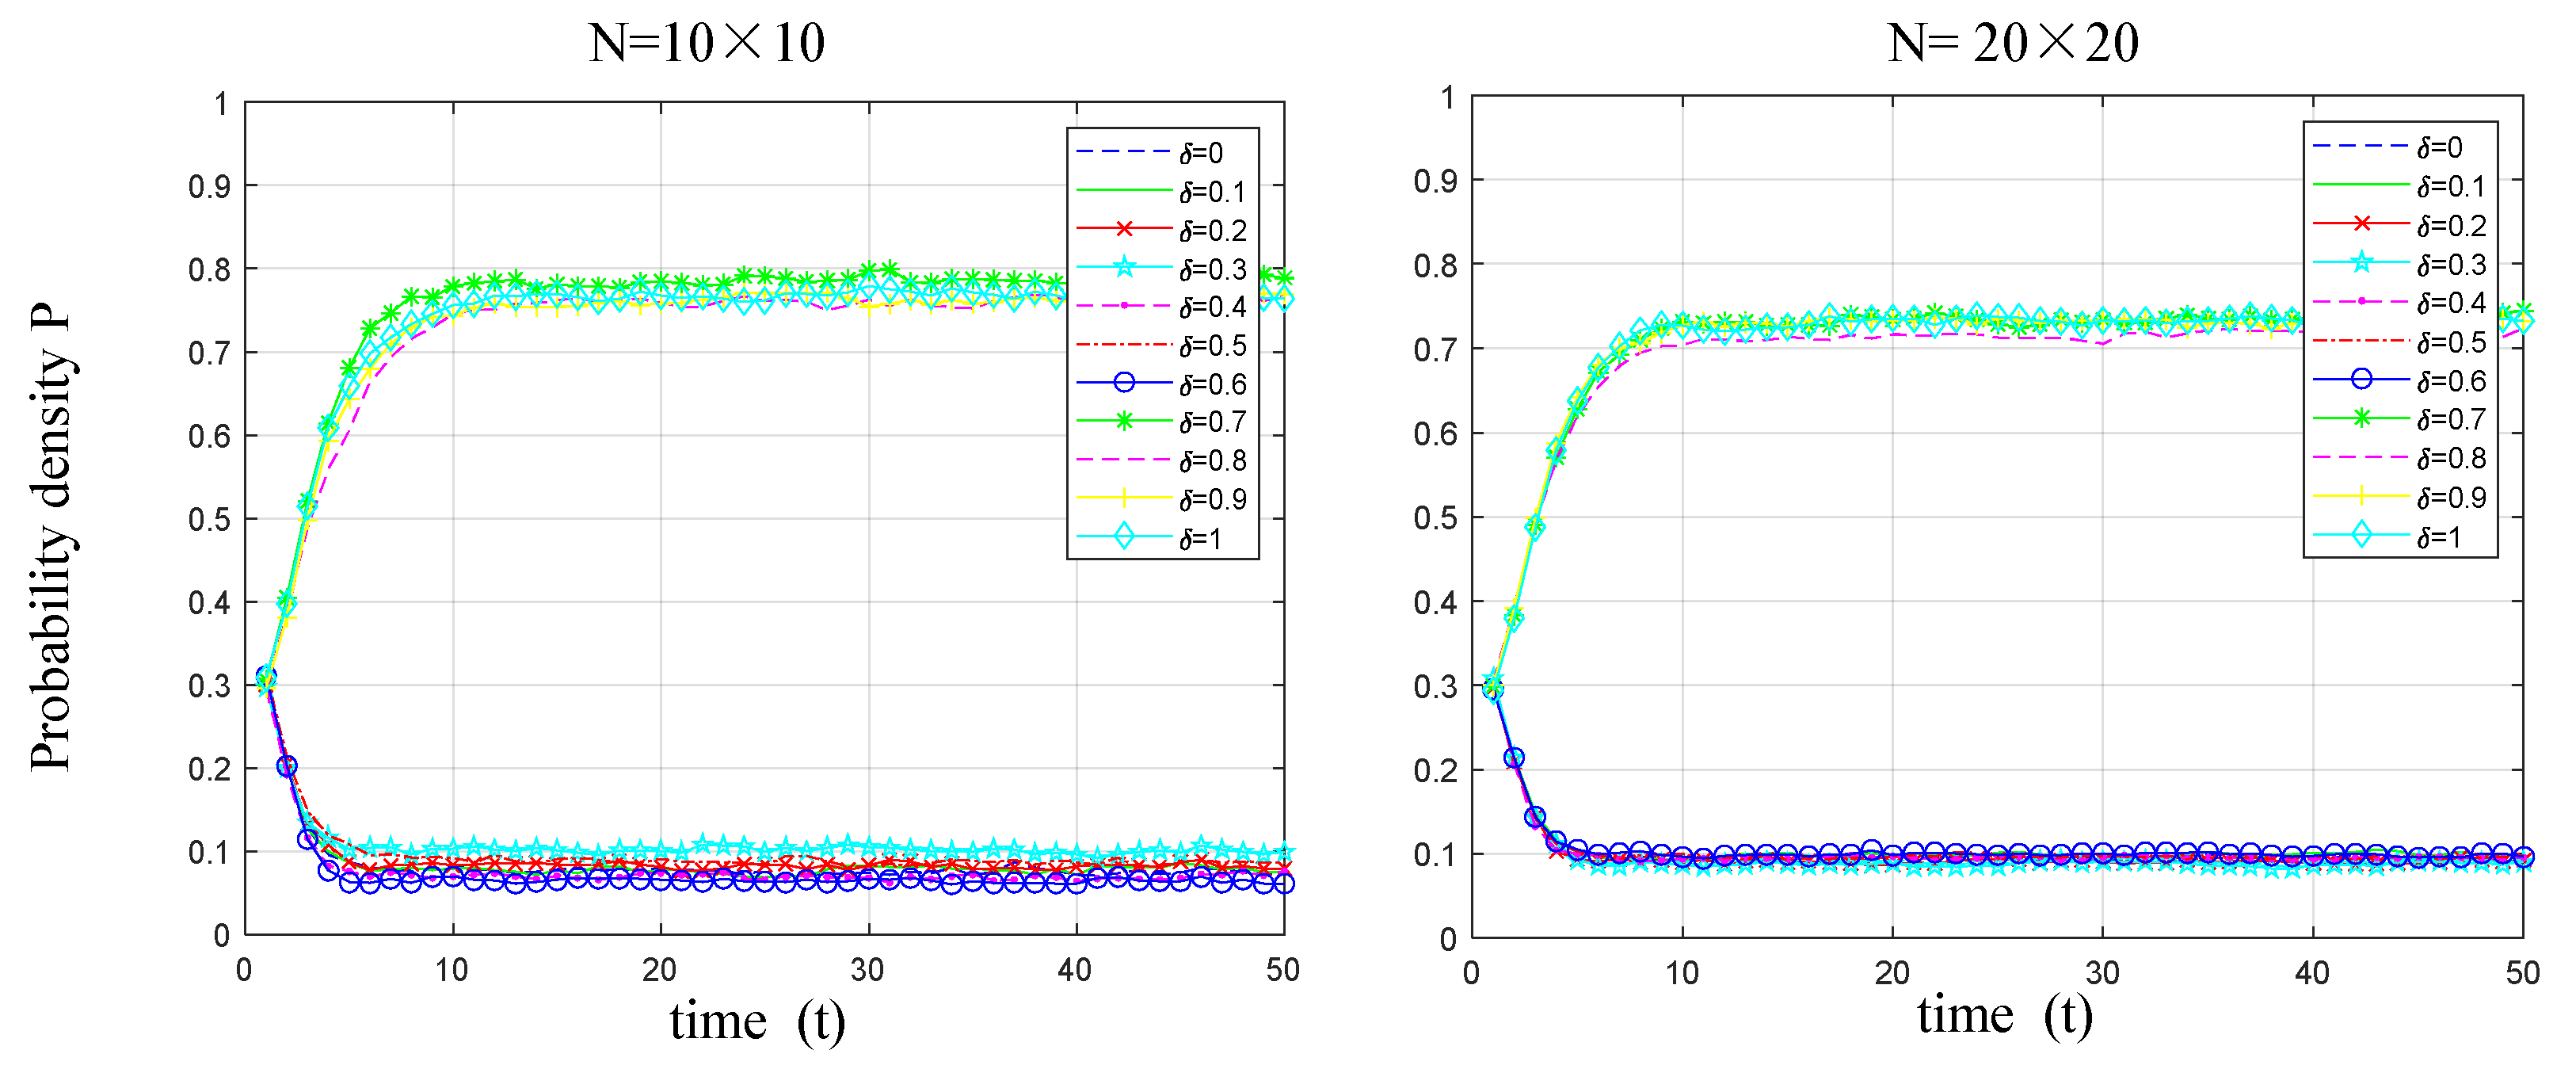
To identify the operational mechanism by which variations in update strategy influence low-carbon technology selection and diffusion among manufacturers, we propose an update strategy based on optimal selection. While keeping the initial parameters unchanged, we assume δ   =   0.6   and   μ   =   0.3 , and we examine the impact of variations in the update strategy on the probability density of low-carbon technology selection and diffusion among manufacturers by comparing random and optimal selection rules.
As shown in Figure 11 and Figure 12, regardless of the scale of manufacturers’ small-world network, when δ   =   0.6   and μ   =   0.3 , the probability density of low-carbon technology diffusion among manufacturers in the small-world network hovers around 0.1. However, the update strategy based on optimal selection reaches this level and stabilizes more quickly compared with the random selection. Similarly, we reduce the carbon emission reduction cost coefficient μ = 0.2 while keeping δ = 0.6 to investigate the impact of different update strategies on low-carbon technology diffusion in the small-world network by comparing random and optimal selection rules.
As shown in Figure 13 and Figure 14, when   δ   =   0.6 and   μ   =   0.2 , regardless of the scale of manufacturers’ small-world network, the probability density of low-carbon technology diffusion among manufacturers in the small-world network can reach 0.7 or higher. Consistent with the simulation results presented above, as the number of manufacturers in the small-world network increases, the probability density of adopting and diffusing low-carbon technologies gradually stabilizes. However, the update strategy based on optimal selection approaches this level and stabilizes more rapidly compared with the random selection. The optimal selection strategy aligns better with the current considerations of manufacturers in choosing partners.
Most of the existing literature discusses the diffusion of low-carbon technologies in manufacturing enterprises based on the Fermi update rule. For instance, Lu et al. [34] based their study on adjacent enterprise learning and the Fermi rule, while Liu et al. [35] considered an improved mechanism that integrates replicator dynamics with Fermi dynamics. Nevertheless, these studies have not considered the tendency of manufacturing enterprises to be more influenced by those with greater influence or exemplary power. From the above simulation results, the optimal selection-based update strategy proposed in this study can more effectively encourage low-carbon technology diffusion among manufacturers and achieve a balanced and stable state more quickly. Despite a slight downward trend for the probability density of low-carbon technology diffusion, as the scale of manufacturers’ small-world network increases, the optimal selection strategy remains more effective than the random selection strategy for encouraging low-carbon technology diffusion.

6. Conclusions and Policy Implications

Low-carbon technology selection lays the behavioral foundation for technology diffusion. The essence of low-carbon technology diffusion lies in the gradual adoption and diffusion of such technologies in manufacturers’ small-world networks. This study considers the complexity of competitive and cooperative relationships between manufacturers, examining the impact of variations in the low-carbon correlation coefficients, network structures, and update strategy of low-carbon technology selection and diffusion. The results indicate the following.
  • Based on government-imposed carbon taxes, appropriately increasing subsidies can increase low-carbon technology diffusion among manufacturers. However, once subsidies reach a certain threshold, further increases have no added effect on low-carbon technology diffusion. Thus, reducing carbon-emission reduction costs for manufacturers can encourage low-carbon technology diffusion in small-world networks. Nonetheless, the initial investment required for low-carbon technologies and the uncertainty of future returns are key factors hindering independent adoption by manufacturers. However, as the scale of manufacturing enterprise small-world networks increases, firms’ low-carbon behavioral decisions become more consistent, reducing the likelihood of random variations.
  • Whether through continued increases in government subsidies or reductions in emission-reduction costs, manufacturers’ low-carbon technology selection and diffusion will tend toward stable equilibrium after reaching a certain threshold, beyond which no further enhancement of low-carbon technology diffusion is possible. The key to low-carbon technology diffusion lies in the structural composition of manufacturers’ small-world networks, which heavily influences the evolution of low-carbon technology adoption and diffusion. Under favorable conditions, when the small-world network approaches a regular network structure, the extent of low-carbon technology diffusion reaches its maximum. Conversely, in unfavorable conditions, the extent of low-carbon technology diffusion is minimized.
  • When manufacturers select objects to imitate and learn from, the strategy of preferentially selecting neighbors for updates aligns more closely with their current considerations in choosing competitors. Compared with the traditional random selection update strategy, the preferential selection update strategy can increase the probability density of low-carbon technology diffusion among manufacturers and rapidly achieve a balanced, stable state among them. Although the probability density of low-carbon technology diffusion may decline as the scale of manufacturers’ small-world networks increases, this trend does not diminish the overall effectiveness of the preferential selection strategy.
Based on the above conclusions, the following policy implications apply.
  • China has implemented carbon trading mechanisms in only a limited number of industries, but these mechanisms have yet to impose binding constraints on the majority of manufacturing enterprises, particularly those operating in sectors that are difficult to integrate into the carbon trading market. In this context, carbon taxes offer distinct advantages in terms of implementation ease, regulatory oversight, and broader applicability. As Wang et al. [19] pointed out, carbon taxes can serve as a complementary policy instrument to carbon trading, ensuring more comprehensive coverage of carbon emissions across the manufacturing sector in the future. Furthermore, the allocation and withdrawal of government subsidies should be aligned with carbon tax policies to strengthen the effectiveness of subsidy supervision and incentivization.
  • With global industrialization, the manufacturing sector has transitioned from an initial phase of free-market equilibrium to a more structured phase marked by industrial clustering and the emergence of networked hubs. The impact of network structure on the adoption and diffusion of low-carbon technologies by manufacturers has become increasingly significant. Governments must also consider how the networks formed by competition and collaboration among manufacturers affect their decision-making processes when designing policies. Importantly, governments can shape these networks by adjusting market access regulations to encourage the concentration and growth of manufacturing firms. Such interventions could help regulate industry competition and in turn facilitate the low-carbon technologies diffusion.
  • Establishing benchmark enterprises for low-carbon transition and disseminating their successful practices can serve as a model for broader industry adoption. Accordingly, the government should prioritize supporting large manufacturing enterprises in their low-carbon transformation processes. In 2023, multiple departments of China jointly issued the “Opinions on Accelerating the Establishment of a Product Carbon Footprint Management System”, which highlighted the critical role of leading enterprises in setting industry benchmarks, further supporting the arguments of this paper. In addition, fostering interaction and communication among enterprises facilitates knowledge transfer and learning, thereby facilitating the low-carbon technologies diffusion across industries.
This study has several limitations. First, this study primarily draws on data from the beer industry to examine the behavioral decisions of manufacturers producing products with no obvious low-carbon attributes. However, focusing solely on a single industry may introduce potential biases in the results, and future research could address this limitation by synthesizing the common characteristics across multiple industries. Secondly, this study lacks comprehensive empirical data, and the limited number of parameters involved in the computer simulation results in minimal data requirements. Future research could address this gap by conducting more rigorous quantitative analyses based on manufacturing industry data. Furthermore, under the context of global industrialization, network hub-based integrated development has effectively overcome geographical constraints. While this study primarily focuses on inter-industry enterprise differences, it does not account for the potential impact of regional disparities on the simulation outcomes. Future research could extend the current framework by incorporating regional variations through alternative methodological approaches. Finally, in contrast to the rationality assumption in the Stackelberg game, this study is grounded in evolutionary game theory and assumes bounded rationality on the manufacturers. This study has not comprehensively considered the influence of additional potential factors, such as how economic crises may affect the diffusion of low-carbon technologies. Future research could further refine the model by integrating a broader range of influencing factors, thereby deepening the understanding of their impact on the behavioral decisions of manufacturing enterprises.

Author Contributions

Conceptualization, W.C. and Z.-H.H.; methodology, W.C.; software, W.C.; validation, W.C. and Z.-H.H.; formal analysis, W.C.; investigation, W.C.; writing—original draft preparation, W.C.; writing—review and editing, W.C. and Z.-H.H.; supervision, Z.-H.H.; funding acquisition, W.C. All authors have read and agreed to the published version of the manuscript.

Funding

This research was supported by the National Social Science Fund of China (Grant number: 21XGL020).

Data Availability Statement

The original contributions presented in this study are included in the article. Further inquiries can be directed to the corresponding author.

Conflicts of Interest

The authors declare no conflicts of interest.

References

  1. Xinhua Net. 2024 Was the Hottest Year in History, and the Global Average Temperature Exceeded the 1.5 °C Temperature Control Target for the First Time. Available online: https://www.xinhuanet.com/tech/20250114/2048ca22d7e74da4a5b1efa251d85c74/c.html (accessed on 20 January 2025). (In Chinese).
  2. Dengjie, T. Vigorously Promote Energy Conservation Work to Assist in Achieving Carbon Peak and Carbon Neutrality People’s Daily. 2021-08-25(013). Available online: https://www.ndrc.gov.cn/fzggw/wld/tdj/zyhd/202108/t20210825_1294578.html (accessed on 20 January 2025). (In Chinese)
  3. Ministry of Industry and Information Technology of the People’s Republic of China. Guiding Opinions on Accelerating the Green Development of Manufacturing Industry. 2024. Available online: https://www.gov.cn/zhengce/zhengceku/202403/content_6935684.htm (accessed on 20 January 2025). (In Chinese)
  4. China Development Network. Fully Recognizing the Necessity and Difficulty of Achieving the “Double Carbon” Goal. Available online: http://www.chinadevelopment.com.cn/news/zj/2022/03/1771088.shtml (accessed on 20 January 2025). (In Chinese).
  5. Onozaka, Y.; McFadden, D.T. Does Local Labeling Complement or Compete with Other Sustainable Labels? A Conjoint Analysis of Direct and Joint Values for Fresh Produce Claim. Am. J. Agric. Econ. 2011, 93, 689–702. [Google Scholar] [CrossRef]
  6. Wang, L.; Zheng, J.J. Research on low-carbon diffusion considering the game among enterprises in the complex network context. J. Clean. Prod. 2019, 210, 1–11. [Google Scholar] [CrossRef]
  7. Shi, Y.; Wei, Z.; Shahbaz, M.; Zeng, Y. Exploring the dynamics of low-carbon technology diffusion among enterprises: An evolutionary game model on a two-level heterogeneous social network. Energy Econ. 2021, 101, 105399. [Google Scholar] [CrossRef]
  8. Wu, B.; Liu, P.; Xu, X. An evolutionary analysis of low-carbon strategies based on the government–enterprise game in the complex network context. J. Clean. Prod. 2017, 141, 168–179. [Google Scholar] [CrossRef]
  9. Xu, X.; Zhang, W.; He, P.; Xu, X. Production and pricing problems in make-to-order supply chain with cap-and-trade regulation. Omega 2017, 66, 248–257. [Google Scholar] [CrossRef]
  10. Hu, X.; Yang, Z.; Sun, J.; Zhang, Y. Carbon tax or cap-and-trade: Which is more viable for Chinese remanufacturing industry? J. Clean. Prod. 2020, 243, 118606. [Google Scholar] [CrossRef]
  11. Wittneben, B.B.F. Exxon is right: Let us re-examine our choice for a cap-and-trade system over a carbon tax. Energy Policy 2009, 37, 2462–2464. [Google Scholar] [CrossRef]
  12. Krass, D.; Nedorezov, T.; Ovchinnikov, A. Environmental Taxes and the Choice of Green Technology. Prod. Oper. Manag. 2013, 22, 1035–1055. [Google Scholar] [CrossRef]
  13. Xu, X.; Xu, X.; He, P. Joint production and pricing decisions for multiple products with cap-and-trade and carbon tax regulations. J. Clean. Prod. 2016, 112, 4093–4106. [Google Scholar] [CrossRef]
  14. Zhou, D.; An, Y.; Zha, D.; Wu, F.; Wang, Q. Would an increasing block carbon tax be better? A comparative study within the Stackelberg Game framework. J. Environ. Manag. 2019, 235, 328–341. [Google Scholar] [CrossRef] [PubMed]
  15. Ahmadi, Y.; Yamazaki, A.; Kabore, P. How Do Carbon Taxes Affect Emissions? Plant-Level Evidence from Manufacturing. Environ. Resour. Econ. 2022, 82, 285–325. [Google Scholar] [CrossRef] [PubMed]
  16. Xia, X.; Chen, J.; Wang, W.; Wang, H. Impact of differentiated carbon taxes on remanufacturing mode selection. Energy Econ. 2024, 140, 107955. [Google Scholar] [CrossRef]
  17. www.gov.cn. First Expansion! The National Carbon Emission Trading Market has Added the Steel, Cement and Aluminum Smelting Industries. Available online: https://www.gov.cn/lianbo/bumen/202503/content_7015718.htm (accessed on 20 May 2025).
  18. Yu, Q.; Rui, Z.; Yankun, X. Establish a collaborative mechanism for the new carbon tax and carbon emission rights trading market in our country. Jianghuai Forum 2024, 4, 97–105. (In Chinese) [Google Scholar] [CrossRef]
  19. Wang, J.; Cheng, S.; Guo, X.; Xu, X.; Wang, Z. An evolutionary analysis of the diffusion of low-carbon technology innovation in supply networks. Res. Int. Bus. Financ. 2024, 70, 102400. [Google Scholar] [CrossRef]
  20. Huang, Y.; He, P.; Cheng, T.C.E.; Xu, S.; Pang, C.; Tang, H. Optimal strategies for carbon emissions policies in competitive closed-loop supply chains: A comparative analysis of carbon tax and cap-and-trade policies. Comput. Ind. Eng. 2024, 195, 110423. [Google Scholar] [CrossRef]
  21. Xu, C.; Wang, C.; Huang, R. Impacts of horizontal integration on social welfare under the interaction of carbon tax and green subsidies. Int. J. Prod. Econ. 2020, 222, 107506. [Google Scholar] [CrossRef]
  22. Wu, H.; Sun, Y.; Su, Y.; Chen, M.; Zhao, H.; Li, Q. Which Is the Best Supply Chain Policy: Carbon Tax, or a Low-Carbon Subsidy? Sustainability 2022, 14, 6312. [Google Scholar] [CrossRef]
  23. Zhang, Q.; Zhao, Q.; Zhao, X.; Tang, L. On the introduction of green product to a market with environmentally conscious consumers. Comput. Ind. Eng. 2020, 139, 106190. [Google Scholar] [CrossRef]
  24. Zhou, Z.; Hu, F.; Xiao, D. Optimal pricing strategy of competing manufacturers under carbon policy and consumer environmental awareness. Comput. Ind. Eng. 2020, 150, 106918. [Google Scholar] [CrossRef]
  25. He, P.; Sun, Y. The impacts of retailer’s carbon tax on the price and carbon reduction decisions in supply chain. Comput. Ind. Eng. 2024, 190, 110034. [Google Scholar] [CrossRef]
  26. Liao, D.; Tan, B. An evolutionary game analysis of new energy vehicles promotion considering carbon tax in post-subsidy era. Energy 2023, 264, 126156. [Google Scholar] [CrossRef]
  27. Hu, Z.H.; Wang, S.W. An Evolutionary Game Model Between Governments and Manufacturers Considering Carbon Taxes, Subsidies, and Consumers’ Low-Carbon Preference. Dyn. Games Appl. 2022, 12, 513–551. [Google Scholar] [CrossRef]
  28. Zheng, P.; Pei, W.; Pan, W. Impact of different carbon tax conditions on the behavioral strategies of new energy vehicle manufacturers and governments—A dynamic analysis and simulation based on prospect theory. J. Clean. Prod. 2023, 407, 137132. [Google Scholar] [CrossRef]
  29. Wang, Y.; Luo, H.; Zhang, X.; Li, Y.; Yang, S.; Lu, Q.; Wang, L. Research on evolutionary game of low-carbon logistics in two-level supply chain under carbon tax policy. Sustain. Futures 2024, 8, 100387. [Google Scholar] [CrossRef]
  30. Liu, D.; Feng, M.; Liu, Y.; Wang, L.; Hu, J.; Wang, G.; Zhang, J. A tripartite evolutionary game study of low-carbon innovation system from the perspective of dynamic subsidies and taxes. J. Environ. Manag. 2024, 356, 120651. [Google Scholar] [CrossRef]
  31. Xu, Y.D.; Han, L.; Li, X.; Zhu, W.X.; Ren, H.P. Evolutionary Game-Based New Energy Vehicle Supply Chain Strategies That Consider Carbon Reduction and Consumers’ Low-Carbon Preferences. Systems 2024, 12, 328. [Google Scholar] [CrossRef]
  32. Fan, R.; Dong, L.; Yang, W.; Sun, J. Study on the optimal supervision strategy of government low-carbon subsidy and the corresponding efficiency and stability in the small-world network context. J. Clean. Prod. 2017, 168, 536–550. [Google Scholar] [CrossRef]
  33. Liu, P.; Li, X.; Li, J. Competitive firms’ low-carbon technology diffusion under pollution regulations: A network-based evolutionary analysis. Energy 2023, 282, 128836. [Google Scholar] [CrossRef]
  34. Lu, Q.; Fang, H.; Hou, J. The impact of energy supply side on the diffusion of low-carbon transformation on energy demand side under low-carbon policies in China. Energy 2024, 307, 132817. [Google Scholar] [CrossRef]
  35. Liu, J.; Sun, J.; Bao, H.; Lu, Y. Research on value co-creation of green hydrogen value chain considering carbon emission trading: A multi-layer complex network evolutionary game perspective. Renew. Energy 2025, 242, 122423. [Google Scholar] [CrossRef]
  36. Hu, Y.; Wang, Z.; Li, X. Impact of policies on electric vehicle diffusion: An evolutionary game of small world network analysis. J. Clean. Prod. 2020, 265, 121703. [Google Scholar] [CrossRef]
  37. Fan, R.; Bao, X.; Du, K.; Wang, Y.; Wang, Y. The effect of government policies and consumer green preferences on the R&D diffusion of new energy vehicles: A perspective of complex network games. Energy 2022, 254, 124316. [Google Scholar] [CrossRef]
  38. Yang, M.; Chen, H.; Long, R.; Sun, Q.; Yang, J. How does government regulation promote green product diffusion in complex network? An evolutionary analysis considering supply side and demand side. J. Environ. Manag. 2022, 318, 115642. [Google Scholar] [CrossRef]
  39. Watts, D.; Strogatz, S. Collective Dynamics of Small World Networks. Nature 1998, 393, 440–442. [Google Scholar] [CrossRef]
  40. Qin, Q.; Liu, Y.; Huang, J.-P. A cooperative game analysis for the allocation of carbon emissions reduction responsibility in China’s power industry. Energy Econ. 2020, 92, 104960. [Google Scholar] [CrossRef]
  41. Chen, W.; Hu, Z.-H. Using evolutionary game theory to study governments and manufacturers’ behavioral strategies under various carbon taxes and subsidies. J. Clean. Prod. 2018, 201, 123–141. [Google Scholar] [CrossRef]
  42. GB/T 4754-2017; Industrial Classification for National Economic Activities. China Standard Publishing House: Beijing, China, 2017.
  43. Lin, B.; Lei, X. Carbon emissions reduction in China’s food industry. Energy Policy 2015, 86, 483–492. [Google Scholar] [CrossRef]
  44. Bossek, D.; Bach, V.; Finkbeiner, M. Lifestyle-LCA: Challenges and Perspectives. Sustainability 2023, 15, 11313. [Google Scholar] [CrossRef]
  45. CO2 Everythinge. Carbon Footprint of Drinks. Available online: https://www.co2everything.com/co2e-of/beer (accessed on 25 August 2025).
  46. GB/T 32151.25-2024; Requirements of the Greenhouse Gas Emissions Accounting and Reporting—Part 25: Food, Tobacco, Alcohol, Beverage and Refined Tea Enterprise. China Standard Publishing House: Beijing, China, 2024.
  47. Wang, H.; Wang, F. Study on purification of food grade carbon dioxide impurities by adsorption technology. Chin. Foreign Wine Ind. Beer Sci. Technol. 2017, 11, 20–25. (In Chinese) [Google Scholar]
  48. Yang, J.; Zhong, J.; Zhang, K. Beer Carbon Footprint and Calculation Case. Beer Sci. Technol. 2013, 08, 6–14. (In Chinese) [Google Scholar]
  49. Carbon Trading Network. Industry Carbon Intensity Advanced Value Data Query List. Available online: www.tanpaifang.com/tanjiliang/2014/0504/31846.html (accessed on 20 January 2025). (In Chinese).
  50. Guo, L.; Cui, M.; Qu, Y.; He, P. An integrated approach to modeling the influence of critical factors in low-carbon technology adoption by chemical enterprises in China. J. Environ. Manag. 2025, 373, 123834. [Google Scholar] [CrossRef] [PubMed]
  51. China Finance. The Total Trading Volume of the National Carbon Market Exceeded 180 Million Tons in 2024. Available online: https://finance.china.com.cn/esg/20250101/6202067.shtml (accessed on 20 January 2025). (In Chinese).
  52. Wang, J.; Yin, L.; Yin, X.; He, W.; Cheng, Z.; Zeng, P. Fully distributed expansion planning for cross-border energy systems using hierarchical dynamic game embedded with carbon emissions. Energy 2025, 314, 134211. [Google Scholar] [CrossRef]
Figure 1. Reconnecting edge probabilities of 20 nodes.
Systems 13 00792 g001
Figure 2. Flowchart of the simulation experiment.
Systems 13 00792 g002
Figure 3. Impact of variations in low-carbon correlation coefficient (N = 100).
Systems 13 00792 g003
Figure 4. Impact of variations in low-carbon correlation coefficient (N = 400).
Systems 13 00792 g004
Figure 5. Impact of variations in government subsidy coefficient (μ = 0.2).
Systems 13 00792 g005
Figure 6. Impact of variations in carbon reduction cost coefficient δ = 0.6 .
Systems 13 00792 g006
Figure 7. Impact of variations in reconnecting edges probability ( δ = 0.6   and   μ = 0.3 ) .
Systems 13 00792 g007
Figure 8. Impact of variations in reconnecting edges probability ( δ = 0.6   and   μ = 0.2 ) .
Systems 13 00792 g008
Figure 9. Impact of variations in node degree ( δ = 0.6   and   μ = 0.3 ) .
Systems 13 00792 g009
Figure 10. Impact of variations in node degree ( δ = 0.6   and   μ = 0.2 ) .
Systems 13 00792 g010
Figure 11. Impact of variations in update strategy ( N = 100 , δ = 0.6   and   μ = 0.3 ) .
Systems 13 00792 g011
Figure 12. Impact of variations in update strategy ( N = 400 , δ = 0.6   and   μ = 0.3 ) .
Systems 13 00792 g012
Figure 13. Impact of variations in update strategy ( N = 100 , δ = 0.6   and   μ = 0.2 ) .
Systems 13 00792 g013
Figure 14. Impact of variations in update strategy ( N = 400 , δ = 0.6   and   μ = 0.2 ) .
Systems 13 00792 g014
Table 1. Definitions of parameter symbols.
ParametersDefinitions
N Number of manufacturers
p b  Unit sales price of the product
c l  Unit production cost for low-carbon products
c o  Unit production cost for original products
μ  Carbon-reduction cost coefficient per unit of product
Q  Average market capacity per unit of product
π o  Profit function for producing ordinary products
π l  Profit function for producing low-carbon products
T  Carbon tax levied on ordinary products
τ  Carbon tax rate per unit of ordinary product
S  Government subsidies for low-carbon products
δ  Government subsidy coefficient for low-carbon products
Table 2. Payoff matrix for manufacturers.
Manufacturers (Vj)
Low-Carbon TechnologyOriginal Technology
Manufacturers (Vi)Low-carbon technology p b c o 1 + μ Q + δ T ;
p b c o 1 + μ Q + δ T
p b c o 1 + μ Q + δ T ;
p b c o Q T
Original technology p b c o Q T ;
p b c o 1 + μ Q + δ T
p b c o Q T ;
p b c o Q T
Table 3. Carbon footprint data of the beverage industry.
ProductsCapacityCarbon Emissions (kg CO2e)
Milk (Cow)250 mL0.8
Coffee15 g0.4
Rice Milk250 mL0.3
Beer335 mL0.25
Soy Milk250 mL0.25
Oat Milk250 mL0.22
Almond Milk250 mL0.18
Coke330 mL0.17
Wine150 mL0.13
Table 4. Initial parameter assignment.
ParametersValueReference
p 8Market price
c o 3Basic Assumption
e o 0.43Yang et al. [48]
e l 0.08Carbon Trading Network [49]
μ 0.1Guo et al. [50]
τ 0.1China Finance [51]
δ 0.3Chen and Hu [41]
Q 1000Basic Assumption
Disclaimer/Publisher’s Note: The statements, opinions and data contained in all publications are solely those of the individual author(s) and contributor(s) and not of MDPI and/or the editor(s). MDPI and/or the editor(s) disclaim responsibility for any injury to people or property resulting from any ideas, methods, instructions or products referred to in the content.