Article

Port Investment Optimization and Its Application Under Differentiated Port and Industrial Risks Along the Maritime Silk Road

1
Faculty of Maritime and Transportation, Ningbo University, Ningbo 315211, China
2
Hangzhou International Innovation Institute, Beihang University, Hangzhou 311115, China
*
Author to whom correspondence should be addressed.
Systems 2025, 13(9), 794; https://doi.org/10.3390/systems13090794 (registering DOI)
Submission received: 23 July 2025 / Revised: 3 September 2025 / Accepted: 7 September 2025 / Published: 9 September 2025

Abstract

Since the implementation of the Belt and Road Initiative (BRI) in 2013, Chinese enterprises have expanded port and industrial investments along the Maritime Silk Road (MSR), forming a mutually reinforcing coupled system. Port investments reduce transportation costs and promote the relocation of industries to host countries. In turn, industrial agglomeration further promotes port investment. However, risks arising from political and economic uncertainties in host countries, as well as fluctuations in international relations, have become increasingly prominent. Due to the differences in the types and levels of risks faced by port and industrial investments, port investment decisions have become more complex and uncertain. To address this issue, this study constructs a bi-level optimization model. The upper model (UM) aims to maximize the total investment profit by optimizing the scale of multiple port investments. The lower model (LM) employs a User Equilibrium (UE) framework to determine the spatial distribution of industries under equilibrium conditions. Using 14 countries along the MSR as a case study, this paper estimates the number of newly constructed berths in each country and the corresponding investment returns. It also finds that local wages and land prices tend to rise after investment. The findings provide valuable references for Chinese enterprises in making overseas investment decisions.

1. Introduction

As a strategic maritime pivot of the Belt and Road Initiative (BRI), the 21st Century MSR has established a composite cooperation framework between China and countries across Asia, Europe, and Africa through dual pathways of infrastructure connectivity and industrial synergy. This strategy innovatively adopts a “push–pull” coordination mechanism: On the one hand, investments in key infrastructure such as ports enhance the locational competitiveness of participating countries (“pull” effect) [1]; on the other hand, industrial capacity cooperation fosters endogenous growth momentum within the region (“push” effect). While existing research has explored BRI-driven port–industrial linkages, most studies adopt fragmented approaches that either examine geopolitical risks in isolation from financial risks or analyze operational risks separately from environmental factors. Current models demonstrate limited explanatory power due to their region-specific assumptions and inability to integrate multi-dimensional risk interactions. This study bridges these gaps through a globally applicable optimization framework that simultaneously quantifies four key risk dimensions (geopolitical, environmental, financial, operational) and translates theoretical outputs into actionable strategies, as demonstrated in our Vietnam case study, where the model improved investment decision-making compared to conventional methods. This thereby facilitates a systemic restructuring of regional economic structures [2].
As quantitatively demonstrated in Figure 1, according to the Statistical Bulletin of China’s Outward Foreign Direct Investment (2014–2023), China’s direct investment in countries along the Belt and Road has shown a significant upward trend from 2014 to 2023, increasing from USD 14.66 billion to USD 31.8 billion annually. Complementing this macroeconomic perspective, Table 1 provides granular case studies of specific port projects across different regions and time periods, creating a comprehensive view when analyzed in conjunction with Figure 1.
As illustrated in Figure 1, China’s direct investment in countries along the Belt and Road experienced sustained growth between 2014 and 2023, rising from USD 14.66 billion in 2014 to USD 31.8 billion in 2023. The cumulative investment over this decade reached USD 187.58 billion, positioning these countries as priority destinations for Chinese enterprises’ outbound investment. Notable progress has been made in China’s port investments along the BRI.
For example, the Port of Piraeus, Greece’s largest seaport, serves as a prominent case. In 2008, COSCO Group secured a 35-year concession for terminal operations for EUR 4.3 billion. In 2023, the port contributed approximately 1.56 percentage points to Greece’s GDP. Since COSCO took over, it has contributed more than EUR 1.4 billion to the local society, directly creating over 3000 jobs and indirectly creating over 10,000 jobs [3]. The improvement of port infrastructure has not only enhanced logistics efficiency and reduced transportation costs but also facilitated industrial development in host countries. Leveraging these advantages, Chinese enterprises have established additional production bases and R&D centers along the BRI corridor, advancing cross-border industrial deployment.
The China-funded Gwadar Port project has also yielded significant economic and social benefits. It has attracted 35 enterprises across sectors such as hospitality, finance, insurance, logistics, warehousing, grain and oil processing, fisheries, and agriculture. Among these, eight enterprises have commenced operations, with a total investment exceeding RMB 3 billion. Upon full operation, the project is expected to create over 2000 local jobs. Similarly, once the Kyaukpyu Port becomes fully operational, it is projected to provide 100,000 jobs in Myanmar. Within ten years of operation, around 90% of management positions are expected to be held by local personnel. Over the next 50 years, the port is anticipated to generate over USD 14 billion in tax revenue for the Myanmar government. Upon full operation of the associated industrial park, annual output is estimated to reach USD 3.2 billion, with a projected per capita GDP of USD 32,000 within the zone.
The development of these industries, in turn, has promoted increases in port cargo throughput and operational scale, thereby supporting the further optimization of port infrastructure and the sustainable growth of regional economies. This mutually reinforcing relationship between ports and industries serves as an important driver of economic development in countries along the route, forming a positive feedback loop akin to a “chicken-and-egg” dynamic [4]. It not only fuels maritime transport activity along the route but also advances industrial economic development in participating nations [5,6].
As shown in Table 1, the development of Chinese overseas port projects under the BRI has made considerable progress. World map analysis reveals that China’s overseas port investments form three strategic clusters: Southeast Asian maritime hubs positioned along the busiest shipping lanes, Mediterranean gateway ports serving as connectors between Europe and Asia, and African coastal terminals anchoring regional trade networks. This triangular geographical distribution creates a comprehensive coverage of key maritime trade routes while ensuring balanced risk exposure across different economic zones. Over the past decade, Chinese port and shipping enterprises have actively engaged in port cooperation and investment abroad, significantly contributing to the socioeconomic development of host countries and enhancing China’s international industrial capacity cooperation. Overseas port cooperation has become both a vital pillar of high-quality BRI development and a strategic foundation for China’s global industrial collaboration. Since 2012, China’s overseas port development has evolved from isolated projects to a globally oriented network layout, expanding from construction-focused engagement to include post-construction operations and management, and transitioning from regional concentration to broader global reach. Several of these projects have become exemplary models of Belt and Road cooperation.
However, as the scale of investment continues to expand, uncertainties in host countries’ political and economic environments—compounded by fluctuations in international relations—have significantly increased the risk of failure in infrastructure and industrial projects, potentially resulting in substantial economic losses. Representative cases illustrate this risk: the South China Sea dispute between China and the Philippines not only disrupted bilateral cooperation on power grid construction but also led to the indefinite suspension of the Mindanao railway project, despite the completion of preliminary designs and land acquisition [7]. Similarly, the Colombo Port City project in Sri Lanka was unilaterally halted in 2015 due to domestic legal disputes, incurring daily losses exceeding USD 380,000 until its partial resumption in 2017 with reduced usage rights (from permanent to a 99-year lease). This case highlights how shifting political and legal frameworks can erode investor confidence and alter contract terms [8]. Likewise, the interruption of the Port of Piraeus privatization process following Greece’s 2015 government transition underscores the vulnerability of infrastructure investments to geopolitical shifts, as policy reversals directly delayed project implementation and renegotiated stakeholder agreements [9].
It is worth noting that there are fundamental differences between port infrastructure investment and industrial investment in terms of service attributes and resource requirements. Port investments exhibit characteristics of public goods, while industrial investments are largely governed by market mechanisms. This difference leads to systemic differences in risk probability between the two types of investments. Additionally, the risks associated with port investments directly impact the cost of port investments, which in turn directly influence port investment decisions, whereas the risks associated with industrial investments directly impact industrial site selection, which in turn affects the spatial distribution of transportation demand and indirectly influences port investment demand.
Based on this understanding, the present study adopts a risk cost quantification approach to systematically explore optimal port investment strategies along the MSR, taking into full account the positive feedback loop between port supply and industrial transport demand.
To this end, a bi-level analytical framework is developed. The upper level employs a port investment optimization model that determines the optimal number of berths by maximizing investment profits. The lower level consists of a user equilibrium (UE) model that simulates freight flow distribution by capturing the full-chain cost between origins and destinations (OD), including land transport, maritime shipping, and production costs, incorporating investment risk costs. By capturing the dynamic changes between port supply capacity and industrial transportation demand through mutual feedback between upper and lower models, a basis for making scientific and reasonable decisions on the optimal investment scale is provided.

2. Literature Review

The literature relevant to this study primarily falls into two categories: research on port investment and research on industrial relocation.

2.1. Research on Port Investment

In the existing literature, port investment studies—both domestic and international—can be categorized into two main types. The first focuses on profit-oriented investment strategies, emphasizing optimization of investment strategies, scale planning, and location selection to maximize returns. The second centers on risk-oriented analyses, examining how various risk factors influence port investment decisions. We have compiled the literature review on port investments in Table 2.
Within the first category, Murillo and Henrique [10] employed ESG performance metrics and clustering analysis of international ports to support responsible investment decisions. They established a comparative importance matrix to identify optimal investment strategies for high-performing ports and conducted quantitative assessments of stakeholder demands in environmental, social, and governance dimensions. Zheng et al. [11] developed an economic model accounting for the fuzziness of disaster probabilities and the spillover externalities of cross-port adaptation, analyzing how regulation affects port investment strategies. Yang et al. [12] detailed the specialization of investment models adopted by Chinese state-owned enterprises in Africa, identifying the EPC + F + I model (Engineering, Procurement, Construction + Financing + Investment) and PPP as common strategies, and emphasized the need to align investment approaches with enterprise characteristics, host country development, and port attributes. Xia and Lindsey [13] explored the interdependence between optimal investment capacity and protection decisions, assessing how capacity, port charges, and timing influence both profitability and social welfare. Wang et al. [14] proposed a non-cooperative game model addressing port congestion, offering strategies for capacity expansion and investment stability under varying decision-making conditions.
A variety of multi-level models have also been proposed to support profit maximization through diversified investment strategies. Tan et al. [15] developed a bi-level model in which the government adjusts subsidies to encourage emissions reduction or improve profit margins, while port authorities determine the number of electric berths for profit maximization, forming a feedback loop. Zheng et al. [16] introduced a random-walk-based link prediction approach to prioritize port construction projects across various locations, considering economic, political, and regional cooperation factors. Quy [17] constructed a three-stage port investment optimization model: determining safety policy under external shocks, evaluating port performance across investment scenarios, and deriving optimal investment strategies through cost analysis. Zhao et al. [18] proposed a dynamic programming model for multi-period investment decision-making, incorporating port supply-demand balance, ecological carrying capacity, and profit-loss constraints. Chen and Yang [2] established a bi-level model where the upper level maximizes investment returns and decides port investment scale, feeding into a lower-level user equilibrium model aimed at minimizing industrial relocation costs, with feedback mechanisms in place. Chen et al. [4] considered the locational advantages of MSR countries and the dynamics between source and host countries, using a matching model at the lower level to simulate industrial-host selection and optimizing social benefits at the upper level. Kutulu [19] proposed a mixed-integer linear programming model with dual objectives—minimizing total empty container emissions and total costs—to optimize inland container logistics and dry port locations. Ma et al. [20] constructed a stochastic programming model using tabu-search-based simulation to determine optimal cold-chain terminal size, accounting for uncertainties in ship type and arrival time, as well as storage and handling requirements. Tu et al. [21] applied an integrated model combining OD cargo demand estimation and shipping network design to Indonesian ports, involving three interrelated sub-models: shipper route choice, carrier profit maximization, and government welfare optimization. Zheng et al. [16] ranked Southeast Asian port projects based on their contributions to the BRI and shipping networks using a link-prediction-based random-walk approach to ensure efficient, sustainable, policy-aligned investment. Wei and Dong [22] developed a bi-objective mixed-integer programming model solved via adaptive weighted Genetic Algorithm (GA) algorithms, aiming to minimize freight cost and time, thereby enhancing inland logistics and trade volumes. Yang et al. [23] built a bi-level planning model using COSCO data to demonstrate that under the BRI, shipping network improvements expanded liner profits and reduced shipper costs. Li et al. [24] formulated a two-stage mixed-integer model where the central government determines hub location and number, followed by carrier routing decisions to minimize total social costs, including hub construction, transport, and transshipment, using a population-based optimization algorithm. Results suggest hub construction under the BRI can reduce overall transport costs. Li et al. [25] investigated the impact of government subsidies and market low-carbon preferences on green technology investment decisions in ports and shipping companies, using a game-theoretic framework to reveal varying sensitivities in pricing, investment levels, and profits. Their findings indicate that ports are more responsive to government subsidies and low-carbon preferences, whereas shipping companies are more influenced by subsidies and cost-sharing ratios.
The second category of research focuses on risk factors in port investment. Wang et al. [26] used a two-period model to analyze port congestion and climate change risks, revealing that port authorities with different risk preferences adopt distinct prevention and adaptation strategies under budget constraints. Itoh and Zhang [27] examined disaster-resilience investments, showing that privatization can reduce shipper risk through risk-sharing, though investor priorities remain profit-driven. Gómez-Fuster and Jiménez [28] integrated game theory, analytic hierarchy process (AHP), and entropy weighting into a financial-economic risk evaluation framework, empirically validating it with the Cartagena Port in Spain. Whitman et al. [29] applied a dynamic risk dependency model and weighted multi-criteria decision analysis to evaluate terminal resource allocation strategies, demonstrating in the Port of Catoosa, Oklahoma, that this method effectively balances GDP contributions with decision-maker risk preferences. Wang et al. [30] used a two-stage game model under fuzzy conditions and asymmetric risk preferences to analyze competitive investment decisions between seaports and inland ports for conventional and unexpected risk prevention. Balliauw et al. [31] evaluated the scale, timing, and phased flexibility of port investment using real options under the background of multi-source uncertainty risks such as technological changes and market cyclicality and constructed a decision-making framework. The results show that this method is superior to static valuation and can have a positive effect on socio-economic impacts such as regional employment and connectivity by alleviating congestion, improving services, and reducing trade costs.

2.2. Research on Industrial Relocation

At the macroeconomic level, the existing literature on industrial relocation can be broadly categorized into two groups: studies on the determinants of industrial relocation and studies on the location selection of different types of facilities. We have compiled the literature review on industrial relocation into Table 3.
The first group of studies focuses on the shift from high-cost to low-cost regions. Lewin et al. [32] found through empirical analysis that the availability of skilled professionals is a critical determinant of offshore outsourcing location decisions, more so than the arbitrage potential from labor cost differentials. Wang et al. [33] employed a land use–transportation interaction model and a bi-level programming framework to systematically analyze how freight network investment policies affect industrial relocation patterns, showing that the sensitivity of location utility significantly moderates policy effectiveness. Zhang and Xu [34], using labor survey data from Spain and a difference-in-differences approach, confirmed that high-speed rail services promote employment growth in the service sector while reducing employment in agriculture and manufacturing. Yan et al. [35], based on panel data from 276 Chinese prefecture-level cities and an improved spatial difference-in-differences method, found that high-speed rail not only alleviated local labor misallocation but also generated significant spatial spillover effects. Hu et al. [36] constructed an index to measure the relative intensity of industrial relocation and used hotspot analysis to trace the spatial trajectory of China’s pollution-intensive industries (PIIs) from 2007 to 2016. Their results reveal that environmental regulations and regional resource endowments jointly drove the shift of PIIs from the eastern coastal region to central and western China. Tate et al. [37], in a study of 319 multinational firms, found that customer proximity, exchange rate volatility, labor costs, and transportation expenses jointly influence industrial location decisions and observed a trend of reshoring to the United States.
The second group of research deals with facility location selection across different types of infrastructure. Notably, Ghodratnama et al. [38] developed a hub location–allocation model that incorporates congestion factors and adopts a bi-objective approach to minimize total costs and total product waiting time. Numerical examples and sensitivity analyses validate the model’s effectiveness in optimizing production plans and highlight the influence of parameter changes on outcomes. Duan et al. [39] used a game-theoretic model to examine a supply chain comprising foreign manufacturers and local retailers, analyzing how tariffs and negative country-of-origin branding affect location strategies. The study found that higher tariffs may make overseas locations more favorable for foreign firms, challenging the conventional wisdom of offshoring high-end and localizing low-end production. Li et al. [40] applied a multi-objective optimization framework to address the facility location problem in geographically segmented supplier networks. Using Germany as a case study, they demonstrated that optimizing facility locations and market segmentation improves service to different market sizes and enhances inventory planning efficiency, ultimately improving overall supply chain performance. Sharma et al. [41] employed the Factor Rating Method (FRM), Analytic Hierarchy Process (AHP), and Best-Worst Method (BWM) to analyze manufacturing site selection. Using FRM, they identified key factors such as raw material availability, location, labor availability, transportation, utility accessibility, and environmental impact, with raw material availability receiving the highest weight.
Most existing studies on industrial location focus on cost minimization or utility maximization (i.e., profit maximization). These works generally assume that industries actively choose their preferred locations, while land providers are viewed as passive recipients. In reality, however, location selection is a multidimensional and dynamic process in which local governments also exercise agency by selectively attracting industries they believe will generate the greatest local benefit. To date, this dynamic interaction has received relatively limited attention in the industrial location literature. In summary, the two subsections of the literature review provide a testable framework: Port investments reduce transportation costs, thereby promoting industrial agglomeration and relocation toward host countries/regions. Conversely, this agglomeration effect enhances incentives for further port investments, creating a dynamic positive feedback loop.

3. Problem Description

3.1. Research Framework

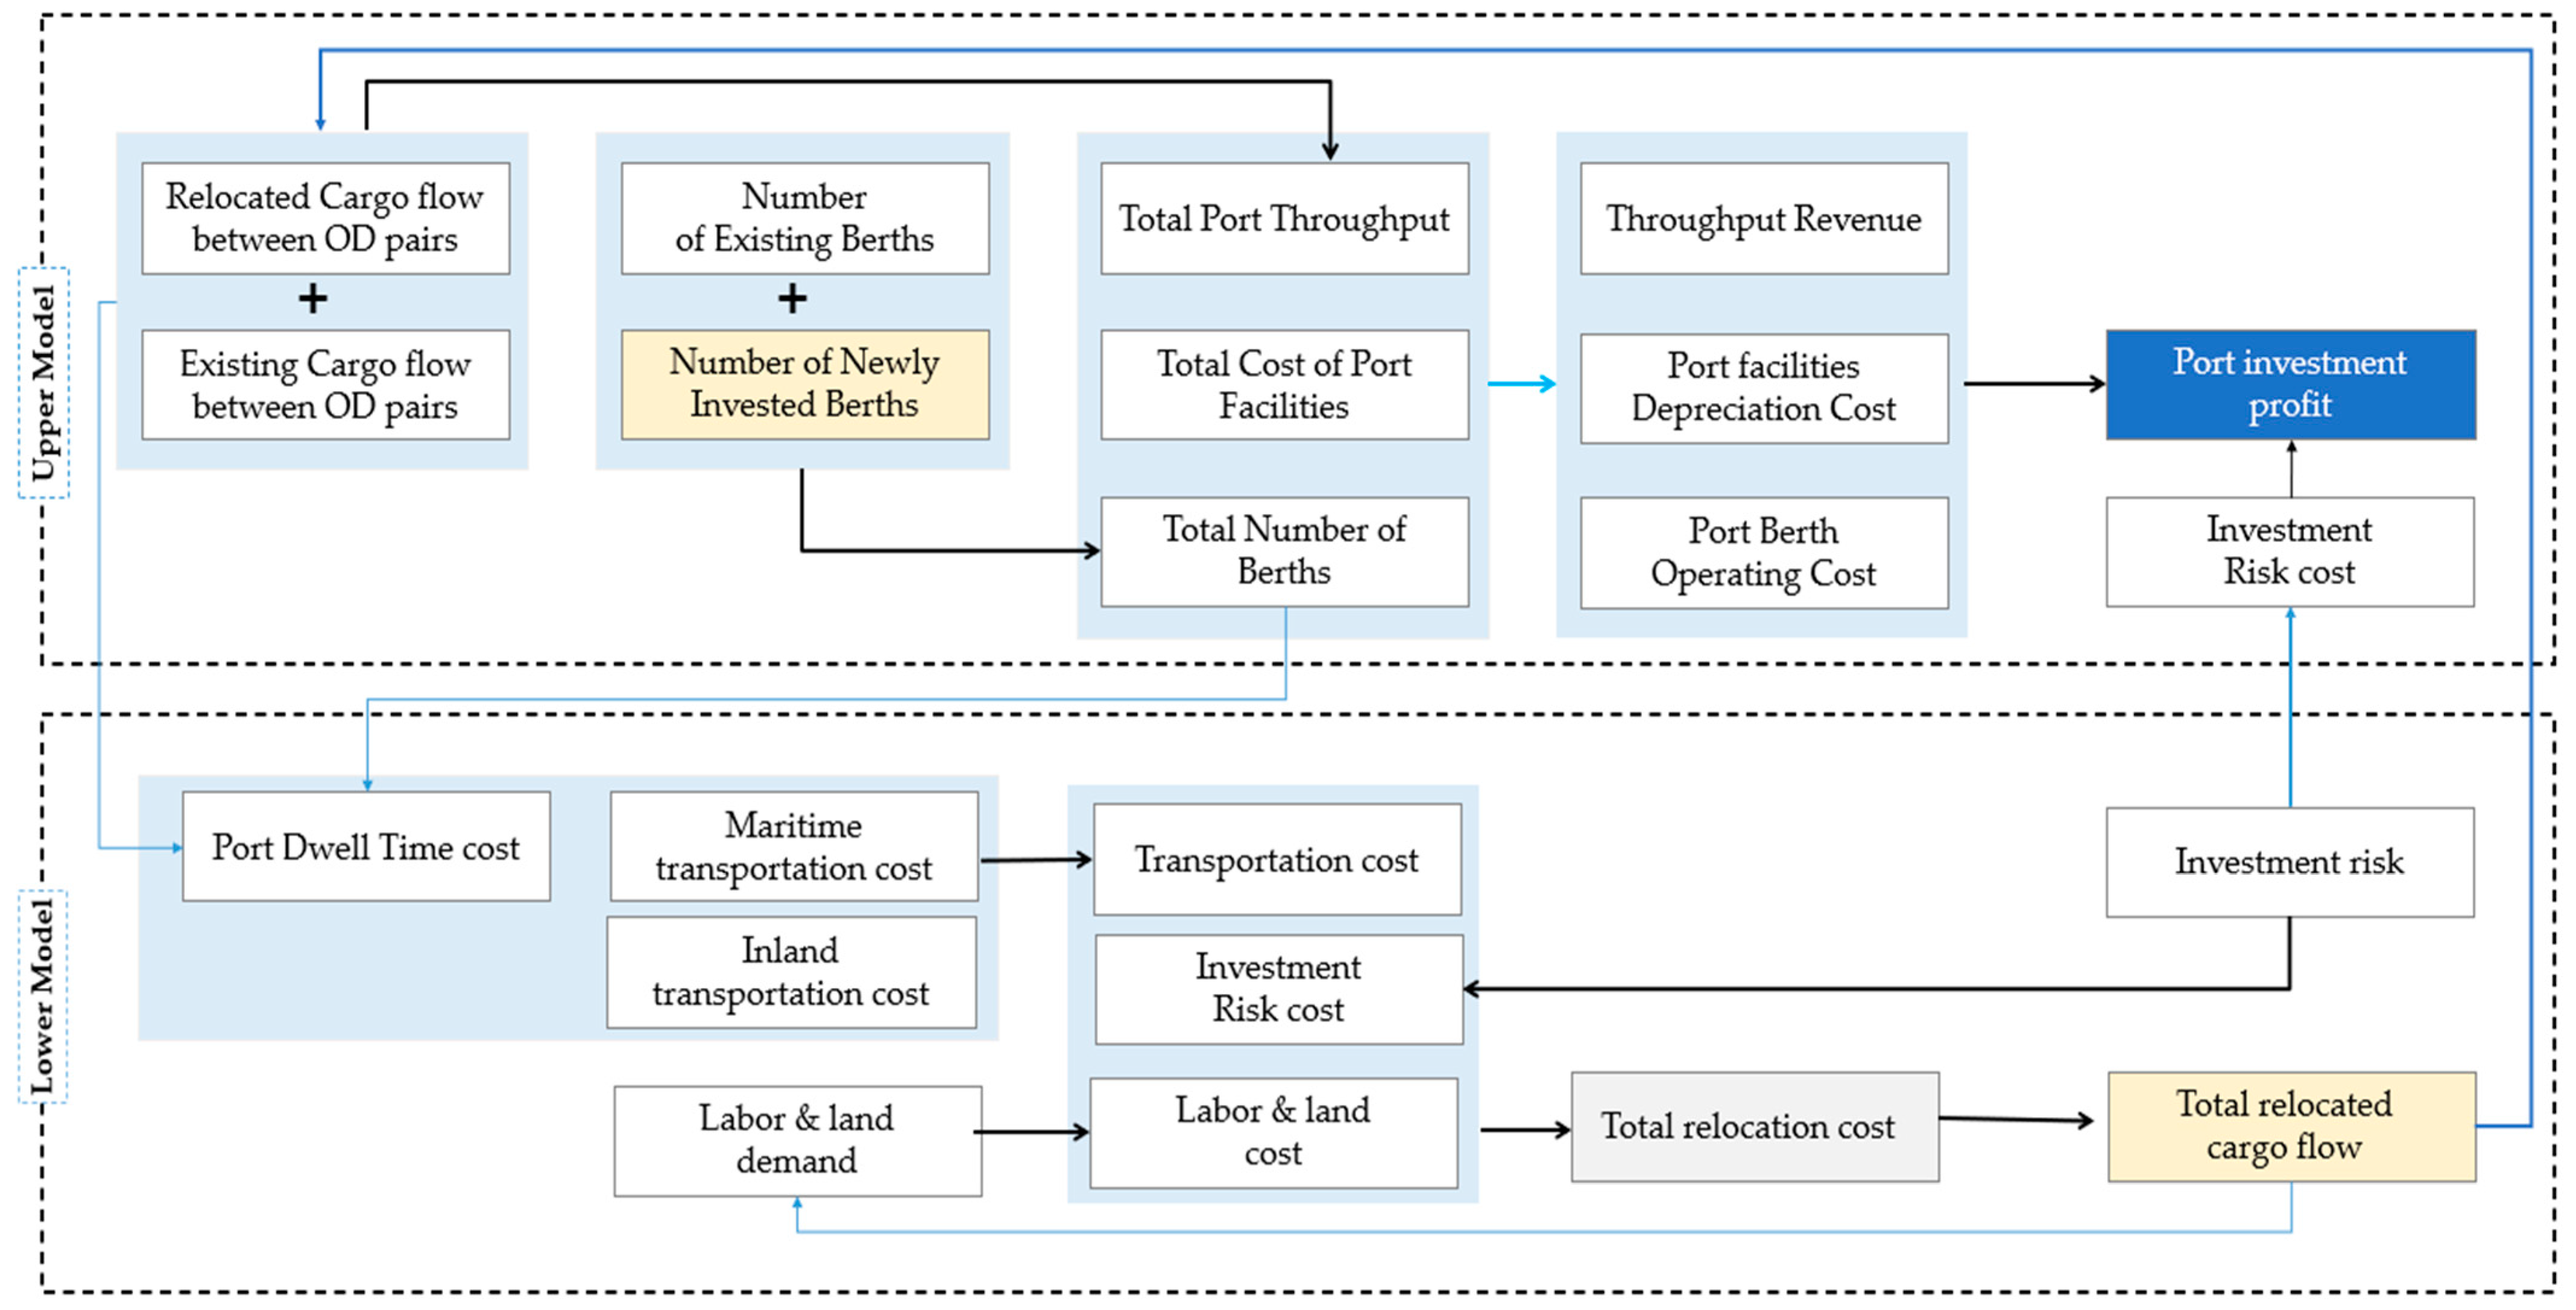
To estimate the returns from China’s port investments in countries along the MSR—within the context of evolving international relations—as well as the manufacturing costs faced by firms under investment-induced industrial relocation, several key factors are considered. These include the number of newly constructed ports, the scale of industrial relocation, tariff costs arising from international relations, investment balance costs between the two parties, and cultural distance costs. The logical framework of this study is illustrated in Figure 2. The proposed model adopts a bi-level structure: The upper-level model aims to maximize the profit from port investments, while the lower-level model employs a user equilibrium approach to determine the total scale of industrial relocation.
In the upper-level model, the decision-maker—representing the Chinese government—determines the number of newly constructed berths. By combining this with the existing berth capacity, the total port investment cost can be calculated. To account for investment risk associated with fluctuations in international relations, this study employs a binary logit regression model to estimate a risk probability function, thereby quantifying the expected investment risk cost.
In this study, ‘risk’ is conceptualized as its expected loss, expressed as the product of the probability of a risk event occurring and the magnitude of the consequent financial loss. The probability of risk occurrence is estimated using a binary logit model, while the financial impact is quantified according to the specific nature of each risk. The resulting risk cost is incorporated as a critical component into both the total port cost in the upper-level model and the path impedance function in the lower-level model.
Once the number of new berths is determined, this parameter is passed to the lower-level model. Port expansion yields positive effects by reducing cargo dwell time, thereby enhancing the attractiveness of port locations for industrial relocation. The resulting changes in freight flows, driven by relocated industries, are then fed back into the upper-level model.
In the lower-level model, as the scale of industry relocation to MSR countries expands, the demand for labor and land factors increases, driving up corresponding factor prices. During the relocation process, investment risk directly affects relocation costs and freight flows: Low investment risk reduces international relocation costs, while high risk raises these costs or may even result in relocation failure. The user equilibrium model is used to calculate the total freight flow along relocation paths. By aggregating the product of flow volumes and unit costs across all network links, the total relocation cost borne by the relocating firms—the decision-makers in the lower-level model—is obtained.
The total OD flows derived in the lower-level model are fed back into the upper-level model to calculate the total port throughput and influence the relocated cargo flow between OD pairs in the upper-level model, which is then used to determine the port’s gross profit.

3.2. Networks and Collections

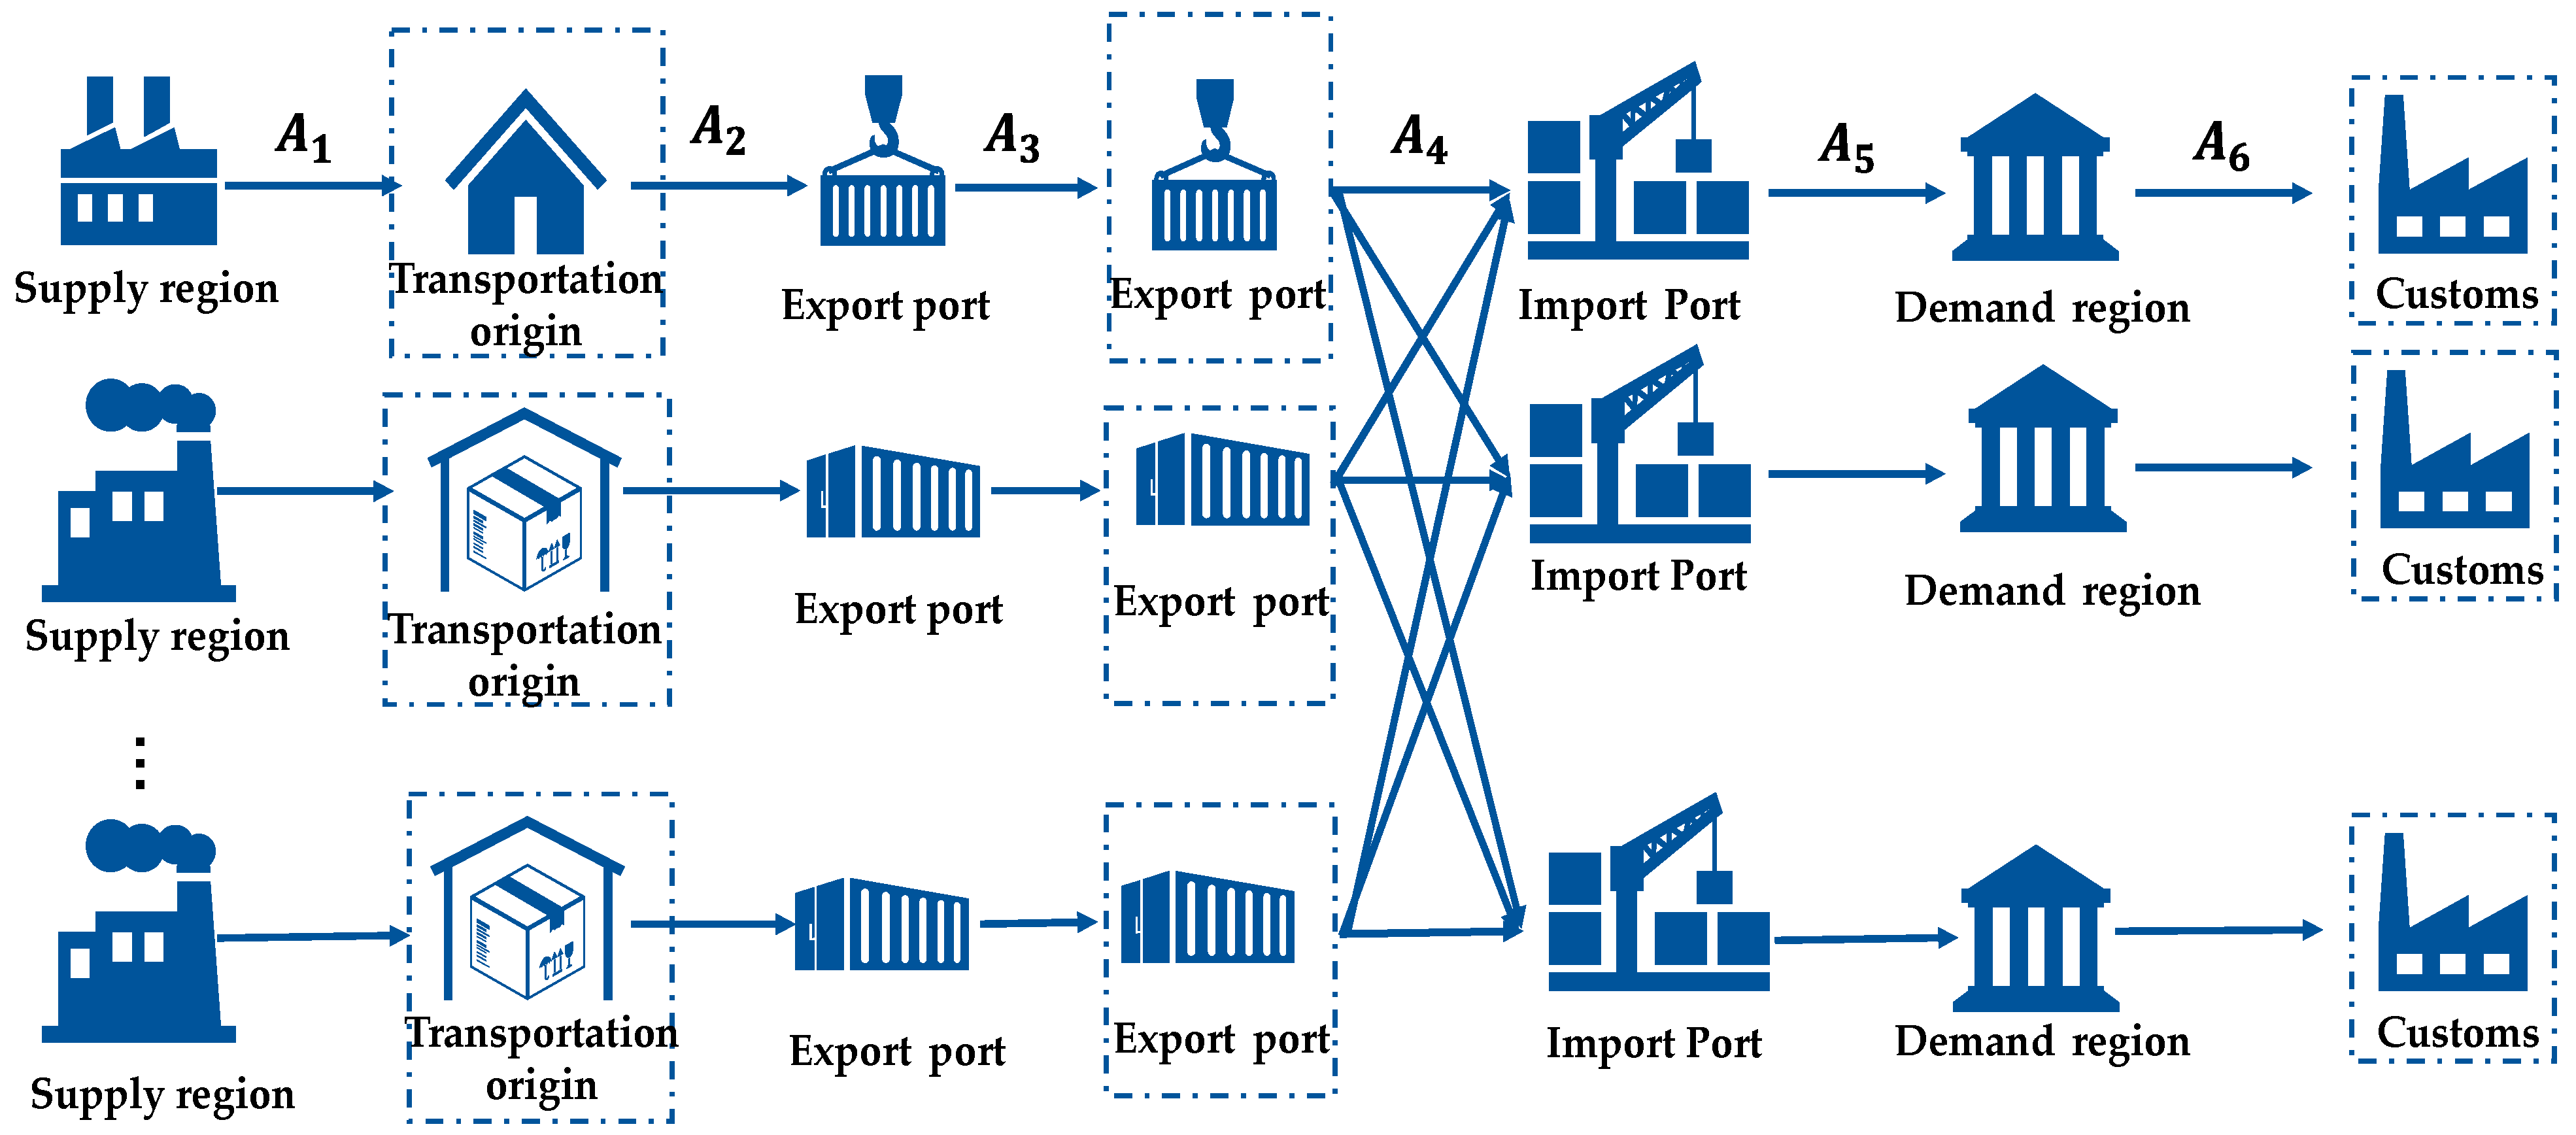
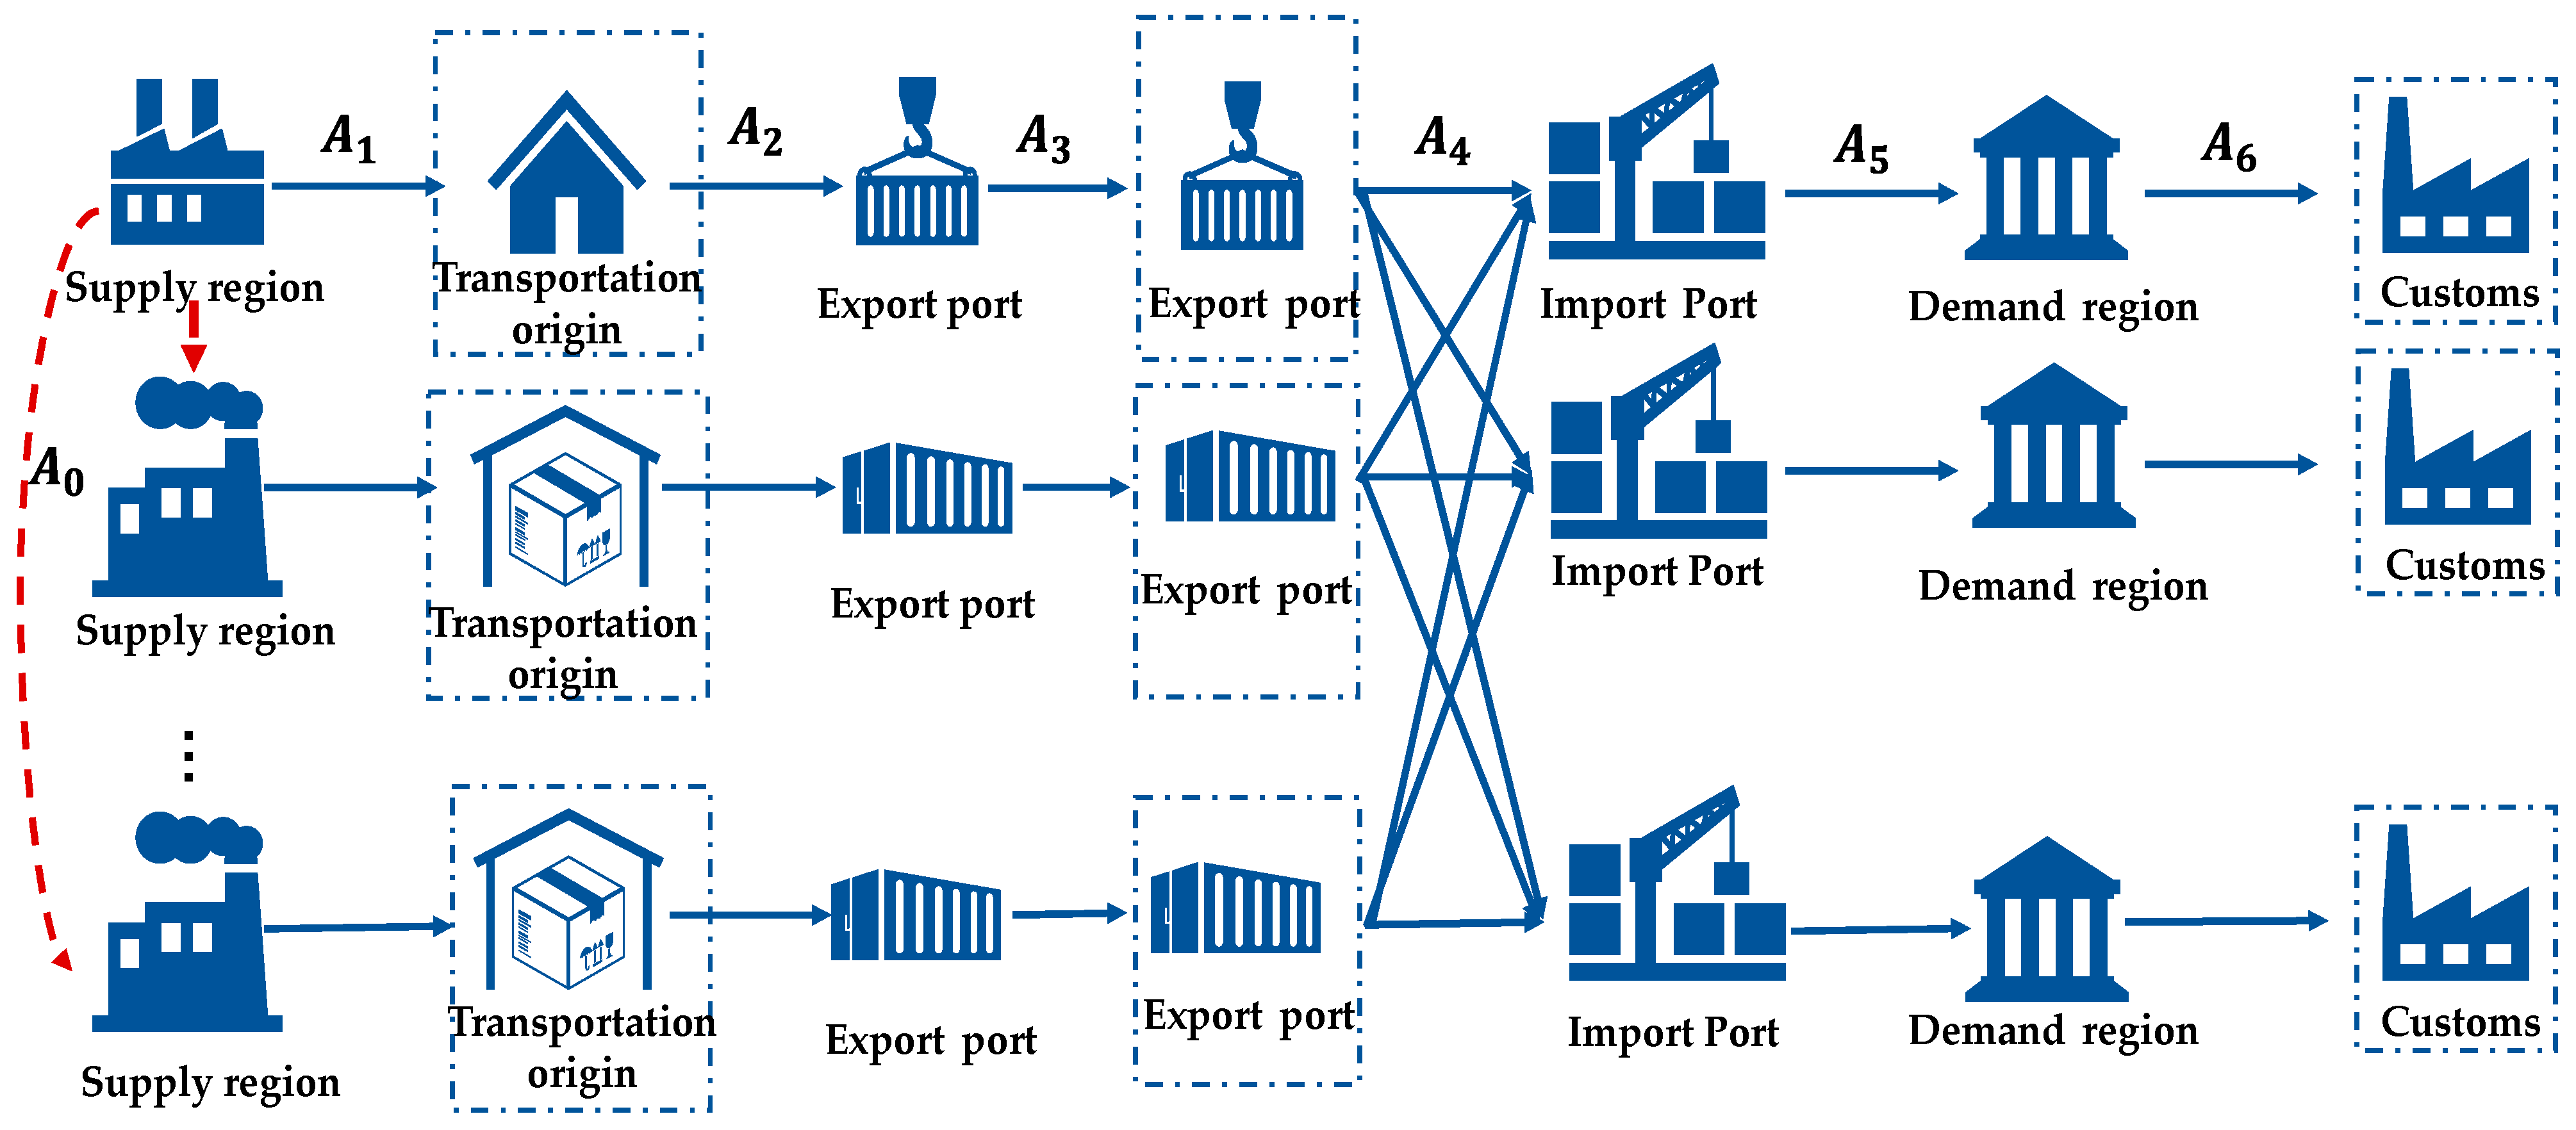
To capture the impact of port investment on industrial relocation and freight flow distribution, this study constructs two types of transportation network models: a “baseline network without industrial relocation” and an “extended network incorporating industrial relocation”. To more precisely represent production and transportation costs within the network, nodes representing production regions and ports are split into “actual nodes” and “virtual nodes” (as illustrated by the dashed-line boxes in Figure 3 and Figure 4). The links connecting actual and virtual nodes denote respective impedance values—representing regional production costs and port-related costs.
As shown in Figure 3, the network consists of two node types: Supply Regions (e.g., China, Vietnam) and Export Ports (e.g., Shanghai Port, Ho Chi Minh Port). And arrows are the links in the network. In the absence of industrial relocation, the production and transportation chain is abstracted into a set of links, each associated with specific impedance functions:
“Link set A1”: Represents production processes; impedance includes land cost, labor cost, and taxation;
“Link set A2”: Represents inland transportation; impedance includes transport cost and time;
“Link set A3”: Represents port operations; impedance includes port charges and dwell time;
“Link set A4”: Represents maritime shipping; impedance includes ocean freight cost and transit time;
“Link set A5”: Represents tariff and cultural distance costs [42], capturing geopolitical friction;
“Link set A6”: Represents cargo unloading and inland transport at the destination; impedance includes unloading fees, port time, and inland delivery costs.
When industrial relocation is considered, the network shown in Figure 3 is expanded into the configuration in Figure 4. A new “virtual link set A0” is introduced to represent the process of industrial relocation. The impedance associated with links in A0 reflects the “cost of industrial relocation”, which incorporates risks associated with investment uncertainty. In this model, the A0 link impedance quantifies the costs incurred during the industrial relocation process driven by port investment.

4. Model Building

The model features two distinct decision-makers, forming a hierarchical structure. In the “upper-level model”, the “government acts as the leader”, making strategic decisions regarding port investment. In the “lower-level model”, “enterprises serve as followers”, responding to government decisions by optimizing their industrial relocation behavior. This constitutes a “bi-level modeling framework”.
The bi-level modeling framework constructed in this paper explores the dynamic and endogenous feedback relationship between port capacity expansion and industrial spatial distribution. Meanwhile, it incorporates differentiated risks associated with port infrastructure and industrial transfer, which helps optimize port investment strategies along the Maritime Silk Road. These strategies can not only align with the needs of industrial transfer but also address the superimposed impact of the two types of risks.
The “upper-level model” is formulated as an “integer programming problem”, where the government seeks to maximize overall investment returns by determining optimal port expansion strategies (e.g., number of berths). The “lower-level model” adopts a “user equilibrium (UE) framework”, in which enterprises allocate freight flows and production activities across the network to minimize their generalized costs, subject to the conditions established by the upper-level decisions.
Our research employs a bi-level structure because its theoretical core aligns closely with the principal–agent game relationship between “government and enterprise” central to this study.
  • Compared to simple integrated optimization: The upper-level and lower-level models correspond to the decisions of different stakeholders, respectively, and these distinct decisions themselves are inherently suitable for the bi-level structure. In contrast, simple integrated optimization relies on a single objective function, which fails to capture the independent decision-making of the upper and lower levels and also cannot reflect the interactive relationships between the two decision-makers.
  • Compared to agent-based modeling (ABM): ABM excels at simulating the “emergence” of micro-level heterogeneity, but its results are statistical and often struggle to converge to the specific macro-level Nash equilibrium that is the focus of our study. The bi-level structure, through the user equilibrium condition at the lower level, allows for an analytical solution to this equilibrium state, avoiding the uncertainty and complexity associated with the extensive parameter calibration required in ABM.
In summary, the bi-level structure is the superior choice for this study due to its theoretical relevance in describing sequential decision-making games and its mathematical rigor.

4.1. Upper-Level Model

The objective of the upper-level model is to maximize port investment returns. Accordingly, the objective function can be expressed as Equation (1):
m a x Z 1 = x p p + x ^ j × p f p p c f c × N Q 1 + N Q 0 C / T C L   ( p P j , p P j )
Specifically, x ^ j denotes the original throughput capacity of the port in country j; x p p represents the freight flow between origin–destination (OD) pairs; p f p indicates the average revenue per container handled at the port p; pc denotes the variable cost per container; fc represents the annual average maintenance cost per container berth; N Q 1 is the decision variable, representing the number of newly constructed container berths; N Q 0 denotes the original number of berths; C represents the total investment cost for berth construction and supporting facilities; T denotes the investment payback period; and CL represents the risk cost associated with port investment.
This equation is designed to maximize the annual net income from port investment. Essentially, it represents the difference between total revenue and total cost and is specifically composed of the following four parts:
  • Gross operating profit: ( x p p + x ^ j ) × ( p f p p c ) . It represents the gross profit from the operating income generated by the new and existing throughput after deducting variable costs.
  • Facility maintenance cost: f c × ( N Q 1 + N Q 0 ) . It refers to the annual fixed cost incurred to maintain the normal operation of all berths (including newly built and existing ones).
  • Amortization of investment capital: C/T. It represents the annual allocation cost of the total initial investment capital for port construction during the payback period.
  • Risk cost: CL. This is a key item, representing the expected loss of investment risk calculated by the binary logit model and is used to quantify the potential economic consequences of uncertain factors such as international relations.
In summary, this function quantitatively measures operating income, rigid costs, and risk premiums to comprehensively calculate the expected annual net income achievable from port investment. The decision-making objective is to maximize this value.
Equation (1) represents the maximization of port investment returns.
N Q 1 + N Q 0 N Q
N Q 1 Q *
Specifically, due to constraints such as shoreline availability, NQ denotes the maximum number of berths that can be constructed. Equation (3) defines the non-negative integer constraint for the number of berths.
C = h c × N Q 1
Specifically, hc denotes the average cost of constructing each container berth and its associated supporting facilities.
In addition, the investment risk probability function constructed in this study is a comprehensive indicator. It not only encompasses basic economic and operational risks but also takes into account higher-order political risks such as the risk of institutional expropriation and the risk of geopolitical conflicts.
These factors collectively act on the calculation of the investment safety probability and are ultimately comprehensively reflected in the risk cost CL. Within the macro-analysis framework focused on in this study, the aforementioned risks exist as general background risks of the investment environment, and their impacts have been included in the overall risk premium. Given that the core objective of this paper is to reveal the linkage mechanism between the two core variables of port investment and industrial transfer, rather than decomposing and measuring the political risks themselves, they are not listed as independent variables in the model. However, we acknowledge the importance of these risks.

4.2. Lower-Level Model

The lower level is formulated as a user equilibrium (UE) model, with Equations (5)–(8) representing the standard form of the UE framework.
m i n   Z 2 = a 0 x a t c a w d w       ( a A )
k f i j k = q i j ,   i , j
f i j k 0 ,   i , j
x a = i j k f i j k δ i j k , a
Specifically, t c a denotes the impedance (generalized cost) on link a; f i j k represents the flow on path k between country i and country j; q i j denotes the total flow between origin i and destination j; x a indicates the total flow on link a; and δ i j k is a binary variable used to determine whether link a is included in path k between i and j. In the context of industrial relocation, this variable also identifies whether the manufactured products from a given supply option to a demand point pass through link a in the virtual (augmented) network.
In the super network, the impedance functions of each link are defined by Equations (9)–(13).
t c ( x a ) = i ( t p i × p v + h p i × n h + l p i × n s ) δ a i , a A 1
t c ( x a ) = i p { [ ω i p × ( f r r o a d × d i p r o a d + α × d i p r o a d / v r o a d ) + ( 1 ω i p ) × ( f b r a i l w a y + f r r a i l w a y × d i p r a i l w a y + α × d i p r a i l w a y / v r a i l w a y ) ] }
t c ( x a ) = γ s c a
t c ( x a ) = p j f r p j s h i p p i n g + α × d p j s h i p p i n g / v s h i p p i n g
t c ( x a ) = τ × C i j
Specifically, Equation (9) represents the production cost in the host country. This equation quantifies the total cost required to produce one twenty-foot equivalent unit (TEU) of goods by summing up cost items across production stages; t p i denotes tax rate at origin; p v p v denotes unit value of containerized products (USD/TEU); h p i denotes daily wage level at origin (USD/person/day); n h denotes labor required to produce one TEU of goods (persons); l p i denotes land cost at origin (USD/m2); and ns denotes land area required to produce one TEU of goods. Equation (10) describes the inland transportation cost structure from the production origin to the port. This formula takes into account the cost composition and modal share (represented by the parameter ω i p , which denotes the share of highway transport from origin i to port p) of both highway and railway transportation modes. The cost of highway transport includes distance-based freight rates and time cost, while railway transport cost comprises a base fee, distance-based freight charges, and time cost. Specifically, f r r o a d denotes highway freight rate (USD/km/TEU); f r r a i l w a y denotes railway freight rate (USD/km/TEU); α denotes value of time (USD/hour/TEU); d i p r o a d denotes road distance from origin i to port p; d i p r a i l w a y denotes rail distance from origin i to port p; v r o a d denotes average highway speed; and v r a i l w a y denotes average railway speed. Equation (11) denotes the port cost, including container handling fees, waiting time costs, and port congestion costs; γ denotes capacity; denotes capacity of port; and s c a denotes cargo throughput of port. Equation (12) denotes maritime transportation cost. Equation (13) denotes industrial investment risk cost; τ denotes probability of industrial investment risk; and C i j denotes total investment amount of the industrial project.
The GDP, wage level, and land price after relocation are defined in Equations (14)–(16), respectively.
G D P i = a x a × p f + x a × p v × κ / ( 1 κ ) + 1 + G D P i 0
h p i = φ i × G D P i 0
l p i = η i × G D P i 0
Specifically, G D P i denotes the GDP of country i after relocation; κ represents the marginal propensity to consume; G D P i 0 denotes the GDP before investment; h p i indicates the wage level after relocation; ϕ i is the coefficient linking wage to GDP; Δ G D P i denotes the change in GDP before and after investment; l p i ±indicates the land price after relocation; and η i is the coefficient relating land price to GDP. All parameters used in this paper and their meanings are presented in the form of a table in Appendix A.

4.3. Algorithm Design

The model proposed in this study is modeled as a bi-level programming problem. The non-convexity of this problem makes it extremely challenging to obtain an exact solution. Existing research [43] has proven the effectiveness of GA in solving two-layer models. Therefore, this paper uses GA to solve the bi-level model. In our research, the upper-level model evaluates the fitness of different investment strategies, while the lower-level model—formulated as a Beckmann transformation—is solved using the classical Frank–Wolfe algorithm. The GA iteratively invokes the Frank–Wolfe method, enabling interaction and feedback between the upper and lower layers of the model. The formulation of the GA is intrinsically aligned with the logical architecture of the bi-level framework proposed in this study. Within this structure, the GA operates on an encoding scheme that represents a critical decision variable: The number of port berths allocated across the 14 countries under consideration. Specifically, the GA simulates the evolutionary process observed in nature, incorporating selection, crossover, and mutation operations to search for the optimal solution.
The fundamental objective of the GA, within the upper-level model, is to intelligently explore the solution space to identify the configuration of newly constructed berths that maximizes overall profit. Each candidate solution generated by the GA—representing a specific set of berth construction values (encoded as an “individual” or “chromosome”)—is evaluated by invoking the lower-level model to assess its optimality.
GA-Based Solution Method: The GA, inspired by biological evolution, is a heuristic optimization technique that performs search and computation based on principles such as natural selection and survival of the fittest. The detailed steps are as follows:
Step 1: Set the population size N and randomly generate N individuals to form the initial population. Each individual is represented as a chromosome composed of multiple genes, encoded using a suitable scheme. The population size N should be appropriately selected: A size too large increases the computational burden, while a size too small may require more iterations to converge.
Step 2: Calculate the fitness value of each individual in the population. The fitness function is typically related to the objective function; it may be the value of the objective function or its reciprocal. In this case, since the goal is to maximize port revenue, the objective function can be directly used as the fitness function. In our study, the GA proposes a trial value for berth construction, which is subsequently input into the lower-level user equilibrium model. Utilizing the Frank–Wolfe algorithm, the lower-level model computes the corresponding equilibrium state of industrial relocation. The lower model then derives the aggregate freight Origin–Destination (OD) flow and returns it to the upper-level model. The upper-level model employs the feedback to compute the total profit attributable to the investment strategy. This profit metric serves as the fitness measure for the individual within the GA.
Step 3: Select a subset of individuals from the population as parents for the next generation based on their fitness values. The selection process usually employs a roulette wheel strategy, assigning selection probabilities proportional to fitness and sampling parents accordingly.
Step 4: Apply crossover and mutation operations to the population with predefined probabilities and select N individuals according to defined rules to form the next generation. A higher profit corresponds to greater fitness, thereby increasing the probability that the strategy will be retained and propagated through subsequent generations via selection, crossover, and mutation operations.
Step 5: Check whether the termination condition is met. If so, terminate the computation; otherwise, return to Step 2. Through repeated cycles of population evolution, the GA iteratively generates and refines new investment strategies. Each iteration involves a full evaluation cycle through the bi-level framework, enabling the algorithm to converge asymptotically toward an optimal investment policy.
Parameter Design: Crossover and mutation are critical operators in GA for identifying optimal individuals. Crossover exchanges genetic material between two fit individuals, potentially creating better offspring and preserving essential traits. Mutation involves randomly altering certain genes in a chromosome, simulating natural random variation. Though the mutation probability is usually low, it prevents premature convergence and enhances result accuracy.
The crossover rate and mutation rate significantly influence model performance. Typically, a higher crossover rate is chosen, ranging from 0.5 to 1.0, while a lower mutation rate is preferred, generally between 0.001 and 0.05. Based on the characteristics of the model and chromosome encoding, the GA parameters used in this study are shown in Table 4, the crossover rate popc = 0.9, and the mutation rate popm = 0.01 [40]. Additional parameters, determined through preliminary experiments, include a population of 30 chromosomes and a maximum of 500 iterations [2,11]. All algorithm development and implementation were carried out using Python 3.11.
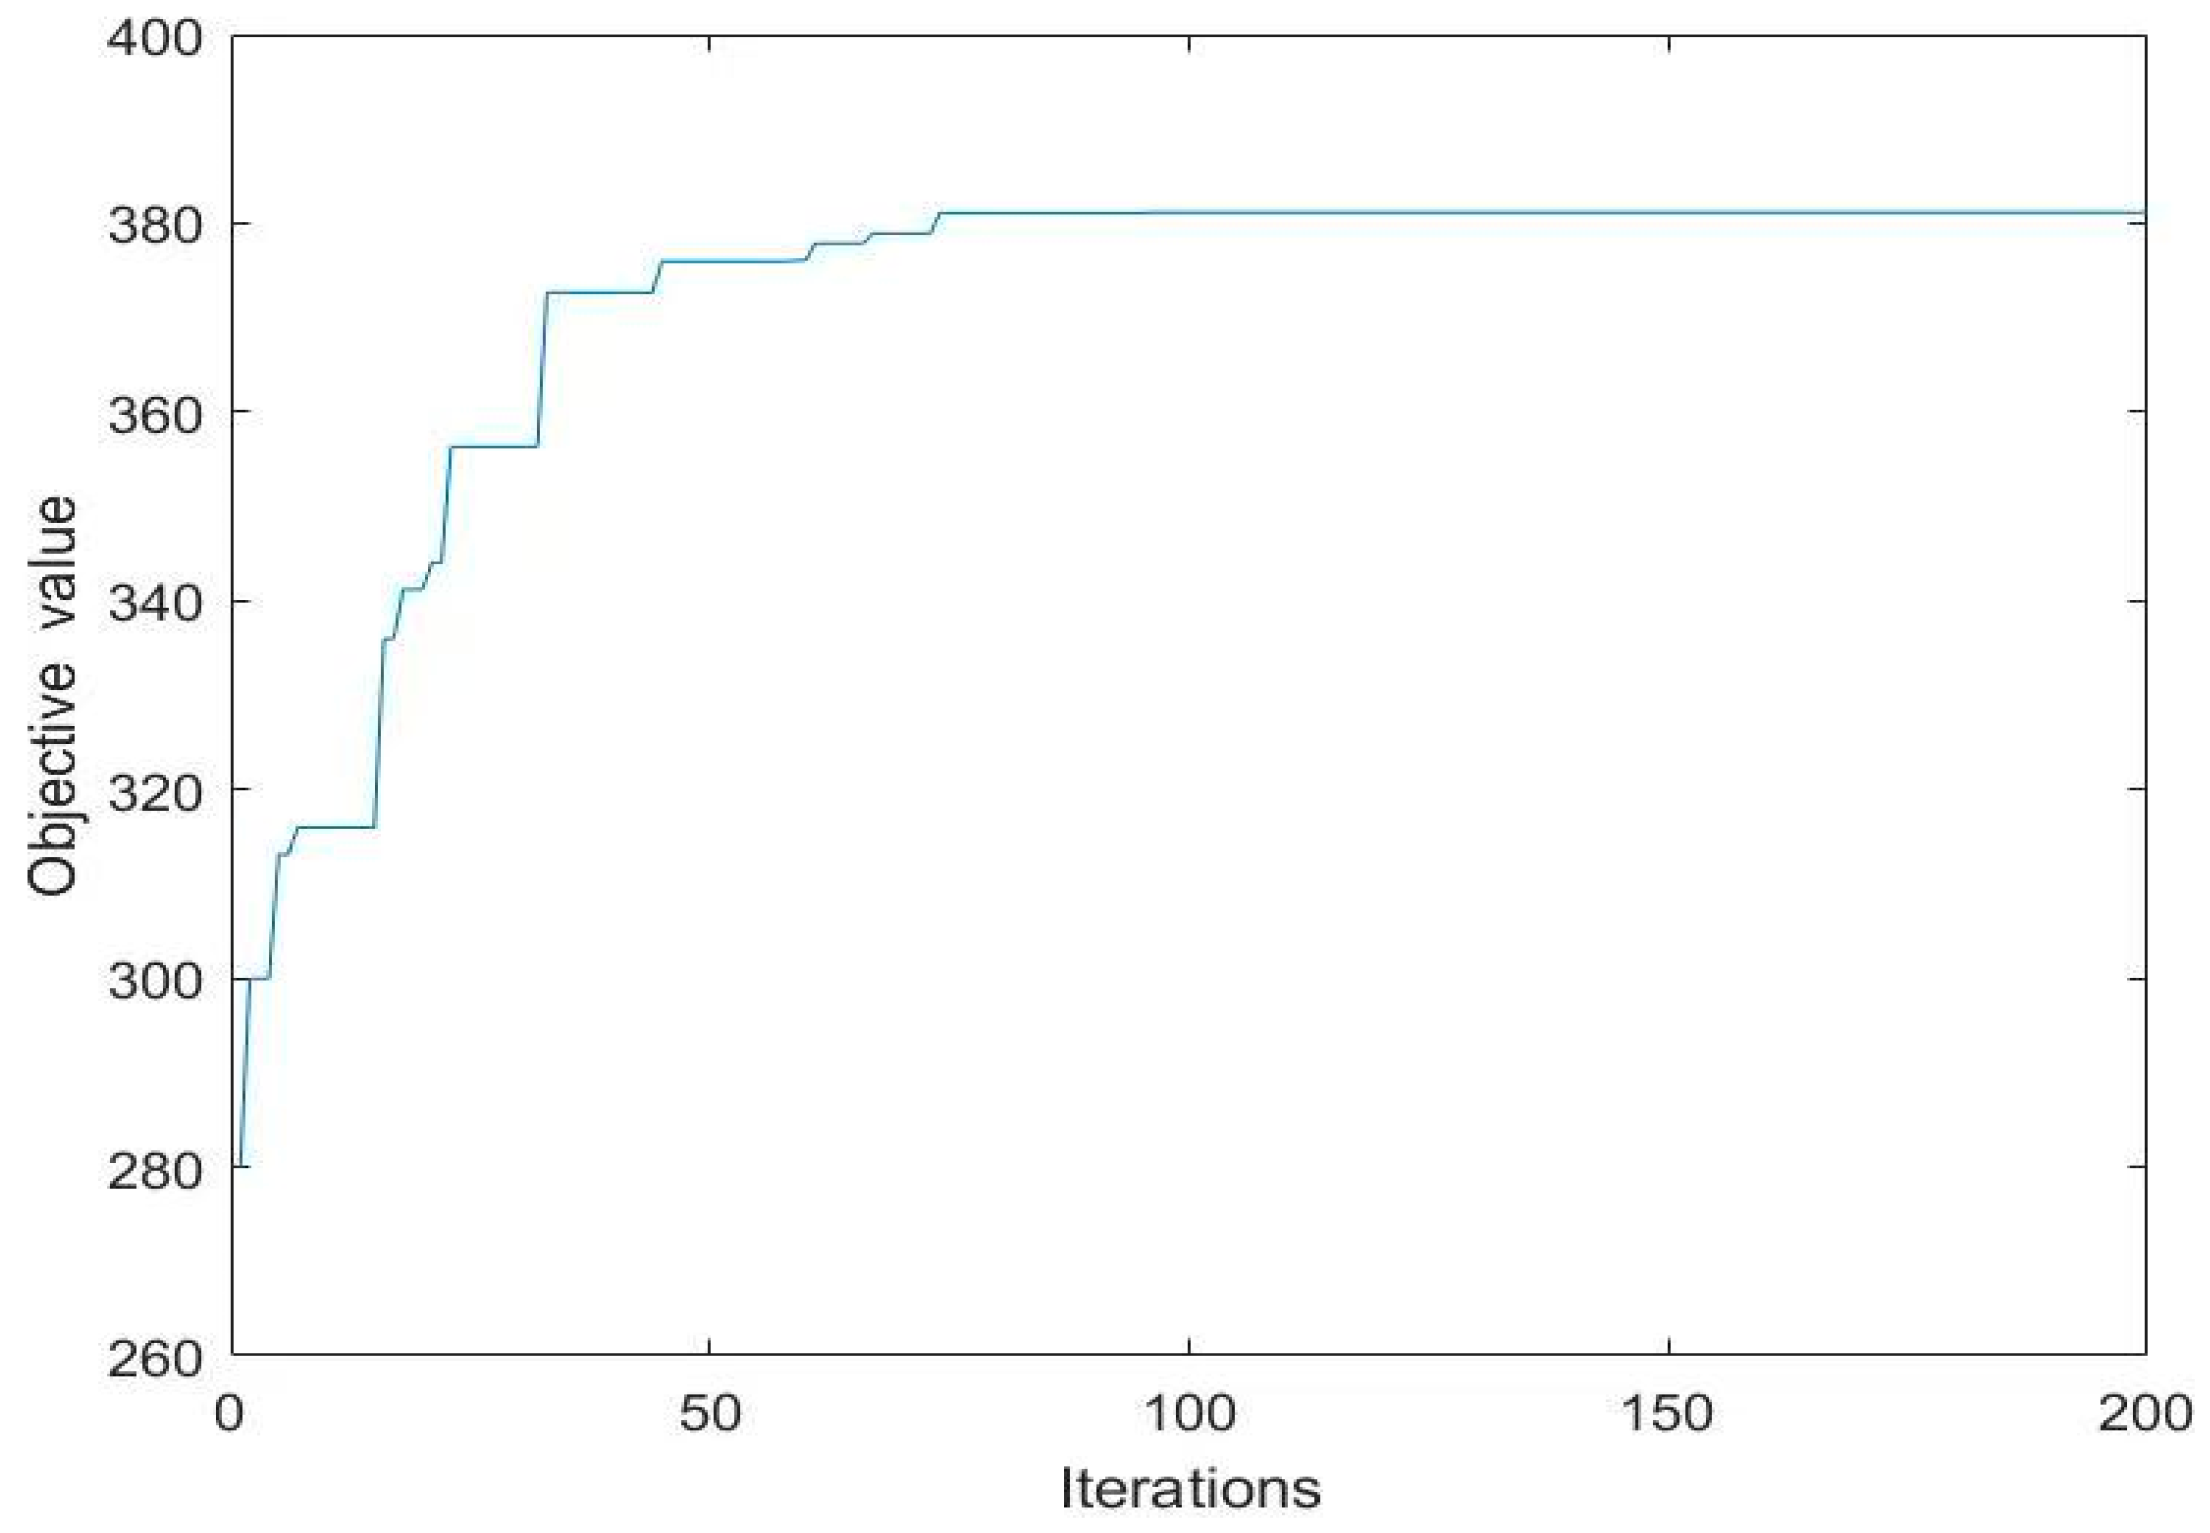
After 500 iterations, we obtained the convergence graph of the GA. To clearly show the convergence process of the iteration curve, we have extracted the first 200 iterations, as shown in Figure 5.
As can be seen from Figure 5, the algorithm exhibits a good convergence trend. The resulting port investment plan and industrial transfer scale analysis are presented in Section 5.2.1 and Section 5.2.2, respectively.

5. Case Study

5.1. Data Sources

This study selects 14 countries as supply regions, including ten from Southeast Asia—(1) the Philippines, (2) Brunei, (3) Indonesia, (4) Vietnam, (5) Cambodia, (6) Laos, (7) Thailand, (8) Singapore, (9) Malaysia, and (10) Myanmar—and four from South Asia—(11) Bangladesh, (12) Sri Lanka, (13) India, and (14) Pakistan. In addition, six continents—North America, South America, Europe, Africa, East Asia, and Oceania—are designated as demand regions. China is also included as a potential source of industrial relocation and is treated as an additional supply region. Key data for the selected countries are derived from the ‘’Guidelines for Country and Regional Foreign Investment Cooperation (2023 Edition)’ jointly published by the Ministry of Commerce of China and other relevant departments [44,45], as shown in Table 5.
Global trade is divided into six intercontinental regions: Europe, Asia, North America, South America, Oceania, and Africa. For each region, the largest port by cargo volume is selected as the designated unloading port—namely, the Port of Rotterdam (Europe), the Port of Shanghai (Asia), the Port of Los Angeles (North America), the Port of Rio de Janeiro (South America), the Port of Sydney (Oceania), and the Port of Alexandria (Africa). Current trade volumes between China and the host countries within various global regions are presented in Table 6. These data serve as a basis for estimating the original demand levels between China, the host countries, and different parts of the world.
“China” represents the baseline domestic origin point in the relocation analysis, serving as a reference for comparing the allocation of TEUs between domestic and overseas ports. The values correspond to the change in TEUs for each port after running the optimization model described in Section 5.2.2. These changes reflect the model’s reallocation of cargo flows based on transport costs, port handling capacities, and aggregated risk scores.
In addition, the initial number of berths at the 14 selected host country ports is presented in Table 7.
Table 7 reflects the scale of port infrastructure across the selected host countries. Among them, the Port of Singapore ranks first with 54 berths, underscoring its role as a regional maritime hub. India’s Mundra Port, with 42 berths, also demonstrates the considerable capacity of Indian port infrastructure. In contrast, Brunei’s Muara Port and Laos’s Vientiane Port have only three berths each, reflecting the geographical constraints and developmental stages of port facilities in these countries. Other key ports listed in the table include the Port of Manila in the Philippines and the Port of Jakarta in Indonesia. Overall, the Port of Singapore and India’s Mundra Port stand out in terms of berth count, indicating significant investment in port development and relatively high cargo handling capacity.
Finally, project success and failure are treated as dependent variables. We utilize data from the China Global Investment Tracker (CGIT), which provides information on Chinese investment in overseas countries across both construction and non-construction sectors during the period from 2012 to 2021. To maintain consistency in the dataset, investments are classified into two categories: infrastructure investments (including hydro, rail, and general construction) and industrial investments (including sectors such as aviation, automotive, manufacturing, and textiles).

5.2. Optimization Result Analysis

5.2.1. Port Investment Plan

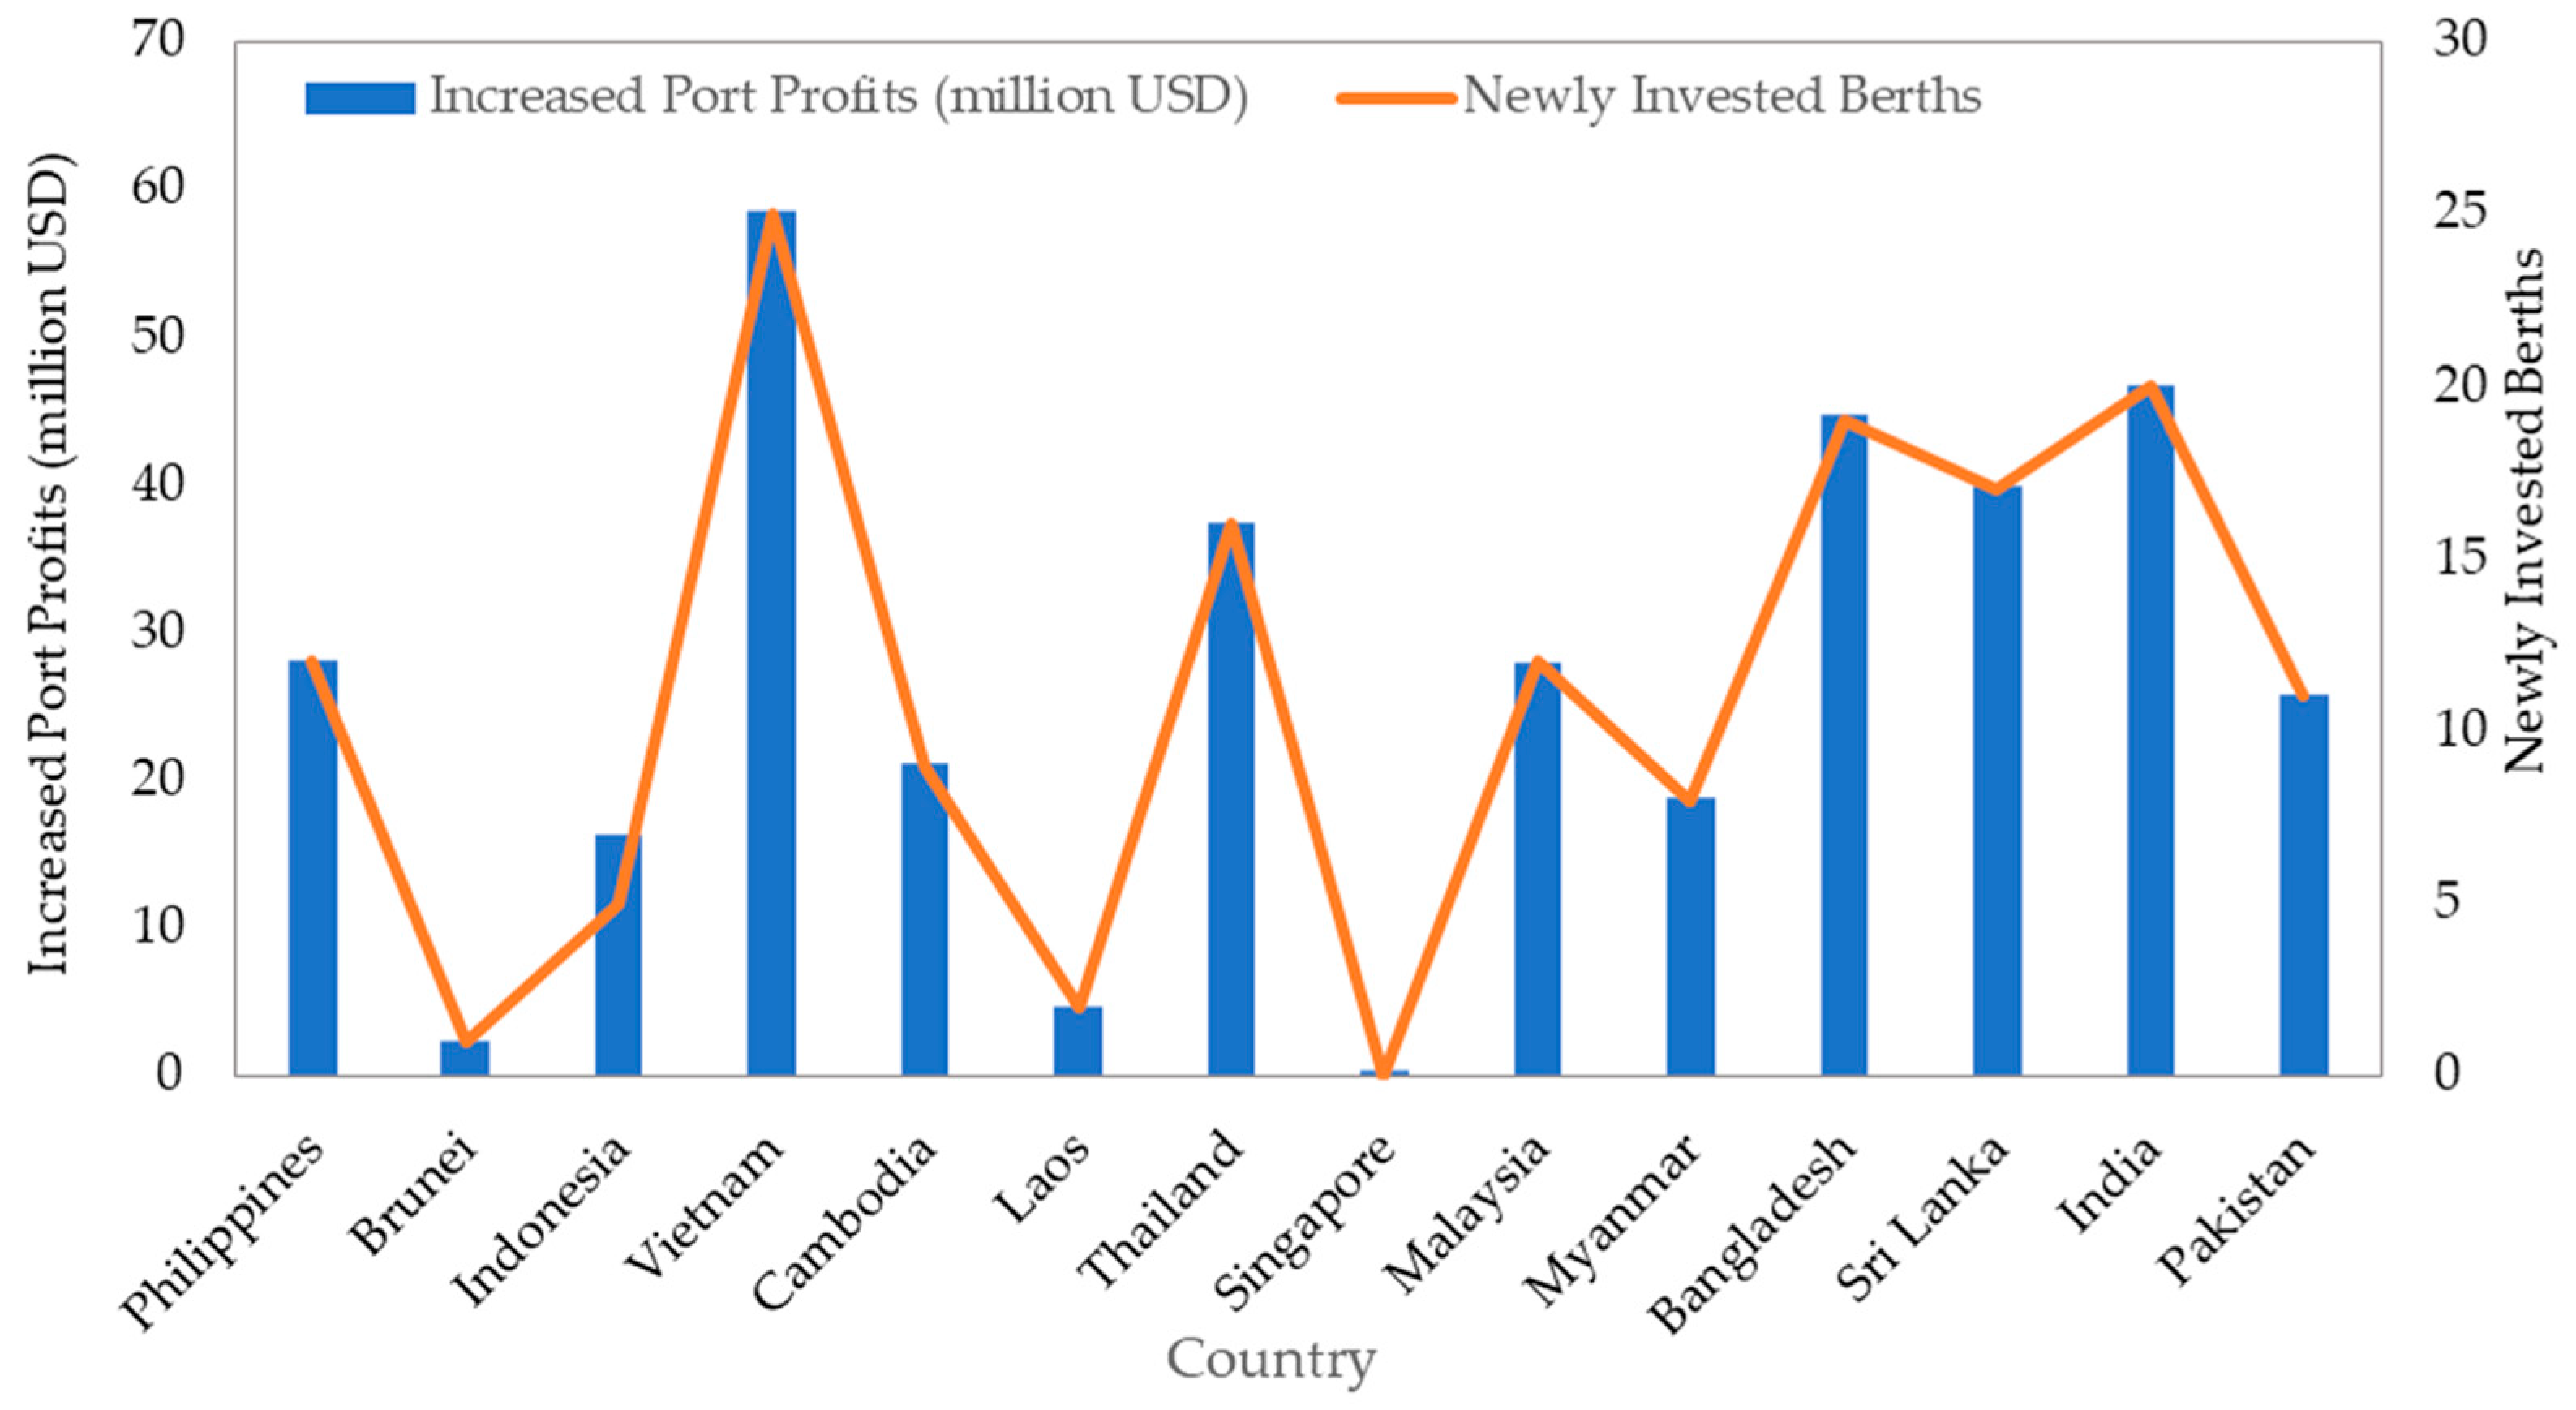
Based on the model’s solution results, the number of berths to be constructed in each selected country, along with the corresponding investment returns, is illustrated in Figure 6.
As shown in Figure 6, blue bars indicate the number of new berths (left axis), and the orange line leads to the port profit (right axis). The chart illustrates the distribution of newly constructed berths and post-investment returns across countries along the MSR.
Vietnam ranks first, with 25 newly constructed berths and post-investment returns of USD 585.9 million, highlighting its strong investment appeal in the region. Bangladesh and India follow closely, with 19 and 20 berths respectively, generating returns of USD 447.1 million and USD 467.7 million, indicating substantial investment potential in both countries. Conversely, Singapore registers zero new berth construction, primarily due to its high labor costs and elevated land prices, which significantly increase the cost of industrial relocation. Despite the absence of new investment, Singapore’s existing port infrastructure may already be sufficient to meet current demand, reducing the necessity for expansion. Overall, while there is a noticeable correlation between the number of new berths and post-investment returns, the outcomes are also shaped by a variety of factors, including geographic location, existing infrastructure, and market demand.
The observed divergence in port investment strategies across the 14 host countries stems primarily from systemic disparities in their political-economic risk exposure. These risks create heterogeneous investment landscapes that fundamentally shape capital allocation decisions.
To objectively capture these cross-border risk differentials, we compute a compo-site risk index (Table 8). The ranking reveals a distinct risk stratification: Singapore and Malaysia demonstrate robust institutional safeguards that minimize uncertainty, whereas Myanmar and Pakistan face elevated risk premiums due to regulatory instability and geopolitical tensions. This risk gradient directly modulates investment scale and expected returns, necessitating country-specific risk mitigation frameworks along the MSR.

5.2.2. Analysis of Industrial Relocation Scale

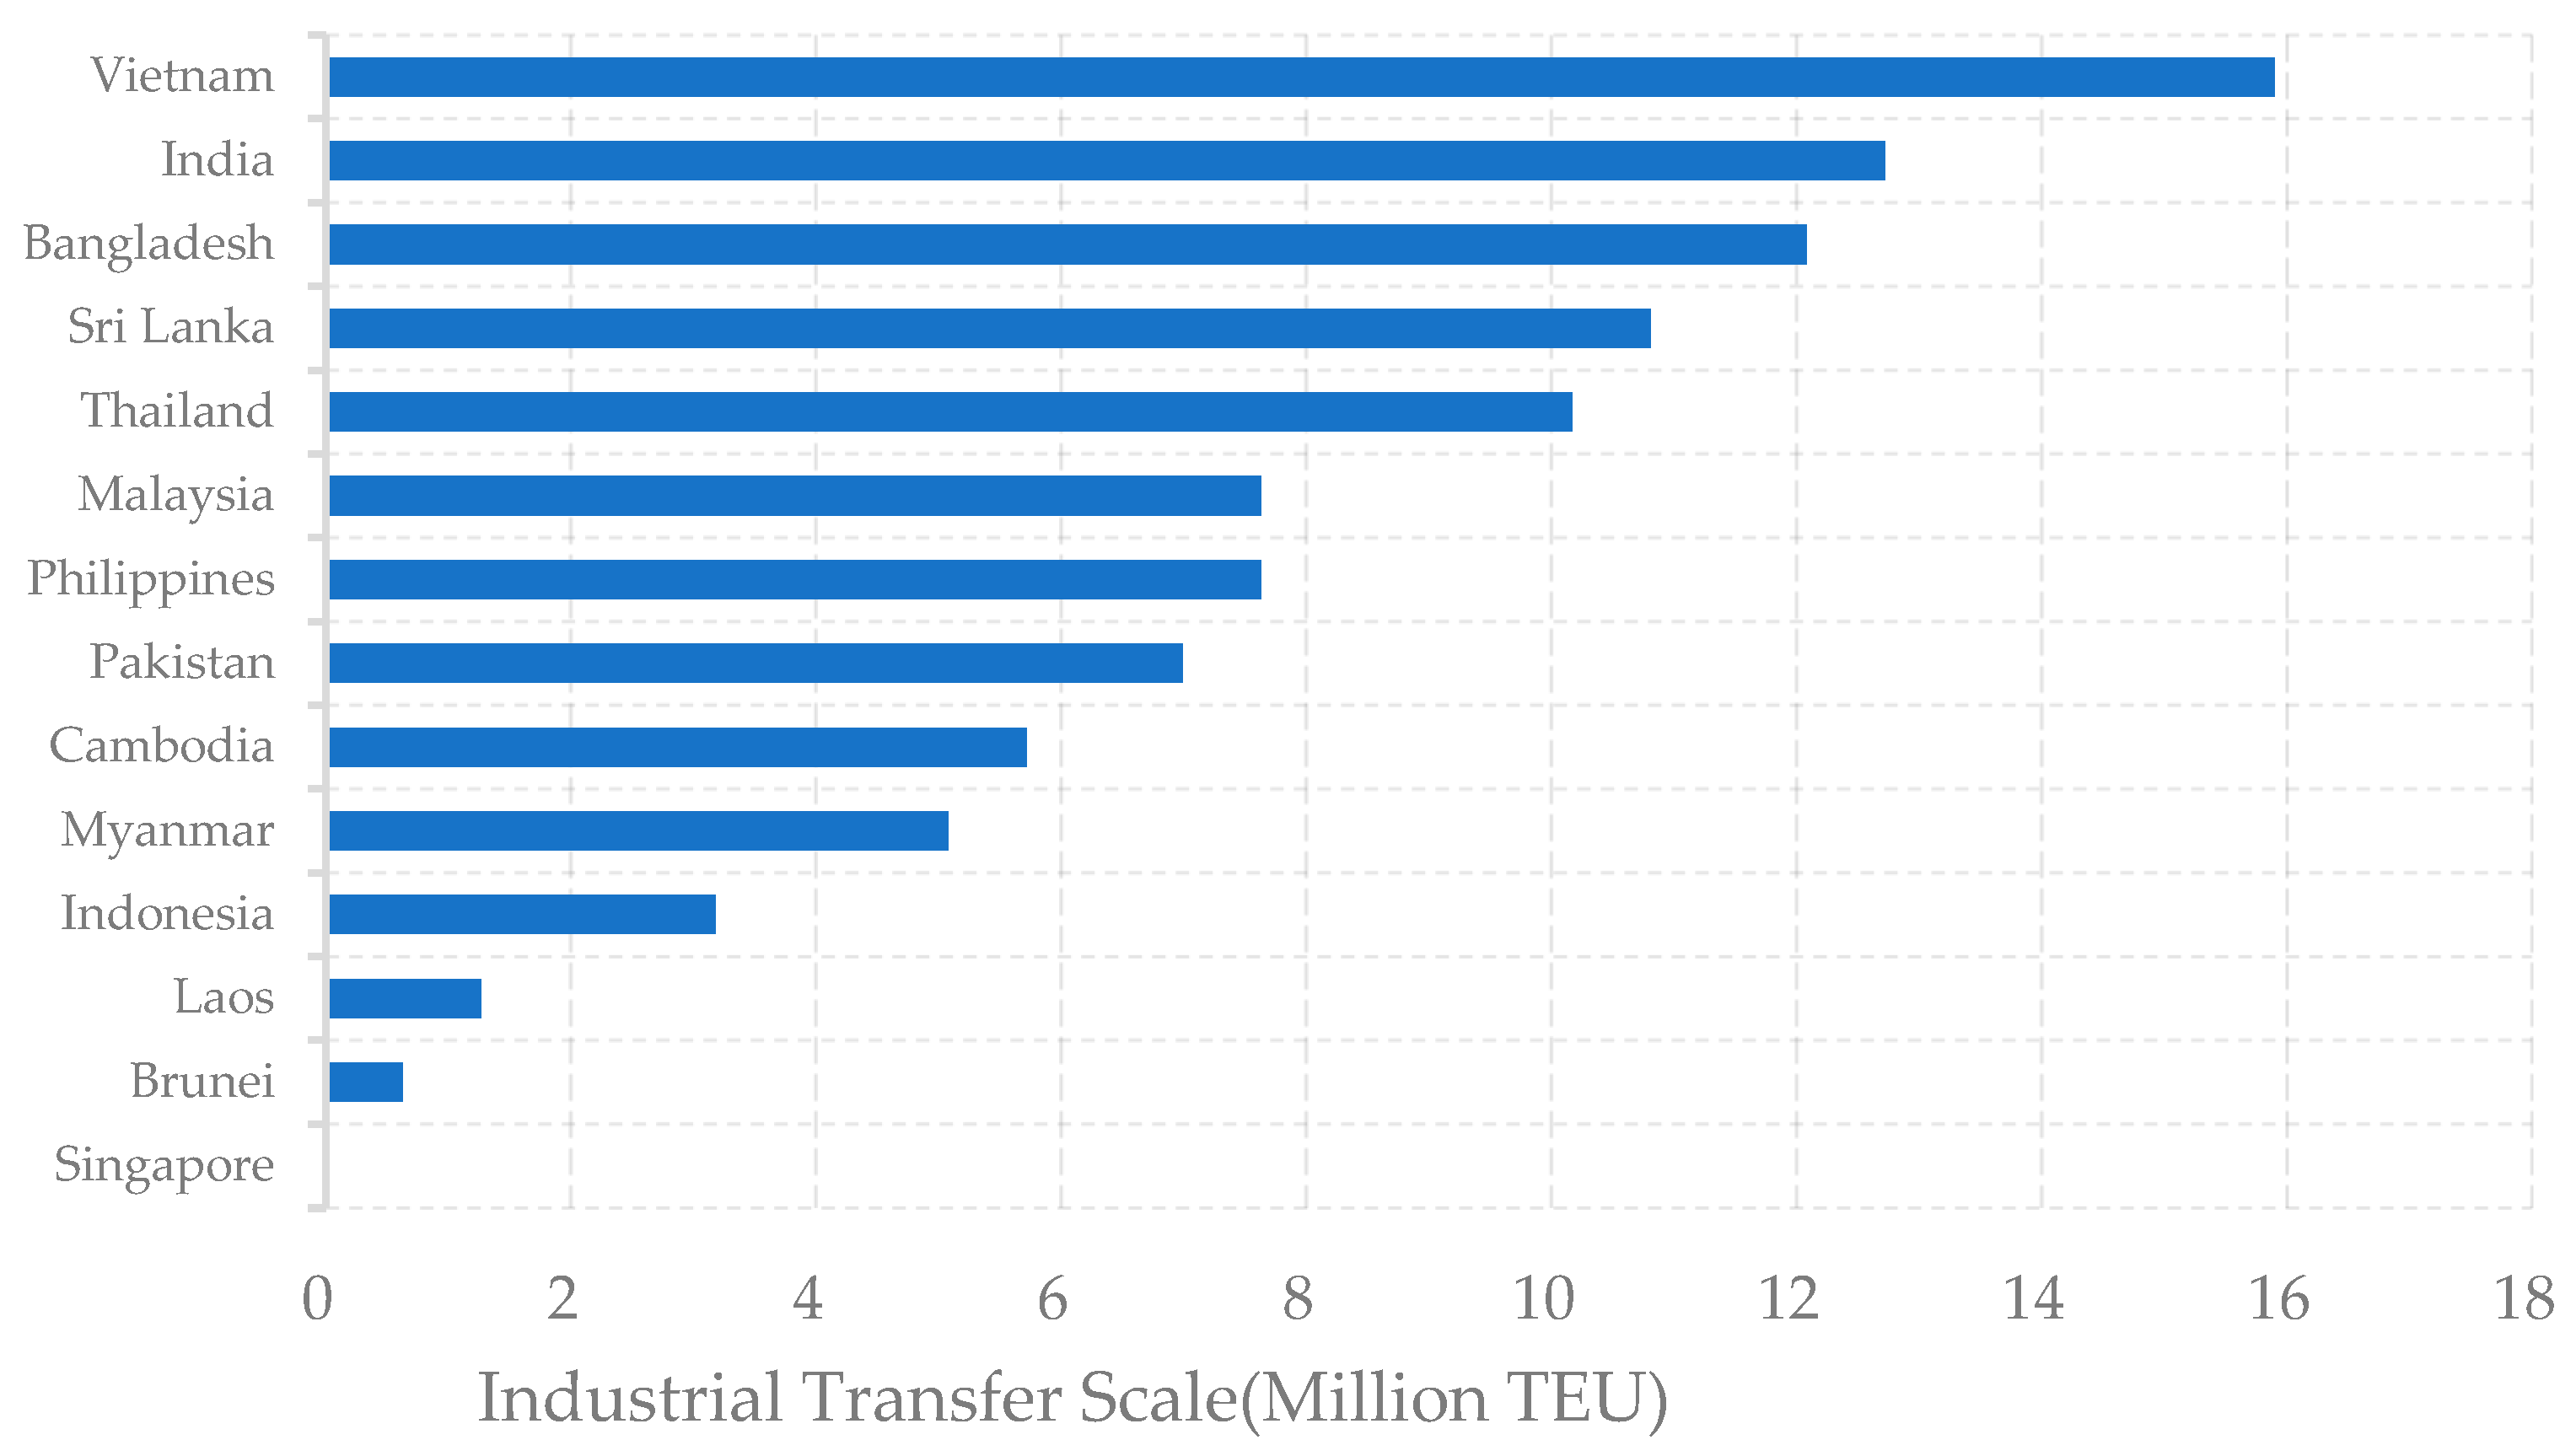
After determining the number of newly constructed berths, the User Equilibrium (UE) allocation model is employed to calculate the volume of industrial relocation from China to each host country. The results are presented in Figure 7.
As shown in Figure 7, there are significant disparities in the scale of industrial relocation from China to host countries, closely linked to variations in land prices and wage levels across these nations. Vietnam ranks first, with a relocation volume of 15.9 million TEU, driven by its low land and labor costs, which make it highly attractive for labor-intensive industries. Thailand, with a more developed economy and moderate wage and land costs, demonstrates a strong capacity to absorb diverse industries, with a relocation scale of 10.176 million TEU. Bangladesh, benefiting from extremely low labor costs, also exhibits high attractiveness for labor-intensive sectors, receiving 12.084 million TEU. In contrast, countries such as the Philippines, Brunei, and Indonesia have relatively higher land and labor costs, along with limited availability of these resources, resulting in moderate to low levels of industrial inflow. Singapore, characterized by very high land prices and wage levels and a focus on high-end service sectors, receives virtually no industrial relocation from China. Overall, many Southeast and South Asian countries have become key destinations for Chinese industrial relocation due to cost advantages in land and labor. However, the actual scale of relocation varies considerably depending on each country’s specific conditions.
The spatial–temporal patterns revealed in Figure 6 and Figure 7 demonstrate a fundamental strategic principle underlying China’s MSR port investments: The deliberate creation of synergistic port–industrial clusters that transcend traditional cost-benefit analysis. Figure 6’s berth investment distribution and Figure 7’s industrial transfer volumes collectively reveal how strategic investments in key locations like Vietnam (25 berths, 15.9 million TEU transfer) create self-reinforcing economic ecosystems where port infrastructure and industrial development mutually accelerate each other’s growth.
This synergistic relationship explains the observed investment concentration in Southeast Asia not merely as a response to existing market conditions, but as a deliberate strategy to create regional economic poles that will generate long-term strategic returns beyond immediate financial metrics. The precise alignment between berth construction scales and industrial transfer volumes across all 14 host countries indicates a carefully calibrated approach to regional development that considers both economic efficiency and geopolitical influence.
Most significantly, the differential outcomes between Vietnam’s success and Brunei’s challenges illustrate China’s willingness to accept varying risk-return profiles across different strategic contexts, suggesting a sophisticated portfolio-based approach to overseas infrastructure investment that balances immediate economic returns with long-term strategic positioning.

5.2.3. Discussion

The empirical results of industrial relocation highlight both opportunities and challenges in the evolving port–industry relationship along the MSR. On the one hand, countries such as Vietnam and Bangladesh demonstrate strong absorptive capacity for relocated industries due to favorable land and labor costs, confirming the theoretical expectation that port expansion stimulates industrial clustering. On the other hand, the limited relocation observed in some host countries illustrates the boundaries of this effect, where institutional and locational advantages cannot fully offset constraints arising from high factor costs, limited resource availability, or insufficient industrial capacity.
These findings extend prior research on port–industry coupling by providing quantitative evidence of the “push–pull” mechanism. Ports not only reduce logistics costs but also reshape industrial spatial patterns, while industrial agglomeration in turn justifies further port investment. However, the results also suggest that this synergy is uneven across regions, being shaped by local risk premiums, infrastructure readiness, and policy stability. For example, while Vietnam benefits from both cost advantages and relatively stable institutional conditions, Myanmar and Pakistan face elevated risks that constrain the scale of effective relocation despite cost competitiveness.
Overall, the discussion underscores the necessity of adopting a differentiated investment portfolio strategy. Rather than pursuing uniform expansion, investors should balance high-return but low-risk destinations with strategically significant yet high-risk regions, thereby ensuring both short-term profitability and long-term strategic positioning. This aligns with recent studies emphasizing that the sustainability of BRI-related port and industrial investments depends not only on economic fundamentals but also on dynamic risk management and host-country engagement mechanisms.

6. Conclusions

This study systematically developed a bi-level optimization framework for port investment decisions along the MSR, demonstrating through comprehensive empirical analysis how differentiated risk assessments can significantly improve investment outcomes across 14 host countries. The empirical results reveal China’s deliberate dual-track port strategy: Achieving immediate returns in established trade hubs like Vietnam while securing long-term footholds in emerging corridors, with strategic clusters in Southeast Asia and the Mediterranean optimizing both operational efficiency and geopolitical influence. The framework’s effectiveness is substantiated by three key findings from our empirical analysis:
First, by constructing this bi-level modeling framework, we captured the dynamic and endogenous feedback between port capacity expansion and the spatial distribution of industries. The industrial transfer patterns captured in Figure 7 reveal Vietnam’s dominant position with 15.9 million TEU of relocated industries, directly resulting from its competitive labor costs and land prices. This substantial industrial inflow validates the model’s capacity to quantify the “push–pull” dynamics between port infrastructure development and industrial spatial redistribution.
Second, the risk-return differentiation across regions emerges clearly from the analysis. Vietnam’s successful 25-berth expansion (USD 585.9 million in returns) contrasts sharply with Brunei’s high-risk costs (USD 78.4 million), demonstrating how geopolitical uncertainties can significantly impact investment outcomes. These differential results, visible in Figure 6’s berth investment distribution, confirm the model’s ability to translate risk assessment into concrete investment strategies.
Third, the case studies provide actionable policy insights. Gwadar Port’s 37% utilization increase through industrial clustering offers a replicable model for BRI policymakers. The empirical analysis reveals significant variation in optimal berth construction, risk exposure, and economic return. The case of Colombo Port City’s suspension (USD 380,000 daily losses) further underscores the importance of operational risk mitigation in project planning. These findings, derived from the lower-level UE model outputs, highlight the framework’s practical utility for diverse stakeholders.
Future research should explore dynamic risk modeling with real-time geopolitical data, ESG integration for sustainable development, and micro-analysis of firm relocation decisions using discrete choice modeling to refine industrial impedance functions. These extensions would build upon our current findings while addressing emerging challenges in global infrastructure investment.
Although this study provides meaningful insights, there are several areas that warrant further exploration. First, this study has not conducted sensitivity analysis or robustness testing on key assumptions (e.g., cost of berth construction, elasticity of GDP), which may affect the validity of the model; future studies could conduct sensitivity analysis or robustness testing on these key assumptions. Secondly, future research can expand this work by incorporating real-time geopolitical risk data to construct a dynamic investment environment, sustainable ESG integration, and micro-analysis of enterprise relocation decisions using discrete choice modeling to refine the industrial impedance function. Thirdly, in the future, factors such as environmental costs or social equity can be incorporated into the model and used as standards for infrastructure investment. Fourth, due to the limitations of data availability during the research period, we did not benchmark or validate the results of this model. In the future, it can be considered to benchmark or verify with other models or past financial performance. Finally, while the current model provides robust composite risk indices, it does not simulate specific operational uncertainties like transport delays, policy reforms, or labor cost fluctuations. Future studies should apply scenario analysis to test system sensitivity to these dynamic factors.

Author Contributions

Conceptualization, D.C. and Y.L.; methodology, D.C. and F.L. (Feng Liu); software, F.L. (Feng Liu) and F.L. (Fuyu Lai); validation, F.L. (Feng Liu), F.L. (Fuyu Lai) and Y.L.; formal analysis, F.L. (Fuyu Lai) and F.L. (Feng Liu); investigation, F.L. (Feng Liu), T.W., X.X. and J.W.; resources, D.C.; data curation, T.W., X.X. and J.W.; writing—original draft preparation, D.C. and F.L. (Feng Liu); writing—review and editing, D.C. and Y.L.; visualization, T.W., X.X. and J.W.; supervision, D.C. and Y.L.; project administration, D.C.; funding acquisition, D.C. and Y.L. All authors have read and agreed to the published version of the manuscript.

Funding

The work was jointly supported by the National Natural Science Foundation of China (Grant No. 72001120; 52572343) and the Natural Science Foundation of Ningbo (Grant No. 2024J127). Hangzhou International Innovation Institute of Beihang University (Grant No. 2025BKZ034).

Data Availability Statement

The data used to support the findings of this study are available from the corresponding author upon request.

Conflicts of Interest

The authors declare no conflict of interest.

Appendix A. Parameters Used in the Paper

Table A1. Summary of parameters.
ParameterDefinition
NQ1the number of newly constructed container berths, which is decision variable
x ^ j the original throughput capacity of the port in country j
x p p the freight flow between origin–destination (OD) pairs
p f p the average revenue per container handled at port p
p c the variable cost per container
f c the annual average maintenance cost per container berth
NQ0the original number of berths
Cthe total investment cost for berth construction and supporting facilities
Tinvestment payback period
CLthe risk cost associated with port investment
NQthe maximum number of berths that can be constructed
hcthe average cost of constructing each container berth and its associated supporting facilities
t c a the impedance (generalized cost) on link a
f i j k the flow on path k between country i and country j
q i j the total flow between origin i and destination j
x a the total flow on link a
δ i j k a binary variable used to determine whether link a is included in path k between i and j
t p i tax rate at origin
pvunit value of containerized products (USD/TEU)
h p i daily wage level at origin (USD/person/day)
nhlabor required to produce one TEU of goods (persons)
nsland area required to produce one TEU of goods
ω i p share of highway transport from origin i to port p
f r r o a d highway freight rate (USD/km/TEU)
f r r a i l w a y railway freight rate (USD/km/TEU)
f b r a i l w a y base railway fee (USD/TEU)
α value of time (USD/hour/TEU)
d i p r o a d road distance from origin i to port p
d i p r a i l w a y rail distance from origin i to port p
v r o a d average highway speed
v r a i l w a y average railway speed
γ congestion coefficient
port capacity
s c a cargo throughput of the port
τ probability of industrial investment risk
c i j total investment amount of the industrial project
G D P i the GDP of country i after relocation
kthe marginal propensity to consume
G D P i 0 the GDP before investment
h p i the wage level after relocation
φ i the coefficient linking wage to GDP
Δ G D P i the change in GDP before and after investment
l p i the original land cost in region i (USD/m2)
l p i the land cost after relocation in region i (USD/m2)
η i the coefficient relating land price to GDP
p o p c crossover rate
p o p m mutation rate
p o p s i z e population size
Hmaximum number of iterations

References

  1. Xu, L.; Huang, J.C.; Chen, J.H. How does the initiative of the 21st century Maritime Silk Road incentive logistics development in China’s coastal region. Ocean Coast. Manag. 2023, 239, 106606. [Google Scholar] [CrossRef]
  2. Chen, D.X.; Yang, Z.Z. Investment in container ports along the Maritime Silk Road in the context of international industry trans fer: The case of the port of Colombo. Marit. Econ. Logist. 2019, 21, 241–257. [Google Scholar] [CrossRef]
  3. Zhang, Y.; Notteboom, T. The economic impact of Chinese port investments on host countries: Evidence from the Port of Piraeus. Marit. Econ. Logist. 2022, 22, 228–247. [Google Scholar]
  4. Chen, D.X.; Yang, D.; Yang, Z.Z. Port investment along the Maritime Silk Road considering mutual selections of the industries planned for transfer and recipient countries with location advantage. Marit. Policy Manag. 2022, 51, 1229–1251. [Google Scholar] [CrossRef]
  5. Feng, L.; Li, X.; Ng, A.K.; Jia, P.; Kuang, H.; Zhang, X. Can port systems be enhanced by government promotion? The case of port cooperation along the maritime silk road. Ocean Coast. Manag. 2023, 242, 100669. [Google Scholar] [CrossRef]
  6. Jiang, M.; Liu, Y.; Lu, J.; Qu, Z.; Yang, Z. Risk assessment of maritime supply chains within the context of the Maritime Silk Road. Ocean Coast. Manag. 2023, 231, 106380. [Google Scholar] [CrossRef]
  7. Fudan University, China and Neighboring Countries Relations Research Center. Research on China’s Neighboring Diplomacy; World Knowledge Press: Beijing, China, 2019; pp. 109–135. [Google Scholar]
  8. Li, X.; Wang, Y.; Liu, Z. Political risk propagation and contractual resilience in BRI port-city projects: Evidence from Colombo. Marit. Policy Manag. 2022, 49, 345–362. [Google Scholar]
  9. Zhang, L.; Notteboom, T.; Pallis, A.A. Geopolitical risks and port governance under the BRI: The case of Port of Piraeus. Transp. Policy 2020, 95, 1–12. [Google Scholar]
  10. Murillo, S.D.C.; Henrique, F.P. ESG performance scoring method to support responsible investments in port operations. Case Stud. Transp. Policy 2022, 10, 664–673. [Google Scholar] [CrossRef]
  11. Zheng, S.; Wang, K.; Li, Z.C.; Fu, X.; Chan, F.T. Subsidy or minimum requirement? Regulation of port adaptation investment under disaster ambiguity. Transp. Res. Part B 2021, 150, 457–581. [Google Scholar] [CrossRef]
  12. Yang, Z.; He, Y.; Zhu, H.; Notteboom, T. China’s Investment in African Ports: Spatial Distribution, Entry Modes and Investor Profile. Res. Transp. Bus. Manag. 2020, 37, 100571. [Google Scholar] [CrossRef]
  13. Xia, W.Y.; Lindsey, R. Port adaptation to climate change and capacity investments under uncertainty. Transp. Res. Part B 2021, 152, 180–204. [Google Scholar]
  14. Wang, C.X.; Xie, F.J.; Xu, L. Which terminals should expand investment: A perspective of internal non-cooperative competition in a port. Marit. Policy Manag. 2020, 47, 718–735. [Google Scholar] [CrossRef]
  15. Tan, Z.; Zeng, X.; Wang, T.; Wang, Y.; Chen, J. Capacity investment of shore power berths for a container port: Environmental incentive and infrastructure subsidy policies. Ocean Coast. Manag. 2023, 239, 106582. [Google Scholar] [CrossRef]
  16. Zheng, J.; Yang, L.; Li, W.; Fu, X.; Li, D. Priority analysis of port investment along the 21st-Century Maritime Silk Road region: The case of Southeast Asia. Marit. Policy Manag. 2022, 49, 1116–1134. [Google Scholar]
  17. Quy, M.N.; Rehan, S.; Lucjan, G. Simulation-Based Performance Assessment Framework for Optimizing Port Investment. J. Waterw. Port Coast. Ocean. Eng. 2021, 147, 04021010. [Google Scholar]
  18. Zhao, G.; Wang, K.; Yu, F.; Kuang, H. Port Multi-Period Investment Optimization Model Based on Supply-Demand Matching. J. Syst. Sci. Inf. 2015, 3, 77–85. [Google Scholar]
  19. Kurtulus, E. Optimizing inland container logistics and dry port location-allocation from an environmental perspective. Res. Transp. Bus. Manag. 2023, 48, 100839. [Google Scholar]
  20. Ma, Q.; Ma, B.; He, Y.; Sun, W. An optimization approach to the scale of port cold-chain dedicated terminals considering uncertainties. Eng. Optim. 2022, 54, 1887–1902. [Google Scholar] [CrossRef]
  21. Tu, N.; Adiputranto, D.; Fu, X.; Li, Z.C. Shipping network design in a growth market: The case of Indonesia. Transp. Res. Part E 2017, 117, 108–125. [Google Scholar] [CrossRef]
  22. Wei, H.; Dong, M. Import-export freight organization and optimization in the dry-port-based cross-border logistics network under the Belt and Road Initiative. Comput. Ind. Eng. 2019, 130, 472–484. [Google Scholar] [CrossRef]
  23. Yang, D.; Pan, K.; Wang, S. On service network improvement for shipping lines under the one belt one road initiative of China. Transp. Res. Part E 2017, 117, 82–95. [Google Scholar] [CrossRef]
  24. Li, L.; Wang, J.; Wang, H.; Jin, X.; Du, L. Intermodal transportation hub location optimization with governments subsidies under the Belt and Road Initiative. Ocean Coast. Manag. 2023, 231, 106414. [Google Scholar] [CrossRef] [PubMed]
  25. Li, M.; Luan, J.; Li, X.; Jia, P. An Analysis of the Impact of Government Subsidies on Emission Reduction Technology Investment Strategies in Low-Carbon Port Operations. Systems 2024, 12, 134. [Google Scholar] [CrossRef]
  26. Wang, B.; Chin, K.S.; Su, Q. Port investments to address diversified risks under risk-sensitive behavior: Prevention or adaptation. Comput. Ind. Eng. 2023, 179, 109153. [Google Scholar] [CrossRef]
  27. Itoh, R.; Zhang, A.M. How should ports share risk of natural and climate change disasters. Analytical modelling and implications for adaptation investments. Econ. Transp. 2023, 33, 100301. [Google Scholar] [CrossRef]
  28. Gómez-Fuster, M.J.; Jiménez, P. Probabilistic risk modelling for port investments: A practical approach. Case Stud. Transp. Policy 2020, 8, 822–831. [Google Scholar] [CrossRef]
  29. Whitman, M.; Baroud, H.; Barker, K. Multicriteria risk analysis of commodity-specific dock investments at an inland waterway port. Eng. Econ. 2019, 64, 346–367. [Google Scholar] [CrossRef]
  30. Wang, B.; Kwai, S.C.; Su, Q. Prevention and adaptation to diversified risks in the seaport-dry port system under asymmetric risk behaviors: Invest earlier or wait. Transp. Policy 2022, 125, 11–36. [Google Scholar] [CrossRef]
  31. Balliauw, M.; Meersman, H.; Van de Voorde, E.; Vanelslander, T. Towards improved port capacity investment decisions under uncertainty: A real options approach. Transp. Rev. 2019, 39, 531–552. [Google Scholar] [CrossRef]
  32. Lewin, A.Y.; Massini, S.; Peeters, C. Why are companies offshoring innovation? The emerging global race for talent. J. Int. Bus. Stud. 2009, 40, 901–925. [Google Scholar] [CrossRef]
  33. Wang, Z.B.; Zhong, M.; Pan, X.F. Optimizing multi-period freight networks through industrial relocation: A land-use transport interaction modeling approach. Transp. Policy 2024, 158, 112–124. [Google Scholar] [CrossRef]
  34. Zhang, Y.X.; Xu, D.F. Service on the rise, agriculture and manufacturing in decline: The labor market effects of high-speed rail services in Spain. Transp. Res. Part A 2023, 171, 103617. [Google Scholar] [CrossRef]
  35. Yan, L.N.; Tu, M.; Chagas, A.L.S.; Tai, L.F. The impact of high-speed railway on labor spatial misallocation—Based on spatial difference-in-differences analysis. Transp. Res. Part A 2022, 164, 82–97. [Google Scholar] [CrossRef]
  36. Hu, J.; Liu, Y.; Fang, J.; Jing, Y.; Liu, Y.; Liu, Y. Characterizing pollution-intensive industry transfers in China from 2007 to 2016 using land use data. J. Clean. Prod. 2019, 223, 424–435. [Google Scholar] [CrossRef]
  37. Tate, W.L.; Ellram, L.M.; Schoenherr, T.; Petersen, K.J. Global competitive conditions driving the manufacturing location decision. Bus. Horiz. 2014, 57, 381–390. [Google Scholar] [CrossRef]
  38. Ghodratnama, A.; Arbabi, H.R.; Azaron, A. Production planning in industrial townships modeled as hub location-allocation problems considering congestion in manufacturing plants. Comput. Ind. Eng. 2019, 129, 479–501. [Google Scholar] [CrossRef]
  39. Duan, H.S.; Zhang, Y.; Huang, Z.Q. Production line location strategy for foreign manufacturer when selling in a market lag behind in manufacturing. Comput. Ind. Eng. 2024, 198, 110678. [Google Scholar] [CrossRef]
  40. Li, Y.; Wu, X.Q.; Bauer, J.; Aurich, J.C. Facility location optimization with market segmentation for additive manufacturing material supplier network using quantum annealing. Digit. Eng. 2024, 2, 100011. [Google Scholar] [CrossRef]
  41. Sharma, P.; Singh Ghatorha, K.; Kang, A.S.; Cepova, L.; Kumar, A.; Phanden, R.K. Strategic insights in manufacturing site selection: A multi-method approach using factor rating, analytic hierarchy process, and best worst method. Front. Mech. Eng. 2024, 10, 1392543. [Google Scholar] [CrossRef]
  42. Hofstede, G.; Hofstede, G.J.; Minkov, M. Cultures and Organizations: Software of the Mind, 4th ed.; McGraw-Hill: New York, NY, USA, 2023; pp. 192–195. [Google Scholar]
  43. Chen, D.; Yang, Z. Systematic optimization of port clusters along the Maritime Silk Road in the context of industry transfer and production capacity constraints. Transp. Res. Part E Logist. Transp. Rev. 2018, 109, 174–189. [Google Scholar] [CrossRef]
  44. World Bank. World Development Indicators 2023; World Bank: Washington, DC, USA, 2023. [Google Scholar]
  45. International Transport Forum (ITF). ITF Transport Statistics: Freight Transport. OECD. 2023. Available online: https://www.itf-oecd.org/transport-data-and-statistics (accessed on 1 January 2025).
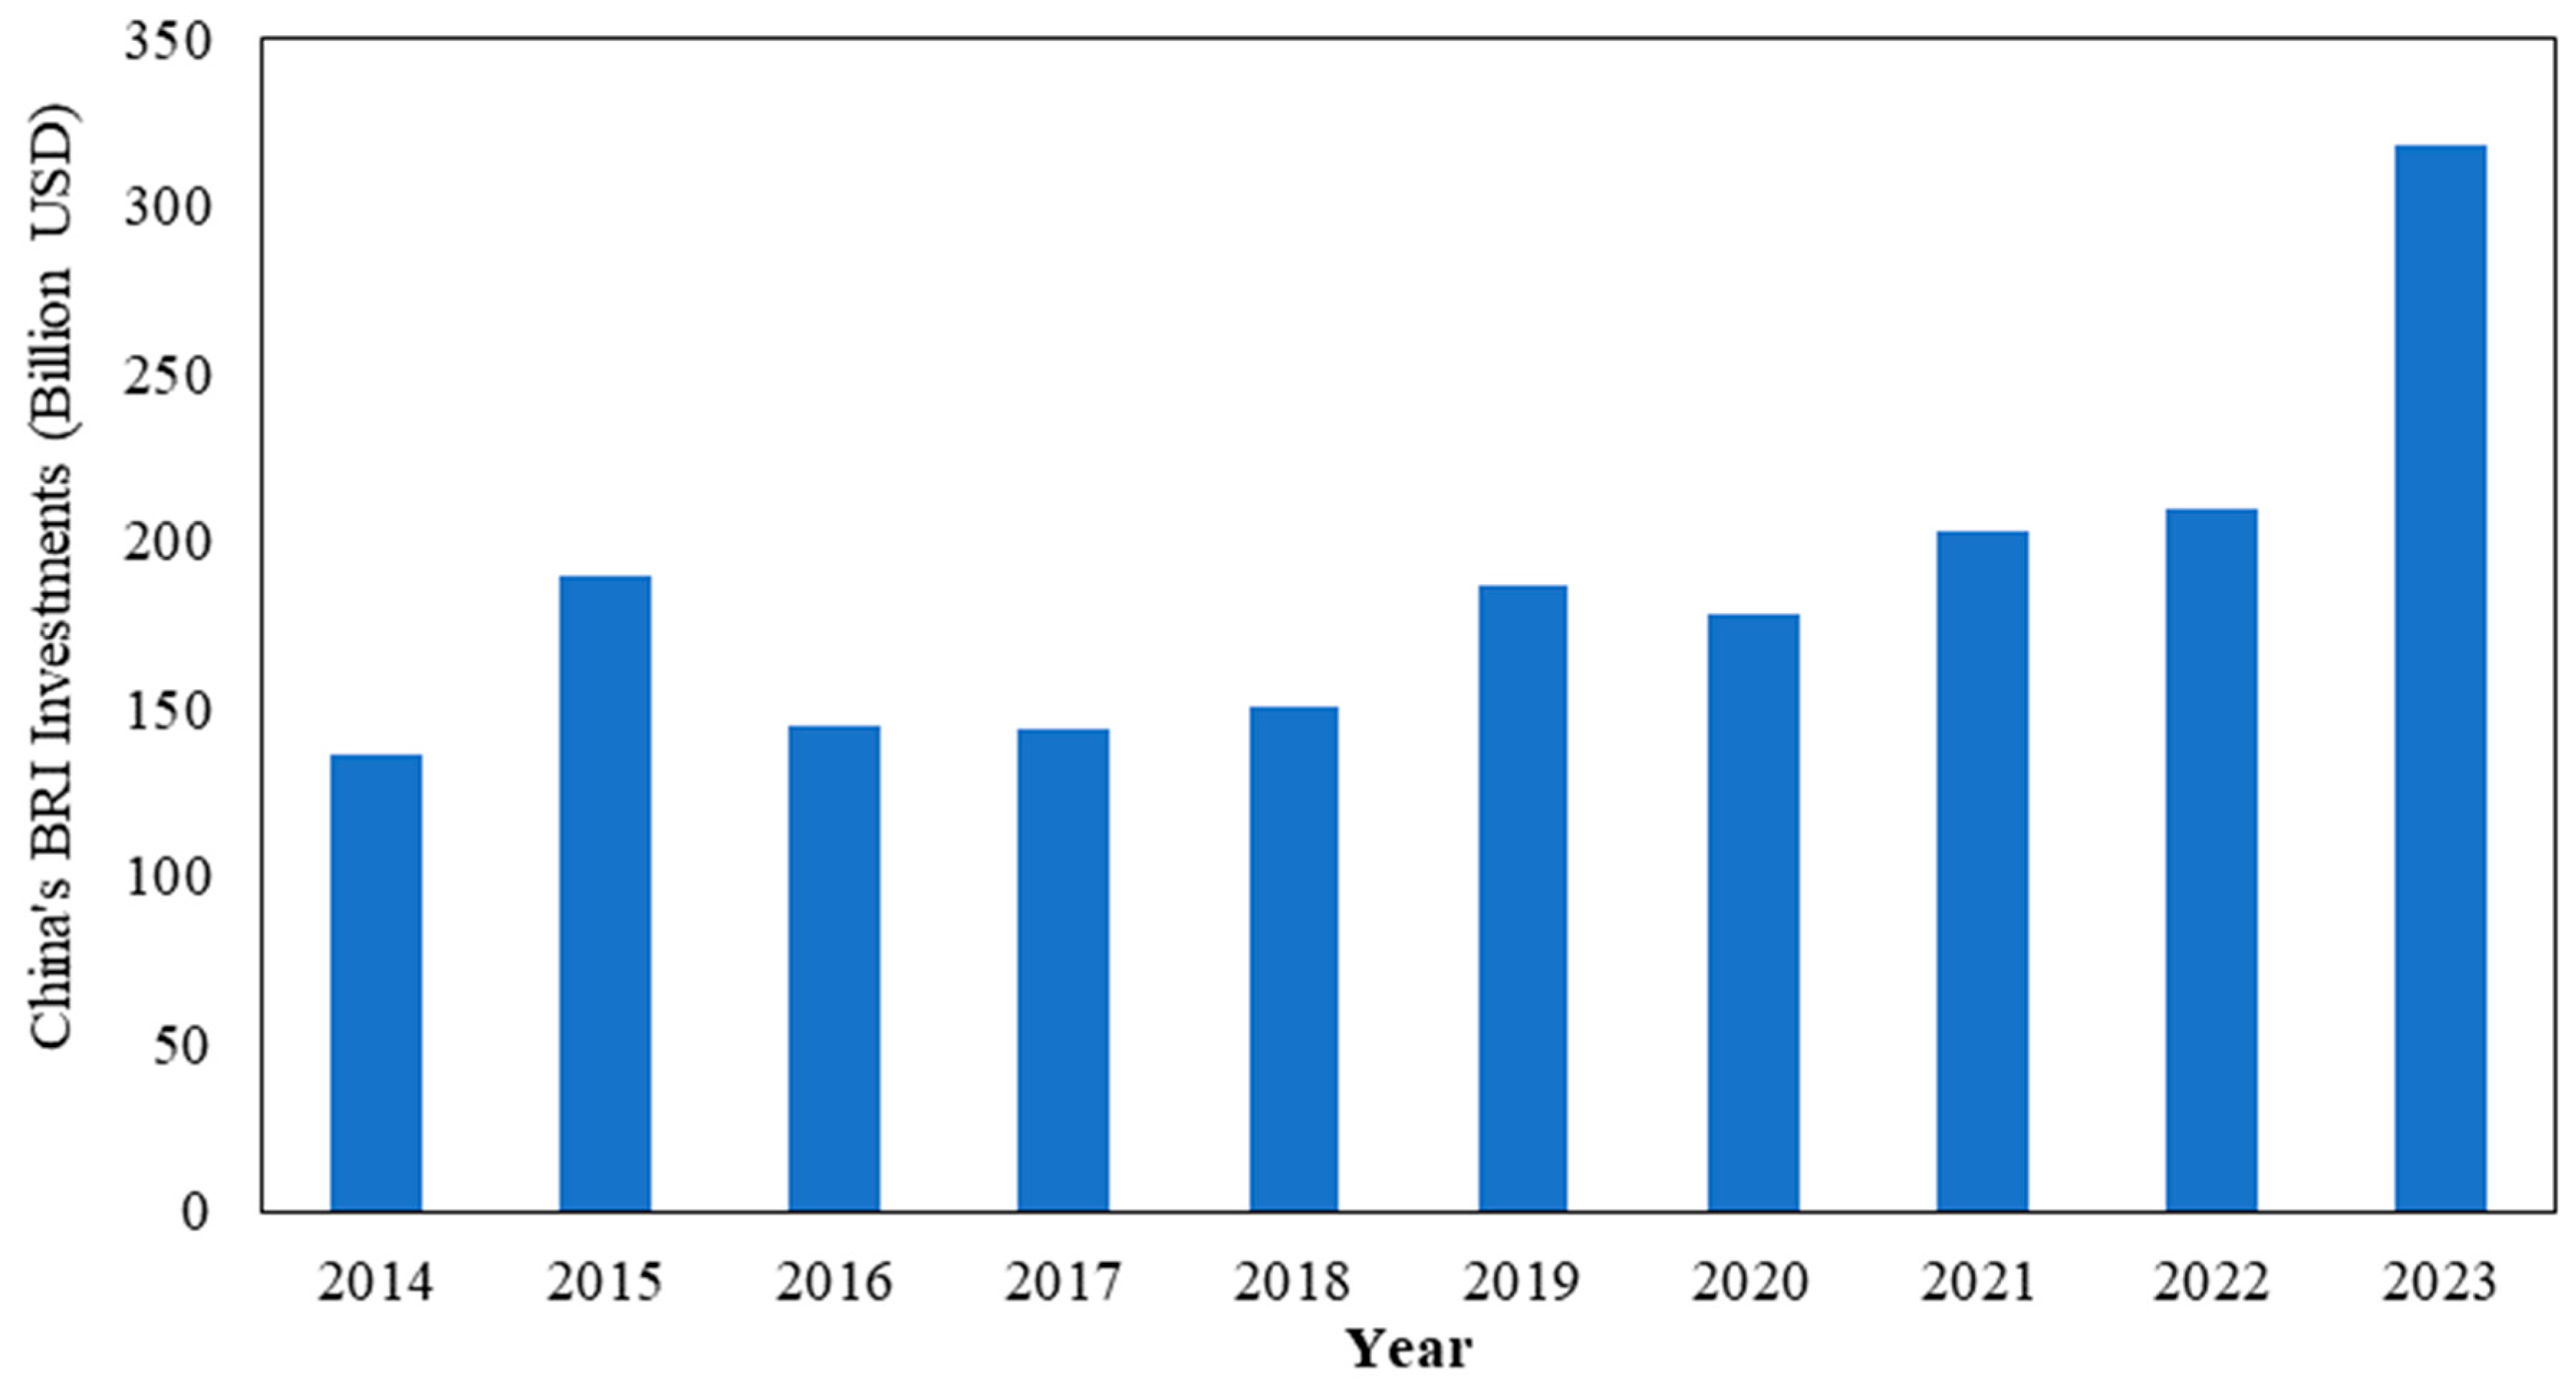
Figure 1. China’s investment in regions along the Belt and Road from 2014 to 2023.
Systems 13 00794 g001
Figure 2. Research framework diagram.
Systems 13 00794 g002
Figure 3. Production + Transportation Networks for Products without Considering Industrial Transfer.
Systems 13 00794 g003
Figure 4. Production + transportation network for products considering industrial transfer.
Systems 13 00794 g004
Figure 5. Convergence plot of the GA.
Systems 13 00794 g005
Figure 6. The number of newly invested berths and the increased port profits.
Systems 13 00794 g006
Figure 7. The scale of China’s industries transferred to each country.
Systems 13 00794 g007
Table 1. China’s overseas port investments, 2012–2023.
AreaPort ProjectsYears
Southeast Asia and South AsiaCOSCO—New Port Terminal2012
Colombo International Container Terminal2012
Hambantota Port2012
West Asia and North AfricaDjibouti Port in Djibouti2013
Suez Canal Terminal2012
Kumport Container Terminal, Istanbul Port,
Türkiye
2015
Jeddah, Saudi Arabia
Khalifa Marina, Abu Dhabi, United Arab Emirates2018
New container terminal at Sokhna Port, Egypt2023
Port Sudan Livestock Terminal2023
Haifa New Port2023
EuropePort of Antwerp2012
Port of Piraeus2012
Euromax Terminal Rotterdam
Terminal Link
Wado Pier2019
Noatum Port Company
Odessa Terminal Holdco Ltd.2020
Rotterdam World Gateway2020
Port of Zeebrugge2022
Container Terminal Tollerort, Port of Hamburg2023
AfricaTogo Lomé Container Terminal Company2012
Nigeria Tinkan International Container Terminal
Bokai Mining Terminal
Container berth at Kribi Deepwater Port in Cameroon
Lomé Container Terminal, Togo
Nigeria Tinkan International Container Terminal
Oceania and the AmericasPort Melbourne
Port of Newcastle
Darwin Port2015
Seattle Pier
Puerto Margarita Island, Panama
Paranagua Port, Brazil2018
Ruchankay Marina2019
Kingston Freeport Terminal Limited2020
Table 2. The summary of the literature on port investment.
Profit-Oriented Investment Strategies (Category I)
ReferencesModelFactors to ConsiderResearch Findings
Murillo and Henrique [10]Clustering analysis, Comparative importance matrixESG performance, stakeholder demandsIdentifies optimal investment strategies for high-performing ports based on ESG metrics.
Zheng et al. [11]Economic model with fuzzy probabilitiesDisaster probabilities, spillover externalities, regulationAnalyzes how regulatory interventions influence port investment strategies under uncertainty.
Yang et al. [12]Descriptive model specializationEnterprise characteristics, host country development, port attributesIdentifies EPC + F + I and PPP as common investment models requiring strategic alignment.
Xia and Lindsey [13]Interdependence modelInvestment capacity, protection decisions, port charges, timingAssesses trade-offs between profitability and social welfare in capacity investment.
Wang et al. [14]Non-cooperative game modelPort congestion, capacity expansionOffers strategies for achieving investment stability under varying decision-making conditions.
Tan et al. [15]Bi-level optimization modelGovernment subsidies, emissions reduction, profit marginsShows a feedback loop where subsidies encourage emission reduction investments that also improve profits.
Zheng et al. [16]Random-walk link predictionEconomic factors, political factors, regional cooperationPrioritizes port construction projects based on their network and strategic importance.
Quy [17]Three-stage optimization modelExternal shocks, port performance, cost analysisDerives optimal investment strategies through sequential safety, performance, and cost evaluation.
Zhao et al. [18]Dynamic programming modelSupply-demand balance, ecological capacity, profit-loss constraintsProvides a framework for multi-period investment decision-making under multiple constraints.
Chen and Yang [2]Bi-level programming modelInvestment return, investment scale, industrial relocation costsMaximizes upper-level returns by considering lower-level industrial relocation feedback.
Chen et al. [4]Bi-level matching modelLocational advantages, source–host country dynamics, social benefitsOptimizes social benefits by simulating industrial-host selection matching.
Kutulu [19]Mixed-integer linear programmingEmpty container emissions, total costsOptimizes inland logistics and dry port locations to minimize both costs and emissions.
Ma et al. [20]Stochastic programming modelShip type uncertainty, arrival time uncertainty, storage requirementsDetermines optimal cold-chain terminal size under operational uncertainties.
Tu et al. [21]Integrated model Shipper route choice, carrier profit, government welfareApplies a multi-stakeholder model to optimize Indonesian port and network investments.
Zheng et al. [16]Link-prediction-based random walkBRI contribution, shipping networksRanks port projects based on their strategic value for efficient, policy-aligned investment.
Wei and Dong [22]Bi-objective mixed-integer programmingFreight cost, freight timeEnhances inland logistics and trade volumes by minimizing cost and time simultaneously.
Yang et al. [23]Bi-level planning modelLiner profits, shipper costsDemonstrates that shipping network improvements under the BRI increase profits and reduce costs.
Li et al. [24]Two-stage mixed-integer modelHub construction cost, transport cost, transshipment costShows that hub construction can minimize total social costs in a network.
Li et al. [25]Game-theoretic frameworkGovernment subsidies, low-carbon preferences, cost-sharingReveals that ports and shipping companies respond differently to subsidies and green market demands.
Risk-Oriented Analyses (Category II)
ReferencesModelFactors to ConsiderResearch Findings
Wang et al. [26]Two-period modelCongestion, climate change risks, risk aversion, investment budget, scale and timingRisk-averse port authorities prioritize investments differently as budgets increase. Provides management insights for port and government decision-makers.
Itoh and Zhang [27]Risk-sharing modelNatural disaster risks, port privatization, profit maximizationRisk-sharing among ports can reduce shipper risk, but private investors still base decisions primarily on profit maximization.
Gómez-Fuster and Jiménez [28]Game theory, AHP, Entropy weight methodRisk management, economic-financial analysisA generic method integrating risk analysis into financial models is effective for assessing risk in port investment projects, as validated in a case study.
Whitman et al. [29]Dynamic risk interdependence model, Weighted MCDAResource allocation, economic loss, GDP, decision-maker risk aversionMCDA helps prioritize port investments based on criteria like GDP and risk aversion, improving port preparedness and resource allocation.
Wang et al. [30]Two-period game modelFuzzy and asymmetric risk behavior, competitive environment, risk preventionInvestigates investment decisions in conventional and disruption risk prevention under competition and varying risk behaviors.
Balliauw et al. [31]A real options approachTechnological change, market cyclesThis method has a positive effect on socio-economic impacts such as regional employment and connectivity.
Table 3. The summary of the literature on industrial relocation.
The Determinants of Industrial Relocation (Category I)
ReferencesModelFactors to ConsiderResearch Findings
Lewin et al. [32]Empirical analysisSkilled professional availability, Labor cost differentialsThe availability of skilled professionals is a more critical determinant of offshore outsourcing locations than labor cost arbitrage.
Wang et al. [33]Land use-transport interaction model, bi-level programmingFreight network investment policies, Location utility sensitivityFreight investment policies affect relocation patterns, and their effectiveness is moderated by the sensitivity of location utility.
Zhang and Xu [34]Difference-in-differences approachHigh-speed rail services, Employment growthHigh-speed rail promotes employment growth in the service sector while reducing it in agriculture and manufacturing.
Yan et al. [35]Improved spatial difference-in-differences methodHigh-speed rail, Labor misallocation, Spatial spillover effectsHigh-speed rail alleviates local labor misallocation and generates significant positive spatial spillover effects.
Hu et al. [36]Index measurement, hotspot analysisEnvironmental regulations, Regional resource endowmentsEnvironmental regulations and resource endowments jointly drove the shift of pollution-intensive industries from eastern to central/western China.
Tate et al. [37]Empirical study of multinational firmsCustomer proximity, Exchange rate volatility, Labor costs, Transportation expensesCustomer proximity, exchange rates, labor, and transport costs jointly influence location decisions, with a noted trend of reshoring to the US.
The Location Selection of Different Types of Facilities (Category II)
ReferencesModelFactors to ConsiderResearch Findings
Ghodratnama et al. [38]Bi-objective hub location–allocation modelCongestion, Total cost, Total product waiting timeThe model effectively optimizes production plans, with outcomes sensitive to parameter changes, balancing cost and time efficiency.
Duan et al. [39]Game–theoretic modelTariffs, Negative country-of-origin brandingHigher tariffs may make overseas locations more favorable, challenging conventional wisdom on offshoring high-end production.
Li et al. [40]Multi-objective optimization frameworkGeographically segmented supplier networks, Market sizes, Inventory planningOptimizing facility location and market segmentation improves service and inventory efficiency, enhancing overall supply chain performance.
Sharma et al. [41]Factor Rating Method (FRM), AHP, Best–Worst Method (BWM)Raw material availability, Location, Labor, Transportation, Utilities, Environmental impactIdentified and prioritized key site selection factors, with raw material availability receiving the highest weight.
Table 4. Algorithm parameters.
ParameterDefinitionValueData Source
p o p c Crossover rate0.9Ghodratnama et al. (2019) [38]
p o p m Mutation rate0.01
p o p s i z e Population size30Chen et al. (2019) [2]
HMaximum number of iterations500Zheng et al. (2021) [11]
Table 5. Data of host countries and Port Hinterland transport modes.
CountryGDP (USD)Port Collection and Distribution Modes
Highway Share Rate (%)Railway Share Rate (%)
Philippines430,232.80991
Brunei13,147.041000
Indonesia1,178,932.01991
Vietnam378,876.06991
Cambodia36,329.791000
Laos20,303.70955
Thailand459,498.91991
Singapore391,555.14973
Malaysia401,479.168020
Myanmar63,756.97964
Bangladesh323,279.98964
Sri Lanka87,374.94991
India3,265,719.70982
Pakistan400,065.45964
Table 6. Annual export trade volume from host Countries to global demand regions (Unit: USD 100,000/year).
North AmericaOceaniaAfricaSouth AmericaEuropeAsia
China145,182.11618.67130.931555.82691.3779.36
Philippines0.313.470.234.074.620.31
Brunei0.00 10.010.009.640.021.38
Indonesia0.097.410.127.074.260.21
Vietnam7.0626.882.94165.5922.814.25
Cambodia0.0010.210.006.150.400.32
Laos7.1835.901.93210.4829.3610.21
Thailand0.060.730.0311.342.920.04
Singapore0.2312.350.4050.959.200.65
Malaysia6.3242.123.43334.7242.242.23
Myanmar6.8443.054.84167.5927.5312.89
Bangladesh3.21101.66.30159.8149.725.16
Sri Lanka0.459.260.437.4124.371.03
India37.8875.0812.00179.5375.377.59
Pakistan1.496.440.379.9110.040.38
Table 7. Original number of berths in major ports of host countries.
Host CountryPortNumber of BerthsHost CountryPortNumber of Berths
PhilippinesManila Port26SingaporeSingapore Port54
BruneiMuara Port3MalaysiaPort Klang4
IndonesiaJakarta Port24MyanmarYangon Port13
VietnamHo Chi Minh Port14BangladeshChittagong Port11
CambodiaSihanoukville Port9Sri LankaColombo Port4
LaosYong’an Port3IndiaMundra Port42
ThailandLaem Chabang Port8PakistanKarachi Port30
Table 8. Risk investment ranking for countries along the Belt and Road.
CountryRankCountryRank
Philippines14Singapore13
Brunei11Malaysia5
Indonesia9Myanmar3
Vietnam1Bangladesh6
Cambodia8Sri Lanka10
Laos2India12
Thailand7Pakistan4
Disclaimer/Publisher’s Note: The statements, opinions and data contained in all publications are solely those of the individual author(s) and contributor(s) and not of MDPI and/or the editor(s). MDPI and/or the editor(s) disclaim responsibility for any injury to people or property resulting from any ideas, methods, instructions or products referred to in the content.