Article

Green Micromobility-Based Last-Mile Logistics from Small-Scale Urban Food Producers

1
Institute of Logistics, University of Miskolc, 3515 Miskolc, Hungary
2
Institute of Technical Sciences, State University of Applied Sciences in Przemyśl, 37-700 Przemyśl, Poland
*
Author to whom correspondence should be addressed.
Systems 2025, 13(9), 785; https://doi.org/10.3390/systems13090785
Submission received: 5 August 2025 / Revised: 3 September 2025 / Accepted: 4 September 2025 / Published: 7 September 2025

Abstract

The growing demand for sustainable urban logistics highlights the need for innovative, low-emission delivery solutions, particularly in the context of small-scale urban food producers. These producers often face logistical challenges in reaching consumers efficiently while minimizing environmental impacts. Green micro-mobility, such as electric cargo bikes and scooters, offers a promising last-mile delivery alternative that aligns with environmental and economic goals. This study addresses the integration of micromobility into urban food logistics, aiming to enhance both efficiency and sustainability. The authors develop a mathematical optimization model that supports real-time decision-making for last-mile deliveries from multiple local food producers to urban customers using micromobility vehicles. The model considers vehicle capacity constraints, and delivery time windows while minimizing greenhouse gas (GHG) emissions and total operational costs. Optimization results based on realistic urban scenario demonstrate that the proposed model significantly reduces GHG emissions compared to conventional delivery methods. Additionally, it enables a more cost-effective and streamlined delivery operation tailored to the specific needs of small producers. The findings confirm that green micromobility-based logistics, supported by optimized planning, can play a crucial role in building cleaner, more resilient urban food distribution systems.

1. Introduction

Urban logistics is undergoing a critical transformation as cities strive to reduce greenhouse gas (GHG) emissions, reduce congestion, and promote sustainable modes of transport. Among the many emerging trends, green micromobility has gained visibility for its potential to serve first- and last-mile delivery needs in dense urban environments. While passenger mobility remains a key theme in current debates, the application of micromobility in urban freight, particularly for small-scale food producers, remains an underexplored yet promising domain. Shared micromobility systems have expanded rapidly in recent years, offering flexible and low-emission alternatives for short-distance travel. Studies reveal that e-scooters and e-bikes appeal mainly to younger users and are increasingly used as first- and last-mile solutions, especially in compact urban areas with adequate infrastructure and mixed land uses [1,2]. Spatial analyses further suggest that their usage is influenced by urban form, walkability, and proximity to transit [3,4]. These findings underscore micromobility’s adaptability across varied urban landscapes, a trait that also makes it well-suited for logistics applications. The COVID-19 pandemic underscored the resilience and utility of shared micromobility, especially when other public transport modes became less viable due to social distancing requirements. E-scooters, in particular, maintained service continuity and were perceived as safer and more autonomous travel options, even receiving policy support in some cities to aid post-pandemic recovery [5]. From a planning perspective, cities such as Paris and Utrecht have increasingly incorporated micromobility into broader urban transport strategies, recognizing its potential not only for personal travel but also for supporting logistics ecosystems [6,7].
Despite these advancements, the integration of micromobility into logistics systems, especially for small food producers, is still emerging. Research shows that while e-scooters can potentially support freight movement, barriers such as vehicle design, user acceptance, and regulatory frameworks must be addressed [1,8]. Furthermore, the interaction between e-scooter trips and transit services remains modest in scale but statistically significant, suggesting room for optimization [9]. Equity concerns also remain prominent, with studies highlighting gaps in access and usage based on age, gender, and socio-economic status [10].
While recent studies have examined the sustainability impacts of various transport interventions, such as the work of Bagdatli and Ipek [11], who investigated the effects of bus priority treatments (BPTs) on small-scale cities from economic, social, and environmental perspectives, there remains a notable research gap in the domain of urban freight and last-mile logistics. Their findings confirm that BPTs can significantly improve sustainability across the three main pillars, even in cities with smaller populations. However, while public transport solutions primarily target passenger mobility, small-scale urban food producers face distinct challenges in delivering goods efficiently and sustainably. Our research addresses this gap by focusing on micromobility-based last-mile logistics, which extends the sustainability discussion from passenger transport systems to freight distribution, thereby complementing and broadening the scope of sustainable urban mobility research.
Recent research has also addressed the role of collaboration and decision-making in improving logistics efficiency. For example, Tatarczak and Grela [12] proposed a coalition formation framework for horizontal supply chain collaboration, where companies can reduce costs and increase efficiency by carefully selecting partners through multi-criteria decision-making approaches. Their study highlights the importance of cooperative strategies and advanced optimization techniques in designing sustainable and cost-effective distribution systems. While their framework focuses on partner selection and coalition structures in horizontal collaboration, our research shifts the attention to last-mile delivery challenges faced by small-scale urban food producers. By integrating micromobility solutions with mathematical optimization, our work complements this line of research by extending collaborative and efficiency-oriented approaches into the domain of urban freight distribution, where practical constraints such as vehicle capacities, time windows, and emissions must also be addressed.
Green last-mile delivery solutions have also been studied from the perspective of third-party logistics (3PL) providers. Kambrath and Vemmanattu [13] investigated how Swedish 3PL companies implement sustainable practices such as electric vehicles, bike couriers, and parcel lockers in both urban and rural environments. Their qualitative findings emphasize the role of infrastructure, regulatory frameworks, and consumer attitudes in shaping the success of green delivery strategies. While their study highlights the opportunities and challenges of established logistics providers, our research focuses on the specific needs of small-scale urban food producers, who often lack access to large 3PL resources. By applying a mathematical optimization model to micromobility-based last-mile logistics, we complement these insights with a quantitative, decision-support approach tailored to small producers operating under tight capacity and sustainability constraints.
To address these challenges, this study proposes a mathematical optimization model for last-mile delivery from small-scale urban food producers using green micromobility vehicles. In this study, the term small-scale food suppliers refers primarily to local bakeries, which are taken as representative examples of this producer group within the urban context. The model aims to optimize routing and vehicle allocation while minimizing operational costs and GHG emissions. Our model incorporates real-world constraints such as delivery time, heterogeneous vehicle types, and limited vehicle capacities. The contribution of this research is twofold. First, it provides an operational decision-support framework tailored to small-scale producers who wish to adopt micromobility solutions. Second, it quantifies the environmental and economic benefits of optimized green last-mile logistics through a case-based analysis in an urban setting. The results demonstrate that well-planned micromobility-based systems can significantly improve efficiency while supporting sustainability and climate mitigation goals.

2. Literature Review

In this chapter, we conduct a systematic literature review to identify existing research gaps. The section is divided into three parts: a descriptive analysis of the available articles, a content analysis with its implications, and the identification of research gaps.

2.1. Descriptive Analysis of Available Research Results

As part of the systematic literature review, we followed these steps: formulating the research questions, selecting sources from Scopus, refining the article list through review and topic identification, analyzing the chosen publications, summarizing the key scientific insights, and identifying research gaps and bottlenecks.
To conduct our search in the Scopus database, we initially used the keywords “last mile” AND “micromobility”, which yielded 116 results. We then refined the search criteria to: (TITLE-ABS-KEY (“last mile”) AND TITLE-ABS-KEY (micromobility) AND NOT TITLE-ABS-KEY (micromobility AND protocols)) AND (LIM-IT-TO (LANGUAGE, “English”)) AND (LIMIT-TO (SRCTYPE, “j”)). This filtering process, which included only English-language journal articles, reduced the number of relevant publications to 83.
The search was carried out in June 2025; therefore, it is possible that further relevant articles have been published since that time.
The selected articles can be categorized based on their research domains. Figure 1 presents the classification of these 83 articles across ten subject areas. The results indicate that most studies fall within the fields of social sciences and engineering. In contrast, the areas of environmental science and energy emphasize the sustainability aspects of last mile delivery operations, while computer science and mathematics concentrate on optimizing micromobility-based last mile delivery solutions.
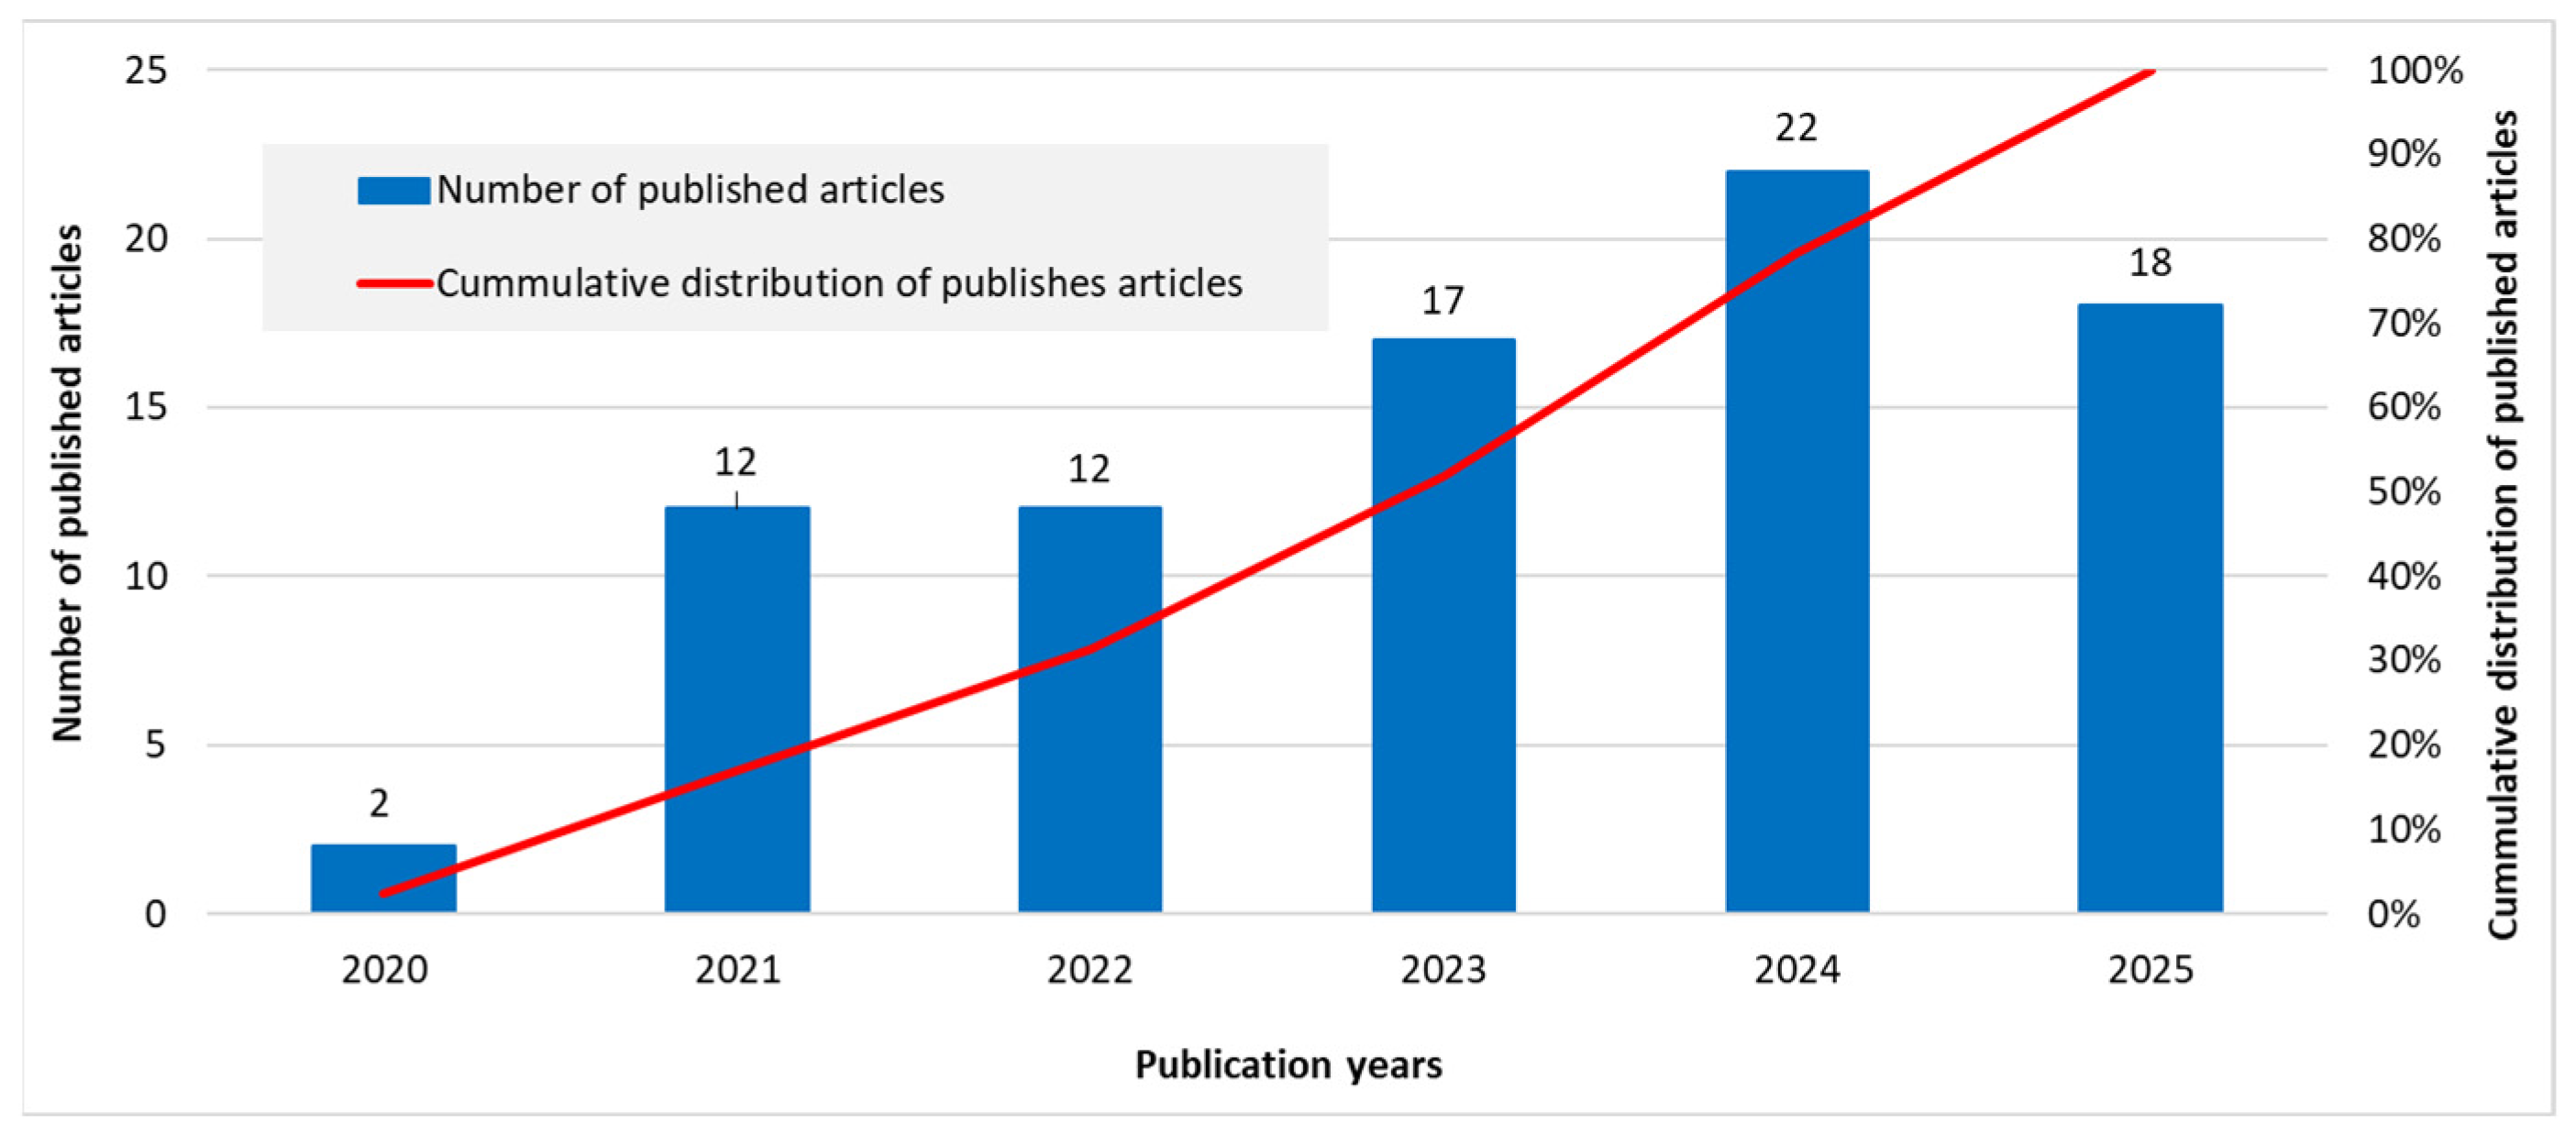
As illustrated in Figure 2, research on micromobility-based last mile delivery solutions has emerged primarily over the past five years. The growing number of publications in recent years highlights the increasing significance of this research area.
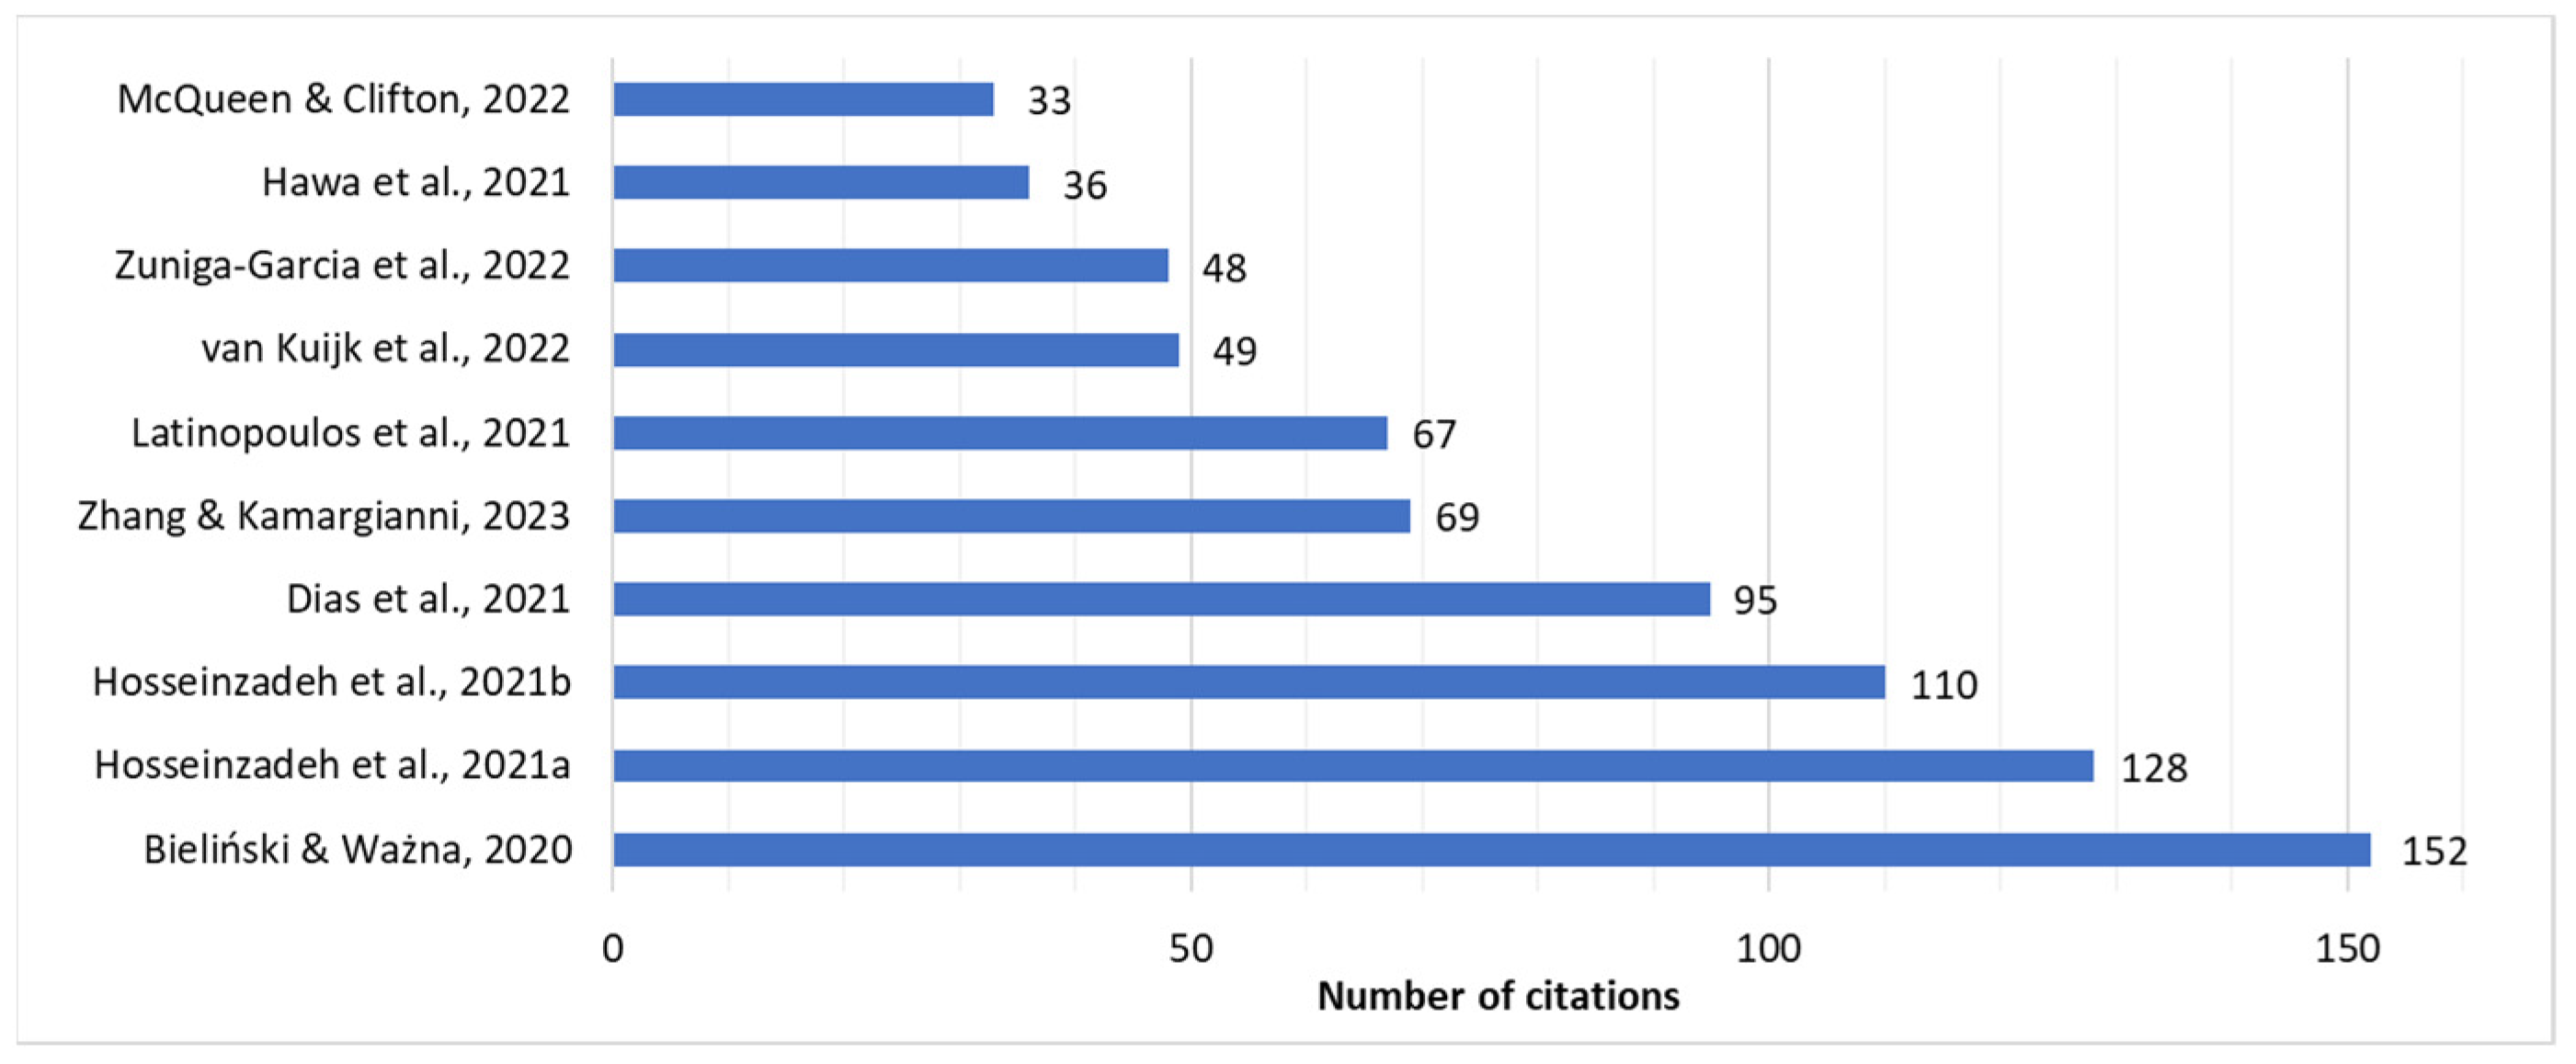
The articles were examined in terms of their scientific impact, which is most commonly measured by the number of citations they have received. Figure 3 presents the ten most cited articles along with their respective citation counts.
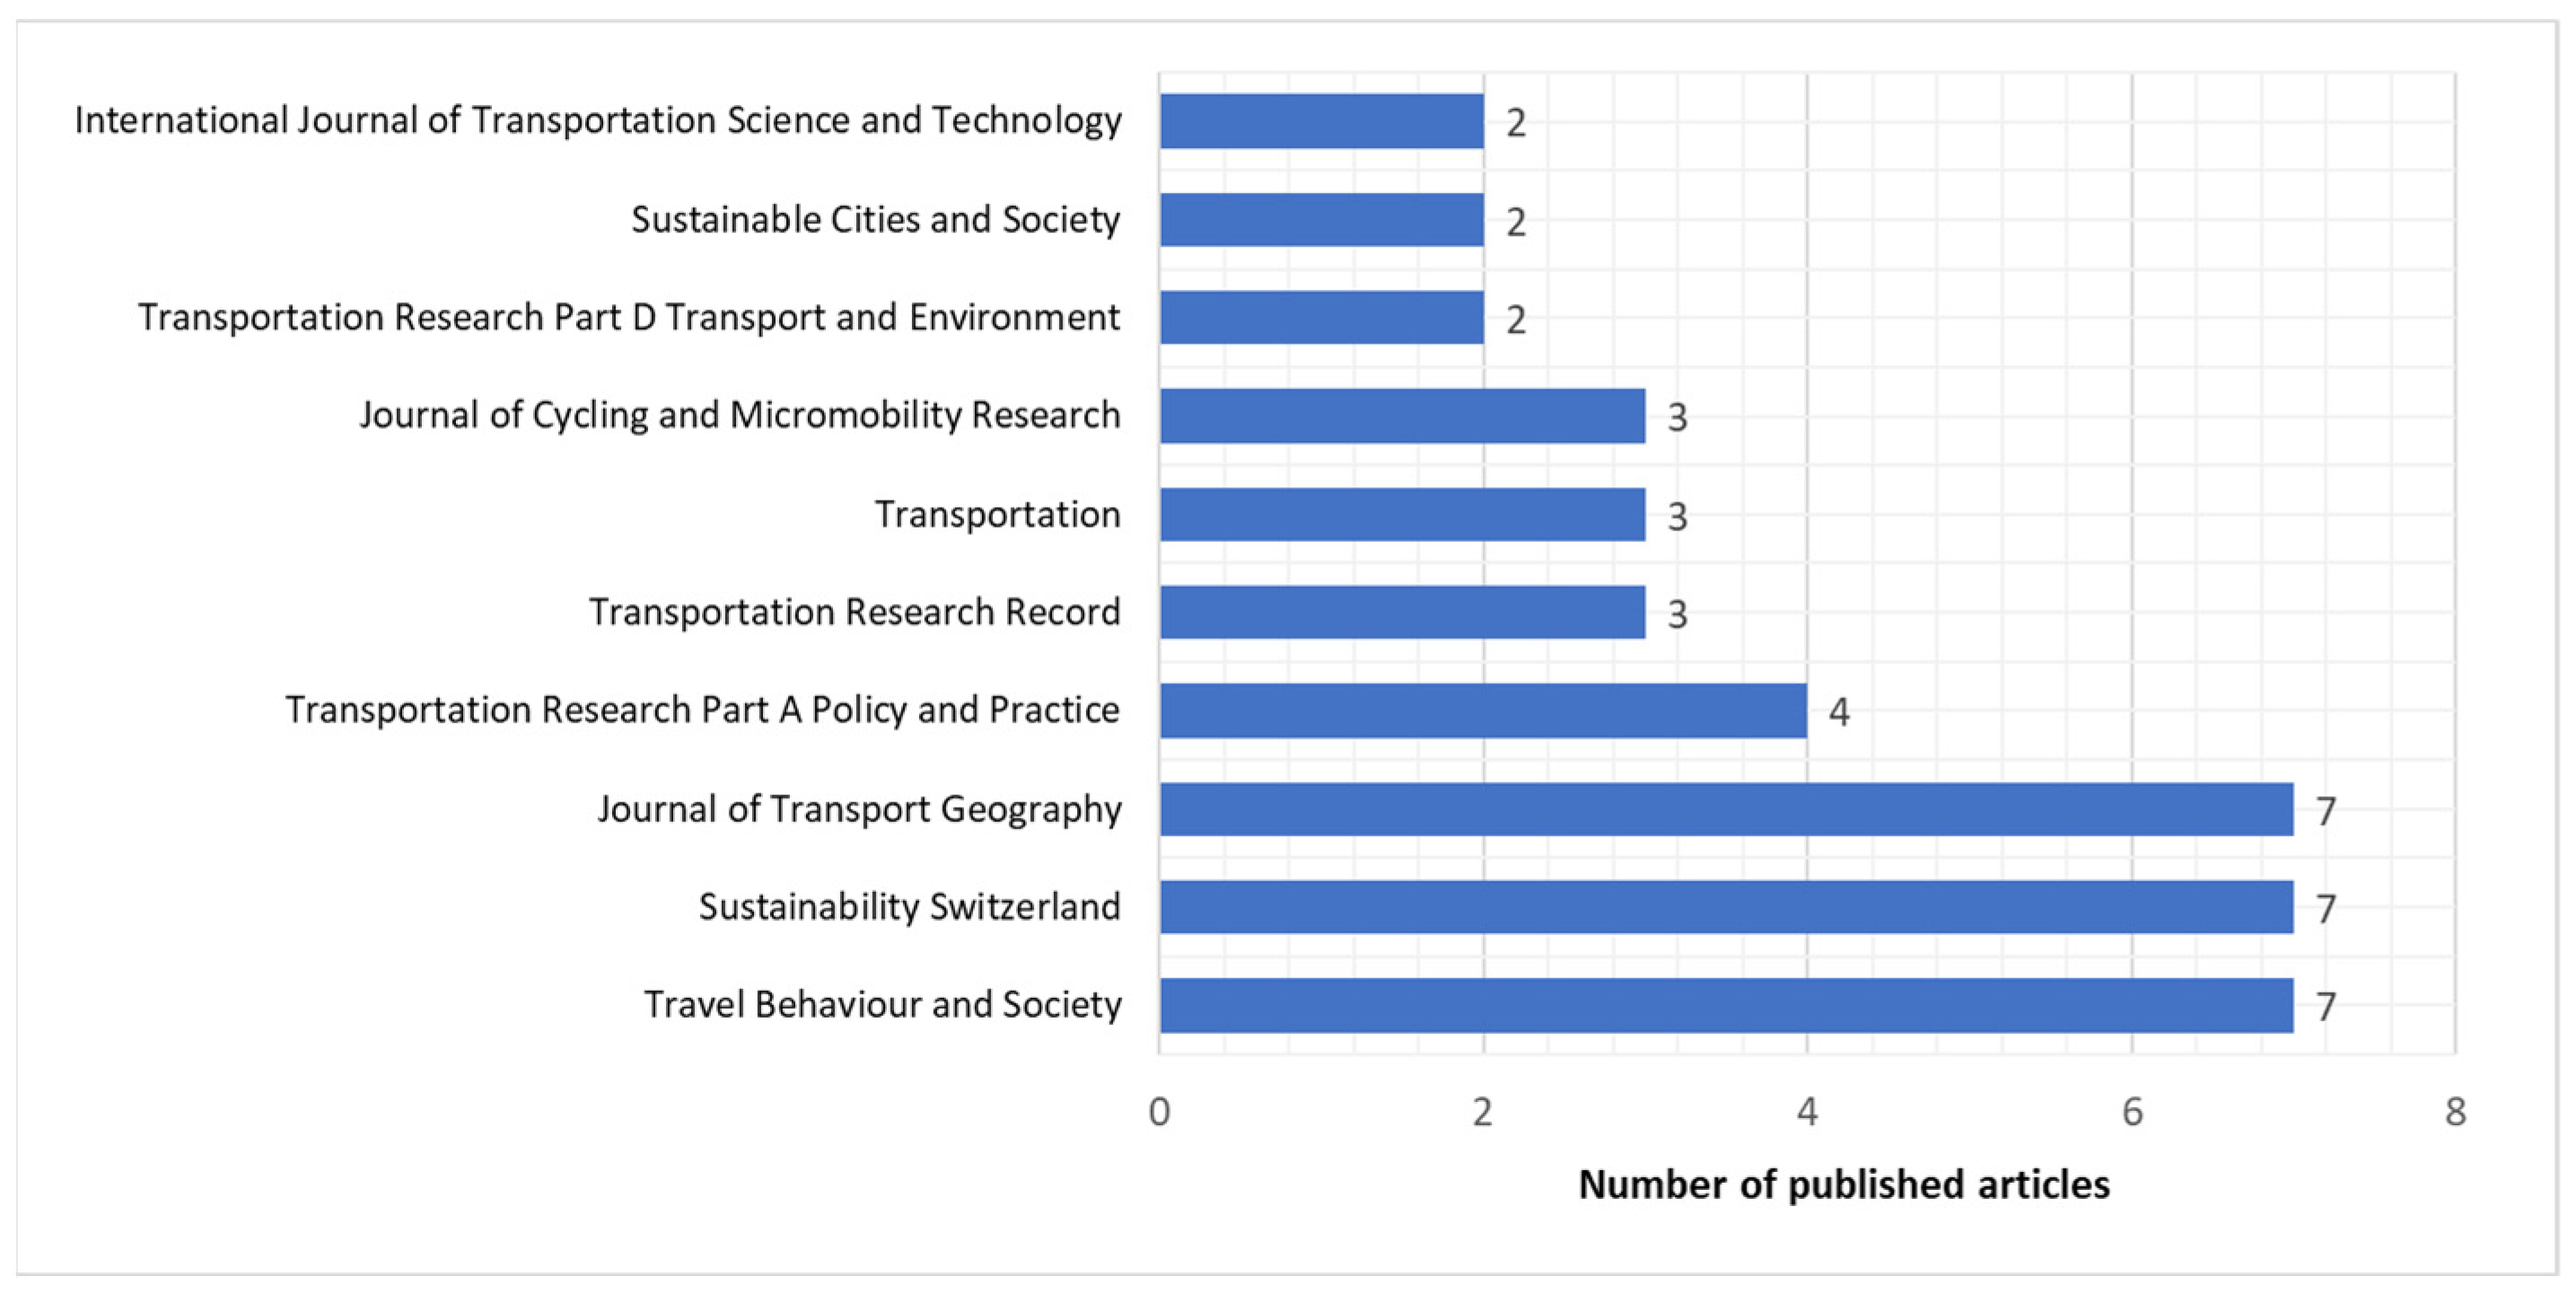
As Figure 4 shows, the distribution of published articles related to micromobility across various academic journals. The highest number of publications appeared in Travel Behaviour and Society, Sustainability (Switzerland), and the Journal of Transport Geography, each with seven articles. These are followed by Transportation Research Part A: Policy and Practice, which includes four publications. The data indicate that micromobility research is primarily featured in journals focused on transport behavior, sustainability, and policy, highlighting the interdisciplinary nature of the field.
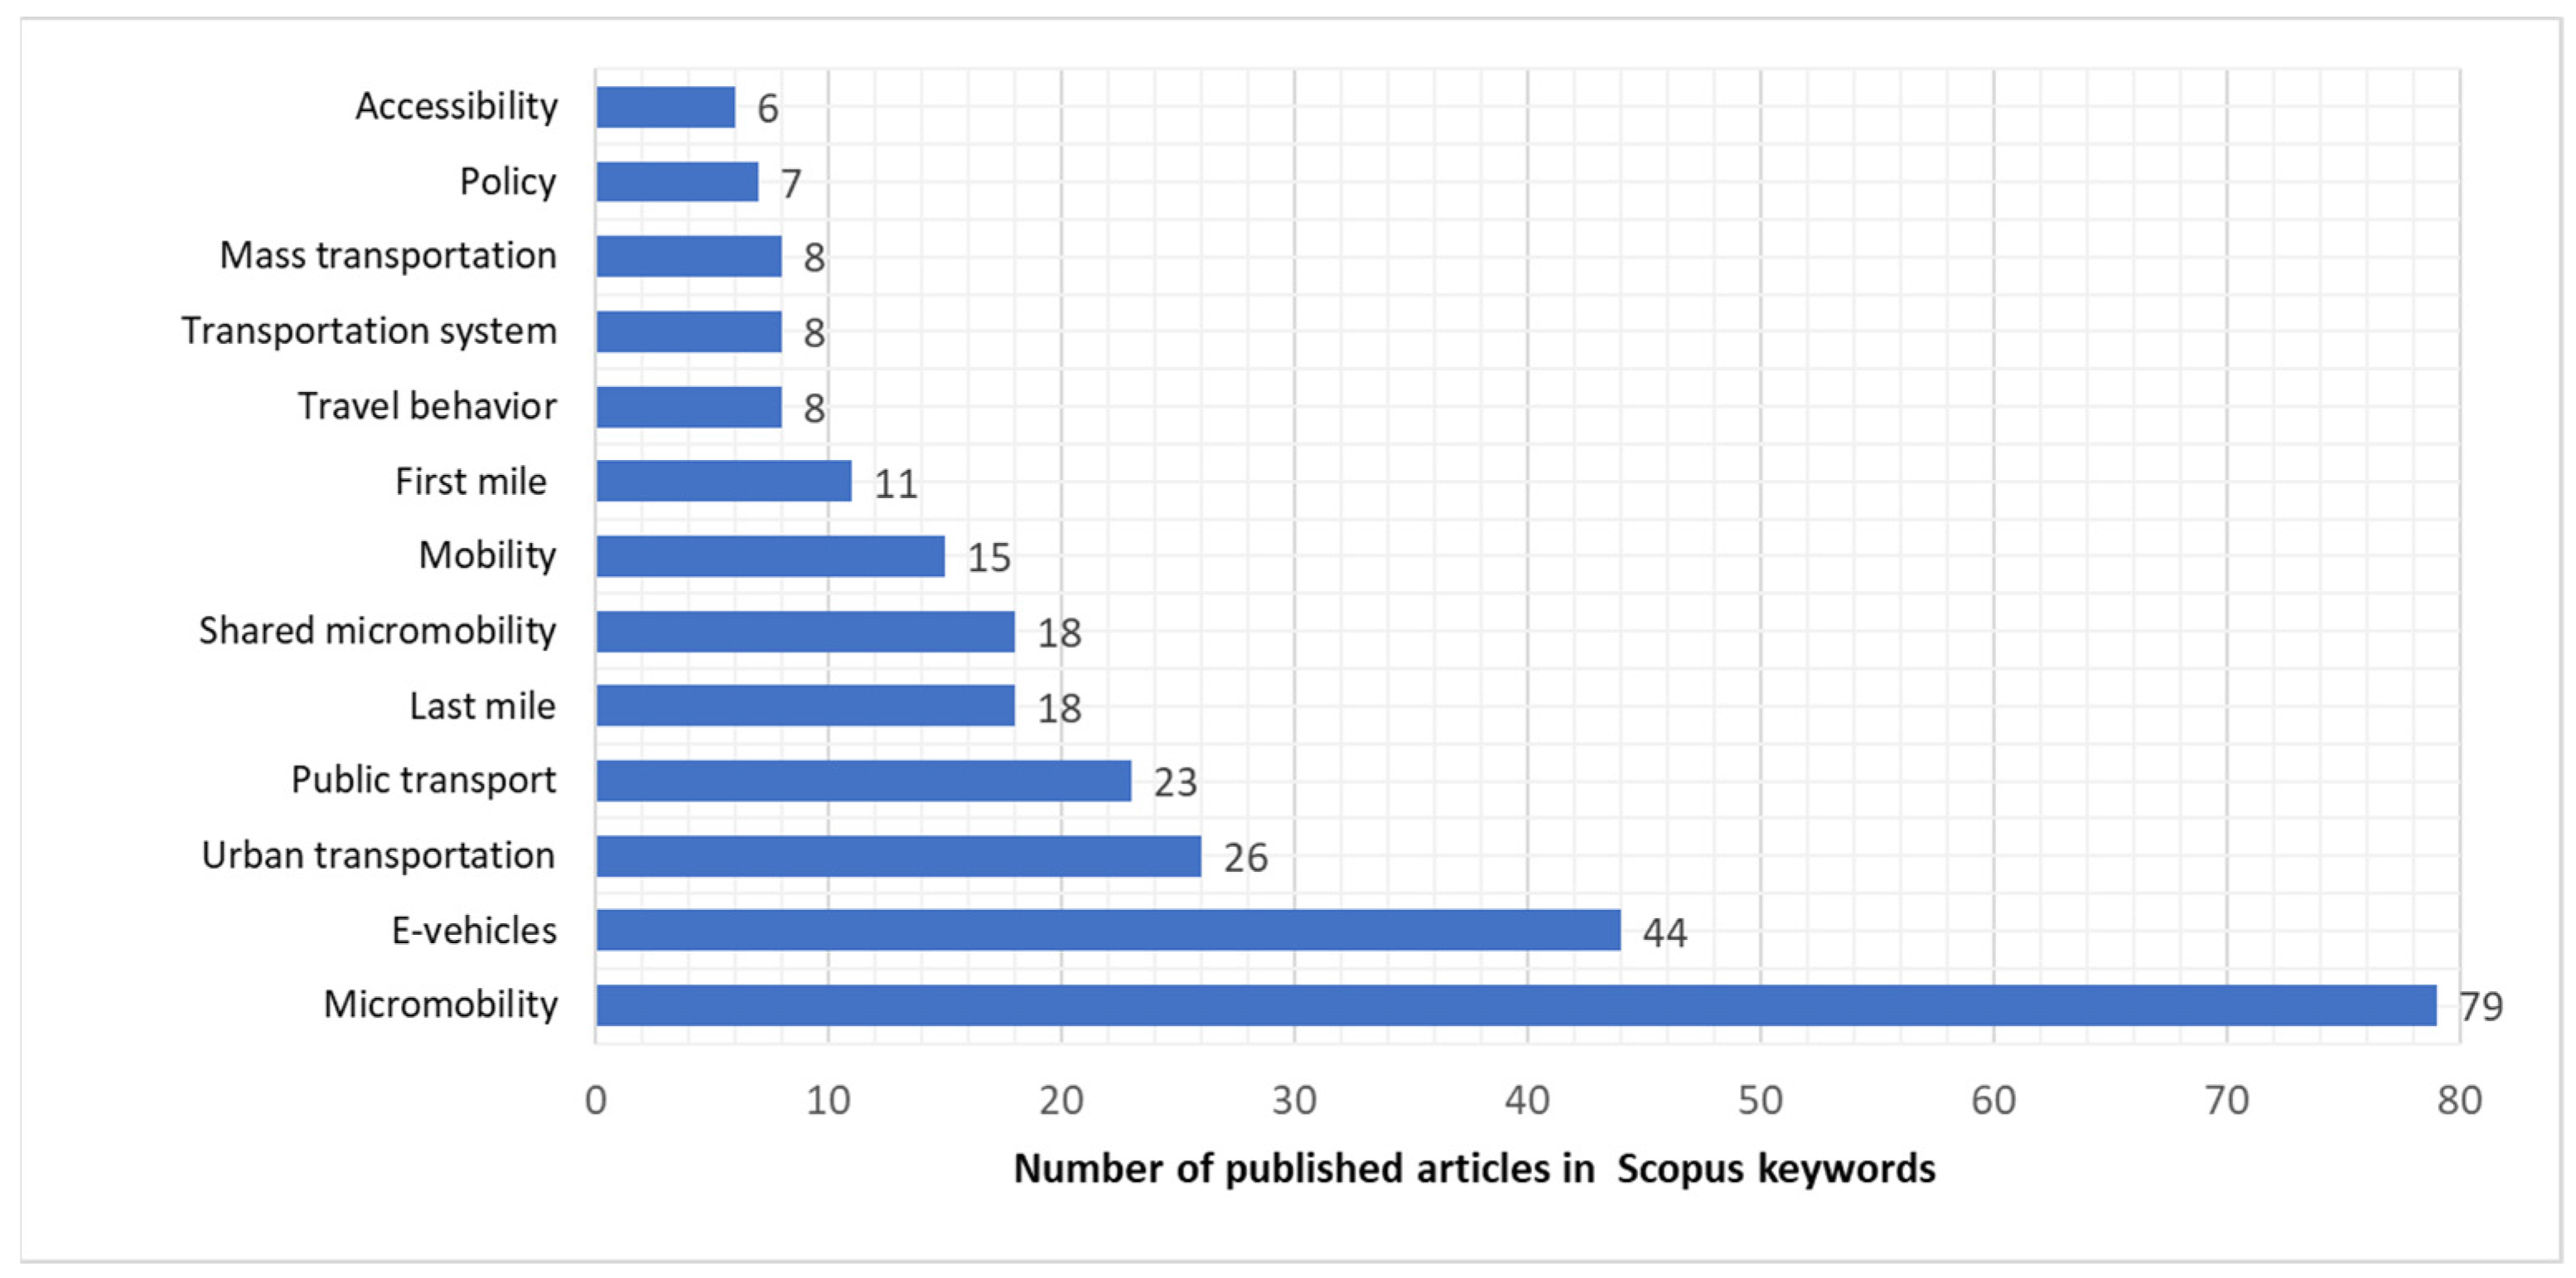
We have analyzed the distribution of articles in the following categories: micromobility, e-vehicles including e-scooters, urban transportation and public transportation, last mile and first mile delivery, shared micromobility, travel behavior, transportation systems, mass transportation, policies and regulations, and accessibility. Figure 5 illustrates the distribution of these categories. The analysis reveals that current research is focused on micromobility, e-vehicles, and urban transportation, reflecting strong interest in technological and operational aspects. In contrast, areas such as accessibility, policy, and mass transportation appear less emphasized, despite their relevance. This imbalance highlights the need for a more comprehensive and multidisciplinary approach, where policy, inclusivity, and system-level coordination are integrated. It also underlines the critical role of optimization in effectively designing and operating micromobility-based last-mile delivery solutions.
In the following step, the 83 articles were reduced after reading them. We excluded articles whose topic did not fit our interest and did not address the optimization of micromobility-based last mile delivery.

2.2. Content Analysis of Available Research Results

In order to comprehensively understand the multifaceted role of micromobility in modern urban transportation systems, this literature review is structured around four key thematic dimensions: integration with public transit, user behavior and social aspects, modeling and network design, as well as safety, perception, and equity. These categories have been selected because they collectively capture the core challenges and opportunities associated with micromobility adoption and management. The integration dimension highlights how micromobility complements and interacts with existing transit networks, which is critical for solving first- and last-mile connectivity issues. Examining user behavior and social factors provides insights into who uses micromobility services and under what conditions, revealing important equity and accessibility considerations. The modeling and network design perspective addresses the technical and planning challenges needed to optimize system efficiency and infrastructure deployment. Lastly, the safety, perception, and equity aspect emphasizes the societal impacts and barriers that influence long-term sustainability and public acceptance. By organizing the review along these four axes, a holistic understanding of the current state of research and practical implications can be achieved.
The integration of micromobility and public transit, particularly in addressing first- and last-mile connections, has become a key focus in urban transportation planning. Liu and Miller (2022) examined how dockless micromobility impacts transit accessibility in Columbus, Ohio, finding that while micromobility generally improves access to public transport, the benefits vary spatially across the city [14]. Similarly, Tyndall (2022) demonstrated that dockless micromobility services complement rail transit by facilitating short trips, highlighting a strong spatial overlap between shared bike usage and light rail ridership [15]. Using a novel dataset, Yin et al. (2024) investigated shared micromobility as a first- and last-mile solution, identifying significant spatiotemporal variations in usage that underline the importance of tailored planning approaches [16]. Shaheen et al. (2021) provided a conceptual overview of micromobility’s evolution in North America, drawing attention to challenges in curb management, safety, and data integration, and calling for policies that better align micromobility services with transit systems [17]. In a case study focused on Sacramento, Mohiuddin et al. (2024) found evidence of a complementary relationship between dockless bike-share systems and transit ridership, with shared bikes increasing transit use under certain conditions [18]. A systematic review by Cui and Zhang (2024), including grey literature, concluded that successful integration hinges on effective coordination, infrastructure development, and digital integration [19]. Beale et al. (2023) explored integrated payment systems between micromobility and public transit in Seattle, concluding that payment integration can enhance transportation equity [20]. Employing machine learning, Vinagre Díaz et al. (2024) classified e-scooter trips based on their relationship to public transit and found a significant share of trips either substituting or connecting with transit [21]. Javadiansr et al. (2024) conducted a spatiotemporal analysis of e-scooter and public transit usage in Tehran, arguing that integration strategies must consider time-of-day patterns and network connectivity [22].
Beyond integration, user behavior and social aspects of micromobility also play a critical role. Campisi et al. (2021) highlighted gender disparities in e-scooter use in Sicily, showing that women are less likely to use e-scooters due to safety and infrastructure concerns [23]. Parnell et al. (2023) similarly found that women perceive higher risks with electric micromobility and emphasize the importance of design and safety for adoption [24]. In Sweden, Wallgren et al. (2023) compared media portrayals of e-scooters with real user experiences, finding more positive perceptions than media narratives suggested [25]. Public perceptions in Poland studied by Turoń et al. (2023) revealed general acceptance of shared e-scooters, though parking and infrastructure issues remain concerns [26]. Kim et al. (2023) tracked multi-year e-scooter travel behavior in Portland, identifying consistent usage patterns and key socio-demographic influences [27]. In Braga, Portugal, Dias et al. (2024) found convenience, cost, and environmental awareness as major factors driving e-scooter use [28]. Romm et al. (2022) used Boston data to show how trip purpose and timing significantly influence micromobility modal choices for first- and last-mile travel [29]. Azimi et al. (2021) analyzed mode choices for accessing transit stations, noting that trip length, income, and land use affect micromobility adoption [30]. Hong et al. (2023) identified strong preferences for e-scooters in mixed-use urban parking areas [31].
On the modeling and network design front, Phithakkitnukoon et al. (2021) applied deep learning to predict spatiotemporal demand for e-scooter sharing with high accuracy, supporting efficient fleet management [32]. Luo et al. (2021) developed an optimization model for designing intermodal networks combining micromobility and on-demand transit, accounting for uncertainty and demand variability [33]. Arias-Molinares et al. (2023) used space-time GIS tools to identify spatial determinants for mobility hub placement, emphasizing land use and ridership patterns [34]. Colovic et al. (2024) introduced a multi-objective model optimizing e-scooter parking location considering accessibility, traffic flow, and parking efficiency [35]. Kazmaier et al. (2020) conducted a life-cycle analysis of electric scooters, concluding sustainability depends heavily on lifespan and usage intensity [36]. Hamerska et al. (2022) proposed the MMQUAL model to assess service quality in shared micromobility, incorporating reliability, availability, and environmental impact [37]. Schwinger et al. (2022) found that micromobility often fills spatial gaps not covered by transit through spatiotemporal comparisons [38]. Oliveira et al. (2022) analyzed freight and public transit infrastructure integration in Brazilian cities by locating lockers, providing models for medium-sized urban areas [39]. Arias-Molinares et al. (2023) again emphasized proximity to transit lines and commercial zones in hub location [40]. Zhang et al. (2024) distilled policy lessons for regulating e-scooters, emphasizing data transparency and inter-agency coordination [41].
Safety, perception, and equity also remain crucial considerations. Sundqvist-Andberg et al. (2021) evaluated electric scooter sharing from sustainability and safety perspectives, recommending infrastructure and governance improvements for long-term viability [42]. Štefancová et al. (2022) used statistical analysis to show that micromobility use increased during the COVID-19 pandemic as people avoided public transit [43]. Huang et al. (2024) linked high e-scooter use in Los Angeles and Washington, D.C. to younger populations and dense transit corridors [44]. Dzięcielski et al. (2024) identified accessibility, density, and cycling infrastructure as key factors influencing bike-share demand in Milton Keynes, UK [45]. Eom et al. (2023) surveyed Seoul subway users, finding preferences for bike-sharing and scooters due to speed and flexibility [46]. Nawaro (2021) explored competition and coexistence between e-scooters and shared bikes, noting context-dependent effects on public transit [47]. Miller et al. (2023) contributed technical data on cargo bicycle tire behavior, supporting more accurate micromobility simulation models [48]. Aguilera-García et al. (2024) analyzed Madrid data to identify income, age, and prior experience as significant predictors of shared and private e-scooter use [49]. Recent studies have also emphasized the role of cargo cycles in sustainable last-mile transport. For example, findings by Nrayana et al. (2022) from Europe’s largest cargo cycle testing project showed that both operational factors and policy measures strongly influence whether businesses adopt such vehicles [50]. These insights are directly relevant to our research, as they underline that micromobility-based food logistics not only depend on optimization models but also on broader adoption dynamics and supportive frameworks that enable small-scale producers to integrate sustainable delivery solutions.

2.3. Critical Analysis of Published Research Results and Research Gap Identification

The detailed overview of the reviewed studies, including their main focus, methodology, and key findings, is summarized in Table 1. This table facilitates a clear comparison across different thematic categories and supports the structured analysis presented in the text.
The reviewed literature provides a broad and in-depth overview of micromobility’s role in urban transport systems, particularly in relation to public transit integration, user behavior, modeling approaches, and safety or equity concerns. These studies highlight the growing importance of micromobility as a complementary mode of travel and underline its potential to reshape how people navigate cities. However, one important application area remains largely overlooked: the use of micromobility to support the logistical needs of small-scale, local producers.
Small-scale producers, such as urban farmers, artisan food makers, and rural producers supplying local markets, often face significant barriers in accessing urban distribution networks. Their operations are typically decentralized, low-volume, and geographically dispersed, which makes conventional freight systems inefficient or economically unviable for their needs. In this context, micromobility could offer a transformative alternative. Its flexibility, low operational cost, and environmental sustainability make it particularly well-suited for short-distance distribution within cities or between peri-urban production sites and urban marketplaces.
Despite these opportunities, current research does not sufficiently address how micromobility could be systematically integrated into the supply chains of small producers. There is a clear lack of studies focusing on the planning, coordination, and optimization of such systems. As cities seek to promote local food systems, reduce emissions, and support more inclusive urban economies, exploring micromobility-based logistics for small producers represents a promising direction for future research and policy development.

3. Materials and Methods

In recent years, small-scale urban food producers have faced growing pressure to deliver their products in ways that are both efficient and environmentally responsible. Many of them rely on green micromobility solutions, such as cargo bikes or electric scooters, to reach local retailers and customers. While these modes of transport offer clear sustainability benefits, they also come with practical limitations, like restricted carrying capacity and limited vehicle availability. At the same time, producers must deal with varying product types, different customer demands, and the challenges of navigating dense urban areas. These factors make delivery planning increasingly complex. This is where mathematical modeling becomes essential. By translating the logistics problem into a structured optimization framework, we can explore the best possible delivery configurations under real-world constraints. It allows planners to make proper decisions, improve efficiency, and reduce emissions. The following model captures these key aspects and serves as a tool for supporting more sustainable and practical last-mile logistics.
Before formulating the mathematical optimization model, several assumptions were made to ensure clarity and tractability of the problem. These assumptions reflect the characteristics of the urban food logistics system under study and help to balance real-world complexity with the need for a solvable model:
  • Homogeneous delivery tasks within a time window: Deliveries are planned within predefined time windows, and demand is known at the beginning of the optimization process.
  • Vehicle characteristics are fixed: The capacity, speed, and emission factors of micromobility vehicles are considered constant during the planning horizon.
  • No partial deliveries: Each delivery task is assigned in full to one or more vehicles, but cannot be split across different time windows.
  • Deterministic input data: Product supply, customer demand, travel distances, and costs are assumed to be accurately known and do not vary during the optimization.
  • Stable operating conditions: Road conditions, weather, and traffic are assumed not to cause unexpected disruptions within the optimization horizon.
These assumptions are common in logistics optimization research and were adopted to keep the model computationally feasible while still capturing the key challenges of last-mile delivery with micromobility vehicles.
The mathematical model is designed to optimize last-mile deliveries from multiple urban food producers to local retail locations using micromobility vehicles. It considers multiple product types, each with specific weight and volume characteristics, and accounts for both producer supply and customer demand. The model includes constraints on vehicle capacity (in terms of weight and volume), the total number of available vehicles, and optional limits on delivery time and emissions. The objective is to minimize total delivery cost, though the framework allows for alternative or multi-objective formulations. The input parameters of the optimization problem are shown in Table 2.
The model includes two sets of decision variables. The first, q i j k represents the quantity of product type k delivered from producer i to location j, and is a continuous, non-negative variable. The second, x i j , is a binary variable that indicates whether a micromobility vehicle is used to deliver from producer i to location j. These variables allow the model to determine both the optimal allocation of product flows and the activation of delivery routes, while respecting vehicle limitations and system-wide constraints.
The primary objective of the model is to minimize the total delivery cost associated with transporting various product types from multiple urban food producers to several retail locations using micromobility vehicles. Each delivery route between a producer i and a location j is associated with a cost coefficient c i j , which may reflect fuel or electricity use, labor, distance traveled, road conditions, or other logistics related factors. The decision variable q i j k denotes the quantity of product type k transported from producer i to location j. Since each product unit delivered along a given route incurs a proportional cost, the total cost for that specific route and product type is calculated as c i j · q i j k . By summing this cost across all producers, destinations, and product types, the model captures the full cost of all deliveries. Formally, the objective function is
min ijk C c o s t = i I j J k K c i j · q i j k .
While cost minimization is often the primary goal, other objectives may be equally important depending on the priorities of urban food logistics. Two common alternative objectives are minimizing total delivery time and minimizing total CO2 emissions.
The total delivery time objective focuses on reducing the overall time spent transporting goods. This can help improve service speed and freshness of products, which is critical for perishable goods. Here, the time parameter t i j represents the time required to travel from producer i to location j. The objective function is
min ijk C t i m e = i I j J k K t i j · q i j k .
To support sustainability goals, the model can also minimize the carbon footprint of the deliveries. The parameter e i j captures the CO2 emissions per unit delivered along the route from i to j. This objective function is
min ijk C e m i s s i o n = i I j J k K e i j · q i j k .
In practice, decision-makers may want to balance cost, time, and emissions simultaneously. This can be achieved by combining the individual objectives into a single weighted objective function. Let α ,   β , and γ be the weights assigned to cost, time, and emissions, respectively, where α + β + γ = 1 . The combined objective becomes
min ijk C = α · i I j J k K c i j · q i j k + β · i I j J k K t i j · q i j k + γ · i I j J k K e i j · q i j k .
By adjusting these weights, logistics service providers can emphasize economic efficiency, delivery speed, or environmental impact according to strategic priorities.
The first constraint ensures that the total quantity of each product shipped from a given producer does not exceed the producer’s available supply. It reflects the limited production capacity and stock levels typical of small-scale urban food producers. By enforcing this constraint, the model prevents unrealistic over-allocation of products beyond what is physically available.
i I , k K :   j J q i j k P i k .
The second constraint guarantees that the total quantity of each product delivered to every retail location meets or exceeds its demand. It ensures that customer needs are fully satisfied and that no location receives less than required. This is critical for maintaining service quality and avoiding shortages in the urban food distribution network.
j J , k K :   i I q i j k D j k .
The third constraint ensures that the total weight of products loaded on a micromobility vehicle does not exceed its maximum weight capacity. Similarly, it limits the total volume of products to stay within the vehicle’s spatial capacity. These combined weight and volume restrictions guarantee that each delivery route is feasible given the physical limitations of the vehicles used.
i I , j J :   k K W k · q i j k C w · x i j .
i I , j J :   k K V k · q i j k C v · x i j .
The fourth constraint limits the total number of delivery routes to the number of available micromobility vehicles. This ensures that the planned deliveries do not exceed the fleet’s capacity. By doing so, the model respects real-world resource limitations and helps prevent overbooking of vehicles.
i I j J x i j M .
The fifth constraint limits the delivery time for each individual route to a specified maximum. This means no single trip from a producer to a delivery location can take longer than the allowed time threshold. Such a restriction helps ensure timely deliveries, which is crucial for maintaining the quality and freshness of perishable goods. It also improves customer satisfaction by preventing excessively long wait times for any delivery.
i I , j J :   t i j · x i j T m a x .
The optional emissions constraint limits the total CO2 emissions generated by the delivery fleet to a predefined maximum. This helps ensure that the logistics operation aligns with environmental sustainability goals and local regulations. For electric micromobility vehicles, a virtual emission value can be calculated based on the CO2 produced during electricity generation, allowing the model to capture indirect environmental impacts. Incorporating this constraint encourages selecting more efficient routes and product allocations that minimize the overall carbon footprint.
i I j J k K e i j · q i j k E m a x .
The seventh constraint enforces that the routing decision variables x i j are binary, meaning they can only take values of 0 or 1. A value of 1 indices that a micromobility vehicle is assigned to deliver goods from producer i to location j, while 0 means no delivery occurs on that route. This binary restriction is essential for accurately modeling route activation and ensuring clear, implementable delivery plans. It prevents fractional or partial route assignments that would be impractical in real-world logistics operations.
i I , j J :   x i j 0,1 .
The optimization problem described above was implemented and solved using OpenSolver version 2.9.3 within Microsoft Excel. This open-source tool was selected for its ability to efficiently handle both large-scale linear and mixed-integer optimization problems, which is essential given the complexity and size of the formulated model. OpenSolver utilizes powerful solvers such as CBC (Coin-or branch and cut), enabling the solution of models that include binary variables, capacity constraints, and multiple objectives. Its integration with Excel also allowed for clear data input, real-time result interpretation, and flexible scenario analysis. By leveraging OpenSolver’s robust algorithms, we ensured that the obtained results were both accurate and computationally reliable.
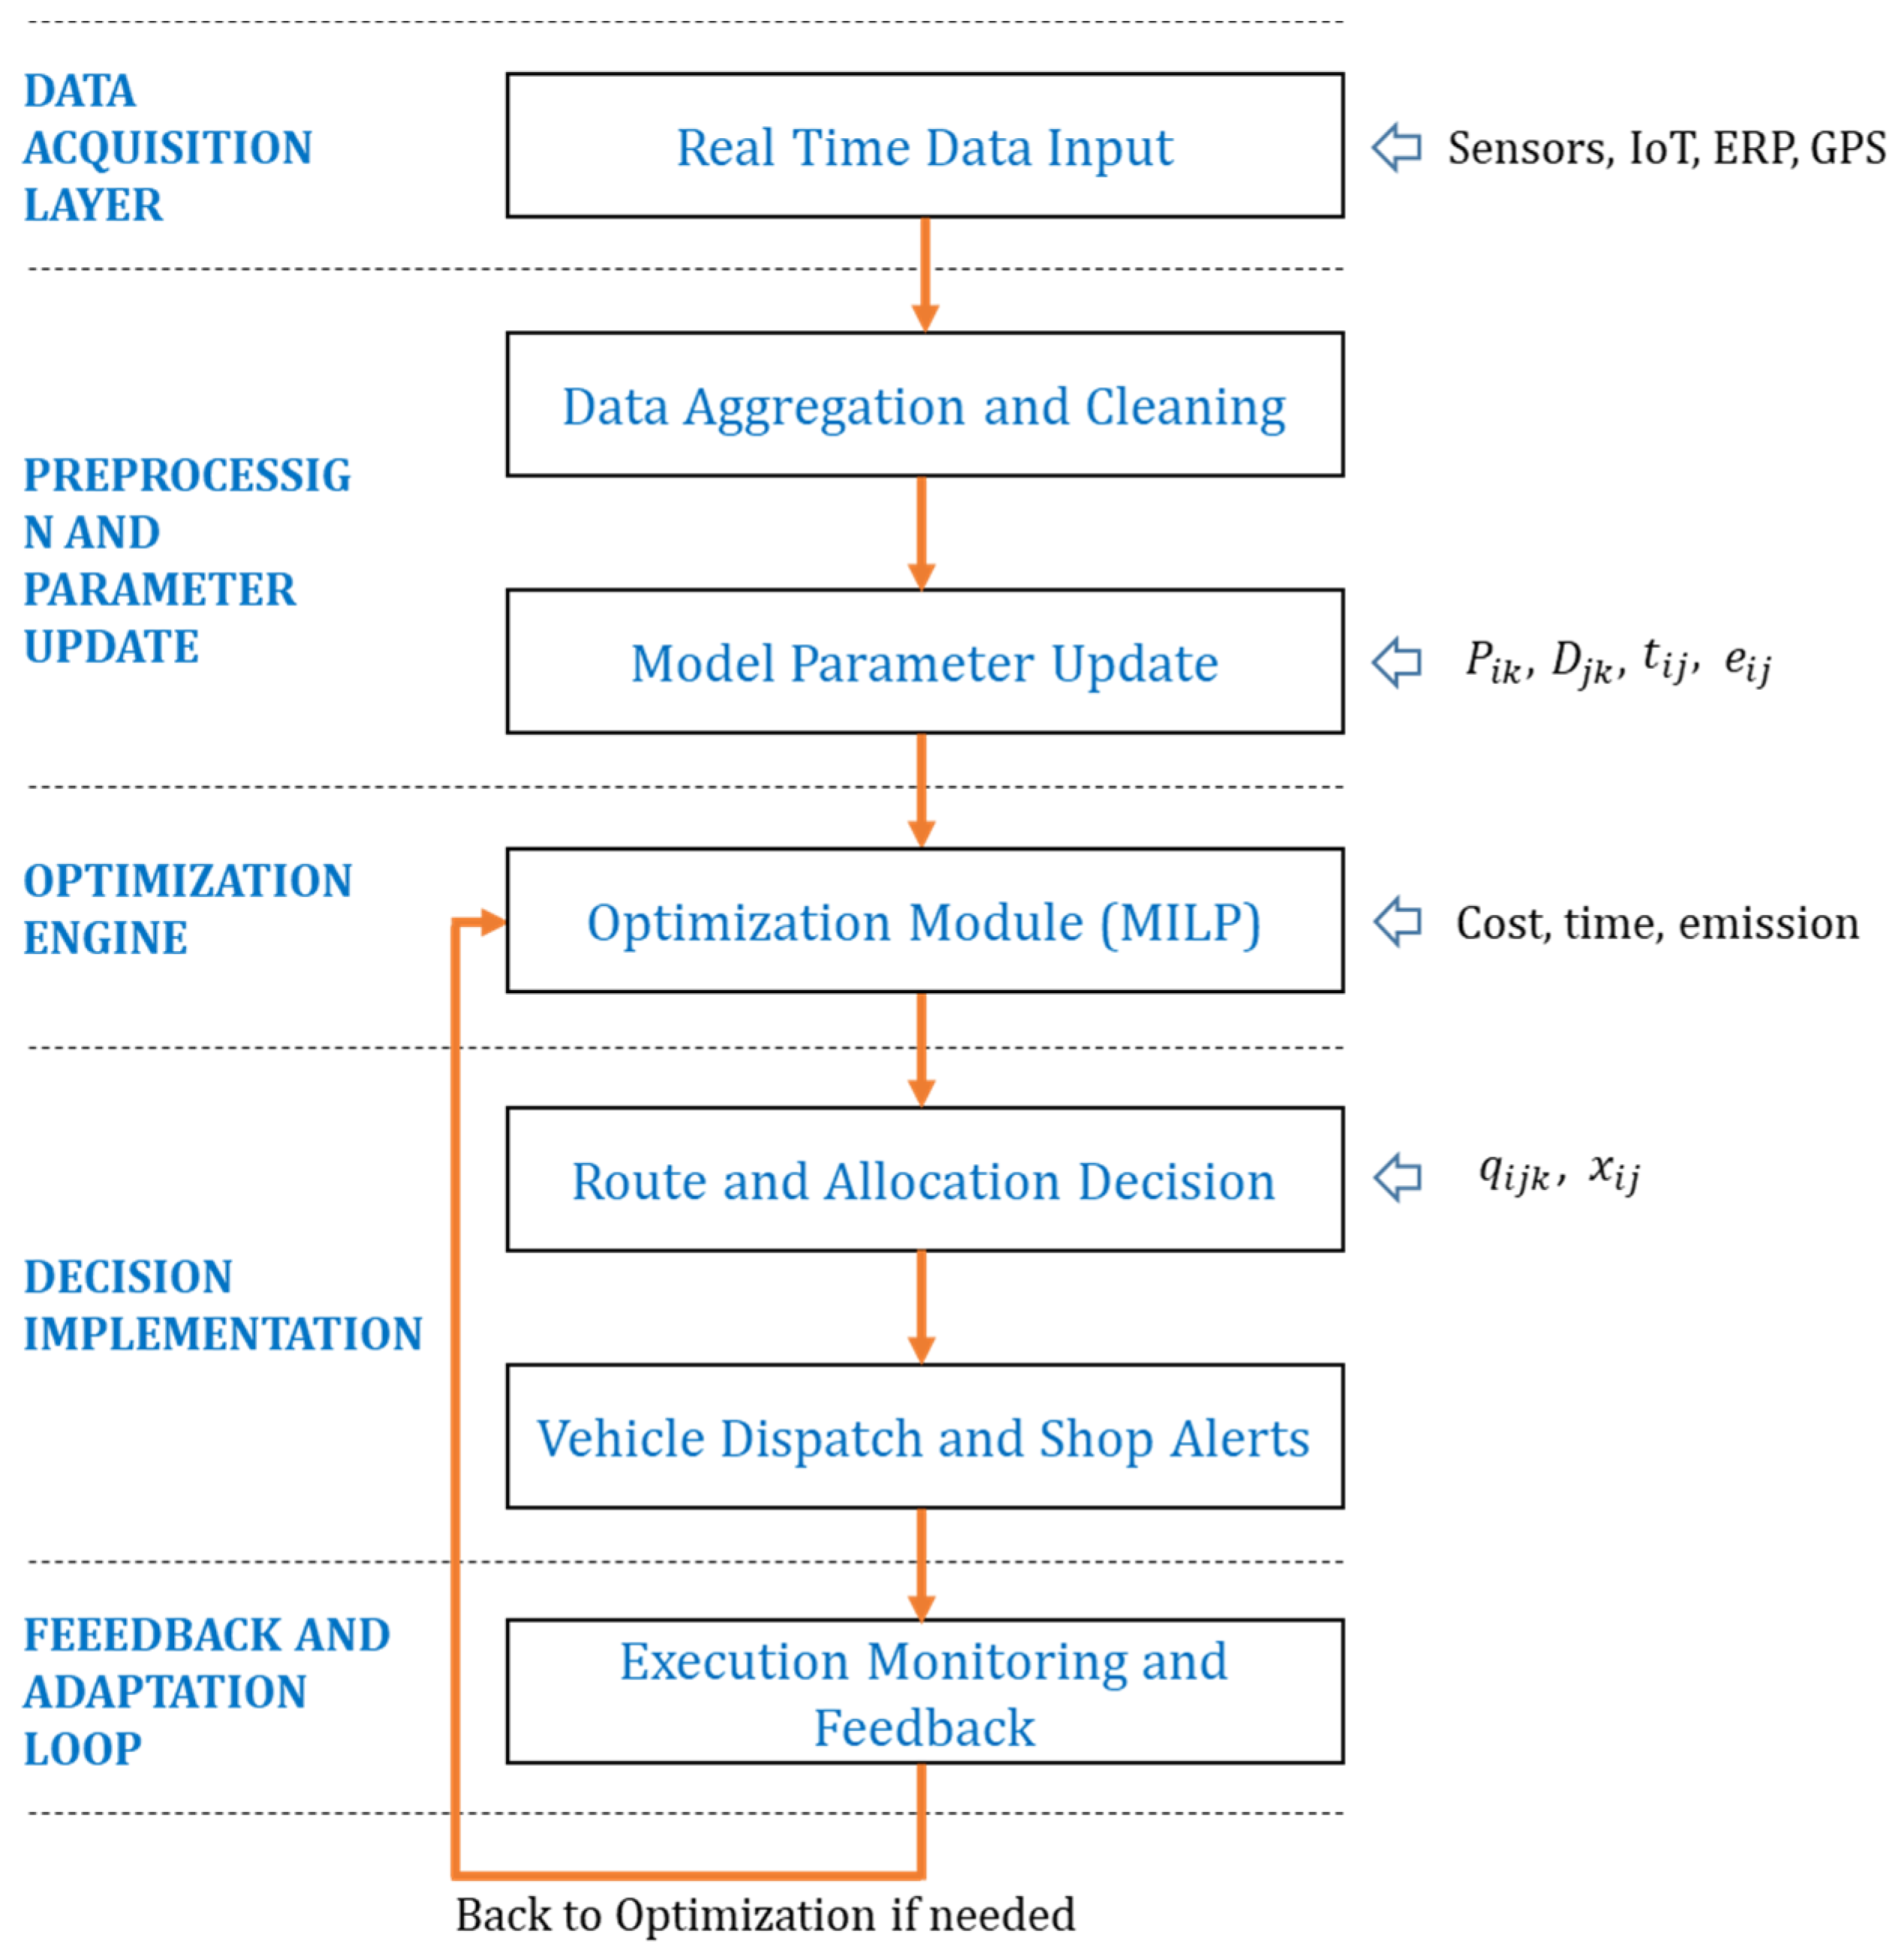
The optimization process begins with the real-time acquisition of data from various sources, including IoT sensors, ERP systems, and GPS devices (see Figure 6). These sources provide up-to-date information on product availability at producers, current customer demand at retail locations, vehicle statuses such as position and availability, as well as dynamic factors like travel times and emission rates. This incoming data is collected and aggregated within a centralized system, where it undergoes preprocessing to ensure accuracy and compatibility with the optimization model’s requirements.
Once cleaned and validated, the data is transformed into input parameters for the mathematical model, including quantities such as product supply, demand, transportation costs, delivery times, and emission factors. Operational constraints, such as vehicle capacity limits and maximum allowable delivery times or emissions, can also be dynamically adjusted based on real-time conditions or strategic priorities.
With updated parameters in place, the optimization engine is triggered to determine the most efficient allocation of product deliveries and activation of delivery routes. Depending on the priorities, the model can minimize delivery cost, time, emissions, or a weighted combination of these objectives. The output consists of detailed delivery schedules and routing decisions that respect vehicle capacities and system constraints.
These optimized decisions are then communicated to the fleet management and dispatch systems, enabling real-time coordination of micromobility vehicles and informing delivery personnel through mobile applications or operator dashboards. This seamless transfer of instructions supports effective and timely execution of the planned routes.
Throughout the delivery process, continuous monitoring captures execution performance, including any deviations, delays, or operational issues. This feedback loop allows the system to adapt dynamically by triggering re-optimization or rescheduling when necessary, ensuring resilience and responsiveness to changing urban logistics conditions. This integrated approach leverages Industry 4.0 technologies to support sustainable, efficient, and flexible last-mile deliveries.

4. Results

This section illustrates the practical application of the algorithm introduced in Section 3 through two comprehensive case studies. These case studies are designed to validate the effectiveness and adaptability of the proposed real-time optimization approach within the context of green micromobility-based last-mile logistics, specifically tailored to the distribution needs of small-scale urban food producers. The first case study employs synthetically generated data to clearly demonstrate the operational steps involved in the algorithm’s implementation. This includes the initialization of parameters, the optimization process itself, and the interpretation of the resulting output. It offers a controlled environment to showcase the algorithm’s functionality, enabling a detailed examination of its numerical performance, responsiveness, and potential advantages for sustainable urban logistics. The second case study moves beyond theoretical analysis and applies the algorithm to a real-world scenario using empirical data collected from the city of Miskolc, Hungary. This case highlights the algorithm’s performance under actual urban conditions, addressing real demand patterns, road network constraints, and delivery requirements. The results from this application provide insight into the practical feasibility, benefits, and potential challenges of deploying micromobility solutions for last-mile logistics in real urban settings.

4.1. Case Study with Simulated Data

However, the application of real-world data provides the most relevant insights into the effectiveness of the proposed model and solution method, but at the same time, the inclusion of a simulated case study adds value for two main reasons:
  • It serves as a means of model validation in a controlled environment. By working with simulated data, we can ensure that all parameters are clearly defined, the constraints are applied correctly, and the solving process can be transparently demonstrated step by step. This helps to confirm that the optimization model functions as intended before being applied to more complex and less predictable real-world datasets.
  • The simulated case study plays a complementary role to the real-world analysis. While the real-world case study demonstrates the model’s practical feasibility and effectiveness under actual operating conditions, the simulated case helps to highlight the inner mechanics of the optimization and makes the methodology more accessible to readers. Together, the two cases strengthen the paper by combining methodological clarity with empirical validation.
In this model, we test the developed model and the solution algorithm using simulated data, which allows for a clear visualization of the obtained results. This, in turn, enables us to verify the quality of the solution. In the present model, the following parameters are considered as given:
  • Set of three producers: i I D _ 13 , I D _ 14 , I D _ 15 ,
  • Set of eight delivery locations (customers): j I D _ 16 , I D _ 17 , , I D _ 23 ,
  • Set of three product types (e.g., bread, vegetables): k I D _ A ,   I D _ B ,   I D _ C ,
  • Delivery tasks’ volume and weight within the predefined time-window of real-time optimization, which obtains its results from the available quantity of product k at producer i in [pcs], the weight per unit of product k in [kg] and the volume per unit of product k in [dm3] (see Table 3).
  • Real-time location of micromobility vehicles (cargo e-trikes and e-scooters);
  • Location of producers and customers;
  • Route matrix among real-time location of free, idle micromobility vehicles, producers and customers based on the above locations (see Table 4 and Table 5).
  • Cost per unit in [EURO/pcs] (see Table 6);
  • Delivery speed of vehicle i [km/h] (see Table 6);
  • CO2 emission of vehicles in [g/km] (see Table 6);
  • Weight capacity of one micromobility vehicle in [kg/vehicle] (see Table 6);
  • Volume capacity of one micromobility vehicle in [dm3/vehicle] (see Table 6);
  • Total number of available micromobility vehicles is 12.
The model was solved using OpenSolver version 2.9.3 within Microsoft Excel, which employs the CBC (Coin-or Branch and Cut) algorithm for handling linear and mixed-integer optimization problems. This method was chosen because
  • It can efficiently solve large-scale optimization models with binary decision variables, which are essential for modeling vehicle allocation and capacity-constrained delivery routes;
  • It ensures accurate and reliable results that reflect the complexity of real-world logistics systems;
  • Its integration with Excel allows for transparent data input, immediate interpretation of results, and flexible scenario analysis;
  • As an open-source tool, it is cost-effective and widely applicable for both scientific research and practical logistics planning.
The optimal assignment matrix is shown in Table 7. The resulting length of the optimized delivery routes, delivery costs and virtual CO2 emission is shown in Table 8.
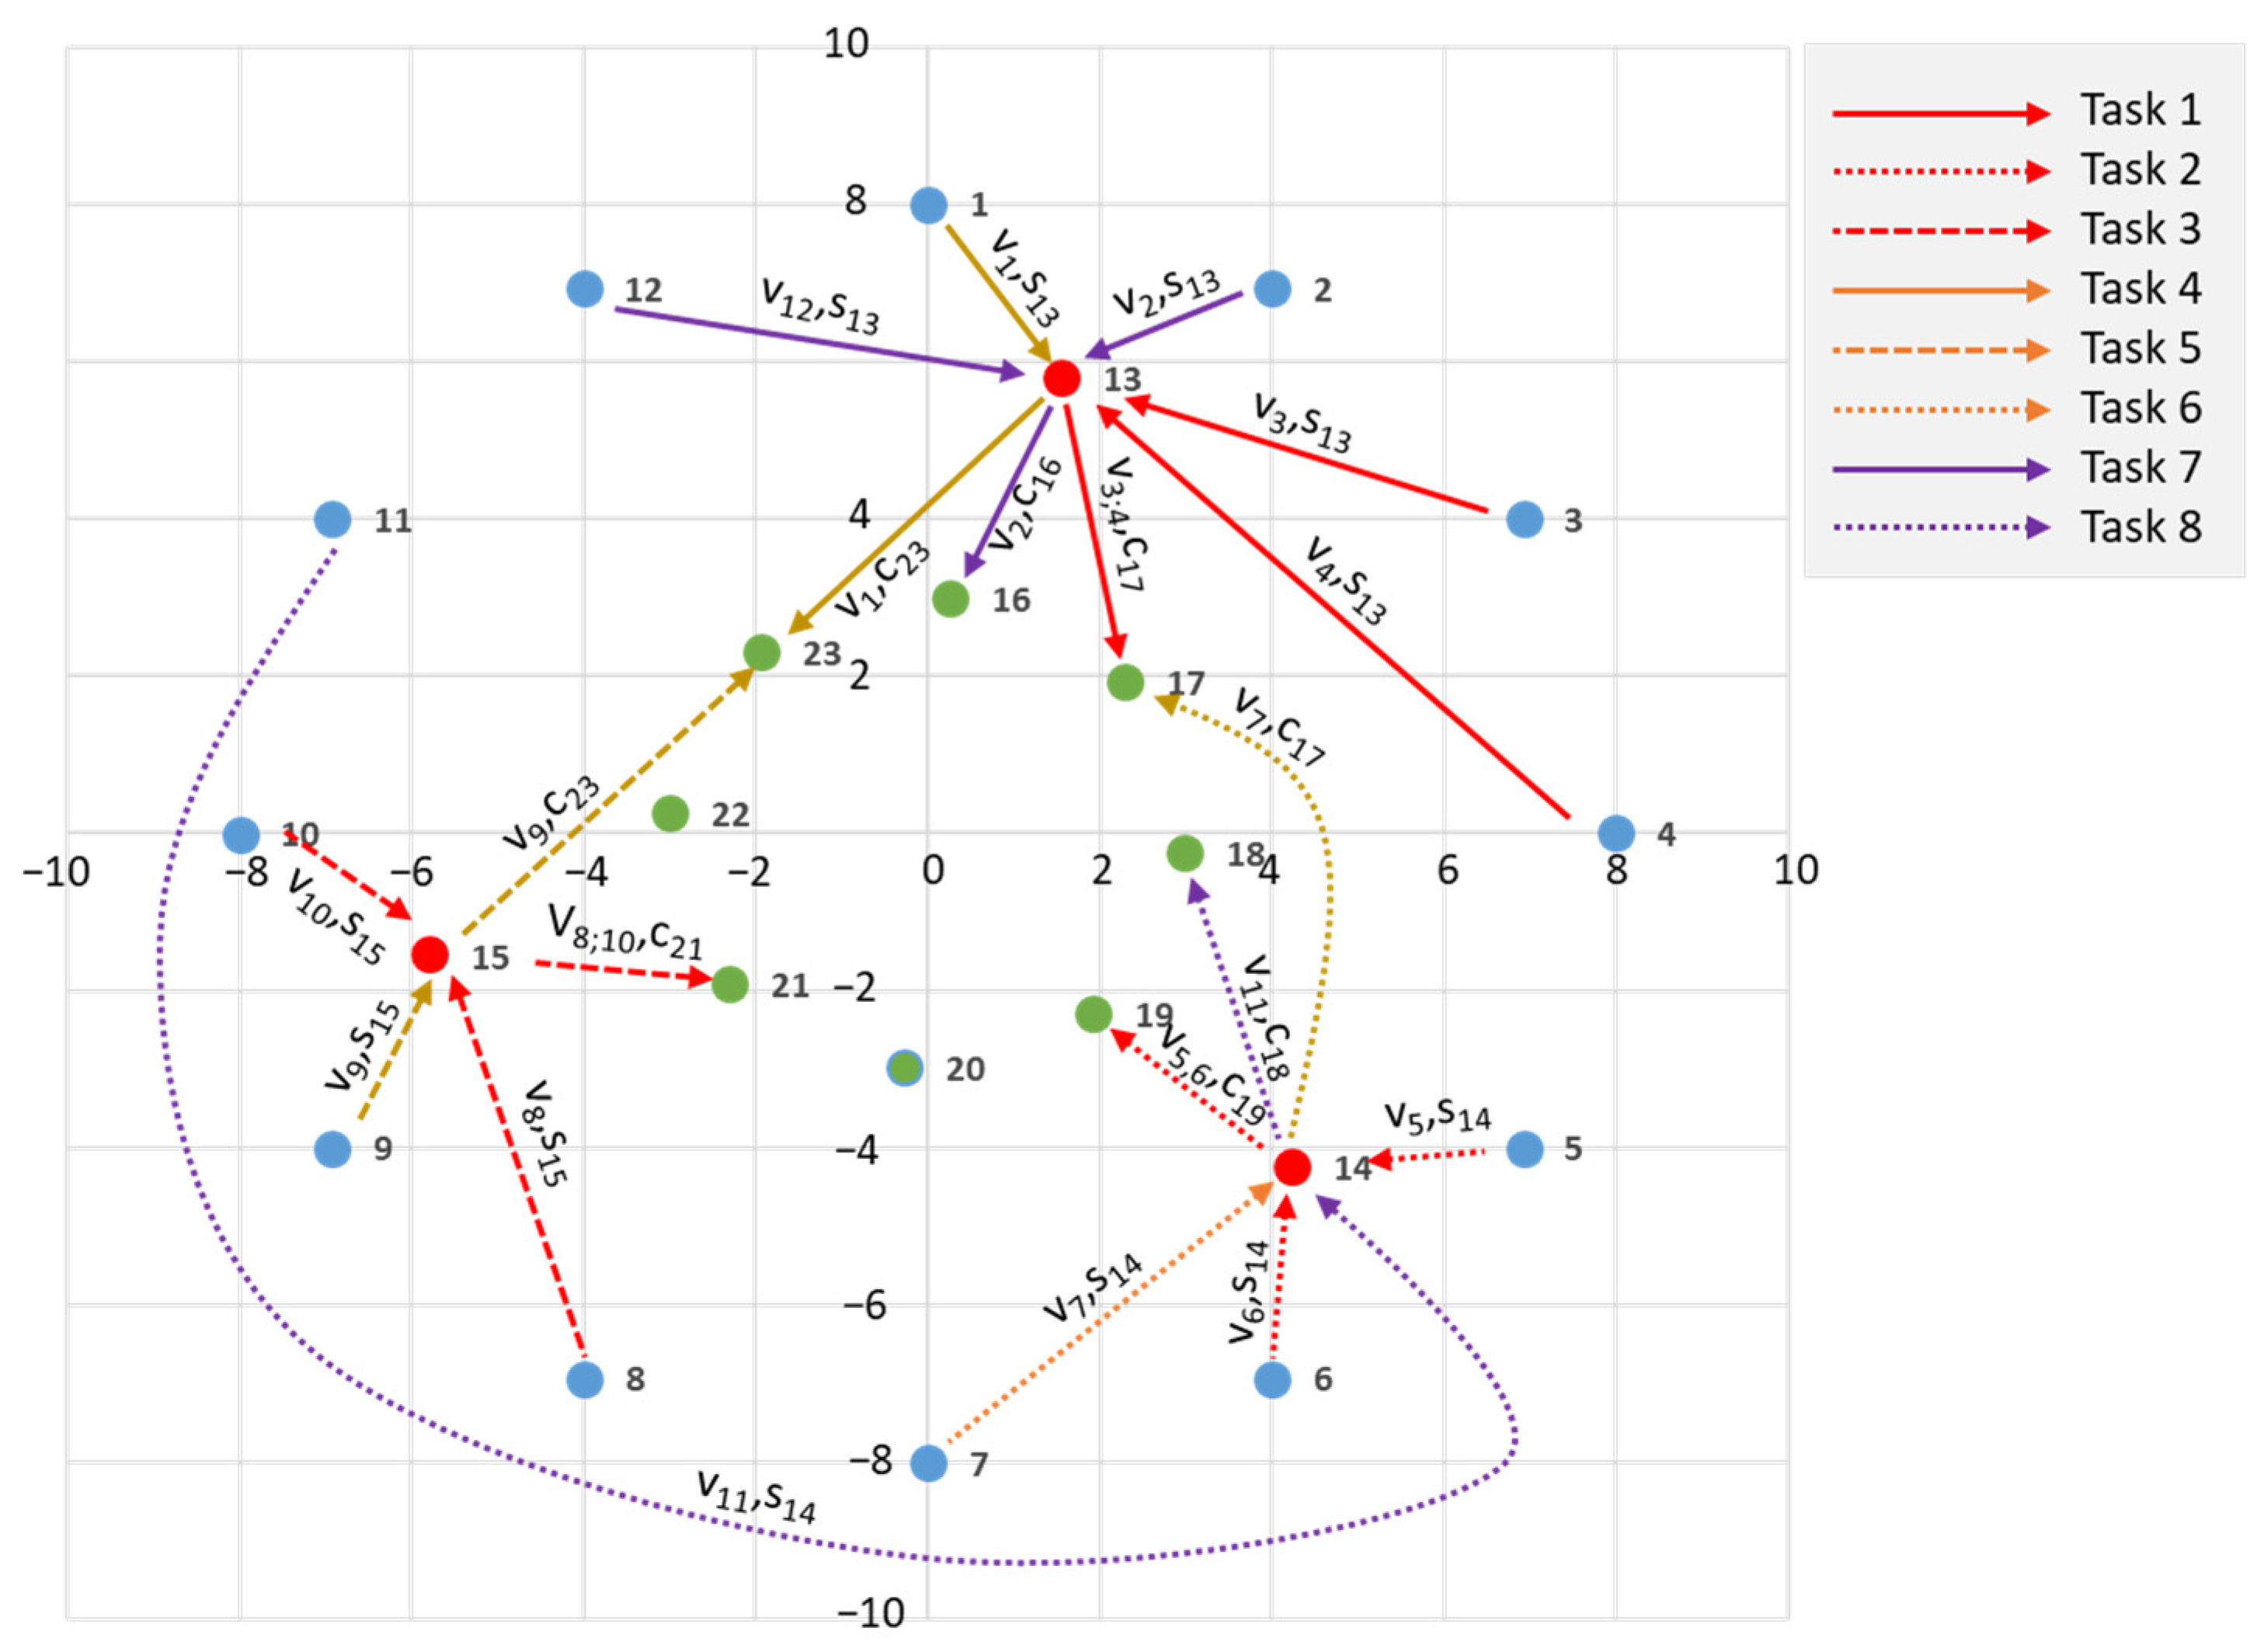
The solution to the optimization problem is illustrated in Figure 7. The blue-marked points (ID_1–ID_12) indicate the positions of the idle micromobility vehicles, the red points (ID_13–ID_15) represent the locations of the set of three producers, while the eight green points correspond to the eight delivery locations (ID_16-ID_23). Due to the weight and volume constraints of the micromobility vehicles, some tasks required multiple vehicles to fulfill them. However, it was not always possible to assign each task to the nearest idle vehicle. For example, in the case of Task 8, vehicle 11 travels to producer ID_14 and delivers the goods to customer ID_18. In this optimization scenario we have taken into consideration a coal-based electricity generation. In this case the social cost of carbon was taken into consideration with 0.00025 EUROcent/g CO2. The weighting factors of the objective function are the same: α = β = γ = 1 / 3 . In this case study, the objective function value was EUR 216.82, representing the total cost of the real-time scheduled delivery operations within the predefined time window. The scenario includes eight delivery tasks from three producers to eight customers, taking into account 12 idle micromobility vehicles, including cargo e-trikes and e-scooters.
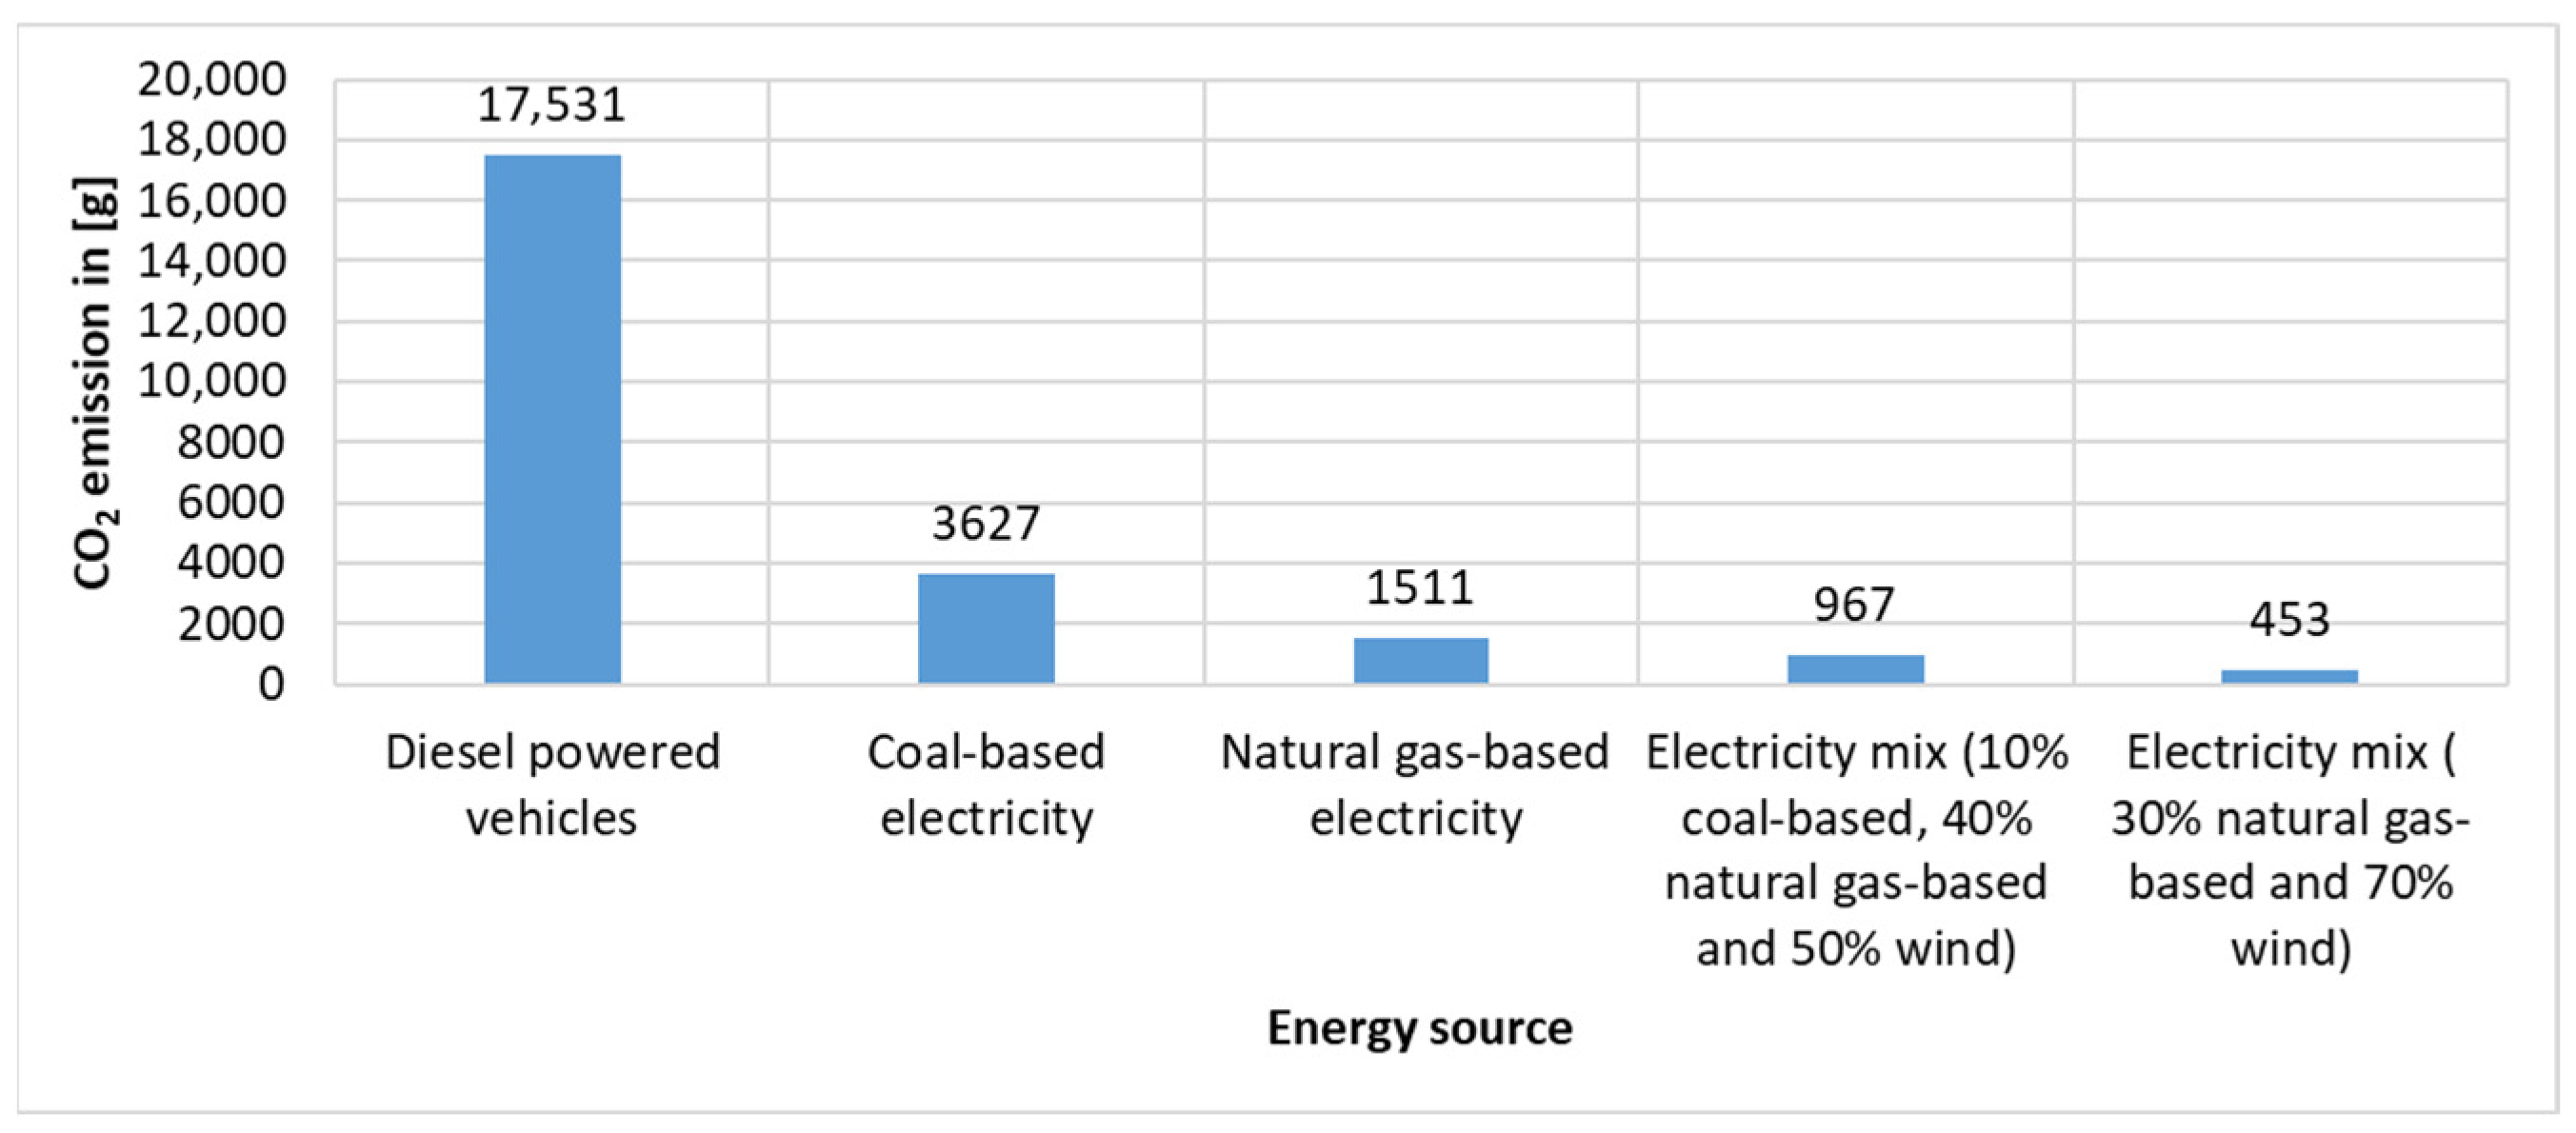
The micromobility-based delivery operation can be evaluated and compared under different energy mix scenarios. In this context, the term “energy mix” refers to the specific sources from which the electricity used to power the micromobility vehicles is generated, such as renewable sources (e.g., solar, wind, or hydroelectric power) or non-renewable sources (e.g., coal or natural gas). This approach allows for a comprehensive analysis of the environmental performance of electric micromobility solutions, depending on the sustainability of the underlying electricity generation. Furthermore, the resulting energy consumption and emission values can also be benchmarked against traditional delivery operations that rely on diesel-powered vehicles. This comparison enables the assessment of the true environmental benefits of micromobility under various energy infrastructure conditions. This comparison is shown in Figure 8.
To estimate the environmental impacts of vehicle operation, CO2 emissions were calculated using distance-based emission coefficients. For the different scenarios, we assumed average emission factors per vehicle, which reflects electricity generation predominantly from the specific sources and is consistent with values reported in IEA database [51]. These coefficients represent average values commonly used in transport and energy modeling studies and were selected to ensure comparability with previous research. All vehicles in the model are assumed to have homogeneous energy consumption rates per kilometer, and the coefficients were applied uniformly across all routes.

4.2. Case Study with Real-World Data

In this model, we test the developed model and the solution algorithm using real-world data. In this real-world model, the following parameters are considered as given:
  • Set of three producers (Sunshine, Csocsaj and Keszi Bakeries: i I D _ N B ,   I D _ C B ,   I D _ K B ;
  • Set of eight delivery locations (customers): j I D _ 1 , I D _ 2 , , I D _ 8 ;
  • Set of three product types (bread and rolls, pastries and sweet baked goods, and savory baked goods): k I D _ B R ,   I D _ P S ,   I D _ S B ;
  • Delivery tasks’ volume and weight within the predefined time-window of real-time optimization (see Table 9);
  • Real-time location of micromobility vehicles (cargo e-trikes and e-scooters), producers (bakeries) and customers (see Table 10).
  • Route matrix among real-time location of free, idle micromobility vehicles, producers and customers based on the above locations (see Table 11 and Table 12).
  • Cost per unit in [EUR/pcs] (see Table 13),
  • Delivery speed of vehicle i [km/h] (see Table 13);
  • CO2 emission of vehicles in [g/km] (see Table 13);
  • Weight capacity of one micromobility vehicle in [kg/vehicle] (see Table 13);
  • Volume capacity of one micromobility vehicle in [dm3/vehicle] (see Table 13);
  • Total number of available micromobility vehicles is 12.
The optimal assignment matrix is shown in Table 14. The resulting length of the optimized delivery routes, delivery costs, and virtual CO2 emission is shown in Table 15.
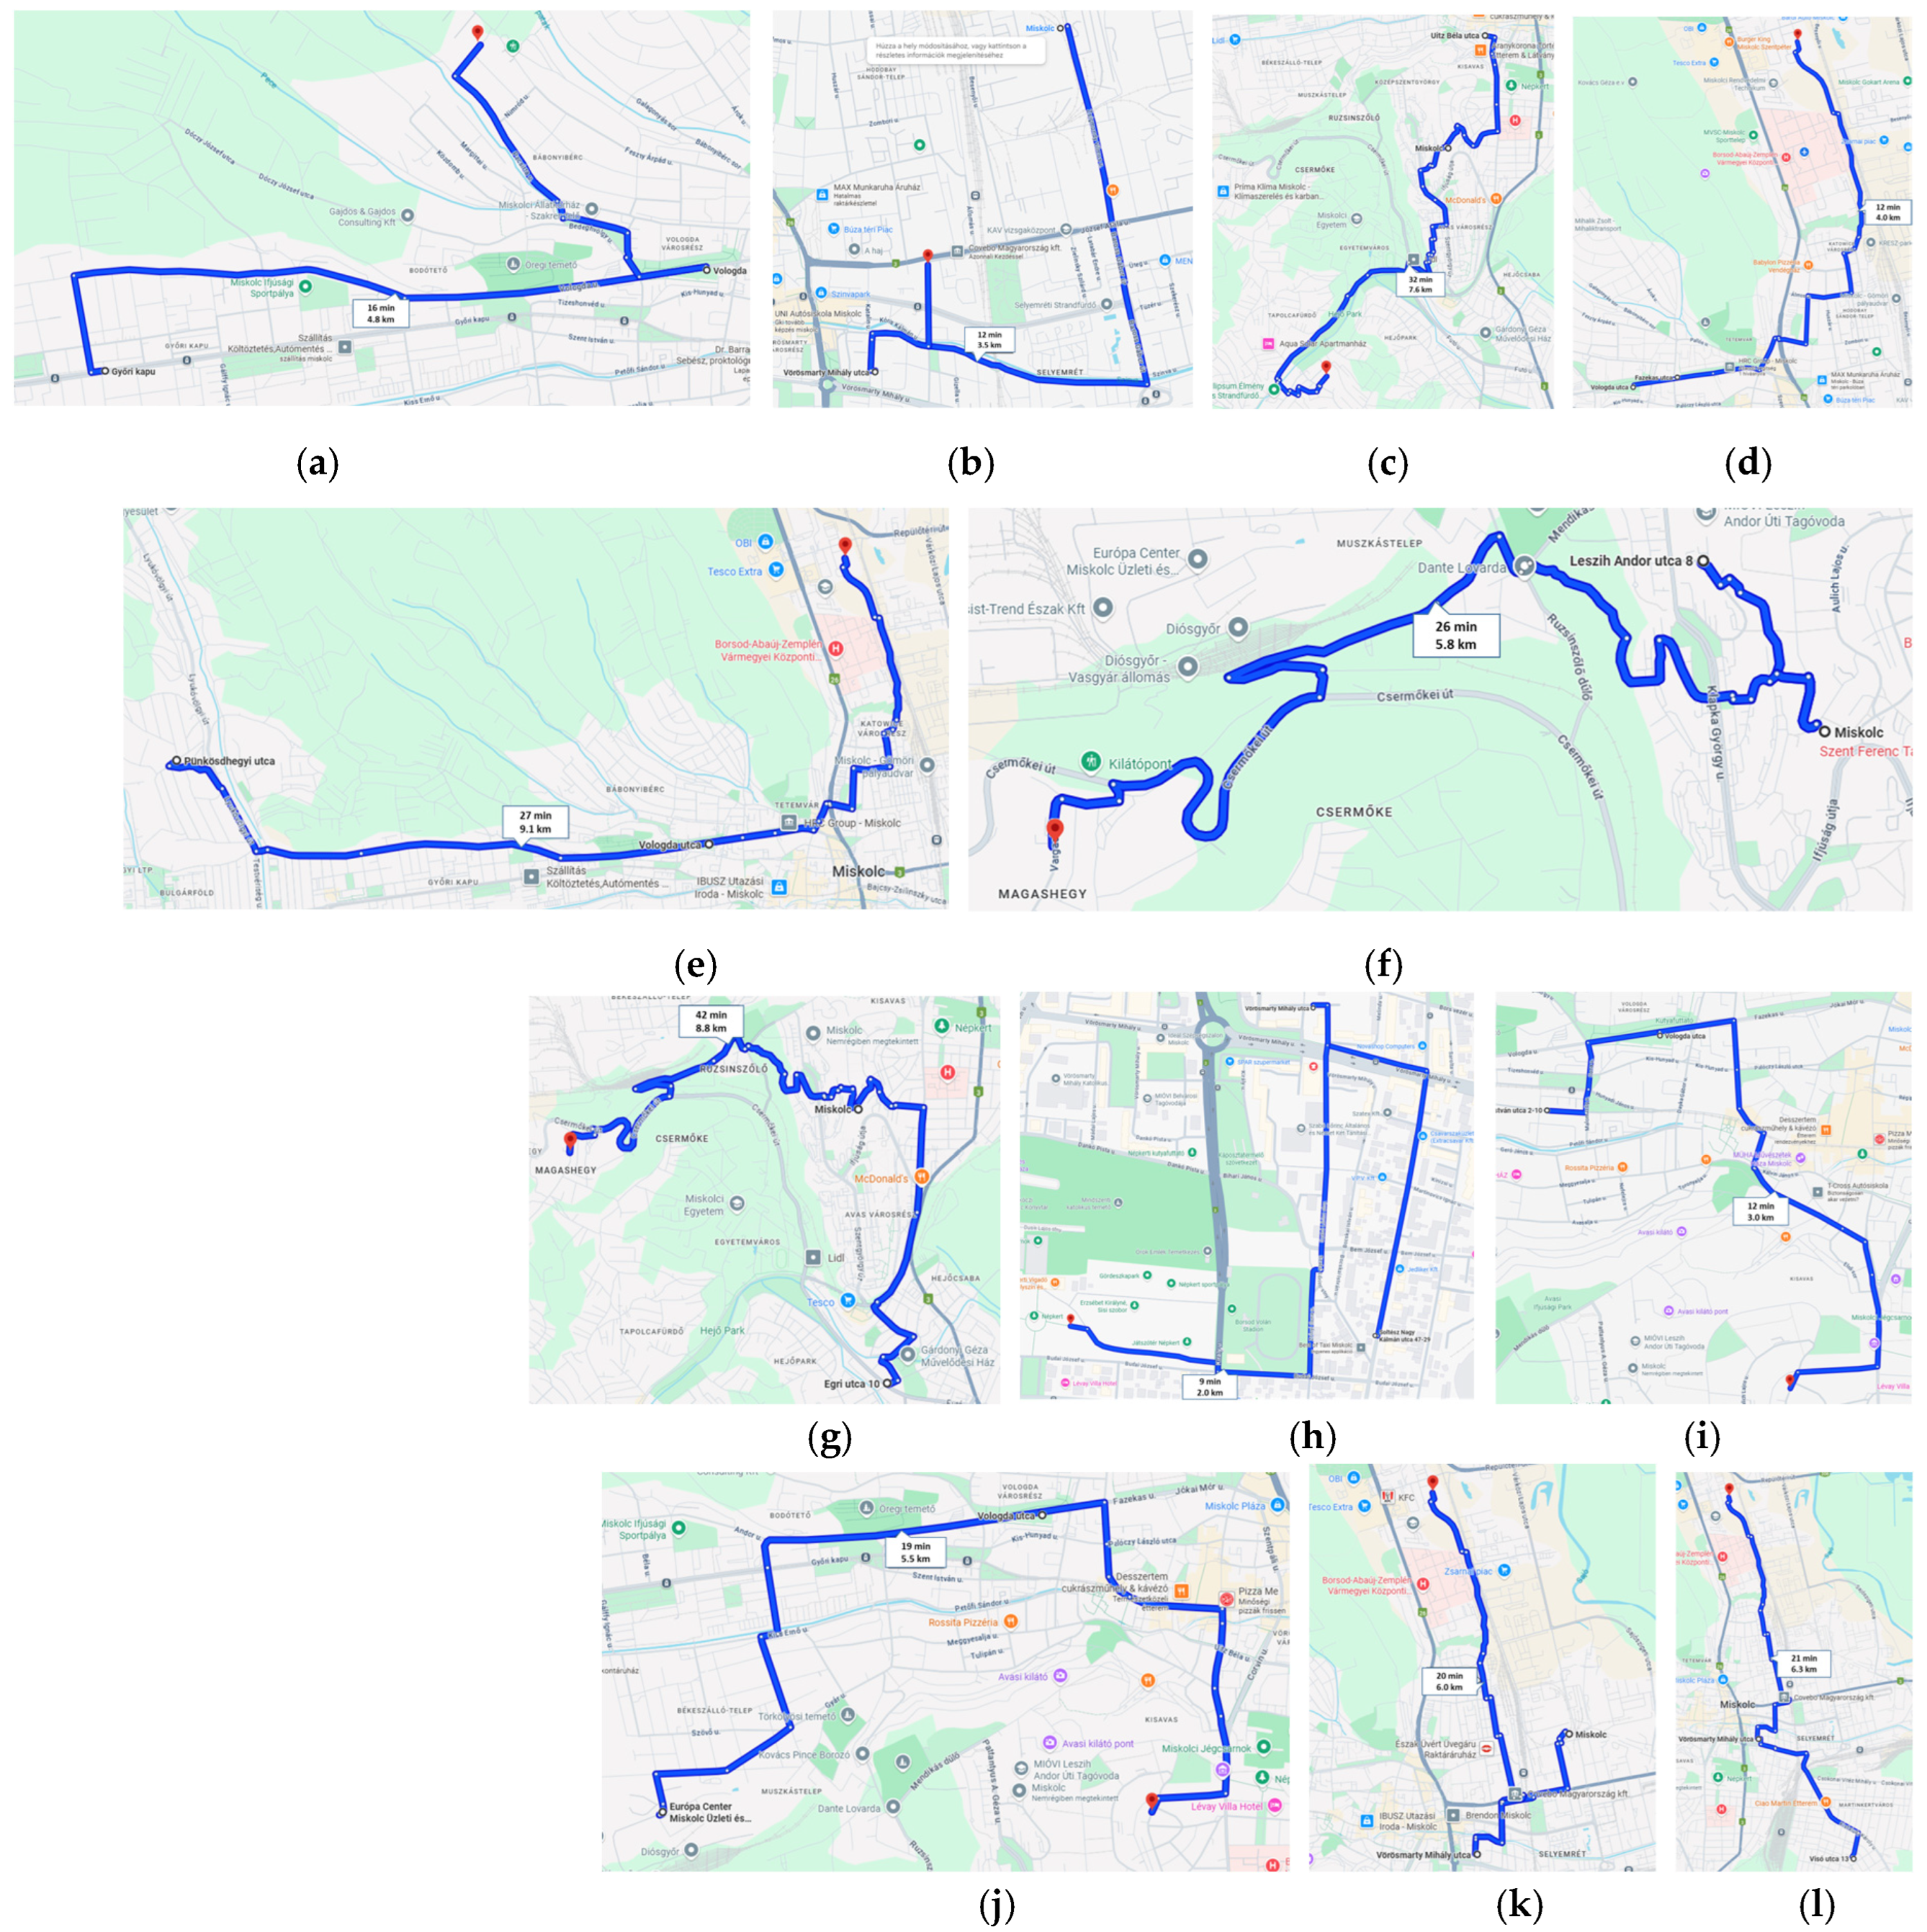
The solution to the optimization problem of the case study based on real-world data is illustrated in Figure 9. Due to the weight and volume constraints of the micromobility vehicles, some tasks (4, 5, 7, and 8) required multiple vehicles to fulfill them. However, it was not always possible to assign each task to the nearest idle vehicle. In this optimization scenario we have also taken into consideration a coal-based electricity generation. In this case the social cost of carbon was taken into consideration with 0.00025 EURcent/g CO2. The weighting factors of the objective function are the same: α = β = γ = 1 / 3 . In this case study, the objective function value was EUR 240.77, representing the total cost of the real-time scheduled delivery operations within the predefined time window. The structure of this scenario is the same as in the case of simulated data, it includes eight delivery tasks from three producers to eight customers, taking into account 12 idle micromobility vehicles, including cargo e-trikes and e-scooters.
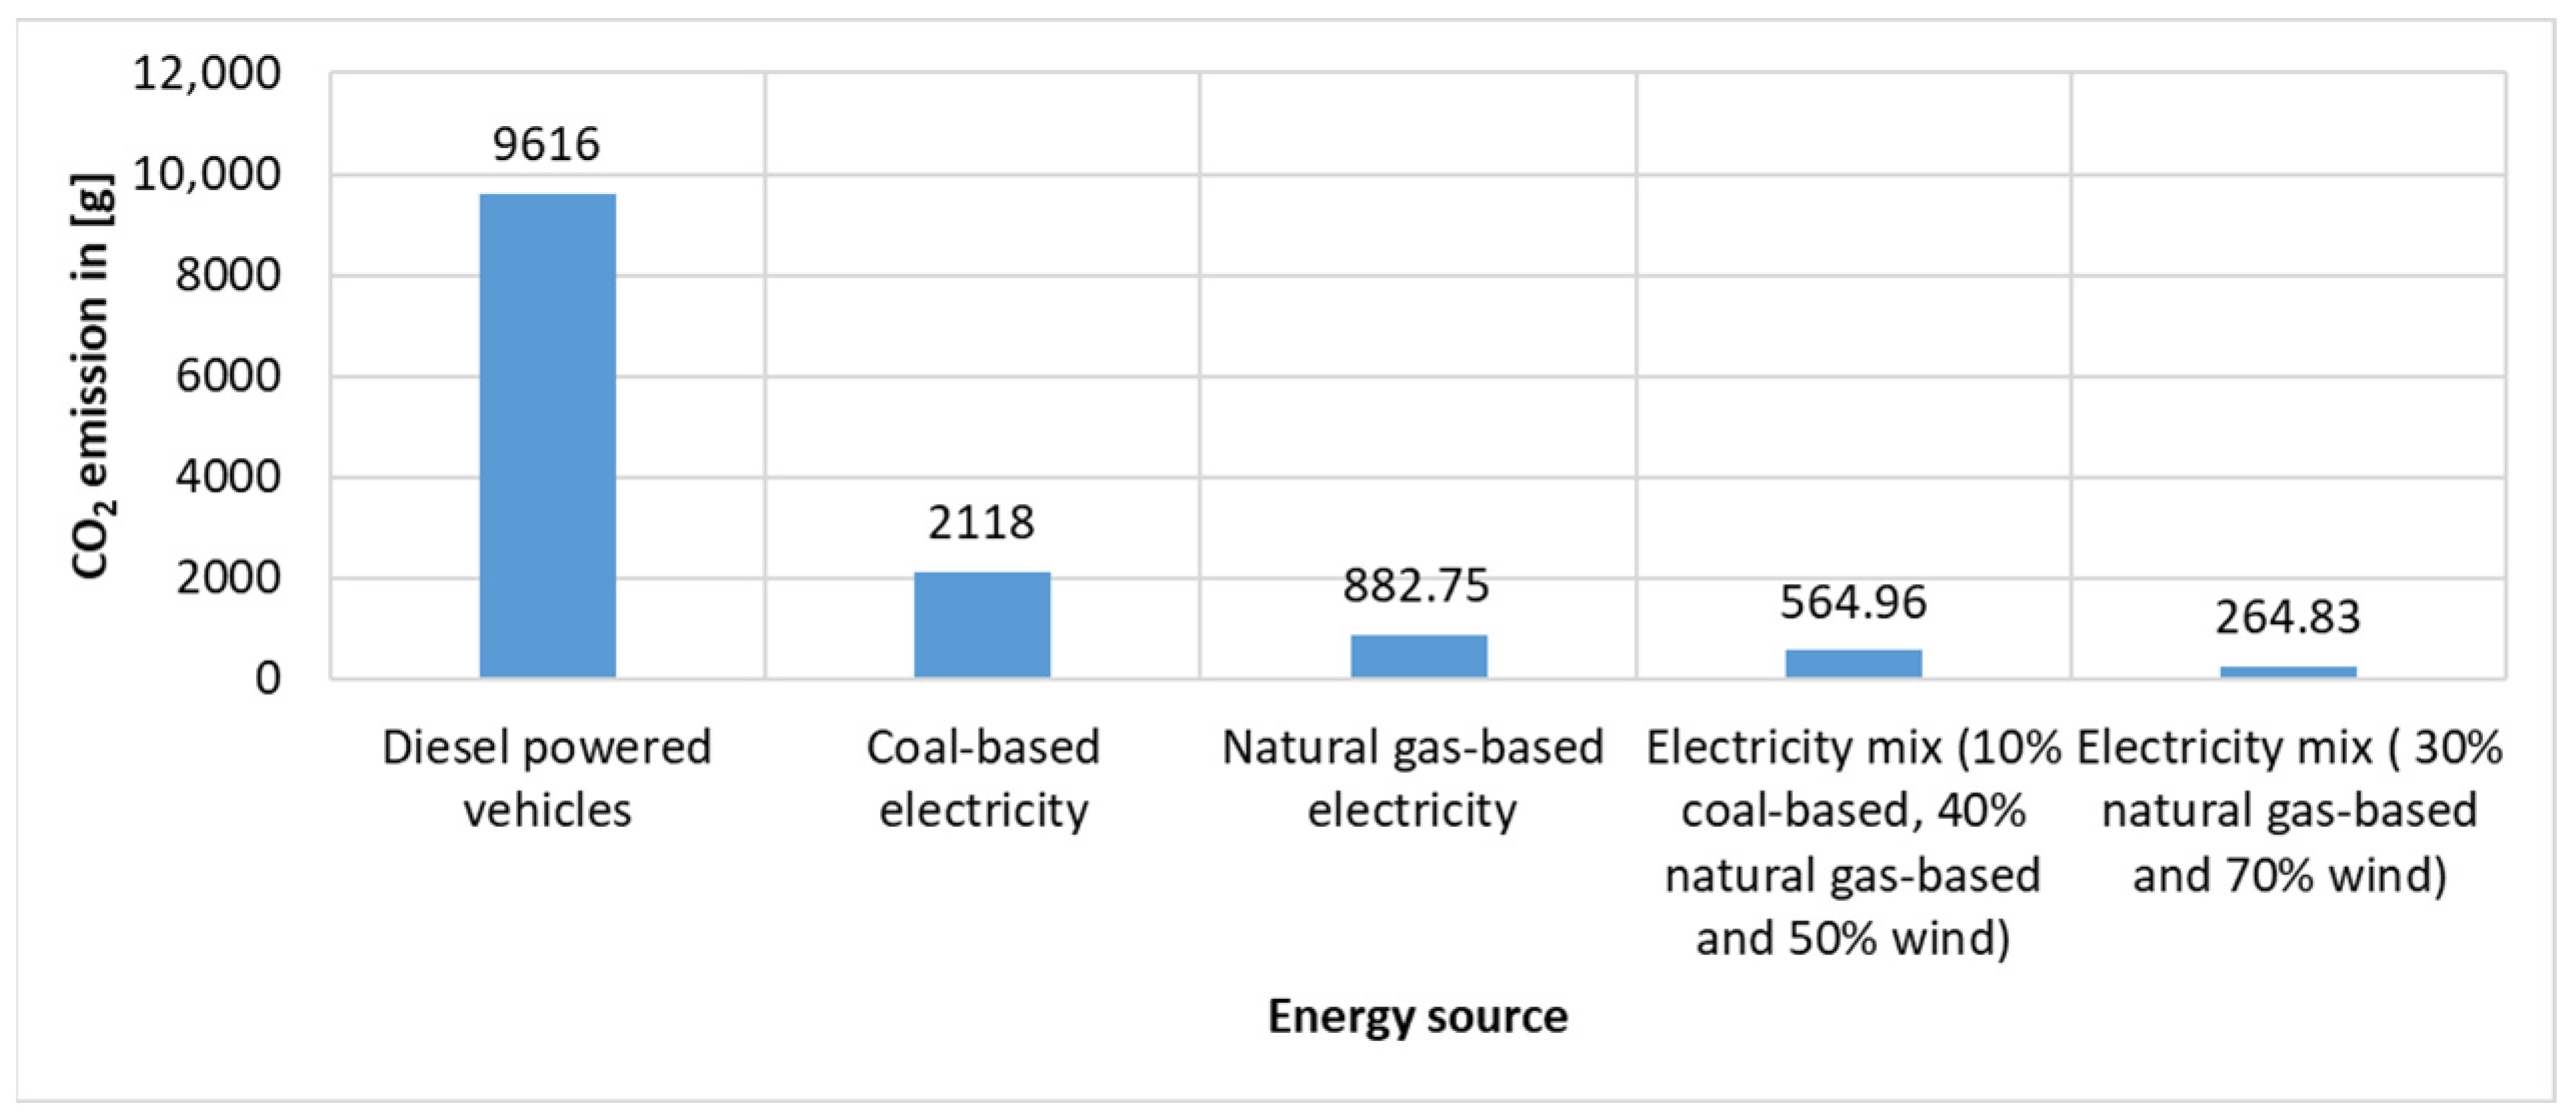
The micromobility-based distribution model can be assessed under different regional electricity scenarios. Here, the “energy mix” denotes the proportions of renewable and non-renewable sources used to generate the electricity that charges the vehicles. Similar to the scenario based on simulated data, this framework enables a clear evaluation of the environmental impacts associated with electric micromobility, depending on local energy production. The resulting emissions and energy consumption can then be compared to conventional diesel delivery fleets to estimate the net environmental gains. This comparison is illustrated in Figure 10.
The results of the model clearly demonstrate that micromobility solutions, especially those powered by low-carbon electricity, can lead to substantial reductions in greenhouse gas (GHG) emissions. When compared to conventional diesel-powered delivery vehicles, which produce approximately 9616 g of CO2 per delivery operation, electric micromobility options show significantly lower environmental impact across various electricity sourcing scenarios.
Even in the worst-case scenario, where electricity is sourced entirely from coal-based power, emissions are reduced to 2118 g of CO2, already representing a notable improvement. When powered by natural gas-based electricity, emissions drop further to 882.75 g of CO2. Under a mixed electricity supply (comprising 10% coal, 40% natural gas, and 50% wind energy), emissions decrease to 564.96 g of CO2, while a cleaner mix with 30% natural gas and 70% wind results in only 264.83 g of CO2.
These findings emphasize that the environmental benefits of micromobility-based logistics are not solely dependent on vehicle type, but also on the carbon intensity of the underlying energy system. When charged with renewable-heavy electricity, optimized micromobility operations can achieve up to 97% CO2 emission reduction compared to diesel-based logistics. This highlights the critical importance of aligning vehicle electrification with broader energy transition strategies to maximize climate benefits in urban last-mile delivery systems.

5. Discussion

This study examined the potential of green micromobility solutions in optimizing last-mile logistics for small-scale urban food producers. By integrating a mathematical optimization model with real-world delivery constraints, we demonstrated that such systems are not only viable but also highly beneficial from both environmental and economic perspectives.
The findings affirm that green micromobility can substantially reduce GHG emissions compared to conventional delivery vehicles, even when accounting for time-window constraints and limited vehicle capacities. These reductions are especially meaningful in urban contexts where emissions and congestion are critical concerns. Moreover, the model shows that strategic routing and vehicle assignment can significantly lower operational costs, making micromobility an accessible and practical solution for small producers who typically operate with limited resources.
In terms of planning, the results highlight the importance of infrastructure and policy alignment. While the physical performance and emission benefits of micromobility are evident, broader adoption depends on urban design (e.g., bike lanes, loading zones), vehicle innovation (e.g., modular cargo systems), and supportive regulatory frameworks. Our model assumes the existence of such infrastructure, which, although feasible in many cities, may require further investment elsewhere.
Furthermore, equity and accessibility issues remain relevant. Although the model itself is neutral in terms of socio-demographic variables, the broader implementation of micromobility-based logistics must consider inclusion to avoid reinforcing existing spatial or economic disparities. For instance, support programs or cooperative models could enhance small producers’ access to shared micromobility fleets.
While the proposed model primarily addresses economic efficiency and environmental sustainability, equity and inclusivity aspects are also critical in urban food logistics. Cooperative ownership models or shared logistics platforms could provide opportunities for small-scale producers who individually lack resources to participate in optimized micromobility systems. By pooling vehicles, sharing infrastructure, or engaging in community-based delivery networks, such approaches could enhance accessibility and fairness, ensuring that the benefits of sustainable last-mile logistics are more widely distributed.
Another key insight is the role of coordination among producers. The model favors collaborative logistics which enhances efficiency and utilization of micromobility vehicles. However, achieving such coordination in practice would require digital platforms and trust-based networks, which are not yet widespread in this sector.

6. Conclusions

This research contributes to the growing body of knowledge on sustainable urban logistics by providing a tailored optimization framework for integrating micromobility into last-mile food distribution. The results confirm that micromobility, when supported by advanced planning and optimization, can offer small-scale urban food producers a cleaner, more resilient, and cost-effective alternative to conventional delivery methods.
The model’s applicability to realistic urban scenarios makes it a valuable decision-support tool for policymakers, logistics planners, and urban food cooperatives. It serves not only to quantify the potential benefits of green logistics but also to guide future investments in infrastructure and micromobility fleet design.
The findings indicate that micromobility-based delivery systems can provide significant environmental and operational cost benefits for small-scale bakeries operating without additional hubs, while a full business case assessment including broader infrastructure costs remains a subject for future research.
Future research should explore dynamic and stochastic extensions of the model to handle real-time traffic, customer demand variability, and vehicle availability. Additionally, pilot implementations in different urban settings would help validate the model’s assumptions and adaptability. Beyond the stochastic extensions briefly mentioned, several promising directions can be explored in future research. One direction is the integration of real-time traffic data into the optimization framework, which would allow delivery routes to dynamically adapt to congestion patterns and unexpected disruptions. Another possibility is the inclusion of dynamic pricing strategies, where delivery costs could vary depending on demand peaks, time of day, or sustainability incentives, thus aligning economic and environmental goals. Finally, the development of digital coordination platforms among producers could further enhance collaboration, enabling small-scale food producers to share resources and jointly optimize micromobility fleets. These directions would not only improve the robustness and efficiency of the proposed model but also support the practical deployment of sustainable last-mile delivery solutions in diverse urban contexts.
Future research should also consider equity and accessibility dimensions. Integrating cooperative ownership models or shared logistics platforms into the optimization framework could strengthen inclusivity for small-scale producers and broaden the societal benefits of micromobility-based last-mile delivery systems.
In summary, optimized micromobility-based logistics presents a promising pathway toward more sustainable urban food systems, aligning environmental goals with the operational needs of local producers.

Author Contributions

Conceptualization, Á.B. and T.B.; methodology, Á.B. and T.B.; software, T.B. and I.K.; validation, Á.B., I.K. and T.B.; formal analysis, Á.B., I.K. and T.B.; investigation, Á.B., I.K. and T.B.; resources T.B.; data curation, I.K.; writing—original draft preparation, Á.B., I.K. and T.B.; writing—review and editing, Á.B., I.K. and T.B.; visualization, Á.B., I.K. and T.B.; supervision, T.B.; project administration, Á.B. All authors have read and agreed to the published version of the manuscript.

Funding

The creation of this scientific communication was supported by the University of Miskolc with funding granted to the author Ágota Bányai within the framework of the institution’s Scientific Excellence Support Program. (Project identifier: ME-TKTP-2025-016).

Data Availability Statement

Data are unavailable due to privacy restrictions.

Conflicts of Interest

The authors declare no conflicts of interest.

Abbreviations

The following abbreviations are used in this manuscript:
FCNFully Convolutional Network
GHGGreenhouse Gas
GISGeographic Information System
MMQUALMicromobility Quality

References

  1. Bieliński, T.; Ważna, A. Electric scooter sharing and bike sharing user behaviour and characteristics. Sustainability 2020, 12, 9640. [Google Scholar] [CrossRef]
  2. Hosseinzadeh, A.; Algomaiah, M.; Kluger, R.; Li, Z. E-scooters and sustainability: Investigating the relationship between the density of E-scooter trips and characteristics of sustainable urban development. Sustain. Cities Soc. 2021, 66, 102624. [Google Scholar] [CrossRef]
  3. Hosseinzadeh, A.; Algomaiah, M.; Kluger, R.; Li, Z. Spatial analysis of shared e-scooter trips. J. Transp. Geogr. 2021, 92, 103016. [Google Scholar] [CrossRef]
  4. Dias, G.; Arsenio, E.; Ribeiro, P. The role of shared e-scooter systems in urban sustainability and resilience during the COVID-19 mobility restrictions. Sustainability 2021, 13, 7084. [Google Scholar] [CrossRef]
  5. Zhang, Y.; Kamargianni, M. A review on the factors influencing the adoption of new mobility technologies and services: Autonomous vehicle, drone, micromobility and mobility as a service. Transp. Rev. 2023, 43, 407–429. [Google Scholar] [CrossRef]
  6. Latinopoulos, C.; Patrier, A.; Sivakumar, A. Planning for e-scooter use in metropolitan cities: A case study for Paris. Transp. Res. D Transp. Environ. 2021, 100, 103037. [Google Scholar] [CrossRef]
  7. van Kuijk, R.J.; de Almeida Correia, G.H.; van Oort, N.; van Arem, B. Preferences for first and last mile shared mobility between stops and activity locations: A case study of local public transport users in Utrecht, the Netherlands. Transp. Res. A Policy Pract. 2022, 166, 285–306. [Google Scholar] [CrossRef]
  8. Zuniga-Garcia, N.; Tec, M.; Scott, J.G.; Machemehl, R.B. Evaluation of e-scooters as transit last-mile solution. Transp. Res. C Emerg. Technol. 2022, 139, 103660. [Google Scholar] [CrossRef]
  9. Hawa, L.; Cui, B.; Sun, L.; El-Geneidy, A. Scoot over: Determinants of shared electric scooter presence in Washington D.C. Case Stud. Transp. Policy 2021, 9, 418–430. [Google Scholar] [CrossRef]
  10. McQueen, M.; Clifton, K.J. Assessing the perception of E-scooters as a practical and equitable first-mile/last-mile solution. Transp. Res. A Policy Pract. 2022, 165, 395–418. [Google Scholar] [CrossRef]
  11. Alcock, R.J. Mathematical Decision Making for Planetary Health: Community-Engaged Design and Optimization of Last-Mile Health and Transportation Systems for Climate Resilience in Highly Constrained Environments. Ph.D. Thesis, The University of Wisconsin-Madison, Madison, WI, USA, 2025. [Google Scholar]
  12. Bagdatli, M.E.C.; Ipek, F. Sustainability impact of bus priority treatments in small-scale cities. Transp. Res. Rec. 2023, 2677, 476–498. [Google Scholar] [CrossRef]
  13. Tatarczak, A.; Grela, G. A coalition formation framework for horizontal supply chain collaboration. LogForum 2024, 20, 357–372. [Google Scholar] [CrossRef]
  14. Liu, L.; Miller, H.J. Measuring the impacts of dockless micro-mobility services on public transit accessibility. Comput. Environ. Urban Syst. 2022, 98, 101885. [Google Scholar] [CrossRef]
  15. Tyndall, J. Complementarity of dockless micromobility and rail transit. J. Transp. Geogr. 2022, 103, 103411. [Google Scholar] [CrossRef]
  16. Yin, Z.; Rybarczyk, G.; Zheng, A.; Su, L.; Sun, B. Shared micromobility as a first- and last-mile transit solution? Spatio-temporal insights from a novel dataset. J. Transp. Geogr. 2024, 114, 103778. [Google Scholar] [CrossRef]
  17. Shaheen, S.; Cohen, A.; Broader, J. Evolution, Curb Policy, and Potential Developments in North America. Built Environ. 2021, 47, 499–514. [Google Scholar] [CrossRef]
  18. Mohiuddin, H.; Fukushige, T.; Fitch-Polse, D.T.; Handy, S.L. Does dockless bike-share influence transit use? Evidence from the Sacramento region. Int. J. Sustain. Transp. 2024, 18, 146–167. [Google Scholar] [CrossRef]
  19. Cui, C.; Zhang, Y. Integration of Shared Micromobility into Public Transit: A Systematic Literature Review with Grey Literature. Sustainability 2024, 16, 3557. [Google Scholar] [CrossRef]
  20. Beale, K.; Kapatsila, B.; Grisé, E. Integrating Public Transit and Shared Micromobility Payments to Improve Transpor-tation Equity in Seattle, WA. Transp. Res. Rec. 2023, 2677, 968–980. [Google Scholar] [CrossRef]
  21. Vinagre Díaz, J.J.; Fernández Pozo, R.; Rodríguez González, A.B.; Wilby, M.R.; Anvari, B. Blind classification of e-scooter trips according to their relationship with public transport. Transportation 2024, 51, 1679–1700. [Google Scholar] [CrossRef] [PubMed]
  22. Javadiansr, M.; Davatgari, A.; Rahimi, E.; Mohammadi, M.; Mohammadian, A. Coupling shared E-scooters and public transit: A spatial and temporal analysis. Transp. Lett. 2024, 16, 581–598. [Google Scholar] [CrossRef]
  23. Campisi, T.; Skoufas, A.; Kaltsidis, A.; Basbas, S. Gender equality and e-scooters: Mind the gap! A statistical analysis of the Sicily Region, Italy. Soc. Sci. 2021, 10, 403. [Google Scholar] [CrossRef]
  24. Parnell, K.J.; Merriman, S.E.; Plant, K.L. Gender perspectives on electric micromobility use. Hum. Factors Ergon. Manuf. 2023, 33, 476–489. [Google Scholar] [CrossRef]
  25. Wallgren, P.; Rexfelt, O.; Nikitas, A. Comparing the bad media-fuelled reputation of e-scooters with real-life user and non-user perceptions: Evidence from Sweden. Transp. Res. Part F Traffic Psychol. Behav. 2023, 99, 189–203. [Google Scholar] [CrossRef]
  26. Turoń, K.; Kubik, A.; Folęga, P.; Chen, F. Perception of Shared Electric Scooters: A Case Study from Poland. Sustainability 2023, 15, 12596. [Google Scholar] [CrossRef]
  27. Kim, M.; Puczkowskyj, N.; MacArthur, J.; Dill, J. Perspectives on e-scooters use: A multi-year cross-sectional approach to understanding e-scooter travel behavior in Portland, Oregon. Transp. Res. Part A Policy Pract. 2023, 178, 103866. [Google Scholar] [CrossRef]
  28. Dias, G.; Ribeiro, P.; Arsenio, E. Determinants of shared e-scooter usage and their policy implications. Findings from a survey in Braga, Portugal. Eur. Transp. Res. Rev. 2024, 16, 20. [Google Scholar] [CrossRef]
  29. Romm, D.; Verma, P.; Karpinski, E.; Sanders, T.L.; McKenzie, G. Differences in first-mile and last-mile behaviour in candidate multi-modal Boston bike-share micromobility trips. J. Transp. Geogr. 2022, 102, 103370. [Google Scholar] [CrossRef]
  30. Azimi, G.; Rahimi, A.; Lee, M.; Jin, X. Mode choice behavior for access and egress connection to transit services. Int. J. Transp. Sci. Technol. 2021, 10, 136–155. [Google Scholar] [CrossRef]
  31. Hong, D.; Jang, S.; Lee, C. Investigation of shared micromobility preference for last-mile travel on shared parking lots in city center. Travel Behav. Soc. 2023, 30, 163–177. [Google Scholar] [CrossRef]
  32. Phithakkitnukoon, S.; Patanukhom, K.; Demissie, M.G. Predicting spatiotemporal demand of dockless e-scooter sharing services with a masked fully convolutional network. ISPRS Int. J. Geo-Inf. 2021, 10, 773. [Google Scholar] [CrossRef]
  33. Luo, Q.; Li, S.; Hampshire, R.C. Optimal design of intermodal mobility networks under uncertainty: Connecting mi-cromobility with mobility-on-demand transit. Eur. J. Transp. Logist. 2021, 10, 100045. [Google Scholar] [CrossRef]
  34. Arias-Molinares, D.; García-Palomares, J.C.; Romanillos, G.; Gutiérrez, J. Uncovering spatiotemporal micromobility patterns through the lens of space–time cubes and GIS tools. J. Geogr. Syst. 2023, 25, 403–427. [Google Scholar] [CrossRef]
  35. Colovic, A.; Prencipe, L.P.; Giuffrida, N.; Ottomanelli, M. A multi-objective model to design shared e-kick scooters parking spaces in large urban areas. J. Transp. Geogr. 2024, 116, 103823. [Google Scholar] [CrossRef]
  36. Kazmaier, M.; Taefi, T.; Hettesheimer, T. Techno-economical and ecological potential of electrical scooters: A life cycle analysis. Eur. J. Transp. Infrastruct. Res. 2020, 20, 233–251. [Google Scholar] [CrossRef]
  37. Hamerska, M.; Ziółko, M.; Stawiarski, P. A Sustainable Transport System—The MMQUAL Model of Shared Micromo-bility Service Quality Assessment. Sustainability 2022, 14, 4168. [Google Scholar] [CrossRef]
  38. Schwinger, F.; Tanriverdi, B.; Jarke, M. Comparing Micromobility with Public Transportation Trips in a Data-Driven Spatio-Temporal Analysis. Sustainability 2022, 14, 8247. [Google Scholar] [CrossRef]
  39. Oliveira, L.K.d.; Oliveira, I.K.d.; França, J.G.d.C.B.; Balieiro, G.W.N.; Cardoso, J.F. Integrating Freight and Public Transport Terminals Infrastructure by Locating Lockers: Analysing a Feasible Solution for a Medium-Sized Brazilian Cities. Sustainability 2022, 14, 10853. [Google Scholar] [CrossRef]
  40. Arias-Molinares, D.; Xu, Y.; Büttner, B.; Duran-Rodas, D. Exploring key spatial determinants for mobility hub place-ment based on micromobility ridership. J. Transp. Geogr. 2023, 110, 103621. [Google Scholar] [CrossRef]
  41. Zhang, Y.; Nelson, J.D.; Mulley, C. Learning from the evidence: Insights for regulating e-scooters. Transp. Policy 2024, 151, 63–74. [Google Scholar] [CrossRef]
  42. Sundqvist-Andberg, H.; Tuominen, A.; Auvinen, H.; Tapio, P. Sustainability and the Contribution of Electric Scooter Sharing Business Models to Urban Mobility. Built Environ. 2021, 47, 541–558. [Google Scholar] [CrossRef]
  43. Štefancová, V.; Kalašová, A.; Čulík, K.; Mazanec, J.; Vojtek, M. Research on the Impact of COVID-19 on Micromobility Using Statistical Methods. Appl. Sci. 2022, 12, 8128. [Google Scholar] [CrossRef]
  44. Huang, E.; Yin, Z.; Broaddus, A.; Yan, X. Shared e-scooters as a last-mile transit solution? Travel behavior insights from Los Angeles and Washington D.C. Travel Behav. Soc. 2024, 34, 100663. [Google Scholar] [CrossRef]
  45. Dzięcielski, M.; Nikitas, A.; Radzimski, A.; Caulfield, B. Understanding the determinants of bike-sharing demand in the context of a medium-sized car-oriented city: The case study of Milton Keynes, UK. Sustain. Cities Soc. 2024, 114, 105781. [Google Scholar] [CrossRef]
  46. Eom, J.K.; Lee, K.-S.; Lee, J. Exploring micromobility mode preferences for last-mile trips from subway stations. J. Public Transp. 2023, 25, 100054. [Google Scholar] [CrossRef]
  47. Nawaro, Ł. E-scooters: Competition with shared bicycles and relationship to public transport. Int. J. Urban Sustain. Dev. 2021, 13, 614–630. [Google Scholar] [CrossRef]
  48. Miller, M.; Pfeil, M.; Reick, B.; Murri, R.; Stetter, R. Measurement and Modeling of a Cargo Bicycle Tire for Vehicle Dynamics Simulation. Appl. Sci. 2023, 13, 2542. [Google Scholar] [CrossRef]
  49. Aguilera-García, Á.; Gomez, J.; Rangel, T.; Baeza, M.d.l.Á.; Vassallo, J.M. Which factors influence the use of shared and privately-owned e-scooters in the city of Madrid? Implications for urban mobility. Cities 2024, 147, 104785. [Google Scholar] [CrossRef]
  50. Narayanan, S.; Gruber, J.; Liedtke, G.; Antoniou, C. Purchase intention and actual purchase of cargo cycles: Influencing factors and policy insights. Transp. Res. Part A Policy Pract. 2022, 155, 31–45. [Google Scholar] [CrossRef]
  51. IEA (International Energy Agency). Comparative Life-Cycle Greenhouse Gas Emissions of a Mid-Size BEV and ICE Vehicle; IEA: Paris, France, 2021; Available online: https://www.iea.org/data-and-statistics/charts/comparative-life-cycle-greenhouse-gas-emissions-of-a-mid-size-bev-and-ice-vehicle (accessed on 12 June 2025).
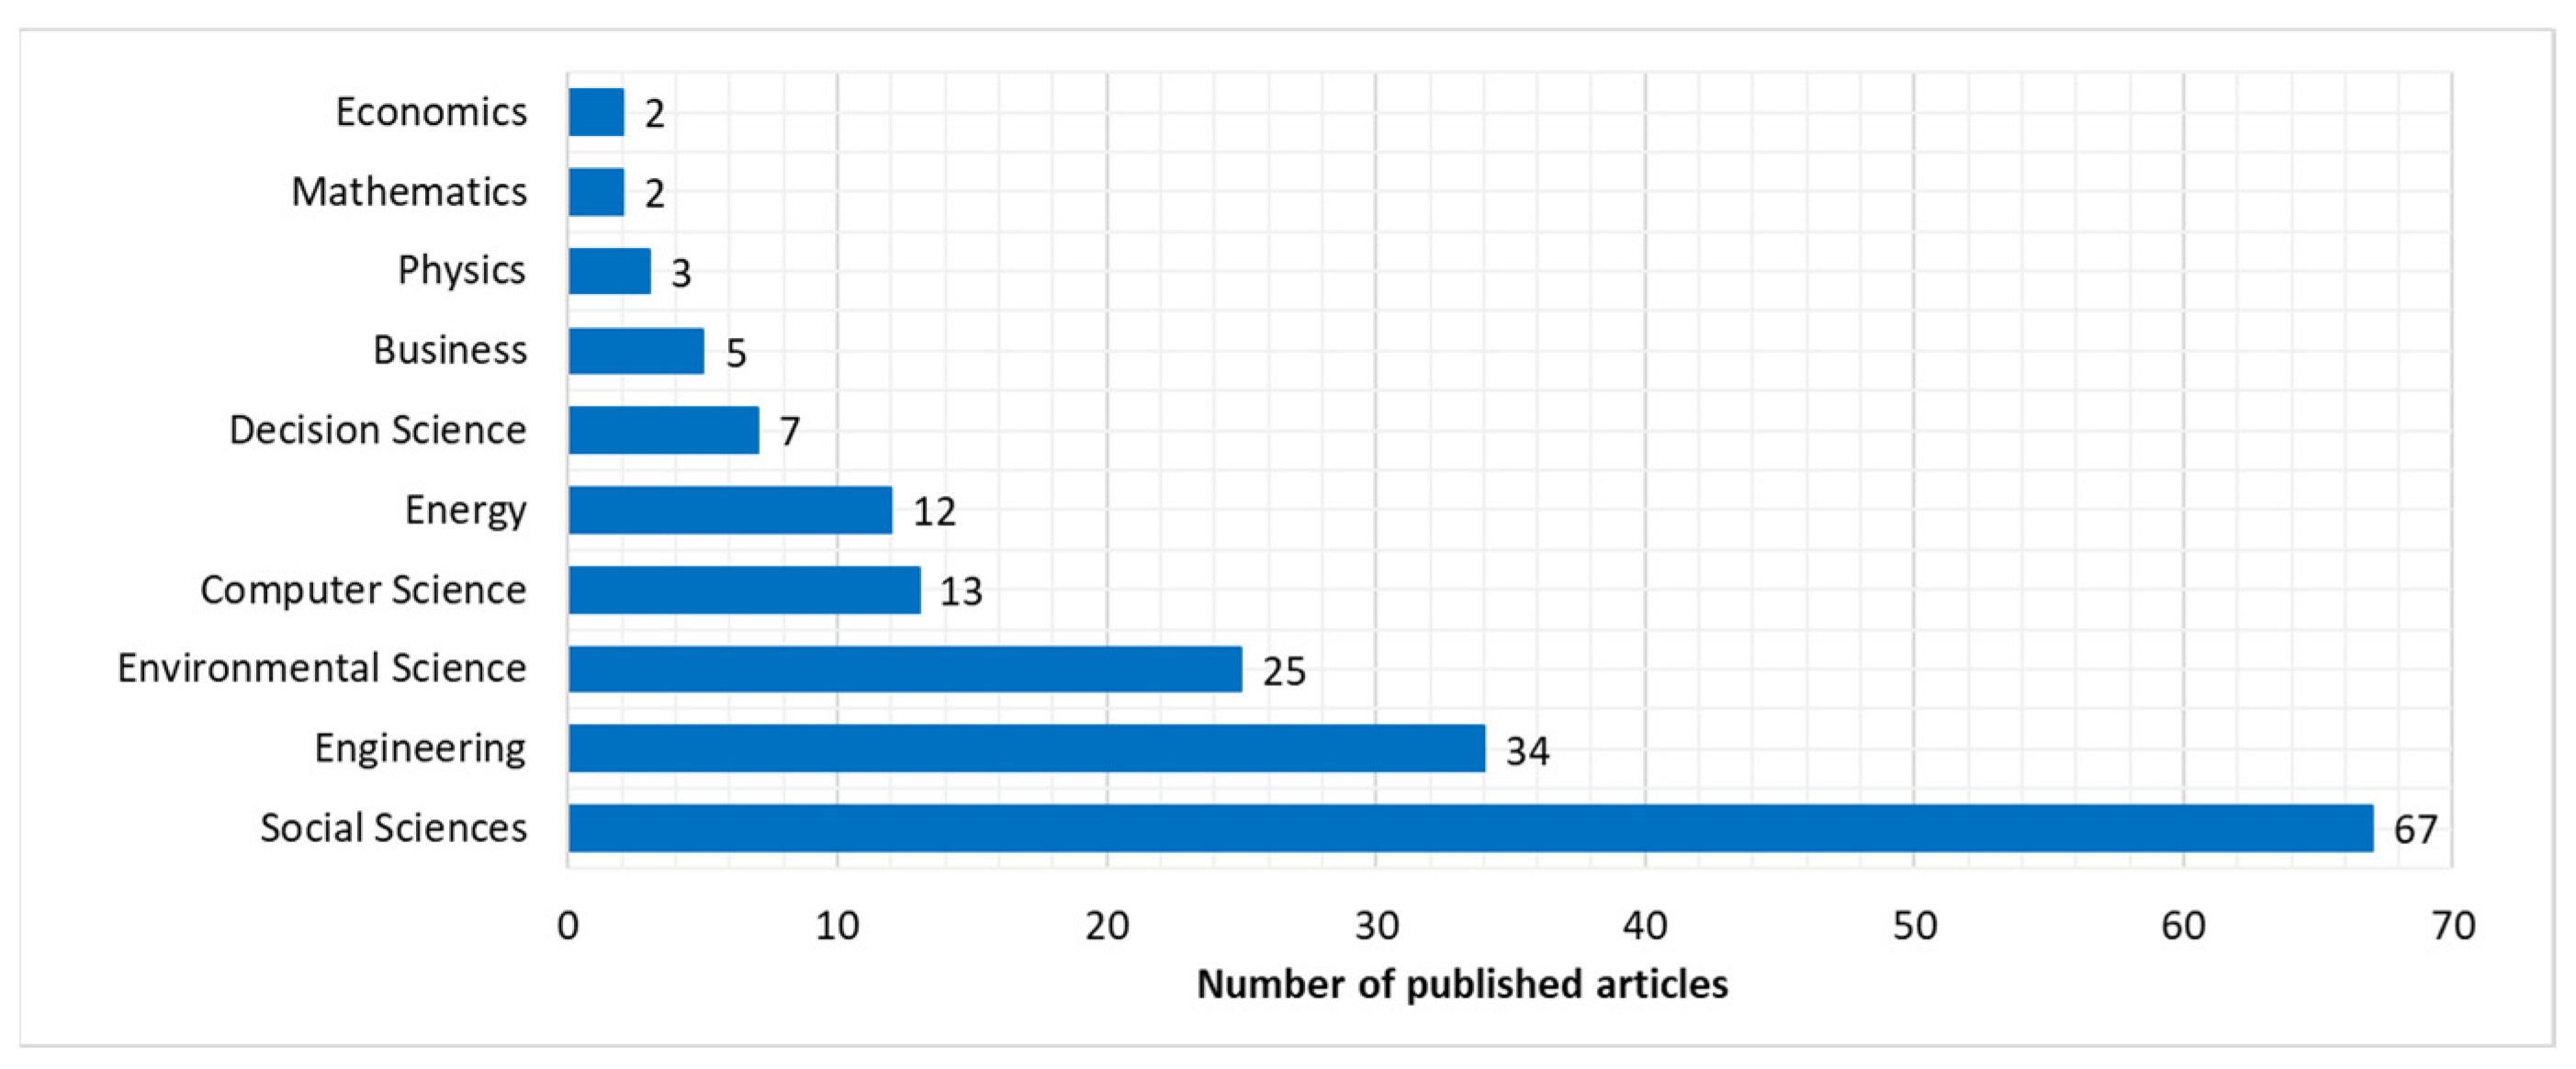
Figure 1. Classification of articles considering subject areas based on a search in Scopus database using topic: “micromobility” AND “last mile”.
Systems 13 00785 g001
Figure 2. Classification of articles by year of publication based on search in Scopus.
Systems 13 00785 g002
Figure 3. The ten most cited articles based on a search in Scopus [1,2,3,4,5,6,7,8,9,10].
Systems 13 00785 g003
Figure 4. Distribution of micromobility-based last mile delivery related articles in journals, based on a search in Scopus.
Systems 13 00785 g004
Figure 5. Distribution of papers according to Scopus keywords.
Systems 13 00785 g005
Figure 6. Integration of real-time data streams and optimization logic in Industry 4.0-enabled green micromobility-based last-mile logistics.
Systems 13 00785 g006
Figure 7. The solution to the optimization problem in the case of simulated data.
Systems 13 00785 g007
Figure 8. Comparison of different energy mix scenarios in the case of simulated data.
Systems 13 00785 g008
Figure 9. The solution to the optimization problem in the case of real-world data: (a) Route assigned to task 1 by vehicle 5 to customer 20 from Sunshine Bakery; (b) route assigned to task 2 by vehicle 9 to customer 23 from Keszi Bakery; (c) route assigned to task 3 by vehicle 3 to customer 18 from Csocsaj Bakery; (d) route assigned to task 4 by vehicle 1 to customer 21 from Sunshine Bakery; (e) route assigned to task 4 by vehicle 7 to customer 21 from Sunshine Bakery; (f) route assigned to task 5 by vehicle 10 to customer 19 from Csocsaj Bakery; (g) route assigned to task 5 by vehicle 12 to customer 19 from Csocsaj Bakery; (h) route assigned to task 6 by vehicle 8 to customer 16 from Keszi Bakery; (i) route assigned to task 7 by vehicle 4 to customer 17 from Sunshine Bakery; (j) route assigned to task 7 by vehicle 6 to customer 17 from Sunshine Bakery; (k) route assigned to task 8 by vehicle 2 to customer 21 from Keszi Bakery; (l) route assigned to task 8 by vehicle 11 to customer 21 from Keszi Bakery.
Systems 13 00785 g009
Figure 10. Comparison of different energy mix scenarios in the case of real-world data.
Systems 13 00785 g010
Table 1. Detailed overview of the reviewed studies, main focus, methodology, and key findings.
CategoryAuthors (Year)Methods UsedKey Findings/Contribution
Integration of Micromobility and Public TransitLiu and Miller (2022) [14]GIS-based accessibility analysisDockless micromobility improves public transit access; spatially varies.
Tyndall (2022) [15]Econometric modelingMicromobility complements rail transit; overlap in short trips.
Yin et al. (2024) [16]Spatiotemporal analyticsMicromobility supports first-/last-mile; varies by time and location.
Shaheen et al. (2021) [17]Policy analysisCurb policy must adapt to enable transit integration.
Mohiuddin et al. (2024) [18]Survey + regressionBike-share complements transit under certain conditions.
Cui and Zhang (2024) [19]Systematic literature reviewCoordination and infrastructure are key for integration.
Beale et al. (2023) [20]Equity mapping + case studyPayment integration improves access for marginalized users.
Vinagre Díaz et al. (2024) [21]Machine learning classificationMany scooter trips connect to or replace public transport.
Javadiansr et al. (2024) [22]GIS + time-seriesMicromobility and transit show synchronized demand patterns.
User Behavior and Socio-DemographicsCampisi et al. (2021) [23]Survey + statistical analysisWomen avoid scooters due to safety/infrastructure concerns.
Parnell et al. (2023) [24]Survey + comparative statsGender differences in perceived safety and preferences.
Wallgren et al. (2023) [25]Survey + media analysisUsers view scooters more positively than media portrayal.
Turoń et al. (2023) [26]Urban surveyUsers are positive; parking cited as main concern.
Kim et al. (2023) [27]3-year cross-sectional surveyUser behavior consistent; demographic factors important.
Dias et al. (2024) [28]SurveyUse driven by convenience, cost, and eco-awareness.
Romm et al. (2022) [29]Trip data analysisFirst- and last-mile use patterns differ by trip type.
Azimi et al. (2021) [30]Mode choice modelingTrip length and land use affect access mode choice.
Hong et al. (2023) [31]Survey + regressionParking preferences favor micromobility for last mile.
Forecasting, Optimization, and PlanningPhithakkitnukoon et al. (2021) [32]Deep Learning (Masked FCN)Model predicts scooter demand with high accuracy.
Luo et al. (2021) [33]Optimization modelingDesigns intermodal networks under uncertainty.
Arias-Molinares et al. (2023) [34]GIS + spatiotemporalKey factors for hub placement identified.
Colovic et al. (2024) [35]Multi-objective optimizationEfficient scooter parking reduces traffic conflicts.
Kazmaier et al. (2020) [36]Life Cycle AnalysisSustainability depends on usage intensity and lifespan.
Hamerska et al. (2022) [37]Service quality model (MMQUAL)Evaluates shared micromobility service dimensions.
Schwinger et al. (2022) [38]Spatiotemporal data analysisMicromobility fills spatial transit gaps.
Oliveira et al. (2022) [39]Facility location modelingLocating lockers improves freight-transit synergy.
Zhang et al. (2024) [41]Policy reviewCalls for better regulation and inter-agency data coordination.
Safety, Perception, and EquitySundqvist-Andberg et al. (2021) [42]Qualitative + policy reviewBusiness models need stronger safety and sustainability focus.
Štefancová et al. (2022) [43]Statistical comparisonMicromobility rose as public transit use declined.
Huang et al. (2024) [44]Survey + regressionHigh usage among young people in dense transit zones.
Dzięcielski et al. (2024) [45]Regression + GISDemand driven by urban density and infrastructure.
Eom et al. (2023) [46]SurveyMicromobility preferred for subway access.
Nawaro (2021) [47]Comparative mode analysisScooters and bikes compete or complement depending on context.
Miller et al. (2023) [48]Experimental simulationCargo bike tire model improves micromobility simulations.
Aguilera-García et al. (2024) [49]Survey + regressionChoice between shared/private scooters depends on age, income.
Table 2. Input parameters of the optimization problem.
ParameterDescription
i I Set of producers
j J Set of delivery locations (customers)
k K Set of product types (e.g., bread, vegetables)
P i k Available quantity of product k at producer i in [kg]
D j k Demand of product k at location j in [kg]
W k Weight per unit of product k in [kg]
V k Volume per unit of product k in [m3]
c i j Cost per unit delivered from i to j in [EURO/kg]
t i j Delivery time from i to j in [min]
e i j CO2 emissions per unit delivered from i to j in [kg CO2]
C w Weight capacity of one micromobility vehicle in [kg]
C v Volume capacity of one micromobility vehicle in [m3]
M Total number of available micromobility vehicles in [pcs]
T m a x Maximum allowable delivery time (optional) in [min]
E m a x Maximum allowable emissions (optional) in [kg CO2]
Table 3. Delivery task volume, weight, and assignment of producers and customers within the predefined time-window in the case study with simulated data.
TaskWeightVolumeFromTo
1129ID_13ID_17
277ID_14ID_19
386ID_15ID_21
4105ID_13ID_23
574ID_15ID_23
662ID_14ID_17
756ID_13ID_16
884ID_14ID_18
Table 4. Route matrix among real-time location of free, idle micromobility vehicles and producers in [km] in the case study with simulated data.
ID of Idle Micromobility VehicleProducers
ID_13ID_14ID_15
ID_12.69712.95711.173
ID_22.69711.17312.957
ID_35.6678.66913.883
ID_48.6695.66713.883
ID_511.1732.69712.957
ID_612.9572.69711.173
ID_713.8835.6678.669
ID_813.8838.6695.667
ID_912.95711.1732.697
ID_1011.17312.9572.697
ID_118.66913.8835.667
ID_125.66713.8838.669
Table 5. Route matrix among producers and customers in [km] in the case study with simulated data.
Producers’ IDCustomers
ID_16ID_17ID_18ID_19ID_20ID_21ID_22ID_23
ID_133.0903.9386.2258.1028.9708.6317.1594.935
ID_148.2556.4704.1743.0234.6756.9388.5198.992
ID_157.5718.8118.8797.7605.7173.5183.3425.458
Table 6. Input parameters of case study with simulated data.
ID of Idle Micromobility VehicleParameters
Cost per Unit
[EURO/pcs · km]
Speed
[km/h]
CO2 Emission
[g/km]
Weight Capacity
[kg/Vehicle]
Volume Capacity
[dm3/Vehicle]
ID_10.4220481011
ID_20.382554123
ID_30.253048154
ID_40.45252455
ID_50.622054104
ID_60.55404283
ID_70.42302462
ID_80.24322453
ID_90.33253084
ID_100.42222465
ID_110.251528.884
ID_120.34302443
Table 7. The optimal assignment matrix in the case study with simulated data.
ID of Idle Micromobility VehicleTasks
ID_16ID_17ID_18ID_19ID_20ID_21ID_22ID_23
ID_100010000
ID_200000010
ID_310000000
ID_410000000
ID_501000000
ID_601000000
ID_700000100
ID_800100000
ID_900001000
ID_1000100000
ID_1100000001
ID_1200000010
Table 8. The resulting length of the optimized delivery routes, delivery costs, and virtual CO2 emission in the case study with simulated data.
ID of Idle Micromobility VehicleParameters
Length of Routes
[km]
Cost
[EURO]
CO2 Emission
[g]
Delivery Time
[min]
ID_17.6332.05366.3022.89
ID_25.7926.39312.4613.89
ID_39.6136.02461.0719.21
ID_412.6128.37302.5830.26
ID_55.7235.46308.8417.16
ID_65.7225.16240.218.58
ID_712.1430.59291.3024.27
ID_89.1811.02220.4317.22
ID_98.1521.53244.6219.57
ID_106.2115.66149.1416.95
ID_1118.0636.11520.0372.23
ID_128.7611.91210.1717.51
Total109.57310.273627.15279.74
Table 9. Delivery task volume, weight, and assignment of producers and customers within the predefined time-window in the case of real-world data.
TaskWeightVolumeFromTo
11030ID_NBID_20
21520ID_CBID_23
3845ID_KBID_18
43020ID_NBID_21
51124ID_KBID_19
61223ID_CBID_16
71820ID_NBID_17
82010ID_CBID_21
Table 10. Real-time location of micromobility vehicles in the case of real-world data.
Type of LocationID of LocationLatitudeLongitude
Idle cargo e-tries or e-scooters within the predefined time windowID_148.10697220.778530
ID_248.10961720.805514
ID_348.10109020.783889
ID_448.10376420.768504
ID_548.10260120.740796
ID_648.09402420.750787
ID_748.11271220.713820
ID_848.09491120.796513
ID_948.11259220.804776
ID_1048.09450320.772994
ID_1148.08668220.811284
ID_1248.06834920.781607
BakeriesID_NB48.10635320.774373
ID_CB48.10040220.794958
ID_KB48.08953220.778257
Customers, location of ordersID_1648.09507120.788859
ID_1748.09415120.781122
ID_1848.06612020.759499
ID_1948.08622520.744807
ID_2048.11483120.761600
ID_2148.12806820.789880
ID_2248.09866120.867083
ID_2348.10419720.797741
Table 11. Route matrix among real-time location of free, idle micromobility vehicles and producers in [m] in the case of real-world data.
ID Of Idle Micromobility VehicleProducers
ID_NBID_CBID_KB
ID_130018002500
ID_2310019003800
ID_312009501700
ID_470023002800
ID_5260044004300
ID_6270039003200
ID_7510070007200
ID_826008001800
ID_9340023004200
ID_1023002400800
ID_11430023004300
ID_12520043003200
Table 12. Route matrix among producers and customers in [km] in the case of real-world data.
Producers’ IDCustomers
ID_16ID_17ID_18ID_19ID_20ID_21ID_22ID_23
ID_NB20002200630044001600380078001900
ID_CB1100160064005400340037006600700
ID_KB1200750450042004300530085002700
Table 13. Input parameters of case study in the case of real-world data.
ID of Idle Micromobility VehicleParameters
Cost per Unit
[EURO/pcs*km]
Speed
[km/h]
CO2 Emission
[g/km]
Weight Capacity
[kg/Vehicle]
Volume Capacity
[dm3/Vehicle]
ID_10.2330482040
ID_20.3530541530
ID_30.2430482550
ID_40.52302417.535
ID_50.53405417.535
ID_60.294042510
ID_70.343241020
ID_80.62202412.525
ID_90.4225301530
ID_100.533241020
ID_110.43028.87.515
ID_120.253524510
Table 14. The optimal assignment matrix in the case of real-world data.
ID of Idle Micromobility VehicleTasks
ID_16ID_17ID_18ID_19ID_20ID_21ID_22ID_23
ID_100010000
ID_200000001
ID_300100000
ID_400000010
ID_510000000
ID_600000010
ID_700010000
ID_800000100
ID_901000000
ID_1000001000
ID_1100000001
ID_1200001000
Table 15. The resulting length of the optimized delivery routes, delivery costs, and virtual CO2 emission in the case of real-world data.
ID of Idle Micromobility VehicleParameters
Length of Routes
[km]
Cost
[EURO]
CO2 Emission
[g]
Delivery Time
[min]
ID_14.1018.861978.20
ID_25.6029.4030211.20
ID_36.2037.2029812.40
ID_42.9026.39705.80
ID_54.2038.962276.30
ID_64.907.112067.35
ID_78.9030.26214178.00
ID_81.9014.73465.70
ID_93.0018.90907.20
ID_105.0026.50120100.00
ID_116.0018.0017312.00
ID_127.409.2517812.69
Total60.10275.552118.60366.84
Disclaimer/Publisher’s Note: The statements, opinions and data contained in all publications are solely those of the individual author(s) and contributor(s) and not of MDPI and/or the editor(s). MDPI and/or the editor(s) disclaim responsibility for any injury to people or property resulting from any ideas, methods, instructions or products referred to in the content.