Article

A Decade of Studies in Smart Cities and Urban Planning Through Big Data Analytics

1
Department of Accounting and Audit, Bucharest University of Economic Studies, 010552 Bucharest, Romania
2
Department of Economic Informatics and Cybernetics, Bucharest University of Economic Studies, 010552 Bucharest, Romania
*
Author to whom correspondence should be addressed.
Systems 2025, 13(9), 780; https://doi.org/10.3390/systems13090780
Submission received: 19 July 2025 / Revised: 29 August 2025 / Accepted: 2 September 2025 / Published: 5 September 2025

Abstract

Smart cities and urban planning have succeeded in gathering the attention of researchers worldwide, especially in the last decade, as a result of a series of technological, social and economic developments that have shaped the need for evolution from the traditional way in which the cities were viewed. Technology has been incorporated in many sectors associated with smart cities, such as communications, transportation, energy, and water, resulting in increasing people’s quality of life and satisfying the needs of a society in continuous change. Furthermore, with the rise in machine learning (ML) and artificial intelligence (AI), as well as Geographic Information Systems (GIS), the applications of big data analytics in the context of smart cities and urban planning have diversified, covering a wide range of applications starting with traffic management, environmental monitoring, public safety, and adjusting power distribution based on consumption patterns. In this context, the present paper brings to the fore the papers written in the 2015–2024 period and indexed in Clarivate Analytics’ Web of Science Core Collection and analyzes them from a bibliometric point of view. As a result, an annual growth rate of 10.72% has been observed, showing an increased interest from the scientific community in this area. Through the use of specific bibliometric analyses, key themes, trends, prominent authors and institutions, preferred journals, and collaboration networks among authors, data are extracted and discussed in depth. Thematic maps and topic discovery through Latent Dirichlet Allocation (LDA) and doubled by a BERTopic analysis, n-gram analysis, factorial analysis, and a review of the most cited papers complete the picture on the research carried on in the last decade in this area. The importance of big data analytics in the area of urban planning and smart cities is underlined, resulting in an increase in their ability to enhance urban living by providing personalized and efficient solutions to everyday life situations.

1. Introduction

Since the earliest days of civilization, humans have tried to improve their lives by developing various solutions to satisfy their demands and continuously adapt to the evolving world. The accelerated population growth that humanity has experienced in recent decades has led large cities to need to implement solutions that will contribute to an efficient management of urban resources and infrastructure. Currently, the main activities that have an enormous impact on a well-organized society are diverse, including medicine [1], public transportation [2], smart grid networks [3], and education [4]; all have the common goal of enriching the urban citizens’ quality of life. With the continuous evolution of these urban infrastructures, the concept of a smart city was introduced.

1.1. Setting the Scene

The primary purpose of modern and smart cities is to increase the life quality of individuals and help the environment by integrating digital technology in urban areas. As this technology advancement was slowly gaining traction across urban communities in recent years, the progress has stalled, since storing and processing large amount of data produced by sensors of smart infrastructure was a major impediment. Nevertheless, the integration of big data architecture in such types of systems helps cities to come closer to the near-future reality of having a smart infrastructure.
Being one of the core concepts in the digital area [5], big data has attracted the interest of numerous academics. Gandomi and Haider [6] discussed big data in their manuscript and defined it as a term that describes large volumes of high velocity, complex, and variable data, which requires advanced computational power to analyze the information. “High velocity” refers to the speed at which data is transmitted and must be processed, whereas “complex” refers to how difficult it is to model the data, and the “variable” term suggests the diversity of data types. The implementation of this concept in smart cities has become imperative, as current hardware technology would not cope with the entire volume of data.
Along with the emergence of the term “smart city”, the concept of urban planning has also evolved. In the paper written by Cheshmehzangi [7], urban planning is defined as “the process of creating and overseeing urban areas to meet the many complex issues”. Even though the concept of a smart city appeared a long time ago [8], it experienced substantial development due to the recent technological evolution that has facilitated the digitalization of large metropolitan areas. Smart cities represent a peak in human settlements, in being designed to respond to individuals’ essentials in all aspects: traffic intelligence [9], bicycle lane systems [10], sustainable energy production [11], health monitoring [12], solutions for electrical voltage problems [13], irrigation systems in urban parks [14], and charging stations for electric vehicles [15].
By investigating the current literature, a concern has been observed regarding the applicability of smart cities in borderline or crisis situations [16,17,18]. These cities are not only efficient systems for resource consumption, but also rescue measures in extreme situations. A key article around this topic is the one written by Megahed and Abdel-Kader [19], which examines how society has been affected by the COVID-19 pandemic, and addresses the challenge of redefining urban planning in such a manner that citizens’ health is not affected. The individuals’ physical and mental health during crisis situations was analyzed, emphasizing the issue of flexible public spaces, safe mobility, modern teleworking, and tele-education technologies. Some concluding remarks are provided, and it is also highlighted the fact that all citizens should have the same facilities in a fair manner, without any form of discrimination.
Westbrook and Costa [20] propose a new concept of a city in which essential needs (e.g., medical services, access to basic products and services) are within a maximum of 15 min of citizens’ homes. Thus, with the help of artificial intelligence, data is collected and analyzed to estimate the degree of urgency and provide the most optimal routes. The COVID-19 pandemic is a referenced example in this manuscript, and the authors highlight the importance and the numerous benefits that would be generated by the implementation of such city, especially in the healthcare domain, for both doctors who were facing a staff crisis, and patients, who had to wait long times to receive the necessary treatment.
Another relevant article is the one written by Alshamaila et al. [21] in which 50 works from the specialized literature are analyzed and three research directions are proposed. The first one includes transport, energy, and water systems, which are monitored for automatic detection in case of damage. The second one analyzes the responsiveness of cities in crisis situations. Drones are deployed to investigate traffic and to propose new access routes for intervention teams. The third research direction examines the communication phase with citizens, who can report the issues they encountered through mobile applications, helping the authorities to react faster and counteract these challenging situations.
However, apart from the benefits brought by a smart city, certain shortcomings can also be identified, both from a technical and conceptual point of view. First, being a distributed network, security breaches are at any time a major risk [22]. Cyber-attacks are becoming more frequent in smart cities due to the information they store. Consequently, once the attackers manage to infiltrate these systems, they have access to sensitive data. On a conceptual level, there is the problem of digital exclusion [23]. Since not all citizens have access to the internet [24] or not all of them have the ability and competence to use it, there is a risk that only a part of the population will benefit from the advantages that this technology brings.
In the European context, smart cities are often associated with Information and Communication Technologies (ICT), transport, and energy, which are considered key elements for implementation, innovation, and sustainability. The concept of “smart city for sustainable development” underlines that technological adoption necessitates great attention to environmental and social implications [25]. Instruments such as the Urban Mobility Plan (SUMP) and Mobility as a Service (MaaS) are of high importance as they help cities be better organized, plan the urban transport more efficiently, and make it more accessible for citizens through user-friendly digital platforms. More information on this topic is offered by Russo and Rindone [26] and Lukasiewicz et al. [27].
Considerable attention should also be offered to big data analytics, which have a significant impact in smart cities’ development and improvement. For instance, cybersecurity analytics (e.g., encryption algorithms, anomaly detection, etc.) helps to protect citizens’ sensitive data and gain their trust, while interoperability solutions [28] (e.g., data integration tools, API-based data sharing, etc.) offer the possibility of integrating traffic, energy, and environment data which have the advantage of increasing the system’s efficiency and reducing their costs. Smart home data analytics [29] (e.g., real-time monitoring, sensor data mining, etc.), along with the implementation of IoT solutions, enhance citizens’ living standards and diminish their spending, while smart tourism analytics [30] (e.g., geospatial analytics, clustering, etc.) can offer crucial details about tourists, create an efficient infrastructure planning, generate personalized services, and facilitate economic growth. Traffic analytics [31] (e.g., GPS data mining, machine learning, etc.) can uncover crowded places, optimize routes, lower emissions, and urban congestion. Environmental analytics [32] (e.g., time-series forecasting, simulation, etc.) have a substantial impact on saving resources, decreasing pollution, and even developing sustainable smart city solutions.

1.2. Aim and Research Questions

That being presented, the aim of this paper is to conduct a detailed investigation on the published articles around smart city and urban planning, better comprehend the domain, understand the power of big data analytics, observe the current challenges and gaps, and even provide some useful information that future researchers and authorities can further utilize to expand the area. The implementation of these systems in as many cities as possible is very important, especially in the current decade, in which the technology evolves continuously and the power of machine learning, artificial intelligence (AI), and Geographic Information Systems (GIS) is substantial.
Furthermore, the integration of big data analytics within smart cities opens up for new perspectives in other connected domains such as accounting and auditing, where data-driven approaches are increasingly essential for monitoring public resource allocation, providing financial transparency, and ensuring performance-based decision-making. As smart governance becomes more prominent both in research and in practical situations, these disciplines play a pivotal role in validating the effectiveness and accountability of smart infrastructure investments and public service delivery.
In the following, the selected domain will be analyzed from numerous perspectives, and insights will become visible. The manuscript will provide answers to diverse questions including, but not limited to, the ones mentioned below:
  • RQ1: What can be stated about the progress of the scientific research on smart cities and urban planning using big data analytics?
Investigations such as annual scientific production evolution and annual average article citations per year evolution offered readers an overview of the research field and demonstrated the high academic interest in and significant growth of the domain, especially in the last decade, supporting the answers for RQ1.
  • RQ2: What insights regarding the number of published articles and their citations are uncovered?
For RQ2 there were multiple analyses performed (e.g., Bradford’s law on source clustering, journals’ impact based on H-index, most relevant journals, most global cited documents, etc.), which highlighted the key sources in the domain with the highest number of published papers, and uncovered details about citations.
  • RQ3: Which are the most prominent authors involved in writing about smart cities and urban planning through big data analytics?
For RQ3, there were examinations conducted, such as top authors with respect to the number of published documents and their production over time, which revealed the main figures in the field.
  • RQ4: Which collaborations among countries, authors, and affiliations have made the most significant contribution of the field’s development?
In order to respond to RQ4, the collaboration index was investigated, along with collaborations between countries, authors, and affiliations, which proved the significant evolution of the field due to the high number of national and international partnerships.
  • RQ5: What key research topics and themes are most frequently explored in the scientific literature?
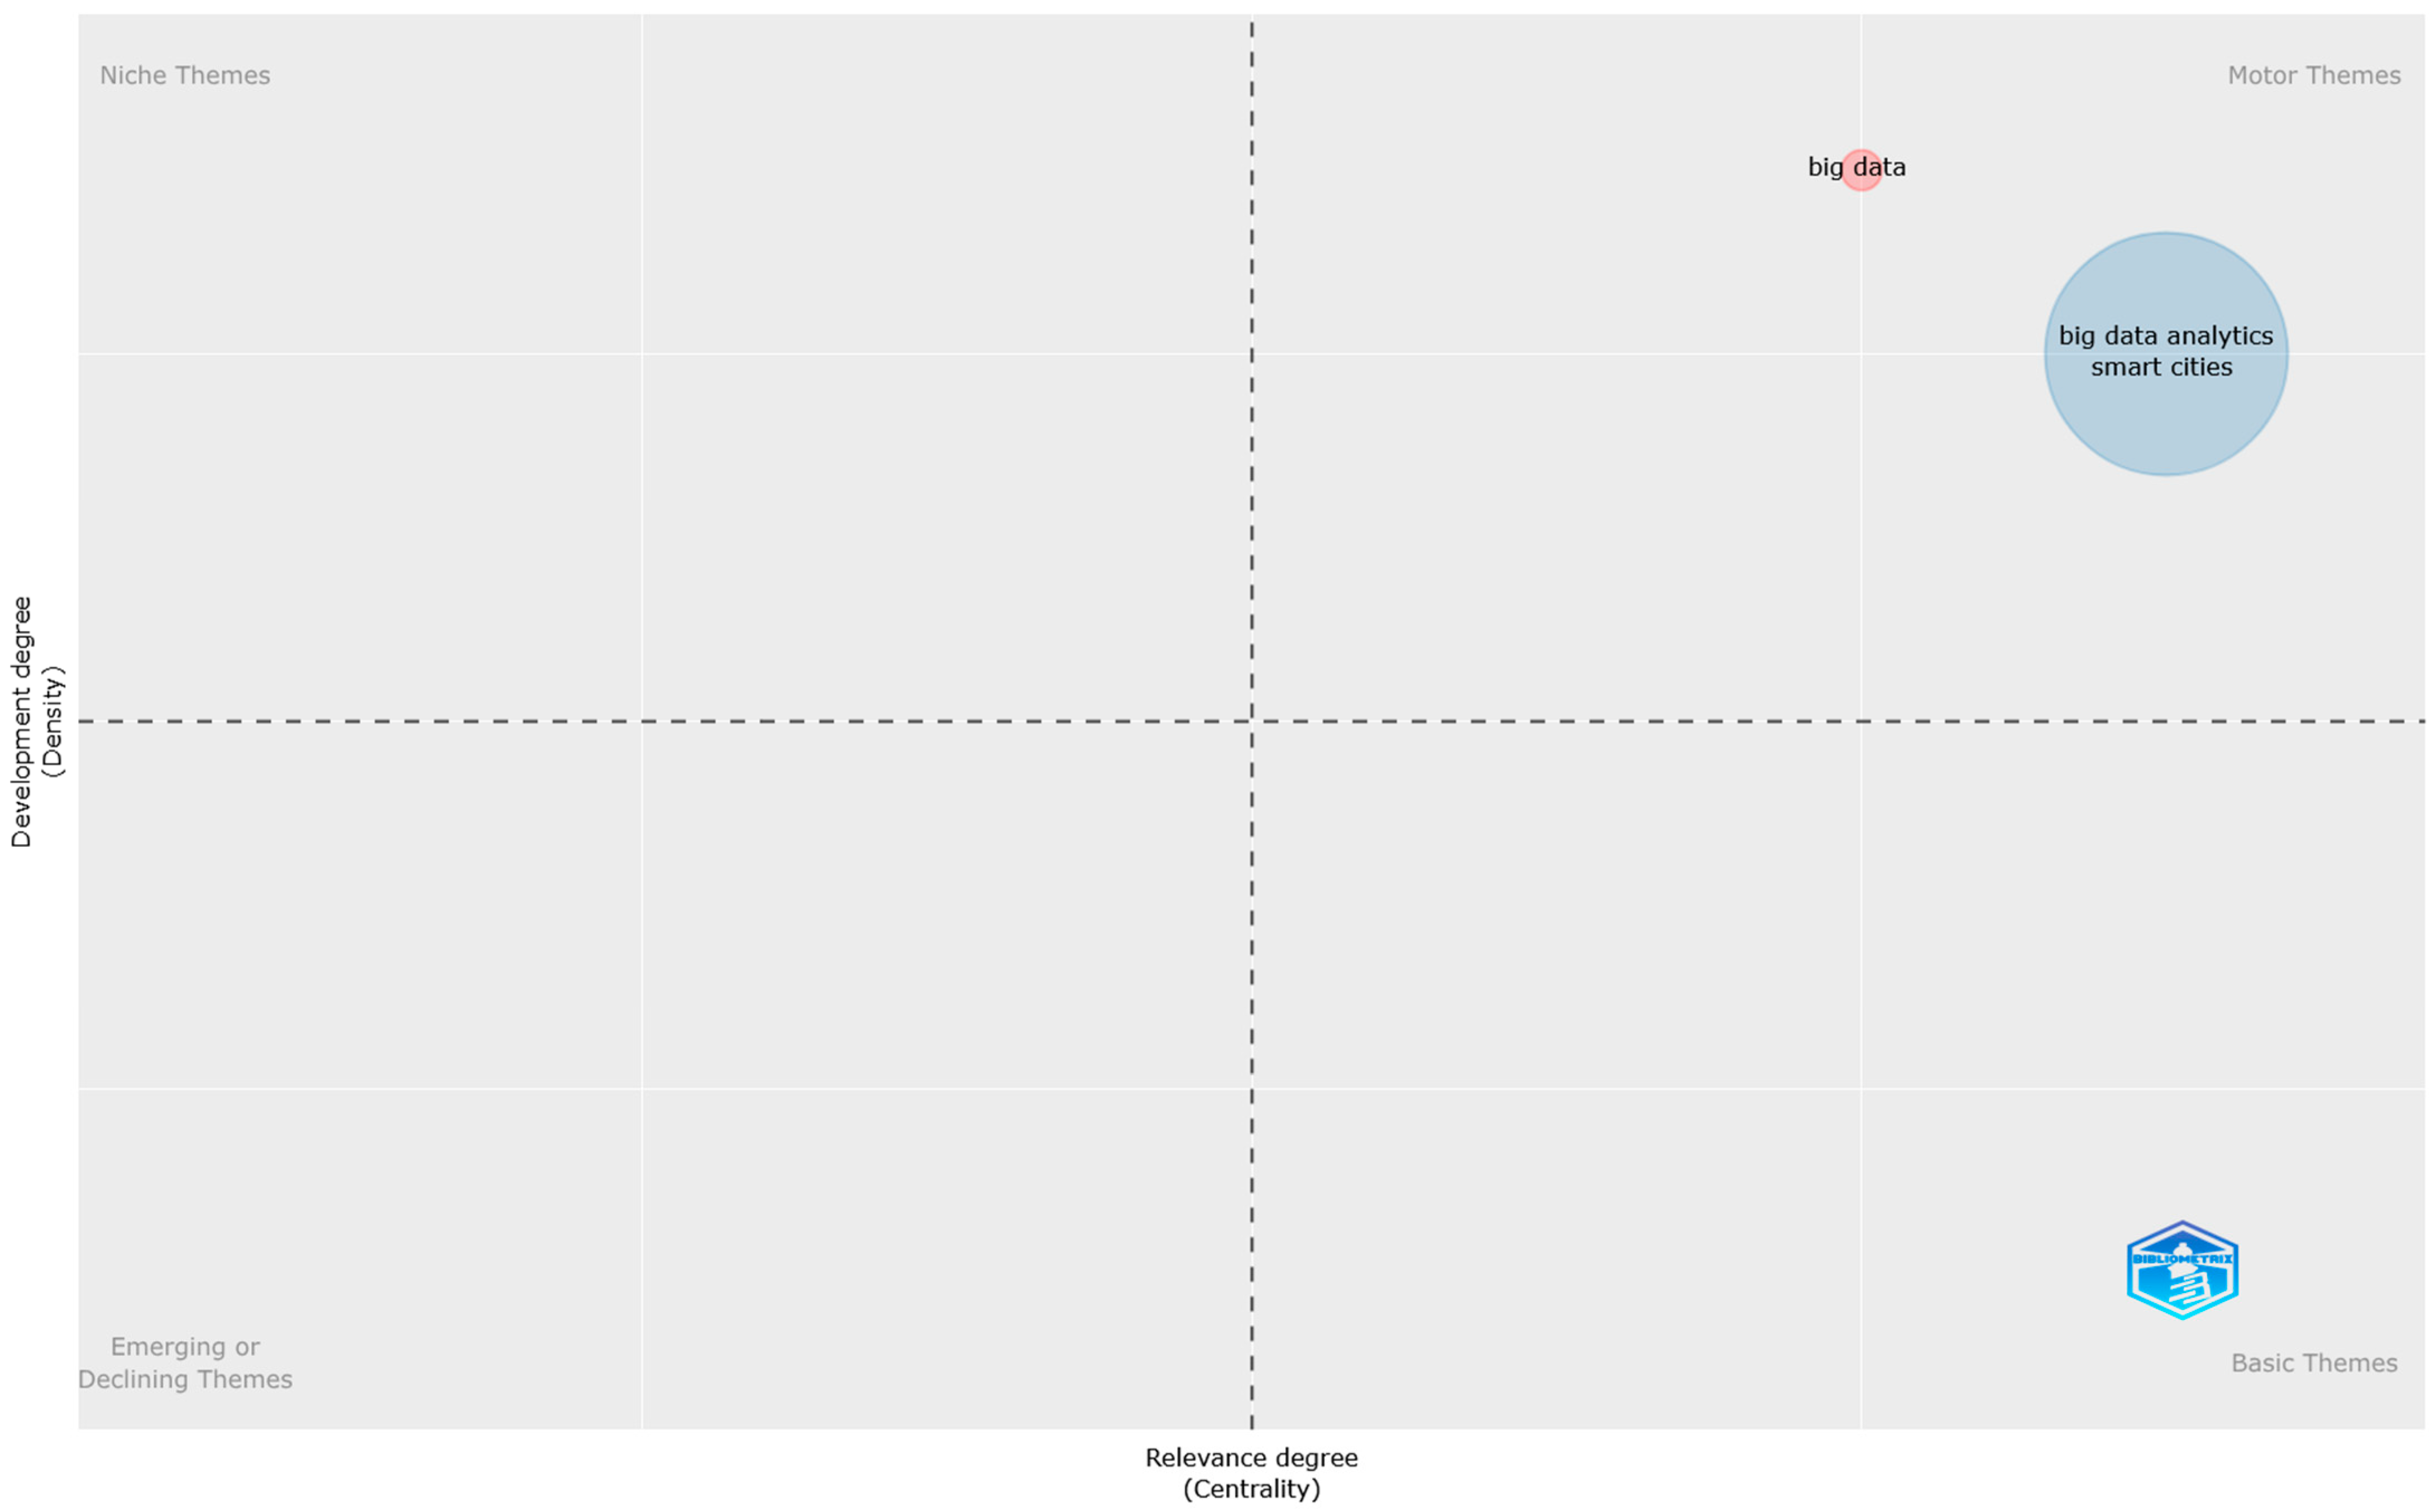
Lastly, for identifying the key topics and themes (RQ5), investigations such as thematic maps, mixed and word analyses were performed, doubled by topic extraction through the use of Latent Dirichlet Allocation (LDA) and BERTopic.

1.3. Structure of the Paper

This article is structured in an organized manner, including five distinct sections. The first one provides a broad perspective of the topic addressed, while the second section analyzes the methodology and the methods involved in this paper, along with the steps followed for collecting the final dataset. The following section is mainly focused on conducting the actual bibliometric investigation, using the filtered set of papers. Multiple perspectives and facets are considered during the analysis. The fourth chapter is dedicated to discussions, where the key findings of this study are presented and compared to the results found in other similar manuscripts. The fifth section is oriented towards limitations, while the last one draws the final conclusions, and underlines the importance of the study and possible future directives that can help interested researchers and authorities in further extending the domain and easily integrate efficient strategies in the urban environments, in such a way to maximize the benefits offered by the technological evolution, adapt to citizens’ needs, and improve their quality of life.

2. Materials and Methods

This section is oriented towards the materials and methods involved by the scientists in the current bibliometric investigation. The information provided here is important for the readers, since it offers a broad vision of the steps that were followed to collect an appropriate set of data and establishes the main facets through which the papers will be examined.
Figure 1 outlines the two primary stages of the examination, which will be detailed throughout this paper: dataset extraction and bibliometric analysis. This methodological approach was followed by many academics in similar studies, addressing numerous topics, including renewable energy communities [33], sentiment analysis [34], recommender systems [35], and misinformation detection [36].
The first phase involves the extraction of the documents from the Web of Science database [37], followed by the use of multiple filters (keywords, year of publication, document type, and language).
The second stage includes the analysis of the previously collected articles, focusing on several facets (dataset overview, sources, authors, the literature, and mixed analyses). Based on the information uncovered during this phase, the concluding remarks, which are useful for both the academic community and authorities, are highlighted.
In the following two subsections, each phase will be discussed in depth.

2.1. Dataset Extraction

Dataset extraction, the first stage, is focused on collecting the set of papers that will be used for the bibliometric investigation. In this manuscript, the data was collected exclusively from the Web of Science Core Collection database [37] (known as WoS), a decision made based on several arguments, all outlined below:
  • After reviewing the current scientific literature, it was noticed that most of the scientists involved in writing bibliometric studies opted for a single database approach. Some of the articles in which WoS was utilized as a sole source for gathering the set of data are listed here and address various subjects: sustainable energy [38], Twitter [39], cybernetics [40], digital era [41], Large Language Models research [42] and neutrosophic research [43].
  • WoS includes papers from all over the world, across numerous subjects, and has an up-to-date version, with a user-friendly interface. Cobo et al. [44] and Bakir et al. [45] further discuss the prominence of this resource within the scientific community in their manuscripts.
  • Singh et al. [46] demonstrated the authority and impact of this database compared to other alternatives, although it maintains a higher standard of article selection.
  • The data generated from the WoS database can be exported in a raw format and then directly imported into Biblioshiny 4.2.1, the R 4.4.0-tool utilized by the authors for generating the visual illustrations provided in the following chapter, where the bibliometric analysis is conducted. Tools such as VOSviewer 1.6.20 and CiteSpace 6.3.R1 were also used for generating some illustrations in order to cross-check the results.
  • The current article includes numerous individualized analyses, and the use of multiple sources would have generated challenges in shaping the hierarchies.
Moreover, Liu [47] and Liu [48] emphasize in their articles that in order to have an accurate bibliometric examination, the access to sources must be as comprehensive as possible. Thus, for the article under discussion, the authors had access for all 10 indexes offered by the Web of Science database:
  • Science Citation Index Expanded (SCIE)—1900–present;
  • Social Sciences Citation Index (SSCI) 1975–present;
  • Arts and Humanities Citation Index (AHCI)—1975–present;
  • Emerging Sources Citation Index (ESCI) 2005–present;
  • Conference Proceedings Citation Index—Science (CPCI-S)—1990–present;
  • Conference Proceedings Citation Index—Social Sciences and Humanities (CPCI-SSH)—1990–present;
  • Book Citation Index—Science (BKCI-S)—2010–present;
  • Book Citation Index—Social Sciences and Humanities (BKCI-SSH)—2010–present;
  • Current Chemical Reactions (CCR-Expanded)—2010–present;
  • Index Chemicus (IC)—2010–present;
As already mentioned above, Web of Science has a user-friendly interface that offers users the possibility of directly applying filters to the extracted dataset, to select only the relevant papers for each analysis.
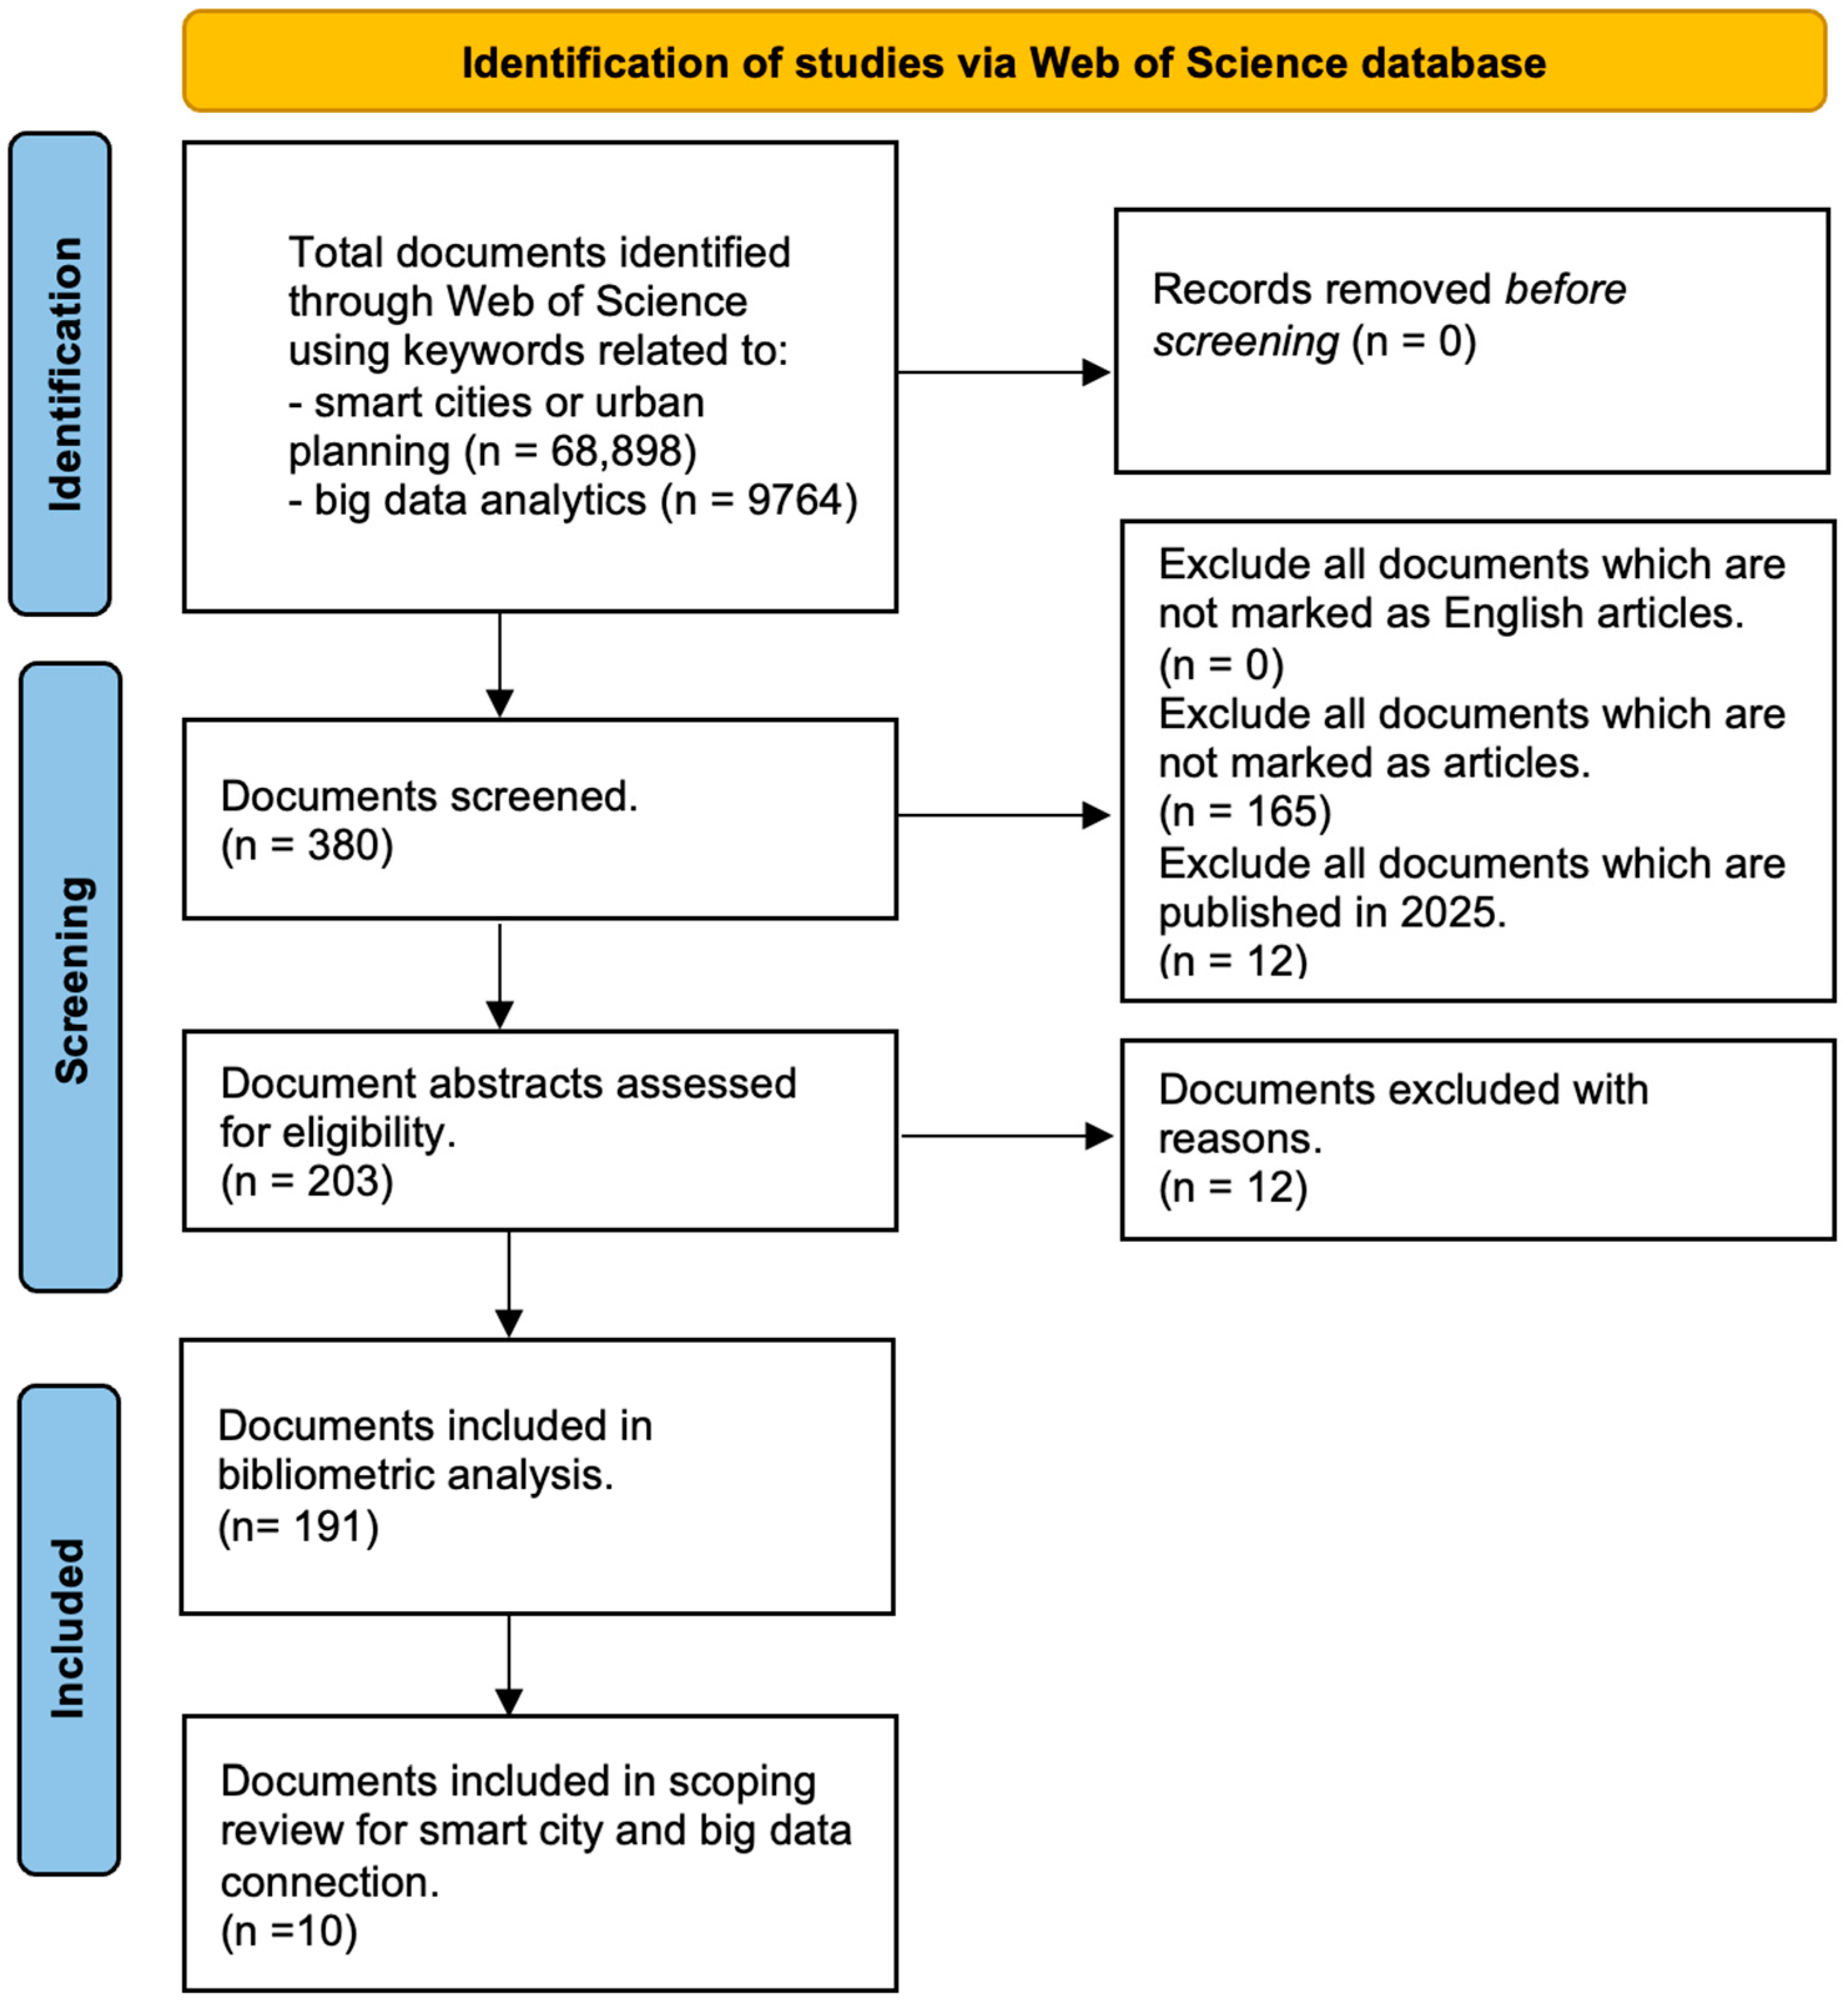
Table 1 captures the queries that were applied with the purpose of excluding publications not aligned with the research focus, while Figure 2 provides the corresponding PRISMA diagram.
The initial two exploratory steps searched for specific keywords in either title, abstract, or author’s keywords: the first one returned 30,579 papers related to smart cities (keywords: “smart_city” or “smart_cities”), while the second one returned 39,671 works about urban planning (keywords: “urban_plan*”—the use of * at the end enabled the retrieval of all lexical variants of the root term). The following exploratory step combined the two sets of data and reached a substantial number of 68,898 papers.
The fourth step retrieved 9764 papers that contains specific keywords related to big data analytics (keywords: “big_data_analytic*”—including all combinations with the mentioned root term).
It is important to mention here the rationale behind the keywords’ selection. Instead of using a wide range of terms and unnecessarily increasing the limitations of the dataset, it was preferred to focus on three essential keywords with their lexical variations that capture the central theme of the research. A similar approach was followed in other bibliometric investigations that address topics such as smart cities for urban planning [49] (keywords used: “Smart City”, “Smart Cities”, “Urban Planning”), big data and artificial intelligence in urban planning [50] (keywords: “AI in urban planning”, “big data analytics and urban development”, “smart cities and AI”, “data-driven urban planning”), data mining used for smart cities [51] (keywords: “data mining”, “smart city”, “smart cities”), big data and data mining in smart city construction [52] (keywords: “big data”, “data mining”, “data analysis”, “smart cities”, “intelligent construction”, “automated construction”, “civil engineering”), and crowdsourced data mining for cities [53] (keywords: “crowd*sourc*”, “social media”, “social networks data”, “microblog*”, “POI”, “point*of*interest*”, “VGI”, “location-based”, “LBS”, “LBSM”, “LBSN”, “volunteered geographic information”, “user*generated content”, “geo*tagged”, “geo-big data”, “Twitter”, “tweets”, “Foursquare”, “Flickr”, “geodata”, “check-ins”, “urban”, “city”, “cities”, “space”, “spatial”, “planning”, “spatio-temporal”, “mobility”).
The fifth exploratory step intersected the last two datasets and significantly reduced the number of papers to 380, which were related exclusively to smart cities or urban planning and big data analytics.
The next exclusion criterion was oriented towards the language in which the documents were written, an important step for a bibliometric investigation. After the execution of this query, no paper was removed, suggesting that English is still the most preferred language for writing academic research. The use of this filter was also noticed in other bibliometric works [54,55,56,57,58,59].
Figure 2. PRISMA flowchart according to PRISMA [60].
Systems 13 00780 g002
The following exploratory step was related to the document type (“article”). All scientific papers that are considered new and original scientific effort are marked by the WoS database as “articles”. It is important to mention here that conference proceedings are also included in this category [61]. The execution of this query almost halved the dataset, resulting in a total of 215 papers. A more detailed discussion regarding the different types of papers is given by Donner et al. [62], who presented how the number of citations can be influenced by different classifications of papers.
Filtering by the year of publication was considered useful because 2025 is not complete from a scientific point of view and this might affect the accuracy of the bibliometric results. Thus, the articles published in 2025 were excluded from the analysis, reducing the dataset to 203 papers.
Lastly, a manual selection of the papers by eliminating the early works which were not related to the “smart city” concept has been performed. As a result, 12 out of the remaining 203 articles addressed related topics, but without having applicability to urban development. Thus, these articles were removed from the list.
The final set of data consists of 191 English-written articles, which will be analyzed in depth in the following chapter, from multiple perspectives.
With the intention of providing a better understanding of the mentioned steps, a graphical illustration that follows the PRISMA (Preferred Reporting Items for Systematic Reviews and Meta-Analyses) flowchart [63] is captured in Figure 2. This scheme follows the classic structure: identification, screening, eligibility, and included. In the end, 191 articles remained to be considered for the analysis, and 10 to be described in detail (the ones that gathered the highest number of citations being considered the most influential in the field under investigation).

2.2. Bibliometric Analysis

In this section, the main facets of the bibliometric analysis are outlined. The previously collected dataset will be analyzed through multiple perspectives, involving numerous metrics.
The R-tool, Biblioshiny 4.2.1 [64], is used for the bibliometric analysis. Due to its intuitive design, along with its high efficiency in identifying trends, analyzing data, and shaping graphs or illustrations, this tool has become the scientists’ primary choice when conducting bibliometric investigations. This statement is further proved by some similar articles found in the academic literature [43,65,66,67,68]. VOSviewer 1.6.20 and CiteSpace 4.4.0 were also involved for cross-checking the results.
Figure 3 presents the bibliometric analysis facets, together with all the analyses conducted in each section.
The “Dataset Overview” component will provide the main insights related to citations, scientific production evolution, keywords, authors, and collaborations.
The “Source Analysis” section investigates the impact that articles have on the scientific community, involving various relevant indicators, such as the H-index or Bradford’s law.
The next component focuses on the authors and their productivity over selected years. Collaborations between them and institutional affiliations will also be analyzed.
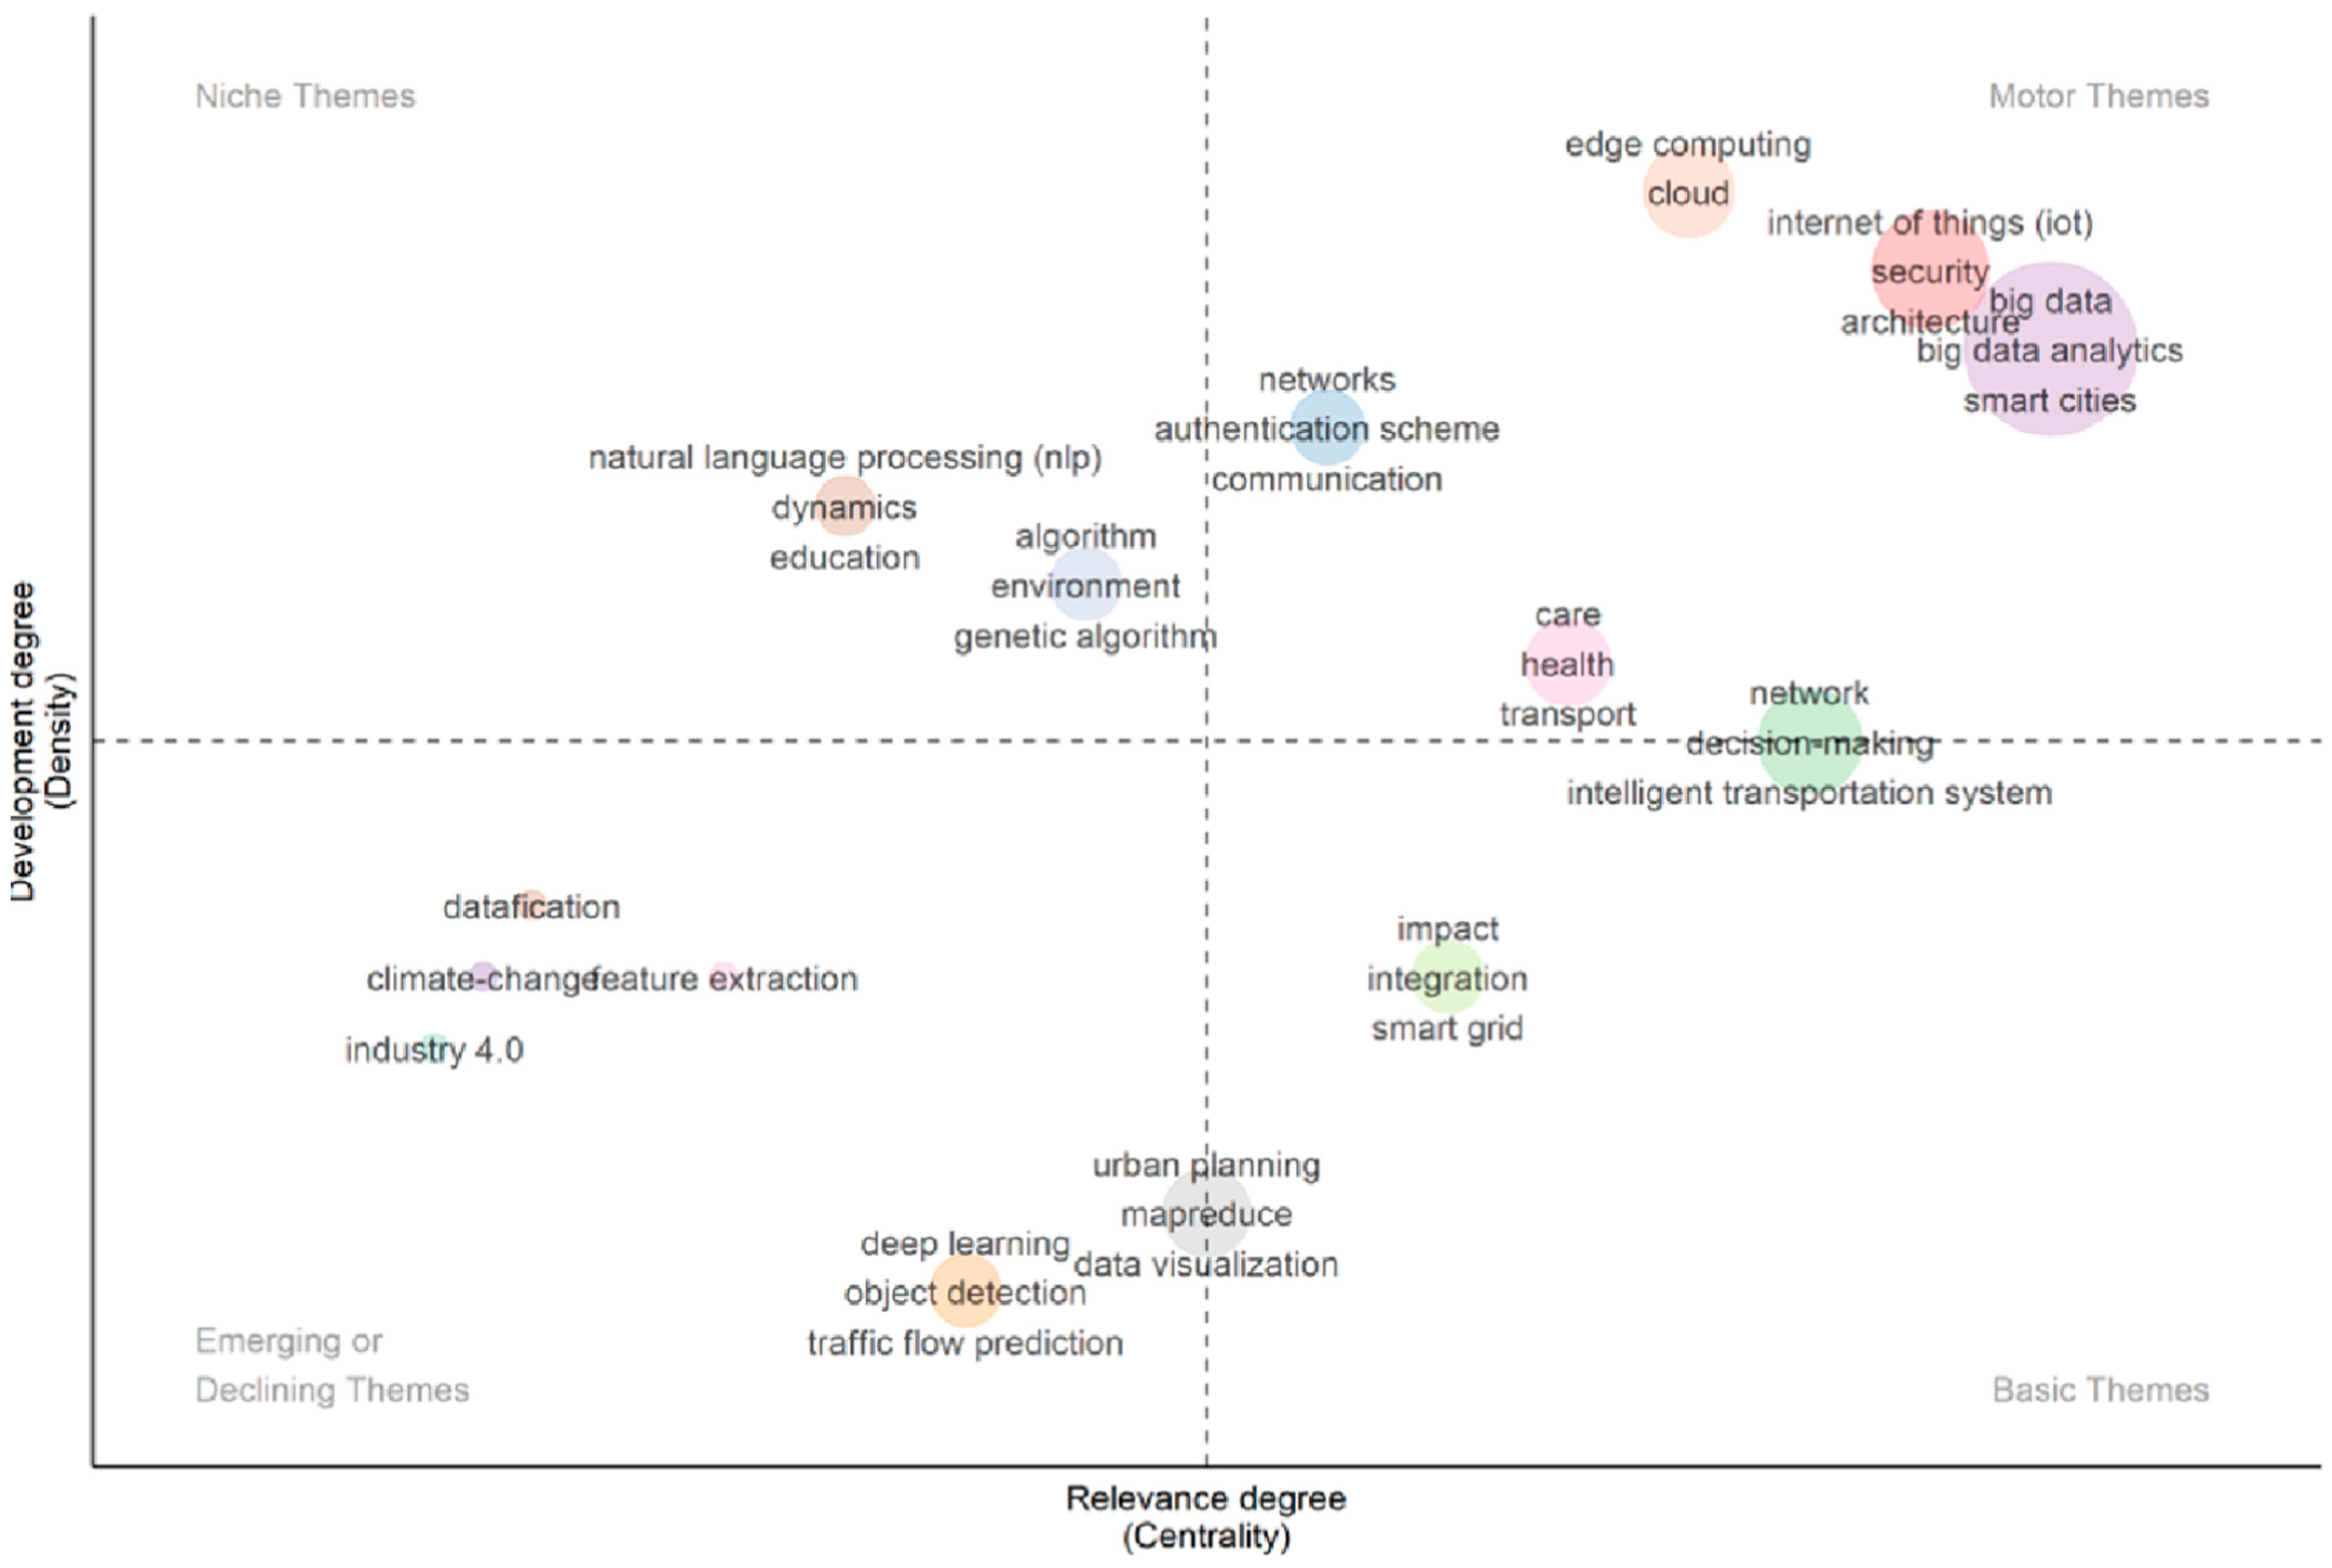
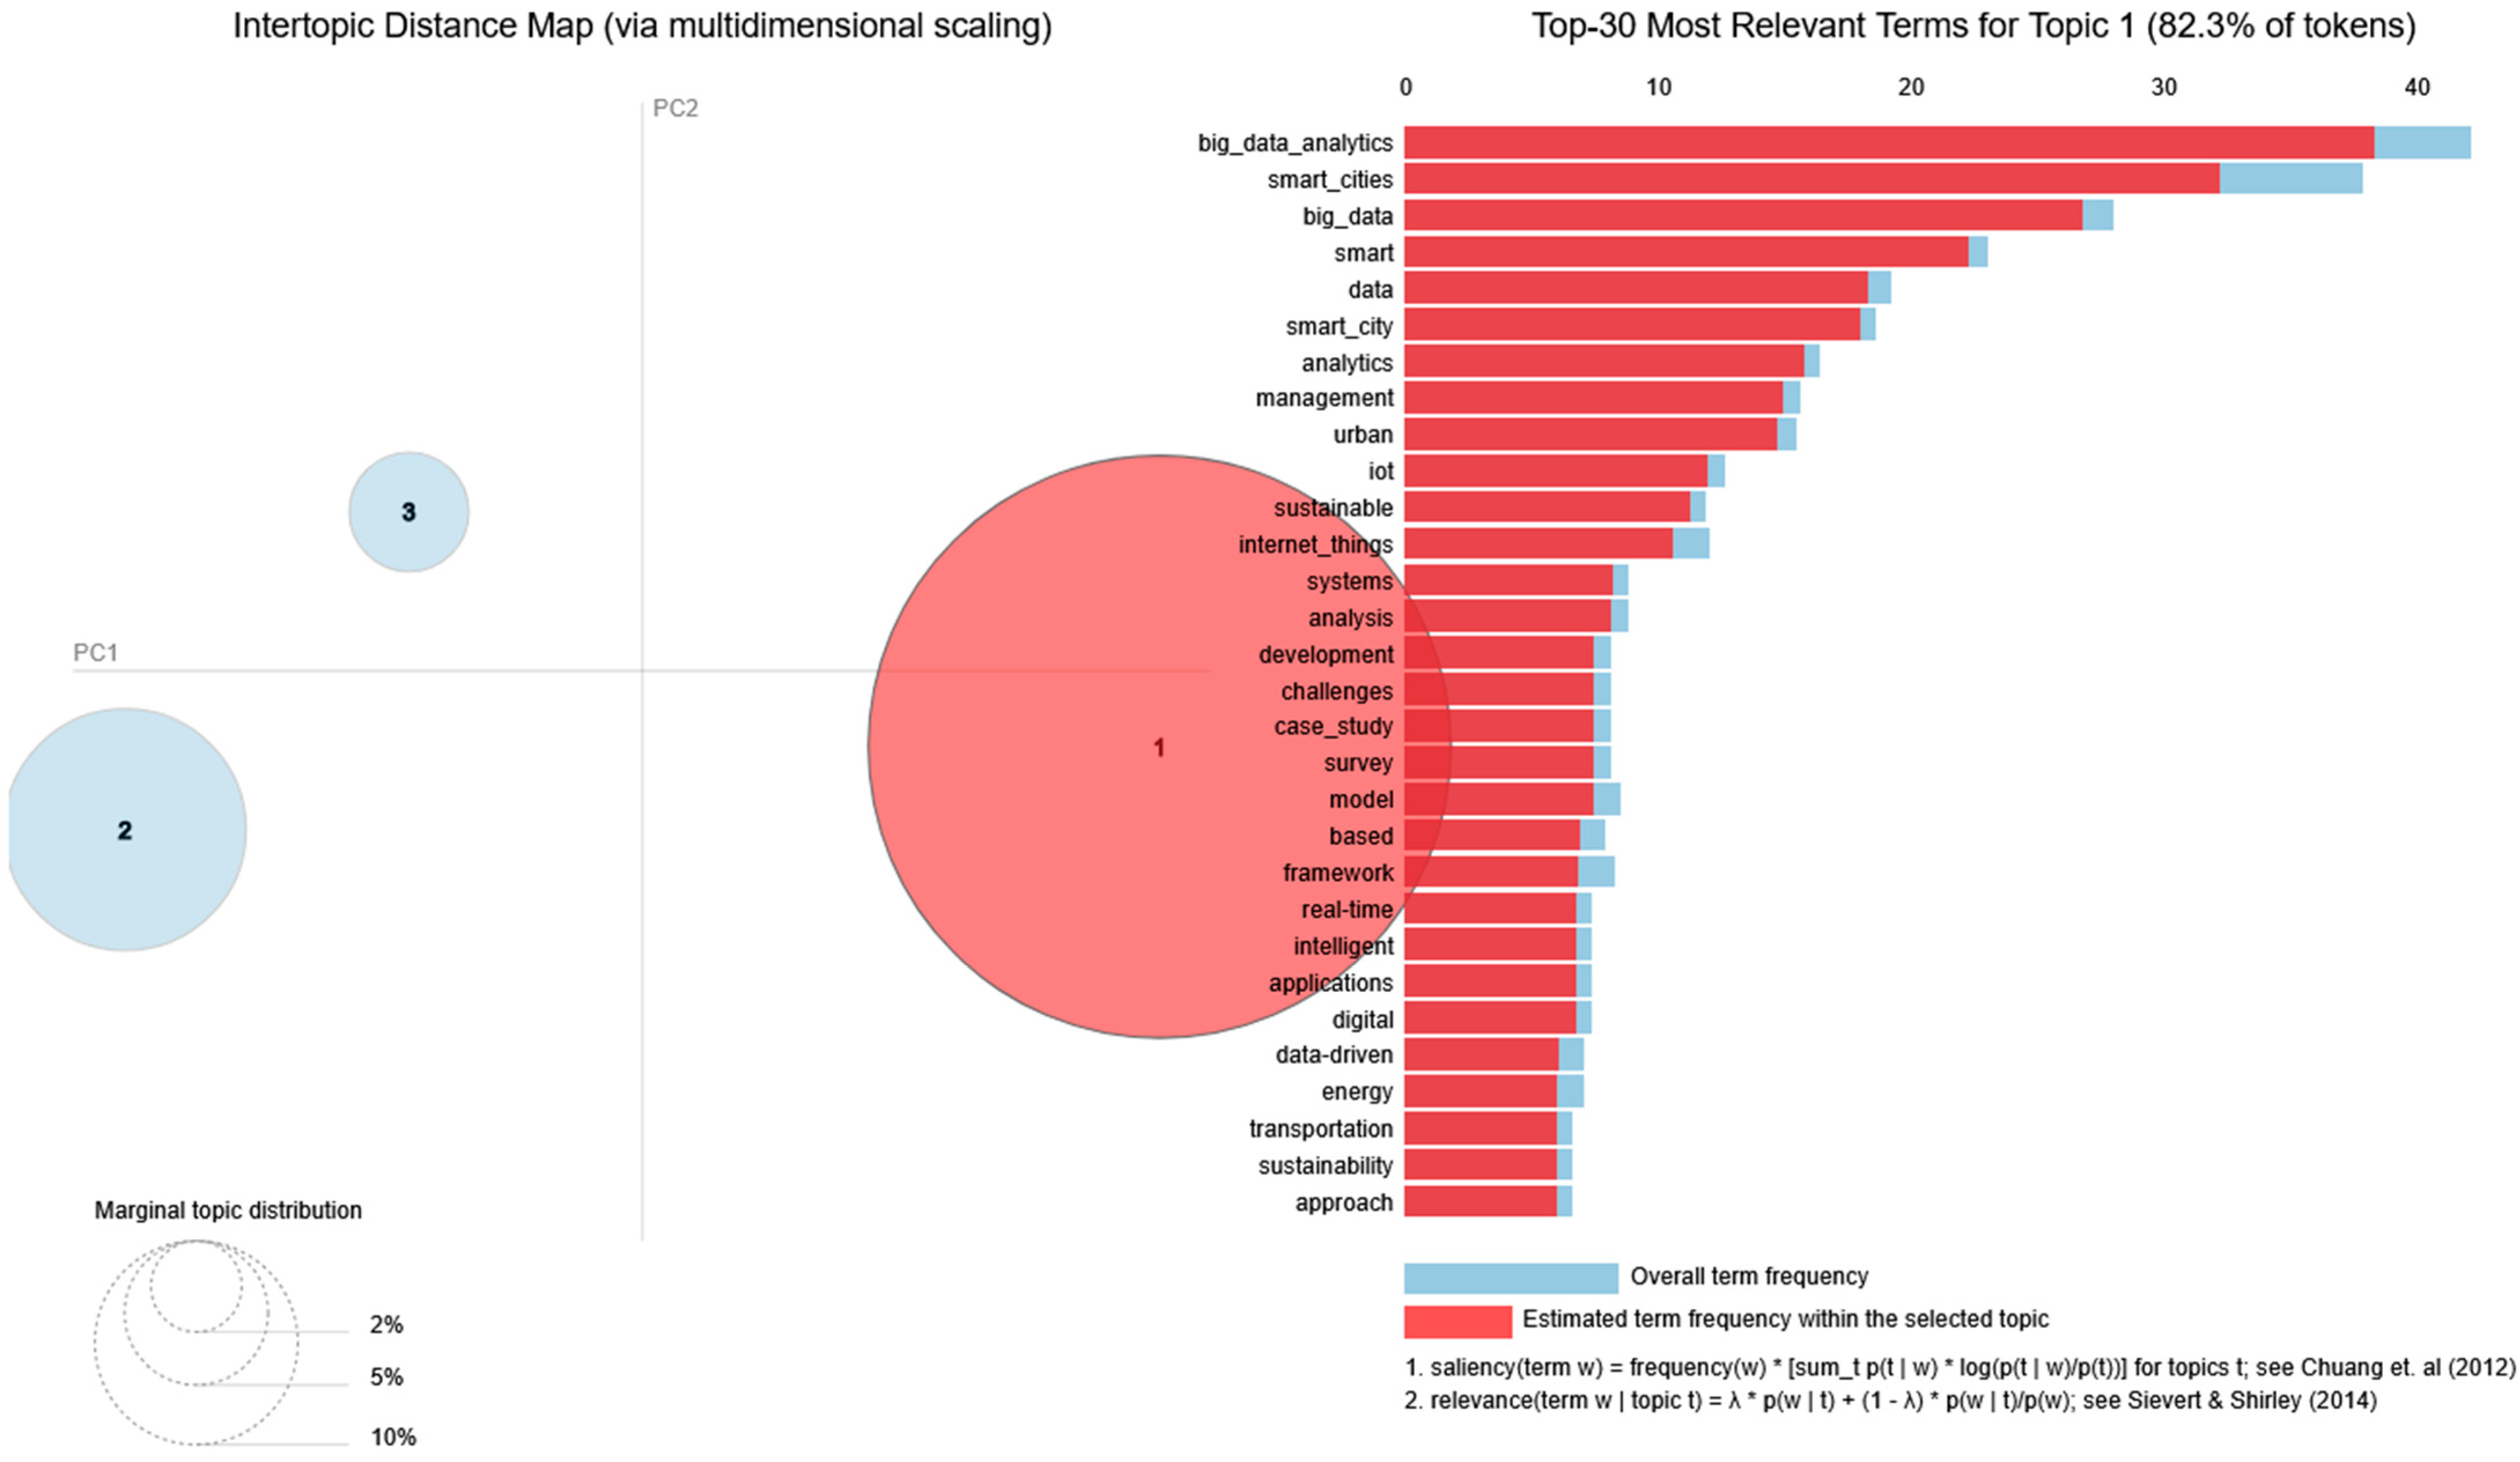
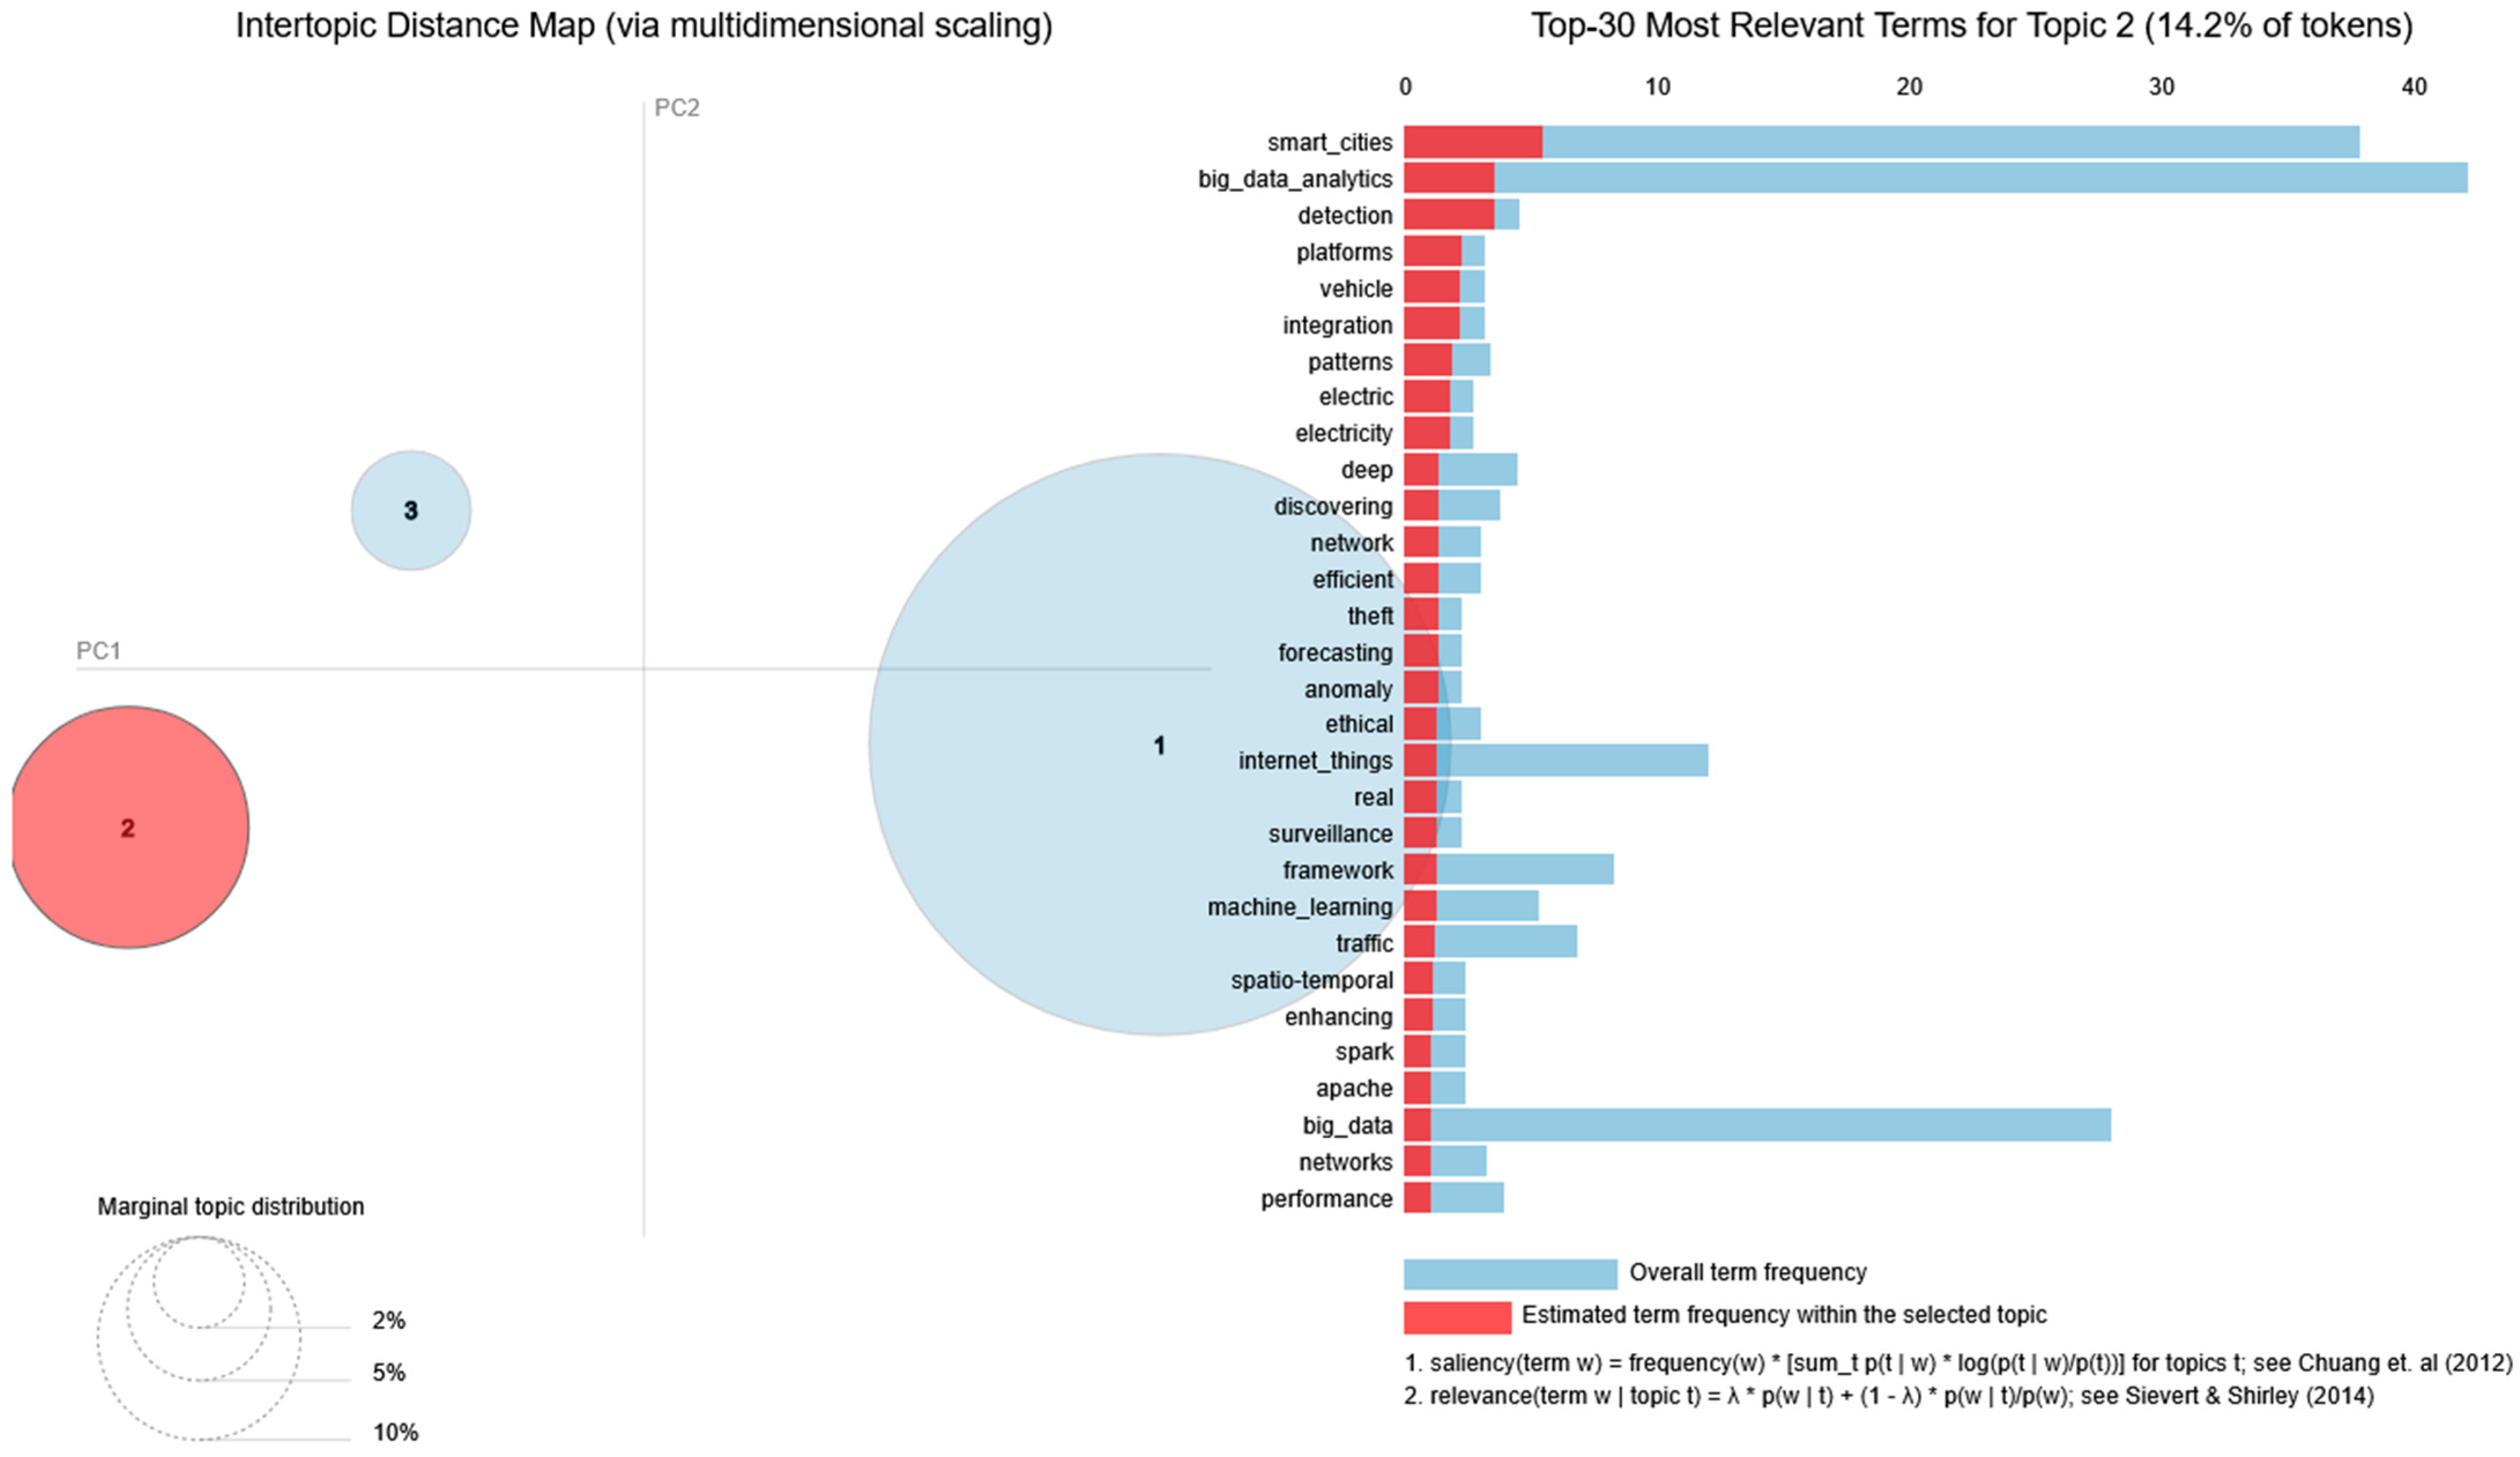
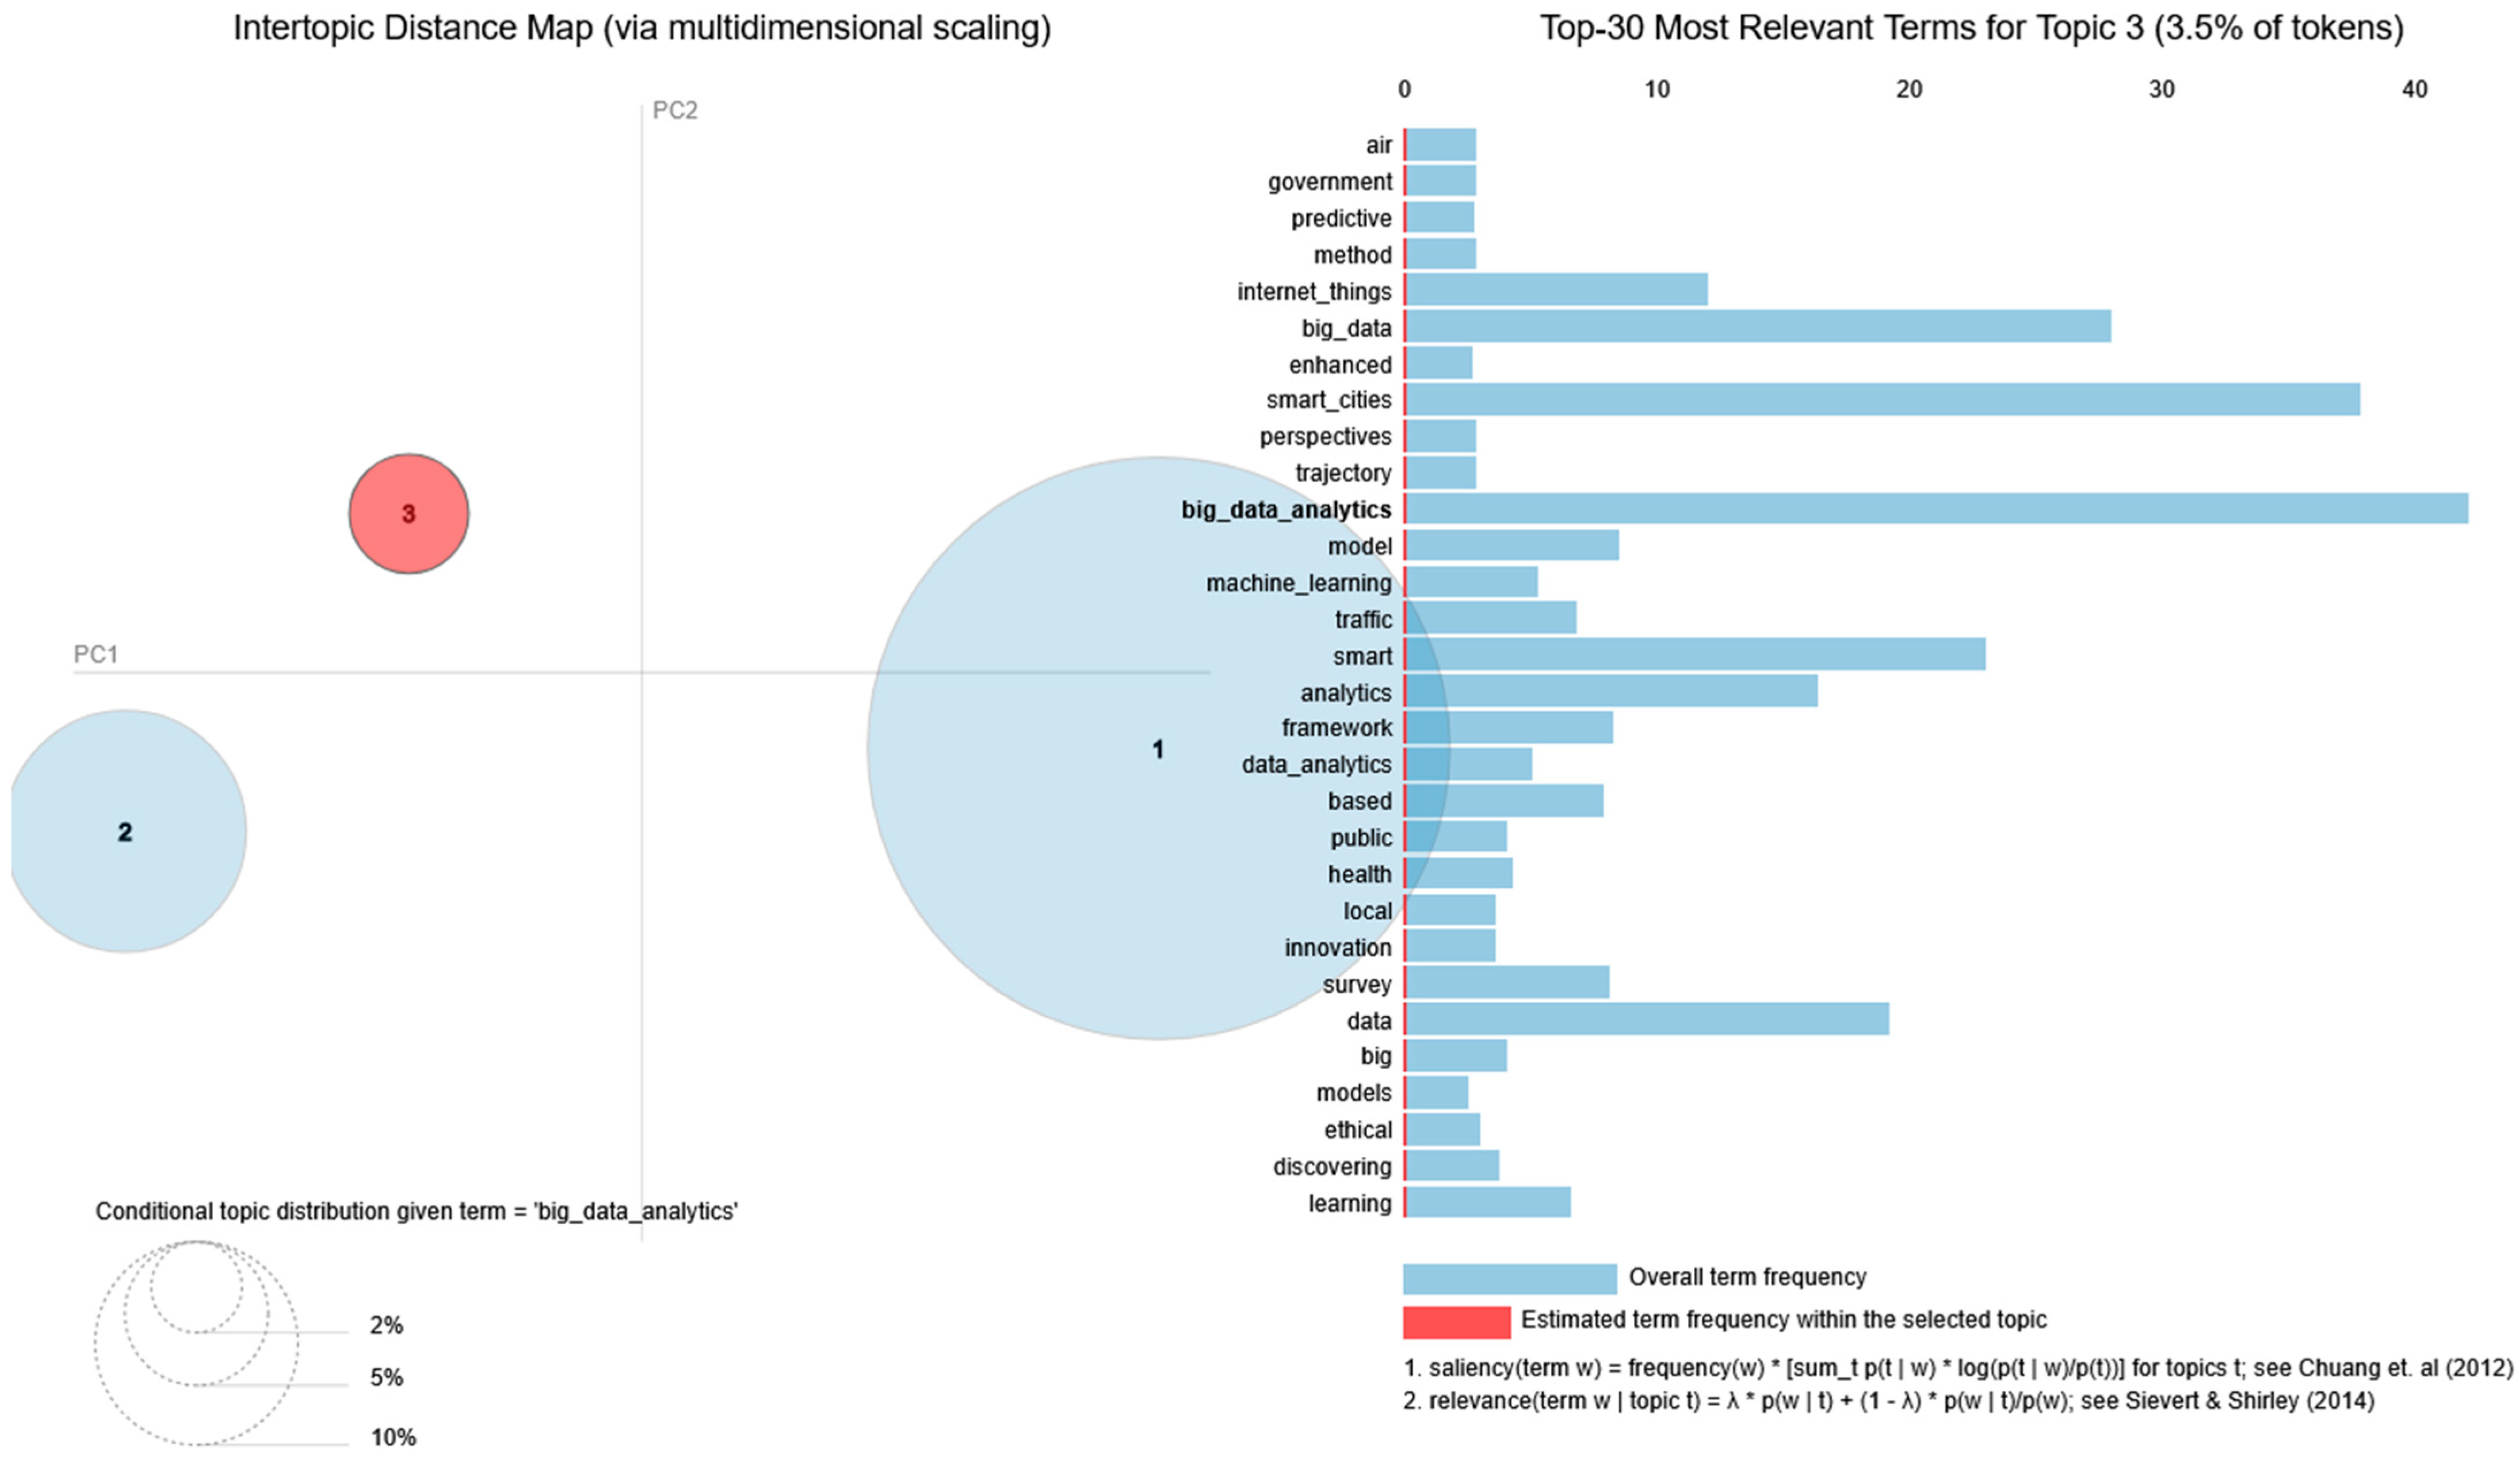
The fourth facet provides a classification of the works according to the number of citations, as well as comprehensive word analysis (e.g., trigrams, bigrams, keywords plus, thematic maps, topic analysis, etc.). To identify the main research topics, Latent Dirichlet Allocation (LDA) has been applied on a combined text corpus consisting of the titles and the abstracts of the analyzed papers. LDA is generative probabilistic model that analyzes word co-occurrence patterns inside a text corpus to identify the main themes. Prior to the modelling process, a text pre-processing step was performed using the Gensim (https://radimrehurek.com/gensim/, 26 June 2025) library [69]. During this pre-processing step, the text has been converted to lowercase, and the punctuation has been removed, together with the generic stop words. Additionally, bigrams and trigrams have been constructed using the CountVectorizer class from the scikit-learn (https://scikit-learn.org/, 26 June 2025) library [70] in order to better capture relevant multiple word expressions.
In order to achieve a good balance between a relatively small number of clusters and a good coherence of the topics, a grid search approach has been used, varying the number of clusters (between 3 and 6), as well as the alpha (0.01, 0.1, 1.0, ‘symmetric’, ‘asymmetric’) and eta (0.01, 0.1, 1.0, ‘symmetric’, ‘auto’) hyperparameters. The best results have been achieved when setting the number of clusters to 3, alpha to ‘asymmetric’ and eta to 1. Moreover, the LDA analysis has been further supplemented by the BERTopic approach. This method constructs coherent topic representations using a class-based variant of TF–IDF and has a proven competitive performance across several topic modelling benchmarks [71]. To improve topic detection accuracy, the text data was first pre-processed by converting all words to lowercase and removing punctuation. Next, the minimum cluster size and the minimum samples parameter of the HDBSCAN algorithm were iteratively fine-tuned to maintain an appropriate balance between granularity and interpretability [42]. The results of the BERTopic analysis have been further put in connection with the ones obtained in the case of LDA for supporting the topics identified in the selected dataset.
The last facet is dedicated to “Mixed Analysis”, which is oriented towards the analysis of three-field plots. This type of investigation provides a complex perspective on the literature in the research field, and highlights the connections between different categories of data.

3. Dataset Analysis

This section involves a detailed bibliometric investigation of the previously extracted dataset, through five perspectives (dataset overview, authors, sources, papers, and mixed analysis).
Visual illustrations, graphs, and tables generated by Biblioshiny4.2.1, VOSviewer1.6.20 and CiteSpace 6.3.R1 will assist readers in better comprehending the domain and understanding its evolution and impact within the academic community. As a result, key insights for both future scientists and authorities will become visible, along with gaps and areas that require additional research and resources.

3.1. Dataset Overview

The final set of data gathered exclusively from the WoS database includes 191 English-written articles that address a topic related to smart cities and urban planning and involve big data analytics. These manuscripts were published within the 2015–2024 period, in 119 distinct sources, highlighting the interdisciplinary nature of this field. The relatively low number of papers published across a decade suggests that the field under investigation it is still in its early stages. At the same time, the academics’ interest and engagement in this domain is substantial, reflecting its high importance and growing relevance for the current era.
The indicator that proves the novelty of the articles is the average years from publication, which recorded an average value of 4.77.
The major impact of the area under research and its relevance within the academic community are further evidenced by the following metrics: average citations per documents (60.1) and number of references (10,372).
Figure 4 shows the evolution of the number of articles published between 2015 and 2024.
The evident domain’s interest within the scientific community is proved by the annual growth rate value (10.72%), which was computed with respect to the below formula:
A n n u a l   G r o w t h   R a t e = F i n a l   Y e a r   P r o d u c t i o n I n i t i a l   Y e a r   P r o d u c t i o n 1 T i m e   S p a n 1
where “Final Year Production” represents the number of articles that were published in the last year included within the timestamp, while “Initial Year Production” symbolizes the number of articles that were published in the first year from the timestamp. Furthermore, “Time Span” denotes the difference in years between the publication of the first and the last article.
Considering these, the updated formula is as follows:
A n n u a l   G r o w t h   R a t e = 2024   Y e a r   P r o d u c t i o n 2015   Y e a r   P r o d u c t i o n 1 T i m e   S p a n   b e t w e e n   2015   a n d   2024 1 = 15 6 1 9 1 = 1.1072 1 = 0.1072 = 10.72 %
Although the topic experienced a significant growth in the academic community between 2020 and 2022, a small decline was noticed between 2023 and 2024. The initial growth could be attributed to the COVID-19 pandemic, which underscored the necessity of adopting smart solutions for resources’ streamlining. Nevertheless, during the mentioned period, the well-being of cities (e.g., safe means of transportation, a functional and efficient medical system, etc.) became a priority, which offered the academic world the chance to focus on this aspect and conduct various types of research.
The academic community’s interest in this field grew significantly between 2020 and 2022, but a slight decrease was then experienced between 2023 and 2024. The initial expansion could be attributed to the COVID-19 pandemic, a worldwide event that emphasized the need of adopting and implementing intelligent solutions for resource efficiency. However, throughout the aforementioned period, the well-being of cities (e.g., safe means of transportation, a functional and efficient medical system, etc.) became a priority within the academic community, a fact proved by the large number of published papers in the scientific literature that address these concerns and propose effective strategies and solutions to critical concerns.
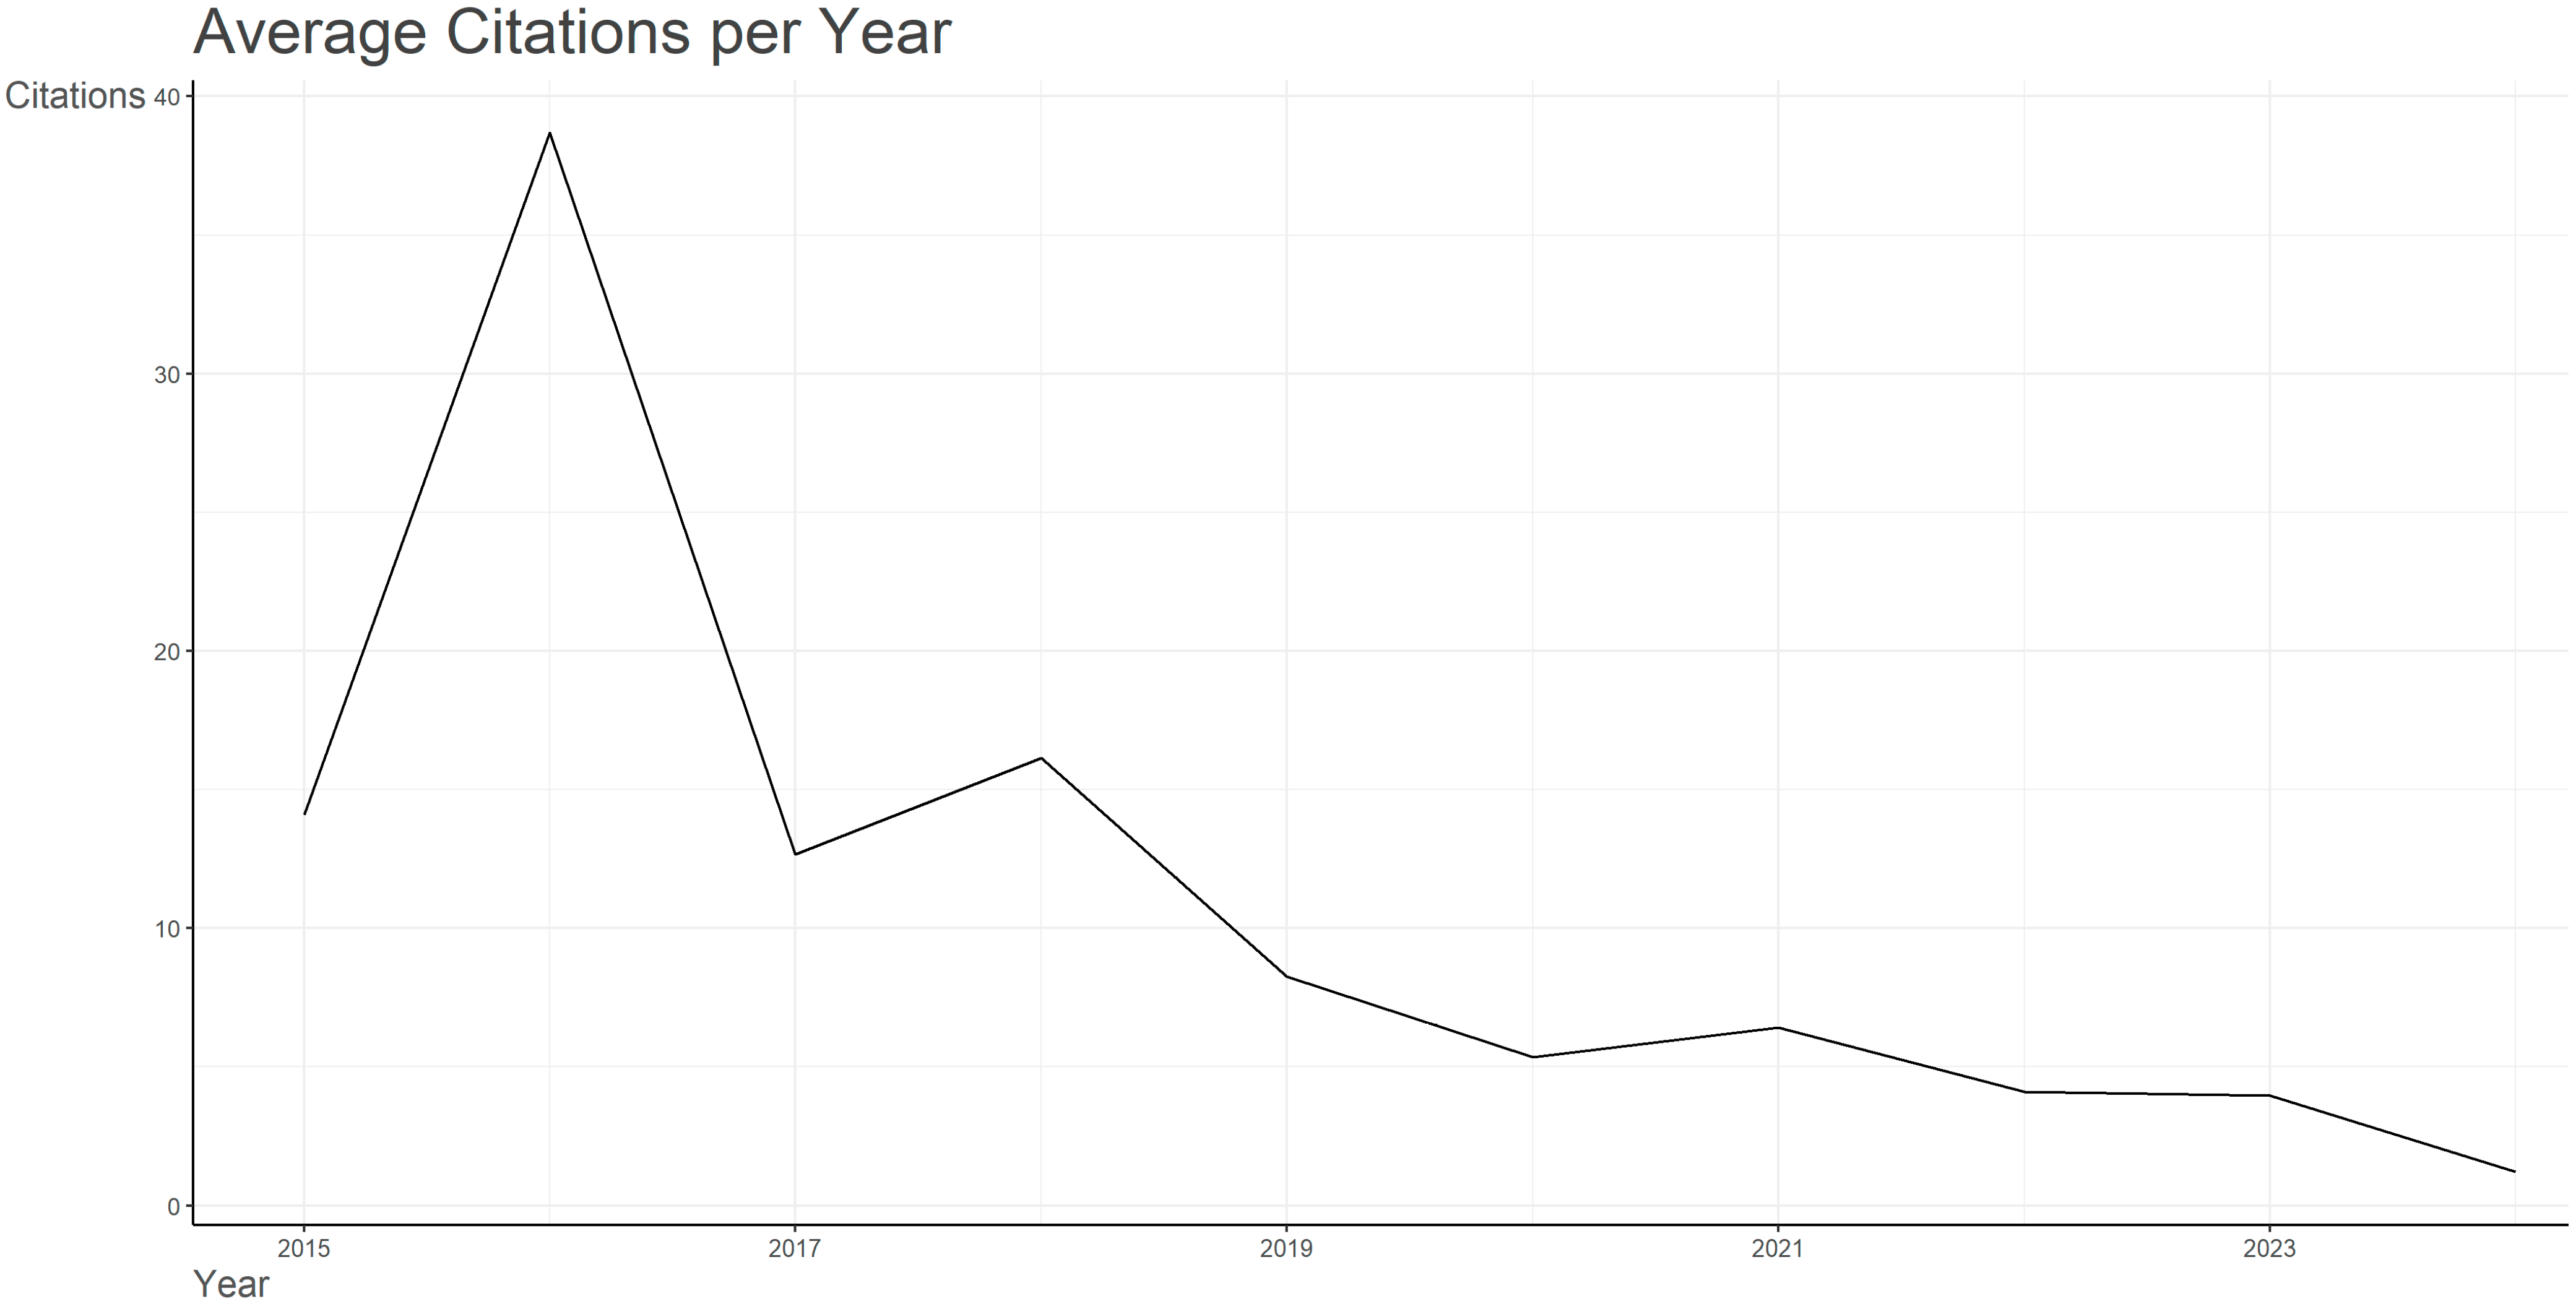
Figure 5 illustrates the evolution of the annual average article citations per year.
The trend indicates that the highest number of citations in the domain of smart cities and urban planning through big data analytics was recorded in 2016 (36 citations). After that period, the number of citations began to decline steadily, reaching an average of only two citations per year in 2024. This discrepancy between the number of citations across the years is generated by the fact that previous research studies represent a point of reference for the recent papers.
However, the low values registered in recent years should not be interpreted as a decline in the scientific community’s interest in the field. The explanation behind this phenomenon is that the novel published papers have not reached their targeted audience and were not yet cited in the latest articles. One further reason that contributed to this depreciation may be the large number of papers published in recent years, which generated challenges for an article to be distinguished within the field and be a reference for this topic.
With the intention of better comprehending the content of the papers extracted for this bibliometric analysis, the values recorded for keywords plus (344) and author’s keywords (673) will be investigated. It becomes visible at this point that the number of author’s keywords is almost two times higher than the number of keywords plus, proving that the authors have an interdisciplinary vision for this topic.
Keywords plus [72] consist of the terms that are automatically generated by the database, identified through the cited articles’ title, while author’s keywords represent the terms chosen by the author. A difference between these two categories is that keywords plus offer a broader perspective on the topic, with respect to the references used by the authors of the papers included in the dataset as a ground base for their studies.
By dividing the number of keywords plus (344) and the number of documents (191), an average of 1.8 is obtained, thus suggesting the existence of a concise vocabulary within the selected papers.
Similarly, by performing the division between the number of authors’ keywords (673) and the number of papers (191), an average of 3.52 is recorded.
The investigation of authors reveals relevant details about the domain of smart cities and urban planning through big data analytics. The high academic community involvement is proved by the large number of scientistics (656) recorded in the WoS dataset used for this manuscript, proving the field’s significance, importance, and applicability in today’s times.
By quickly investigating the discrepancy between the high number of authors (656) and the articles from the dataset (191), a remark can be outlined: in this field, there is a high tendency of collaboration between scientists, and the manuscripts are the result of teamwork. This observation is further proved by the values recorded for authors of single-authored documents (16) and authors of multi-authored documents (640).
To be more precise, only 2.44% papers from the dataset are single-authorship publications, while at the opposite end, 97.56% of the works represent academic collaborations with at least two contributors. The involvement of multiple authors in the domain brings with it several advantages, such as: diverse perspectives, greater visibility, increased productivity, enhanced peer validation, etc.
Going further with the discussion, the tendency of partnerships between authors in the domain of smart cities and urban planning through big data analytics is evident and proved once again by the low values recorded for two popular indicators: single-authored documents (16) and documents per author (0.291).
The values registered for authors per document (3.43) and co-authors per document (3.92) indicators underline that the papers written in this domain involve, in general, around three or four scientists, and they address challenging and high impact topics that require the involvement and expertise of multiple experts.

3.2. Sources

The hierarchy of the most relevant sources, with respect to the number of published manuscripts in the domain of smart cities and urban planning through big data analytics, are listed in Figure 6. For the present investigation, only the sources which recorded a minimum of four articles in the field were taken into consideration.
The IEEE Access and Sustainable Cities and Society are placed on the first two positions, both with the same number of articles: namely, ten.
At a minor difference, Sustainability journal is found to be third place in the hierarchy, with no less than nine published articles, followed by Future Generation Computer Systems the International with six articles.
The positions that follow belong to IEEE Communications Magazine, IEEE Internet of Things Journal, and Sensors, each with five manuscripts, and Applied Sciences-Basel, with four papers.
As can be easily noticed, the mentioned journals focus on technology, IoT, sustainability, smart systems, digital infrastructure, and urban development, proving that authors tend to publish their papers on sources that are oriented towards the domain addressed, to ensure that their findings reach the target audience.
All these journals are mainly oriented to areas such as technology, IoT, sustainability, smart systems, digital infrastructure, and urban development. This demonstrates that authors consider multiple aspects when choosing the right journal for publishing their paper, as their findings must be read by the target audience.
Figure 7 presents Bradford’s law on source clustering. From a theoretical perspective [73], three distinct zones are delimited: Zone One (the core—which consists of the most relevant journals with the highest number of citations recorded), Zone Two (the centre—which comprises journals with moderate productivity), and Zone Three (the outside—which includes sources with decreased productivity).
This law suggests that a relatively small number of sources publish a large proportion of the total number of relevant articles. As shown in Figure 7, the area marked in grey includes the core sources: more specifically, the journals that have the greatest influence in the analyzed field.
As expected from the previous findings, most of the journals placed in Zone 1 are also listed in the top of the most relevant sources with respect to the number of published manuscripts: IEEE Access, Sustainable Cities and Society, Sustainability, Future Generation Computer Systems-The International Journal of E-science, IEEE Communications Magazine, IEEE Internet of Things Journal, Sensors, Applied Sciences-Basel, Big Data Research, Big Data Science and Analytics for Smart Sustainable Urbanism: Unprecedented Paradigmatic Shifts and Practical Advancements, Cities, and Energies.
Figure 8 represents a visual illustration of the journals’ impact based on the H-index, an indicator that measures both the sources’ productivity and impact. The H-index represents a correlation between the number of citations and the number of articles published by a scientist. This indicator specifies whether the author has published H articles with at least H citations each [74].
The journals that recorded less than a value of three for the examined indicator were excluded from the ranking. Thus, the journals Sustainability and Sustainable Cities and Society hold the first two positions in the hierarchy with a value of nine recorded for H-index (at least nine articles with nine citations each).
Compared to the other two previously presented tops, the journal IEEE Access fell from first place to the third one (H = 8).
The following hierarchy remained unchanged: Future Generation Computer Systems the International Journal of Science (H = 6), IEEE Communications Magazine and IEEE Internet of Things Journal (both with H = 5), Applied Sciences Basel and Sensors (H = 4), and Big Data Research (H = 3).
This time, the journal Smart Cities appears in the top 10, with three articles with at least three citations each.
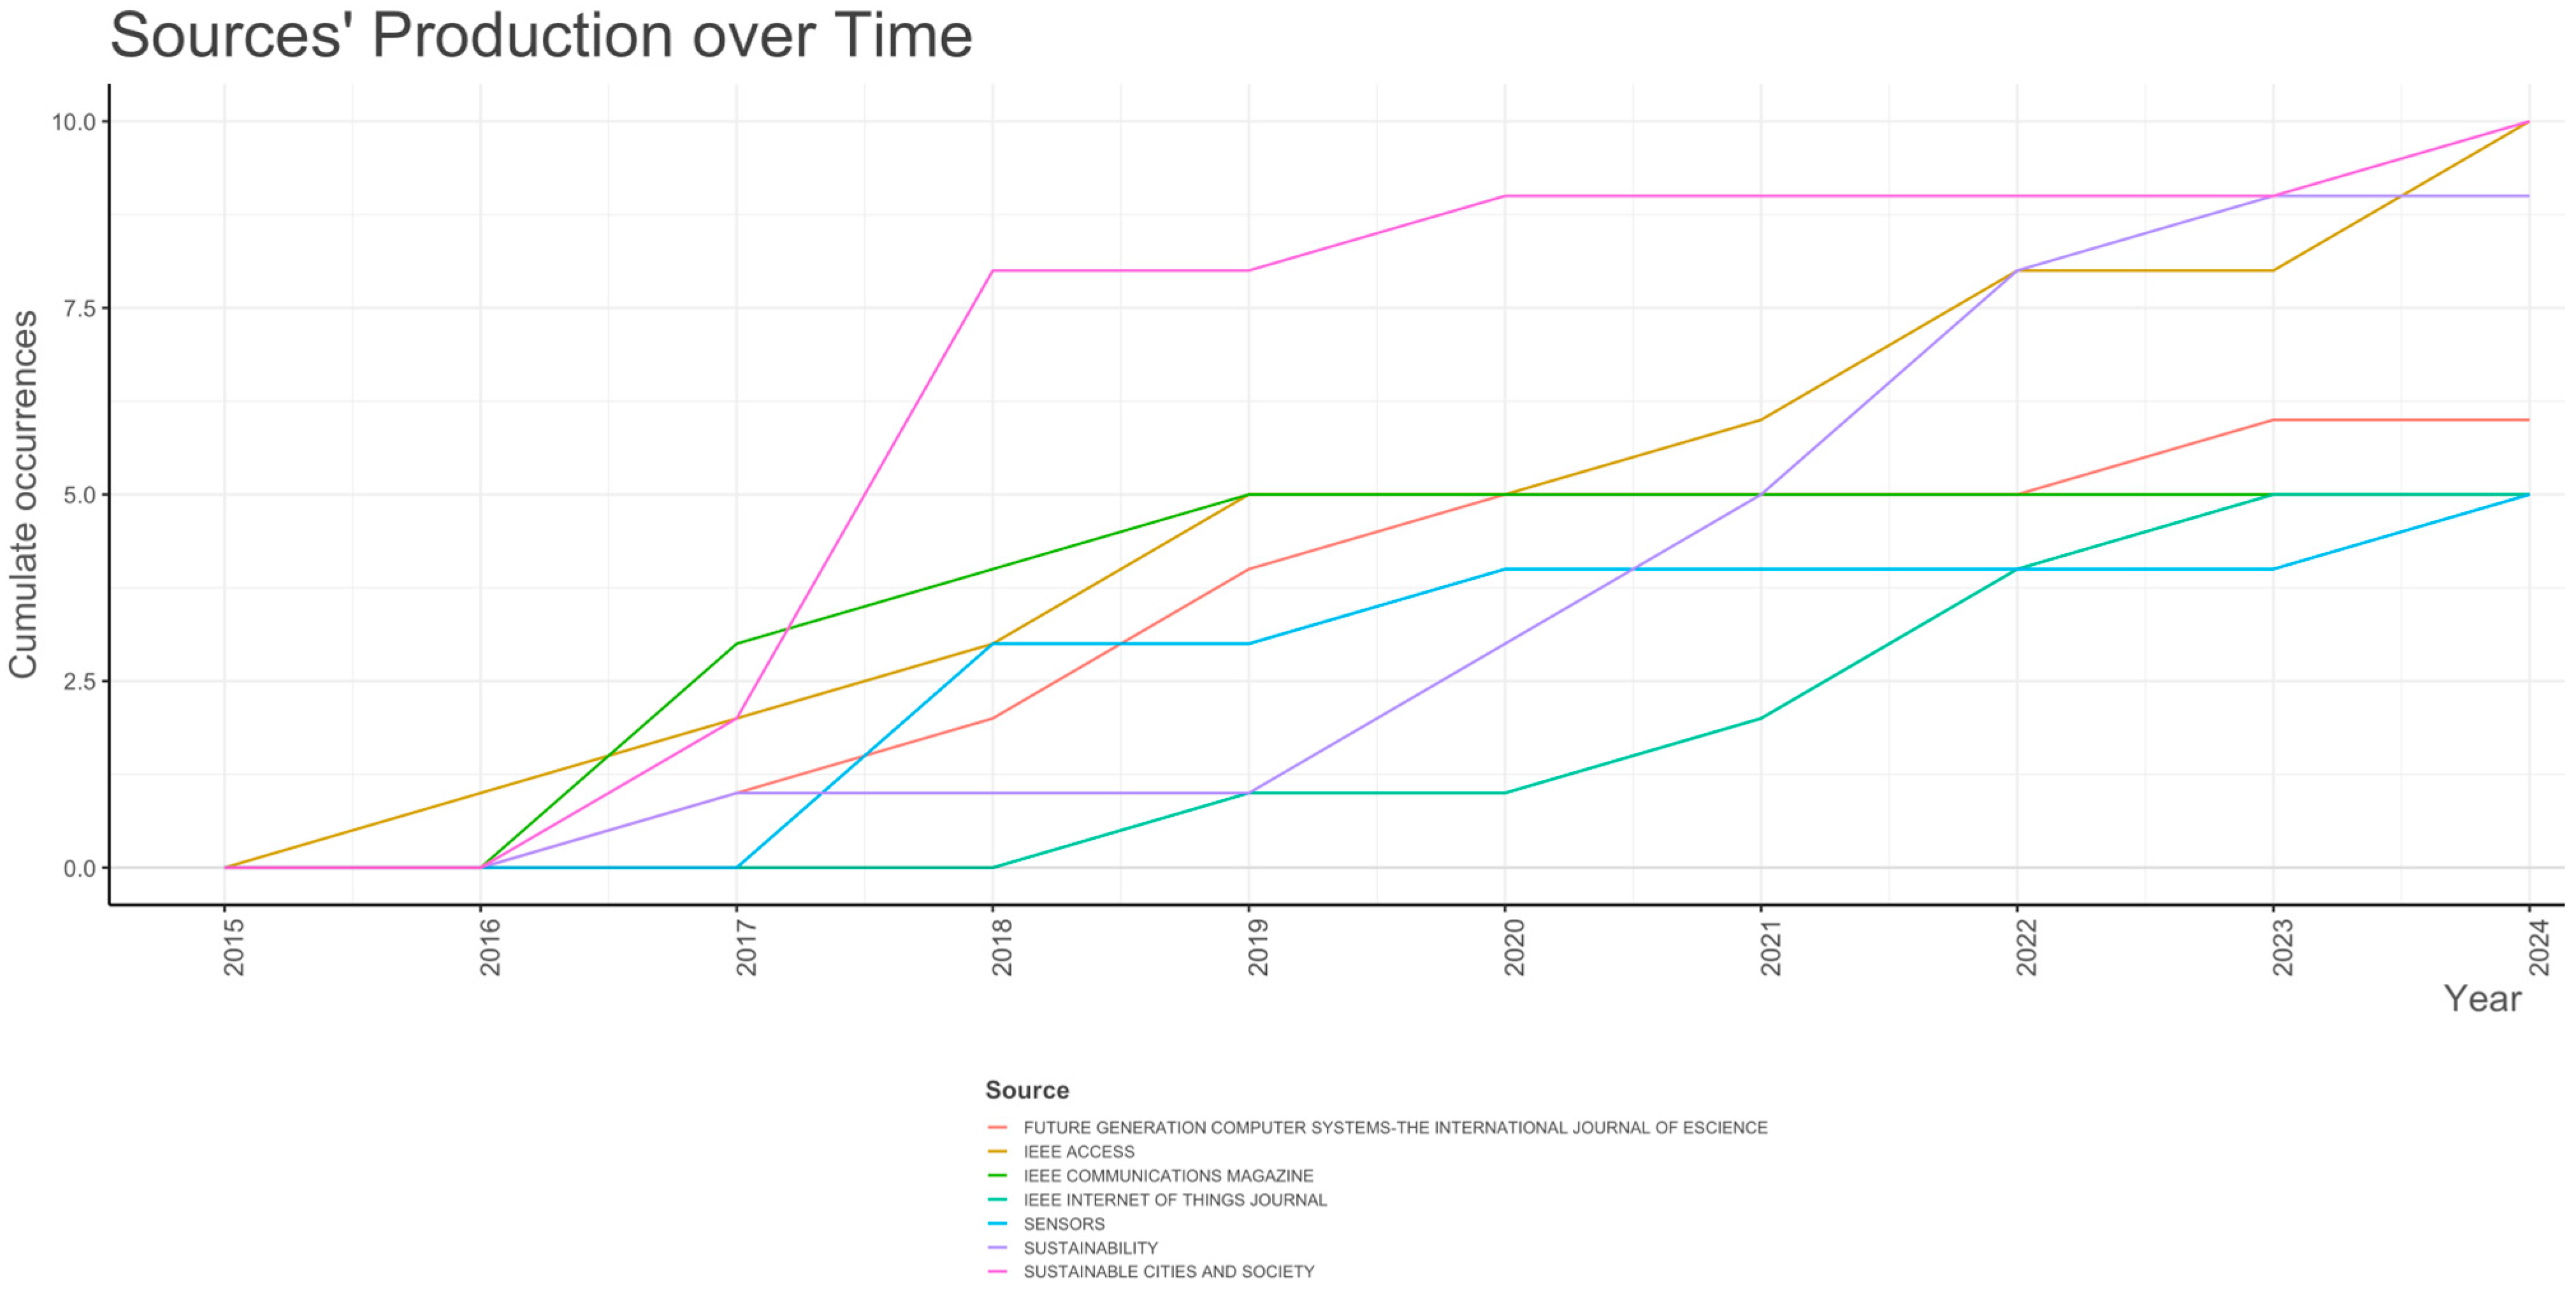
Figure 9 captures the journals’ growth based on the number of published articles over time. The X-axis includes the timestamp covering the years 2015–2024, while the Y-axis incorporates the number of published articles by each journal.
The journals that experienced the highest growth are noticed in the below graph: Future Generation Computer Systems the International Journal of Science (orange), IEEE Access (yellow), IEEE Communications Magazine (light green), IEEE Internet of Things Journal (dark green), Sensors (blue), Sustainability (purple), and Sustainable Cities and Society (pink).
It becomes visible at this point that most of the journals demonstrated high publication output before 2021, except Sustainability and IEEE Internet of Things Journal, which showed significant growth after 2020.

3.3. Authors

This section is dedicated to authors, focusing on uncovering insights about their productivity, collaborations, affiliations, and countries.
The authors’ hierarchy according to their number of published papers in the domain of smart cities and urban planning through big data analytics is provided in Figure 10. The illustration included exclusively the scientists with at least four published papers in the field.
Generally, an increased number of published papers in a specific domain emphasizes the high importance and impact of the domain.
The most prolific authors with respect to the number of published manuscripts in this research field are Bibri SE and Khan M, each with six papers.
The subsequent three positions are occupied by Babar M, Han K, Mehmood R and Rathore MM, each with five articles, followed by the authors that recorded a number of three published papers (Das AK, Paul A, Yaqoob I).
Figure 11 captures the productivity of the top nine most involved authors over time, with respect to the number of published articles in the field of smart cities and urban planning through big data analytics.
The circles from the figure represent the papers that each author published in that specific year. The more articles the author had in that year, the larger the size of the circle.
The colour of the circle reflects the number of citations for a manuscript. The darker the colour of the circle, the higher the number of citations.
From the below illustration, some insights are revealed:
  • The highest number of citations were registered for the papers published between 2016 and 2018, by Rathore MM, Paul A, and Yaqoob I.
  • The most productive year in terms of published papers was 2017 (twelve articles), while at the opposite end, the year characterized by the lowest publication output is 2024 (one article).
  • The highest number of published articles reached by one of the authors listed in the hierarchy in a year is three (Yaqoob I in 2017, Bibri SE and Babar M in 2019, Memood R in 2022).
Figure 12 illustrates the authors’ productivity based on Lotka’s Law.
Lotka’s Law [75] was formulated by Alfred Lotka in 1926, and describes the productivity of the authors, proving that the number of scientists who publish a single article is significantly higher than the number of authors who publish multiple manuscripts, according to the below formula:
A n = A ( 1 ) n ^ 2
where n is the number of articles, A(n) represents the number of authors with n articles, and A(1) the number of authors with a single article.
The X-axis includes the number of papers (from one to six), while the Y-axis contains the percentage of authors who have written that specific number of articles.
It is noticed that over 80% of the authors have contributed to only one article, compared to the ones that contribute to more than three papers, which is almost zero.
According to Lotka’s Law, there is a central core of academics who contribute to the substantial proportion of discoveries in the field.
In Figure 13, there is the hierarchy of the authors’ local impact, with respect to H-index. According to the below illustration, Khan M, Han K, and Rathore MM are situated on the first three positions. Please refer to Figure 13 for complete list.
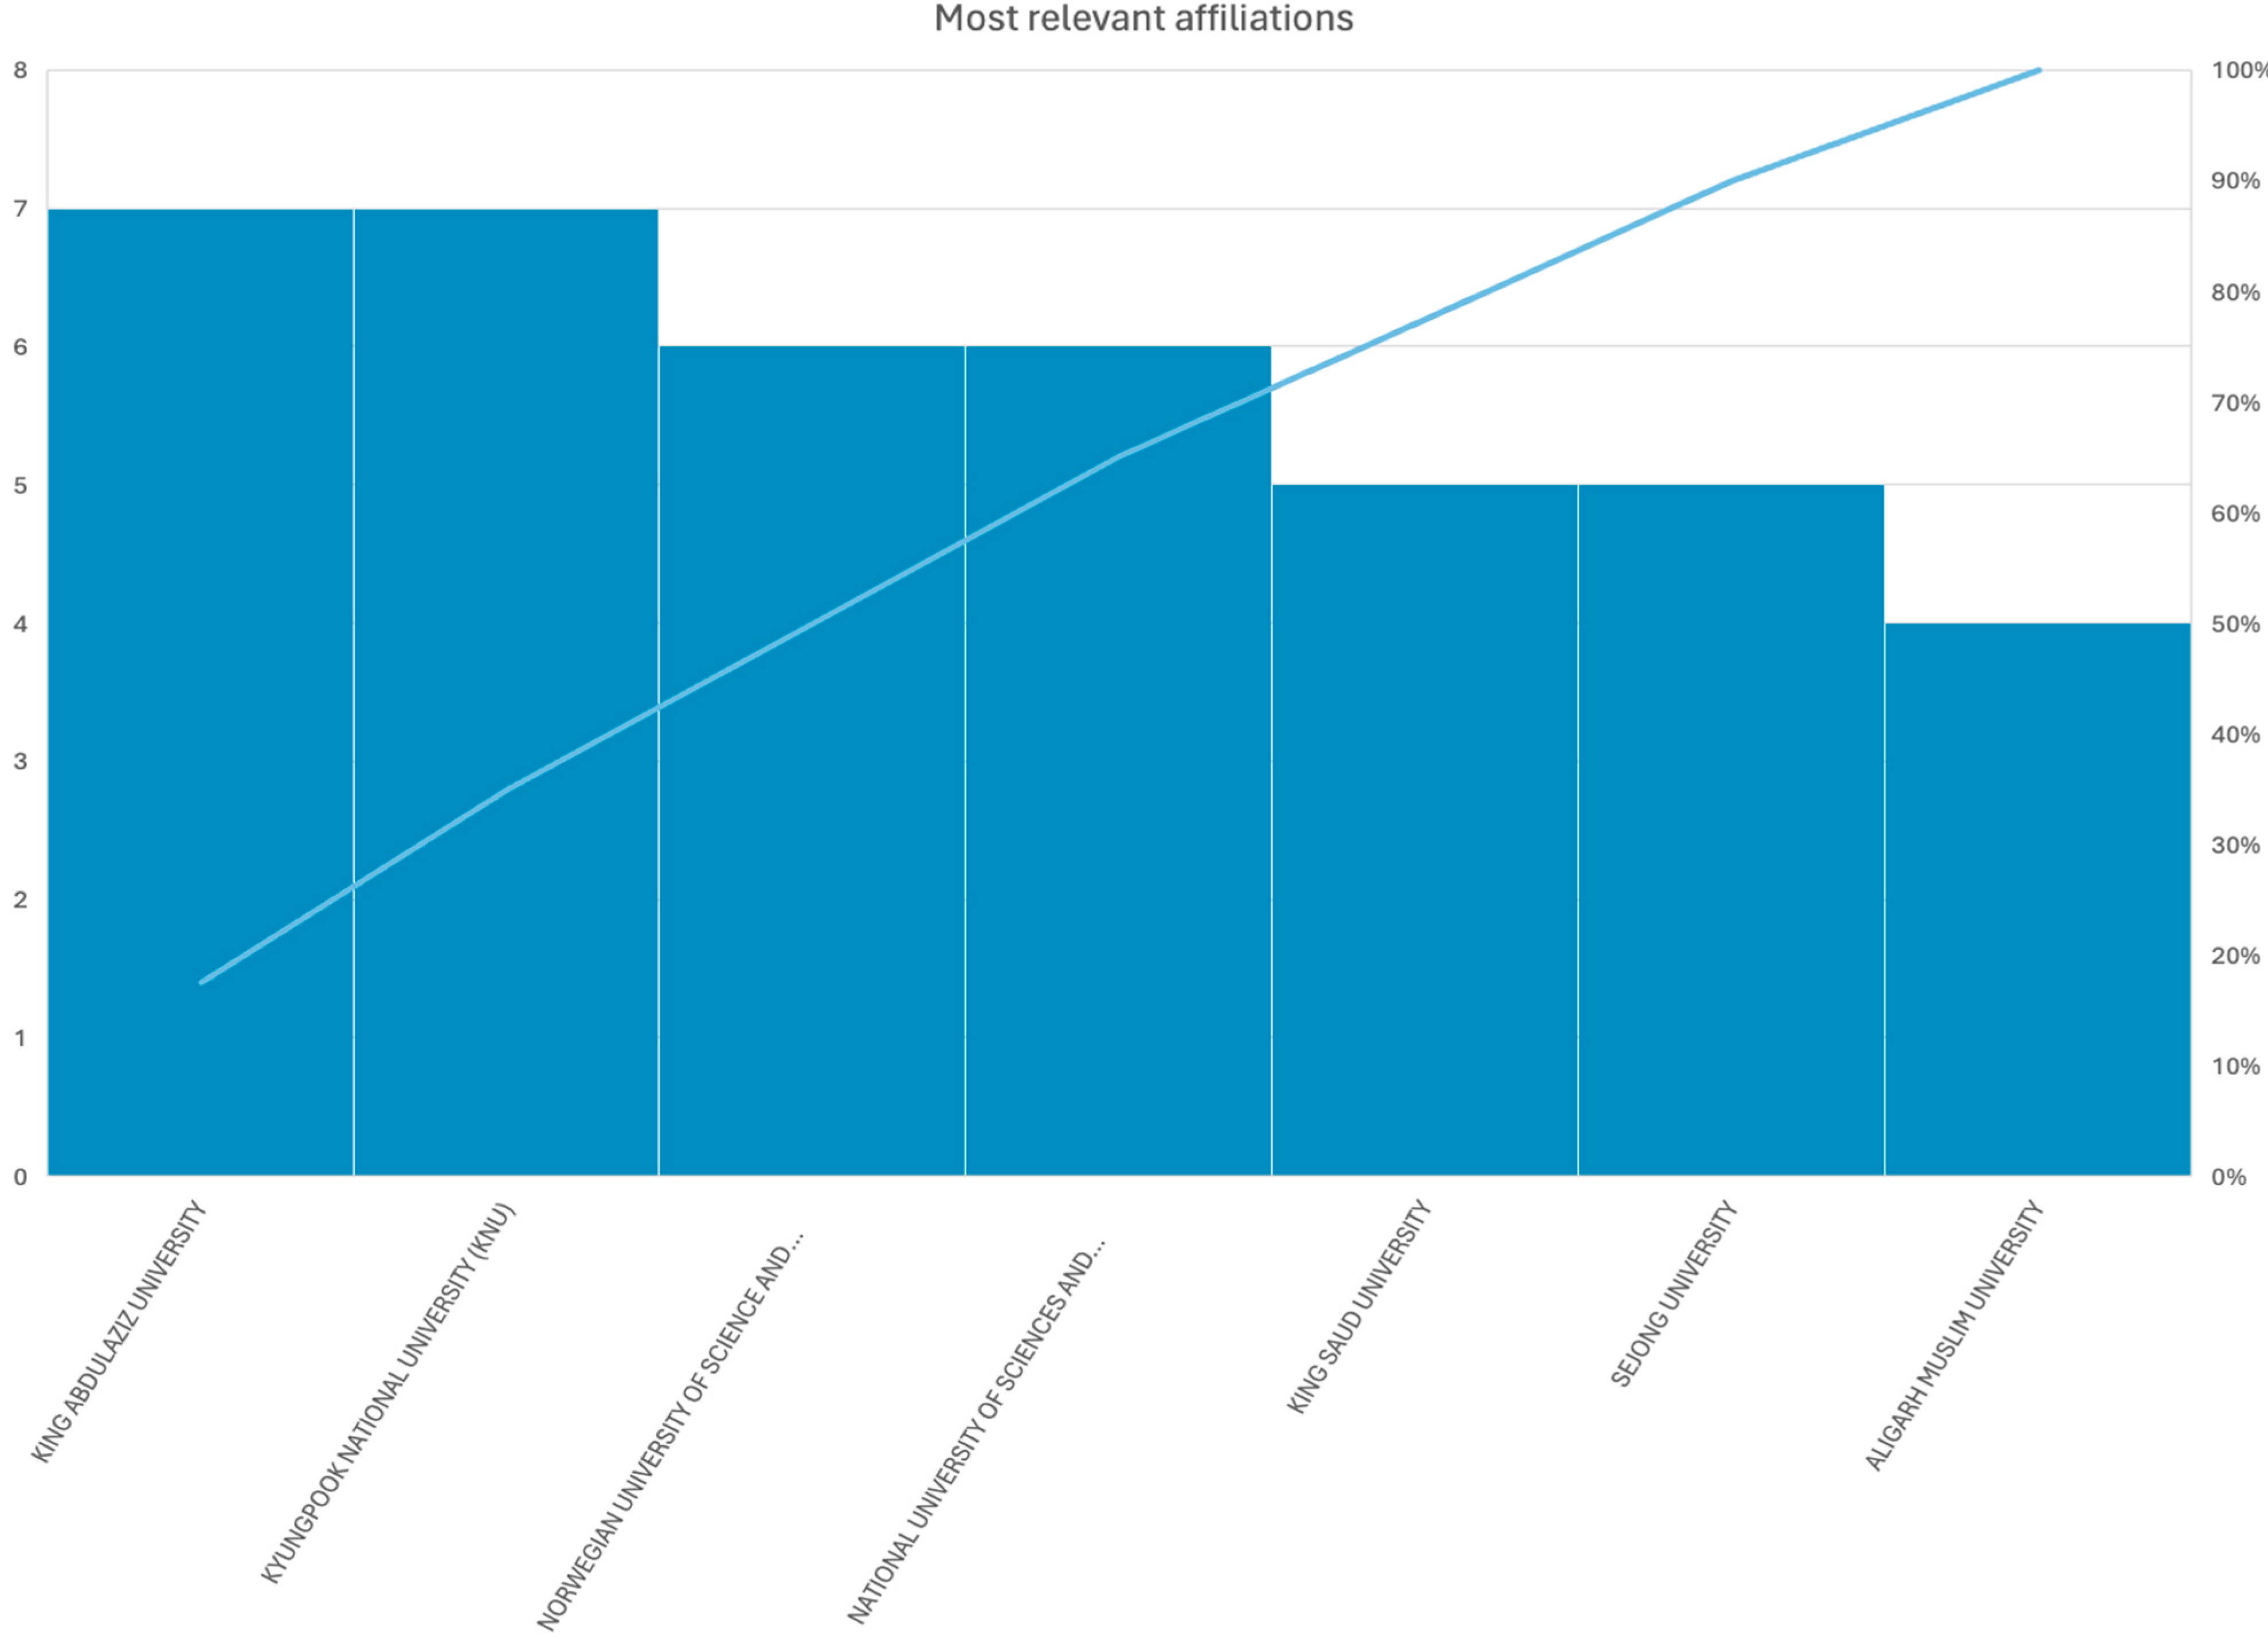
Figure 14 captures the top seven most relevant affiliations, with respect to the number of published articles around the topic of smart cities and urban planning through big data analytics. Only the universities with at least four published papers in this field were included in the ranking.
The highest number of published articles is observed in the case of two universities, each with seven manuscripts: King Abdulaziz University and Kyungpook National University.
Other affiliations that are placed at the top are listed here in order: Norwegian University of Science and Technology, National University of Sciences and Technology—Pakistan, King Saud University, Sejong University, and Aligarh Muslim University.
It is observed that universities from Asia and the Middle East dominate this hierarchy, while Europe has only two representatives: Norway and Portugal. This suggests a global interest in the development of urban environment and a significant focus on the well-being of citizens.
The most relevant corresponding authors’ countries with respect to the number of published articles are presented in Figure 15.
In the below visual illustration, two indicators are noticed: SCP (Single Country Publications) coloured in turquoise, which symbolizes the number of national publications, and MCP (Multiple Country Publications), coloured in red, which represents the number of international articles (the result of a collaboration between authors from distinct regions across the globe).
China and India share the first position in terms SCPs, both recording 14 published articles. From the MCP perspective, the country with the most articles written in collaboration with authors from other countries is China, followed by Korea and Pakistan.
The graphic highlights a pronounced tendency of collaboration between the countries of the world, which underlines the importance of adopting the most efficient strategies and implementing the best techniques that can address the current challenges from the urban environments. The importance of smart cities and the power of technology’s advancement into this area is reflected by the high number of published articles and the collaborations between academics from all over the world.
Figure 16 illustrates the top five countries’ production over time.
China had a constant number of publications each year. India and the United Kingdom seem to have followed China’s trend, but on a smaller scale in terms of total number of articles, while Pakistan and Saudi Arabia had a rapid increase in the number of publications in 2019 and 2022, respectively, with the trend stabilizing.
Figure 17 represents a visual illustration of the terrestrial globe, focusing on the scientific production based on countries:
  • Regions coloured in dark blue are marked by a high productivity.
  • Countries coloured in light blue have a moderate productivity.
  • Countries coloured in grey have no representative articles in the field of research.
According to the below representation, the leadership position belongs to China, followed at a significant difference by India and Saudi Arabia.
Although it is noticeable that the domain of smart cities and urban planning through big data analytics is of high interest for most of the countries around the world, imbalances can also be observed in areas such as Africa, South America and Eastern Europe.
Figure 18 lists the countries that recorded the highest number of citations in the domain of smart cities and urban planning, involving big data analytics.
The top four countries on the hierarchy are China (with 1891 citations), Korea (with 1512 citations), Malaysia (with 1425 citations), and India (with 620 citations). An explanation could be that Asia is the most populated continent, so an efficient management of the resources is imperative. Thus, these countries have shown a pronounced interest in this domain and have contributed significantly to the field of urban development.
Other relevant countries are listed here, in order: United Kingdom (583 citations), Norway (529 citations), Pakistan (524 citations), Germany (506 citations), Finland (496 citations), and the USA (469 citations).
The collaborations between countries are illustrated in Figure 19, in which regions with scientific activities in the field are coloured in blue. The more intense the activity, the darker the shade of blue.
The red lines drawn represent the collaborations between countries. The thicker the line, the higher the number of articles between the respective countries.
The centre of the graphic representation is China, which registered collaborations with several countries, including but not limited to India, Australia, the United Kingdom, Malaysia, Saudi Arabia, the USA, Pakistan, Canada, Sweden, and France. It is also observed that most of the countries involved in the field are open to collaborations.
A similar illustration was created in Figure 20 using another tool, namely VOSviewer. The same aspect is uncovered: China holds the leadership position in terms of worldwide partnerships with countries like Saudi Arabia, Pakistan, India, South Korea, the USA, France, etc.
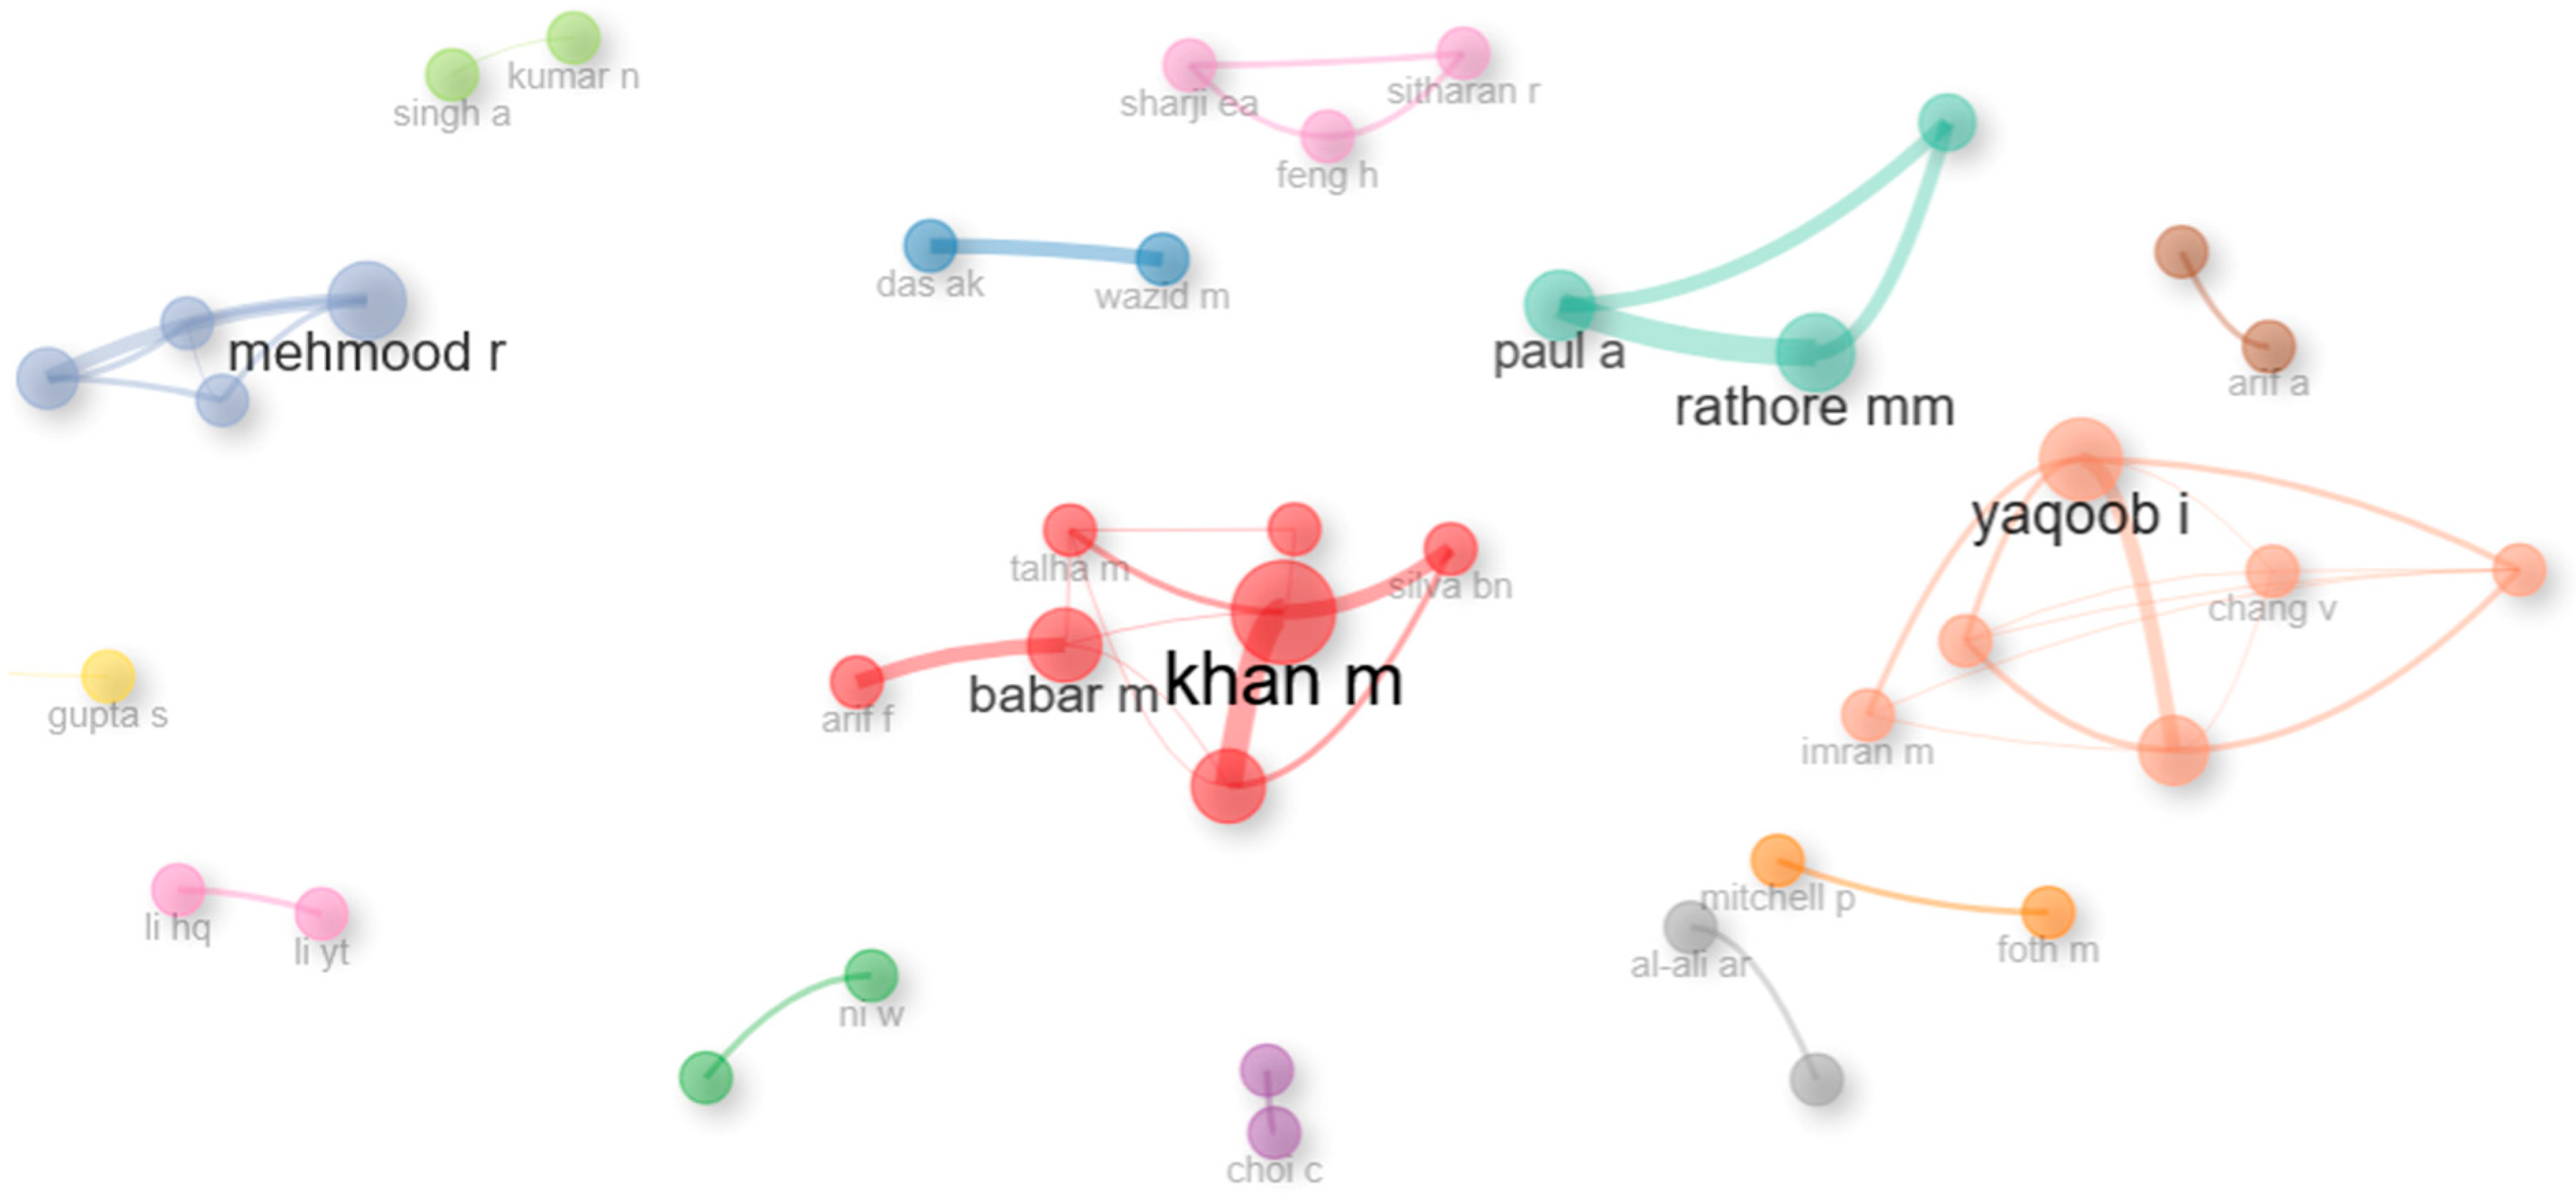
Figure 21 presents the top 43 authors’ collaboration network. As can be noticed, most of the collaborative clusters are composed of small groups of academics, with two exceptions (clusters coloured in red and orange).
The first cluster (red) has the following authors as main actors: Khan M, Babar M, Han K, Arif F, Silva BN, Talha M, and Farman H. They propose new solutions and architectures for integrating big data and IoT with smart cities [76,77].
The orange cluster includes the authors Yaqoob I, Hashem IAT, Ahmed E, Chang V, Gani A, and Imran M. Their main focus is proposing new architectures, as well as their integration in various domains [78].
The cluster formed by Paul A and Rathore MM is the one coloured in light green. Their objective is to explore how big data and IoT technologies can be integrated into different contexts of smart cities [79].
The blue cluster comprises Mehmood R, which is focused on designing secure communication in smart cities. For instance, one of the scientific contributions is oriented towards analyzing elementary aspects of software-defined wireless sensors’ security [80].
The integration of machine learning and artificial intelligence elements [81] is studied by Feng H, who is part of the purple cluster.
The rest of the clusters in the list are formed by collaborations of only two academics. Thus, they have a lower influence, and a smaller number of published articles compared to the rest of the clusters. They focus on integrating IoT, big data and machine learning into smart cities, but also on the security of transmitted data within a city’s infrastructure.
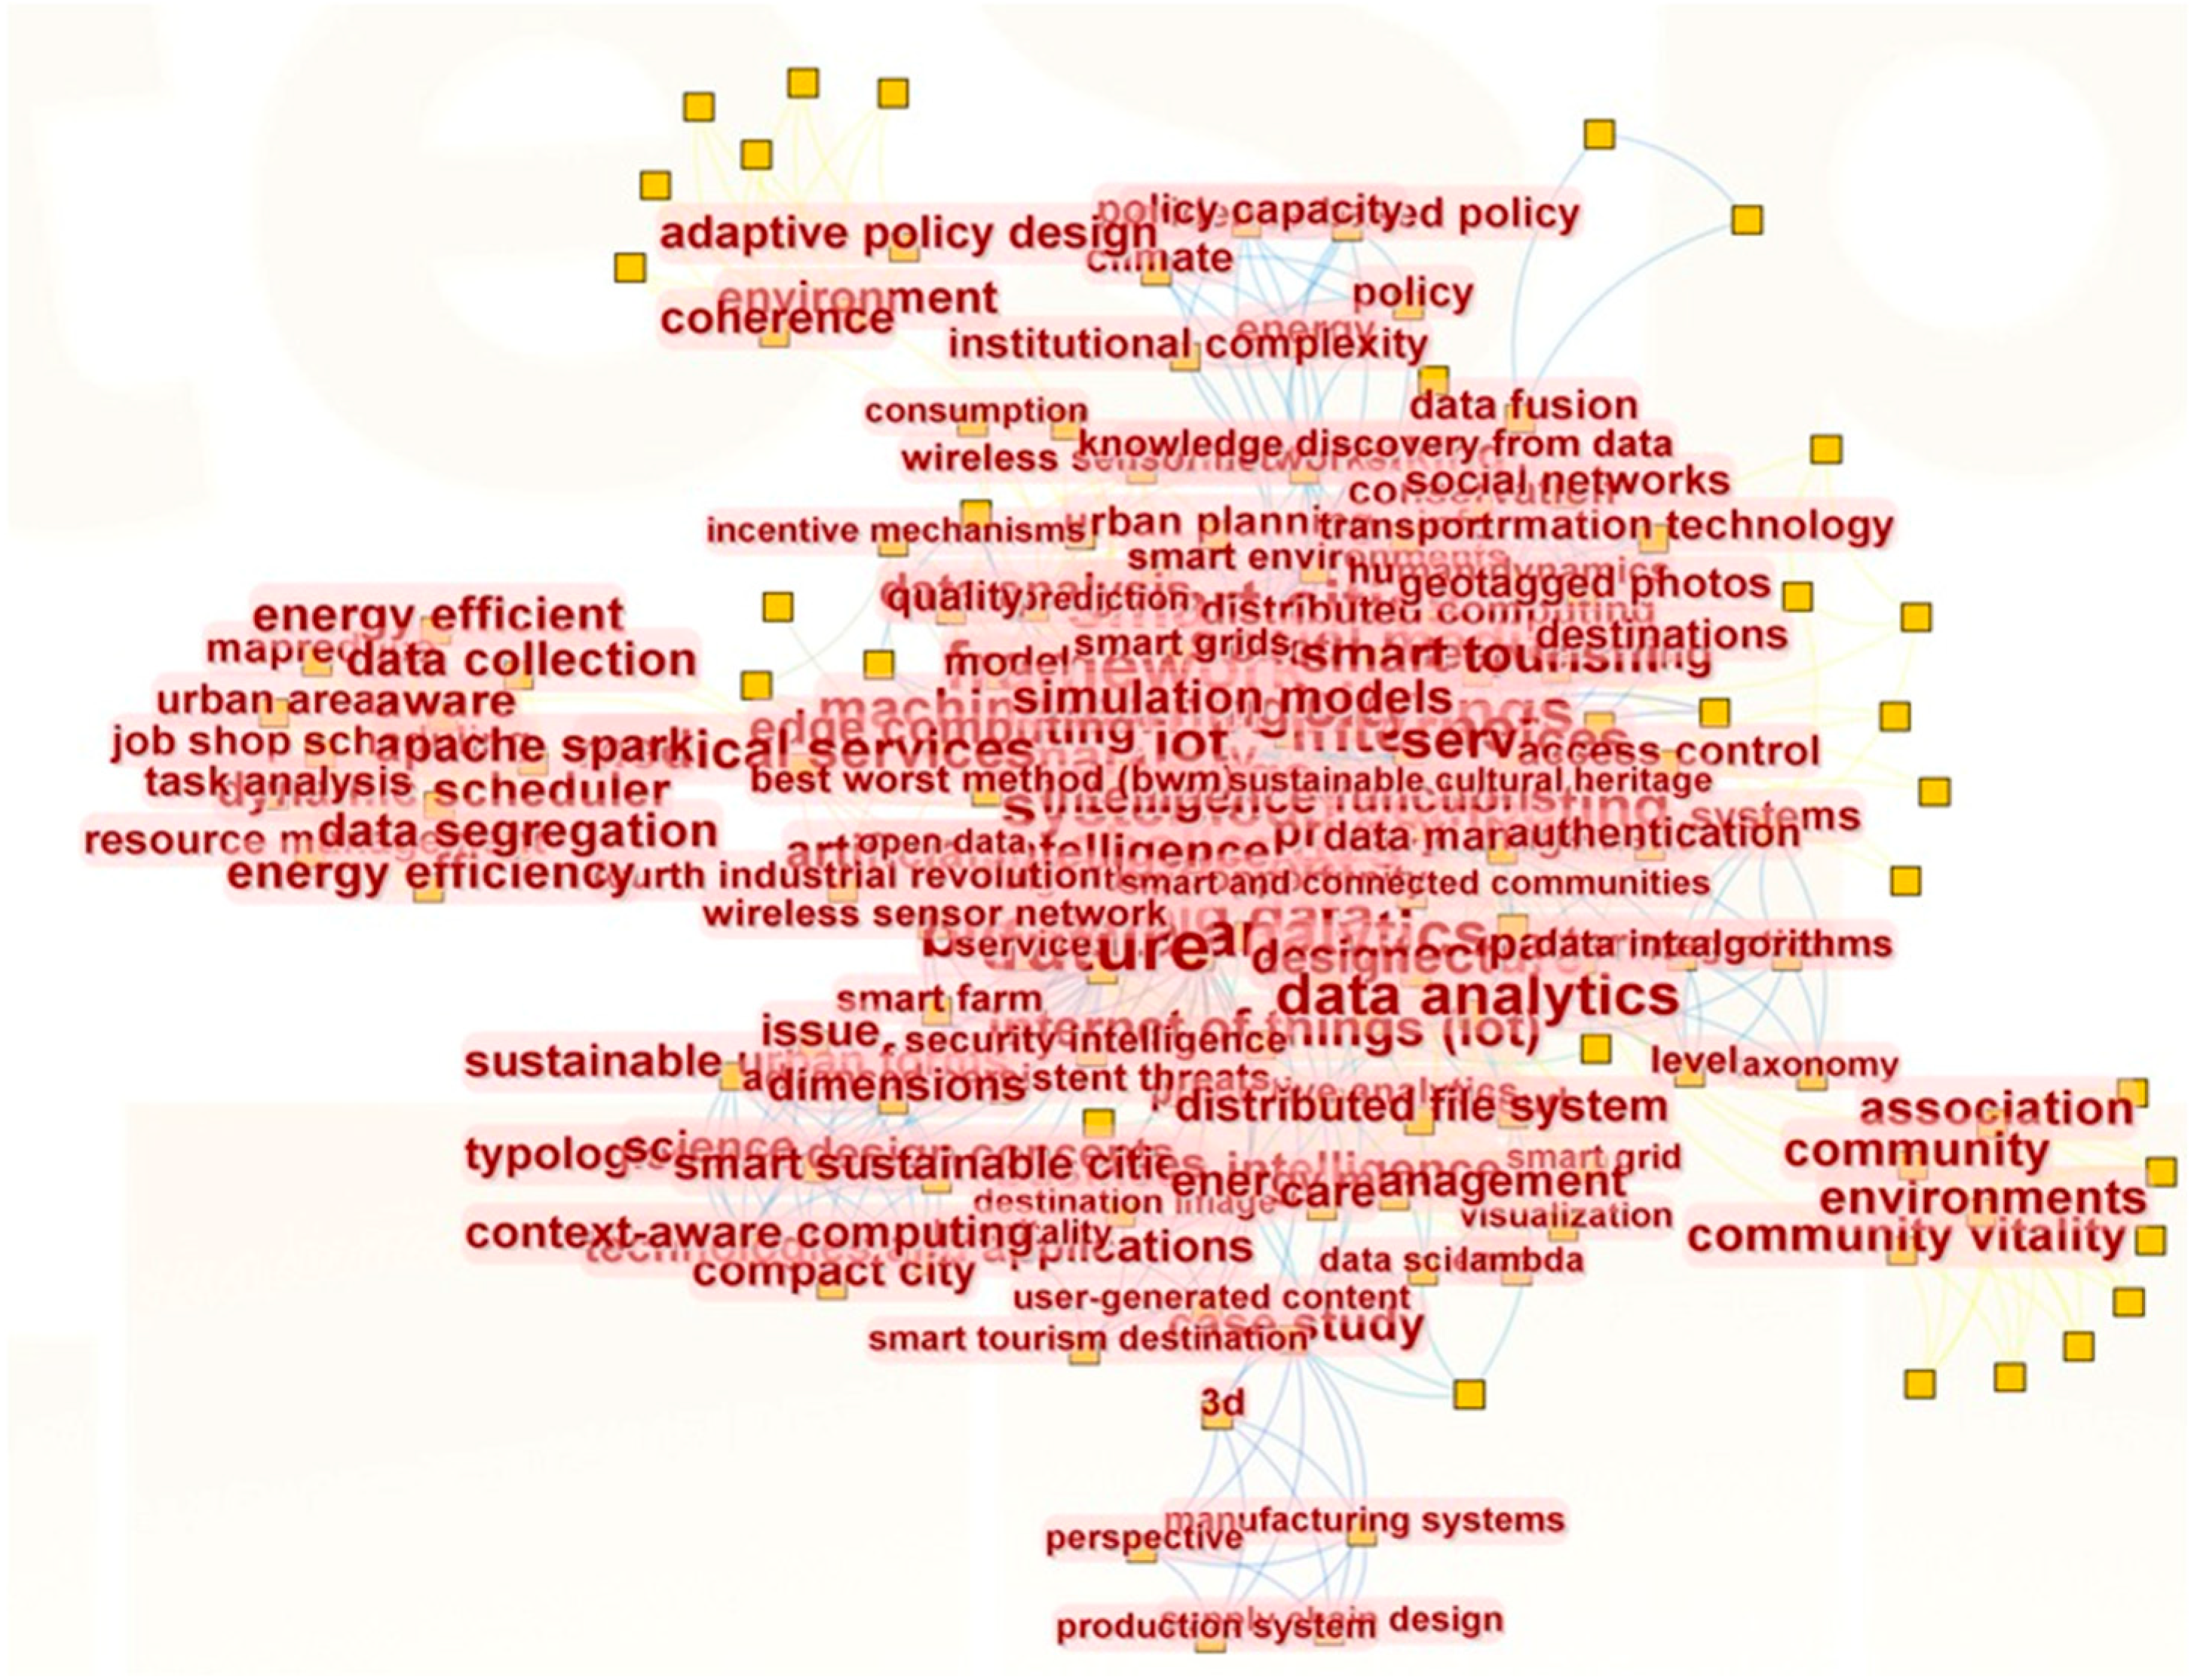
An analogous examination was performed using CiteSpace 6.3.R1 in Figure 22. The same key collaborations are noticed in the below illustration.

3.4. Analysis of the Literature

This section is oriented towards conducting an in-depth analysis of the papers included in the dataset, from three distinct perspectives.
In the first phase, an overview of the top 10 papers from the data collection set will be provided, with respect to the number of citations. Relevant indicators such as total citations (TC), total citations per year (TCY), and normalized total citations (NTC) will be discussed, together with general details for each article, such as the name of the first author, the number of academics involved in writing the paper, the contributors’ region of provenance, the publishing journal, year, etc.
The subsequent section will offer readers a summary for each of the top 10 articles listed in the hierarchy, with an emphasis on the main aspects: subject, purpose, methods used, data involved, main findings, etc.
Lastly, a detailed word analysis will be performed on the entire dataset, including thematic maps, co-occurrence networks, word-clouds, bigrams, trigrams, and many more. This section will offer a comprehensive vision of the addressed domain, reveal hidden insights, connections between elements, areas of high interest, topics that require additional attention, challenges, gaps, etc.

3.4.1. Top 10 Most Cited Papers—Overview

Table 2 presents the top 10 most global cited papers that address the topic of smart cities and urban planning through data analytics. A brief analysis of the table uncovers several insights about this field of research.
In terms of collaborations, there was noticeably an increased tendency of partnerships between scientists. Only one out of ten articles have a single author [82], while at the opposite end, the manuscript with the highest number of contributors is eight [83].
When discussing countries, for the selected papers listed in the hierarchy, one can identify 15 distinct regions involved, a fact that demonstrates the global nature of the topic. The existence of both national and international associations reflects the complexity of the domain, together with the importance of combining technological expertise and resources to advance the research, improve the existing techniques, and propose the most efficient strategies for each city.
Going further with the discussion, the attention should be now redirected to citations indicators. Three distinct indicators are visible in Table 2: total citations (TC—ranges between 316 and 590), total citations per year (TCY—ranges between 35.11 and 62), and normalized total citations (NTC—ranges 1.38 between and 4.51). The high values recorded by these indicators underline once again the significance of the domain within the academic community.
Further explanation is provided regarding NTC, since TC and TCY are more accessible and easier to comprehend. Normalized total citations (NTC) measures the real impact of an article and it is computed by the total number of citations of a work divided by the average citations in the same year of similar articles [34,68]. NTC is a relative measure.
The first position in the hierarchy is occupied by the paper written by Hashem et al. [83], with the following values recorded for the mentioned metrics: TC = 590, TCY = 59, and NTC = 1.52. The following two places belong to the manuscripts written by Sun et al. [84] (TC = 559, TCY = 55.90, NTC = 1.44), and Rathore et al. [85] (TC = 535, TCY = 53.50, NTC = 1.38).
Interested readers can find out more information in Table 2.
Table 2. Top 10 most global cited documents.
No.Paper (First Author, Year, Journal, Reference)Number of AuthorsRegionTotal Citations (TC)Total Citations per Year (TCY)Normalized TC (NTC)
1Hashem IAT, 2016, International Journal of Information Management, [83]8United Arab Emirates, United Kingdom,
Malaysia.
59059.001.52
2Sun YC, 2016, IEEE Access, [84]4China,
the USA.
55955.901.44
3Rathore MM, 2016, Computer Networks, [85]4Pakistan, Canada.53553.501.38
4Marjani M, 2017, IEEE Access, [86]7Malaysia.51457.114.51
5Porambage P, 2018, IEEE Communications Surveys and Tutorials, [87]5United Kingdom,
Finland,
Ireland.
49662.003.84
6Huang CJ, 2018, Sensors, [88]2China,
Taiwan.
46958.633.63
7Al Nuaimi E, 2015, Journal of Internet Services and Applications, [89]4United Arab Emirates. 44240.182.85
8Mehmood Y, 2017, IEEE Communications Magazines, [90]6Pakistan,
Qatar,
Morocco.
40044.443.51
9Bibri SE, 2018, Sustainable Cities and Society, [82]1Norway.39749.633.08
10Ahmed E, 2017, Computer Networks, [91]7Malaysia,
France,
Sweden.
31635.112.77

3.4.2. Top 10 Most Cited Papers—Review

Table 3 presents some general details related to each of the manuscripts included in the data collection set. In the following pages, the articles will be briefly reviewed, focusing on their key results.
The leadership position in the hierarchy, shaped according to the number of citations, belongs to the article written by Hashem et al. [83], in which the role of big data and Internet of Things (IoT) technologies in the development of smart cities is analyzed. While IoT facilitates the connection of devices to smart networks in such a way that the data transmission to analysis platforms is performed in real time, big data allows for the collection and examination of huge amounts of data transmitted by sensors. The applicability of big data within smart cities is essential and diversified. In the energy field, it allows for real-time monitoring of consumption. Moreover, in the field of public health, big data technology can be used for personalized treatment or even diagnosing patients, while in transportation it has a significant contribution in streamlining traffic and reducing fuel consumption. The authors mention the existence of some challenges (e.g., the confidentiality and security of stored data) but also highlight the limited capabilities of artificial intelligence algorithms for processing high volumes of data. In the final part of the paper, it is presented that several cities (Stockholm, Helsinki, Copenhagen) have successfully implemented smart solutions for traffic and waste management.
The second work on the list belongs to Sun et al. [84] and is oriented towards smart cities, but with a particular emphasis on small communities and historical cities. Differently to large metropolises, historical cities are preserving traditions and conserving the sites they have. An example discussed in the manuscript is the implementation of the TreSight system in a city from Italy (Trento). This is a platform that helps tourists have personalized recommendations for museums, local attractions, restaurants, and hotels. The system they envision consists of four distinct layers (the data collection layer, the interconnection layer, the analysis layer, and the service layer, which offers the user solutions for their requirements). Finally, some challenges faced by these systems are raised. As expected, confidentiality and the risk of cyber-attacks are mentioned, as well as the heavy interpretation of the data. The authors also discuss the issue of protecting traditional culture, which requires special methods of digitalization.
The third article written by Rathore et al. [85] proposes a new architecture for collecting and analyzing large datasets, which involves a new step compared to other approaches found in the literature. Data pre-processing, the extra phase mentioned, involves filtering, as well as data comprehension for optimizing the volume and quality of the data, thus reducing its volume. The scientists analyzed an agricultural scenario in which, with sensors’ help, data related to temperature, humidity, and light was collected, so as to detect various problems that might occur to the crop (drought, floods, etc.). By utilizing this approach, it was demonstrated that the system has a low latency, being very efficient in terms of time. Another aspect raised within the article was the importance of both online and offline analysis. Even though it is known that online analysis (in real time) is essential, it also highlighted the offline analysis, which can assist in better comprehending long-term patterns.
Marjani et al. in [86] conducted a literature review in the domain of big data and IoT, and proposed a new architecture for the analysis of large-scale data, which aims to provide adequate support for decision-making in complex business contexts. An examination of some use cases from different domains (e.g., agriculture, transportation, smart supply chain, smart grid, etc.) is also performed. Shortcomings and limitations of this technology together with opportunities such as confidentiality, processing of large datasets, and system integration are discussed.
Porambage et al. [87] focus on how MEC (Multi-Access Edge Computing) can assist in transmitting faster large volumes of data. MEC is defined as a distributed computing model that provides cloud functionalities at the edge of the network, close to user devices. This technology has several advantages, such as low latency time and bandwidth efficiency. This article reviews MEC architectures that can be integrated with 5G networks, Software Defined Networking (SDN), and Network Function Virtualization (NFV). This technology can be used in different branches of a smart city, such as smart energy networks, intelligent transportation systems, medical monitoring, and smart manufacturing. Finally, shortcomings and further research directions such as data privacy and computational resource management are highlighted.
Huang and Kuo [88] are focused on air quality. Due to the evolution and modernization of cities, air pollution has become a serious concern, and it is affecting the residents’ quality of life. The authors considered particles with a diameter of less than 2.5 µm, these particles being coal-fired power generation, smoke, or dusts. They propose an artificial intelligence model based on CNN (Convolutional Neural Networks) and LSTM (Long Short-Term Memory) networks to improve the prediction of PM2.5 in urban areas. The results show that the model based on CNN-LSTM significantly exceeds the accuracy of existing models in the literature. Thus, the authors conclude that the use of deep learning in the context of smart cities can be a promising research solution.
Nuaimi et al. [89] wrote a manuscript about big data, and its use in practical and theoretical cases. In the first part, five characteristics of big data are presented: volume (the size of the data), velocity (the speed through which data is generated, stored, analyzed and pre-processed), variety (the difference between the types of data received), variability (the errors or mistakes that are present in the data), and added value (the advantages that big data can bring to businesses). Taking these aspects into consideration, the authors examine the implementations of big data into various applications such as intelligent transportation, public utilities, and medicine.
Mehmood et al. [90] discuss how IoT is integrated into the development of smart cities. IoT incorporates the connectivity of various devices combined with sensors, facilitating a wide range of functionalities. The paper focuses on the analysis of different platforms used for the implementation of smart cities, such as Fiware, Ocean, Contiki, but also on the analysis of five case studies. The cities specified in the analysis are Busan (South Korea), Santander (Spain), Milton Keynes (United Kingdom), and Chicago (United States of America).
Although most of the scientists in the academic literature discuss the economic side of the IoT implementation, the study conducted by Bibri [82] is oriented towards the environmental protection context and objectively analyzes the shortcomings, challenges, and opportunities that big data and IoT technologies demonstrate.
Ahmed et al. [91] underline the important role that IoT and big data technologies have in the implementation of smart cities. This article presents the architectures used in the industry, as well as in other important fields (medicine, agriculture, etc.). In the second part of the manuscript, the associated challenges in this field and possible future research directives are discussed. The security of these systems is the biggest challenge encountered by the authors, followed by the processing of large volume of data.
Table 3. Brief summary of the content of top 10 most global cited documents.
No.Paper (First Author, Year, Journal, Reference)TitleDataPurpose and Methods Involved
1Hashem IAT, 2016, International Journal of Information Management, [83]The role of big data in smart cityAuthors did not use data; they explained the concepts in a theoretic manner.Providing an overview of existing work.
2Sun YC, 2016, IEEE Access, [84]Internet of Things and Big Data Analytics for Smart and Connected CommunitiesAuthors did not use data; they explained the concepts in a theoretic manner.Introducing a new concept to the scientific world that includes small towns or historic cities in the idea of a smart city.
3Rathore MM, 2016, Computer Networks, [85]Urban Planning and Building Smart Cities based on the Internet of Things using Big Data AnalyticsAuthors used real large size IoT generated datasets from various reliable resources.Introducing a new architecture for collecting and analyzing large datasets.
4Marjani M, 2017, IEEE Access, [86]Big IoT Data Analytics: Architecture, Opportunities, and Open Research ChallengesAuthors did not use data; they explained the concepts in a theoretic manner.Providing an overview of existing work.
5Porambage P, 2018, IEEE Communications Surveys and Tutorials, [87]Survey on Multi-Access Edge Computing for Internet of Things RealizationAuthors did not use data; they explained the concepts in a theoretic manner.Presenting how MEC (Multi-Access Edge Computing) can help in transmitting large volumes of data faster.
6Huang CJ, 2018, Sensors, [88]A Deep CNN-LSTM Model for Particulate Matter (PM2.5) Forecasting in Smart CitiesThe authors used a PM2.5 dataset of Beijing. They propose an artificial intelligence model based on CNN. (Convolutional Neural Networks) and LSTM (Long Short-Term Memory) networks to improve PM2.5 prediction.
7Al Nuaimi E, 2015, Journal of Internet Services and Applications, [89]Applications of big data to smart citiesAuthors did not use data; they explained the concepts in a theoretic manner.Presenting the concept of big data, as well as its use in practical and theoretical cases.
8Mehmood Y, 2017, IEEE Communications Magazines, [90]Internet-of-Things-Based Smart Cities: Recent Advances and ChallengesAuthors did not use data; they explained the concepts in a theoretic manner.Providing an insightful picture of how IoT integrates into the development of smart cities.
9Bibri SE, 2018, Sustainable Cities and Society, [82]The IoT for Smart Sustainable Cities of the Future:
An Analytical Framework for Sensor–Based Big Data
Applications for Environmental Sustainability
Authors did not use data; they explained the concepts in a theoretic manner.Providing an overview of the existing work.
10Ahmed E, 2017, Computer Networks, [91]The role of big data analytics in Internet of ThingsAuthors did not use data; they explained the concepts in a theoretic manner.Providing an overview of the existing work.

3.4.3. Word Analysis

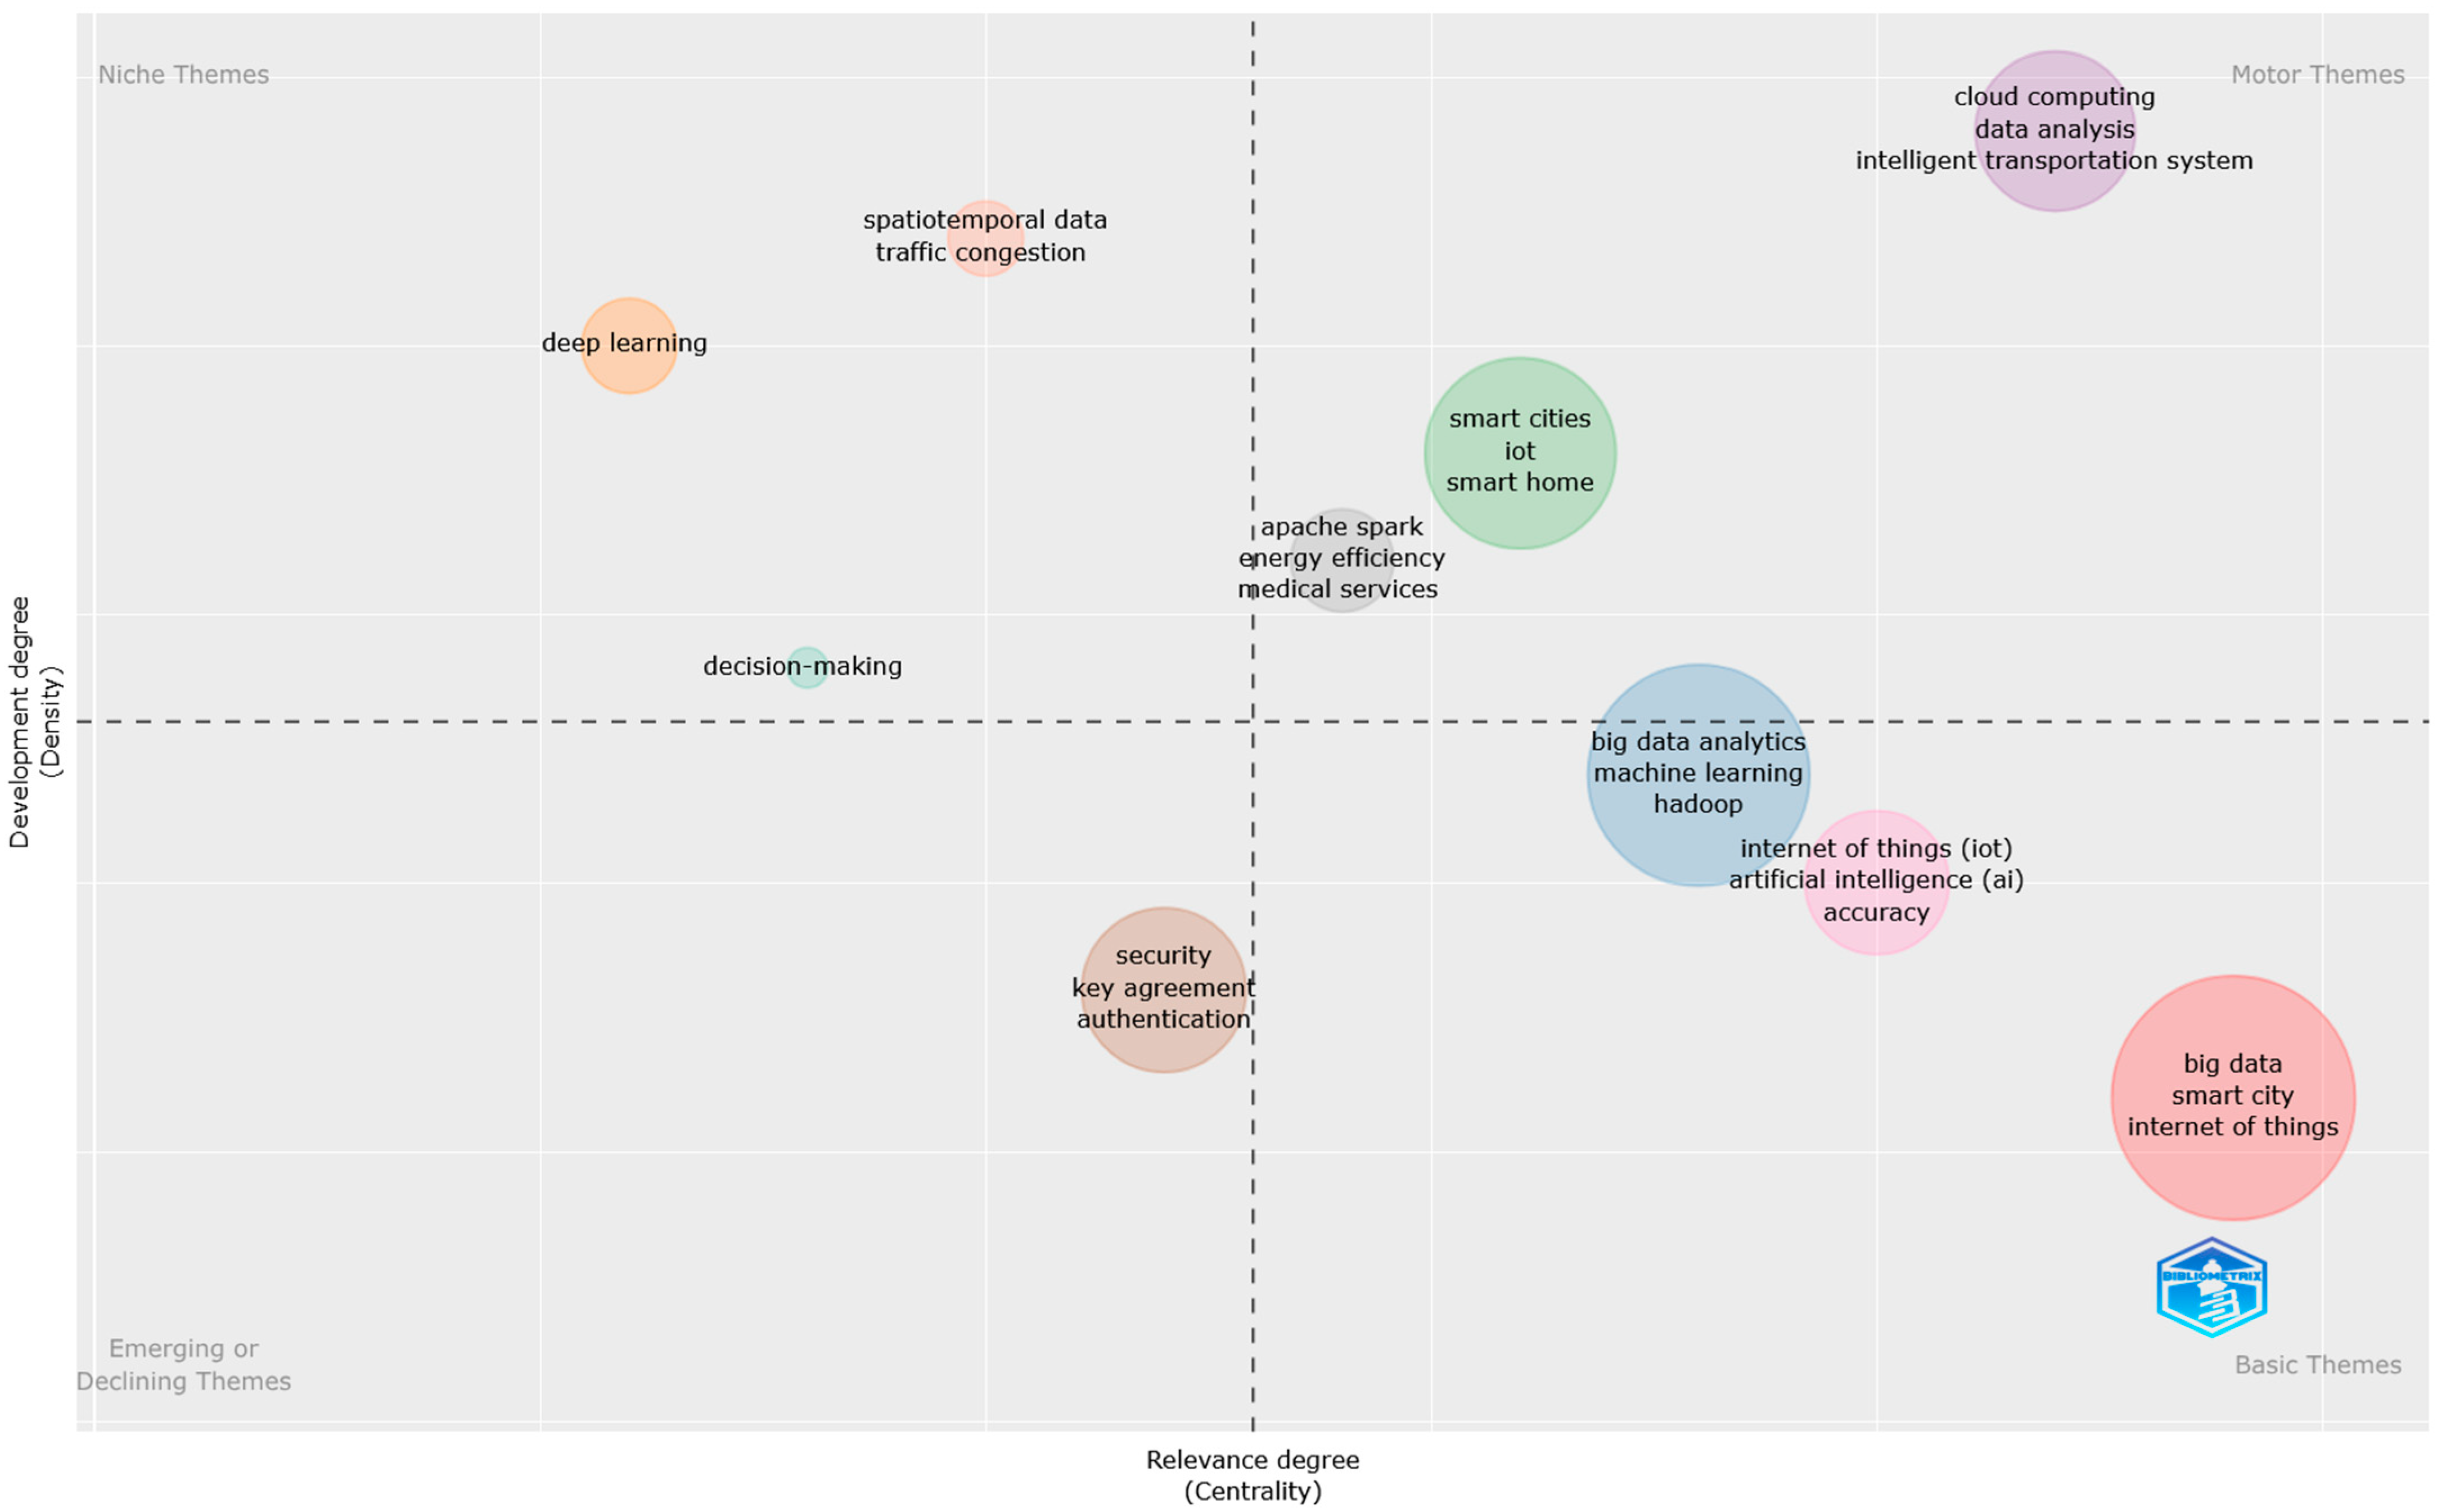
This section is dedicated to the analysis of the words. The intention is to better comprehend the domain of smart cities and urban planning through big data analytics, identify the emerging topics with the greatest influence, hidden trends, challenging aspects, and many more. The study will include various investigations: authors’ keywords, keywords plus, bigrams, and trigrams (in both abstracts and titles), as well as co-occurrence networks and thematic maps.
The most frequent words in keywords plus are highlighted in Figure 23.
The highest number of occurrences is noticed in the case of “internet” (34 occurrences). This suggests that the internet is perceived as the fundamental structure in smart cities. The following two positions in the hierarchy are occupied by “framework” (24 occurrences) and “challenges” (20 occurrences), indicating that smart city technology is in its developmental phase, with new frameworks being proposed, but at the same time it implies certain disadvantages during the implementation process. Other top words refer to the technologies used (“big data” and “things” both having 16 occurrences), but also to basic terms in the field (“city” with 19 occurrences, “cities” with 14 occurrences, “system” with 13 occurrences).
Furthermore, the word “future” has 14 occurrences in the hierarchy, underlining the academic community’s interest regarding the impact of smart city solutions on urban environments in the near future.
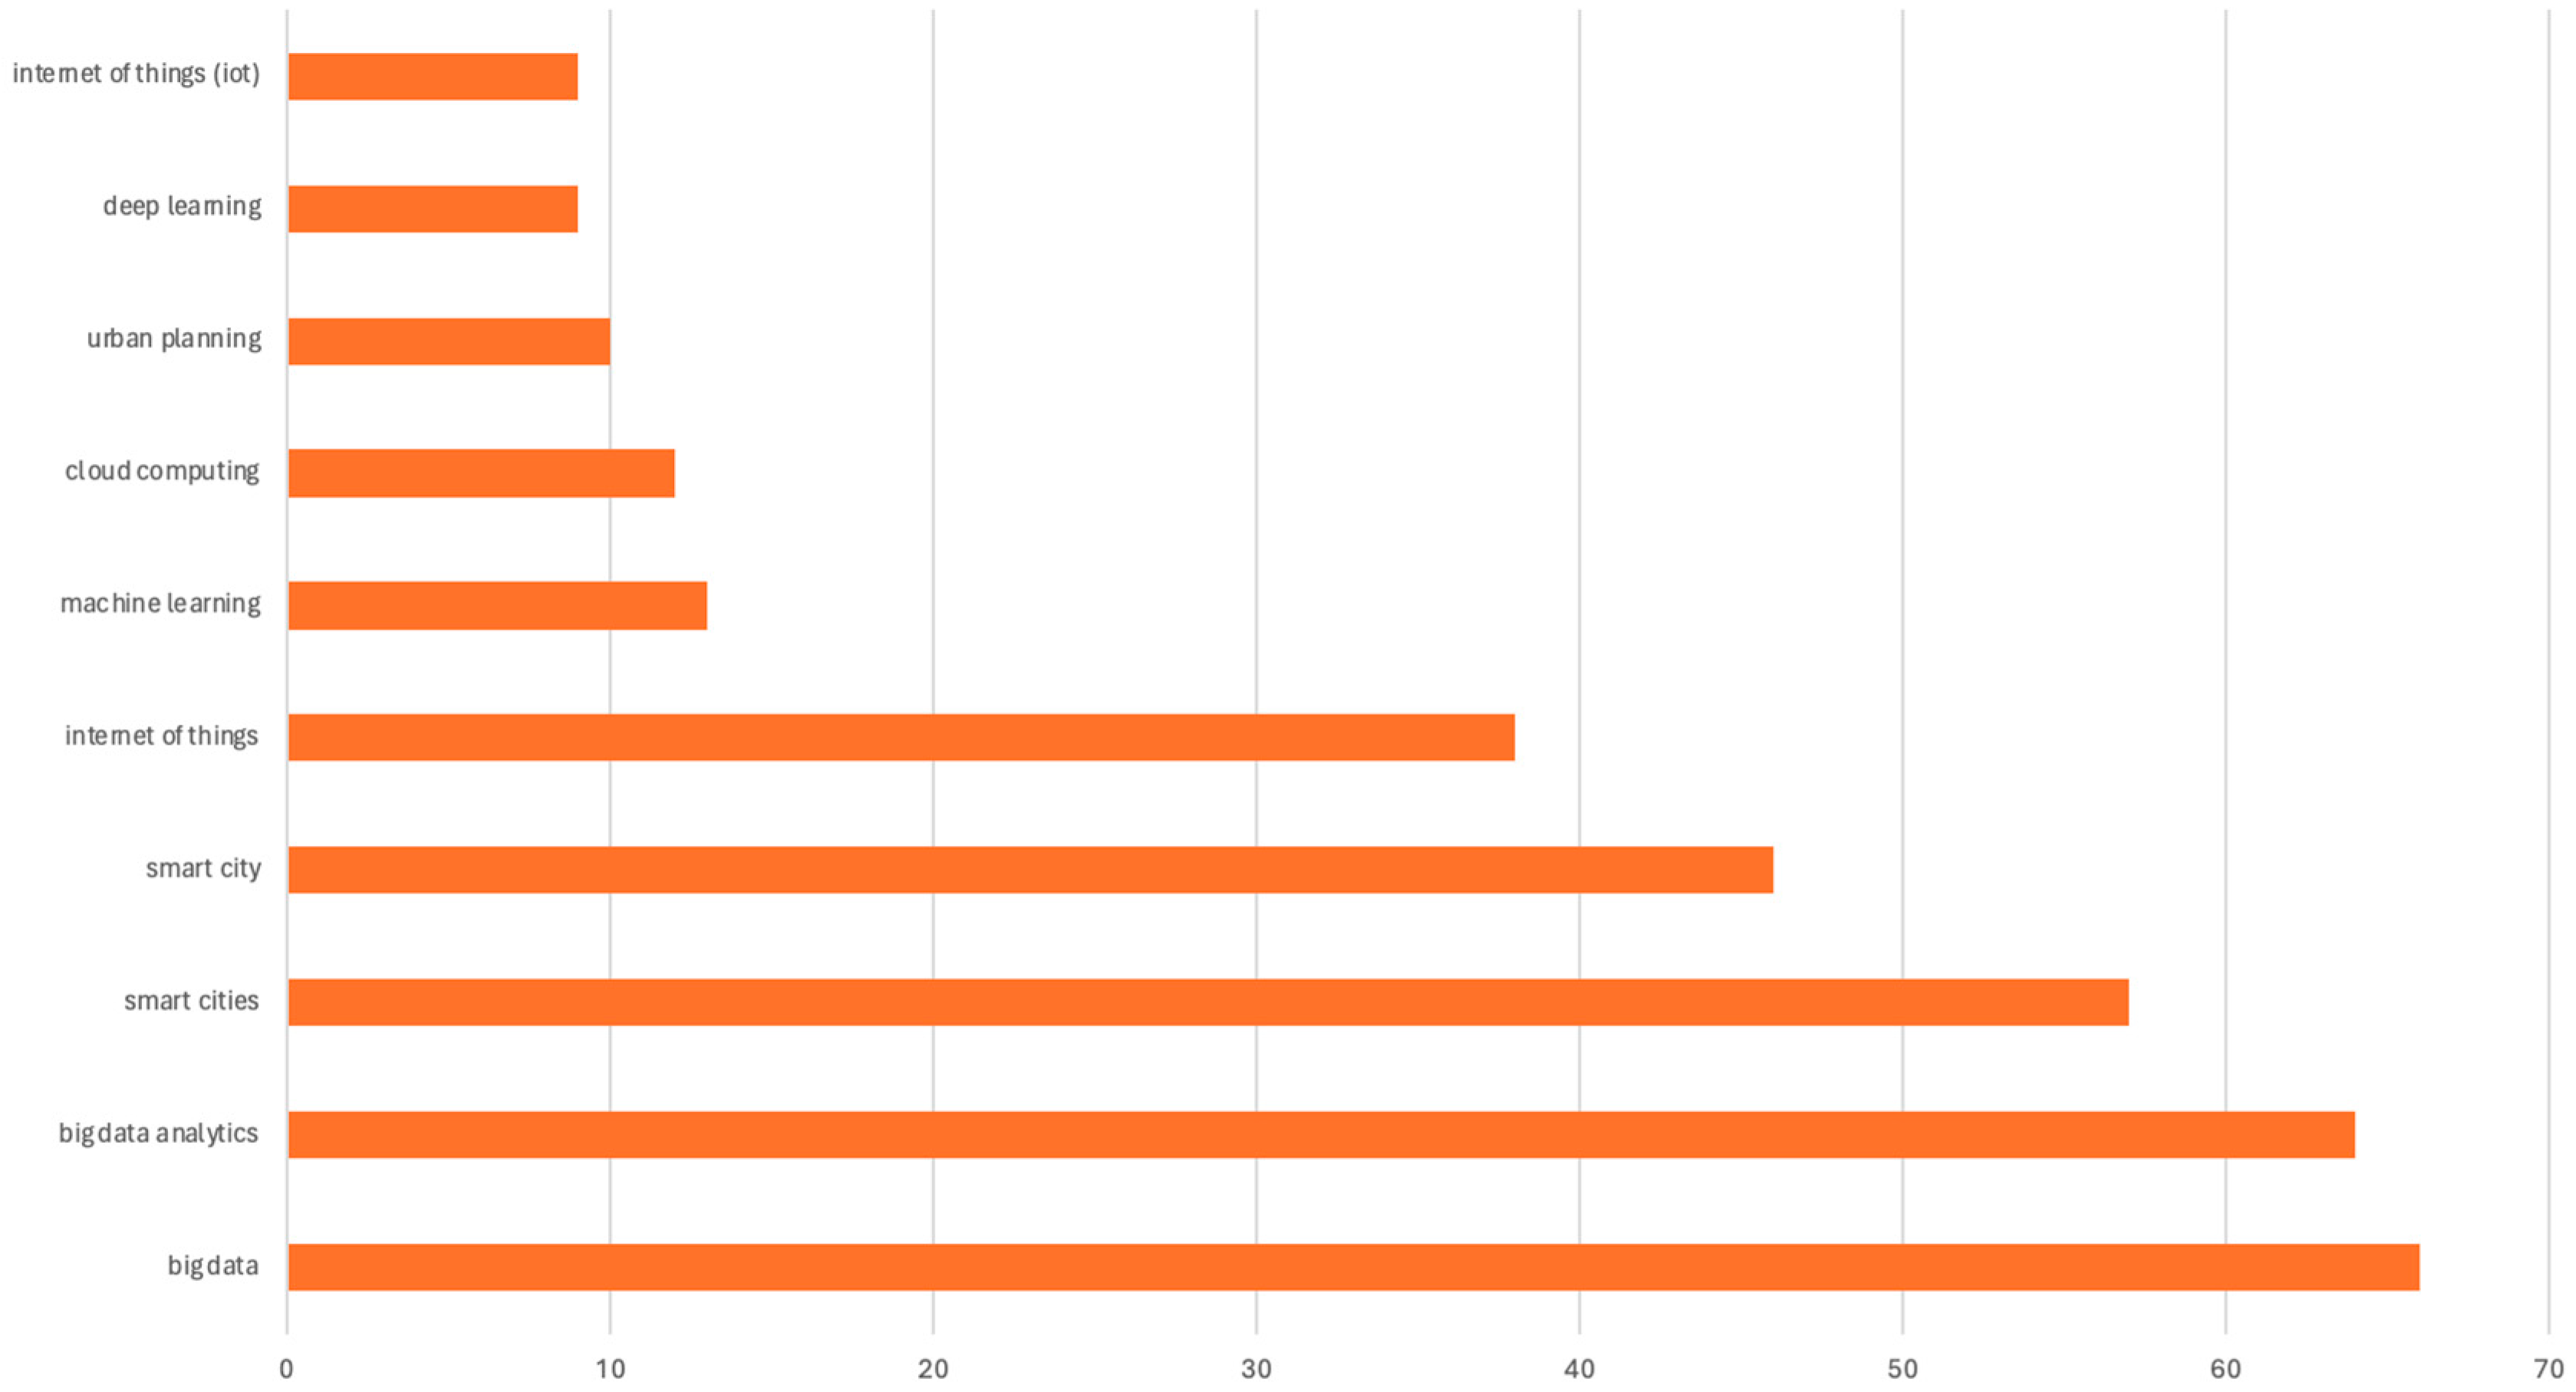
Figure 24 presents the top 10 most frequent words in authors’ keywords. The terms observed on the first two positions are “big data” (66 occurrences) and “big data analytics” (64 occurrences) highlighting the importance given by the authors for analyzing and processing large volumes of data.
In addition to the classic terms in the field, such as “smart cities” (57 occurrences), “smart city” (46 occurrences), and “urban planning” (10 occurrences), one can notice the appearance of more technical concepts and even algorithms, such as “internet of things”/”internet of things (iot)” (38 and 9 occurrences), “machine learning” (13 occurrences), “cloud computing” (12 occurrences), and “deep learning” (9 occurrences), proving the power of integrating these technologies within the infrastructure of the cities along with their high capabilities of combating current challenges, achieving long-term environmental sustainability, and improving citizens’ lives.
Figure 25 represents a visual illustration of the top 50 most frequently used words, based on keywords plus (A) and authors’ keywords (B). The higher the number of occurrences, the larger the size of the word in the image. Thus, for the dataset related to smart cities and urban planning through big data analytics, the most used keywords plus are “internet”, “framework”, and “challenges”, while the most used authors keywords are “big data”, “big data analytics”, and “smart cities”.
Figure 26 lists the most frequent bigrams in both abstracts and titles. In the case of abstracts, the first position is occupied by “smart cities” with 197 occurrences, followed by “data analytics” with 193 occurrences and “smart city” with 189 occurrences. Other terms present in the hierarchy are listed here, with respect to the number of occurrences: “machine learning” (32 occurrences), “data processing” (28 occurrences), “artificial intelligence” (26 occurrences), “cloud computing” (23 occurrences), “data analysis” (23 occurrences), “data management” (22 occurrences), and “smart sustainable” (22 occurrences).
On the other hand, the bigrams in the titles are slightly different and are listed in the following order: “data analytics” (76 occurrences), “smart cities” (54 occurrences), “smart city” (29 occurrences), “city applications” (6 occurrences), “machine learning” (6 occurrences), “analytics framework” (5 occurrences), “data management” (5 occurrences), “sustainable smart” (5 occurrences), “artificial intelligence” (4 occurrences), and “urban planning” (4 occurrences).
The presence of relevant terms within the two categories proves that the initial filters applied on the dataset were appropriate, and successfully retrieved only the papers closely linked to the research topic of this manuscript. Apart from these findings, an important aspect is revealed here: the number of bigrams in abstracts is significantly higher compared to titles. This is not surprising, considering that in general, the manuscript’s title is composed of few terms that capture only the essence of the study, while more details are presented in abstract.
In a similar manner, Figure 27 captures the top 10 most frequent trigrams in abstracts and titles.
The trigrams found in abstracts are listed here with respect to the number of occurrences: “smart city applications” (15 occurrences), “data analytics bda” (14 occurrences), “smart sustainable cities” (13 occurrences), “smart city services” (10 occurrences), “smart city development” (9 occurrences), “artificial intelligence ai” (8 occurrences), “fourth industrial revolution” (7 occurrences), “rail transit ridership” (7 occurrences), “communication technology ict” (6 occurrences), and “intelligent transportation system” (6 occurrences).
In the case of titles, the following trigrams are noticed: “smart city applications” (six occurrences), “data analytics framework” (four occurrences), “electric vehicle integration” (three occurrences), “analytics embedded smart” (two occurrences), “data analytics architecture” (two occurrences), “data analytics embedded” (two occurrences), “embedded smart city” (two occurrences), “future smart cities” (two occurrences), “green smart cities” (two occurrences), and “intelligent transportation systems” (two occurrences).
All mentioned terms are in close connection with the domain of research, highlighting an interdisciplinary approach that integrates various techniques and methods (e.g., data analytics, artificial intelligence) to support the smart cities’ evolution, which prioritizes sustainability and citizens’ needs, paying significant attention to the transport sector.
Figure 28 captures a co-occurrence network for the terms in author’s keywords. According to this visual representation, twelve distinct clusters can be identified, as discussed in the following.
First cluster (red) focuses on big data, smart cities, smart city, internet of things, cloud computing, deep learning, IoT, artificial intelligence, data analysis, sensors, Apache Spark, data analytics, decision-making, healthcare, case study, distributed computing, medical services, smart city initiatives, smart grid, smart home, and surveillance. This cluster is oriented towards the process of transforming and improving urban environments using multiple advanced technologies and methods (e.g., big data, internet of things, cloud computing, etc.). The desire is to increase the efficiency in key domains (e.g., healthcare) and the citizens’ quality of life, and also assist authorities in enhancing the strategies and refining decision-making processes by examining case studies using AI and data analysis. Apache Spark is a great option for large-scale data processing as it can be integrated and used for multiple smart city initiatives (e.g., smart grid, smart home, surveillance), adhering to the environmental progress of urban areas.
The second cluster (blue) features words such as big data analytics, machine learning, sustainability, intelligent transportation system, computer vision, innovation, natural language processing (NLP), smart grids, smart sustainable cities, and smart tourism. This cluster presents various methods and technologies (e.g., big data analytics, machine learning, and natural language processing) to support the progress and enhance efficiency in smart sustainable cities, with a particular focus on key sectors such as tourism, transport, and smart grids.
Third cluster (green) deals with internet of things (IoT) and artificial intelligence (AI). This cluster presents the power of combining IoT and AI in analyzing data and making intelligent decisions that can further assist in the urban environments’ evolution.
Fourth cluster (purple) features elements related to edge computing. This cluster is focused on a technology that can enhance the data analysis phase, by reducing the delays and having a significant contribution, especially for real-time applications. By using edge computing frameworks, IoT devices can quickly process data, hence improving the time needed for examination.
Fifth cluster (light orange) encompasses security, authentication, and privacy. This cluster is focused on the challenges associated with security (threats, attacks), authentication, and privacy (the storage and protection of personal and sensitive information). All those three concepts are of high importance in our technological era, especially during this transition to smart cities, where the citizens’ trust and safety represent key aspects.
Sixth cluster (brown) deals with urban planning, Hadoop, data visualization, and MapReduce. This cluster discusses two data tools, namely Hadoop and MapReduce, that have a significant contribution in processing large datasets and visualizing patterns. This has a particular importance, especially for urban planning processes and decisions made by the authorities.
Seventh cluster (light pink) gravitates around big data analysis. This cluster is focused on big data analysis, a key process for examining various datasets that can reveal crucial insight relevant for decision-making processes and smart cities’ implementation.
Eight cluster (grey) looks at decision-making. This cluster is focused on one of the most important phases, during smart cities’ implementation and urban planning. The involvement of experts in the domain, together with allocating the necessary resources, and paying significant attention to citizens’ needs will contribute to enhancing current strategies and combating possible challenges.
The ninth cluster (dark green) looks over interoperability. This cluster refers to the interoperability of different smart cities systems which can help in seamlessly exchanging data between them to help the ecosystem of working together.
Tenth cluster (dark orange) deals with key agreement. This cluster describes the key agreement, which is used for securing smart cities’ environments and enhancing the communication between physical devices and data stored on the cloud.
The eleventh cluster (violet-grey) focuses on open data, which is an important key to transitioning to smart city infrastructure. It helps in understanding the lifestyle of a community by using real-time information.
For the twelfth cluster (dark pink), the term spark can be associated with multiple initiatives, most of them referring to sustainable urban policies altogether with modern approaches regarding mobility.
Figure 29 was generated using VOSviewer 1.6.20 tool and uncovers five distinct clusters, as follows:
  • Cluster One (blue): “big data analytics”, “smart city”, “urban planning”, “hadoop”. These terms indicate the power of big data technologies in urban planning, in the context of smart cities’ development.
  • Cluster Two (red): “big data”, “cloud computing”, “security”, “internet of things (iot)”, “artificial intelligence”, “edge computing”. These terms are mainly oriented to current emerging technologies, and their high contribution in smart cities’ security aspects.
  • Cluster Three (green): “smart cities”, “data analysis”, “iot”, “sustainability”. This cluster underlines the power of IoT and data-driven solutions for developing sustainable smart cities.
  • Custer Five (purple): “internet of things”. This cluster highlights the importance of integrating IoT in smart cities.
  • Cluster Six (yellow): “machine learning”, “deep learning”. The cluster’s focus is on the role of artificial intelligence techniques in smart cities, and their increased use in urban planning and decision-making processes.
The results uncover the same key terms and are mostly similar with the ones obtained from Biblioshiny.
CiteSpace 6.3.R1 was further utilized for obtaining the co-occurrence network for the terms in authors’ keywords (Figure 30). Although in the below illustration there cannot be defined distinct clusters, the same key terms are noticed: “data analystics”, “iot”, “smart cities”, “machine learning”, “big data”, etc.
The thematic map based on author’s keywords is provided in Figure 31. The horizontal axis measures the relevance of the topic, while the vertical axis measures the level of development in the field (the frequency at which the keywords appear alongside with other relevant keywords).
The visual illustration is delimited into four distinct zones.
In the upper left corner, one can notice the niche themes: the ones that are well-developed but quite isolated. Terms such as NLP, dynamics, education, algorithm, environment, and generic algorithm are involved, highlighting the use of advanced algorithms and natural language processing techniques for a better comprehension of the educational end environmental contexts, focusing on adapting to changing conditions, and optimizing current processes.
The second zone is represented by motor themes, the most relevant for the research field, which consist of networks, authentication scheme, communication, edge computing, cloud, IoT, security, architecture, big data, big data analytics, smart cities, care, health, and transport. These words are oriented towards emerging technologies in urban planning, smart transportation methods, healthcare, and management of data. These are all a base for smart cities’ development.
Basic themes, the third category, consists of themes that require additional investigation by interested researchers. The following terms are included: intelligent transportation system, impact, integration, and smart grid, which refer to important elements and factors in the smart urban infrastructure, especially those related to green energy systems, public transportation, and their interoperability.
It is noticed that decision-making is placed at the intersection between motor and basic themes, suggesting that it serves as a critical mechanism for converting essential infrastructure and technology (basic themes) into usable and goal-oriented applications (motor themes).
Lastly, the emerging or declining themes, found in the bottom left corner includes topics that are no longer of interest within the academic community or have not yet been explored by the scientists. These terms consist of datafication, climate change, feature extraction, Industry 4.0, deep learning, object detection, and traffic flow prediction. This emphasizes that these challenges are temporary, which means that some may be losing focus due to changes in research objectives, while others are developing fields with space for development and modernization in the future.
Similarly, the following three terms are observed at the intersection between emerging or declining and basic themes: urban planning, MapReduce, and data visualization. These underline their basic significance to the greater scientific community, but they also point to possible stagnation or the need for renewal. Their positioning also implies that while they serve as critical tools or concepts, they may require methodological advancement or integration with more modern technologies to remain relevant in rapidly evolving fields.
Further, an LDA analysis was conducted on the purpose of topic discovery. As a result, three topics are identified, as depicted in Figure 32, Figure 33 and Figure 34.
The dominant topic, namely Topic One, provides an increased focus around elements associated with smart cities, urban management, IoT, and big data analytics, highlighted by the occurrence of keywords such as big_data_analytics, smart_cities, urban, management, iot, analytics, data-driven, and transportation. The topic links the technological innovation and urban planning, while the presence of the 82.3% of tokens in this topic underlines its dominance in the discourse, covering most of the body of the research.
Topic Two deals with issues related to technological implementation and security, featuring a series of keywords related to detection, surveillance, anomaly, ethical, machine_learning, forecasting, and traffic. Based on the keywords associated with this topic, one can highlight the interest of the researchers in the area of technological implementation and security, with a focus on applied research, particularly in data-driven monitoring and prediction systems.
Topic Three represents a smaller topic, featuring issues related to governance, public health, and innovation, highlighted by the presence of words such as public, government, health, innovation, predictive, and enhanced. Due to its reduced contribution, 3.5% of tokens, the works included in this topic are not dominant, but can bring future contributions to the field.
Thus, through the LDA, three topics are observed: Topic One—Smart Urban Development and Data-Driven Planning, Topic Two—Machine Learning and Security in Urban Systems, and Topic Three—Public Innovation, Policy, and Health.
The centrality of big data analytics in smart urban development is emphasized by the dominance of Topic One, while the contributions brought by Topic Two and Topic Three suggest an expanding landscape where ethical implications, surveillance, and public governance are gaining attention.
By comparing the results with the thematic map in Figure 31, it can be observed that LDA Topic One matches a series of topics highlighted in the thematic map in the area of motor themes, while LDA Topic Two has concepts related to the emerging themes and basic themes in the thematic map. Furthermore, LDA Topic Three seems to match themes located at the borderline between motor and basic themes of the thematic map, more specifically, to the theme depicted in pink in Figure 31 dedicated to issues related to health, care and transport.
Next, a BERTopic analysis has been performed. As a result, six clusters have been obtained, as depicted in Figure 35. For each identified topic, the most salient 10 words have been extracted and are discussed in the following. Figure 36 presents the position within map of each identified topic through BERTopic, along with five of the most used words extracted for each topic.
Based on the information in Figure 36, as well as the 10 most salient words, the following composition for each topic identified through BERTopic can be observed: BERTopic Zero deals with issues related to urban development and sustainability, and it is characterized by keywords such as urban, city, development, sustainable, framework, and analysis, while BERTopic One focuses on IoT systems and can be put in connection with the research papers featuring the development of IoT and its usage in management solutions for smart cities’ application, being characterized by keywords such as smart, IoT, processing, internet, architecture, and services. Regarding BERTopic Two, characterized by keywords such as learning, model, dataset, machine learning, accuracy, and methods, as well as keywords related to health and diseases, it can be stated that it includes works focusing on data-driven modelling, both for improving security and for ensuring public health. BERTopic Three gravitates around keywords such as traffic, road, flow, intelligent transportation, vehicle, and distributed processing, which might reflect the fact that this topic gathers under its umbrella the papers placed at the intersection of smart cities and transport innovations. Further, BERTopic Four combines aspects of IoT security and trust mechanisms—in this case, the most frequent terms are security, blockchain, authentication, access control, and communication. Lastly, BERTopic Five is complementary to BERTopic Four, covering keywords such as IoT, analytics, privacy, techniques, management, and cognitive methods.
Considering the above observations, the focus of the identified BERTopics is as follows: BERTopic Zero—urban and sustainable cities, BERTopic One—smart IoT architectures, BERTopic Two—machine learning applications, BERTopic Three—intelligent transportation systems, BERTopic Four—security and blockchain-based solutions, BERTopic Five—IoT analytics and privacy.
Further, the results of the LDA analysis have been compared with the ones obtained through BERTopic analysis. Given both the keywords associated with each topic, as well as the position of the topics within the map provided in Figure 35, it can easily be observed that BERTopic Zero, BERTopic One and BERTopic Three (located in the top-left side of Figure 35) gravitate around the elements related to smart cities, urban management, IoT, big data analytics, transportation, which have also been identified in LDA Topic One. Furthermore, BERTopic Two, BERTopic Four and BERTopic Five (located in the bottom-right side of Figure 35) are discussing issues related to technological implementation, security, and ML, which are similar to the elements included in LDA Topic Two. Furthermore, a part of BERTopic Two retains elements that can be associated with LDA Topic Three. Given the reduced representation of the LDA Topic, namely only 3.5% of topics, it was expected that in BERTopic analysis the representativity of these studies would be reduced. Table 4 summarizes the comparison between the identified topics through both analyses.

3.5. Mixed Analysis

As mentioned in the beginning, a section dedicated to mixed analysis is included in the manuscript. Its main purpose is to offer readers insights about smart cities and urban planning through big data analytics, highlighting the connections between countries, authors, universities, journals, and keywords.
Figure 37 depicts the connection between three distinct variables: countries (left), authors (middle), and journals (right).
In terms of countries, the highest scientific contribution in the field of smart cities and urban planning through data analytics is noticeably in Korea and Pakistan.
When discussing authors, the most prolific scientists with respect to the number of published papers in the investigated research domain are Khan M, Bibri SE, and Han K.
The most preferred journals for publishing papers associated with this field are Sustainable Cities and Society and Future Generation Computer Systems—the International Journal of E-science.
At this point, the authors’ tendency to publish in multiple journals, instead of focusing on a particular one, is visible. The interdisciplinary nature of the field offers scientists the opportunity to discuss the topic from various perspectives and publish their manuscript in numerous sources to reach a larger audience.
Going further with the discussion, the connection between affiliations (left), authors (middle), and keywords (right) is depicted in Figure 38.
In the left side of the visual representation, one can notice that the affiliation with the highest involvement in the domain addressed is Kyungpook National University (KNU), followed at a significant difference by National University of Sciences and Technology—Pakistan, and King Saud University.
The authors affiliated with these institutions are listed in the second column. An important remark here is that all of the top 10 scientists are affiliated with at least one university from the hierarchy.
Furthermore, the most used keywords are “big data analytics”, “internet of things”, and “big data”.
Apart from this, it is observed that each author addressed several topics around the domain of smart cities, proving once again the interdisciplinary nature of the field. Also, collaborations between universities and researchers from different countries show the globalization of the research topic.

4. Discussions

In the subsequent pages, the findings revealed during the bibliometric investigation performed through data analytics around the topic of smart cities and urban planning will be discussed. Apart from this, there will also be provided answers to the questions raised in the introduction.
The first subsection highlights the results uncovered during the analysis phase and then compares them with other existing studies written by other authors around distinct topics from the academic literature.
Afterwards, a reflection on the smart cities’ applicability is provided, focusing on essential domains (urban mobility, healthcare, tourism, environmental sustainability, and education).
Lastly, key limitation in the applicability of smart cities is described as an awareness that data privacy and security might cause possible breaches. However, the cost incurred for implementing such systems represents a challenge, as a large amount of data is at risk and vulnerable.

4.1. Bibliometric Analysis Results and Comparison with Other Studies

The last decade has been marked by a pronounced growth in software technology; thus, the transmission and processing of large volumes of data has become increasingly popular. More and more researchers have proposed new ideas regarding the architectures and frameworks with which a smart city can be developed. The scientific peak of this field, as previously seen, was the period between 2020 and 2022, when the COVID-19 pandemic spread [92,93]. Due to the medical crisis that occurred during that period, as well as the need to develop systems for responsible resource consumption, this field has experienced a significant expansion.
As already mentioned, this study proposes a comprehensive bibliometric investigation, with a particular focus on the field of smart cities and urban planning through the lens of big data development. The manuscript investigated the evolution of the domain within the academic community and uncovered the main topics addressed, areas of high interests, sectors that require additional involvement and resources, current challenges, hidden trends, and many more.
The bibliometric examination was divided into five distinct facets, listed here in order of their appearance: dataset overview, authors, sources, papers, and mixed analysis.
The dataset was collected exclusively from the Web of Science database, a decision that was based on multiple arguments (the popularity of the source, its up-to-date version, vast collection of papers across any fields, ease of integration with Biblioshiny, VosViewer and CiteSpace, etc.).
Its user-friendly interface offered the possibility of applying various filters. Initially, only the papers that contained specific keywords related to smart cities or urban planning and big data analytics in either abstracts, titles, or author’s keywords were collected. Then, other exclusion criteria were applied: language (English), document type (article), and year of publication (the ongoing year 2025 was removed). Once the set of papers was gathered, a manual selection of the articles was performed to eliminate the early works that were not related to the smart city concept.
The final data collection set includes 191 English-written articles, published within a period of 10 years (2015–2024) in 119 distinct sources, proving the interdisciplinary nature of this field.
It was noticed that the domain is still in its development phase, but its high importance and relevance are further evidenced by the academics’ interest and engagement in publishing papers and expanding the domain along with the technological advancement. This statement is also supported by the value registered for the annual growth rate (10.72%).
The raw file generated from WoS was directly imported into the scientometric tools (Biblioshiny, VOSviewer, and CiteSpace), which assisted in shaping the hierarchies and designing the visual illustration included in the previous chapter.
In terms of the annual scientific production evolution, it was observed that the highest number of citations (36) in the domain of smart cities and urban planning through big data analytics was recorded in 2016. After that period, the number of citations began to decline steadily, reaching an average of only two citations per year in 2024. This was caused by the fact that the papers published last year have not yet reached their entire audience, while the early works are, in general, referenced in the new ones.
Furthermore, there is a high tendency of collaborations between authors, a fact initially observed through the discrepancy between the high number of authors (656) and the articles from the dataset (191). By conducting some further investigation, the following information was revealed: only 2.44% papers from the dataset are single-authorship publications, while at the opposite end, 97.56% of the works represent academic collaborations, involving at least two scientists.
Not only is the collaboration between authors is significant, but also the partnerships between countries that resulted in numerous international contributions to the academic literature. China is the country which registered the highest number of collaborations in the domain of smart cities and urban planning across the world, including India, Australia, United Kingdom, Malaysia, Saudi Arabia, the USA, Pakistan, Canada, Sweden, and France.
China’s substantial involvement was observed in other fields as well. Its presence among top contibutors in numerous bibliometric investigations proves its powerful community of scientists and their strong technical and interdisciplinary expertise. Some bibliometric papers, for which China occupies the top of most relevant countries, are addressing subjects such as: the stock market [94], Twitter-related studies [39], grey systems [95], mathematics [96], and plant disease [97]. The large number of documents produced by Asian countries was also noted in the work of Harnal et al. [98], which ranks Asian countries in first place according to the number of published articles in the field.
When discussing sources, the most influential in this domain are IEEE Access and Sustainable Cities and Society, both with the same number of articles (10). These two journals are found in Zone 1 according to Bradford’s law on source clustering, being classified as the most relevant sources with the highest number of citations recorded, and they also have a leading position in the hierarchy shaped with respect to the H-index. Their presence among other similar topics conducted in bibiliometric studies that address distinct topics (smart cities research [99], COVID-19 [100], sentiment analysis with deep learning [101], and vaccine misinformation [102]), proves their influential position within the scientific community.
The most relevant authors were uncovered by shaping a hierarchy with respect to the number of published articles in the mentioned field. Bibri SE and Khan M occupy the first two positions, each with six published papers. Regarding their production over time, the year 2017 offered a maximum of 12 articles in the field, while at the opposite end, the year characterized by the lowest publication output was 2024, when only one article was published. The highest number of published articles reached by one of the authors from the hierarchy in a year is three (Yaqoob I in 2017, Bibri SE and Babar M in 2019, Memood R in 2022).
Going further with the discussion, some remarks about the affiliations should be highlighted. King Abdulaziz University and Kyungpook National University are the leaders according to the number of published papers (each recorded seven articles). A closer examination of the hierarchy reveals that the universities from Asia and the Middle East dominate this top, while Europe has only two representatives (Norway and Portugal), proving a global interest in the development of urban environment.
The analysis of the top 10 most cited documents offered readers an overview of the main topics addressed, and the approaches followed by the scientists. It was observed that, mainly, two types of articles were written: original works that introduced new architectures and demonstrated their power using real datasets (e.g., PM2.5 dataset of Beijing) and literature review papers oriented towards explaining specific concepts (e.g., big data, IoT, and smart city) in a theoretical manner. All those papers had the same core objective: presenting methods and technologies that can support the advancement of smart sustainable cities and enhance their efficiency, with a particular focus on essential fields (e.g., transport, healthcare, and tourism), citizens’ needs, trust, and security, as well as providing strategies for combating the current challenges.
Lastly, as the words and mixed analyses were performed and based on these findings, some conclusions can be drawn. The keywords with the highest number of occurrences are as follows: “big data” (66 occurrences), “big data analytics” (64 occurrences), “smart cities” (57 occurrences), “internet” (34 occurrences), “framework” (24 occurrences), and “challenges” (20 occurrences). These terms underline that the internet is perceived as the fundamental structure in smart cities. Smart cities are still in their development phase involving new frameworks being proposed, but at the same time, implying certain disadvantages during the implementation process. Apart from these, the power of big data in the development of smart cities is substantial, a fact proved by the academics’ high interest in this topic.
Thematic maps reveal the main topics from the academic community, such as natural language processing, dynamics, education, algorithm, environment, security, architecture, healthcare, impact, integration, etc. These terms underline the power of using machine learning, IoT and big data for the implementation and development of smart cities, with a particular focus on key areas.
Mixed analyses suggest that the authors tend to publish their papers related to smart cities and urban planning through data analytics in multiple sources, rather than focusing on a particular one. Furthermore, each scientist is linked with at least one affiliation from the top, and conducts various partnerships with academics from all over the world (proving once again the globalization of the research topic).

4.2. Discussions of Specific Themes

In this section, various topics related to smart cities, addressed within the academic literature, will be discussed with the intention of offering readers a better understanding of the research domain’s applicability.

4.2.1. Implications of Smart Cities in Urban Mobility

One of the domains in which smart cities have demonstrated their high impact is represented by urban mobility [103]. This does not exclusively refer to creating new road infrastructure and streamline traffic, but also to offer alternative solutions and environmentally friendly sources. These consist of public transportation with electric engines, creating cycling infrastructure, and even optimizing the ride-sharing system.
The study conducted by Müller-Eie and Kosmidis [104] examines no less than 14 Nordic cities with populations between 50,000 and 300,000, and demonstrates that the implementation of smart mobility solutions is quite conventional, and the goals that cities propose are often abstract, without a clear plan.
Thus, the paper written by Brcic et al. [105] proposes a connected ecosystem that includes all the buses, trams and metros of a smart city, operating according to a dynamic schedule. In this ecosystem, bicycles also coexist, bike sharing applications being a component of the smart city in the authors’ vision. The idea of smart parking is also proposed for drivers who create traffic jams when looking for a suitable parking space. All these implementations are monitored by ICT, which allow for the collection, analysis, and distribution of data in real time.
The paper written by Chen and Zhang [106] is more technical and involves the integration of machine learning techniques (Teaching–Learning-Based Optimization—TLBO algorithm, and a hybrid Artificial Neural Network–Recurrent Neural Network—ANN–RNN) for optimizing the urban mobility in smart cities.
Urban mobility is a topic of high importance nowadays, especially in crowded cities. Challenges such as traffic density, travelling costs, fuel consumption, and air pollution can all be addressed through continuous academic research and technological advancements (internet of things, machine learning, artificial intelligence, and data analytics).

4.2.2. Implications of Smart Cities in Healthcare Systems

Another key area in which the implementation of smart cities has a significant contribution is the healthcare domain. Considering the works in this field, the paper authored by Quazi et al. [107] is oriented towards using artificial intelligence for predictive analytics on data collected from sensors. Real case studies from various urban environments (Barcelona, London, and some cities from Singapore) are also involved.
Also, Clim et al. [108] present the theoretical foundation for a Clinical Decision Support System that follows the Software as a Medical Device (SaMD) paradigm, called CDS-SaMD. The proposed method uses a tiered architecture to gather and interpret data from Electronic Health Records (EHRs) in hospital settings. The architecture comprises several phases, including sensor-based data collection, pre-processing, cloud-based transmission and storage, data reduction, feature extraction, and decision tree-based analysis. This methodology aims to help medical professionals in making more accurate and timely decisions on diagnosis and treatment. The proposed framework shows increased efficiency compared to traditional diagnostic methods. By enabling timely and informed clinical decisions, the strategy may reduce mortality rates and enhance patient care outcomes.
This domain is of high importance, especially after observing the challenges that were associated with the COVID-19 pandemic [109]. The involvement of both the academic community and authorities is crucial for implementing efficient health strategies, improving the quality of the services, integrating smart devices within hospitals (e.g., smart beds, smart bracelets for measuring blood pressure, glucose sensors, etc.), as well as gaining citizens’ trust.

4.2.3. Implications of Smart Cities in Tourism Industry

The tourism industry in smart cities is another point of academic interest. For example, the work conducted by Escobar and Hall [110] is oriented towards presenting a critical review of the existing papers related to smart cities and the tourism industry, and uncovers the connection between them (how smart cities influence tourism). The dataset was collected from three popular databases (Scopus, Web of Science, EBSCOhost) and consisted of 73 manuscripts. During the analysis phase, some barriers were noticed, and the authors highlight the need to involve more people in decision-making processes and adapting to their needs, while at the same time promoting tourism as a way of increasing city attractiveness through sustainable practices.
Furthermore, Diaz et al. [111] highlight the power of combining modern technologies and methods (IoT, big data, or artificial intelligence) during the smart cities’ development and implementation. The citizens’ opinions are substantial, and without adapting to their needs, such systems will not have a positive impact. A new model for personalized tourist recommendations is proposed, involving a technology acceptance model (TAM), and the findings prove that within smart cities, tourists with higher digital skills benefit from more personalized services.
Also, Ivars-Baidal et al. [112] investigate how the ideas of smart cities and smart tourism destinations are being applied in the design of Spanish tourist destinations, with a particular focus on data-driven management, governance, and sustainability. By discussing the benefits and drawbacks of smart initiatives through document-planning analysis and local manager surveying, the study makes a significant addition to the global discussion on the actual impact of smart strategies in urban and tourism development.
The connection between smart cities and smart tourism is evident. The authorities should pay considerable attention to travellers’ needs and safety, and involve advanced techniques to ensure better communication between tourists and the city, as well as provide them with personalized experiences, analyze their preferences, and based on them, improve urban planning. All these factors can contribute to enhancing the global image of the city and increasing its economic development.

4.2.4. Implications of Smart Cities in Education

The impact of smart cities in education is also found among the academics’ interest. Based on the works in this area, the paper written by Dimitrova et al. [113] presents the opportunities and impact that smart cities have on the education sector, focusing on how advanced techniques can influence the students’ learning process and problem-solving skills. The authors highlight the importance of collaboration between experts, schools, governments, and academic communities in implementing smart education and creating sustainable cities.
Also, Clarinval et al. [114] examines the effects of an interactive strategy for including young people in directing urban development. Early teenagers were used to test the approach, and the results showed a noticeable increase in their understanding of collaborative planning and urban creativity. The experience’s lessons offer useful direction for upcoming plans that seek to involve a larger range of participants in the planning of smart cities.
The paper written by Molnar [115] considers past research to identify impediments to knowledge sharing in different types of situations. A selected dataset with relevant articles from two popular databases, more specifically Scopus and Web of Science, highlight three major issues: the reliance on digital technologies introduces new learning obstacles, current programmes may not sufficiently address the needs of changing urban environments, and unanticipated side effects may occur in connected industries. The goal is to increase the understanding of these insufficiently explored areas as part of the greater urban learning reformation.
Learning is an important part of modern urban regions, as it increases confidence on digital tools to improve daily lives. Education must be addressed with attention, especially during the transition to smart cities. The use of technology can have a powerful impact in enhancing the learning process, but at the same time it can represent a challenge if it is not implemented with strategic planning and full awareness.

4.3. Key Limitations in the Applicability of Smart Cities

The development of smart cities in recent years, especially during the pandemic, has been remarkable. However, along with the benefits brought by this technology, there are also risks to which citizens are revealed [116]. Being a decentralized system, cybersecurity issues are the most common [117].
Given the fact that confidential data about citizens are stored in cloud environments, these can become appealing to hackers. In addition, the human factor remains poorly prepared in the field of security, with hackers being able to take advantage of institutions in order to have unauthorized access to various information. The article written by Almeida [118] is oriented towards this topic, focusing on making the smart city a safer environment from a data protection perspective. The scientist proposes 24 strategies for combating the associated challenges, including multifactor authentication, cybersecurity training for citizens, and separation of critical information from public information.
Another risk that may arise along with the smart cities’ implementation is represented by social discrimination. First, not all citizens have access to the internet or know how to use its functionalities. For the smart city to be a tool used by everyone without being beneficial only for certain citizens, some training should be carried out before the development and implementation of such cities. However, there is also the case of people from small towns or villages migrating to large metropolises that have implemented intelligent systems. This would create a demographic problem, in which small towns and villages would remain unpopulated, while large cities would become overpopulated. These problems are explained in detail by Caragliu and Del Bo [23].
However, these issues represent an opportunity for future research, new architecture, and ides in the domain’s growth.

4.4. Cross-Regional and Interdisciplinary Comparative Analysis in the Dataset

This section aims to contribute to a better understanding of the field, with a particular focus on a comparative analysis across regions ad disciplines. As a first step, the initial dataset collected from the Web of Science database, which contained 191 manuscripts, was split in to four distinct categories based on the first author’s region of provenance, as follows:
  • Asia—107 articles (approx. 56.02% of the dataset)
  • Europe—53 articles (approx. 27.75% of the dataset)
  • America—10 articles (approx. 5.24% of the dataset)
  • Others—21 articles (approx. 10.99% of the dataset)
As can be noticed, the leading position is held by Asia, which is not surprising considering the previous examinations in which China, India, and Korea were always found to be among the most involved contributors in the domain of smart cities and urban planning through big data analytics.
With the intention of better understanding the fields of interest in each region, three word clouds with the most popular trigrams in titles were created in Figure 39: A—Asia, (B)—Europa, and (C)—America.
It is noticed that most of the papers associated with the Asia region are oriented towards the application of smart cities, their architecture, development, and future evolution, with a particular focus on electric vehicles, and real-time data processing (Figure 39A), while in the papers associated with the Europe region there is a high interest in smart sustainable urbanism, building digital twins, analyzing the real world, automotive process advancement, challenges, and production systems in smart cities (Figure 39). Lastly, in the manuscripts associated with the America region, the focus is on integrating sustainability in smart cities, monitoring the quality of roads (asphalt), improving urban mobility, reducing congestion, and fuel saving, through data analytics surveys and detection-based systems (Figure 39C).
Although the papers belong to scientists from different regions, they cover similar themes (e.g., sustainability, smart cities development, big data analytics integration, traffic, etc.), proving a shared global interest with common priorities.
Furthermore, an analysis in terms of thematic maps has been conducted on the three main contributing regions. The results are highlighted in Figure 40, Figure 41 and Figure 42.
Given the number supremacy of the papers associated with the Asia region, Figure 40 provides a wide range of themes in all four quadrants of the thematic map. As a result, a strong orientation of these papers towards the motor themes can be observed, with clusters gravitating around elements related to technology and infrastructure, characterized by specific keywords such as cloud computing, data analysis, and intelligent transportation systems. Furthermore, the important role played by the digital technologies is observed through the keywords associated with motor themes, such as big data, smart city, and IoT, as well as by the large-scale data processing highlighted by keywords such as machine learning, artificial intelligence, and Hadoop. Also, in terms of niche themes, an interest in the area of transport and mobility optimization can be observed—given the keywords deep learning, spatiotemporal data, and traffic congestion, while the emerging themes are featuring elements related to privacy and cybersecurity—highlighted by the presence of the terms such as security, key agreement, and authentication.
For the papers associated with the Europe region, the thematic map presented in Figure 41 highlights a more balanced approach, as most of the themes lie between motor and basic themes. In terms of motor themes, it can be observed that a technological trend is followed, highlighted through the use of IoT, artificial intelligence, and edge computing keywords. On the other side, the basic themes focus on well-stated elements, including smart cities, big data, and cloud computing, while in the area of emerging themes one can discover the rise in urban planning and data analysis, which might be connected with the authors’ efforts to support aspects related to urban design and spatial planning.
In the case of papers associated with America region, as their number has been relatively small, namely 10 papers, the only common elements in the authors’ keywords have been big data analytics and smart cities, which results in an almost empty thematic map as presented in Figure 42. Even though efforts have been made to extract more elements from the authors’ keywords, the map could not have been further enhanced.
As a result of the thematic map analysis, one can observe a technology and infrastructure-driven profile for the themes approached in the papers associated with the Asia region, a smart sustainable approach in the case of Europe, and a narrow focus for the ones associated with the America region (with the observation that the number of the papers included in this area is relatively reduced, which might have also contributed to receiving fewer results).
By comparing the results with the ones obtained in the case of the word-clouds, it can be observed that the results are similar. Moreover, the three thematic maps created for the three main contributing regions show clear complementarities with the global thematic map provided in Figure 31.

5. Limitations

In this chapter, the main limitations are highlighted in an objective manner to provide interested readers with a comprehensive overview of the way in which this analysis was conducted and some possible future research directives that can be considered by other scientists that desire to further contribute to the continuous expansion of this field.
As already mentioned in the first part of the manuscript, the datasets consist of 191 English-written articles related to smart cities and urban planning through data analytics.
The first limitation that should be highlighted here is represented by the source from which the papers were collected. As for this manuscript, the decision was to gather the data exclusively from the Web of Science database, considering multiple arguments. WoS is a popular database in the scientific community, being the best option for collecting the datasets, especially for bibliometric examinations [35,43,119,120]. Its up-to-date version is a friendly and easy-to-use interface, with a vast collection of papers across any domain; these are just some examples that place it in the top of scientists’ preferences. Another important aspect that contributed to this decision was its straightforward integration with the scientometric tools (Biblioshiny 4.2.1, VOSviewer 1.6.20, CiteSpace 6.3.R1). The file in raw format exported from WoS can be directly imported into Biblioshiny 4.2.1 for generating the needed graphs, tables, and visual representations. Furthermore, the individual analyses conducted in this manuscript would have generated challenges and an increased complexity of hierarchical shaping if multiple databases were utilized simultaneously.
In other words, the single database approach used in the current manuscript was a necessity (the best choice in this context), and the exclusion of other databases (e.g., Scopus) was a result of this choice, rather than the purpose of the research. Interested researchers are encouraged to find alternatives for combining datasets gathered from multiple sources.
Furthermore, during the data collection phase, multiple filters were considered in the WoS database (please refer Table 1). Although the intent was to collect an appropriate set of papers for obtaining accurate results, some limitations might have been introduced alongside filters’ usage.
Initially, the papers were selected based on the presence of specific keywords related to smart cities or urban planning and data analytics. Even if the search was performed on titles, abstracts, and even author’s keywords, and the use of “*” at the end of the main words enabled the retrieval of all lexical variants of the root term (including both plural and singular forms), some works may have been omitted due to differences in terminology.
After the keywords’ search, the set of papers was restricted to exclude all papers that were not written in English. This restriction had no impact on the initial dataset.
A criterion that generated a substantial decrease in the number of papers was represented by document type. All the works that were not marked as articles in the WoS database were excluded from the investigation. There might be a possibility of neglecting some relevant contributions to the academic literature (e.g., books), upon applying this filter.
Lastly, the year constraint was imposed. Since the present investigation is conducted in July (the middle of the year), all the papers published in 2025 were excluded from the analysis. This decision was made considering that the current year is incomplete from a scientific point of view, but it can also represent a limitation (certain publications might have been disregarded).
After all those filters, a manual selection of the early papers that were not related to smart cities was performed. The intent was to eliminate articles that were considered irrelevant for this bibliometric research, but it is possible that by mistake, some articles might have been unintentionally overlooked.
Having all those aspects in mind, future researchers are encouraged to take into consideration all the aforementioned limitations, gather larger sets of data (without the use of filters, if possible), and further extend the research domain. It is essential to understand the impact of smart cities, address environment challenges, adapt to citizens’ needs and promote a sustainable lifestyle. The continuous evolution of the technology, along with the high-performance algorithms and systems, have a substantial power upon collecting and processing the data, and at the same time can assist authorities in decision-making processes associated with urban planning and smart solutions.

6. Conclusions

This last section from the manuscript is oriented towards highlighting the main insights revealed during the investigation phase.
The data collection set was gathered from the Web of Science database and consisted of 191 English-written articles, published within 2015–2024. All papers are related to smart cities and urban planning through data analytics and were examined through five distinct perspectives (dataset overview, sources, authors, papers, and mixed analysis).
The main findings are summarized below:
  • The importance and the popularity of the domain within the academic community is proved by the annual growth rate, which is 10.72%.
  • The field has experienced an exponential growth in recent years, especially after the COVID-19 pandemic, when the need of digitalization and interconnection between individuals significantly increased due to more and more activities being carried online.
  • There is a pronounced tendency of collaborations between authors in this domain (2.44% papers from the dataset are single-authorship publications, while at the opposite end, 97.56% involve at least two contributors). The collaboration is observed in the case of both countries and authors.
  • The journals that published the highest number of articles in the domain of smart cities and urban planning are IEEE Access and Sustainable Cities and Society (each with 10 papers).
  • The most prolific authors with respect to the number of published manuscripts in this research field are Bibri SE and Khan M, each with six papers. From the perspective of the H-index the most prolific author is Khan M with six articles, followed by Rathore MM with five articles
  • When discussing countries, China, India, and Korea are listed as the top three contributors in the field of smart cities and urban planning through data analytics.
  • King Abdulaziz University and Kyungpook National University are the affiliations that recorded the highest number of published articles in the analyzed domain.
  • The examination of the top 10 most cited papers revealed that the majority of the scientists were oriented towards providing original solutions to improve the transmission of large volumes of data, making predictions, and testing the performance of some models on datasets based on real-life conditions, while others (four out of ten) opted for presenting the concept of big data, analyzing the existing literature and identifying challenges, gaps in research and many more.
  • The word analysis highlighted that the papers are focusing on the process of transforming and improving urban environments using multiple advanced technologies and methods (e.g., big data, internet of things, cloud computing, artificial intelligence, etc.), to support the progress and enhance efficiency in smart sustainable cities, increase citizens’ quality of life, the efficiency of processes in key domains (e.g., transport, healthcare, tourism), and at the same time, address possible security concerns, and assist authorities in decision-making processes. The most popular terms found in the datasets are as follows: “internet”, “framework” “challenges”, “big data”, “big data analytics”, and “smart cities”.
The results obtained through the word analysis are further supported by the ones obtained through thematic maps and LDA topics discovery. Considering the general thematic map, it has been observed that the motor themes gravitate around technological elements in smart city development, while the basic themes focus on smart urban infrastructure, with particular relevance to sustainability, public transport, and energy systems. Furthermore, the results obtained through LDA have been supported by the results extracted through the use of BERTopic analysis.
Even though considering both the global thematic map and the regional thematic maps (created for regions such as Asia, Europe and America), it can be observed that big data applications in smart cities and urban planning are studied and explored in parallel, not being integrated—e.g., urban planning tends to appear as a separate cluster usually connected with elements related to sustainability, governance, or spatial analysis, whereas smart city themes are clustered around technology-driven developments in IoT, big data analytics and edge computer—in the case of the topic discovery made through the use of LDA analysis, the main topic includes terms like “urban” and “smart city/smart cities”. Keeping in mind the fact that the thematic maps have been built based on authors’ keywords, while the topic discovery has been conducted through the use of titles and abstracts, this further supports the fact that the terms are connected mostly in the discourse associated with each topic in part. In LDA, the smart cities and urban planning terms co-occur in the dominant topic, which underline the situations in which the two concepts are put together in a diffuse way, embedded in broader discussions rather than forming a distinct research cluster. Thus, while the thematic maps show a gap between the terms, the topic modelling uncovers some overlapping discourse between the two concepts.
That being outlined, this research aimed to offer readers a comprehensive overview regarding the domain of smart cities and urban planning through data analytics. Hidden themes, areas that require further investigation, topics of high importance, current challenges, and other relevant details were all presented and explained with the assistance of various metrics and indicators.
The field of research is essential in the current technological world. It is of high importance for both the academic community and authorities to collaborate, share knowledge, and propose efficient strategies for offering citizens a simple and gradual transition to smart cities. The rise in machine learning, artificial intelligence, and Geographic Information Systems, along with the applications of big data analytics, have a powerful contribution and impact on this sector. Future researchers are encouraged to further extend the domain, utilize huge datasets and various algorithms, offer advanced solutions, and at the same time pay significant attention to people’ needs, and security challenges. Since the current investigation is mainly based on empirical evidence from the literature, future research could further explore the integration of these findings into a solid theoretical framework. Some suggestions are represented by introducing a mature three-dimensional framework of technology application governance or even adding theoretical arguments derived from existing classifications to support the analysis. Additionally, future examinations could refine the recommended dimensions, compare, and test the empirical classification with the current models using case studies or alternative conceptual approaches.
Going further with the discussion, given the gaps highlighted in the thematic maps between smart cities and urban planning, as well as the overlapping discourse of the two terms in the LDA analysis, some specific directions for future research in smart cities and urban planning through big data analytics domain can be highlighted. These include investigating the uses of environmental, energy, and traffic data in optimizing urban infrastructure, involving, and optimizing the machine learning and artificial intelligence algorithms for controlling urban resources and flows, as well as establishing frameworks for citizen data governance and protection. Besides this, some possible ways of implementing the results can be accomplished through monitoring tools, statistics for decision-makers, development of data protection standards and efficient policies, along with theoretical and case study validations.
The use of big data analytics in urban planning addresses the gap between data-driven analysis and smart city implementation, supporting a more consistent, efficient, and environmentally friendly urban growth. Informed decisions related to the key concerns (e.g., transport, traffic, energy distribution, environment, etc.) can be made through real-time analytics, dashboards, IoT platforms, API-based data sharing, etc., which can guarantee an increase in citizens’ quality of life and urban areas’ development. At the moment, there are still challenges encountered by authorities, but with constant research and involvement, such opportunities will become achievable.
Also, given the themes highlighted in both the global and regional analysis conducted on the authors’ keywords, it can be observed that future research directions might consider focusing on applications of heterogeneous data types in smart transportation, providing technical pathways for privacy and cybersecurity frameworks, conducting sustainability-driven data analytics, or research in the area of interoperability and governance models for smart city data. Furthermore, considering the niche themes in the global thematic map, one can highlight the rise in the themes related to health, care, and social well-being in data-driven cities, which might constitute future research directions to be explored.
The results discussed in this study in regard to the big data analytics for smart cities opens interdisciplinary perspectives, particularly for fields such as accounting and auditing, which are increasingly important in the context of smart governance. Big data analytics can support the design of performance auditing tools, provide transparency in public investments, and reinforce accountability in urban infrastructure projects, ensuring that the digital transformation of cities is both effective and equitable.

Author Contributions

Conceptualization, F.D., A.S., G.-C.T. and L.-A.C.; Data curation, F.D., A.S., G.-C.T. and L.-A.C.; Formal analysis, F.D., A.S., G.-C.T. and L.-A.C.; Funding acquisition, L.-A.C.; Investigation, F.D., A.S., G.-C.T. and L.-A.C.; Methodology, F.D., A.S., G.-C.T. and L.-A.C.; Project administration, L.-A.C.; Resources, A.S., G.-C.T. and L.-A.C.; Software, F.D., A.S., G.-C.T. and L.-A.C.; Supervision, L.-A.C.; Validation, F.D., A.S., G.-C.T. and L.-A.C.; Visualization, F.D., A.S., G.-C.T. and L.-A.C.; Writing—original draft, A.S., G.-C.T. and L.-A.C.; Writing—review and editing, F.D. All authors have read and agreed to the published version of the manuscript.

Funding

Andra Sandu acknowledges the support of a grant of the Romanian Ministry of Research, Innovation and Digitalization, project CF 178/31.07.2023—‘JobKG—A Knowledge Graph of the Romanian Job Market based on Natural Language Processing’. Florin Dobre acknowledges the support of a grant from the Bucharest University of Economic Studies, through the project “Analysis of the Economic Recovery and Resilience Process in Romania in the Context of Sustainable Development”, EconST2025. Liviu-Adrian Cotfas acknowledges the support of a grant from the Bucharest University of Economic Studies through the project “Promoting Excellence in Research through Interdisciplinarity, Digitalization, and the Integration of Open Science Principles to Enhance International Visibility (ASE-RISE)”, Project Code CNFIS-FDI-2025-F-0457.

Data Availability Statement

Data is contained within paper.

Conflicts of Interest

The authors declare no conflicts of interest.

References

  1. Mohammadzadeh, Z.; Saeidnia, H.R.; Lotfata, A.; Hassanzadeh, M.; Ghiasi, N. Smart City Healthcare Delivery Innovations: A Systematic Review of Essential Technologies and Indicators for Developing Nations. BMC Health Serv. Res. 2023, 23, 1180. [Google Scholar] [CrossRef]
  2. Kuo, Y.-H.; Leung, J.M.Y.; Yan, Y. Public Transport for Smart Cities: Recent Innovations and Future Challenges. Eur. J. Oper. Res. 2023, 306, 1001–1026. [Google Scholar] [CrossRef]
  3. Silva, N.S.E.; Castro, R.; Ferrão, P. Smart Grids in the Context of Smart Cities: A Literature Review and Gap Analysis. Energies 2025, 18, 1186. [Google Scholar] [CrossRef]
  4. Sciarrone, F.; Temperini, M. K-OpenAnswer: A Simulation Environment to Analyze the Dynamics of Massive Open Online Courses in Smart Cities. Soft Comput. 2020, 24, 11121–11134. [Google Scholar] [CrossRef]
  5. Batty, M. Big Data, Smart Cities and City Planning. Dialogues Hum. Geogr. 2013, 3, 274–279. [Google Scholar] [CrossRef]
  6. Gandomi, A.; Haider, M. Beyond the Hype: Big Data Concepts, Methods, and Analytics. Int. J. Inf. Manag. 2015, 35, 137–144. [Google Scholar] [CrossRef]
  7. Cheshmehzangi, A. Urban Planning for the Contemporary Age: Navigating Complexities and Shaping Urban Futures. Encyclopedia 2025, 5, 19. [Google Scholar] [CrossRef]
  8. Allam, Z.; Jones, D.S. Pandemic Stricken Cities on Lockdown. Where Are Our Planning and Design Professionals [Now, Then and into the Future]? Land Use Policy 2020, 97, 104805. [Google Scholar] [CrossRef]
  9. Ismaeel, A.G.; Mary, J.; Chelliah, A.; Logeshwaran, J.; Mahmood, S.N.; Alani, S.; Shather, A.H. Enhancing Traffic Intelligence in Smart Cities Using Sustainable Deep Radial Function. Sustainability 2023, 15, 14441. [Google Scholar] [CrossRef]
  10. Wolniak, R. Analysis of the Bicycle Roads System as an Element of a Smart Mobility on the Example of Poland Provinces. Smart Cities 2023, 6, 368–391. [Google Scholar] [CrossRef]
  11. Salama, R.; Al-Turjman, F. Sustainable Energy Production in Smart Cities. Sustainability 2023, 15, 16052. [Google Scholar] [CrossRef]
  12. Abdulmalek, S.; Nasir, A.; Jabbar, W.A.; Almuhaya, M.A.M.; Bairagi, A.K.; Khan, M.A.; Kee, S.-H. IoT-Based Healthcare-Monitoring System towards Improving Quality of Life: A Review. Healthcare 2022, 10, 1993. [Google Scholar] [CrossRef]
  13. Rosin, A.; Drovtar, I.; Mõlder, H.; Haabel, K.; Astapov, V.; Vinnal, T.; Korõtko, T. Analysis of Traditional and Alternative Methods for Solving Voltage Problems in Low Voltage Grids: An Estonian Case Study. Energies 2022, 15, 1104. [Google Scholar] [CrossRef]
  14. Cano, L.; Ortega, C.; Talavera, A.; Lazo, J. Smart City Park Irrigation System: A Case Study of San Isidro, Lima—Peru. In Proceedings of the UCAmI 2018, Punta Cana, Dominican Republic, 4–7 December 2018; MDPI: Basel, Switzerland, 2018; p. 1227. [Google Scholar]
  15. Bachiri, K.; Yahyaouy, A.; Gualous, H.; Malek, M.; Bennani, Y.; Makany, P.; Rogovschi, N. Multi-Agent DDPG Based Electric Vehicles Charging Station Recommendation. Energies 2023, 16, 6067. [Google Scholar] [CrossRef]
  16. Dyachia, S.; Paul, A.; Ayodeji, O.; Ukwe-Nya, S.; Yakubu; Purwanto, A.; Rustam; Andrasmoro, D. Smart Cities and Environmental Sustainability: Evaluating the Nexus in South-West Nigeria. Indones. J. Geogr. 2025, 57, 10–20. [Google Scholar] [CrossRef]
  17. Bichueti, R.S.; Leal Filho, W.; Gomes, C.M.; Kneipp, J.M.; Costa, C.R.; Frizzo, K. Climate Change and Urban Resilience in Smart Cities: Adaptation and Mitigation Strategies in Brazil and Germany. Urban Sci. 2025, 9, 179. [Google Scholar] [CrossRef]
  18. Soyata, T.; Habibzadeh, H.; Ekenna, C.; Nussbaum, B.; Lozano, J. Smart City in Crisis: Technology and Policy Concerns. Sustain. Cities Soc. 2019, 50, 101566. [Google Scholar] [CrossRef]
  19. Megahed, N.A.; Abdel-Kader, R.F. Smart Cities after COVID-19: Building a Conceptual Framework through a Multidisciplinary Perspective. Sci. Afr. 2022, 17, e01374. [Google Scholar] [CrossRef]
  20. Westbrook, T.; Costa, D.G. Emergency Response in Smart 15-Minute Cities: The Space-Time Compression. Urban Plan. Transp. Res. 2025, 13, 2482831. [Google Scholar] [CrossRef]
  21. Alshamaila, Y.; Papagiannidis, S.; Alsawalqah, H.; Aljarah, I. Effective Use of Smart Cities in Crisis Cases: A Systematic Review of the Literature. Int. J. Disaster Risk Reduct. 2023, 85, 103521. [Google Scholar] [CrossRef]
  22. AlDairi, A.; Tawalbeh, L. Cyber Security Attacks on Smart Cities and Associated Mobile Technologies. Procedia Comput. Sci. 2017, 109, 1086–1091. [Google Scholar] [CrossRef]
  23. Caragliu, A.; Del Bo, C.F. Smart Cities and the Urban Digital Divide. Npj Urban Sustain. 2023, 3, 43. [Google Scholar] [CrossRef]
  24. Colom, A. The Digital Divide: By Jan van Dijk, Cambridge, Polity Press, 2020, 208 Pp., £17.99 (Paperback), ISBN: 978-1-509-534456. Inf. Commun. Soc. 2020, 23, 1706–1708. [Google Scholar] [CrossRef]
  25. Chen, H.; Su, Z. Role of Smart City for Sustainable Development: Exploring the Nexus among Smart Cities, e-Governance and Environmental Development. Int. J. Electron. Bus. 2024, 19, 255–270. [Google Scholar] [CrossRef]
  26. Russo, F.; Rindone, C. Smart City for Sustainable Development: Applied Processes from SUMP to MaaS at European Level. Appl. Sci. 2023, 13, 1773. [Google Scholar] [CrossRef]
  27. Lukasiewicz, A.; Świtała, M.; Kamińska, E.; Regulska, K. Sustainable Urban Mobility and MaaS Implementation—Selected European and Polish Case. Studies 2023, 22, 225–241. Available online: https://www.rabdim.pl/index.php/rb/article/view/v22n3p225 (accessed on 26 June 2025).
  28. Babar, M.; Arif, F. Smart Urban Planning Using Big Data Analytics to Contend with the Interoperability in Internet of Things. Future Gener. Comput. Syst. 2017, 77, 397–402. [Google Scholar] [CrossRef]
  29. Yu, S.; Liu, C.; Li, M. Study of Intelligent Home Environment System Based on Big Data and Improved K-Means Algorithm. Sci. Rep. 2025, 15, 5743. [Google Scholar] [CrossRef]
  30. Gajdosik, T. Big Data Analytics in Smart Tourism Destinations. A New Tool for Destination Management Organizations? In Proceedings of the Smart Tourism as a Driver for Culture and Sustainability: Fifth International Conference IACuDiT 2019, Athens, Greece, 28–30 June 2018; pp. 15–33, ISBN 978-3-662-55702-0. [Google Scholar]
  31. Nguyen, H.; Nguyen, P.; Bui, V. Applications of Big Data Analytics in Traffic Management in Intelligent Transportation Systems. JOIV Int. J. Inform. Vis. 2022, 6, 177. [Google Scholar] [CrossRef]
  32. Huang, B.; Wang, J. Big Spatial Data for Urban and Environmental Sustainability. Geo-Spat. Inf. Sci. 2020, 23, 125–140. [Google Scholar] [CrossRef]
  33. Domenteanu, A.; Delcea, C.; Florescu, M.-S.; Gherai, D.S.; Bugnar, N.; Cotfas, L.-A. United in Green: A Bibliometric Exploration of Renewable Energy Communities. Electronics 2024, 13, 3312. [Google Scholar] [CrossRef]
  34. Sandu, A.; Cotfas, L.-A.; Delcea, C.; Crăciun, L.; Molănescu, A.G. Sentiment Analysis in the Age of COVID-19: A Bibliometric Perspective. Information 2023, 14, 659. [Google Scholar] [CrossRef]
  35. Sandu, A.; Cotfas, L.-A.; Stanescu, A.; Delcea, C. Guiding Urban Decision-Making: A Study on Recommender Systems in Smart Cities. Electronics 2024, 13, 2151. [Google Scholar] [CrossRef]
  36. Sandu, A.; Ioanăș, I.; Delcea, C.; Geantă, L.-M.; Cotfas, L.-A. Mapping the Landscape of Misinformation Detection: A Bibliometric Approach. Information 2024, 15, 60. [Google Scholar] [CrossRef]
  37. WoS Web of Science. Available online: www.webofknowledge.com (accessed on 9 September 2023).
  38. Oprea, S.-V.; Bâra, A. Generative Literature Analysis on the Rise of Prosumers and Their Influence on the Sustainable Energy Transition. Util. Policy 2024, 90, 101799. [Google Scholar] [CrossRef]
  39. Yu, J.; Muñoz-Justicia, J. A Bibliometric Overview of Twitter-Related Studies Indexed in Web of Science. Future Internet 2020, 12, 91. [Google Scholar] [CrossRef]
  40. Cibu, B.; Delcea, C.; Domenteanu, A.; Dumitrescu, G. Mapping the Evolution of Cybernetics: A Bibliometric Perspective. Computers 2023, 12, 237. [Google Scholar] [CrossRef]
  41. Ravšelj, D.; Umek, L.; Todorovski, L.; Aristovnik, A. A Review of Digital Era Governance Research in the First Two Decades: A Bibliometric Study. Future Internet 2022, 14, 126. [Google Scholar] [CrossRef]
  42. Cotfas, L.-A.; Sandu, A.; Delcea, C.; Diaconu, P.; Frăsineanu, C.; Stănescu, A. From Transformers to ChatGPT: An Analysis of Large Language Models Research. IEEE Access 2025, 13, 146889–146931. [Google Scholar] [CrossRef]
  43. Delcea, C.; Domenteanu, A.; Ioanăș, C.; Vargas, V.M.; Ciucu-Durnoi, A.N. Quantifying Neutrosophic Research: A Bibliometric Study. Axioms 2023, 12, 1083. [Google Scholar] [CrossRef]
  44. Cobo, M.J.; Martínez, M.A.; Gutiérrez-Salcedo, M.; Fujita, H.; Herrera-Viedma, E. 25 years at Knowledge-Based Systems: A Bibliometric Analysis. Knowl.-Based Syst. 2015, 80, 3–13. [Google Scholar] [CrossRef]
  45. Bakır, M.; Özdemir, E.; Akan, Ş.; Atalık, Ö. A Bibliometric Analysis of Airport Service Quality. J. Air Transp. Manag. 2022, 104, 102273. [Google Scholar] [CrossRef]
  46. Singh, V.K.; Singh, P.; Karmakar, M.; Leta, J.; Mayr, P. The Journal Coverage of Web of Science, Scopus and Dimensions: A Comparative Analysis. Scientometrics 2021, 126, 5113–5142. [Google Scholar] [CrossRef]
  47. Liu, W. The Data Source of This Study Is Web of Science Core Collection? Not Enough. Scientometrics 2019, 121, 1815–1824. [Google Scholar] [CrossRef]
  48. Liu, F. Retrieval Strategy and Possible Explanations for the Abnormal Growth of Research Publications: Re-Evaluating a Bibliometric Analysis of Climate Change. Scientometrics 2023, 128, 853–859. [Google Scholar] [CrossRef]
  49. Medina Benini, S.; Silva, A.; Aparecida Rombi de Godoy, J.; Angelo, P. Smart Cities for Urban Planning: A Bibliometric-Conceptual Analysis. Int. J. Bus. Manag. 2024, 19, 92. [Google Scholar] [CrossRef]
  50. Korada, L. Unlocking Urban Futures: The Role Of Big Data Analytics And AI In Urban Planning -A Systematic Literature Review And Bibliometric Insight. Migr. Lett. 2021, 18, 775–795. [Google Scholar]
  51. Kousis, A.; Tjortjis, C. Data Mining Algorithms for Smart Cities: A Bibliometric Analysis. Algorithms 2021, 14, 242. [Google Scholar] [CrossRef]
  52. Liu, Z.; Pan, D.; Zhong, J.; Huang, H. Big Data and Data Mining Technologies Driving Smart City Construction: A Bibliometrics Study from 2014 to 2024. In Proceedings of the 2024 4th International Conference on Computational Modeling, Simulation and Data Analysis, Hangzhou, China, 6–8 December 2024; Association for Computing Machinery: New York, NY, USA, 2025; pp. 95–100. [Google Scholar]
  53. Niu, H.; Silva, E.A. Crowdsourced Data Mining for Urban Activity: Review of Data Sources, Applications, and Methods. J. Urban Plan. Dev. 2020, 146, 04020007. [Google Scholar] [CrossRef]
  54. Fatma, N.; Haleem, A. Exploring the Nexus of Eco-Innovation and Sustainable Development: A Bibliometric Review and Analysis. Sustainability 2023, 15, 12281. [Google Scholar] [CrossRef]
  55. Gorski, A.-T.; Ranf, E.-D.; Badea, D.; Halmaghi, E.-E.; Gorski, H. Education for Sustainability—Some Bibliometric Insights. Sustainability 2023, 15, 14916. [Google Scholar] [CrossRef]
  56. Stefanis, C.; Giorgi, E.; Tselemponis, G.; Voidarou, C. Terroir in View of Bibliometric. Stats 2023, 6, 956–979. [Google Scholar] [CrossRef]
  57. Domenteanu, A.; Diaconu, P.; Delcea, C. Bibliometric Insights into Time Series Forecasting and AI Research: Growth, Impact, and Future Directions. Appl. Sci. 2025, 15, 6221. [Google Scholar] [CrossRef]
  58. Crăciun, M.A.; Domenteanu, A.; Dudian, M.; Delcea, C. Navigating Sustainability: A Bibliometric Exploration of Environmental Decision-Making and Behavioral Shifts. Sustainability 2025, 17, 2646. [Google Scholar] [CrossRef]
  59. Domenteanu, A.; Cotfas, L.-A.; Diaconu, P.; Tudor, G.-A.; Delcea, C. AI on Wheels: Bibliometric Approach to Mapping of Research on Machine Learning and Deep Learning in Electric Vehicles. Electronics 2025, 14, 378. [Google Scholar] [CrossRef]
  60. Page, M.J.; McKenzie, J.E.; Bossuyt, P.M.; Boutron, I.; Hoffmann, T.C.; Mulrow, C.D.; Shamseer, L.; Tetzlaff, J.M.; Akl, E.A.; Brennan, S.E.; et al. The PRISMA 2020 Statement: An Updated Guideline for Reporting Systematic Reviews. BMJ 2021, 372, n71. [Google Scholar] [CrossRef]
  61. WoS Document Types. Available online: https://webofscience.help.clarivate.com/en-us/Content/document-types.html (accessed on 26 June 2025).
  62. Donner, P. Document Type Assignment Accuracy in the Journal Citation Index Data of Web of Science. Scientometrics 2017, 113, 219–236. [Google Scholar] [CrossRef]
  63. Shamseer, L.; Moher, D.; Clarke, M.; Ghersi, D.; Liberati, A.; Petticrew, M.; Shekelle, P.; Stewart, L.A.; Prisma-P Group. Preferred Reporting Items for Systematic Review and Meta-Analysis Protocols (PRISMA-P) 2015: Elaboration and Explanation. BMJ 2015, 349, g7647. [Google Scholar] [CrossRef] [PubMed]
  64. Aria, M.; Cuccurullo, C. Bibliometrix: An R-Tool for Comprehensive Science Mapping Analysis. J. Informetr. 2017, 11, 959–975. [Google Scholar] [CrossRef]
  65. Profiroiu, M.; Cibu, B.; Delcea, C.; Cotfas, L.-A. Charting the Course of School Dropout Research: A Bibliometric Exploration. IEEE Access 2024, 12, 71453–71478. [Google Scholar] [CrossRef]
  66. Crețu, R.F.; Țuțui, D.; Banta, V.-C.; Șerban, E.C.; Barna, L.-E.-L.; Crețu, R.-C. Effects of Artificial Intelligence-Based Technologies Implementation on the Skills Needed in the Automotive Industry a Bibliometric Analysis. Amfiteatru Econ. 2024, 26, 801–816. [Google Scholar] [CrossRef]
  67. Delcea, C. Grey Systems Theory in Economics—Bibliometric Analysis and Applications’ Overview. Grey Syst. Theory Appl. 2015, 5, 244–262. [Google Scholar] [CrossRef]
  68. Sandu, A.; Ioanăș, I.; Delcea, C.; Florescu, M.-S.; Cotfas, L.-A. Numbers Do Not Lie: A Bibliometric Examination of Machine Learning Techniques in Fake News Research. Algorithms 2024, 17, 70. [Google Scholar] [CrossRef]
  69. Řehůřek, R.; Sojka, P. Software Framework for Topic Modelling with Large Corpora; University of Malta: Msida, Malta, 2010. [Google Scholar] [CrossRef]
  70. Pedregosa, F.; Varoquaux, G.; Gramfort, A.; Michel, V.; Thirion, B.; Grisel, O.; Blondel, M.; Prettenhofer, P.; Weiss, R.; Dubourg, V.; et al. Scikit-Learn: Machine Learning in Python. J. Mach. Learn. Res. 2011, 12, 2825–2830. [Google Scholar]
  71. Grootendorst, M. BERTopic: Neural Topic Modeling with a Class-Based TF-IDF Procedure. arXiv 2022, arXiv:2203.05794. [Google Scholar]
  72. Zhang, J.; Yu, Q.; Zheng, F.; Long, C.; Lu, Z.; Duan, Z. Comparing Keywords plus of WOS and Author Keywords: A Case Study of Patient Adherence Research. J. Assoc. Inf. Sci. Technol. 2016, 67, 967–972. [Google Scholar] [CrossRef]
  73. Alabi, G. Bradford’s Law and Its Application. Int. Libr. Rev. 1979, 11, 151–158. [Google Scholar] [CrossRef]
  74. Hirsch, J.E. An Index to Quantify an Individual’s Scientific Research Output. Proc. Natl. Acad. Sci. USA 2005, 102, 16569–16572. [Google Scholar] [CrossRef]
  75. Newby, G.B.; Greenberg, J.; Jones, P. Open Source Software Development and Lotka’s Law: Bibliometric Patterns in Programming. J. Am. Soc. Inf. Sci. Technol. 2003, 54, 169–178. [Google Scholar] [CrossRef]
  76. Silva, B.N.; Khan, M.; Han, K. Integration of Big Data Analytics Embedded Smart City Architecture with RESTful Web of Things for Efficient Service Provision and Energy Management. Future Gener. Comput. Syst. 2020, 107, 975–987. [Google Scholar] [CrossRef]
  77. Babar, M.; Khattak, A.S.; Jan, M.A.; Tariq, M.U. Energy Aware Smart City Management System Using Data Analytics and Internet of Things. Sustain. Energy Technol. Assess. 2021, 44, 100992. [Google Scholar] [CrossRef]
  78. Ariyaluran Habeeb, R.A.; Nasaruddin, F.; Gani, A.; Targio Hashem, I.A.; Ahmed, E.; Imran, M. Real-Time Big Data Processing for Anomaly Detection: A Survey. Int. J. Inf. Manag. 2019, 45, 289–307. [Google Scholar] [CrossRef]
  79. Rathore, M.M.; Paul, A.; Hong, W.-H.; Seo, H.; Awan, I.; Saeed, S. Exploiting IoT and Big Data Analytics: Defining Smart Digital City Using Real-Time Urban Data. Sustain. Cities Soc. 2018, 40, 600–610. [Google Scholar] [CrossRef]
  80. Saqib, M.; Khan, F.Z.; Ahmed, M.; Mehmood, R.M. A Critical Review on Security Approaches to Software-Defined Wireless Sensor Networking. Int. J. Distrib. Sens. Netw. 2019, 15, 155014771988990. [Google Scholar] [CrossRef]
  81. Yang, X.; Sitharan, R.; Sharji, E.A.; Feng, H. Exploring the Integration of Big Data Analytics in Landscape Visualization and Interaction Design. Soft Comput. 2024, 28, 1971–1988. [Google Scholar] [CrossRef]
  82. Bibri, S.E. The IoT for Smart Sustainable Cities of the Future: An Analytical Framework for Sensor-Based Big Data Applications for Environmental Sustainability. Sustain. Cities Soc. 2018, 38, 230–253. [Google Scholar] [CrossRef]
  83. Hashem, I.A.T.; Chang, V.; Anuar, N.B.; Adewole, K.; Yaqoob, I.; Gani, A.; Ahmed, E.; Chiroma, H. The Role of Big Data in Smart City. Int. J. Inf. Manag. 2016, 36, 748–758. [Google Scholar] [CrossRef]
  84. Sun, Y.; Song, H.; Jara, A.J.; Bie, R. Internet of Things and Big Data Analytics for Smart and Connected Communities. IEEE Access 2016, 4, 766–773. [Google Scholar] [CrossRef]
  85. Rathore, M.M.; Ahmad, A.; Paul, A.; Rho, S. Urban Planning and Building Smart Cities Based on the Internet of Things Using Big Data Analytics. Comput. Netw. 2016, 101, 63–80. [Google Scholar] [CrossRef]
  86. Marjani, M.; Nasaruddin, F.; Gani, A.; Karim, A.; Hashem, I.A.; Siddiqa, A.; Yaqoob, I. Big IoT Data Analytics: Architecture, Opportunities, and Open Research Challenges. IEEE Access 2017, 5, 5247–5261. [Google Scholar] [CrossRef]
  87. Porambage, P.; Okwuibe, J.; Liyanage, M.; Ylianttila, M.; Taleb, T. Survey on Multi-Access Edge Computing for Internet of Things Realization. IEEE Commun. Surv. Tutor. 2018, 20, 2961–2991. [Google Scholar] [CrossRef]
  88. Huang, C.-J.; Kuo, P.-H. A Deep CNN-LSTM Model for Particulate Matter (PM2.5) Forecasting in Smart Cities. Sensors 2018, 18, 2220. [Google Scholar] [CrossRef]
  89. Al Nuaimi, E.; Al Neyadi, H.; Mohamed, N.; Al-Jaroodi, J. Applications of Big Data to Smart Cities. J. Internet Serv. Appl. 2015, 6, 25. [Google Scholar] [CrossRef]
  90. Mehmood, Y.; Ahmad, F.; Yaqoob, I.; Adnane, A.; Imran, M.; Guizani, S. Guizani Internet-of-Things-Based Smart Cities: Recent Advances and Challenges. IEEE Commun. Mag. 2017, 55, 16–24. [Google Scholar] [CrossRef]
  91. Ahmed, E.; Yaqoob, I.; Hashem, I.A.T.; Khan, I.; Ahmed, A.I.A.; Imran, M.; Vasilakos, A.V. The Role of Big Data Analytics in Internet of Things. Comput. Netw. 2017, 129, 459–471. [Google Scholar] [CrossRef]
  92. Lv, Y.; Ma, C.; Li, X.; Wu, M. Big Data Driven COVID-19 Pandemic Crisis Management: Potential Approach for Global Health. Arch. Med. Sci. 2021, 17, 829–837. [Google Scholar] [CrossRef] [PubMed]
  93. Alsunaidi, S.J.; Almuhaideb, A.M.; Ibrahim, N.M.; Shaikh, F.S.; Alqudaihi, K.S.; Alhaidari, F.A.; Khan, I.U.; Aslam, N.; Alshahrani, M.S. Applications of Big Data Analytics to Control COVID-19 Pandemic. Sensors 2021, 21, 2282. [Google Scholar] [CrossRef]
  94. Bagane, P.; Mehta, N.; Parth, K.; Nisarg, B.; Sahni, I.; Kotrappa, S. Bibliometric Survey for Stock Market Prediction Using Sentimental Analysis and LSTM. Libr. Philos. Pract. E-J. 2021, 5335. Available online: https://digitalcommons.unl.edu/libphilprac/5335 (accessed on 26 June 2025).
  95. Sandu, A.; Diaconu, P.; Delcea, C.; Domenteanu, A. Emphasizing Grey Systems Contribution to Decision-Making Field Under Uncertainty: A Global Bibliometric Exploration. Mathematics 2025, 13, 1278. [Google Scholar] [CrossRef]
  96. Petcu, M.A.; Ionescu-Feleaga, L.; Ionescu, B.-Ș.; Moise, D.-F. A Decade for the Mathematics: Bibliometric Analysis of Mathematical Modeling in Economics, Ecology, and Environment. Mathematics 2023, 11, 365. [Google Scholar] [CrossRef]
  97. Kumar, S.; Patil, R.R.; Kumawat, V.; Rai, Y.; Krishnan, N. A Bibliometric Analysis of Plant Disease Classifification with Artifificial Intelligence Using Convolutional Neural Network. Libr. Philos. Pract. E-J. 2021. Available online: https://digitalcommons.unl.edu/libphilprac/5777 (accessed on 26 June 2025).
  98. Harnal, S.; Sharma, G.; Malik, S.; Kaur, G.; Khurana, S.; Kaur, P.; Simaiya, S.; Bagga, D. Bibliometric Mapping of Trends, Applications and Challenges of Artificial Intelligence in Smart Cities. ICST Trans. Scalable Inf. Syst. 2022, 9, e76. [Google Scholar] [CrossRef]
  99. Guo, Y.-M.; Huang, Z.-L.; Guo, J.; Li, H.; Guo, X.-R.; Nkeli, M.J. Bibliometric Analysis on Smart Cities Research. Sustainability 2019, 11, 3606. [Google Scholar] [CrossRef]
  100. Michailidis, P. Visualizing Social Media Research in the Age of COVID-19. Information 2022, 13, 372. [Google Scholar] [CrossRef]
  101. Puteh, N.; Ali bin Saip, M.; Husin, M.Z.; Hussain, A. Sentiment Analysis with Deep Learning: A Bibliometric Review. Turk. J. Comput. Math. Educ. 2021, 12, 1509–1519. [Google Scholar]
  102. Mahajan, R.; Gupta, P. A Bibliometric Analysis On The Dissemination Of COVID-19 Vaccine Misinformation On Social Media. J. Content Community Commun. 2021, 14, 218–229. [Google Scholar] [CrossRef]
  103. Shaheen, S.A.; Cohen, A.P. Carsharing and Personal Vehicle Services: Worldwide Market Developments and Emerging Trends. Int. J. Sustain. Transp. 2013, 7, 5–34. [Google Scholar] [CrossRef]
  104. Müller-Eie, D.; Kosmidis, I. Sustainable Mobility in Smart Cities: A Document Study of Mobility Initiatives of Mid-Sized Nordic Smart Cities. Eur. Transp. Res. Rev. 2023, 15, 36. [Google Scholar] [CrossRef]
  105. Brcic, D.; Slavulj, M.; Šojat, D.; Jurak, J. The Role of Smart Mobility in Smart Cities. In Proceedings of the Fifth International Conference on Road and Rail Infrastructure (CETRA 2018), Zadar, Croatia, 17–19 May 2018; p. 1606. [Google Scholar]
  106. Chen, G.; Zhang, J. wan Intelligent Transportation Systems: Machine Learning Approaches for Urban Mobility in Smart Cities. Sustain. Cities Soc. 2024, 107, 105369. [Google Scholar] [CrossRef]
  107. Quazi, F.; Mehta, R.; Gorrepati, N.; Abdul Kareem, S. Healthcare in Smart Cities—Creating a Sustainable Urban Environment. Int. J. Glob. Innov. Solut. IJGIS 2024. [Google Scholar] [CrossRef]
  108. Clim, A.; Zota, R.; Constantinescu, R.; Ilie-Nemedi, I. Health Services in Smart Cities: Choosing the Big Data Mining Based Decision Support. Int. J. Healthc. Manag. 2020, 13, 79–87. [Google Scholar] [CrossRef]
  109. Hassankhani, M.; Alidadi, M.; Sharifi, A.; Azhdari, A. Smart City and Crisis Management: Lessons for the COVID-19 Pandemic. Int. J. Environ. Res. Public. Health 2021, 18, 7736. [Google Scholar] [CrossRef]
  110. Escobar, S.D.; Hall, C.M. Integrating Smart Cities and Tourism Systems: A Critical Review. Int. J. Public Sect. Manag. 2024, 38, 196–212. [Google Scholar] [CrossRef]
  111. Marín Díaz, G.; Galdón Salvador, J.L.; Galán Hernández, J.J. Smart Cities and Citizen Adoption: Exploring Tourist Digital Maturity for Personalizing Recommendations. Electronics 2023, 12, 3395. [Google Scholar] [CrossRef]
  112. Ivars-Baidal, J.A.; Celdrán-Bernabeu, M.A.; Femenia-Serra, F.; Perles-Ribes, J.F.; Vera-Rebollo, J.F. Smart City and Smart Destination Planning: Examining Instruments and Perceived Impacts in Spain. Cities 2023, 137, 104266. [Google Scholar] [CrossRef]
  113. Dimitrova, V.; Nikolov, N.; Gospodinov, T. Education in the Era of Smart Cities: Transformation and Opportunities. In Proceedings of the International Scientific and Practical Conference 2024, Copenhagen, Denmark, 10–13 September 2024; Volume II, p. 357. [Google Scholar]
  114. Clarinval, A.; Simonofski, A.; Henry, J.; Vanderose, B.; Dumas, B. Introducing the Smart City to Children: Lessons Learned from Hands-On Workshops in Classes. Sustainability 2023, 15, 1774. [Google Scholar] [CrossRef]
  115. Molnar, A. Smart Cities Education: An Insight into Existing Drawbacks. Telemat. Inform. 2021, 57, 101509. [Google Scholar] [CrossRef]
  116. Ismagilova, E.; Hughes, L.; Rana, N.; Dwivedi, Y. Security, Privacy and Risks Within Smart Cities: Literature Review and Development of a Smart City Interaction Framework. Inf. Syst. Front. 2022, 24, 393–414. [Google Scholar] [CrossRef] [PubMed]
  117. Houichi, M.; Jaidi, F.; Bouhoula, A. Cyber Security within Smart Cities: A Comprehensive Study and a Novel Intrusion Detection-Based Approach. Comput. Mater. Contin. 2024, 81, 393–441. [Google Scholar] [CrossRef]
  118. Almeida, F. Prospects of Cybersecurity in Smart Cities. Future Internet 2023, 15, 285. [Google Scholar] [CrossRef]
  119. Sandu, A.; Cotfas, L.-A.; Stanescu, A.; Delcea, C. A Bibliometric Analysis of Text Mining: Exploring the Use of Natural Language Processing in Social Media Research. Appl. Sci. 2024, 14, 3144. [Google Scholar] [CrossRef]
  120. Domenteanu, A.; Delcea, C.; Chirita, N.; Ioanăș, C. From Data to Insights: A Bibliometric Assessment of Agent-Based Modeling Applications in Transportation. Appl. Sci. 2023, 13, 12693. [Google Scholar] [CrossRef]
Figure 1. Analysis steps.
Systems 13 00780 g001
Figure 3. Bibliometric analysis facets.
Systems 13 00780 g003
Figure 4. Annual scientific production evolution.
Systems 13 00780 g004
Figure 5. Annual average article citations per year evolution.
Systems 13 00780 g005
Figure 6. Top eight most relevant journals.
Systems 13 00780 g006
Figure 7. Bradford’s law on source clustering.
Systems 13 00780 g007
Figure 8. Journals’ impact based on H-index.
Systems 13 00780 g008
Figure 9. Journals’ growth (cumulative) based on the number of papers.
Systems 13 00780 g009
Figure 10. Top nine authors based on number of documents.
Systems 13 00780 g010
Figure 11. Top nine authors’ production over time.
Systems 13 00780 g011
Figure 12. Author productivity based on Lotka’s Law.
Systems 13 00780 g012
Figure 13. Authors’ Local Impact based on H-index.
Systems 13 00780 g013
Figure 14. Top seven most relevant affiliations.
Systems 13 00780 g014
Figure 15. Top 10 most relevant corresponding author’s country.
Systems 13 00780 g015
Figure 16. Countries’ production over time.
Systems 13 00780 g016
Figure 17. Scientific production based on country.
Systems 13 00780 g017
Figure 18. Top 10 countries with the most citations.
Systems 13 00780 g018
Figure 19. Country collaboration map in Biblioshiny.
Systems 13 00780 g019
Figure 20. Country collaboration map in VOSviewer 1.6.20.
Systems 13 00780 g020
Figure 21. Top 43 authors collaboration network in Biblioshiny 4.2.1.
Systems 13 00780 g021
Figure 22. Top 43 authors collaboration network in CiteSpace 6.3.R1.
Systems 13 00780 g022
Figure 23. Top 10 most frequent words in keywords plus.
Systems 13 00780 g023
Figure 24. Top 10 most frequent words in authors’ keywords.
Systems 13 00780 g024
Figure 25. Top 50 words based on keywords plus (A) and authors’ keywords (B).
Systems 13 00780 g025
Figure 26. Top 10 most frequent bigrams in abstracts and titles.
Systems 13 00780 g026
Figure 27. Top 10 most frequent trigrams in abstracts and titles.
Systems 13 00780 g027
Figure 28. Co-occurrence network for the terms in author’s keywords in Biblioshiny 4.2.1.
Systems 13 00780 g028
Figure 29. Co-occurrence network for the terms in author’s keywords in VOSviewer 1.6.20.
Systems 13 00780 g029
Figure 30. Co-occurrence network for the terms in author’s keywords in CiteSpace.
Systems 13 00780 g030
Figure 31. Thematic map based on author’s keywords.
Systems 13 00780 g031
Figure 32. LDA Topic One composition.
Systems 13 00780 g032
Figure 33. LDA Topic Two composition.
Systems 13 00780 g033
Figure 34. LDA Topic Three composition.
Systems 13 00780 g034
Figure 35. BERTopic results.
Systems 13 00780 g035
Figure 36. BERTopic composition.
Systems 13 00780 g036
Figure 37. Three-fields plot: countries (left), authors (middle), journals (right).
Systems 13 00780 g037
Figure 38. Three-fields plot: affiliations (left), authors (middle), keywords (right).
Systems 13 00780 g038
Figure 39. Top 10 trigrams in titles—various regions datasets.
Systems 13 00780 g039
Figure 40. Thematic map based on authors’ keywords—Asia dataset.
Systems 13 00780 g040
Figure 41. Thematic map based on authors’ keywords—Europe dataset.
Systems 13 00780 g041
Figure 42. Thematic map based on authors’ keywords—America dataset.
Systems 13 00780 g042
Table 1. Data selection steps.
Exploration StepsFilters on Web of ScienceDescriptionQueryQuery NumberCount
1Title/Abstract/Author’s KeywordsContains specific keywords related to smart cities(((((TI = (smart_city)) OR TI = (smart_cities)) OR AB = (smart_city)) OR AB = (smart_cities)) OR AK = (smart_city)) OR AK = (smart_cities)#130,579
2Title/Abstract/Author’s KeywordsContains specific keywords related to urban planning(((TI = (urban_plan*)) OR AB = (urban_plan*)) OR AK = (urban_plan*))#239,671
3Title/Abstract/Author’s KeywordsContains specific keywords related to smart cities or urban planning#1 OR #2#368,898
4Title/Abstract/Author’s KeywordsContains specific keywords related to big data analytics((TI = (big_data_analytic*)) OR AB = (big_data_analytic*)) OR AK = (big_data_analytic*)#49764
5Title/Abstract/Author’s KeywordsContains specific keywords related to smart cities or urban planning and big data analytics#3 AND #4#5380
6LanguageLimit to English(#3) AND LA = (English)#6380
7Document TypeLimit to Article(#4) AND DT = (Article)#7215
8Year publishedExclude 2025(#5) NOT PY = (2025)#8203
9 Manual selection of the papers by eliminating the early works not related to smart cities #9191
Table 4. Alignment between LDA and BERTopic results.
LDA ResultsMain ThemeCorresponding BERTopic ResultsRelevant Keywords in BERTopic
LDA Topic 1Smart cities, urban management, IoT, big data analytics, transportationBERTopic 0—Urban and sustainable citiesurban, sustainable, city, framework, smart
BERTopic 1—Smart IoT architecturessmart, IoT, architecture, services, management
BERTopic 3—Intelligent transportation systemstraffic, intelligent, road, vehicle, transportation
LDA Topic 2Technological implementation, security, anomaly detection, ML, forecastingBERTopic 2—Machine learning applicationsmachine learning, dataset, methods, accuracy, diseases
BERTopic 4—Security and blockchain-based solutionssecurity, blockchain, authentication, IoT
BERTopic 5—IoT analytics and privacyIoT, analytics, privacy, cognitive, techniques
LDA Topic 3Governance, public health, innovationBERTopic 2—Machine learning applicationshealth, diseases, dataset, predictive, learning
Disclaimer/Publisher’s Note: The statements, opinions and data contained in all publications are solely those of the individual author(s) and contributor(s) and not of MDPI and/or the editor(s). MDPI and/or the editor(s) disclaim responsibility for any injury to people or property resulting from any ideas, methods, instructions or products referred to in the content.