Abstract
Parking management and operation represent a major challenge for both users and administrators, who seek to ensure efficient utilization, accommodate as many demands as possible, and reduce maintenance costs. This paper presents a theoretical model for an integrated IT system designed for parking management and administration. The modeling process involved designing a parking facility using the AutoCAD Vehicle Tracking v25.00.2775 software package, in accordance with current design standards. To simulate system operation, a dedicated Python v2025.12.0 program was developed to assign parking spaces to arriving vehicles based on specific allocation criteria. Three allocation strategies were applied: random allocation, allocation aimed at minimizing the driving distance within the parking lot, and allocation aimed at reducing the walking distance from the assigned space to the destination. The simulation results show that, in the absence of allocation criteria, parking spaces are utilized in a quasi-uniform manner. The calculated values of variance and standard deviation are significantly lower in this case, increasing as allocation restrictions are introduced, but then returning to reduced values as the occupancy rate grows, since under intensive use the potential for controlled allocation decreases. The relationship between the number of allocations of each parking space and the applied allocation strategies was examined using Pearson and Spearman correlation coefficients. The results reveal a direct linear dependence under moderate demand and an inverse dependence under high demand—patterns consistent with situations observed in practice. The proposed software application provides a practical tool for effective parking management, contributing to the rational use of parking spaces, reduced travel distances within the facility, lower fuel consumption, and consequently, reduced pollution.
1. Introduction
Parking, particularly for passenger cars, is an essential component of the transportation system. It plays a significant role in traffic planning, with the potential to either encourage or discourage transport demand. Parking involves considerable social costs, and its capacity planning, location, and management represent a complex issue for both transport planners and public authorities [1]. In the absence of appropriately dimensioned and efficiently managed parking facilities, vehicles tend to park along the roadway, resulting in the occupation of the curbside lane and a consequent reduction in the effective number and width of traffic lanes. This situation has major implications for traffic flow and network performance. In many cases, parking infrastructure is either insufficient or mismanaged, compelling drivers to travel additional distances in search of an available parking slot [2,3]. Parking accessibility and the satisfaction of the driver are major concerns when it comes to the development of smart cities [4]. This has led to an increase in traffic congestion, a decrease in zone accessibility and parking spaces, and the need for specific measures to estimate accessibility [5].
When properly implemented, parking management can significantly reduce the number of parking slots required in a given area while providing a range of economic, social, and environmental benefits [6]. Parking management can be categorized into on-site and area-wide management. This study focuses on on-site management, which addresses how a single parking facility can be administered in order to maximize benefits and ensure the rational use of parking slots. Area-wide management refers to the coordination of multiple parking facilities within a specific zone and the allocation of vehicles based on various criteria—such as the minimum travel distance to the assigned facility, search costs, fuel consumption, or the number of vehicle occupants [7,8,9,10,11]. As a result, traffic intensity in the area is reduced, contributing to the mitigation of congestion—an issue that increasingly absorbs substantial community resources, both economic and environmental [12]. It is estimated that approximately 30% of traffic congestion in central urban areas is caused by vehicles searching for a parking slot, with the average search time being around 7 to 8 min [13,14].
In 2024, TomTom, a company specializing in traffic coordination systems and traffic analysis [15], conducted a study on congestion levels in 500 cities across 62 countries worldwide, including 254 cities from Europe. According to this analysis, Bucharest ranked first in Europe in terms of congestion levels, and fifth globally, with a congestion level of 48% (compared to 55% in 2023, 52% in 2020, and 41% in 2015). Bucharest was followed by Plovdiv (Bulgaria), Łódź (Poland), Dublin (Ireland)—each also reporting a 48% congestion level—and Hull (United Kingdom) with 46%. In this ranking, the top three cities share the same congestion level, with their positions differentiated based on additional traffic quality criteria. It is notable that between 2015 and 2023, the congestion level in Bucharest increased steadily, while in 2024, a decrease was recorded. However, despite this reduction, Bucharest remains first in the European ranking, whereas in previous years it occupied fifth place. This suggests that other cities have managed to reduce traffic congestion more effectively than the public administration in Bucharest.
With the widespread implementation of the smart city model across urban areas, a range of intelligent digital solutions has been developed. Among these, smart parking systems stand out by integrating advanced technologies with human-centered innovation, aiming to optimize resource utilization and reduce the consumption of non-renewable energy sources [16,17,18]. As a result, urban areas can benefit from faster, more convenient, and higher-density vehicle parking, ensuring that each parking slot is utilized efficiently. Ultimately, smart parking systems are expected to contribute to more effective urban management, leading to reduced traffic congestion and lower parking operation and management costs [19,20].
Smart parking systems contribute to positive changes for various urban stakeholders by reducing the incidence of traffic accidents, particularly those caused by driver inattention, as drivers are often distracted while searching for available parking spaces or rushing to occupy vacant ones [21,22]. The use of parking applications on mobile devices enables the localization and advanced reservation of parking spaces, eliminating the need for drivers to rush in search of an available spot. In addition to assisting drivers, smart parking systems are also expected to support parking operators and facility owners in maximizing the utilization of available space and resources in a way that increases revenue while enhancing the overall parking experience for their customers [23]. The use of smart parking systems enables administrators to implement dynamic pricing strategies based on real-time occupancy levels. Consequently, these systems provide both economic and operational benefits for parking facility owners, local authorities, and end users [24].
Overall, the literature underscores the need for integrative approaches that balance algorithmic efficiency with infrastructural constraints and user diversity. Moreover, the system’s performance under peak visitor demand or in socioeconomically mixed districts remains unexplored.
Based on these considerations, the research team developed a fully original integrated IT system for simulating the allocation of parking spaces. The allocation is dynamic in both time and space, and is performed according to several parameters, such as the following: assigning a space so that the driving distance within the parking lot is minimized; assigning a space so that both the driving distance within the lot and the walking distance from the parking space to the final destination are minimized; or assigning spaces randomly so that demand across parking areas is evenly distributed. The simulation model was implemented in a Python v2025.12.0 programming environment for a large-scale parking lot and a fleet of 500 vehicles. This number can be easily adjusted depending on parking demand intensity. The model is innovative both in terms of its programming environment and its allocation criteria. It was validated through a case study of a large-scale parking lot (1000 m × 510 m) but can be applied to parking facilities of any size and with any space arrangement, in compliance with current design standards. Simulation parameters can be easily modified within the program, which makes this model universally applicable to any parking configuration—unlike other models found in the literature. This flexibility allows parking administrators to adapt their management policies to meet both system demands and user requirements. For each allocation criterion used in the simulation, key operational indicators of the parking facility are evaluated, and conclusions are formulated to ensure that the benefits are maximized for both the administrator and users.
These insights may support improved parking utilization by enabling the implementation of differentiated pricing strategies based on the degree to which the defined parameters are satisfied. In doing so, this study addresses an existing gap in the technical literature on parking systems, which generally focuses on the interaction between traffic flow and parking, or on the relationship between parking demand and the urban areas served by road infrastructure.
This document is structured as follows: in Section 2, the paper delves into the existing research and literature that provides contextual and general evidence on the main issues in urban parking, slot allocation in private parking areas, priority routines and fairness policies, allocation, and reservation systems. Section 3 outlines the design methodology, the spatial configuration, and the analytical tools used to implement a rule-based, criteria-driven distribution of parking spaces, and Section 4 presents the simulation of the parking facility’s operation, with its logical framework and functional description detailed in the previous section. Further, Section 5 succeeds with an analysis of the distribution of parking slot usage, synthesizes the results, and engages in assessing the implications of the observed data. Finally, Section 6 draws conclusions on the automation and digitalization of parking systems and the indirect contribution to improved traffic flows, thus mitigating the negative externalities of road congestion.
2. Literature Review
2.1. Main Issues in Urban Parking Research
Urban areas frequently face imbalances between parking demand and supply, which manifest either as oversupply—leading to inefficient land use—or as shortages, resulting in traffic congestion caused by “cruising” for parking. Additionally, a spatial and functional mismatch between the type and location of available parking and actual demand further complicates the issue. Addressing this requires adaptive policies, including dynamic pricing mechanisms and zoning regulations [25].
The study of [26] addressed parking congestion through data-driven strategies, including dynamic pricing, infrastructure expansion, and policy interventions. The analysis was limited as it mainly relied on synthetic projections due to uncollected employment/land-use data, and modern solutions of real-time monitoring (e.g., IoT sensors, mobile apps) were not integrated.
A significant body of literature has investigated how drivers select parking based on a combination of factors, including cost, walking distance, expected search time, safety, and trip purpose [27]. These studies often rely on stated preference surveys and discrete choice modeling, though discrepancies between stated and revealed preferences are commonly reported.
User heterogeneity is a central theme, with behavioral differences observed across user groups (e.g., residents vs. visitors, commuters vs. shoppers) [28]. Cao et al. introduced a behavior model based on cumulative prospect theory to capture drivers’ risk attitudes and decision-making biases under uncertainty, particularly focusing on how unreliable cruising times influence choices between on-street and off-street parking [29]. Nevertheless, this approach did not incorporate real-time IoT data (e.g., smart parking sensors) for adaptive decision support.
Rodríguez et al. extended this field by integrating alternative availability and user heterogeneity into a mixed logit framework. Their methodology combined stated preference surveys with discrete choice models—including error component models—to analyze parking behavior. The study accounted for systematic and random taste variation, as well as the correlation between alternatives, offering actionable insights for cities on how pricing policies and arrival times influence parking demand [27].
Smart parking research increasingly emphasizes the use of sensors and mobile applications to reduce search time by guiding drivers to available parking slots [30]. Additional solutions include park-and-ride strategies, which integrate parking with public transit to reduce inner-city traffic volumes [27]. These initiatives are aligned with broader efforts to optimize urban mobility using data-driven parking policies, as highlighted in [25,31]. However, implementation challenges remain—particularly regarding data privacy, infrastructure investment, and user adoption barriers.
Contemporary parking management approaches increasingly shift from supply-side solutions—such as expanding parking stock—to demand-side strategies that focus on optimizing existing capacity. These include policies aimed at improving turnover, efficiency, and support for sustainable urban planning [32].
Shared parking arrangements allow multiple users with different peak usage times to access the same spaces, reducing the overall number of required parking spots and improving land-use efficiency [25].
Time restrictions are another commonly used tool to increase parking space utilization in high-demand zones. Several studies have examined the effectiveness of such policies: Weinberger discussed their influence on driver behavior and parking space utilization [33]; Marsden provided a comprehensive review of parking regulations [34]; Jakobsson explored how time restrictions affect both parking behavior and mode choice [35]; Arnott modeled the impact of parking time limits on traffic congestion and efficiency [36]; and Litman offered practical guidelines for implementation [37].
2.2. Main Issues in Slot Allocation in Private Parking Areas
One of the most persistent challenges in the management of private parking areas lies in how individual slots are allocated. The traditional approach—assigning fixed slots to specific users—remains widespread due to its administrative simplicity and perceived fairness. However, this model often results in inefficiencies, particularly in mixed-use facilities or residential buildings where vehicle ownership varies across households, or where peak usage periods are not aligned. Underutilization of assigned slots during working hours or extended absences is a frequent occurrence [13]. Although such studies highlight the mismatch between allocation and actual demand, there is limited exploration of how user behaviors (e.g., sharing agreements, informal reallocations) influence or mitigate these inefficiencies.
In response, dynamic allocation schemes have emerged as promising alternatives. These models rely on real-time data to assign slots based on current availability, the estimated parking time, or user category. Solutions like the Dy PARK system incorporate dynamic pricing and rematching algorithms to optimize usage under fluctuating demand conditions [38]. However, while simulation outcomes suggest improved slot utilization and user throughput, such results are context-dependent and are rarely validated in operational environments. The Dy PARK model, for instance, assumes broad technological penetration and high user compliance—factors that remain uncertain in many residential settings. This illustrates a broader gap in the literature: the transition from simulation to scalable, user-accepted deployment remains insufficiently addressed.
Several contributions have attempted to formalize parking slot assignment using optimization methods. Genetic algorithms have been employed to reduce search time and on-site traffic congestion in complex facilities like shopping centers [39]. Similarly, Elfaki et al. proposed a constraint optimization model that accounts for parking spot availability, proximity, and priority categories [40]. While these models show computational effectiveness, they frequently assume homogeneity in vehicle types, driver behavior, and infrastructure—assumptions that limit their adaptability to real-world constraints. Moreover, most algorithmic approaches do not include mechanisms for handling social or legal constraints, such as the rights of parking slot holders, parking disputes, or allocation fairness.
Beyond allocation logic, space optimization has received attention as a complementary research stream. Mladenović et al. introduced a scalable dynamic framework that adapts to usage patterns across heterogeneous facilities, and Nakazato et al. explored dynamic pricing to balance demand across time slots [41,42]. These works provide robust mathematical models and emphasize operational scalability. However, a notable limitation is their lack of attention to user-centered outcomes: few studies have analyzed how these models impact user satisfaction, acceptance, or perceptions of fairness—particularly in environments where space is both limited and socially sensitive, such as residential complexes.
Reservation-based systems are often proposed as partial solutions, enabling more predictable parking behavior and reduced internal traffic. Yet even here, critical issues remain. While such systems are effective in structured environments like office buildings or automated garages, their adaptability to legacy infrastructures and informal user cultures is uncertain [43]. Additionally, few studies have addressed the long-term maintenance, system fatigue, or policy implications of relying on automated scheduling, particularly in settings where not all users have equal digital access.
Although some studies have attempted to link technical allocation systems with user preferences—such as through real-time slot suggestions or price-based incentives—there is minimal integration between algorithmic design and behavioral science. This disconnect leaves open critical questions about accessibility, trust, and the actual willingness of users to adapt to dynamic or automated allocation models. As the focus shifts from system performance to user access and fairness, another critical question arises: how should parking be distributed when demand exceeds supply, particularly in residential or mixed-use environments?
2.3. Priority Routine and Fairness Policies
In residential and mixed-use parking environments, slot allocation must address not only operational efficiency but also equity of access, particularly when the parking demand exceeds capacity. Unlike public lots, private and semi-private parking structures often cater to defined user groups (e.g., residents, staff, and visitors), making the perceived fairness of allocation routines a central issue. From an engineering management perspective, fairness policies must be designed to balance utilization efficiency, user satisfaction, and system enforceability under spatial and behavioral constraints.
One of the most intuitive allocation strategies is First-Come-First-Served (FCFS). While widely implemented due to its simplicity and transparency, FCFS does not account for user heterogeneity. In their empirical study on reserved residential parking systems, Yang et al. found that residents tend to perceive FCFS as inequitable when it consistently favors early arrivals—often visitors or commuters—at the expense of long-term tenants. This suggests a key limitation in relying on time-of-arrival alone as an allocation metric in environments with habitual or entitled users. The literature lacks longitudinal studies analyzing how repeated FCFS exposure influences resident satisfaction or informal workarounds (e.g., unofficial slot exchanges) [44].
To address equity concerns, priority-based allocation systems have emerged, often giving preferential access to elderly users, people with disabilities, electric vehicles (EVs), or residents with seniority. Chen et al. developed a comparative model to analyze how such a system balances efficiency and fairness. Their results show that while priority rules improve access for vulnerable or high-need users, they can reduce the total system throughput under constrained capacity. The trade-off curve between allocative fairness and operational efficiency remains a key gap, as few studies have addressed real-time system adaptability in response to demand shifts or behavioral compliance [45].
Another widely used approach is the implementation of permit-based systems, where access is pre-assigned to specific users through long-term agreements. Xu & Sun proposed a dynamic permit reservation model that adjusts slot assignments based on usage frequency while penalizing monopolization of premium locations. Their formulation explicitly incorporates a fairness function into the cost optimization process, a critical contribution to bridging algorithmic efficiency and ethical considerations. However, their study did not explore how such systems scale in socially diverse or informally governed parking environments, where enforcement and digital access may be inconsistent [46].
An alternative to gaining traction is a cyclic slot allocation strategy, where access to premium parking spots is distributed in turn among eligible users over a fixed time interval. This approach has been explored primarily in the context of electric vehicle (EV) charging infrastructure. Panayiotou et al. demonstrated that fair time-based cycling, combined with reservation windows, enhances temporal equity and reduces peak-period traffic congestion. Although the study focused on EV facilities, the underlying principles are broadly applicable to conventional parking environments. However, implementing such cyclic strategies requires high levels of user compliance and strong enforcement mechanisms—factors that remain insufficiently examined in residential contexts where parking personalization is often the default [47].
Recent contributions have also highlighted the role of digital systems in enabling adaptive and differentiated access control. Alahmadi et al. introduced a privacy-enhanced parking management framework that integrates user profiles into slot reservation logic, assigning different rules based on attributes such as driver age, vehicle type, or mobility level. Their system demonstrated scalability and security through a blockchain-based infrastructure. Yet, the study did not address sociotechnical adoption barriers such as digital illiteracy, low smartphone penetration among older residents, or resistance to algorithmic decisions—all of which can affect real-world effectiveness [48].
The complexity of fairness increases further in mixed-use urban environments, where residents and non-residents often compete for the same parking infrastructure. İnaç presented a case study from Istanbul where proximity-based digital permits were introduced to prioritize residents over visitors. The deployment significantly reduced unauthorized occupation and improved satisfaction scores among permit holders. Importantly, the study emphasized the role of transparency and communication, suggesting that procedural fairness—how rules are applied and explained—can be as important as outcome fairness. However, the system’s performance under peak visitor demand or in socioeconomically mixed districts remains unexplored [49].
Considering electrification trends, the intersection of fairness policies and EV infrastructure presents an emerging frontier. Ebrahimi et al. investigated how EV parking and charging lots can support grid operations under uncertainty. Although their focus was on distribution systems, the implications for user-level fairness are critical: how should limited charging-enabled spots be shared among growing EV populations with different usage patterns and priorities? Their model integrated stochastic demand but did not address policy-level questions such as whether EV drivers with longer parking times should have the same access priority as short-term users [50].
2.4. Smart Allocation and Reservation Systems
Smart allocation and reservation systems represent a pivotal research direction in the context of intelligent transport and parking infrastructure. The core objective of these systems is to dynamically assign parking slots to users in real time, based on availability, cost, proximity, and—in more advanced designs—anticipated demand and user preferences.
A foundational contribution by Drašković and Vukićević introduced a branch-and-bound optimization model, supported by wireless sensors and Bluetooth communication, to guide vehicles to the nearest vacant slot in interconnected parking blocks. While the framework demonstrates algorithmic feasibility, its testing was limited to controlled environments with ideal infrastructure assumptions. Moreover, it does not integrate predictive features such as demand anticipation or user-specific preferences, which are crucial for adaptive urban deployments [51].
More recent developments have addressed some of these limitations. Wang et al. proposed a heuristic model based on Lagrangian relaxation, which optimizes the allocation of shared private parking spaces while accounting for EV charging requirements and platform-level rules. However, despite its scalability in large scenarios, the model assumes full information and does not capture demand volatility or user behavior [52].
Likewise, Burns et al. contributed a dynamic reservation framework focused on delivery vehicles, formulating the problem as a sliding time window mixed-integer program. While this approach significantly improves utilization under structured demand, its applicability in general-purpose parking environments remains limited by its assumptions of reliable arrival forecasts and delivery-focused constraints [53].
On the practical implementation side, Renuka and Dhanalakshmi developed a mobile-based smart parking system using slot allocation, IR sensors, and RFID-based billing. Though effective in small-scale settings, it relies on rule-based scheduling (e.g., FCFS) without optimization or feedback control [54]. Aswath et al. expanded on hardware-oriented approaches by integrating YOLOv8-based vision, Raspberry Pi processing, and web-based reservation interfaces, yet still without a decision layer capable of dynamic prioritization or equity-based allocation [55].
Finally, Zhang et al. synthesized the research landscape across four dimensions—inventory control, allocation decision-making, pricing, and performance evaluation—and highlighted important missing elements such as fairness, demand elasticity, and multimodal integration [56]. In parallel, Ismael and Holguín-Veras tackled the problem of parking allocation under vehicle heterogeneity, formulating a mixed-integer optimization model that explicitly distinguishes between vehicle classes such as cars, vans, and trucks. Their model emphasizes capacity constraints and compatibility rules in shared facilities, showing notable gains in total system efficiency and fairness. However, the study operated under centralized information assumptions and did not incorporate behavioral or stochastic uncertainty in arrival patterns [57].
Despite these contributions, current systems still lack comprehensive integration of adaptive, user-centered, and context-aware logic. There remains a need for hybrid systems that not only allocate resources efficiently but also adapt to stochastic conditions, incorporate behavioral modeling, and ensure equitable access in diverse urban contexts.
2.5. Physical Design Constraints and Integration into Smart Parking Systems
The physical design of parking facilities fundamentally determines their usability, efficiency, and integration with evolving urban mobility systems. Core design parameters such as parking slot dimensions, aisle widths, and layout geometry are tightly linked to easy movement, spatial yield, and user experience. Yet, as the complexity of urban mobility systems increases—with the introduction of automated vehicles (AVs), electric vehicle (EV) infrastructure, and sensor-based guidance systems—traditional geometric principles alone are no longer sufficient.
At the base of parking layout design lies the notion of the design vehicle, as articulated by Mikušová et al., which provides a structured approach to defining turning radius, parking slot lengths, and clearance zones. This model ensures compatibility with a range of vehicle types, including commercial and articulated vehicles, offering a robust baseline for geometric planning. However, it inherently assumes homogeneity in traffic composition and static infrastructure, overlooking the increasingly diverse and dynamic nature of road vehicle composition [58].
A complementary approach is offered by mathematical models such as that of Maina et al., who used mixed-integer linear programming (MILP) to identify optimal parking angles [59]. Their results, showing 75° as the most space-efficient configuration, align with empirical optimization efforts like those by Wang et al., who, through field-based layout trials in a surface parking lot in Panzhihua, demonstrated how aisle width and angle impact capacity and flow [60]. Still, both studies operated under idealized, static conditions and lacked adaptability to shifting demand, temporary closures, or real-time reconfiguration.
The geometric demands of automated vehicle systems challenge these static assumptions even further. Kong et al. demonstrates that AVs, by eliminating human error and reducing the space required for vehicle movements, allow for much denser configurations [61]. Chen and Sun extended this by proposing hybrid layouts accommodating both AVs and conventional vehicles, integrating structural constraints such as EV charging points and obstacle buffers. However, these studies were predominantly simulation-based and overlooked behavioral variability, pedestrian movement patterns, and clarity of traffic signs—factors that strongly influence usability in real deployments [62].
3. Materials and Methods
Based on the insights outlined in the literature, the present study transitions from conceptual considerations to the practical development of a structured parking allocation model. This section outlines the design methodology, the spatial configuration of the facility, and the analytical tools used to implement a rule-based, criteria-driven distribution of parking spaces.
The design of the information system for parking management and administration begins with the physical layout planning of the parking facility, which was carried out in accordance with [63], specifying the structural dimensions of parking slots as well as the adopted orientation angles of the parking layout—90, 45, 60, and 75 degrees. The design process was conducted using the AutoCAD Vehicle Tracking v25.00.2775 software, selecting a 90-degree parking orientation relative to the circulation direction in the parking area, as this configuration represents the most applied solution in practice.
AutoCAD Vehicle Tracking v25.00.2775 is a software tool used for analyzing vehicle movement trajectories. It enables designers to simulate vehicle movements within parking facilities, intersections, or confined spaces, assessing accessibility and maneuverability. Among its extended functionalities, the following can be highlighted:
- Simulation of vehicles with varying dimensions, including passenger cars, trucks, and buses.
- Vehicle path analysis, by identifying critical areas where large vehicles cannot fit within the geometric constraints.
- Integration with Building Information Modeling (BIM), allowing 3D visualization of parking layouts in the context of surrounding constructions.
- Generation of reports and the ability to export data to other software, such as automatic generation of traffic flow data and spatial occupancy analysis.
Figure 1 presents the designed layout of the parking facility, which consists of 8 rows (A, B, C, …, H), each containing 12 parking slots, resulting in a total of 96 parking slots distributed over an area measuring 1000 m in length and 510 m in width. For the proposed layout, it was assumed that access to the parking facility is made from the northern side, while the exit is through the southern side. It should be noted that the access points, the number of parking slots, as well as their inclination angle, can be configured under any of the aforementioned orientation hypotheses using the AutoCAD Vehicle Tracking v25.00.2775 software.
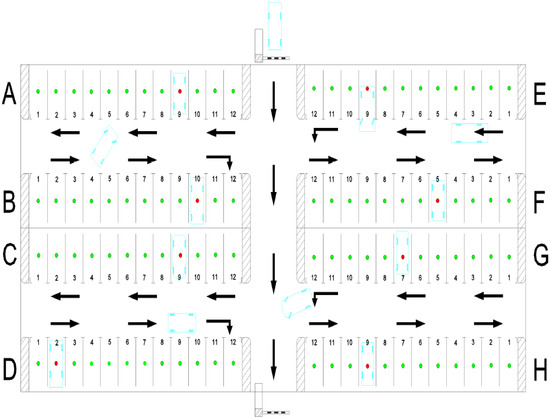
Figure 1.
A layout representation of the parking facility using the AutoCAD Vehicle Tracking v25.00.2775 software.
After designing the parking layout in accordance with the shape and dimensions of the area designated for the parking facility, a program was developed in Python to simulate vehicle behavior within a public parking lot. The main features of the simulation are as follows:
- Dynamic allocation of parking slots based on predefined criteria, as detailed below:
- (a)
- random allocation of a free parking slot within the designated parking area,
- (b)
- allocation of parking slots such that the driving distance through the parking area to the assigned space is minimized,
- (c)
- the same allocation criterion as in point (b), with the additional condition of minimizing the walking distance from the assigned parking slot to the destination. In the simulation, each vehicle is assigned a free space initially marked in green, and once occupied, the indicator changes to red.
- Parking time. This is a random time interval, predefined as a parameter at the beginning of the simulation. The set value used in the simulation is t ≥ 200 s, after which the vehicle exits the parking area, and the corresponding space becomes available for allocation to another vehicle.
- Real-time visual update. The graphical interface displays, in real time, the occupied or available status of each parking slot through an animation that can be played at a configurable speed.
- Evaluation of operational metrics. The main performance metrics related to parking usage are calculated based on the initial simulation parameters. These include the number of times each parking space is used during the simulation, the average occupancy time per space, the average driving distance within the parking area, and the average walking distance from the parking space to the intended destination.
Objectives (a), (b), and (c) of the decision-making process are selected by the parking administrator within the management process, depending on the occupancy rate of the parking facility—determined by the simulation program—and on the declared preferences of the users. For a given time interval (e.g., during a single day), the three management strategies may be applied alternately to increase both the efficiency of use and customer satisfaction. Simulation and modeling of operations can provide threshold values for switching allocation criteria for parking spaces and, implicitly, the tariffs applied. Differentiated pricing can be used depending on the degree to which customer requirements are met, while maintaining budgetary balance. Applying criterion (b) results in a shorter driving route within the parking facility, which benefits the user by reducing fuel consumption, time, and costs; this may justify a higher parking fee, while still maintaining budgetary equilibrium for the user. A similar effect occurs when criterion (c) is applied, in which case, beyond the reduction in the in-parking driving distance, the walking distance to the destination is also minimized. This, in turn, increases user satisfaction, as all vehicle occupants benefit primarily from time savings. However, applying criteria (b) and (c) leads to more intensive use of certain parking areas and a decline in the use of others. Consequently, this results in uneven wear of the parking infrastructure and may create discomfort in usage. To balance the utilization of different zones, parking management will rely on allocation criterion (a), which naturally entails lower parking costs.
The transition from the simulation model to the real management model will integrate information on user preferences collected in advance, while users will be informed regarding the extent to which they can benefit from the allocation criteria as well as the associated parking costs, thus allowing them to decide whether to use the parking facility or not.
The parking system operates as a queuing system with multiple service stations, where the service stations correspond to the individual parking slots. Arrivals into the system are represented by vehicles seeking to occupy a parking slot, while departures are represented by vehicles leaving the parking facility. The arrival rate is measured in vehicles attempting to enter the parking system within a given time interval (λ = veh/h) and is considered a random variable. The service process corresponds to the random parking time, which generates the departure flow, also measured in terms of the number of vehicles exiting the parking facility over a specified period (μ = veh/h). As long as λ < μ, the system remains stable; however, its performance is governed by the value of the utilization ratio . The closer this ratio approaches 1, the greater the waiting times generated within the system. In other words, this ratio represents the number of services completed during the time it takes for one unit of demand to arrive for service. If the simulation starts with the arrival of the first vehicle, which finds the parking facility entirely empty, a key question arises: after how much time will the parking facility reach full occupancy? If we denote the total number of available parking slots by np, then the total occupancy time (Tp) can be calculated using Equation (1):
Up to this moment in time (Tp), the value of λ may exceed that of μ. After this point, for the parking facility to continue accepting incoming vehicles, the arrival rate must become equal to or less than the departure rate, i.e., λ ≤ μ.
The simulation program developed in the Python environment consists of the phases presented in Figure 2.
Figure 2.
Phases of the simulation program developed in the Python v2025.12.0.
Figure 3 presents a flowchart of the simulation process, illustrating the functional blocks of the software and their logical sequencing. In this figure, n represents the number of vehicles requesting parking, d1 represents the distance from the barrier to the parking spot, d2 represents the distance from the parking slot to the main entrance, and t denotes the parking time.
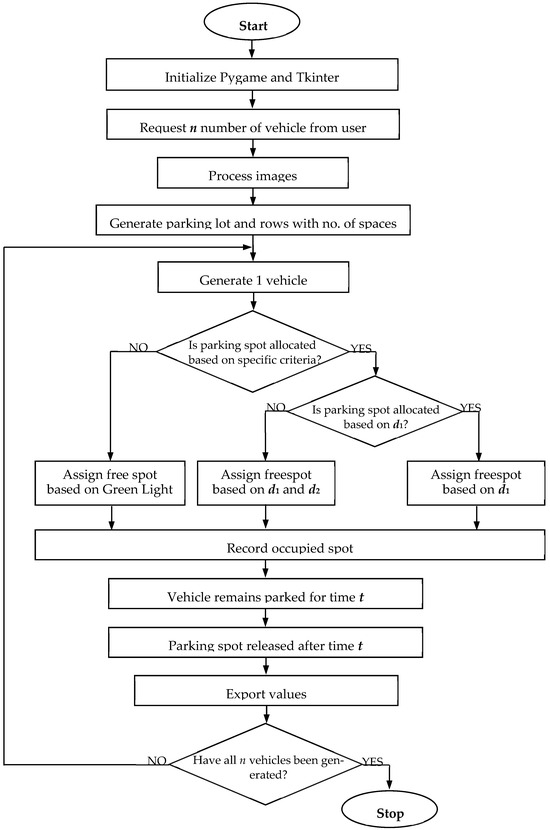
Figure 3.
A flowchart of the simulation implemented in Python.
To ensure that the simulation closely replicates human behavior, three scenarios were proposed:
- (1)
- A baseline scenario, with no restrictions on the allocation of parking spaces.
- (2)
- An allocation strategy aimed at minimizing the total travel distance covered by all vehicles within the parking area while searching for a parking space.
- (3)
- An allocation strategy combining the constraints from scenario 2, while also minimizing the walking distance from the parked vehicle to the destination.
In the simulation, the points of interest were located between rows C and D, and between rows G and H of the parking facility.
Scenario 1 assigns available parking slots randomly. Users tend to exhibit preferences when choosing a parking slot—such as minimizing walking distance to their point of interest, selecting less crowded or less exposed areas to reduce the risk of vehicle damage, or other personal considerations (e.g., better lighting, wider sidewalks, etc.). This scenario serves as the baseline scenario, providing a reference for comparison with the other allocation strategies to highlight the advantages and disadvantages associated with user-driven choices.
Scenario 3 builds upon the allocation criteria of Scenario 2 by also minimizing the walking distance from the parking slot to the user’s destination. In this case, in addition to reducing internal driving distance, the assignment process considers the convenience of pedestrian access. The simulation assumes that the points of interest are located between rows C and D and between rows G and H of the parking facility. This strategy aims to improve user experience while maintaining efficient vehicle circulation and minimizing discomfort during navigation within confined spaces.
The objective function of this scenario is the minimum total distance traveled by all vehicles within the parking area while searching for an available parking space. This refers specifically to the distance from the entrance of the facility to the parking slot assigned by the program. The objective function is defined by Equation (2).
where v represents the vehicle assigned to the parking spot identified by the coordinates of the corresponding cell i and j:
i—represents the row identifier of the parking cell, with values ranging from A to H;
j—represents the column index of the parking cell, with values ranging from 1 to 12.
Scenario 3 assigns a parking slot while maintaining the constraints from Scenario 2, with the addition of a new requirement aimed at minimizing the walking distance from the assigned parking spot to the point of interest. Thus, to the constraint defined by Equation (1), an additional constraint was introduced—minimizing the total walking distance for all parked vehicles, as calculated by Equation (3):
where represents the walking distance from the assigned parking slot to the designated point of interest. It should be noted that, in discussions concerning disutility, this walking distance affects each occupant of the parked vehicle. As a simplifying assumption of the model, it was considered that each vehicle is occupied solely by the driver, who is also the one making the parking slot selection decision.
The simulation was carried out for a user-defined number of vehicles, generating information regarding the number of vehicles assigned to each parking slot, the utilization rate of each slot, the average occupancy duration per space, as well as the average occupancy time per row and for the entire parking facility. To ensure a meaningful analysis of parking lot operations, only scenarios where vacant spaces are available were considered. Once the parking facility reaches full occupancy, no additional vehicles are generated until at least one spot becomes available again. This constraint was introduced to assess the dynamics of space occupation and release, recognizing that in non-automated parking systems, all arriving vehicles are granted access regardless of the occupancy level. In such situations, when parking demand is high, newly entering vehicles tend to congest the drive aisles, thereby increasing the exit time for vehicles attempting to leave the facility.
To determine whether there is a dependency between the utilization rate of parking slots and specific parking-related indicators, namely, the distance to the parking slot, or the combined distance composed of the driving segment plus the walking distance to the destination, both Pearson and Spearman correlation coefficients were applied. These correlation coefficients serve as important tools for describing the linear relationship between the selected variables; however, Spearmint’s correlation is used to quantify dependence and model the variation of nonlinear value pairs [64].
The Pearson correlation coefficient quantifies the strength of the linear relationship between two continuous variables, x and y, by producing values between −1 and +1. A value of +1 indicates a perfect positive linear dependency, where an increase in one variable is consistently accompanied by an increase in the other. A value of −1 reflects a perfect negative linear dependency, implying that one variable increases as the other decreases proportionally. A value of zero suggests the absence of any linear dependency, indicating that the two variables are not linearly related.
The Pearson correlation coefficient () which quantifies the degree of linear dependency between two continuous variables, is computed according to Equation (4):
where xi and yi represent the paired values of the two variables being compared, indexed by i = 1, 2, …, n, with n denoting the total number of observed data pairs for the variables x and y.
The Pearson correlation coefficient specifically assesses both the strength and the direction of the linear dependency between two continuous variables. When the dependency structure between variables deviates from linearity, the Pearson correlation fails to accurately quantify the strength of the association. To address this limitation, alternative methods can be applied—such as Spearman’s rank correlation coefficient, which is particularly suitable for ordinal data and for capturing more complex, non-linear associations. Spearman’s coefficient is used when the goal is to assess the degree of association between two sets of values, even when precise measurements are not available. In certain scenarios, we deal with characteristics that cannot be directly quantified but can be ranked based on a specific criterion. In these cases, the ordinal position of the data is considered rather than its numerical value. We assume a set of n elements ranked according to qualitatively distinct characteristics. For a population of n statistical units A1, A2,…, An, each unit is described by two attributes, (x1, y1), (x2, y2),…, (xn, yn). We denote by di the difference between the ranks of the two variables for the i-th observation:
where the vector with components di represents a measure of the degree of proximity in the correspondence between the variables x and y. If d = 0, it indicates that the variables under consideration have identical ordering for the two characteristics; therefore, a perfect correspondence exists. The greater the values of di, the higher the level of discordance between the two variables. To avoid compensation effects between positive and negative differences, the squared values of di are used in the calculation. Accordingly, Spearman’s rank correlation coefficient () is defined by the following expression:
di = xi – yi (i = 1, 2, …,n),
As with Pearson’s correlation coefficient, a value of = 1 indicates perfect concordance, whereas a value of = −1 reflects maximum discordance between the two ranked variables.
Both correlation coefficients were employed to assess the strength of the relationship between parking slot utilization and three key distance metrics: the minimum driving distance covered by vehicles within the parking area to reach the allocated spot; the walking distance from the parking slot to the final destination; and the total distance, defined as the sum of the driving distance and the subsequent walking distance to the destination. The corresponding results are presented in the case study section and are further interpreted in the discussion chapter.
4. Case Study
The case study was conducted on the parking facility illustrated in Figure 1, which comprises 96 parking slots arranged in four rows symmetrically aligned with a central vertical axis. This axis also serves as the main access and exit route. The four rows are divided by the central axis into eight half-rows, labeled from A to H. Each half-row contains 12 consecutively numbered parking slots. Vehicle movement within the parking facility, to reach the slot automatically allocated by the system, is constrained to two directions: north–south (NS) and east–west (EW). Vehicles also follow these two directions when exiting the facility, which allows for the calculation of the total travel distance within the parking layout. The geometric configuration of the parking area, including slot orientation angles compliant with current standards and physical dimensions, was modeled using the AutoCAD Vehicle Tracking software v25.00.2775. This tool enables the design of any layout adapted to the available surface area for the parking arrangement.
The simulation of the parking facility’s operation was implemented using Python, with its logical framework and functional description detailed in the previous section.
The simulation program was executed under three analytical scenarios: (a) random allocation of an available parking slot within the designated facility; (b) allocation of parking slots aimed at minimizing the distance traveled within the parking area to the assigned slot; and (c) the same allocation criterion as in point (b), with the additional objective of minimizing the walking distance from the allocated parking slot to the final destination.
The simulation was conducted for a total of 500 vehicles, with their arrival times at the parking entrance barrier randomly generated by the program. At the start of the simulation, the parking lot is assumed to be empty, entering a loading and transition phase until the moment the first vehicle exits the facility. From that point onward, both entry and exit events occur simultaneously, each governed by a specific intensity parameter defined within the program. The minimum parking time was set to 200 s, while a time shorter than the typical real-world duration was selected to ensure manageable simulation runtimes. This value remains consistent with the time intervals between successive vehicle arrivals requesting a parking slot. Given that the simulation includes both entries and exits, translating the adopted test values to real-world conditions can be achieved by a uniform time-axis scaling of all durations involved. Initially, the simulation was executed for parking times ranging between 200 and 250 s.
A representative segment of the simulation output, including data for the first 11 and the last 11 vehicles generated under scenario (a), is detailed in Table 1. Similar tables were produced for the remaining two scenarios; however, to conserve space, only the aggregated results are shown in Table 2, Table 3 and Table 4. The license plate number of each vehicle was automatically generated by the simulation program and does not correspond in any way to real-life vehicle registrations. In a real-world implementation, the program could identify each vehicle at the entrance barrier and process this information in accordance with applicable legal regulations regarding the handling of personal data.

Table 1.
Representative simulation output for scenario (a)—parking time: 200–250 s.
Table 2.
Allocation of vehicles across individual parking slots according to scenario (a).
Table 3.
Distribution of vehicles per parking slot under scenario (b).
Table 4.
Distribution of vehicles across each parking slot according to scenario (c).
Table 1 presents a detailed overview of the 500 vehicles simulated, including the assigned parking slot, the distance traveled from the entrance gate to the designated space, and the parking time.
The distribution of vehicles across individual parking slots, as determined by the simulation under scenario (a), is summarized in Table 2.
As shown in Table 2, the most frequently used parking spot was B7, which accommodated eight vehicles throughout the simulation. Additionally, there were seven parking spots that were each used by seven vehicles: A3, D4, F4, A6, C8, D8, and D11. At the other end of the spectrum, the least used parking spots were A8 and F11, each of which accommodated only two vehicles. Four other spots—E4, B6, C9, and G12—were used by just three vehicles. The sum of all values in Table 2 confirms that the total number of vehicles simulated and successfully parked was 500.
For scenario (b), the vehicle allocation to parking slots—based on the same parking time—was conducted according to the logic described and is presented in Table 3.
From Table 3, it can be observed that the most frequently used parking slot was utilized by nine parked vehicles—this occurred 28 times—and eight parked vehicles in 22 instances. At the opposite end of the spectrum, some parking slots were never used, which occurred in 39 cases. A highly uneven usage pattern is evident, driven by the allocation algorithm’s emphasis on minimizing the in-parking driving distance. This led to a strong preference for parking spaces located near the entrance of the car park. For scenario (c), the distribution of vehicles across parking slots, under the same parking time conditions, was carried out according to Table 4.
The data presented in Table 4 indicate a highly uneven distribution of space usage across the car park. A total of 27 parking spaces were each used by nine vehicles, while 18 others accommodated eight vehicles. At the opposite end of the spectrum, 32 parking slots were never utilized throughout the simulation. This pronounced disparity in allocation is largely attributable to the dual objective of minimizing both the in-parking driving distance and the walking distance to the designated point of interest. Consequently, the allocation algorithm favored parking slots located near both the entrance and the predefined destinations.
The simulation was extended to cover multiple vehicle parking time intervals across the three adopted study scenarios. It was assumed that the randomly generated vehicle parking time falls within the following ranges: T1 = [200, 250] s, T2 = [250, 300] s, T3 = [300, 350] s, and T4 = [350, 380] s. The results concerning the usage of individual parking slots and parking rows, the minimum and maximum space utilization rates, as well as the peak instantaneous occupancy of the car park, are summarized in Table 5.
Table 5.
Simulation results for the three analytical scenarios and various vehicle parking times within the car park.
As shown in Table 5, for scenario (a), which does not impose any allocation constraints, the use of parking slots becomes progressively more evenly distributed as the vehicle parking time increases. This uniform exploitation presents potential advantages for car park operators, primarily by promoting even wear of the pavement surface, which may lead to less frequent and more cost-effective maintenance interventions over the long term. In contrast, once specific allocation criteria are introduced (as in scenarios b and c), the spatial distribution of parking activity becomes increasingly uneven. This is a direct result of the prioritization logic embedded in the allocation algorithm, which favors certain parking slots over others based on defined optimization objectives. Nonetheless, such non-uniform patterns of use may still prove beneficial operationally: since the wearing and degradation of the driving surface would occur unevenly across the facility, maintenance activities could be localized to the most affected areas. This targeted approach would reduce the need for full facility closures and allow unaffected areas to remain in operation. Furthermore, the effectiveness of these allocation strategies is particularly evident under moderate demand conditions—interpreted here as shorter parking times. Notably, as the average parking time increases, the discrepancy between minimum and maximum usage levels across parking slots tends to diminish, suggesting that longer parking times contribute to a more balanced distribution of use over time.
Figure 4 illustrates the simulation results obtained under the scenario of random vehicle parking, with parking times in the range T1 = [200, 250] s. This scenario was selected because it features the shortest parking times, resulting in lower peak demand at any given moment. Consequently, the system can accommodate all 500 vehicles without exceeding capacity. The car park operates continuously, without interruptions.
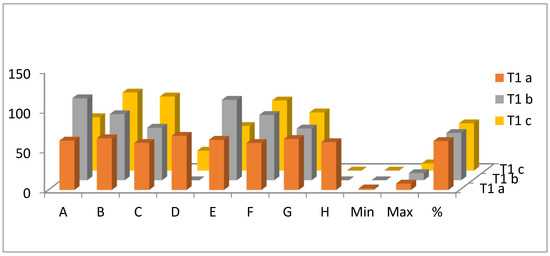
Figure 4.
Simulation results for the three scenarios, T1 = [200, 250] s.
To provide a clear visualization of the simulation results, a three-dimensional representation was chosen. On the horizontal axis, the parking rows (labeled A to H, as shown in Figure 1) are plotted for the 500 vehicles that received a parking space during the simulation interval. The minimum, maximum, and utilization percentage values are also shown. The vertical axis represents the magnitude of these values according to the scale on the left side of the figure. The axis perpendicular to this plane represents the three simulation scenarios defined in Section 3, Materials and Methods.
Through this three-dimensional representation, all three scenarios for the selected parking duration can be visualized simultaneously.
The degree of numerical dispersion in parking slot allocation around the mean value, based on the data presented in Table 5, is assessed through the calculation of variance and standard deviation for the three analytical scenarios. The resulting values are presented in Table 6.
Table 6.
The standard deviation and variance of the values resulting from parking slot allocation.
An analysis of the values presented in Table 6 reveals that both the variance and the standard deviation are significantly lower in the scenario without any parking constraints. These values increase as allocation restrictions are introduced. However, they tend to decrease again as the overall occupancy level of the car park rises. This is because, under high congestion, the capacity for controlled allocation—based on predefined criteria—diminishes, leading to an almost uniform distribution of parked vehicles.
To determine whether there is any correlation between the number of allocations of a parking slot and the criteria used for space assignment, two correlation coefficients were computed, as described in Chapter 2—Materials and Methods: Pearson’s correlation coefficient and Spearman’s rank correlation coefficient. The results of the analysis are presented in Table 7.
Table 7.
Pearson and Spearman correlation coefficients for allocation criteria (b) and (c).
An analysis of the values presented in Table 7 reveals a strong correlation between parking slot occupancy and the allocation criteria under conditions of lower parking demand. As demand increases, the strength of this correlation diminishes. By the time occupancy reaches 95%, certain values even exhibit a negative correlation. This indicates that, as the utilization of a parking slot increases, the allocation criterion is no longer followed; on the contrary, the relationship between the two variables becomes inversely proportional.
5. Discussion
The simulation outcomes provide valuable insights into the functioning of a parking facility under both unconstrained conditions and cases involving allocation criteria. An analysis of the distribution of parking slot usage indicates that, when no allocation rules are applied, parking slots tend to be used in a quasi-uniform manner, with each slot being occupied multiple times. This pattern becomes more pronounced as the intensity of car park usage increases, which was modelled by increasing the duration of vehicle parking. The introduction of allocation criteria—based either on minimizing the in-parking driving distance or the walking distance to the final destination—predictably results in a non-uniform usage pattern, prioritizing spaces that minimize the respective objectives. In certain cases, particularly under Cases T1, T2, and T3 (representing shorter parking times), some parking slots remain completely unused, regardless of overall demand levels. In Case T4, which involves the longest parking times, the distribution of allocated spaces begins to rebalance. This shift occurs because high occupancy levels limit the program’s capacity to enforce the predefined allocation criteria.
For the parking time span T1 (200–250 s), it is observed that the maximum instantaneous utilization rate of the entire parking lot ranges between 61.45% and 59.38%, with the higher value corresponding to the case without restrictions on space allocation. This outcome reflects practical reality, as users are generally assigned spaces without imposed restrictions. When allocation restrictions are introduced, utilization becomes more dispersed (min. 0 and max. 9), and the maximum instantaneous utilization rate decreases to 59.38%. As the parking time span increases and reaches T4 (350–380 s), the maximum instantaneous utilization rate ranges between 96.88% and 54.80%. The higher value again corresponds to the unrestricted allocation scenario, while the lower value is associated with the simultaneous application of two allocation criteria—namely, the minimum driving distance to the assigned parking space and the minimum walking distance to the point of interest. These findings may support parking managers in making decisions aimed at balancing and optimizing parking utilization through the implementation of differentiated pricing schemes based on user-selected allocation criteria.
The analysis of standard deviation and variance supports this trend: these values are lowest in the unconstrained case, increase under constrained allocation, and then decrease again as congestion rises. This reflects the practical reality that, as congestion increases, the ability to allocate spaces based on strict criteria diminishes, leading to a more uniform distribution of usage across the car park.
The lowest values of the standard deviation are obtained for time spans T3 and T4, in the absence of allocation restrictions, with values of 1.49 and 1.52, respectively. These results indicate a strong clustering of values around the mean. When correlated with the maximum instantaneous utilization rate (which is very high for T3 and T4), it can be concluded that as the parking duration increases, the possibilities for allocation according to the predefined criteria are reduced, and allocation becomes quasi-uniform. Thus, an optimal parking interval can be determined, for which the allocation criteria can still be effectively applied. In the case study, this value ranges between 250 and 300 s. The optimal value can be easily obtained by running the simulation program with alternative input parameters specified by the user.
The maximum instantaneous car park use can reach levels as high as 97%, which is considered extremely high for the queueing system. This phenomenon was also identified through the computation of the Pearson and Spearman correlation coefficients. These indicate a direct linear dependency under relatively moderate levels of demand but reveal an inverse relationship when the parking facility becomes highly saturated—an observation that aligns with patterns commonly encountered in real-world scenarios.
The Pearson and Spearman correlation analyses performed for the number of allocations of a parking space with respect to allocation criteria (b) and (c) indicate that, at a 60% occupancy level, the highest Pearson coefficient is 0.941. This corresponds to the allocation criterion combining the minimum driving distance to the assigned parking space with the minimum walking distance to the point of interest, suggesting a direct linear relationship between the number of allocations and the chosen allocation criterion. The highest Spearman coefficient is 0.887, corresponding to the correlation between the number of allocations and allocation criterion (c), defined as the walking distance from the parking space to the point of interest. The difference between the two maximum values is only 0.054, reflecting an exceedingly small discrepancy and thus a strong concordance between the variations of the two analyzed variables. At the opposite extreme, for high occupancy levels (95%), the correlation between the number of allocations and the allocation criteria reaches a maximum value of −0.738, which indicates an inverse correlation between the analyzed measures, i.e., non-compliance with the allocation criteria.
This application provides a robust tool for the implementation of effective car park management and has the potential to significantly reduce the number of parking slots required within a specific area, while offering a variety of economic, social, and environmental benefits, as also demonstrated in the work of [6].
The application can offer financial benefits to car park operators by enabling the implementation of differentiated pricing strategies, based on the ability to allocate preferential parking slots relative to key points of interest served by the facility, or according to the current level of demand. Consequently, such parking management and administration systems provide both financial and logistical advantages, as also highlighted in the work of [24].
The data obtained may assist parking managers in improving financial and operational parameters to maximize profit and enhance customer satisfaction. Financial benefits can be achieved through reductions in maintenance and operational costs, allocation of spaces according to user-selected criteria, implementation of differentiated tariffs based on satisfaction levels, and energy savings derived from reduced pollution within the parking facility. Shorter driving distances inside the parking lot not only decrease pollution but also reduce fuel consumption and physical effort for users, as assigned spaces are closer to their destinations.
The proposed simulation model is of general applicability and can be adapted to any parking facility, regardless of its size, orientation of parking spaces, or distribution of destinations and points of interest. All input variables can be modified quickly and easily within the model, yielding corresponding results and efficiency indicators of parking utilization.
The simulation model was also tested for smaller parking facilities, but the results did not produce significant benefits or noteworthy advantages; thus, they were not included in this work. Since the allocation criteria are defined in terms of travel distances (either the distance driven through the parking lot or the sum of driving and walking distances to the destination), the operational indicators become most relevant in parking facilities where such distances are considerable. This consideration was the rationale for selecting, in the case study, a parking lot measuring 1000 m in length and 510 m in width. These dimensions were derived from a design created using AutoCAD Vehicle Tracking v25.00.2775 for 96 available spaces. A symmetric parking layout was chosen for testing to identify different patterns of functional similarity. The main limitation of this simulation model lies in the fact that the results obtained for parking management are significant primarily in large-scale parking facilities with substantial internal distances to be traveled.
This application can be improved by incorporating functionalities for visualizing vehicle movement within the parking area, including the detection of potential conflict points. Further enhancements may also involve integration with external traffic monitoring systems, mobile applications, or IoT platforms that capture users’ declared preferences. In an initial stage, such data could be collected at the parking entrance, where users specify their preferred parking location or final destination.
6. Conclusions
This study presented an information system for the management and operation of a parking facility, aimed at maximizing space utilization, reducing search times, enabling preferential allocation, and promoting the rational use of the available area. The software application, developed entirely by the research team, is original and was designed with the objectives of ease of generalization and universal applicability, regardless of the surface area or geometric layout of the parking lot. For modeling and simulation purposes, a parking facility with 96 spaces was considered; however, the number of spaces and the lot size can be easily scaled due to the use of AutoCAD Vehicle Tracking v25.00.2775. The operation of the facility was simulated using a custom-developed Python program, which assigns parking spaces to vehicles based on predefined allocation criteria that aim to optimize utilization while accommodating user preferences. Operational indicators were also evaluated to support the development of marketing policies by parking administrators. The results indicate that the proposed model enhances parking operations and can be adjusted to meet different management objectives—whether to maximize space efficiency or financial revenue, through differentiated pricing based on ease of access or user-specific constraints. These constraints include walking distance from the allocated parking space to the destination and user-defined preferences. The calculated performance indicators include average parking time per space and for the entire facility, individual space occupancy rates within a given time interval, and the average vehicle travel distance required to reach the assigned parking slot. The model was tested under a simulated demand of 500 randomly generated vehicles with randomly varied parking durations constrained within defined time intervals.
The simulation model employs as input data the arrival times of vehicles, generated randomly, as well as the durations of parking occupancy, also randomly generated within various time intervals. For the study and analysis, four intervals of parking duration were considered, denoted T1, T2, T3, and T4, with values ranging between 200 s and 380 s.
In practical application, the model will rely on real input data: vehicle state information and user-declared preferences collected via mobile IoT systems or in-vehicle embedded systems, which will communicate with fixed parking management systems. Feedback on user behavior will be gathered through automated vehicle transmission systems, whereby the parking management system will receive information on the occupied space, parking duration, the distance traveled within the facility, and the walking distance to the destination.
The system is compatible with real-time data input, either from entry barriers or from external traffic monitoring systems. Parking durations may also be captured directly from sensors installed at each space, detecting occupancy and vacancy.
We conclude that the automation and digitalization of parking systems can contribute indirectly to improved traffic flow by reducing the number of vehicles driving in search of parking, thus mitigating the negative externalities of road congestion.
Author Contributions
Conceptualization, V.D. and A.-B.M.; methodology, V.D.; software, A.-B.M. and M.A.R.; validation, O.M.D., E.A.R. and F.C.O.; formal analysis, V.D., O.M.D. and E.A.R.; investigation, F.C.O.; resources, O.M.D.; data curation, E.A.R.; writing—original draft preparation, V.D. and A.-B.M.; writing—review and editing, V.D., E.A.R. and O.M.D.; visualization, M.A.R.; supervision, V.D.; project administration, V.D.; funding acquisition, O.M.D. All authors have read and agreed to the published version of the manuscript.
Funding
The research work contained in this paper was supported within the framework of the grant no. 42/09.10.2023 from GNAC ARUT 2023.
Data Availability Statement
The data presented in this study is available on request from the corresponding author.
Acknowledgments
This work was supported by a grant from the National Program for Research of the National Association of Technical Universities—GNAC ARUT 2023.
Conflicts of Interest
The authors declare no conflicts of interest.
References
- Shaaban, K.; Tounsi, H. Parking detection method using quadtree decomposition analysis. J. Traffic Transp. Eng. (Engl. Ed.) 2022, 9, 645–653. [Google Scholar] [CrossRef]
- Zhu, Y.; Ye, X.; Chen, J.; Yan, X.; Wang, T. Impact of cruising for parking on travel time of traffic flow. Sustainability 2020, 12, 3079. [Google Scholar] [CrossRef]
- Samaranayake, P.; Gunawardana, U.; Stokoe, M. Kerbside parking assessment using a simulation modelling approach for infrastructure planning—A metropolitan city case study. Sustainability 2023, 15, 3301. [Google Scholar] [CrossRef]
- Arellano-Verdejo, J.; Alonso-Pecina, F.; Alba, E.; Arenas, A.G. Optimal allocation of public parking spots in a smart city: Problem characterisation and first algorithms. J. Exp. Theor. Artif. Intell. 2019, 31, 575–597. [Google Scholar] [CrossRef]
- Harpalete, O.L. Methods to Estimate Urban Accessibility in a Medium Size City. Case Study: Iasi, Romania. U.P.B. Sci. Bull. 2023, 85, 120–134. Available online: https://www.scientificbulletin.upb.ro/rev_docs_arhiva/full1ba_354364.pdf (accessed on 22 May 2025).
- Karri, S.; Dhabu, M.M. Multistage Game Model Based Dynamic Pricing for Car Parking Slot to Control Congestion. Sustainability 2022, 14, 11808. [Google Scholar] [CrossRef]
- Shoup, D.C. Cruising for parking. Transp. Policy 2006, 13, 479–486. [Google Scholar] [CrossRef]
- Azari, K.A.; Arintono, S.; Hamid, H.; Rahmat, R.A.O. Modelling demand under parking and cordon pricing policy. Transp. Policy 2013, 25, 1–9. [Google Scholar] [CrossRef]
- Mondal, M.A.; Rehena, Z.; Janssen, M. Smart parking management system with dynamic pricing. J. Ambient. Intell. Smart. Environ. 2021, 13, 473–494. [Google Scholar] [CrossRef]
- Thompson, R.G.; Richardson, A.J. A parking search model. Transp. Res. Part A Policy Pract. 1998, 32, 159–170. [Google Scholar] [CrossRef]
- Arnott, R. On the optimal target curbside parking occupancy rate. Econ. Transp. 2014, 3, 133–144. [Google Scholar] [CrossRef]
- Qian, Z.; Xiao, F.; Zhang, H.M. Managing morning commute traffic with parking. Transp. Res. Part B Methodol. 2012, 46, 894–916. [Google Scholar] [CrossRef]
- Geng, Y.; Cassandras, C.G. New “smart parking” system based on resource allocation and reservations. IEEE Trans. Intell. Transp. Syst. 2013, 14, 1129–1139. [Google Scholar] [CrossRef]
- Weinberger, R.R.; Adam Millard-Ball, A.; Hampshire, R.C. Parking search caused congestion: Where’s all the fuss? Transp. Res. Part C Emerg. Technol. 2020, 120, 102781. [Google Scholar] [CrossRef]
- TomTom Trafic Index. Available online: https://www.tomtom.com/traffic-index/ranking/ (accessed on 10 May 2025).
- Naphade, M.; Banavar, G.; Harrison, C.; Paraszczak, J.; Morris, R. Smarter cities and their innovation challenges. Computer 2011, 44, 32–39. [Google Scholar] [CrossRef]
- Biyik, C.; Allam, Z.; Pieri, G.; Moroni, D.; O’Fraifer, M.; O’Connell, E.; Olariu, S.; Khalid, M. Smart parking systems: Reviewing the literature, architecture and ways forward. Smart Cities 2021, 4, 623–642. [Google Scholar] [CrossRef]
- Atiqur, R. Smart car parking system model for urban areas. Comput. Sci. Inf. Technol. 2021, 2, 95–102. [Google Scholar] [CrossRef]
- Babic, M.; Vekj, A.; Stanojevic, M.; Ostojic, G.; Borocki, J.; Stankovski, S. Modern parking solutions for smart cities. In Proceedings of the 30th DAAAM International Symposium on Intelligent Manufacturing and Automation, Zadar, Croatia, 23–26 October 2019. [Google Scholar]
- Parmar, J.; Das, P.; Dave, S.M. Study on demand and characteristics of parking system in urban areas: A review. J. Traffic Transp. Eng. 2020, 7, 111–124. [Google Scholar] [CrossRef]
- Borgonovo, E.; Gatti, S.; Peccati, L. What drives value creation in investment projects? An application of sensitivity analysis to project finance transactions. Eur. J. Oper. Res. 2010, 205, 227–236. [Google Scholar] [CrossRef]
- Channamallu, S.S.; Kermanshachi, S.; Rosenberger, J.M.; Pamidimukkala, A. A review of smart parking systems. Transp. Res. Proc. 2023, 73, 289–296. [Google Scholar] [CrossRef]
- Kuran, M.Ş.; Viana, A.C.; Iannone, L.; Kofman, D.; Mermoud, G.; Vasseur, J.P. A smart parking lot management system forscheduling the recharging of electric vehicles. IEEE Trans. Smart Grid 2015, 6, 2942–2953. [Google Scholar] [CrossRef]
- Sajeev, A.; Vidwans, S.; Mallick, C.; Jog, Y. Understanding smart and automated parking technology. Int. J. Serv. Sci. Technol. 2015, 8, 251–262. [Google Scholar]
- Shoup, D. The High Cost of Free Parking, 2011 Updated Edition; reprinted by Routledge: London, UK, 2017. [Google Scholar]
- Kattimani, R. Appraisal of Multilevel Car Parking Facility at KG Road–CBD Area, Bengaluru City. Int. J. Res. Eng. Technol. 2014, 3, 404–410. [Google Scholar] [CrossRef]
- Rodríguez, A.; dell’Olio, L.; Moura, J.L.; Alonso, B.; Cordera, R. Modelling Parking Choice Behaviour Considering Alternative Availability and Systematic and Random Variations in User Tastes. Sustainability 2023, 15, 8618. [Google Scholar] [CrossRef]
- Hess, S.; Polak, J.W. Mixed Logit Modelling of Airport Choice in Multi-Airport Regions. J. Air Transp. Manag. 2005, 11, 59–68. [Google Scholar] [CrossRef]
- Cao, Y.; Ren, Y.; Jia, H.; Sun, M.; Dali, Z. Modeling Parking Choice Behavior Using Cumulative Prospect Theory. Sustainability 2024, 16, 1596. [Google Scholar] [CrossRef]
- Fabusuyi, T.; Hampshire, R.C.; Hill, V. Evaluation of a Smart Parking System. Transp. Res. Rec. 2013, 2359, 10–16. [Google Scholar] [CrossRef]
- Kelly, J.A.; Clinch, J.P. Influence of Varied Parking Tariffs on Parking Occupancy Levels by Trip Purpose. Transp. Policy 2006, 13, 487–495. [Google Scholar] [CrossRef]
- Stover, V.G.; Koepke, F.J. Parking Design, Transportation and Land Development, 2nd ed.; Institute of Transportation Engineers: Washington, DC, USA, 2002. [Google Scholar]
- Weinberger, R.R. Death by a Thousand Curb Cuts: Evidence on the Effect of Minimum Parking Requirements on the Choice to Drive. Transp. Policy 2012, 20, 93–102. [Google Scholar] [CrossRef]
- Marsden, G.R. The Evidence Base for Parking Policies—A Review. Transp. Policy 2006, 13, 447–457. [Google Scholar] [CrossRef]
- Jakobsson, C.; Fujii, S.; Gärling, T. Determinants of private car users’ acceptance of road pricing. Transp. Policy 2000, 7, 153–158. [Google Scholar] [CrossRef]
- Arnott, R.; Inci, E. An Integrated Model of Downtown Parking and Traffic Congestion. J. Urban Econ. 2006, 60, 418–442. [Google Scholar] [CrossRef]
- Litman, T. Parking Management Best Practices, Updated ed.; Victoria Transport Policy Institute: Victoria, BC, Canada, 2024. [Google Scholar] [CrossRef]
- Singh, G.; Jyoti, D.; Kumar, R. DyPARK: A Dynamic Pricing and Allocation Scheme for Smart On-Street Parking System. IEEE Trans. Intell. Transp. Syst. 2023, 24, 4217–4234. [Google Scholar] [CrossRef]
- Thomas, D.; Kovoor, B.C. A Genetic Algorithm Approach to Autonomous Smart Vehicle Parking System. Procedia Comput. Sci. 2018, 125, 68–76. [Google Scholar] [CrossRef]
- Elfaki, A.O.; Messoudi, W.; Bushnag, A.; Abuzneid, S.; Alhmiedat, T. Constraint Optimization Model for Dynamic Parking Space Allocation. Sensors 2024, 24, 3988. [Google Scholar] [CrossRef]
- Mladenoviċ, M.; Delot, T.; Laporte, G.; Wilbaut, C. A Scalable Dynamic Parking Allocation Framework. Comput. Oper. Res. 2021, 125, 105080. [Google Scholar] [CrossRef]
- Nakazato, T.; Fujimaki, Y.; Namerikawa, T. Parking Lot Allocation Using Rematching and Dynamic Parking Fee Design. IEEE Trans. Control Network Syst. 2022, 9, 1692–1703. [Google Scholar] [CrossRef]
- Sahu, D.; Sinha, P.; Prakash, S.; Yang, T.; Rathore, R.S.; Wang, L. A Multi-Objective Optimization Framework for Smart Parking Using Digital Twin, Pareto Front, MDP and PSO for Smart Cities. Sci. Rep. 2025, 15, 7783. [Google Scholar] [CrossRef]
- Yang, T.; Zhao, L.; Huang, M. Empirical Research on Residents’ Acceptance of Reserved Parking. In Proceedings of the 2024 International Conference on Artificial Intelligence and Data Mining (ICAIDM 2024), Hangzhou, China, 20–22 April 2024; Atlantis Press: Dordrecht, The Netherlands. [Google Scholar] [CrossRef]
- Chen, R.; Gao, G.; Kang, L.-J.; Zhang, L.-Y. Efficiency and Equity Analysis on Parking Reservation. Transp. Res. Part E Logist. Transp. Rev. 2024, 187, 103606. [Google Scholar] [CrossRef]
- Xu, D.; Sun, H. Research on Parking Service Optimization Based on Permit Reservation and Allocation. J. Adv. Transp. 2022, 2022, 8364988. [Google Scholar] [CrossRef]
- Panayiotou, T.; Mavrovouniotis, M.; Ellinas, G. On the Fair-Efficient Charging Scheduling of Electric Vehicles in Parking Structures. In Proceedings of the 2021 IEEE International Intelligent Transportation Systems Conference (ITSC), Indianapolis, IN, USA, 19–22 September 2021; pp. 1627–1634. [Google Scholar] [CrossRef]
- Alahmadi, S.; Hakeem, A.; Attiah, A.; Alghamdi, B.; Mohaisen, L. Towards Scalable and Privacy Enhanced On-Street Parking Management: A Roadmap for Future Inquiry. Electronics 2023, 12, 4160. [Google Scholar] [CrossRef]
- İnaç, H. Efficient On-Street Parking Management: Priority Parking Permits for Residents Integrated with Digital Systems—Case of Istanbul. J. Intell. Transp. Syst. Appl. 2025, 8, 256. [Google Scholar] [CrossRef]
- Ebrahimi, M.; Ebrahimi, M.; Shafie-khah, M.; Laaksonen, H. The Role of EV Parking Lots for Supporting the Distribution System Operation Considering EV Uncertainties. Transp. Res. Procedia. 2023, 70, 263–270. [Google Scholar] [CrossRef]
- Drašković, D.; Vukićević, S. A Model of Software System for Parking Using Search Algorithms. In Proceedings of the 35th International Convention on Information and Communication Technology, Electronics and Microelectronics (MIPRO 2012), Opatija, Croatia, 21–25 May 2012. [Google Scholar]
- Wang, X.; Guo, Z.; Hou, J.; Li, T. Optimal Allocation of Private Parking Spaces in Shared Parking Systems Considering EV Charging: A Lagrangian Relaxation Based Decomposition Approach. Comput. Ind. Eng. 2025, 205, 111170. [Google Scholar] [CrossRef]
- Burns, A.; Forsythe, C.R.; Michalek, J.J.; Whitefoot, K. Estimating the Potential for Dynamic Parking Reservation Systems to Increase Delivery Vehicle Accommodation. Transp. Res. Part A Policy Pract. 2025, 193, 104380. [Google Scholar] [CrossRef]
- Renuka, R.; Dhanalakshmi, S. Android Based Smart Parking System Using Slot Allocation and Reservations. ARPN J. Eng. Appl. Sci. 2015, 10, 3116–3120. Available online: https://arpnjournals.com/jeas/research_papers/rp_2015/jeas_0415_1892.pdf (accessed on 5 June 2025).
- Aswath, S.; Kishore, N.; Thinagaran, S.K.; Vishwaa, M.; Hariharan, A.; Vasavi, C.S.; Karthikeyan, B. Smart Car Parking System with Online Reservation. Procedia Comput. Sci. 2025, 258, 2777–2786. [Google Scholar] [CrossRef]
- Zhang, X.; Pitera, K.; Wang, Y. Parking Reservation Techniques: A Review of Research Topics, Considerations, and Optimization Methods. J. Traffic Transp. Eng. (Engl. Ed.) 2023, 10, 1099–1117. [Google Scholar] [CrossRef]
- Ismael, A.; Holguín-Veras, J. Optimal Parking Allocation for Heterogeneous Vehicle Types. Transp. Res. Part A Policy Pract. 2025, 192, 104357. [Google Scholar] [CrossRef]
- Mikušová, M.; Abdunazarov, J.; Żukowska, J.; Usmankulov, A. Designing of Parking Spaces Taking into Account the Parameters of Design Vehicles in Russia. Computation 2020, 8, 71. [Google Scholar] [CrossRef]
- Maina, R.M.; Kiprop, A.K.; Muriithi, C.M. A mathematical model for optimization of vehicle parking space. OPSEARCH 2025, Online First, 1–18. [Google Scholar] [CrossRef]
- Wang, Q.; Zhang, Y.; Zhang, Y. Optimization Design of Parking Lot Layout—Taking Panzhihua Wanda Outdoor Parking Lot as an Example. In Proceedings of the International Conference on Smart Transportation and City Engineering (STCE 2023); SPIE: Bellingham, WA, USA, 2024; Volume 13018, p. 130184C. [Google Scholar] [CrossRef]
- Kong, Y.; Le Vine, S.; Liu, X. Capacity Impacts and Optimal Geometry of Automated Cars’ Surface Parking Facilities. J. Adv. Transp. 2018, 2018, 6908717. [Google Scholar] [CrossRef]
- Chen, S.; Sun, Q. An Optimization Design of Hybrid Parking Lots in an Automated Environment. Sustainability 2023, 15, 15475. [Google Scholar] [CrossRef]
- Design Standards for Car Parks—Code Reference NP 24–2022; Ministry of Development, Public Works and Administration of Romania; Part I, No. 110 bis/2023; Official Gazette of Romania: Bucharest, Romania, 2023.
- Târcolea, C.; Paris, A.S.; Sylvan, D. Modeling Dependencies in Bivariate Distributions. U.P.B. Sci. Bull. Series A 2020, 82, 150–156. Available online: https://www.scientificbulletin.upb.ro/rev_docs_arhiva/full902_166350.pdf (accessed on 2 July 2025).


Disclaimer/Publisher’s Note: The statements, opinions and data contained in all publications are solely those of the individual author(s) and contributor(s) and not of MDPI and/or the editor(s). MDPI and/or the editor(s) disclaim responsibility for any injury to people or property resulting from any ideas, methods, instructions or products referred to in the content. |
© 2025 by the authors. Licensee MDPI, Basel, Switzerland. This article is an open access article distributed under the terms and conditions of the Creative Commons Attribution (CC BY) license (https://creativecommons.org/licenses/by/4.0/).