Article

An Improved Case-Based Reasoning Method Based on Dynamic Entropy Weighting: A Case Study of Scenario Prediction for Major Maritime Emergencies

College of Systems Engineering, National University of Defense Technology, Changsha 410073, China
*
Author to whom correspondence should be addressed.
Systems 2025, 13(9), 766; https://doi.org/10.3390/systems13090766
Submission received: 8 July 2025 / Revised: 23 August 2025 / Accepted: 27 August 2025 / Published: 1 September 2025
(This article belongs to the Section Artificial Intelligence and Digital Systems Engineering)

Abstract

The retrieval mechanism of traditional CBR methods has limitations when applied to complex multi-layer objects, mainly due to their nonlinearity and emergent properties. This paper proposes an improved case-based reasoning method with cascaded retrieval (CRCBR) to address the aforementioned issues, but the non-fixed model structure makes it difficult to determine appropriate weight calculation methods for CRCBR. To tackle this problem, we propose a dynamic entropy weight method for heterogeneous multi-attribute data, which designs separate entropy calculation methods for different data types and computes weights through a flexible secondary allocation mechanism. Finally, using seven evaluation metrics and three assessment perspectives as the evaluation framework, we validate the effectiveness and superiority of our method through comparative experiments with traditional CBR and CRCBR without dynamic entropy weighting (termed the baseline method) on real-world maritime emergency data. The experimental results show that our method surpasses traditional CBR across all three evaluation perspectives, outperforms the baseline in two perspectives, and is no worse than the baseline in the remaining perspective.

1. Introduction

Case-based reasoning (CBR), as an intelligent reasoning method, has evolved many meaningful variants since its establishment in the 1980s and has been widely applied in many fields. With the increasing complexity of problems [1], many traditional intelligent methods are becoming inadequate, while some new approaches (such as deep learning and large language models) are emerging. CBR has advantages, such as strong interpretability, fast reasoning speed, and small-sample friendliness, making it favored in many fields, but it performs mediocrely in many complex problems (e.g., financial markets, large-scale complex engineering). The improvement of traditional CBR methods for complex problems has become an important focus for scholars in this field. Analyzing the impact of complex system characteristics on traditional case-based reasoning methods and making corresponding improvements form the core starting point of this paper.
Do the characteristics of complex systems, such as emergence, affect the effectiveness of CBR in retrieving similar cases? This question can be affirmatively supported by referring to relevant theoretical research on complex systems [2]. However, there is relatively little methodological research in CBR related to this aspect. The most commonly used retrieval mechanism in traditional CBR is the distance-based k-nearest neighbors method, on which there are abundant improvement studies [3,4,5,6], while some scholars have approached retrieval efficiency enhancement from the case base perspective [5,7]. Additionally, a body of research has emerged in new directions, such as uncertain case reasoning [8,9] and machine learning-integrated case reasoning [10]. These studies have improved the efficiency of traditional methods or expanded their application boundaries, but research on retrieval mechanism improvements for complex systems remains scarce. Complex systems are among the most concerning research issues in today’s scientific community, and the study and solution of complex system characteristics have always been cutting-edge hotspots in various fields. Clarifying the manifestations of complex system characteristics’ impact on CBR retrieval effectiveness, and improving and resolving adverse effects, represent a major challenge in expanding the applicability of CBR. This challenge stems from the fact that improving the CBR retrieval mechanism to address the impact of complex system characteristics is essentially a problem of redesigning the case base container.
Moreover, the challenges posed by complex systems to CBR methods lie not only in the retrieval mechanism but also in testing various components, including case modeling, similarity computation models, and weight allocation methods. To address the nonlinearity and emergence characteristics of complex systems, case modeling relaxes model constraints, as fully deterministic structural modeling is unsuitable for complex systems; a better approach is to adopt non-fixed structural models. This means focusing on capturing the main structure of the model without constraining the detailed structure. Non-fixed models impose new requirements on CBR weight allocation; although existing research has yielded substantial findings in subjective–objective weighting [11,12,13,14], hybrid weighting [14,15,16,17], and dynamic weighting methods [18,19], weighting approaches for non-fixed models remain relatively unexplored. How to allocate weights in the similarity calculation process for non-fixed structure case models to better coordinate with the retrieval mechanism and improve the overall performance of the CBR method is another challenge of this paper. This challenge stems from the non-fixed structure modeling method adopted to adapt to complex system case modeling, which is essentially an ontology-based knowledge container design problem.
The existing research on CBR improvements rarely focuses on the impact of complex system characteristics (such as emergence) on the effectiveness of CBR methods. Although numerous variant studies of CBR exist in areas such as temporal issues [20], fuzzy reasoning problems [21], and efficient reasoning [3,5], they do not provide strong support for the core objective of this paper. This study improves the application of CBR methods to complex multi-layer objects. The definition of complex multi-layer objects is shown in Concept 1:
Concept 1: Complex Multi-layer Objects. Complex multi-layer objects refer to a class of complex systems that can be divided into multi-level structures from a conceptual perspective. In addition to exhibiting characteristics of complexity, these systems also demonstrate hierarchical characteristics, which makes their analysis less difficult than general complex systems [2].
This study proposes a cascade retrieval-based case-based reasoning method (CRCBR) that enhances reasoning accuracy by simultaneously considering inter-level similarities. Additionally, to address CRCBR’s non-fixed model structure, we propose a dynamic entropy weight method that considers entropy weight calculation for multi-type data and allocates weights through secondary distribution, improving CRCBR performance. Using maritime emergency scenario prediction as a case study with real accident data, we conduct experimental analysis and performance comparison to validate the effectiveness and superiority of our proposed method.
The main contributions of this study can be summarized as follows:
  • Proposed a case-based reasoning method with a cascaded retrieval mechanism to improve traditional CBR’s application to complex multi-layer objects, enhancing its applicability to such problems.
  • Proposed a dynamic entropy weight method with secondary weight allocation to solve the weight assignment difficulty caused by CRCBR’s non-fixed model structure, enhancing CRCBR’s performance.
  • Verified the effectiveness and superiority of the proposed method using real-world maritime emergency accident data.
The remainder of this paper is organized as follows. Section 2 reviews CBR application studies in various domains and the improvement research on retrieval mechanisms and weight computation methods. Section 3 details the proposed methodology. Section 4 demonstrates the application of our method using a major maritime emergency scenario prediction. Section 5 conducts comprehensive comparative and ablation experiments to evaluate method performance. Section 6 concludes the study and outlines potential future research directions.

2. Related Works

This section provides a concise review of CBR-related research, summarizes research progress relevant to this study, identifies gaps in current research focus, and introduces the target problems of this research. Beginning with an introduction to CBR’s foundational theories, it reviews applied CBR research across multiple domains and summarizes emerging challenges and neglected aspects in applied studies. Regarding the difficulties in CBR application research, we analyze advancements and limitations in methodological improvements (primarily retrieval mechanisms and weight allocation), thereby clarifying the key problems to be addressed in this study.

2.1. The Foundation of CBR

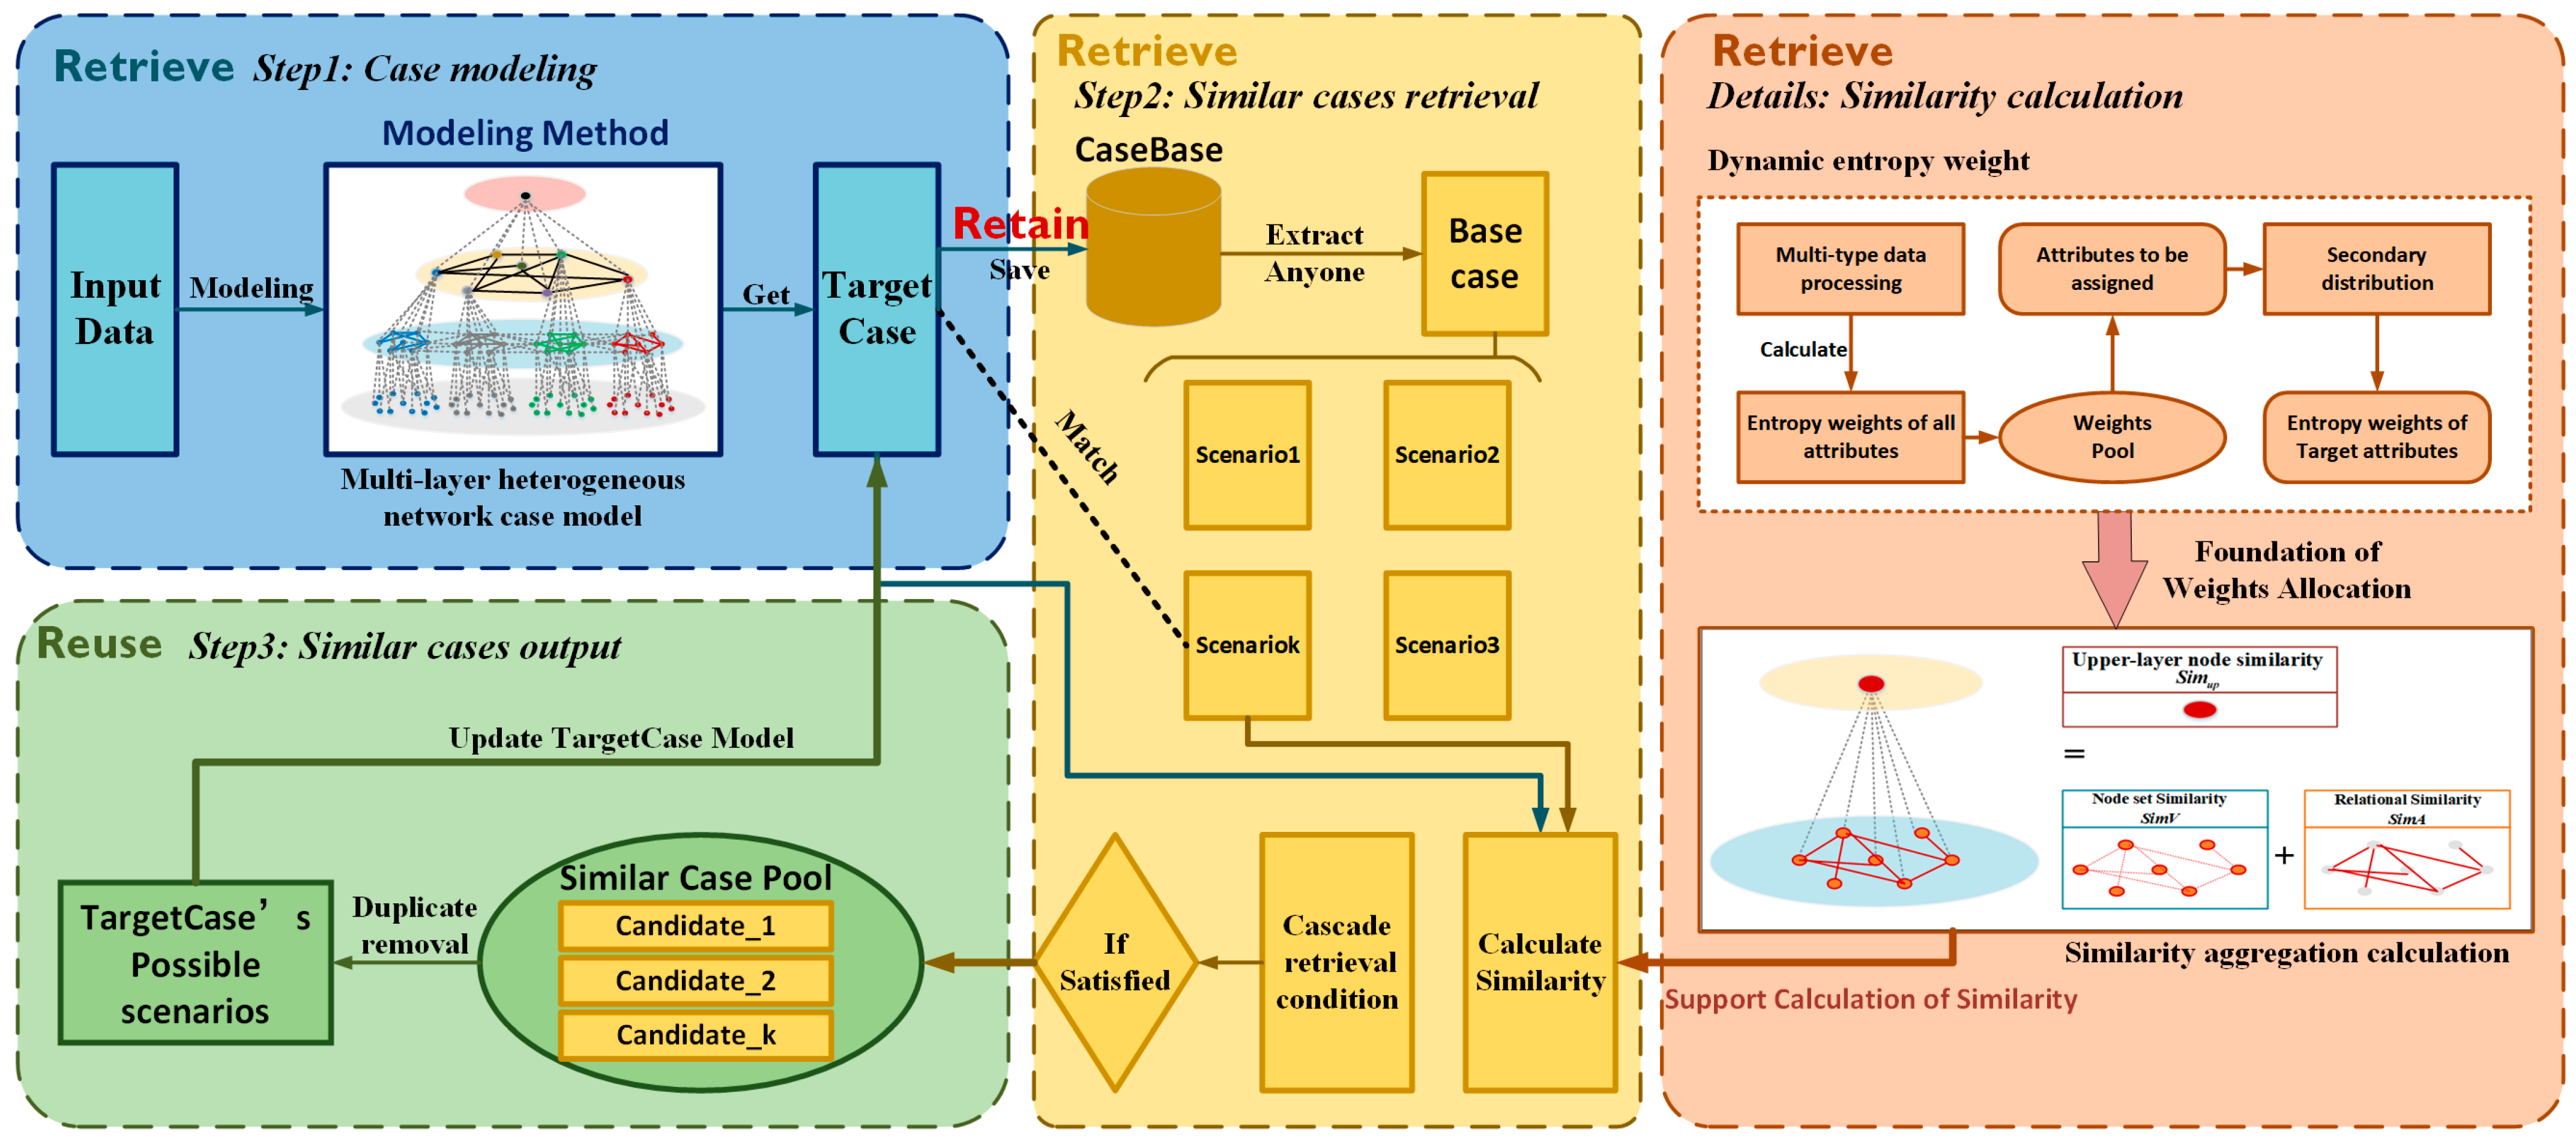
Case-based reasoning (CBR) is a type of analogical reasoning that originated from Roger Schank’s description in Dynamic Memory in 1982. CBR solves problems by comparing target cases with historical cases and adapting solutions. The general CBR process comprises four stages—case retrieval (Retrieve), case reuse (Reuse), case revision (Revise), and case retention (Retain)—which are collectively known as the “4R” life cycle model. When encountering a new problem, CBR first transforms it into a case model to create a target case, then retrieves source cases similar to the target case from the case library. For problem-solving CBR, after retrieving source cases, similar source cases are adapted as needed to solve the problem; whereas for explanatory CBR, it primarily uses similar source cases to explain the target problem (e.g., prediction, decision-making, etc.). After problem resolution, the target case is stored in the case library, achieving dynamic updating of the case library. A generic CBR workflow is shown in Figure 1.

2.2. Application Research of CBR

As a branch of AI, CBR has been widely applied due to its fast reasoning, strong interpretability, and small-sample friendliness, with application studies in medicine, engineering, business, emergency response, etc.
In medicine, CBR has been used in developing clinical decision support systems [22,23] and medical data classification [24]. In engineering, CBR is widely applied in design, management, and decision-making. For engineering design, scholars have applied CBR to develop decision support systems for healthcare facility design [25]; CBR has been widely used in construction site safety risk management [26] and construction project schedule management [27]; Moreover, CBR is commonly seen in mechanical equipment health management [28], power grid emergency response evaluation [29], and rail transit software safety assessment [30]. With the widespread application of advanced information technologies, CBR has also found applications in the Industry 4.0 wave; for instance, some studies have employed CBR to design online optimization methods for chemical and petrochemical processes [31], improving the efficiency of petrochemical processes. In business, scholars have used CBR to develop a corporate strategy response method based on business environment convenience [32], and others have applied CBR to determine business management priorities for operational optimization [33].
In emergency management, CBR also has wide applications. CBR is commonly used in natural disaster-related emergency management problems, such as typhoon damage prediction [34] and landslide risk analysis [35]. Moreover, CBR is favored in emergency response for various incidents, such as public health emergency evolution prediction [36], natural gas pipeline emergency response [37], and urban disaster chain reaction management [38]. More generally, CBR has extensive applications in emergency plan risk analysis [39], emergency decision-making [40,41], rapid crisis response [37], and adaptive response generation [42].
Although CBR has been widely applied in various fields and has produced many practically significant research outcomes, the existing research has paid insufficient attention to more complex problems, such as ultra-large-scale disaster emergency prediction and response, complex financial market trading, and mega-engineering project management. Some scholars have begun to focus on applying and improving CBR for complex problems, such as aerospace engine system fault diagnosis [43] and corporate investment strategy formulation [32], but such research remains relatively scarce.

2.3. Research on Improvements of CBR Retrieval Mechanism

As the core component of CBR capability, the performance of retrieval mechanisms decisively influences overall reasoning effectiveness. Therefore, research on improving retrieval mechanisms remains a hotspot in CBR, yielding various optimization strategies for different problems. Current research primarily focuses on case base reduction, retrieval efficiency improvement, uncertain reasoning, and multi-phase hybrid retrieval strategies. Regarding case base reduction, researchers have proposed various strategies to reduce the search space when addressing challenges from large-scale case bases. Regarding the core issue of how to efficiently reduce case bases with minimal damage, Smyth et al. emphasized its significance and proposed viable solutions [44]. Subsequently, many scholars have further explored this issue. For example, Pérez-Pons et al. (2023) [5] explored a method of progressively reducing case base size until locating similar cases, essentially an evolved form of traditional hierarchical retrieval. Similarly, Nakhjiri et al. [7], Lulu Shen et al. [6], and Yamin et al. [45] have also contributed to this research direction. Improving retrieval efficiency is another important direction, where researchers often employ machine learning for rapid similarity matching. For example, Bouzar-Benlabiod et al. [10] applied neural networks to enhance retrieval efficiency, Hoffmann et al. [46] developed a CBR system using graph neural networks to process embedded graph information, while Mülâyim and Arcos [3] improved retrieval mechanisms using clustering techniques. These methods essentially build upon k-NN or neural network retrieval to improve efficiency. Additionally, some research proposed a distributed CBR system, advocating improved retrieval efficiency through distributed design [47]. For uncertain reasoning, researchers have developed specialized retrieval mechanisms addressing incomplete case base knowledge or inherent problem uncertainty. Methods such as incremental retrieval by Cunningham et al. [8] and progressive retrieval by Low et al. [9] effectively enhance CBR system adaptability and reasoning capability under such complex conditions. For multi-stage hybrid retrieval strategies, scholars argue that combining the strengths of multiple retrieval mechanisms is an effective approach to enhance overall retrieval capability. This is manifested in multi-stage retrieval design [45,48,49] and hybrid retrieval strategies [6,49]. The MAC/FAC retrieval mechanism [50] represents one of the most seminal works in this domain, pioneering a two-stage retrieval strategy of coarse filtering followed by fine filtering. By applying different strategies in stages or integrating multiple techniques (e.g., k-NN, clustering, neural networks), more comprehensive and accurate optimal similar case selection is achieved.
The existing research has made significant progress in improving CBR retrieval efficiency and expanded CBR applications to large-scale case bases and uncertain reasoning scenarios. However, improvement research for complex systems, particularly CMOs, remains insufficient, hindering CBR applications in many current complex problem domains. The inherent nonlinearity and emergence characteristics of complex systems and CMOs introduce theoretical errors in CBR similarity analysis, compromising its accuracy. Therefore, corresponding improvements to CBR retrieval mechanisms are essential to address this issue.

2.4. Research on CBR Weight Calculation

Effective weight calculation methods are crucial for improving CBR reasoning performance. For many problems, especially complex ones, similarity computation requires aggregating local similarities into global similarity. The aggregation process involves determining weights for different similarity components.
Numerous studies exist on CBR weight calculation methods, employing various approaches, including data-driven objective weighting, statistics-based weighting, machine learning-based weighting, and hybrid weighting methods. Objective weighting calculates weights based on data distribution and information gain, such as using intuitionistic fuzzy numbers [12] or indicator coverage of reasoning targets [36], with entropy weighting [51] and its variants [19,52] being most common. Some researchers employ statistical approaches, such as Chen et al. [53] using gray relational analysis and gray wolf optimization for weight allocation, and Guo et al. [11] developing a weighted Dirichlet hyperparameter algorithm for CBR weighting. With the advancement of machine learning technologies, weighting can now be accomplished through learning techniques. Armengol et al. employed a learning-based weighting method in fuzzy-set CBR systems [21], enabling automatic weight optimization. However, this model is built on the premise of a fixed case structure and is not suitable for the non-fixed structure model problem discussed in this paper. Ronny et al. proposed a weight allocation method for temporal CBR systems, which uses automated binary weights to calculate weights for temporal case data [20]. Similarly, this model is applicable to fixed structure models rather than non-fixed structure models. Furthermore, some researchers have utilized genetic algorithms to design weighting methods for CBR systems [54], also aiming to address automatic weight optimization. Recognizing the limitations of single approaches, hybrid methods have emerged, such as Wang et al.’s [13] CRITIC-H2TLWMSM, Wang et al.’s [14] AHP-entropy, and Zou et al.’s [15] improved game theory-based methods.
The entropy weight method, as one of the most classical algorithms in objective weighting, is frequently used in CBR weight calculation. For instance, Liao et al. [51] employed entropy weighting, Gao et al. [28] used modified intuitionistic fuzzy entropy, and Shahina et al. [55] developed a multiscale multivariate entropy weighting method. These studies demonstrate the effectiveness of entropy weighting in CBR. However, traditional entropy weighting’s limitations (numeric-only applicability and lack of dynamism) hinder its use in more complex CBR problems. Some scholars have proposed solutions to address these issues. Examples include Zhang et al.’s [19] dynamic relative entropy weighting, Ke et al.’s [52] hierarchical weighted permutation entropy, and Duan et al.’s [18] dynamically allocated entropy weighting for uncertain situations.
Although there are many studies on CBR weighting methods, some newer CBR approaches still lack matching weighting methods, with CRCBR being a typical case. The complex problems addressed by CRCBR often involve non-fixed model structures and complicated computation processes, which hinder the application of certain weighting methods (e.g., statistics-based or subjective weighting approaches). Therefore, developing an objective weighting method suitable for CRCBR is an urgent problem to be solved.

3. Methodology

This section elaborates on the CRCBR method based on dynamic entropy weighting. First, the details of the CRCBR method are introduced, covering three main components: case modeling methods, similarity computation models, and cascade retrieval mechanisms, corresponding to the ‘Retrieve’ phase in the basic CBR workflow. The dynamic entropy weighting method is then presented. It is applied for weight allocation in similarity computation models, addressing similarity computation problems for non-fixed structure models and multi-type data. Figure 2 shows the framework diagram of our proposed method, briefly describing its basic workflow and key innovations.

3.1. Cascade Retrieval-Based Case-Based Reasoning

Cascade retrieval-based case-based reasoning (CRCBR) is a case-based reasoning method designed for complex objects, particularly complex multi-layer objects (hereafter CMOs). Besides the disordered characteristics of general complex systems (e.g., nonlinearity, emergence), CMOs possess ordered hierarchical features from certain perspectives, making them less analytically challenging. The following briefly introduces CRCBR through its key components: case modeling, similarity computation, and retrieval mechanism.

3.1.1. Case Modeling

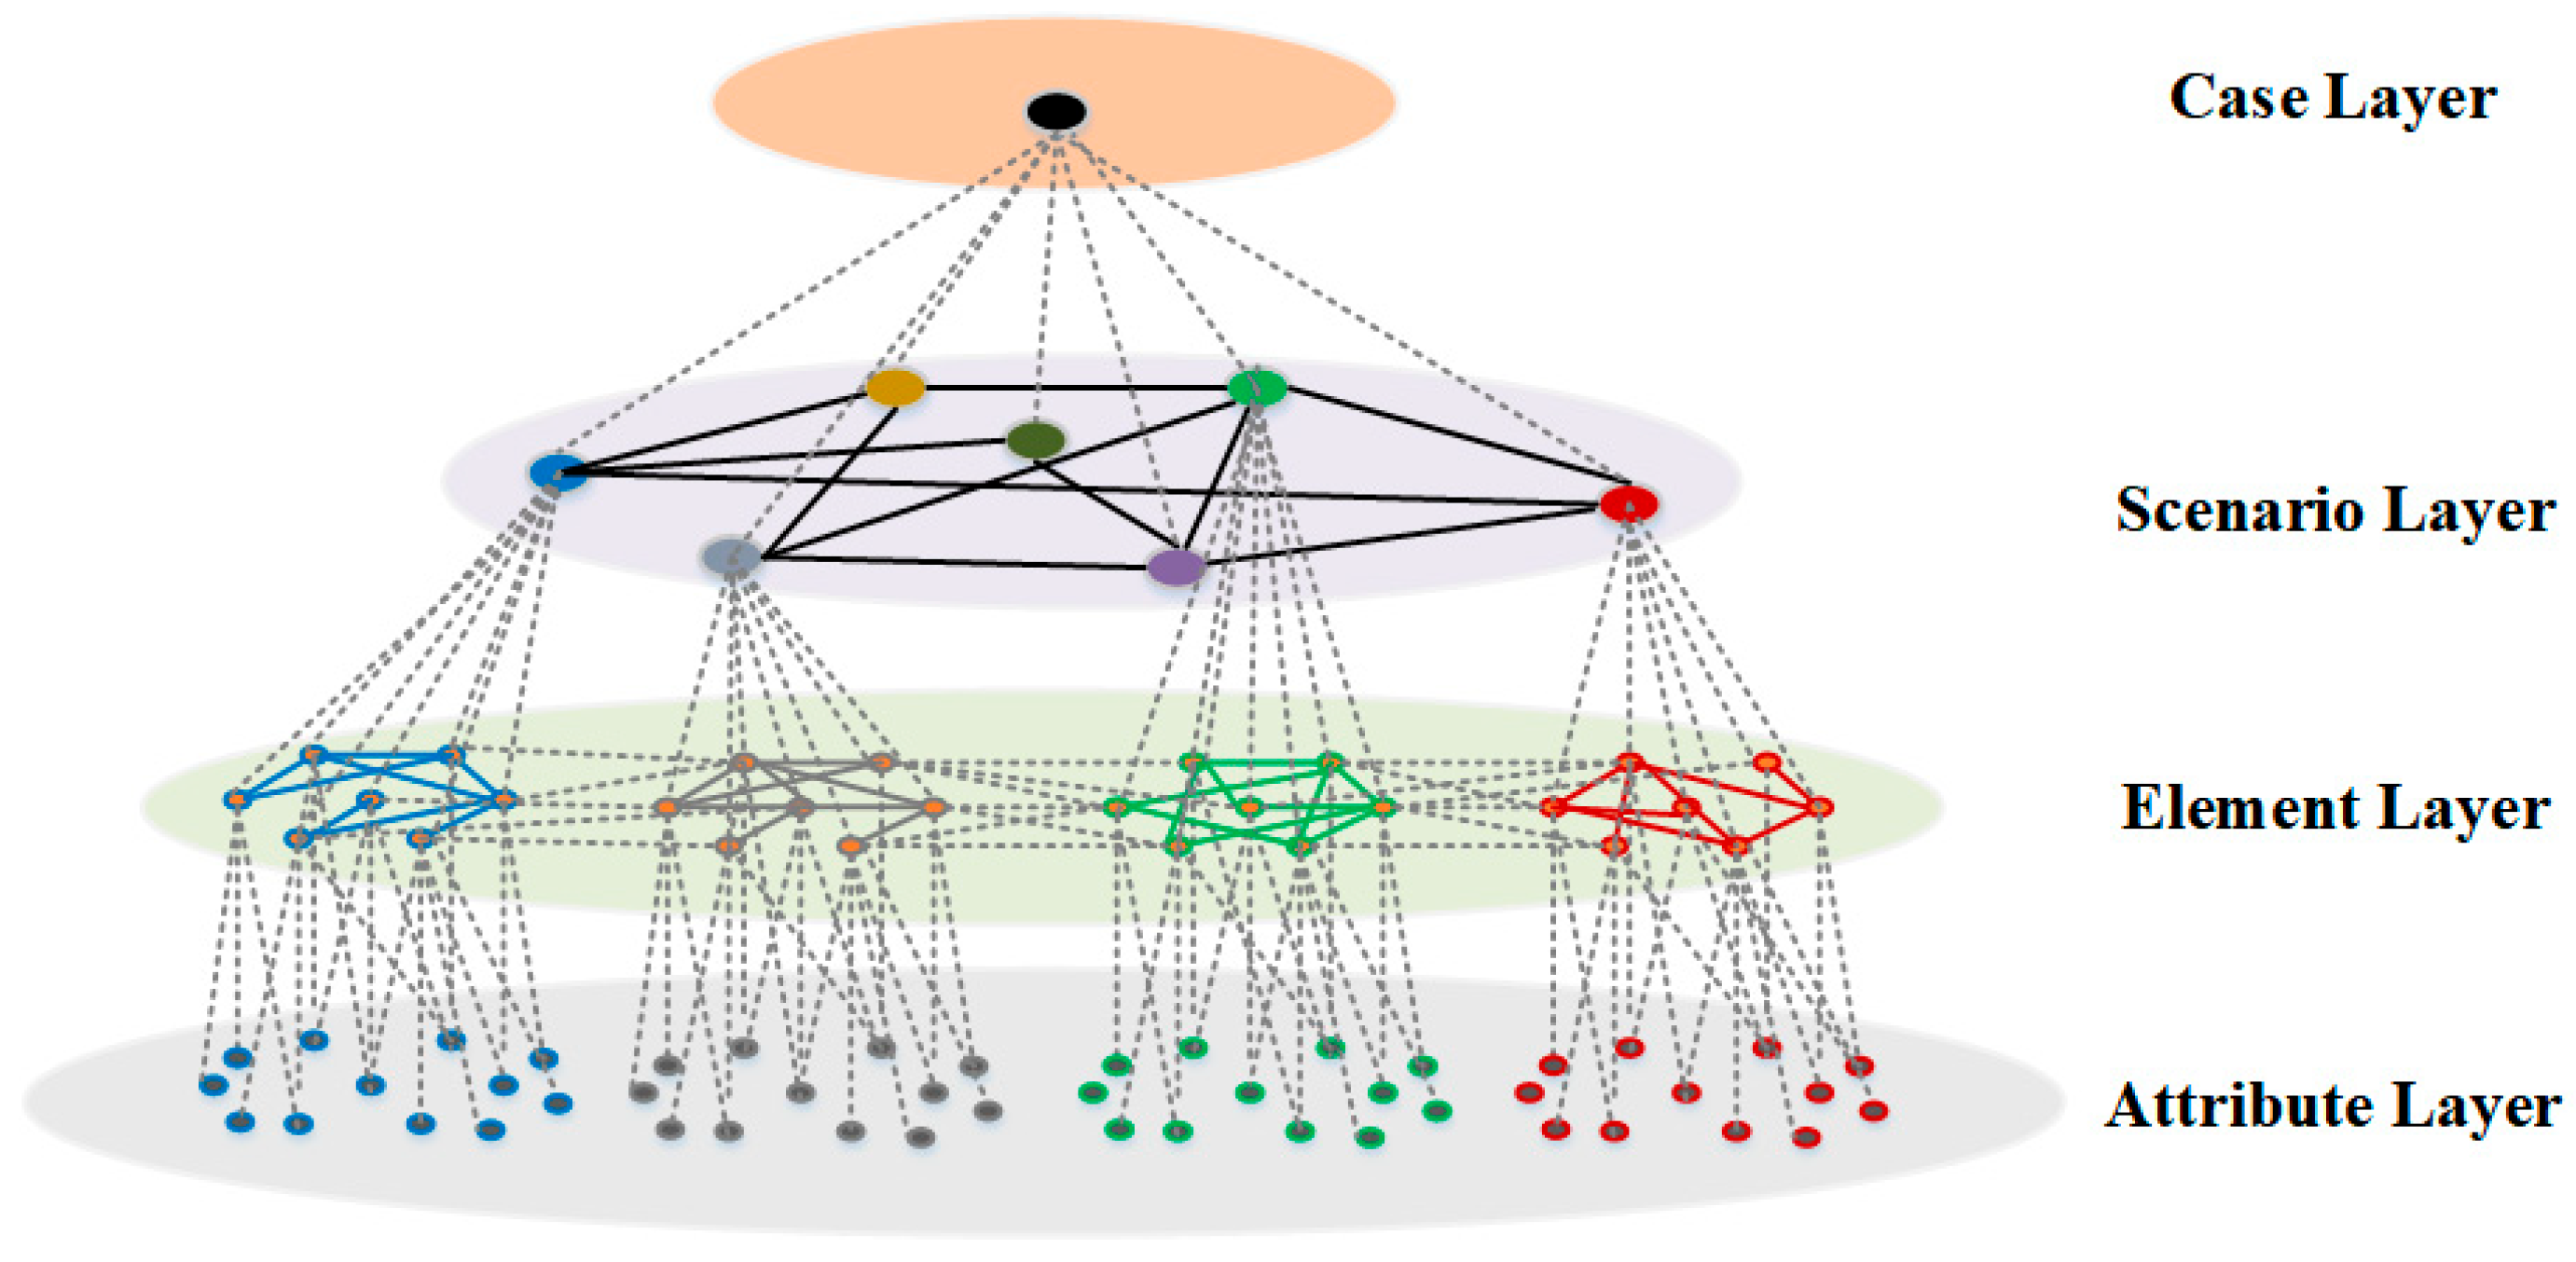
Considering CMOs’ disordered complexity and ordered hierarchy, multi-layer heterogeneous networks can effectively model these characteristics. Therefore, CRCBR often uses multi-layer heterogeneous networks as the modeling approach for case construction.
Assuming a CMO has M hierarchical levels with conceptual subordinate relationships between levels, its corresponding multi-layer heterogeneous network can be modeled as:
G = ( N , O ) = { N [ 1 ] , N [ 2 ] , , N [ M ] ; O [ 1 , 2 ] , O [ 2 , 3 ] , , O [ α , β ] , ( β { 2 , , M } , α = β 1 ) }
In this formulation, N [ α ] denotes the network at the α -th layer, while O [ α , β ] represents the set of inter-layer connections between the α -th and β -th layers. The network at the α -th layer, denoted as N [ α ] , is formally defined as N [ α ] = { V [ α ] , A [ α ] } , where V [ α ] represents the node set of the α -th layer network, and A [ α ] corresponds to its adjacency matrix. The adjacency matrix is defined as A [ α ] = { a [ α ] i j } ( i , j m ) , where a [ α ] i j is a binary indicator of edge existence between nodes i and j in the α -th layer network (1 for presence, 0 for absence), and m denotes the cardinality of nodes in the α -th layer network.
Based on the network’s hierarchical characteristics, the levels are divided into three types: top, bottom, and middle layers. Middle-layer nodes, bearing primary connectivity relationships, are often the focus of case-based reasoning analysis. The case model based on the multi-layer heterogeneous network is shown in Figure 3.

3.1.2. Similarity Computation Model

The similarity computation model is the fundamental basis for similar case retrieval and one of the core components of case-based reasoning. Highly correlated with case modeling, CRCBR’s typical similarity computation model integrates local–global and hierarchical computation models, termed as an aggregation model. The local–global principle is a similarity computation model designed for calculating the similarity of complex-structured targets [56]. For case models represented as multi-layer heterogeneous networks, similarity computation within a single layer essentially measures that layer’s network similarity, thus enabling the local–global computation of both network components and the entire layer. Subsequently, a hierarchical computation model aggregates similarity across different network layers, yielding target similarity based on analysis objectives. The computational principles of the aggregation model are described in the following steps, with model schematics shown in Figure 3. Without loss of generality, we denote input data as Targetcases and standardized case base data as Basecases.
In the aggregation model, upper-level node similarity is obtained by computing the similarity of their associated lower-level local networks. The similarity of associated lower-level local networks comprises two components: node set similarity and relational similarity. This relationship can be expressed by Equation (2):
S i m u p = w V S i m V + w A S i m A
where S i m u p represents the upper-layer node similarity, with SimV and SimA denoting node set similarity and relational similarity, respectively, while w V and w A correspond to the weighting coefficients for SimV and SimA.
Since case modeling provides only a framework for modeling data into case models rather than completely fixed structures, structural differences often exist between different case models. We introduce structural similarity [57] to measure structural differences, calculated using Jaccard Similarity, as shown in Equation (3):
T S i m = | O T O B | | O T O B |
where T S i m represents the structural similarity measure, O T denotes the element set of Targetcase, and O B corresponds to the element set of Basecase.
For relational similarity SimA, simply compute the similarity between the adjacency matrices of Targetcase and Basecase, then multiply by their structural similarity. The computation of SimA is given by Equation (4), while the adjacency matrix similarity is calculated via Equation (5):
S i m A = S i m A M T S i m A
S i m A M = g = 1 m 2 S i m ( a T g , a B g ) m 2 , S i m ( a T k , a B k ) = 1 , a T k = a B k 0 , a T k a B k
where S i m A M denotes the adjacency matrix similarity, T S i m A represents the relational structural similarity, with a T i and a B i , (i ∈ {1,…,m}) corresponding to elements in the adjacency matrices of Targetcase and Basecase, respectively, and m indicating the cardinality of intersecting elements in the adjacency matrices of Targetcase and Basecase.
Node set similarity SimV consists of two parts: (1) weighted sum of node similarities, and (2) node set structural similarity. SimV is obtained by multiplying these two components, as shown in Equation (6):
S i m V = ( i = 1 l w v i S i m v i ) T S i m V
where S i m v i represents the similarity measure of the i-th node, w v i denotes its corresponding weighting coefficient, l indicates the cardinality of nodes in the layer network, and T S i m V corresponds to the node set structural similarity.
For any node in the node set, it is also the upper-level node of its next layer, so its similarity calculation follows the same process described above. For bottom-layer networks without subordinate layers, node similarity can be calculated using appropriate methods (e.g., Euclidean distance, Manhattan distance) based on node characteristics, while relational similarity remains computed via Equations (3)–(5).

3.1.3. Cascade Retrieval Mechanism

The retrieval mechanism is one of the core components affecting CBR performance. In the similarity determination problem of case-based reasoning, after calculating the case similarity values, the similarity between target and source cases can be determined based on whether the values meet threshold requirements. This decision logic is simple and practical, but the locality of case modeling and similarity computation introduces errors in target similarity, which are more prevalent and severe for complex objects, impairing true similarity judgment.
The cascade retrieval mechanism determines true similarity by considering both target similarity and associated component similarity, reducing errors from model locality. The specific implementation principles of cascade retrieval in CRCBR are described below.
For a middle layer node V α , let SimS be the similarity computed through the case model, SimR be the similarity from complex relationships between associated lower-level local networks and the overall lower-level network, and ε be the residual similarity from unobservable parts, then the V α ’s true similarity Sim is given by Equation (7):
S i m = S i m S + S i m R + ε S i m R = f ( { V n } ) , n Z +
where f ( ) is a nonlinear function, and { V n } is the node set with complex relationships in V α ’s associated lower-level network.
SimS can be obtained through the similarity computation model, while SimR is difficult to quantify. Although difficult to quantify, SimR’s impact on true similarity Sim cannot be ignored [58,59,60]. Neglecting SimR’s effect leads to erroneously equating Sim with SimS, causing misjudgment of true similarity. Common similarity misjudgments’ causes are illustrated in Figure 4, and common misjudgments are shown in Table 1.
Consider that due to the conceptual hierarchical structure of the case model, for V α , SimR also represents similarity generated by the complex relationships between V α and other same-level nodes. Thus, according to the case model, SimR is incorporated in the similarity of V α ’s superior nodes, as shown in Equation (8):
S i m R S i m u p
where S i m u p is the similarity of superordinate nodes.
Since the true similarity Sim of V α requires comprehensive consideration of SimS and SimR, we can evaluate SimS and SimR separately and combine their results as the final similarity assessment. The comprehensive evaluation of SimS and SimR can be expressed by Equation (9):
S i m φ S i m S φ 1 S i m R φ 2
Combined with Equation (8), the decision formula is transformed into Equation (10):
S i m φ S i m S φ 1 S i m u p φ 3
where φ is V α ’s true similarity threshold, φ 1 for SimS, φ 2 for SimR, and φ 3 for S i m u p .
In summary, the process of target similarity determination using the cascade retrieval mechanism is completed.

3.2. Dynamic Entropy Weight

The entropy weight method is one of the most classical objective weighting methods and has been widely applied in many fields. In CRCBR, the similarity aggregation process involves multiple weighted summations, where effective weight assignment is crucial for result validity. However, CRCBR’s non-fixed case models and data heterogeneity challenge entropy weight application, prompting our proposed dynamic entropy weight method for CRCBR weighting.

3.2.1. Entropy Weight

The entropy weight method obtains indicator weights by calculating information entropy, with the basic principles described below.
First, standardize all sample data. Considering indicator preferences, normalization formulas for positive/negative indicators are given in Equations (11) and (12):
z i j = x i j min ( x j ) max ( x j ) min ( x j )
z i j = max ( x j ) x i j max ( x j ) min ( x j )
where x i j is the value of the j-th indicator for the i-th sample, x j is the value list of the j-th indicator, and z i j is the normalized value of the j-th indicator for the i-th sample.
After standardization, we obtain the decision matrix Z = ( z i j ) m × n , 0 z i j 1 , composed of original sample data and all indicators, where m and n are the numbers of samples and indicators, respectively.
Since CRCBR does not completely fix the case model structure, structural differences may exist between different case models, leading to sample size variations. These sample size differences result in missing values in decision matrix Z, which are skipped during computation, with only non-missing values being processed.
The proportion matrix P = ( p i j ) m × n is further calculated from the decision matrix Z, as shown in Equation (13):
p i j = z i j i v a l i d z i j , z i j   i s   n o t   e m p t y N u l l , z i j   i s   e m p t y , i [ 1 , , m v a l i d ] , j [ 1 , , n ]
where p i j is the proportion value corresponding to z i j , m v a l i d is the effective sample size for the j-th indicator, with m v a l i d m max , m max = max ( l e n ( x j ) ) being the maximum sample size, and l e n ( ) being the counting function.
The information entropy is further calculated from the proportion matrix P, as shown in Equation (14):
e j = k i = 1 m v a l i d p i j ln p i j
where e j is the information entropy of the j-th indicator, and k = 1 / ln m v a l i d is the normalization coefficient.
After obtaining all indicators’ information entropy, the divergence coefficients are further calculated as shown in Equation (15):
d j = 1 e j
where d j is the divergence coefficient of the j-th indicator.
The weights corresponding to each indicator’s divergence coefficient are obtained as shown in Equation (16):
w j = d j j = 1 n d j
where w j is the weight of the j-th indicator.

3.2.2. Multi-Type Data Processing

Conventional entropy weighting can only process precise numerical data, while case-based reasoning typically handles multiple data types. For our practical application needs, we present the application and processing methods of entropy weighting for interval numerical data, list-type numerical data, and textual data.
For interval-valued data x i j = [ a , b ] , assuming uniform distribution, the interval midpoint is taken as the estimated value, as shown in Equation (17):
x i j = a + b 2
where x i j is an interval sample datum, a and b are the lower and upper bounds, and x i j is the processed value of x i j .
For list-type numerical data x i j = [ x 1 , x 2 , , x n ] , the weighted average of the value list is taken as the estimate, as shown in Equation (18).
x i j = 1 n k = 1 n x k
For textual data x i j t e x t , a text-to-value mapping f : t e x t R is established, and the mapped value is taken as the processed value, as shown in Equation (19).
x i j = f ( x i j )

3.2.3. Dynamic Assignment

Due to non-fixed case models, structural differences exist between the Targetcase and Basecases. This necessitates weight allocation for each aggregation operation during similarity computation. Therefore, we propose a dynamic weighting method: first computing a weight pool via enhanced entropy weighting, then performing secondary allocation by extracting relevant weights [18]. The specific process is as follows.
Let W = { w i , i ( 1 , 2 , , n ) } be the indicator weight pool obtained via improved entropy weighting, and W = { w α , w α W } be the relevant indicator list for an aggregation operation. Then for any weight w α i in it:
w α i = w α i w α i
Apply Equation (20) processing to all indicators in W to obtain the secondary weight list W p r o c e s s e d = { w α i } for this aggregation operation.

4. Case Study

This section demonstrates our method’s application using a major maritime emergency scenario prediction as an example. Major maritime emergencies are incidents in marine environments that severely impact or may impact life, property, or ecological safety. Such emergencies typically involve concurrent multi-type accidents as complex disasters. Therefore, summarizing typical accidents as scenarios is crucial for rapid situation assessment.
Scenario prediction problems belong to explanatory CBR problems, focusing on predicting scenarios of major maritime emergencies based on scenario occurrences from similar cases; thus, the “Revise” phase in CBR is largely irrelevant. This section follows the “Retrieve–Reuse–Retain” workflow to demonstrate our method through the following: major maritime emergency case modeling, case base construction, similarity computation model design, weight allocation, retrieval mechanism configuration, and prediction result output.

4.1. Data Introduction and Processing

This paper uses scenario prediction for major maritime emergencies as an application example. Regarding such problems, publicly available data primarily consists of marine accident investigation reports, which cannot be directly used as input for CRCBR systems. We collected a set of official accident investigation reports published by the International Maritime Organization (IMO) and the China Maritime Safety Administration. Based on our proposed case modeling approach, we manually reviewed and extracted information from each report to generate corresponding case models. We initially constructed a case base containing 30 accident cases from various countries and regions, covering different accident severity levels to ensure representativeness.
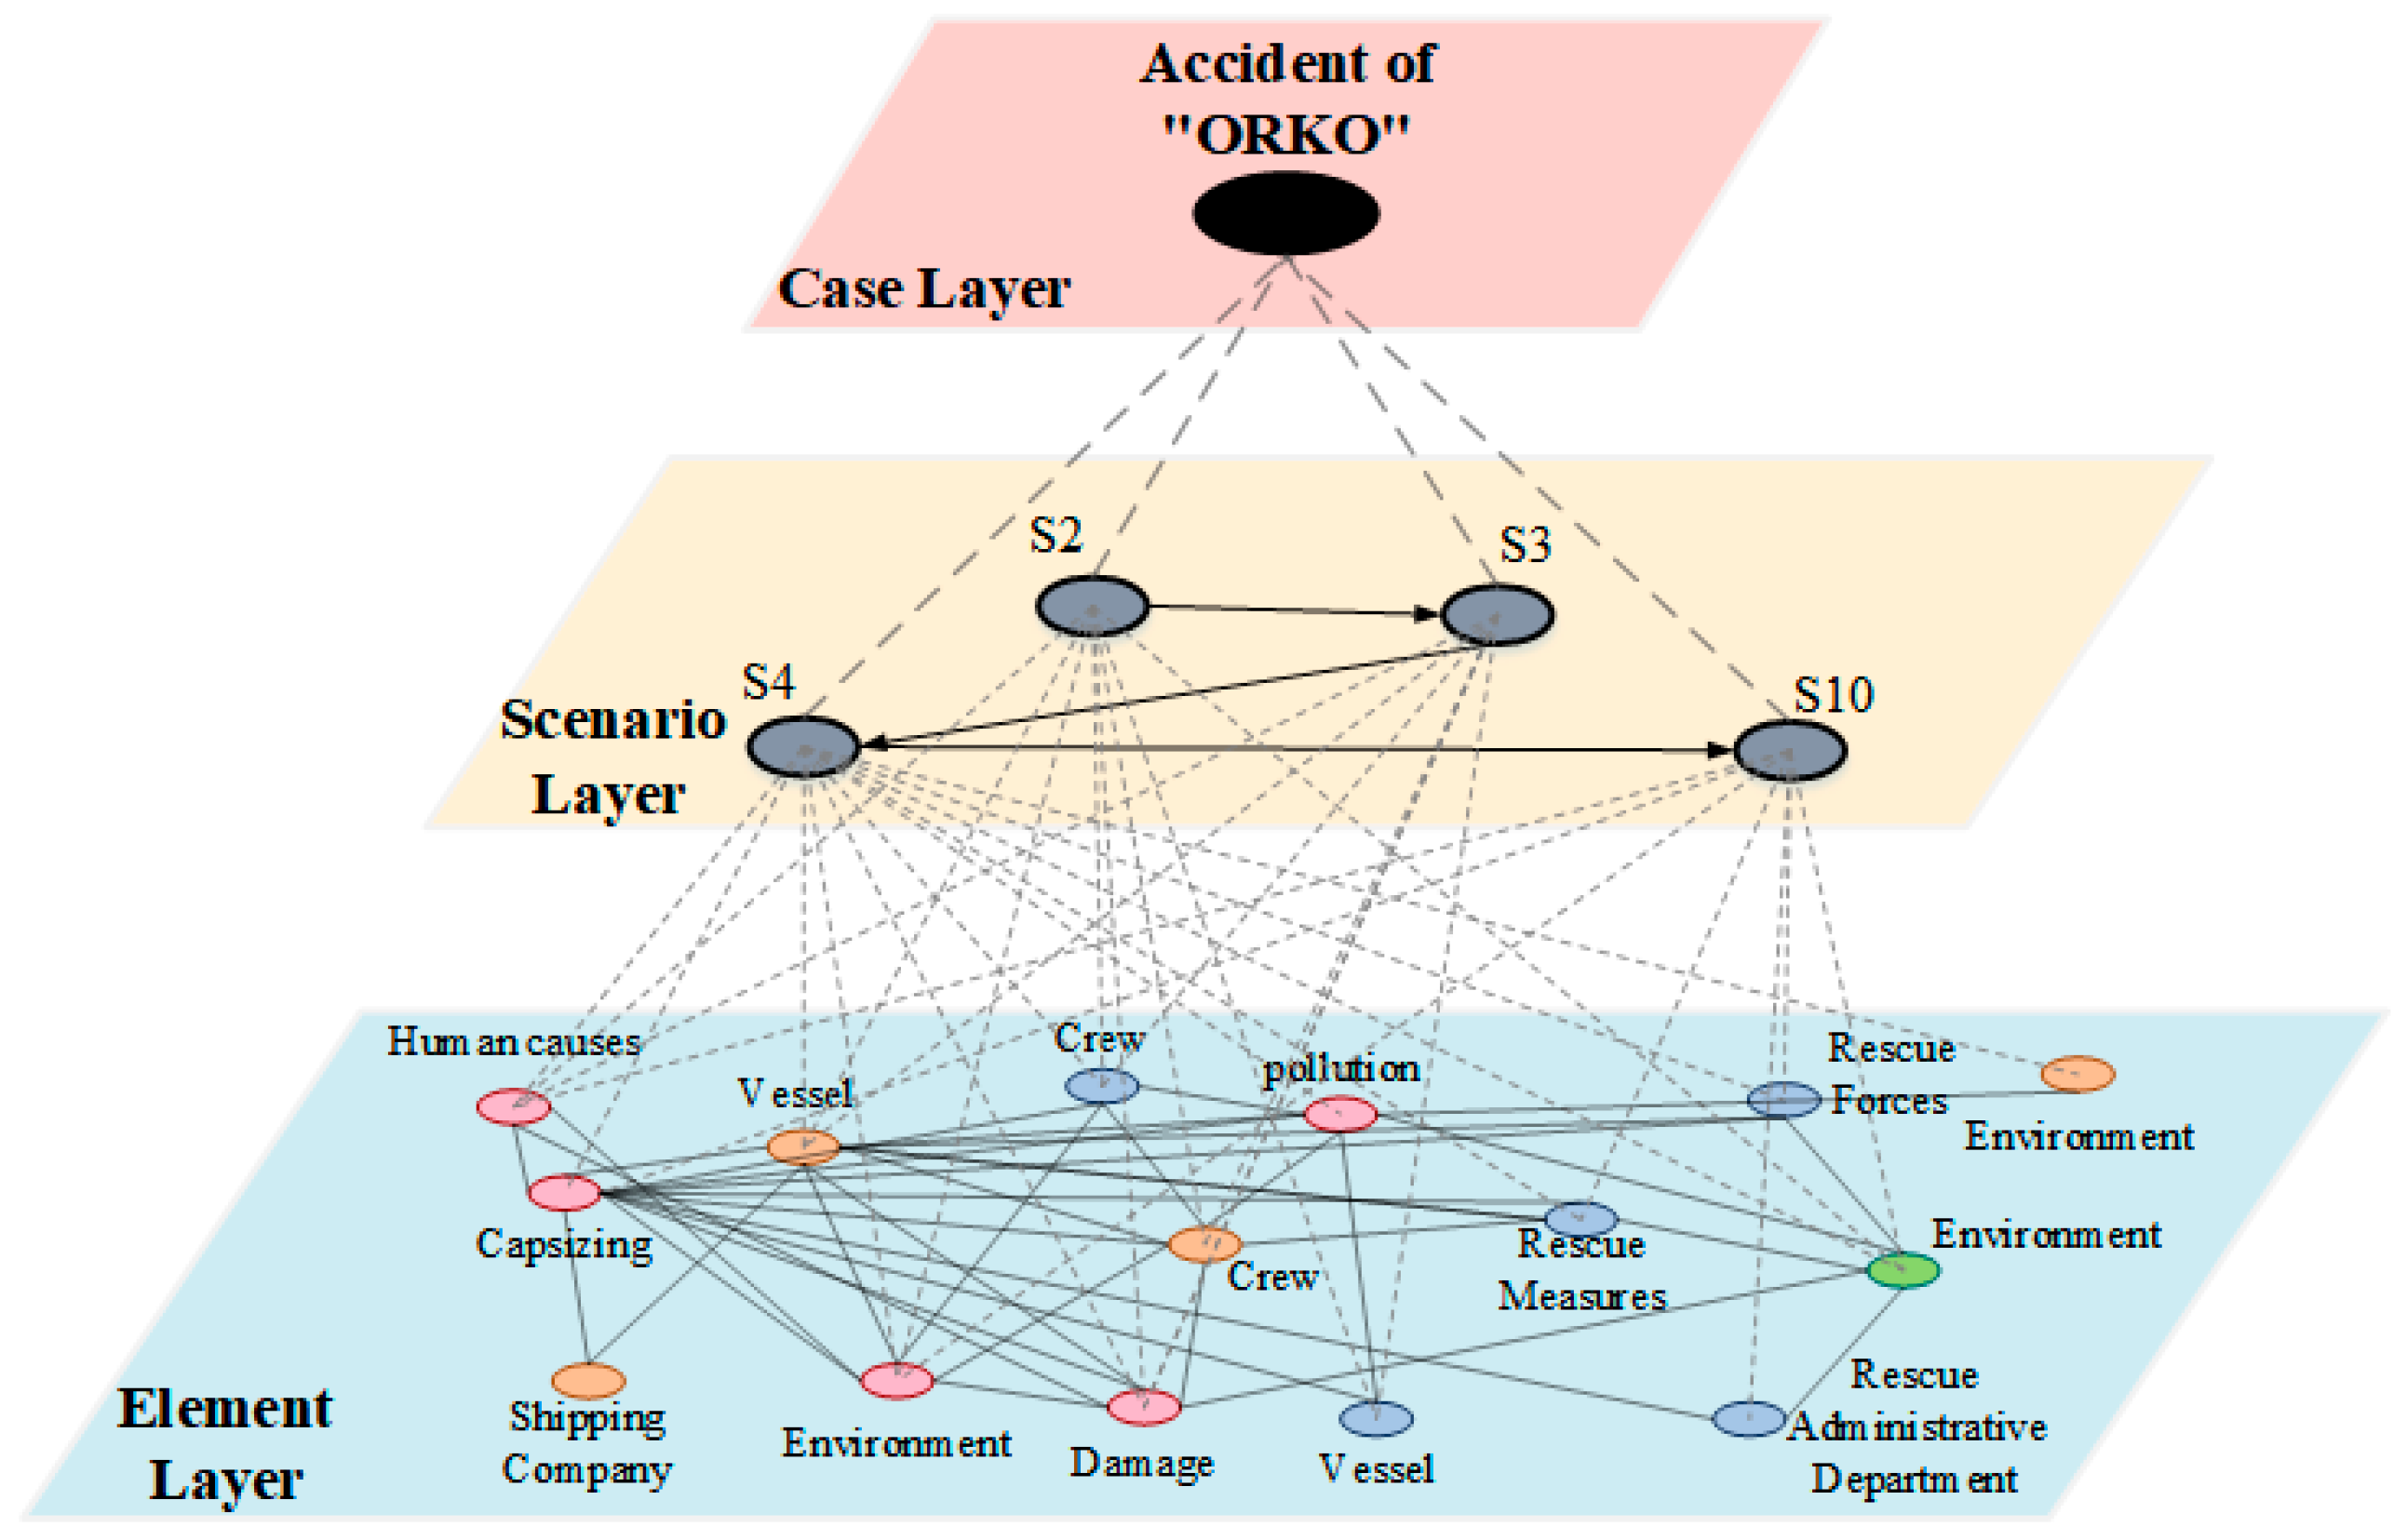
The case model is a multi-layer heterogeneous network model with a top-down conceptual structure, following the fundamental construction logic of “accident case → accident scenario → accident object → object attributes.” This model decomposes maritime accidents into four layers of heterogeneous networks and maps relevant data to corresponding network layers, thereby incorporating multi-type accident data (including numerical values and text) into the case model. Section 4.2 provides a detailed introduction to this model, while Section 4.3 and Section 4.4 demonstrate example models.
Additionally, we selected a maritime accident case outside the case base as an input sample to test different CBR methods’ performance in predicting possible scenarios for this sample. The input sample’s accident data were also structured as a case model to ensure structural consistency. However, since the scenario layer of the input sample represents the prediction target, it was processed as a hybrid scenario to support CBR analysis and computation.

4.2. Major Maritime Emergency Case Modeling (Retrieve)

Based on scenario theory, major maritime emergencies cases can be viewed as interactions of multiple scenarios, where scenarios represent objects and their complex interactions, each with various attributes. Following this logic, we construct the case model.
First, the case layer is clearly the top level, aggregated from scenario layers.
Second, cases consist of scenarios. We extract 11 scenarios from IMO’s maritime accident classification (Table 1), denoted as C = { S , E | S = { S 1 , S 2 , , S 11 } , E S = { E 1 , E 2 , , E m } } .
The object layer comprises constituent objects and their interactions, so it can be denoted as S = { O , E I | O = { O 1 , O 2 , , O p } , E I = { E 1 , E 2 , , E q } } . Following public safety triangle theory [61], we classify objects into: hazard sources, vulnerable entities, mitigation agents, and environmental factors. Thus, the scenario structure is denoted as S V = { ( H Z , V L , M I , E N V ) , E I } .
The attribute layer contains object attributes without inter-attribute relationships, which can be denoted as O = { H | H = { h 1 , h 2 , , h k } } . Each attribute consists of a name-value pair, which is h i = { N a , S a } . This study references relevant research on maritime accidents [15,62] and their contributing factors to extract common accident object attributes. Example illustrations are provided in Appendix A, Table A1, Table A2, Table A3, Table A4 and Table A5.
The complete case model structure is formalized in Equation (21) and illustrated in Figure 5, with symbol definitions in Table 2.
C = { ( S i , E ) | S i = { H Z , V L , M I , E N V } , E = { E S , E I } | H Z , V L , M I , E N V = { h k ( N a , S a ) } , i , k N + }

4.3. Case Base Construction and Basecase Model Examples (Retrieve)

This study extracts information from official accident investigation reports published by China MSA and IMO to build a case base using our case modeling method. We selected 30 maritime accidents to build the case base, with brief information shown in Table 3. The selected cases cover multiple regions (China, Argentina, Portugal, France, etc.) with diverse accident levels and scenario types.
The grounding accident of the Portuguese vessel “ORKO” (Case C3) exemplifies a source case model. Figure 6 shows Case C3′s final model, while Appendix A, Table A1 details all elements and attributes for its “Hull Rupture” scenario. Other Basecase models are omitted due to space constraints.

4.4. TargetCase Modeling (Retrieve)

We selected the “Mariano Perez IX” maritime accident as the Targetcase, giving a brief introduction below.
On 7 September 2024, an explosion sank the fishing vessel “Mariano Perez IX” at JR Pier, Mazatlán Port, Mexico. Preliminary investigation indicates that improper welding equipment operation during deck welding caused the explosion. The explosion killed one welder, injured another, and created hull breaches, causing flooding. The explosion ignited localized fires, with burn damage evident on the hull and equipment. Firefighters responded promptly for rescue operations. Excessive flooding ultimately caused complete vessel sinking. Weather conditions included clear skies, 35 °C temperature, Force 3 winds, and 1 m wave height. The complex scene involved flammable bunker fuel, requiring urgent scenario prediction.
Expert analysis identified actual scenarios: Hull Rupture (S2), Hull Flooding (S3), Vessel Capsizing (S4), Vessel Fire (S5), Vessel Explosion (S6), and General Personnel Casualties (S8). With unknown scenarios, we predict potential scenarios using object/attribute data. The Targetcase’s scenario layer remains undetermined for prediction, necessitating a hybrid scenario approach for structural equivalence in similarity computation. Figure 7 shows the case model, with full attributes in Appendix A, Table A2, Table A3, Table A4 and Table A5.

4.5. Construction of Similarity Computation Model (Retrieve)

According to the convention of explanatory CBR problems, scenarios identified as similar in the case base represent potential accident scenarios. Based on the similarity computation model proposed in Section 3.1.2, we present the similarity calculation model for major maritime emergency cases, with relevant symbols and definitions detailed in Table 4, and hierarchical relationships among symbols illustrated in Figure 8.
First, the case layer aggregates from scenario layers as in Equation (22):
S i m C = w S S i m S + w S R S i m S R
The Targetcase’s single hybrid scenario yields zero inter-scenario similarity, simplifying Equation (22) to (23):
S i m C = S i m S = i = 1 k S i m S i
Next, scenario layers aggregate from object layers. With four object types, aggregation follows Equation (24):
S i m S i = w D S i m D + w D R S i m D R S i m D = i = 1 4 w D i S i m D i S i m D i = ( j = 1 m w d j S i m d j ) T S i m D i
Object layer relational similarity S i m D R is computed via Equations (3) and (5).
Secondly, the object layer is aggregated from the attribute layer. Any object similarity S i m d j in the object layer is obtained by aggregating associated attributes, as shown in Equation (25).
S i m d j = w P S i m P + w P R S i m P R
The major maritime emergency model assumes no inter-attribute interactions, yielding S i m P R equals 0. Thus, Equation (25) simplifies to (26).
S i m d j = S i m P = ( i = 1 n w P i S i m P i ) T S i m P
Attribute similarity is computable from incident data. We next discuss data typing and corresponding similarity measures, with type annotations in Appendix A, Table A6.
Table 5 classifies and summarizes the common attribute data types in major maritime emergencies reports and provides examples and corresponding similarity calculation methods. For the three types of numerical data—precise, interval, and discrete types—we employ Euclidean distance [63] to calculate their similarity. However, Euclidean distance requires that variables have a definite range of values, and in major maritime emergencies, it is extremely common for variables to lack a clear range of values. Therefore, we define relative similarity to deal with this situation, as shown in row 2 of Table 6. In addition, we discuss the combinations of data forms when calculating similarity between different cases and provide the corresponding similarity calculation formulas, as shown in Table 6.

4.6. Weight Allocation (Retrieve)

Similarity aggregation involves multiple weighted summations requiring proper weight assignment. Entropy weighting computes weights from data distribution, but only the attribute layer contains raw data in our major maritime emergency model, while the other layers obtain similarity through aggregation from the lower layers. Thus, we apply Section 3.2’s dynamic entropy weighting to attribute data, while assigning equal weights to other layers (object, scenario, case).
We extract all attribute data (names and values) from all case models. Numerical data are processed directly, while textual data requires text-to-value mapping.
We establish text mappings via ordinal mapping and expert scoring. Text attributes with ordinal semantics (e.g., fire severity, explosion intensity) are mapped to increasing integers. Non-ordinal text attributes (e.g., damage causes, damage types) are numerically scored by domain experts. Mapping examples appear in Appendix A, Table A7.

4.7. Retrieval Mechanism Setting (Retrieve)

Apply the cascade retrieval mechanism to major maritime emergency scenario prediction. After computing all similarities, set discriminant conditions for Basecase scenarios per cascade retrieval. As the scenario layer is intermediate with the case layer above, the discriminant condition follows Equation (27):
S i m μ S i m S i μ 1 S i m C = i = 1 k S i m S i μ 2
where μ is the true scenario similarity threshold, μ 1 is the scenario similarity threshold, and μ 2 is the case similarity threshold.

4.8. Output of Prediction Results (Reuse and Retain)

After extracting source cases from the case base, the hybrid scenario of the input case is compared with each scenario of the source cases for similarity computation. Scenarios meeting the cascade retrieval criteria are selected into the similar case pool, while non-qualifying scenarios are discarded, thus traversing the entire case base. After traversal, duplicate scenarios in the similar case pool are removed, yielding the prediction results for the input case. The prediction results are validated, and the input case model’s scenario layer is updated upon confirming consistency with actual accident scenarios, then the updated input case model is stored in the case base. This process is illustrated in Figure 9.

5. Method Evaluation

The list of potential scenarios generated by applying different CBR methods to the input sample constitutes the prediction results, where properties such as comprehensiveness and accuracy of the result list can reflect the performance of CBR methods. To analyze different CBR methods’ performance from multiple metrics and application scenario perspectives, this study selects seven metrics to evaluate CBR performance from three capability perspectives. To demonstrate our method’s superiority, we compare CRCBR-EW (proposed) with CRCBR-mean (equal weights) and HCBR-EW (hierarchical CBR with entropy weights). We first present evaluation metrics and perspectives, then analyze our case study data. In addition, experiments were conducted on AMD 7945HX-CPU/NVIDIA RTX 4060 hardware using Python 3.8 in PyCharm 2024.

5.1. Evaluation Metrics and Perspectives

Considering both procedural and final results, we select seven performance metrics, defined and calculated as shown in Table 7, recording the number of true accident scenarios as NTS.
This paper adopts three evaluation perspectives—optimality [15], satisfactoriness, and sensitivity [10]—to comprehensively analyze and evaluate the performance of different CBR methods using seven performance metrics. Optimality measures the peak performance of methods. Since optimal solutions cannot always be obtained, the capability to achieve satisfactory solutions is equally crucial. Thus, we introduce the satisfactoriness perspective to evaluate this capability. Sensitivity reflects how critical parameters influence performance, representing a common yet essential evaluation dimension.

5.2. Method Performance Analysis

This section conducts parameter analysis experiments for all three methods. HCBR-EW uses hierarchical retrieval: it first analyzes hazard sources, then vulnerable entities, before final similarity analysis of filtered cases. Manual analysis determined optimal parameter ranges: HCBR-EW’s tier-1 threshold a l p h a [ 0.01 , 0.16 ] , tier-2 threshold b e t a [ 0.01 , 0.16 ] , with alpha, beta step = 0.01. CRCBR variants use scenario threshold a 1 [ 0.3 , 0.45 ] , case threshold a 2 [ 0.7 , 0.85 ] , with a1, a2 step = 0.01. The parameter value ranges for all three CBR methods were constrained to combinations of 16 discrete values for each of the two key parameters, ensuring consistent analytical scope across methods. Performance analysis proceeds within these parameter ranges.

5.2.1. Optimality

The optimal performance data for all three methods appear in Table 8. At optimal performance, CRCBR-EW and CRCBR-mean show clear advantages over HCBR-EW in recall, precision, and retrieval efficiency for real accident scenarios. CRCBR-EW and CRCBR-mean show identical optimal performance with no difference.
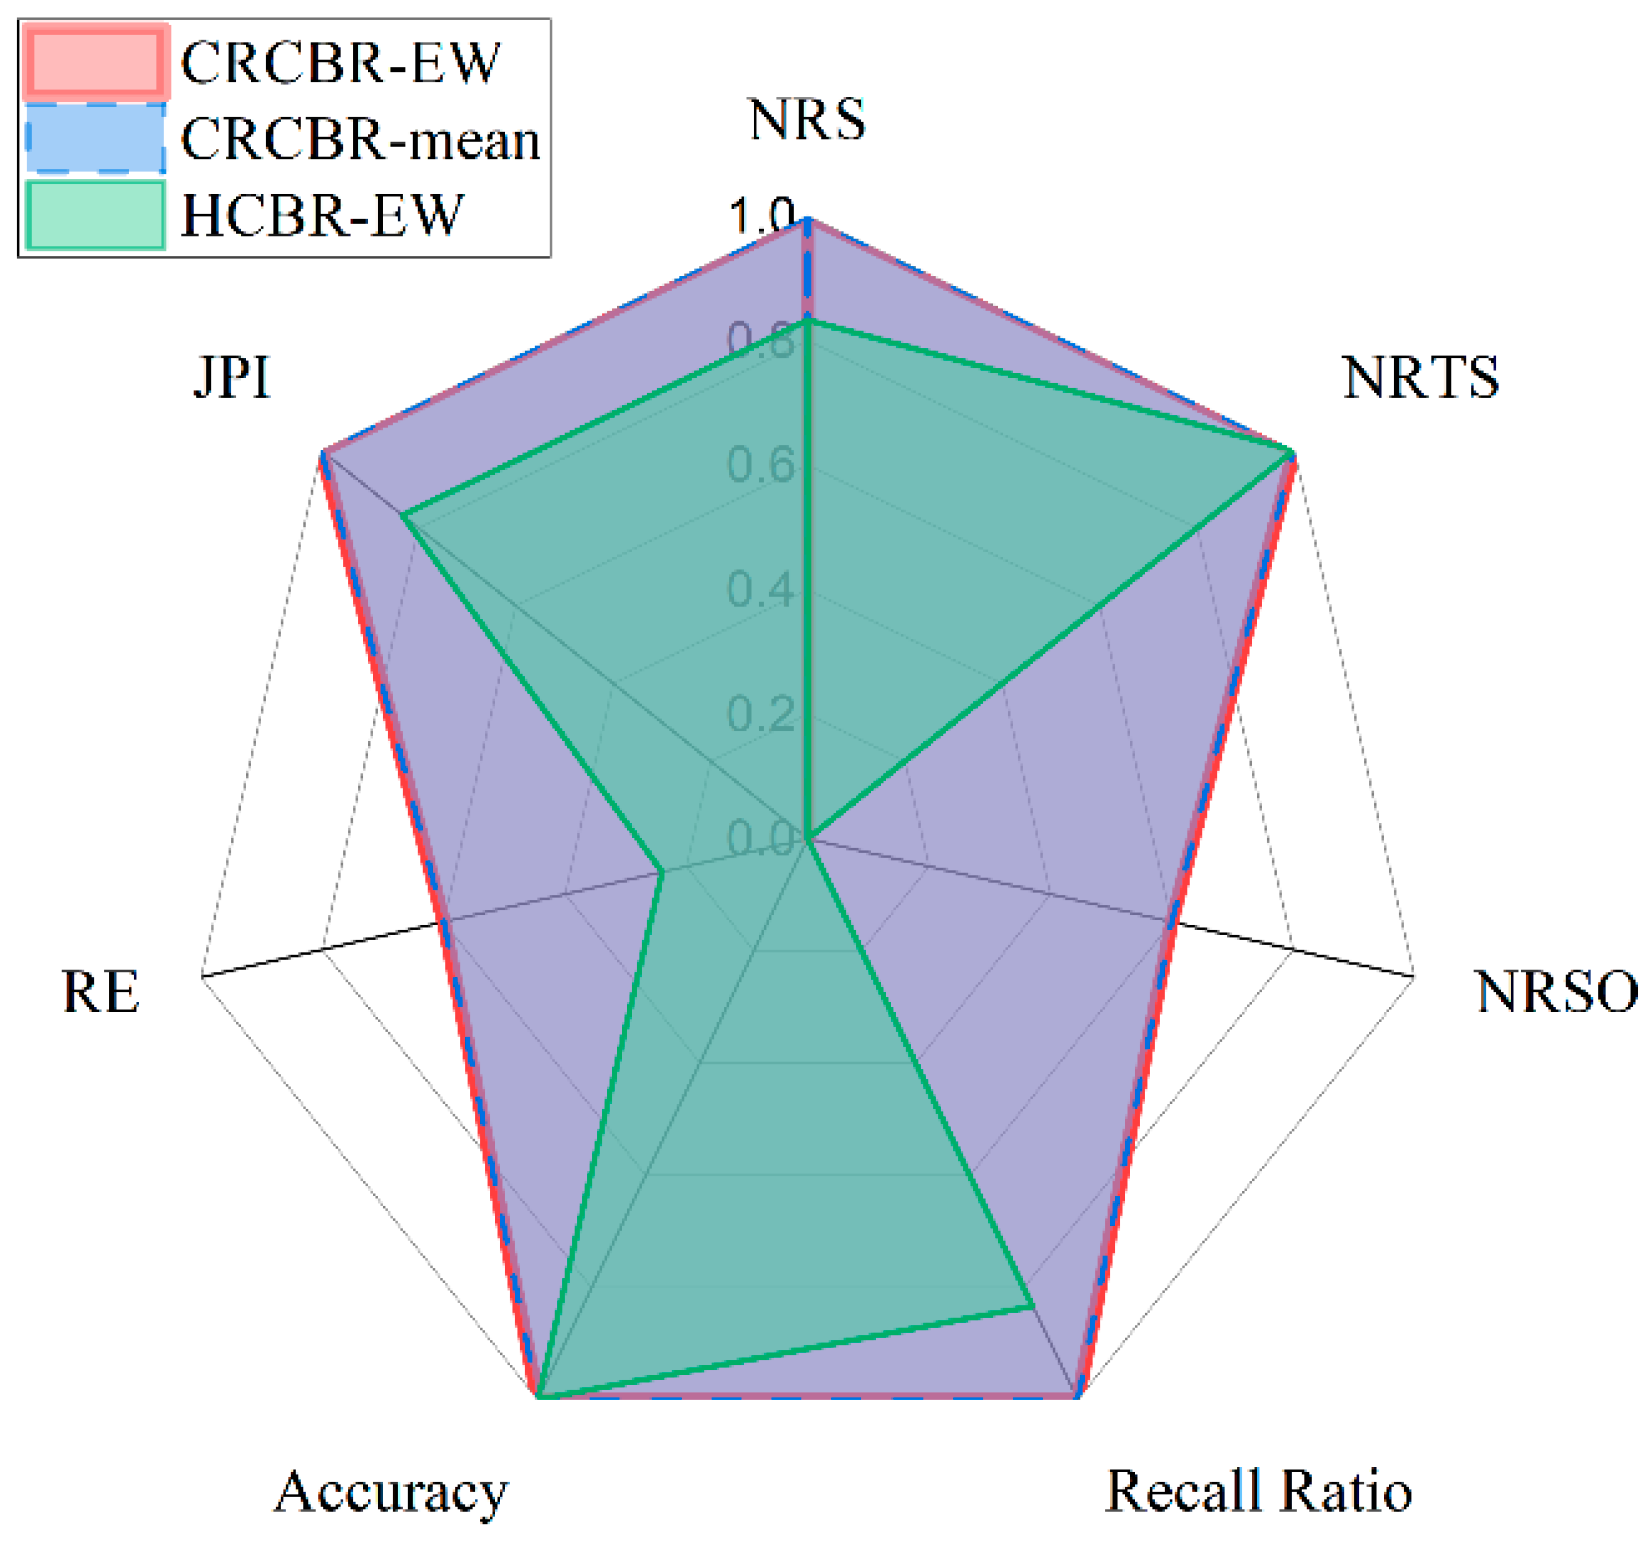
Using NRSO as a penalty term with other metrics, Figure 10’s radar chart compares optimal performance across methods. Red represents CRCBR-EW, blue CRCBR-mean, and green HCBR-EW. Figure 10 visually demonstrates CRCBR variants’ superiority on five metrics and parity on two versus HCBR-EW. Thus, CRCBR achieves better optimal performance than HCBR.

5.2.2. Satisfactoriness

Given our focus on comprehensiveness, accuracy, and efficiency in major maritime emergency prediction, we use Joint Performance Indicator (JPI) and Retrieval Efficiency (RE) as constraints. Since a JPI closer to 1 indicates better performance, we center it at 1 as JPI-central for clearer analysis, while higher RE values are preferable.
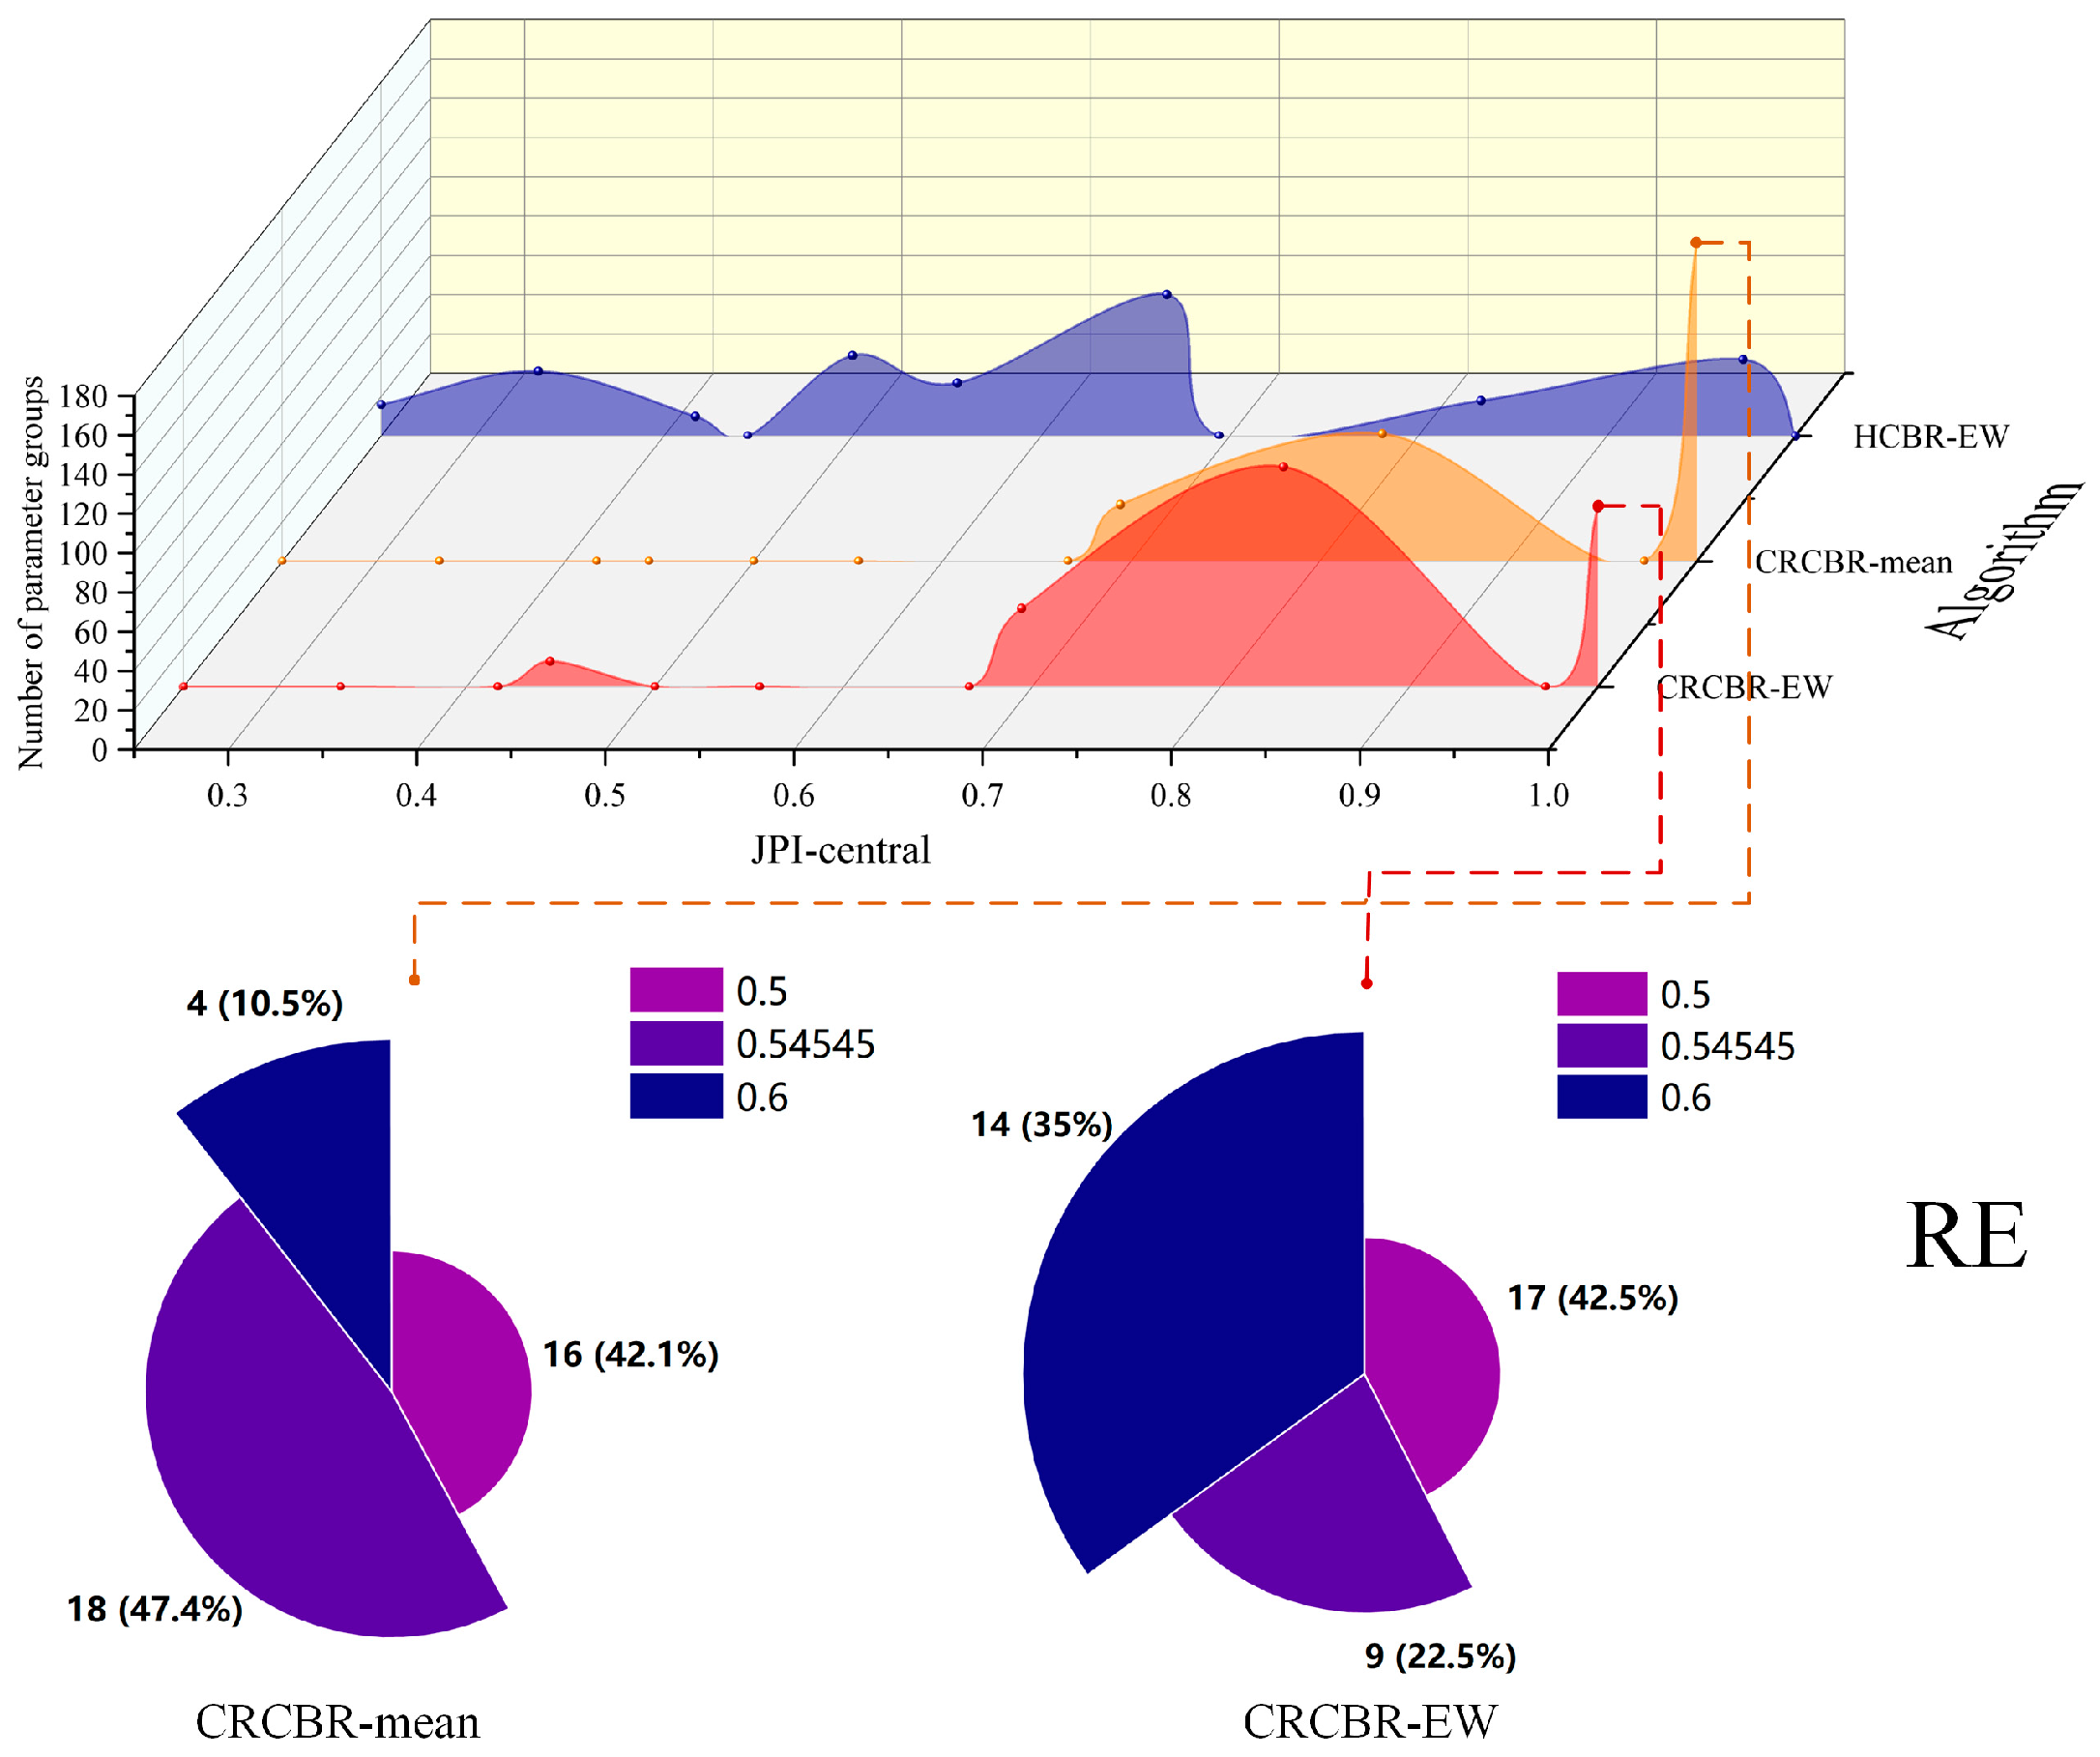
Figure 11 (top) shows the distribution of parameter sets across JPI-central values. Both CRCBR variants concentrate in high JPI-central ranges ([0.65, 1]), while HCBR-EW spreads more in lower ranges, indicating CRCBR’s superior satisfactoriness.
Comparing CRCBR variants at JPI-central = 1 and RE > 0.5 (Figure 10 bottom), CRCBR-EW has 14 parameter sets at peak RE = 0.6 versus CRCBR-mean’s 4. Within RE ∈ [0.5, 0.6], counts are similar (40 vs. 38), but CRCBR-EW dominates higher RE ranges.
Thus, CRCBR surpasses HCBR in satisfactoriness, and CRCBR-EW outperforms CRCBR-mean, proving dynamic entropy weighting’s efficacy.

5.2.3. Sensitivity

Different CBR methods employ different retrieval mechanisms with distinct key parameters, whose impacts reflect mechanism effectiveness. Using JPI-central and RE as metrics, we analyze how key parameters affect each method’s performance.
(1) Parameter impacts on JPI-central
Figure 12A shows CRCBR-EW’s JPI-central trends with parameters a1/a2, with Figure 12(A-1,A-2) detailing individual impacts. Figure 12(A-1) demonstrates that the distribution of JPI-central transitions from a concentrated pattern to oscillatory behavior within a certain range, indicating that parameter a1 has a significant influence on its distribution trend. As shown in Figure 12(A-2), JPI-central maintains consistent oscillation intervals when a2 values are low, but the oscillation range decreases when a2 exceeds 0.82, suggesting that parameter a2 also notably affects the distribution trend. Notably, JPI-central remains at relatively high levels across the tested ranges of both a1 and a2 (primarily distributed above 0.7, with only occasional values around 0.4), demonstrating that both parameters significantly impact the performance level of JPI-central. The relative influence of a1 versus a2 on JPI-central can be directly observed in Figure 12A.
Figure 12B displays CRCBR-mean’s JPI-central patterns with a1/a2, with Figure 12(B-1,B-2) detailing individual impacts. As evident from Figure 12(B-1), the oscillation range of JPI-central shows minimal variation with changing parameter a1 values, yet consistently maintains performance levels no lower than 0.7. This indicates that while parameter a1 does not significantly influence JPI-central’s variation pattern, it effectively sustains high performance standards. Similarly, Figure 12(B-2) reveals that parameter a2 likewise produces negligible changes in JPI-central’s oscillation characteristics, while preserving the same minimum performance threshold (≥0.7). Consequently, parameters a1 and a2 demonstrate comparable effects: neither substantially alters the performance variation trend, but both exert a notable influence in maintaining superior performance levels.
Figure 12C illustrates the overall trend of JPI-central in HCBR-EW as parameters alpha and beta vary, with Figure 12(C-1,C-2) specifically demonstrating the influence of parameters alpha and beta on JPI-central, respectively. As is clearly observable, JPI-central exhibits significant variations in its oscillation range, corresponding to changes in both alpha and beta parameters. This indicates that both alpha and beta parameters exert considerable influence on the variation trends of JPI-central. However, JPI-central displays substantial dispersion in its distribution, with particularly wide spread across the lower performance range (0.3–0.5). This observation suggests that parameters alpha and beta demonstrate limited effectiveness in maintaining desirable performance levels for JPI-central.
From the analysis of the three CBR methods, CRCBR-EW significantly affects both the distribution trends and performance levels of JPI-central; CRCBR-mean shows a notable influence on JPI-central’s performance levels, but a limited impact on its distribution trends; HCBR has marked effects on JPI-central’s distribution trends, but a weak influence on its levels. In conclusion, CRCBR-EW’s key parameters exhibit superior sensitivity.
(2) Parameter impacts on RE
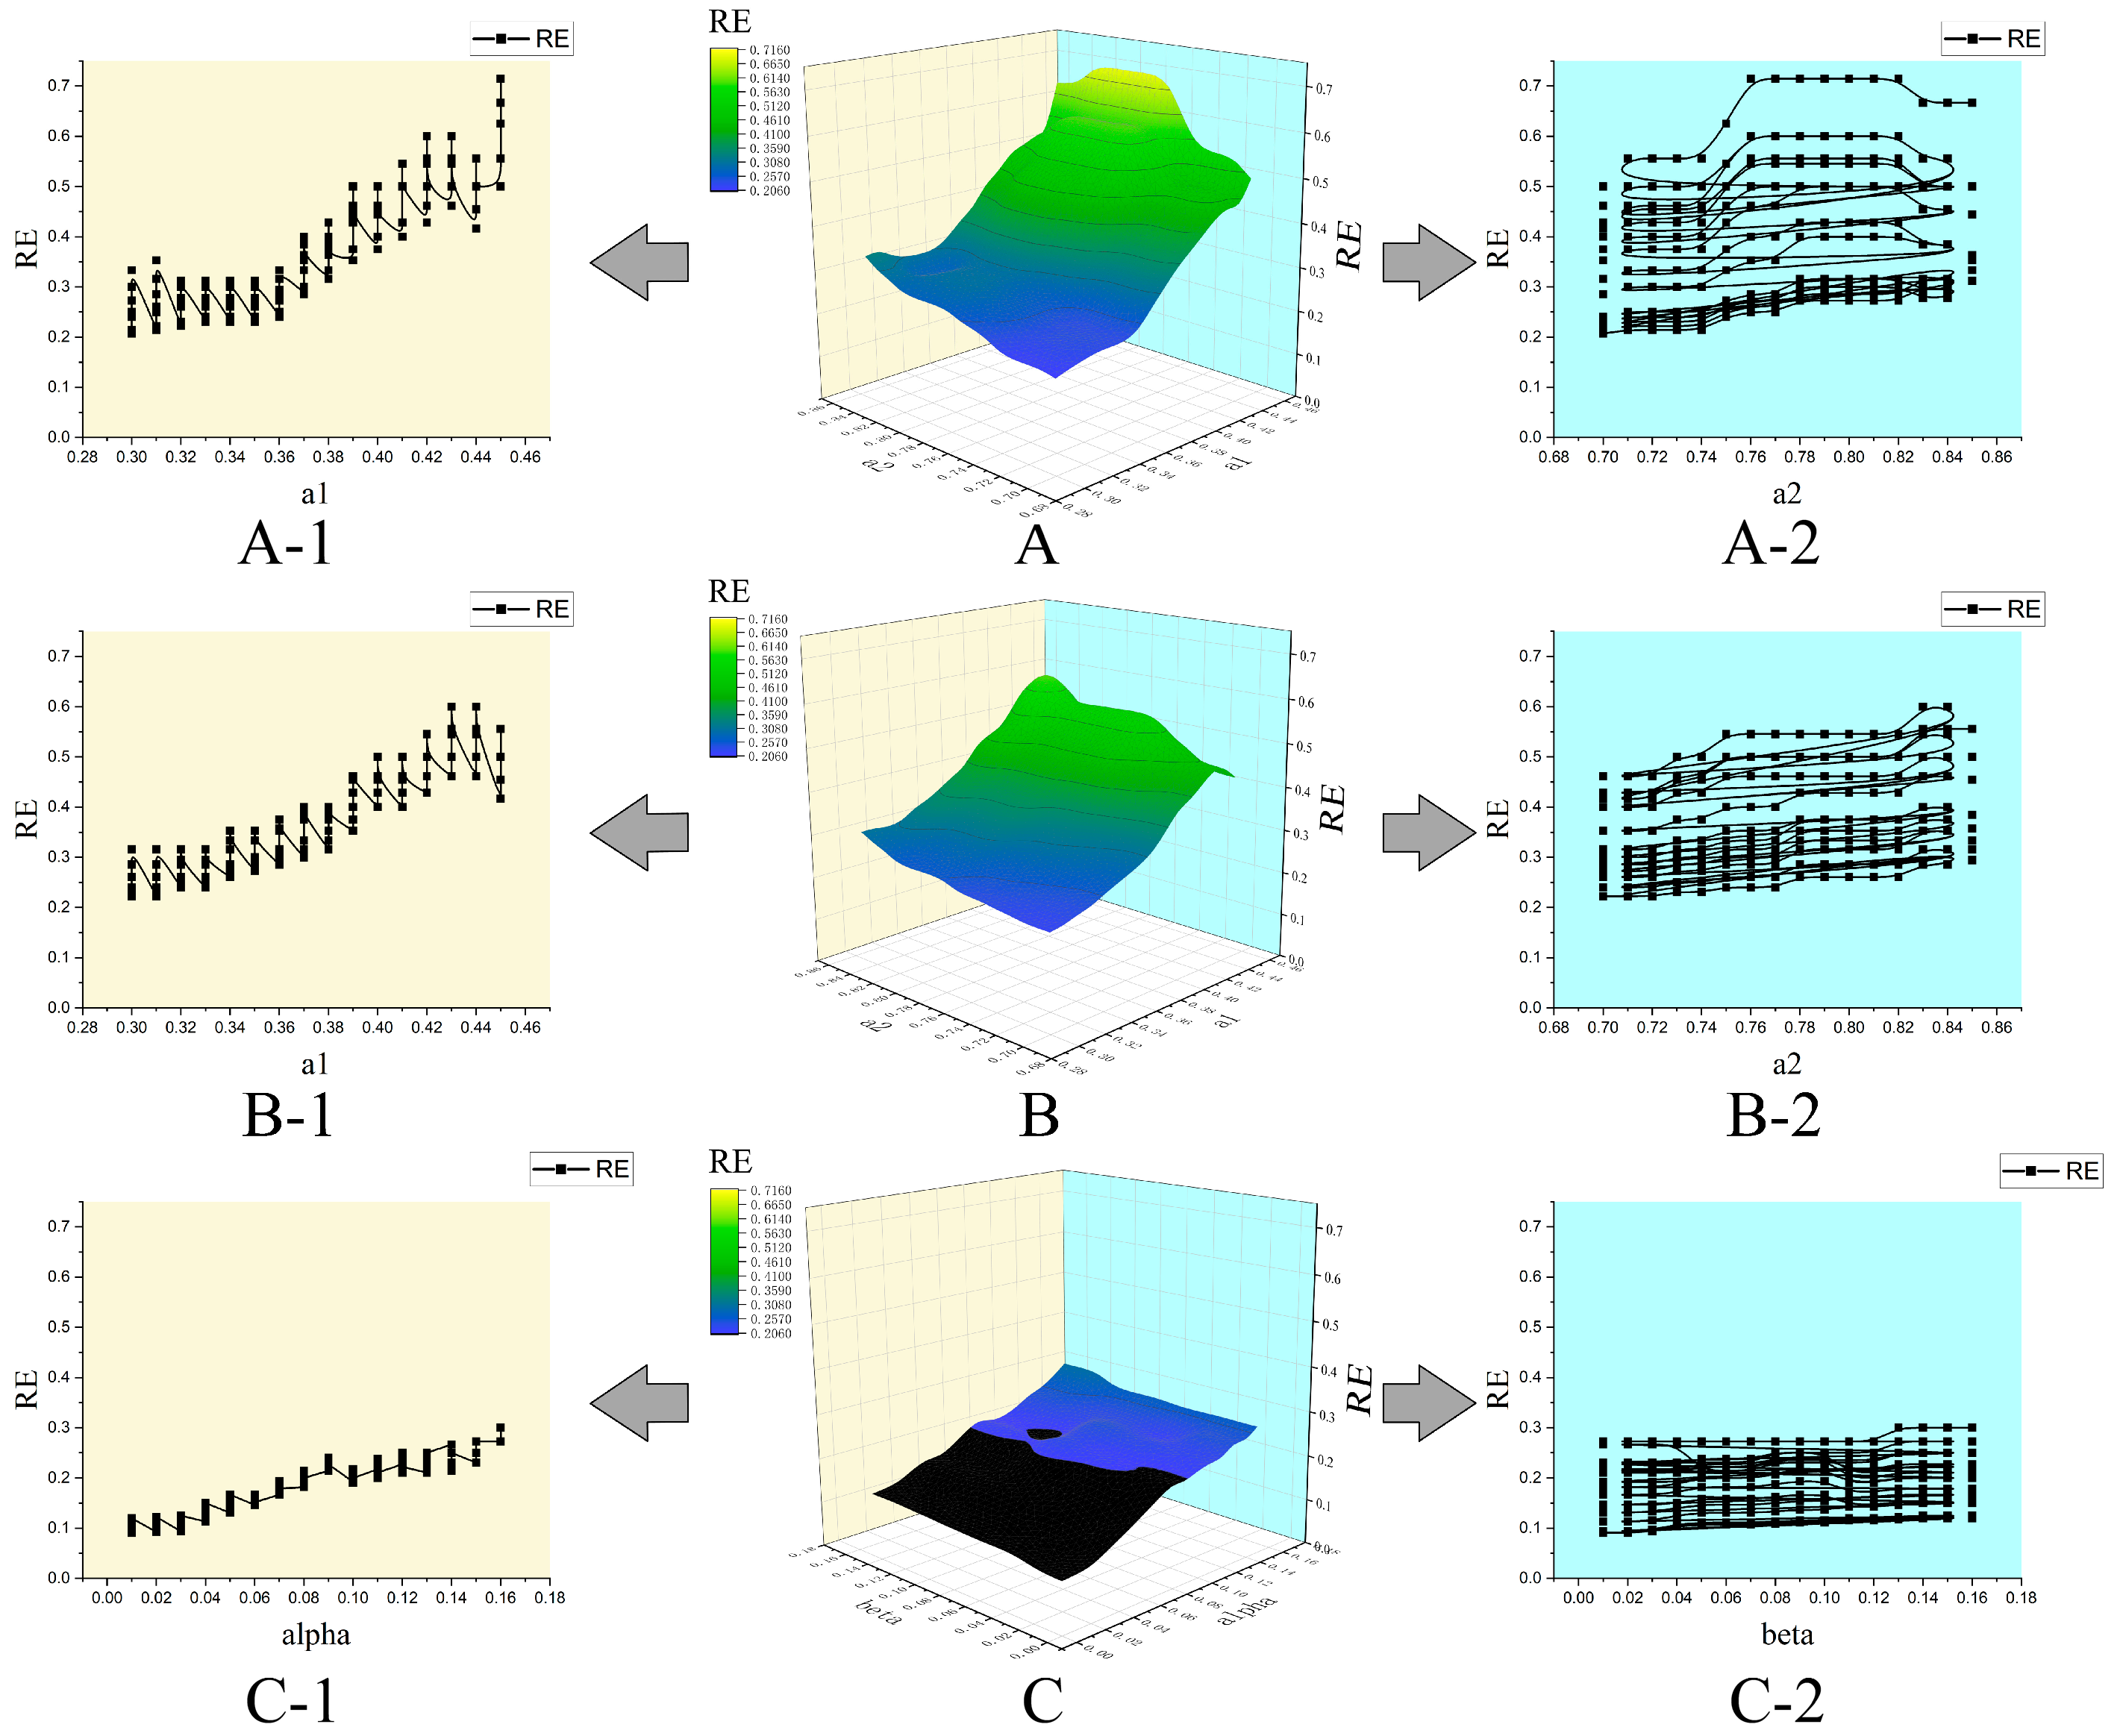
Figure 13A shows the overall trend of RE in CRCBR-EW as parameters a1 and a2 vary, with Figure 13(A-1,A-2), respectively, demonstrating the influence of parameters a1 and a2 on RE. As seen in Figure 13(A-1), RE’s oscillation range gradually expands with increasing a1 values, with extremum levels rising from 0.2 to 0.7, indicating that parameter a1 significantly affects both RE’s distribution trend and performance level. Figure 13(A-2) shows that RE’s oscillation range first increases, then decreases with rising a2 values, while extremum levels improve from 0.2 to 0.7, collectively indicating that parameter a2 notably influences both RE’s distribution trend and level. The relative impacts of a1 versus a2 on RE are visually represented in Figure 13A.
Figure 13B shows the overall trend of RE variation with parameters a1 and a2 in CRCBR-mean. Figure 13(B-1,B-2) demonstrates the effects of parameters a1 and a2 on RE, respectively. As shown in Figure 13(B-1), the oscillation range of RE gradually expands with increasing parameter a1. The tail shows a downward trend, with extreme values of the oscillation range increasing from 0.2 to 0.6. This indicates that parameter a1 has a significant effect on both the distribution trend and magnitude of RE. Figure 13(B-2) shows that the oscillation range of RE exhibits a gradual increasing trend with parameter a2. Moreover, the extreme values of the oscillation range increase from 0.2 to 0.6. Overall, parameter a2 shows significant impacts on both the distribution trend and magnitude of RE. The influence degrees of a1 and a2 on RE can be visually observed in Figure 13B.
Figure 13C shows the overall trend of RE variation with parameters alpha and beta in HCBR-EW. Figure 13(C-1,C-2) demonstrates the effects of parameters alpha and beta on RE, respectively. As shown in Figure 13(C-1), the oscillation range of RE gradually expands with increasing parameter alpha. The extreme values of the oscillation range increase from 0.1 to 0.3. This indicates that parameter alpha has a significant effect on the distribution trend of JPI-central but limited impact on its magnitude. Figure 13(C-2) shows no significant trend change in RE’s oscillation range, with increasing parameter beta. Moreover, the extreme values of the oscillation range remain largely unchanged. Overall, parameter beta shows no significant impact on either the distribution trend or magnitude of RE. The relative influences of alpha versus beta on RE can be visually compared through Figure 13C.
Based on the analysis of the three CBR methods, the key parameters of CRCBR-EW show significant impacts on both the distribution trend and magnitude of RE. The key parameters of CRCBR-mean also demonstrate significant effects on both the distribution trend and magnitude of RE, but their impact on magnitude is less pronounced than that of CRCBR-EW. The key parameter alpha of HCBR shows a significant influence on the distribution trend of RE but has a limited impact on its magnitude. The key parameter beta shows no significant effects on either the distribution trend or magnitude of RE. Overall, the key parameters of CRCBR-EW exhibit more significant impacts on performance.
In summary, the CRCBR method proposed in this paper demonstrates superior performance compared to traditional methods represented by HCBR. Moreover, the proposed CRCBR-EW method outperforms the CRCBR-mean method in terms of both satisfactoriness and sensitivity, which verifies the effectiveness of our proposed improvements.

6. Conclusions

Addressing traditional CBR’s limitations with complex multi-layer objects, we propose a cascade retrieval-based CBR method with dynamic entropy weighting. First, we theoretically analyze traditional CBR’s poor performance on CMOs and improve it via cascaded retrieval. Second, we propose dynamic entropy weighting with secondary allocation to handle CRCBR’s non-fixed structures and multivariate data. Using a major maritime emergency scenario prediction with real accident data, we demonstrate our method’s application. Finally, we compare our method against CRCBR-mean and HCBR-EW using seven metrics across three perspectives, proving its superiority.
For future extensions of this research, two promising directions could be considered: weight allocation methods under more scenarios and quantitative calculation of similarity misjudgment issues. Regarding weight allocation, discussions on updated variants of the entropy weight method, machine learning-based weighting methods, and hybrid weighting models can provide a solid foundation for the extension of this study. In our case analysis using a dynamic entropy weight method, we only performed entropy weight calculation and allocation for the bottom-level data while assuming equal weights for intermediate nodes. This assumption may not hold true for many problems in other domains. Therefore, the weight allocation problem for the remaining intermediate nodes deserves further attention and in-depth exploration. Moreover, weight calculation and allocation can be achieved not only through objective weighting methods. There already exists considerable research on hybrid weighting methods, and numerous studies have employed advanced techniques, such as machine learning for weight allocation. Integrating CRCBR methods with more advanced weight allocation approaches represents another valuable direction for future research. Secondly, regarding the quantitative calculation of similarity misjudgment issues, relevant cutting-edge theoretical research in the field of complex systems can provide feasible solutions for this approach. Our approach addresses this by simultaneously considering similarities across different relational levels to reveal hidden complex relationship similarities. Although certain effectiveness has been achieved, precise quantitative calculation remains unrealized. Combining complex systems theory to further develop quantitative calculation methods presents a worthwhile problem for deeper investigation.

Author Contributions

J.L.: Conceptualization of this study, Data curation, Formal analysis, Methodology, Software, and Writing original draft. Y.D.: Methodology, Data curation, Investigation, Project administration, and Validation. S.H.: Data curation and Formal analysis. J.W.: Data curation and Supervision. R.Y.: Data curation, Investigation, and Resources. All authors have read and agreed to the published version of the manuscript.

Funding

This work was supported by the National Natural Science Foundation of China under Grants 7247011890 and 72431011, and Sichuan Province’s Major Aviation and Gas Turbine Project during the 14th Five-Year Plan: Development and Verification of Long-Endurance Unmanned Aerial Vehicle Engines Based on Demand (Funding Number: 2022ZDZX0039).

Data Availability Statement

The database used in this study was independently developed and built by the researchers. If necessary, please contact the corresponding author.

Conflicts of Interest

The authors declare no conflicts of interest.

Abbreviations

The following abbreviations are used in this manuscript:
CBRCase-based reasoning
CRCBRCascade retrieval-based case-based reasoning
CMOComplex multi-layer object
IMOInternational Maritime Organization
China MSAMaritime Safety Administration of the People’s Republic of China

Appendix A

Appendix A.1

Table A1. Attribute data of “ORKO” accident case.
Entity CategoryEntity NameEntity Attribute
Hazard Sources Attribute NameAttribute ValueData TypeValue Range
Human factorsImproper operationImproper navigation42-
Improper operationImproper management42
DamageCause of damageCollision42-
Extent of damage3515
Cause of damageRupture42
EnvironmentWater levelMedium water level42
Wave height21
TideEbb tide42
Vulnerable EntitiesVesselQuantity11-
Type of lossHull damage42-
Type of lossCargo loss42
Extent of loss5515
Cause of lossCollision42-
CrewNumber of injuries01-
Number of deaths01
Number of affected121-
Shipping companyQuantity11-
Type of lossEconomic loss42-
Type of lossSafety loss42-
Extent of loss4515
Mitigation AgentsVesselQuantity11-
ActionEmergency evasion42
ActionShip self-rescue42-
CrewActionEmergency evasion42-
ActionLife-saving refuge42-
Rescue measuresRescue measuresPersonnel search and rescue42-
Rescue measuresPollution cleanup42-
Rescue resourcesRescue personnel81-
Rescue ship11-
Rescue Administrative DepartmentQuantity21-
Response level2523
Emergency measuresPollution cleanup42
Emergency measuresPersonnel search and rescue42-
EnvironmentEnvironmentWeatherClear42-
Wind strength311–10
Wave height21-
Wind directionNorth to northeast wind 42-
Visibility4526

Appendix A.2

Table A2. Attribute data of “Mariano Perez IX” accident case—Hazard sources.
Entity CategoryEntity NameEntity Attribute
Hazard Sources Attribute NameAttribute ValueData TypeValue Range
ExplosionExplosion range201-
Severity of explosion4515
Cause of explosionOperational error42-
Open flameCause of fireWelding42-
Area of fire201-
Severity of fire3515
DamageType of damageHull damage42-
Extent of damage3515
Cause of damageExplosion42-
Explosive materialsTypeUnknown42-
Quantity1001-
Flammable materialsTypeUnknown42-
Quantity1501-
EnvironmentWave height11-
Wind strength311–10

Appendix A.3

Table A3. Attribute data of “Mariano Perez IX” accident case—Vulnerable Entities.
Entity CategoryEntity NameEntity Attribute
Vulnerable Entities Attribute NameAttribute ValueData TypeValue Range
VesselQuantity11-
Type of lossHull damage42-
Extent of loss5515
Cause of lossExplosion42-
CrewNumber of injuries11-
Number of deaths11
Shipping CompanyQuantity11-
Type of lossEconomic loss42-
Type of lossSafety loss42-
Extent of loss5515

Appendix A.4

Table A4. Attribute data of “Mariano Perez IX” accident case—Mitigation agents.
Entity CategoryEntity NameEntity Attribute
Mitigation Agents Attribute NameAttribute ValueData TypeValue Range
VesselQuantity11
ActionAssistance alarm42
CrewActionEmergency avoidance42-
ActionAlarm42
ActionRepair the hull42
ActionLife-saving refuge42-
Rescue measuresRescue measuresFire extinguishing42-
Rescue measuresMedical assistance42
Rescue resourcesProfessional rescue vessel11-
Rescue Administrative DepartmentQuantity21-
Response level3523
Emergency measuresPersonnel search and rescue42-

Appendix A.5

Table A5. Attribute data of “Mariano Perez IX” accident case—Environment.
Entity CategoryEntity NameEntity Attribute
Environment Attribute NameAttribute ValueData TypeValue Range
EnvironmentWeatherClear42-
Air temperature351-
Wind strength311–10
Wave height11-

Appendix A.6

Table A6. Entity Attribute Data Type Specifications.
LabelImplication
1Precise Type
2Interval Type
3Discrete Type
41Boolean Type (Numerical)
42Enumerated Type (Textual)
51Scale Type (Numerical)
52Evaluative Type (Textual)

Appendix A.7

Table A7. Text-numerical mapping table of the case model.
Attribute NameMapping Relationship
Fire causeFlammable material leakage: 1, welding: 3, flammable material explosion: 5
Collision causeImproper operation: 1, navigation violation: 3, management failure: 5
TideEbb tide: 1, low tide: 3, flood tide: 5
WeatherClear: 1, cloudy: 2, cloudy with local fog: 3, gale with rough seas: 4
Damage causeCollision: 1, improper sealing: 1, fire: 1, engine room flooding: 1, hull breach: 1, vessel capsizing: 2, explosion: 2
Rescue measuresFirefighting: 2, distress alert: 1, SAR operations: 2, MEDEVAC: 2, pollution containment: 1, damage control: 1

References

  1. Graessler, I.; Grewe, B. Stages of Systems Engineering: An Analysis and Characterization of Systems Engineering Approaches. Systems 2025, 13, 53. [Google Scholar] [CrossRef]
  2. De Domenico, M. More is different in real-world multilayer networks. Nat. Phys. 2023, 19, 1247–1262. [Google Scholar] [CrossRef]
  3. Mülâyim, M.O.; Arcos, J.L. Fast anytime retrieval with confidence in large-scale temporal case bases. Knowl.-Based Syst. 2020, 206, 106374. [Google Scholar] [CrossRef]
  4. Pascual-Pañach, J.; Sànchez-Marrè, M.; Cugueró-Escofet, M.À. A temporal case-based reasoning approach for performance improvement in intelligent environmental decision support systems. Eng. Appl. Artif. Intell. 2024, 136, 108833. [Google Scholar] [CrossRef]
  5. Pérez-Pons, M.E.; Parra-Dominguez, J.; Hernández, G.; Bichindaritz, I.; Corchado, J.M. OCI-CBR: A hybrid model for decision support in preference-aware investment scenarios. Expert Syst. Appl. 2023, 211, 118568. [Google Scholar] [CrossRef]
  6. Shen, L.; Li, J.; Suo, W. Risk response for critical infrastructures with multiple interdependent risks: A scenario-based extended CBR approach. Comput. Ind. Eng. 2022, 174, 108766. [Google Scholar] [CrossRef]
  7. Nakhjiri, N.; Salamó, M.; Sànchez-marrè, M. Reputation-Based Maintenance in Case-Based Reasoning. Knowl.-Based Syst. 2020, 193, 105283. [Google Scholar] [CrossRef]
  8. Cunningham, P.; Smyth, B.; Bonzano, A. An incremental retrieval mechanism for case-based electronic fault diagnosis. Knowl.-Based Syst. 1998, 11, 10. [Google Scholar] [CrossRef]
  9. Low, N.; Hesser, J.; Blessing, M. Multiple retrieval case-based reasoning for incomplete datasets. J. Biomed. Inform. 2019, 92, 103127. [Google Scholar] [CrossRef]
  10. Bouzar-Benlabiod, L.; Harrar, K.; Yamoun, L.; Khodja, M.Y.; Akhloufi, M.A. A novel breast cancer detection architecture based on a CNN-CBR system for mammogram classification. Comput. Biol. Med. 2023, 163, 107133. [Google Scholar] [CrossRef] [PubMed]
  11. Guo, Y.; Chen, W.; Zhu, Y.X.; Guo, Y.Q. Research on the integrated system of case-based reasoning and Bayesian network. ISA Trans. 2019, 90, 213–225. [Google Scholar] [CrossRef]
  12. Shao, J.; Liang, C.; Liu, Y.; Xu, J.; Zhao, S. Relief demand forecasting based on intuitionistic fuzzy case-based reasoning. Socio-Econ. Plan. Sci. 2021, 74, 100932. [Google Scholar] [CrossRef]
  13. Wang, D.; Liu, J.; Lin, Q.; Yu, H. A decision-making system based on case-based reasoning for predicting stroke rehabilitation demands in heterogeneous information environment. Appl. Soft Comput. 2024, 154, 111358. [Google Scholar] [CrossRef]
  14. Wang, R.; Sun, Y.; Ni, J.; Wu, X.; Zheng, H. An improved case-based reasoning approach for mechanical design by enhancing the retrieval accuracy and leveraging the implicit knowledge. Adv. Eng. Inform. 2024, 60, 102374. [Google Scholar] [CrossRef]
  15. Yiyang, Z.; Zhang, Y.; Lang, K.; Wang, X. Case-based reasoning for shipwreck emergency salvage scheme assisted decision. Ocean. Eng. 2023, 278, 114332. [Google Scholar] [CrossRef]
  16. Lei, L.; Yu, S.; Ke, Y.; Deng, L.; Kang, Q. Evaluation Model for Emergency Material Suppliers in Emergency Logistics Systems Based on Game Theory–TOPSIS Method. Systems 2025, 13, 493. [Google Scholar] [CrossRef]
  17. Zhang, S.; Yu, X.; Mao, H.; Yao, H.; Li, P. Evaluating Expressway Safety Based on Fuzzy Comprehensive Evaluation with AHP–Entropy Method: A Case Study of Jinliwen Expressway in Zhejiang Province, China. Systems 2023, 11, 496. [Google Scholar] [CrossRef]
  18. Duan, Y.; Cao, X.; Zhao, J.; Yang, X.; Zhao, F.; Guo, X. Research on health state evaluation method for shearer based on dynamic weight and fuzzy comprehensive evaluation. In Proceedings of the 2023 CAA Symposium on Fault Detection, Supervision and Safety for Technical Processes (SAFEPROCESS), Yibin, China, 22–24 September 2023; pp. 1–6. [Google Scholar]
  19. Zhang, Q.; Feng, J.; Ma, Z.; Chen, G. Threat assessment of air target based on dynamic relative entropy ranking method. In Proceedings of the 31st China Conference on Decision and Control, Nanchang, China, 3–5 June 2019; pp. 3750–3754. [Google Scholar]
  20. Seiger, R.; Schultheis, A.; Bergmann, R. Case-Based Activity Detection from Segmented Internet of Things Data. In Proceedings of the ICCBR 2025, Biarritz, France, 30 June–3 July 2025; Springer: Berlin/Heidelberg, Germany, 2025; p. 16. [Google Scholar]
  21. Armengol, E.; Esteva, F.; Godo, L.; Torra, V. On Learning Similarity Relations in Fuzzy Case-Based Reasoning. Trans. Rough Sets II 2004, 3135, 14–32. [Google Scholar]
  22. Corbat, L.; Nauval, M.; Henriet, J.; Lapayre, J.-C. A fusion method based on Deep Learning and Case-Based Reasoning which improves the resulting medical image segmentations. Expert Syst. Appl. 2020, 147, 113200. [Google Scholar] [CrossRef]
  23. Shen, Y.; Colloc, J.; Jacquet-Andrieu, A.; Lei, K. Emerging medical informatics with case-based reasoning for aiding clinical decision in multi-agent system. J. Biomed. Inform. 2015, 56, 307–317. [Google Scholar] [CrossRef]
  24. Bentaiba-Lagrid, M.B.; Bouzar-Benlabiod, L.; Rubin, S.H.; Bouabana-Tebibel, T.; Hanini, M.R. A case-based reasoning system for supervised classification problems in the medical field. Expert Syst. Appl. 2020, 150, 113335. [Google Scholar] [CrossRef]
  25. Guerrero, J.I.; Miró-Amarante, G.; Martín, A. Decision support system in health care building design based on case-based reasoning and reinforcement learning. Expert Syst. Appl. 2022, 187, 116037. [Google Scholar] [CrossRef]
  26. Lu, Y.; Yin, L.; Deng, Y.; Wu, G.; Li, C. Using cased based reasoning for automated safety risk management in construction industry. Saf. Sci. 2023, 163, 106113. [Google Scholar] [CrossRef]
  27. Xie, L.; Wu, S.; Chen, Y.; Chang, R.; Chen, X. A case-based reasoning approach for solving schedule delay problems in prefabricated construction projects. Autom. Constr. 2023, 154, 105028. [Google Scholar] [CrossRef]
  28. Gao, Y.; Bao, R.; Pan, Z.; Ma, G.; Li, J.; Cai, X.; Peng, Q. Mechanical equipment health management method based on improved intuitionistic fuzzy entropy and case reasoning technology. Eng. Appl. Artif. Intell. 2022, 116, 105372. [Google Scholar] [CrossRef]
  29. Liu, Z.-G.; Li, X.-Y.; Durrani, D.K.; Zhang, R.-J. Case-driven assessment of power grid emergency response capability considering typhoon disaster scenario diversity. J. Clean. Prod. 2023, 386, 135813. [Google Scholar] [CrossRef]
  30. Hadj-Mabrouk, H. Application of Case-Based Reasoning to the safety assessment of critical software used in rail transport. Saf. Sci. 2020, 131, 104928. [Google Scholar] [CrossRef]
  31. Luo, L.; Zhou, Y.; Zhou, Z.; Zhou, C.; Ji, X.; Liu, B.; He, G. Online optimization of petrochemical process via case-based reasoning and conditional mutual information. Chem. Eng. Res. Des. 2024, 207, 380–391. [Google Scholar] [CrossRef]
  32. Wang, Y.; Wang, X.; Feng, Y.; Liu, L. Strategic response for ease of doing business using case-based reasoning. Expert Syst. Appl. 2022, 210, 118514. [Google Scholar] [CrossRef]
  33. Carmona, M.A.; Barbancho, J.; Larios, D.F.; León, C. Applying case based reasoning for prioritizing areas of business management. Expert Syst. Appl. 2013, 40, 3450–3458. [Google Scholar] [CrossRef]
  34. Wang, K.; Yang, Y.; Reniers, G.; Li, J.; Huang, Q. Predicting the spatial distribution of direct economic losses from typhoon storm surge disasters using case-based reasoning. Int. J. Disaster Risk Reduct. 2022, 68, 102704. [Google Scholar] [CrossRef]
  35. Zhao, Z.; Chen, J.; Xu, K.; Xie, H.; Gan, X.; Xu, H. A spatial case-based reasoning method for regional landslide risk assessment. Int. J. Appl. Earth Obs. Geoinf. 2021, 102, 102381. [Google Scholar] [CrossRef]
  36. Duan, J.; Lin, Z.; Jiao, F.; Jiang, Y.; Chen, K. A dynamic case-based reasoning system for responding to infectious disease outbreaks. Expert Syst. Appl. 2022, 204, 117628. [Google Scholar] [CrossRef]
  37. Chen, Y.; Zhang, L.; Hu, J.; Chen, C.; Fan, X.; Li, X. An emergency task recommendation model of long-distance oil and gas pipeline based on knowledge graph convolution network. Process Saf. Environ. Prot. 2022, 167, 651–661. [Google Scholar] [CrossRef]
  38. Feng, Y.; Xiang-Yang, L. Improving emergency response to cascading disasters: Applying case-based reasoning towards urban critical infrastructure. Int. J. Disaster Risk Reduct. 2018, 30, 244–256. [Google Scholar] [CrossRef]
  39. An, X.; Meng, H.; Yin, Z.; Wen, J.; Liu, X. A knowledge transfer-based method for risk analysis and procedure optimization of emergency schemes. Process Saf. Environ. Prot. 2024, 182, 652–677. [Google Scholar] [CrossRef]
  40. Zhang, W.; Chen, X.; Mao, J.; Ke, F.; Liang, H. How to select plan in emergency decision-making? A two-stage method with case-based reasoning and prospect theory. Appl. Soft Comput. 2024, 155, 111473. [Google Scholar] [CrossRef]
  41. Wang, D.; Wan, K.; Ma, W. Emergency decision-making model of environmental emergencies based on case-based reasoning method. J. Environ. Manag. 2020, 262, 110382. [Google Scholar] [CrossRef]
  42. Yu, X.; Li, C.; Zhao, W.-X.; Chen, H. A novel case adaptation method based on differential evolution algorithm for disaster emergency. Appl. Soft Comput. 2020, 92, 106306. [Google Scholar] [CrossRef]
  43. Chen, M.; Qu, R.; Fang, W. Case-based reasoning system for fault diagnosis of aero-engines. Expert Syst. Appl. 2022, 202, 117350. [Google Scholar] [CrossRef]
  44. Smyth, B.; Keane, M. Remembering to Forget-A Competence-Preserving Case Deletion Policy for Case-Based Reasoning System. In Proceedings of the 14th International Joint Conference on Artificial Intelligence (IJCAI-95), Montreal, QC, Canada, 20–25 August 1995. [Google Scholar]
  45. Zhao, Y.; Zhang, M.; Guo, X.; Zhou, Z.; Zhang, J. Research on Matching Method for Case Retrieval Process in CBR Based on FCM. Procedia Eng. 2017, 174, 267–274. [Google Scholar] [CrossRef]
  46. Hoffmann, M.; Bergmann, R. Using Graph Embedding Techniques in Process-Oriented Case-Based Reasoning. Algorithms 2022, 15, 27. [Google Scholar] [CrossRef]
  47. Plaza, E.; McGinty, L. Distributed case-based reasoning. Knowl. Eng. Rev. 2005, 20, 4. [Google Scholar] [CrossRef]
  48. Xu, B.; Zhang, Y.; Fan, Z.-P.; Han, L.; Shen, Z.-X. Patient privacy protection: Generating available medical treatment plans based on federated learning and CBR. Inf. Manag. 2024, 61, 103908. [Google Scholar] [CrossRef]
  49. Yu, L.; Li, M. A case-based reasoning driven ensemble learning paradigm for financial distress prediction with missing data. Appl. Soft Comput. 2023, 137, 110163. [Google Scholar] [CrossRef]
  50. Forbus, K.D.; Gentner, D.; Law, K. MAC/FAC: A Model of Similarity-Based Retrieval. Cogn. Sci. 1995, 19, 64. [Google Scholar]
  51. Liao, W.; Wang, S.; Liu, Q.; Shu, X. Reactive Power Optimization of Distribution Network Based on Case-Based Reasoning. In Proceedings of the 2018 IEEE Power & Energy Society General Meeting (PESGM), Portland, OR, USA, 5–10 August 2018; pp. 978–982. [Google Scholar]
  52. Ke, Y.; Yao, C.; Song, E.; Yang, L.; Dong, Q. Fault Diagnosis Method of Diesel Engine Injector Based on Hierarchical Weighted Permutation Entropy. In Proceedings of the 2021 IEEE International Instrumentation and Measurement Technology Conference (I2MTC), Glasgow, UK, 17–20 May 2021; pp. 1–6. [Google Scholar]
  53. Chen, W.; Wang, X.; Wang, W.; Zhu, Y.; Cai, Z.; Yang, S. A heterogeneous GRA-CBR-based multi-attribute emergency decision-making model considering weight optimization with dual information correlation. Expert Syst. Appl. 2021, 182, 115208. [Google Scholar] [CrossRef]
  54. Park, S.; Park, S.; Jang, H.; Ahn, Y.; Kwon, N. Computing green remodeling construction cost for public buildings based on genetic algorithm and case-based reasoning. Dev. Built Environ. 2025, 22, 100655. [Google Scholar] [CrossRef]
  55. Begum, S.; Barua, S.; Filla, R.; Ahmed, M.U. Classification of physiological signals for wheel loader operators using Multi-scale Entropy analysis and case-based reasoning. Expert Syst. Appl. 2014, 41, 295–305. [Google Scholar] [CrossRef]
  56. Bergmann, R. Experience Management-Foundations, Development Methodology, and Internet-Based Applications; Springer: Berlin/Heidelberg, Germany, 2002. [Google Scholar]
  57. Zhang, Y.; Zhong, Q.; Ye, X.; Qu, X. Research on method of emergency aid decision making based on CBR. Appl. Res. Comput. 2009, 26, 4. [Google Scholar]
  58. Malizia, F.; Corso, A.; Gambuzza, L.V.; Russo, G.; Latora, V.; Frasca, M. Reconstructing higher-order interactions in coupled dynamical systems. Nat. Commun. 2024, 15, 5184. [Google Scholar] [CrossRef]
  59. Sugihara, G.; May, R.; Ye, H.; Hsieh, C.H.; Deyle, E.; Fogarty, M.; Munch, S. Detecting causality in complex ecosystems. Science 2012, 338, 496–500. [Google Scholar] [CrossRef]
  60. Yuan, B.; Zhang, J.; Lyu, A.; Wu, J.; Wang, Z.; Yang, M.; Liu, K.; Mou, M.; Cui, P. Emergence and Causality in Complex Systems: A Survey of Causal Emergence and Related Quantitative Studies. Entropy 2024, 26, 108. [Google Scholar] [CrossRef] [PubMed]
  61. Zhang, H.; Liu, W.; Luan, Y.; Liu, Y. Construction of Scenario Graph for a Major Emergency. J. China Soc. Sci. Tech. Inf. 2021, 40, 10. [Google Scholar]
  62. Guo, Y.; Jin, Y.; Hu, S.; Yang, Z.; Xi, Y.; Han, B. Risk evolution analysis of ship pilotage operation by an integrated model of FRAM and DBN. Reliab. Eng. Syst. Saf. 2023, 229, 108850. [Google Scholar] [CrossRef]
  63. Zheng, J.; Wang, Y.-M.; Zhang, K.; Gao, J.-Q.; Yang, L.-H. A heterogeneous multi-attribute case retrieval method for emergency decision making based on bidirectional projection and TODIM. Expert Syst. Appl. 2022, 203, 117382. [Google Scholar] [CrossRef]
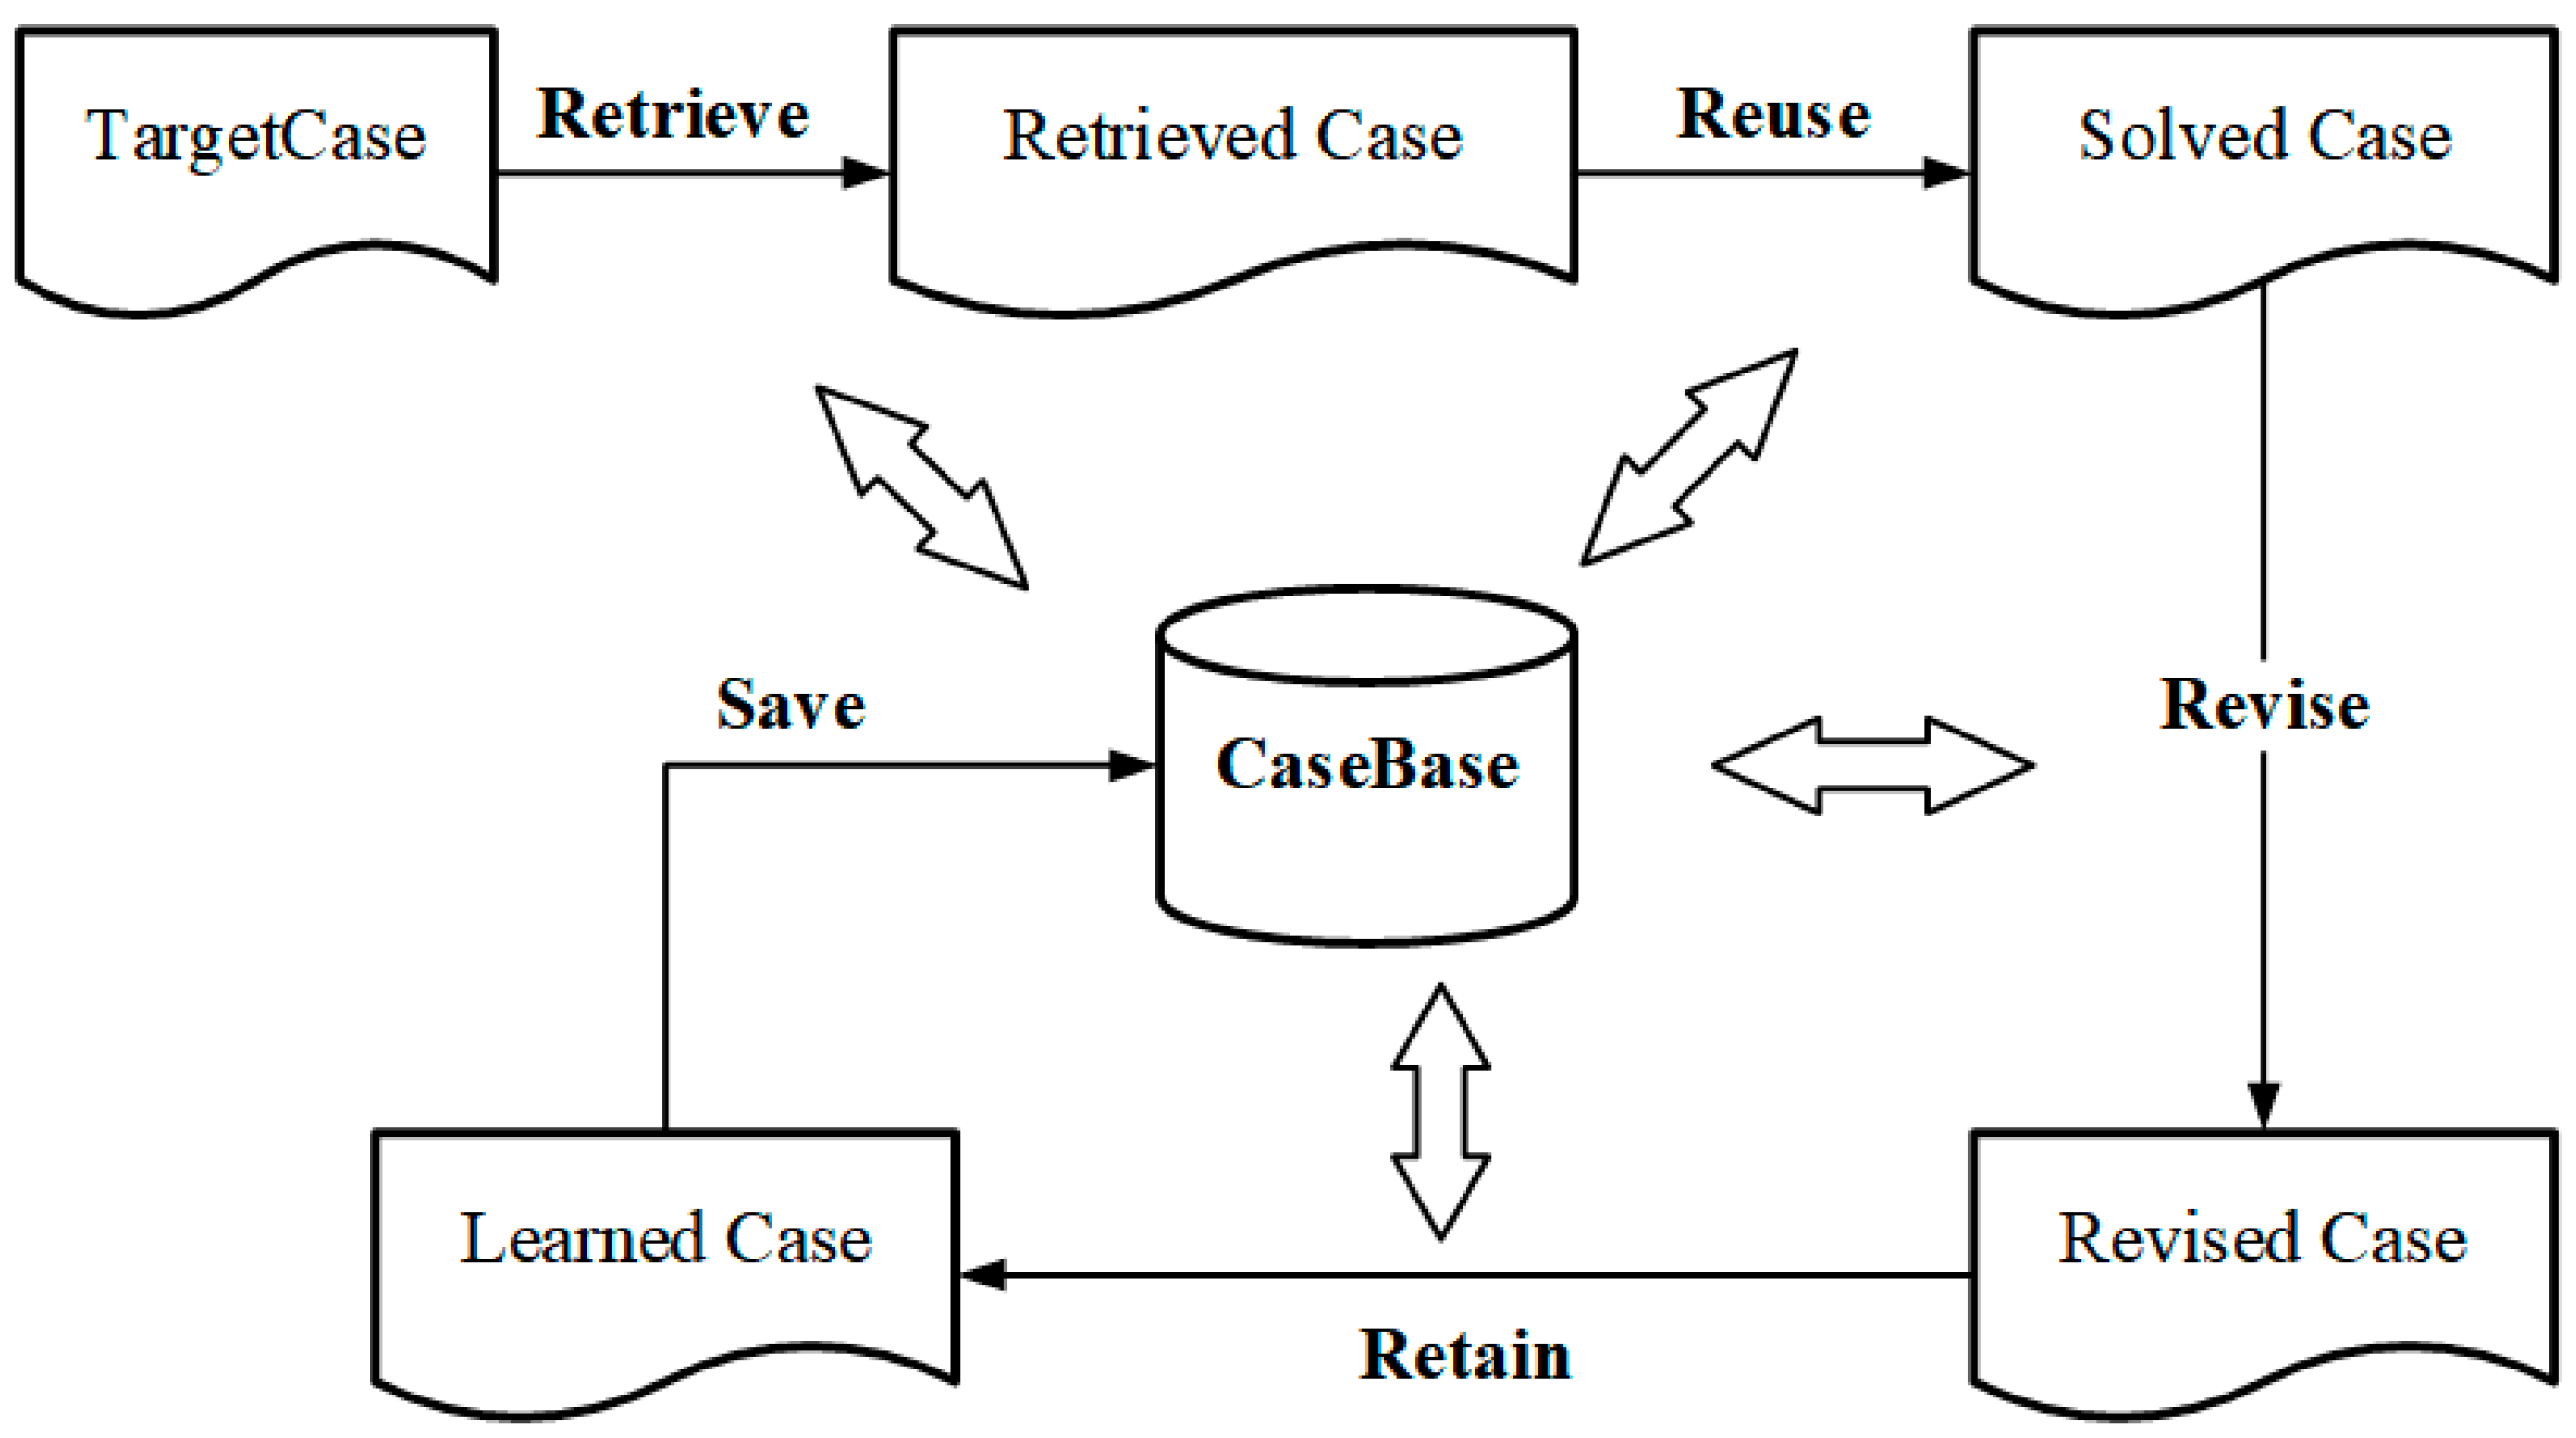
Figure 1. The generic CBR workflow (The two-way arrows represent the two-way support between the case library and each process.).
Systems 13 00766 g001
Figure 2. The framework of the CRCBR method based on the dynamic entropy weight method.
Systems 13 00766 g002
Figure 3. Case model of a multi-layer heterogeneous network and the principle of similarity aggregation (Different colors of nodes at the same layer represent different nodes, colors of nodes at different layers represent the categories of associated layer nodes, and colors at different layers represent layer categories. The directional arrow serves a guiding function. The undirected arrows represent the relationships between nodes within and between layers.).
Systems 13 00766 g003
Figure 4. The principle of similarity misjudgment (The undirected arrows represent the bidirectional relationships between nodes within and between layers. Directed arrows represent the one-way relationship between nodes.).
Systems 13 00766 g004
Figure 5. The basic structure of major maritime emergency cases (Different colors of nodes at the same layer represent different nodes, colors of nodes at different layers represent the categories of associated layer nodes, and colors at different layers represent layer categories.).
Systems 13 00766 g005
Figure 6. The “ORKO” vessel grounding accident case model.
Systems 13 00766 g006
Figure 7. “Mariano Perez IX” accident case model.
Systems 13 00766 g007
Figure 8. The hierarchical structure relationship of various similarities in major maritime emergencies(Dot lines separate the similarity at different layers.).
Systems 13 00766 g008
Figure 9. Output process of prediction results.
Systems 13 00766 g009
Figure 10. Comparison of the optimality of different CBR methods.
Systems 13 00766 g010
Figure 11. Comparison of the satisfactoriness of different CBR methods.
Systems 13 00766 g011
Figure 12. The variation trend of JPI-central with key parameters in different CBR methods. (A) The variation trend of JPI-central with key parameters in CRCBR-EW; (B) The variation trend of JPI-central with key parameters in CRCBR-mean; (C) The variation trend of JPI-central with key parameters in HCBR. The arrow serves a guiding function, pointing to the subgraph of the variation trend of JPI-central with a single parameter of a certain method.
Systems 13 00766 g012
Figure 13. The variation trend of RE with key parameters in different CBR methods. (A) The variation trend of RE with key parameters in CRCBR-EW; (B) The variation trend of RE with key parameters in CRCBR-mean; (C) The variation trend of RE with key parameters in HCBR. The arrow serves a guiding function, pointing to the subgraph of the variation trend of RE with a single parameter of a certain method.
Systems 13 00766 g013
Table 1. Major maritime emergency scenario summary.
Scenario CategoryScenario NumberScenario Name
VesselS1Vessel Collision
S2Hull Rupture
S3Hull Flooding
S4Vessel Capsizing
S5Vessel Fire
S6Vessel Explosion
PersonnelS7Personnel Missing
S8General Personnel Casualties
S9Major Personnel Casualties
EnvironmentalS10General Pollutant Leakage
S11Major Pollutant Leakage
Table 2. Case model symbols and their corresponding meanings.
SymbolMeaningSymbolMeaning
CMajor maritime emergency caseHZHazard source set
SScenario set of a caseVLvulnerable entities set
SkA scenarioMImitigation agents set
ESInter-scenario relationship setENVenvironmental factors set
EkAn inter-scenario relationshipHAttribute set of an object
OObject set of a scenariohiAn attribute
OiAn objectNaName of an attribute
EIInter-object relationship setSaValue of an attribute
Table 3. Example of a case base for major maritime emergencies.
Case NumberAccident NameOccurrence TimeOccurrence PlaceAccident LevelAccident Scenarios
C1Shanghai “8.20” collision accident between “Longqing 1” and “Ning Gaopeng 688”20 August 2020ChinaEspecially MajorS2, S5, S6, S7, S9, S11
C2Qingdao “4.27” ship pollution accident27 April 2021ChinaEspecially MajorS2, S11
C3The “ORKO” grounding and overturning accident2 December 2024PortugalMajorS2, S3, S4, S10
C4“Don Tomasso” overturning accident11 December 2021ArgentinaMajorS3, S4, S8, S10
C5Shanghai “4.5” collision accident between “XIANGZHOU” and “VAN MANILA”5 April 2017 ChinaMajorS2, S3, S4, S9, S11
C6“Pescargen IV” overturning accident5 August 2022ArgentinaMajorS2, S3, S4
C7The “i-Catcher” capsizing accident10 September 2022New ZealandMajorS4, S9, S10
C8The overturning accident of “SAINT BERNARD”17 April 2023FranceGeneralS4, S8
C9“MARIA REINA MADRE” overturning accident9 February 2024SpainGeneralS3, S4
C10The fire and explosion accident of the “CD Manzanillo”10 October 2023SingaporeMajorS5, S6, S8
Table 4. Symbols and meanings related to similarity computation models.
SymbolMeaningSymbolMeaning
S i m C Case similarity T S i m P Attribute set structure similarity
S i m S Scenario set similarity w S Scenario set similarity weight
S i m S R Scenario-level relation similarity w S R Scenario-level relation similarity weight
S i m S i Specific scenario similarity w D Element set similarity weight
S i m D Object set similarity w D R Element-level relation similarity weight
S i m D R Object-level relation similarity w D i Specific-type element similarity weight
S i m D i Specific-type object similarity w d j Specific element similarity weight
T S i m D i Specific-type object structure similarity w P Attribute set similarity weight
S i m d j Specific object similarity w P R Attribute-level relation similarity weight
S i m P Attribute set similarity w P i Specific attribute similarity weight
S i m P Specific attribute similarity
Table 5. Attribute data types and similarity calculation methods.
Data TypeSubtypeVariable Data FormatExamplesSimilarity Calculation Method
Numerical TypePrecise TypeSpecific ValuesCargo Capacity (10,000 tons), Draft (10 m), Temperature (30 °C)Refer to Table 6
Interval TypeSpecific IntervalsOil Spill Volume (10–20 tons), Explosion Range (30–50 m2)Refer to Table 6
Discrete TypeNumerical ListsNumber of Injuries (20, 30 people), Number of Rescue Ships (10, 15 vessels)Refer to Table 6
Boolean Type0–1 VariablesShip Specifications (1,803,020 m) S i m = 1 , x T = x B 0 , x T x B
Scale TypeIncreasing Positive Integer SequenceWind Strength ([1, 2, …, 10] levels), Emergency Response Level ([1, 2, 3] levels) S i m = 1 x T x B β α
Text TypeEnumeration TypeData DescriptionsShip Types (Cargo ships, Fishing vessels, Tankers, etc.) S i m = 1 , x T = x B 0 , x T x B
Evaluation TypeSeries of Words with Comparative ValueDamage Condition (Slight, Moderate, Severe, Extremely Severe) S i m = 1 x T x B β α
xT represents the input case variable, xB denotes the source case variable, β stands for the maximum value of the variable, and α indicates the minimum value of the variable.
Table 6. Similarity calculation of precise, interval and discrete data.
Targetcase Variable TypeBasecase Variable TypeIs the Value Range DeterminedCalculation Formula
Precise TypePrecise Typeyes S i m = 1 x T x B B A
Precise TypePrecise Typeno S i m = x L x U
Interval TypeInterval Typeyes S i m = x T 1 x T 2 x B 1 x B 2 ( 1 y x B A ) d y d x ( x T 2 x T 1 ) ( x B 2 x B 1 )
Interval TypeInterval Typeno S i m = x T 1 x T 2 x B 1 x B 2 ( x L x U ) d y d x ( x T 2 x T 1 ) ( x B 2 x B 1 )
Discrete TypeDiscrete Typeyes S i m = 1 p = 1 m q = 1 n x T p x B q m n ( B A )
Discrete TypeDiscrete Typeno S i m = p = 1 m q = 1 n x L x U m n
Sim represents the similarity measure between xT and xB; A and B denote the upper and lower bounds of variable values respectively; xL and xU represent the minimum and maximum values between xT and xB respectively; xT1 and xT2 specify the lower and upper bounds of xT’s value range; xB1 and xB2 define the lower and upper bounds of xB’s value range; xBk and xBq denote specific values within xB’s value sequence; xTp represents a particular value in xT’s value sequence; m and n indicate the cardinalities of value sequences for Targetcase and Basecase respectively.
Table 7. Performance metrics and calculation methods.
Indicator NameDefinitionCalculation Method
Number of Retrieved Scenarios (NRS)Number of Output Similar ScenariosDerived from Statistical Analysis of Method Output Results
Number of Retrieved True Scenarios (NRTS)Number of Output Similar Scenarios Conforming to FactsNumber of Scenarios Conforming to Facts Among Retrieved Scenarios
Number of Retrieved Scenarios Obtained (NRSO)Number of Similar Scenarios Retrieved from Case BaseStatistical Number of Similar Scenarios Retrieved by CBR Method from Case Base
Recall RatioComprehensiveness of CBR Method in Retrieving Targetcase Fact Scenarios R e c a l l   Ratio = NRS NTS
AccuracyAccuracy of CBR Method in Retrieving Targetcase Fact Scenarios A c c u r a c y = N R T S N T S
Retrieval Efficiency
(RE)
Ratio of Retrieval Effectiveness to Retrieval Cost for CBR Method in Retrieving Targetcase Fact Scenarios R E = N R T S N R S O
Joint Performance Indicator (JPI)Comprehensive Performance of CBR Method in Retrieving Targetcase Fact Scenarios in Terms of Comprehensiveness and Accuracy J P I = r e c a l l   r a t i o × a c c u r a c y
Table 8. Optimality Comparison of CBR Methods.
Method NameNRSNRTSNRSORecall
Ratio
AccuracyREJPI
CRCBR-EW6610110.61
CRCBR-mean6610110.61
HCBR-EW76251.16710.241.167
Disclaimer/Publisher’s Note: The statements, opinions and data contained in all publications are solely those of the individual author(s) and contributor(s) and not of MDPI and/or the editor(s). MDPI and/or the editor(s) disclaim responsibility for any injury to people or property resulting from any ideas, methods, instructions or products referred to in the content.