Article

Evaluating the Impact of Automated Vehicle Penetration on Intersection Traffic Flow: A Microsimulation-Based Approach

Transport Faculty, National University for Science and Technology Politehnica Bucharest, Spl Independentei, No 313, RO-060042 Bucharest, Romania
*
Author to whom correspondence should be addressed.
Systems 2025, 13(9), 751; https://doi.org/10.3390/systems13090751 (registering DOI)
Submission received: 17 July 2025 / Revised: 27 August 2025 / Accepted: 28 August 2025 / Published: 30 August 2025
(This article belongs to the Special Issue Modelling and Simulation of Transportation Systems)

Abstract

As automation technologies continue to advance within the automotive industry, urban road traffic is gradually shifting from conventional driving toward fully autonomous. This transition is supported by the progressive integration of partially automated functions, such as Adaptive Cruise Control (ACC) and lane-keeping assistance, which are already implemented in commercial vehicles and increasingly affect both individual driving behavior and overall traffic flow dynamics. The main purpose of this research is to evaluate the impact of automated vehicles presence in a complex signalized intersection under mixed traffic conditions, considering different penetration rates and demand levels. A review of previous modeling approaches from the literature was conducted, highlighting critical aspects to be considered in the design and simulation of road traffic. Field traffic data were collected and used as input for a microsimulation model developed in AIMSUN. A base scenario and a 20% growth scenario were analyzed to assess the impact of AV-ACC penetration, varying the AV-ACC’s rates in traffic composition. The results indicate that increased AV-ACC penetration rates, especially beyond 50%, contribute significantly to improving traffic stability and efficiency.

1. Introduction

Urban mobility has become an increasingly relevant issue as cities gain prominence, now hosting more than 56% of the world’s population and accounting for over 80% of global GDP [1]. Traditionally, urban planning principles were designed to improve efficiency and quality of life. The development of Smart Mobility offers researchers and practitioners innovative approaches to understanding and designing cities [2]. Given the rapid growth of urbanization and the new mobility challenges faced by most cities, paper [3] seeks to examine the evolution of the Smart Urban Mobility concept through a bibliometric analysis.
To further justify the relevance of the study, we incorporate recent pan-European quantitative evidence. Road congestion in Europe imposes substantial economic costs estimated at over EUR 110 billion annually, equating to approximately 1% of GDP [4].
On the technological front, 67% of new private vehicles sold in Europe during Q1 2025 were equipped with advanced Level-2 autonomous features (ADAS), underlining the growing relevance of automation in traffic modeling [5].
Smart urban mobility is a fundamental component of the smart city concept, which involves maintaining a high quality of travel parameters within urban areas [6,7,8]. The gradual automation of driving processes, including the deployment of automated vehicles, is expected to contribute to sustainable urban mobility, as users begin to shift from active drivers to passive system supervisors [9,10,11,12,13].
The transition toward higher levels of driving automation, supported by advancements in Artificial Intelligence, is occurring incrementally. Four evolutionary traffic phases are commonly identified: (1) traffic composed entirely of regular vehicles (RVs); (2) mixed traffic with both RVs and vehicles with different levels of automation, with RVs still prevailing; (3) mixed traffic where vehicles with different levels of automation become the majority and (4) fully automated traffic. The overarching goal is to develop effective traffic management policies that account for large-scale vehicle interactions, human behavioral variability and the coexistence of RVs with automated vehicles [14].
The smart city concept is closely tied to the adoption of intelligent vehicles [15,16], which play a key role in making urban environments more sustainable, efficient and livable. Increasingly, cities are integrating automated vehicles (AVs) into their transport systems, reshaping urban infrastructure and influencing its environmental sustainability [17]. Paper [18] examines public acceptance of Connected and Automated Vehicles (CAVs), a category of intelligent vehicles that has recently moved from vision to reality. While there is a degree of acceptance for these vehicles, a lack of public awareness leads to some hesitation. As the share of AVs increases, mobility, safety and environmental benefits will eventually improve [19,20].
The Society of Automotive Engineers International (SAE) defines Connected and Automated Vehicles (CAVs) using the J3016 classification framework, which specifies six levels of driving automation from Level 0 to Level 5 [21]. Level 0 (No Automation)—no driving automation; Level 1 (Driver Assistance)—steering or brake/acceleration assistance, with full driver supervision. Level 2 (Partial Automation)—both steering and brake/acceleration assistance, typically combining lane centering with Adaptive Cruise Control (ACC), which maintains speed and following distance, driver must remain attentive. Level 3 (Conditional Automation)—vehicle drives under specific conditions, driver takes over when requested. Level 4 (High Automation)—full driving within defined operational domains (e.g., local driverless taxi) without driver input. Level 5 (Full Automation)—complete driving automation under all conditions, no driver required [22].
Partial automation, like Advanced Driver Assistance Systems (ADAS), enhances driving comfort and safety by reducing human errors. A key example is Adaptive Cruise Control (ACC), which uses sensors to manage speed and distance from the vehicle ahead. An upgraded version, Cooperative Adaptive Cruise Control (CACC), uses vehicle-to-vehicle (V2V) communication for more precise and faster adjustments. Unlike ACC, CACC can communicate with other vehicles via dedicated short-range communication (DSRC), offering a larger detection range. However, in both systems, the driver still controls the steering and monitors the traffic [23].
The potential of automated vehicles (AVs) to improve urban traffic efficiency is a controversial topic, with conflicting findings reported in the literature. A commonly optimistic hypothesis argues that SAE Level 2 AVs, especially those equipped with ACC and CACC, can improve traffic flow stability by minimizing human driving errors and enabling more consistent car-following behavior [23]. On the other hand, critical hypotheses point out that vehicles with different levels of automation may offer limited benefits in complex urban environments. Thus, mixed traffic with penetration rates of automated vehicles with ACC below 50% will initially have a slight negative effect on traffic flow [22,24].
In our paper, the term “AV-ACC” refers to partially automated vehicles corresponding to SAE Level 2 automation. These vehicles are equipped with Adaptive Cruise Control (ACC), which enables automated longitudinal control, i.e., maintaining speed and headway to the preceding vehicle, but do not perform autonomous lateral maneuvers such as lane changes or route-based decisions. Therefore, while longitudinal behavior (acceleration and deceleration) is automated, lateral control and situational awareness remain fully under human driver supervision. Although these vehicles are formally categorized as SAE Level 2 autonomous vehicles, in simulation environments, their lateral behavior is modeled similarly to that of conventional regular vehicles (RVs).
To evaluate the potential impact of partially automated vehicles on urban traffic, two traffic demand scenarios—a base scenario and a 20% growth scenario—have been considered in these analyses. In both cases, the presence of automated vehicles influenced traffic performance according to their penetration rates in the traffic. Results indicate that increasing the penetration rate of AV-ACC vehicles generally enhances traffic efficiency. However, under an increased traffic flow, mixed traffic for penetration rates below 50% of AV-ACC initially has a modest negative effect on traffic flow, due to the interaction complexities introduced by their coexistence. For AV-ACC penetration rates exceeding 50%, the improvements become evident, suggesting that automation benefits are dependent on reaching sufficiently high penetration levels.

2. Literature Review

The existing literature on automated vehicles covers a wide range of topics, from socio-economic implications to technical control strategies and traffic management approaches. To provide a clear and structured overview, the following review is organized into thematic categories: (1) socio-economic and environmental context of automated vehicles adoption, (2) driver behavior modeling and mixed traffic flow dynamics, (3) control strategies for connected and automated vehicles, (4) traffic management at intersections and network level, and (5) observed impacts and thresholds in mixed traffic scenarios.
(1) There are numerous studies that review the literature on AVs, examining their social, economic and financial advantages as well as the geographic scope of the studies. They emphasize that concerns exist across all continents regarding the need to reduce traffic congestion effects, decrease the number of accidents and improve traffic safety [25,26,27,28,29].
A taxonomy of socio-mobility was proposed in [30], which defines how AVs strengthen social connections since the mobility of AVs is considered a vehicle-related issue rather than a mobility issue. However, current research has several limitations: most studies focus on potential benefits in isolation without systematically comparing socio-economic trade-offs or considering transitional periods where AVs and RVs share infrastructure. There is limited quantitative analysis of environmental impacts and the interaction with urban land use. This gap highlights the need for studies that integrate socio-economic, environmental, and urban planning dimensions simultaneously, allowing a more realistic assessment of AVs adoption effects.
(2) Several studies focus on understanding driver behavior and its impact on mixed traffic conditions. An analysis of driver behavior models was proposed in [31]. These models have been used as input data for self-coaching, accident prevention studies and the development of driver assistance systems.
In [32], the authors introduced a model designed to examine the interaction between AVs and RVs while accounting for the uncertainty of human driving behavior. The experimental results show that AVs exert a notable influence on both the uncertainty and stability of mixed traffic flow. Moreover, higher penetration rates of AVs can mitigate the unpredictability of RV behavior and enhance the overall stability of the traffic system.
According to [33], the advancement of vehicle automation will lead to a future in which human-driven vehicles and autonomous vehicles coexist. As a result, conventional vehicles, carsharing services, autonomous vehicles and shared autonomous vehicles will operate side by side, reshaping travel behavior. Autonomous vehicles—particularly when integrated with shared mobility—hold the potential to alleviate or even resolve pressing urban issues such as traffic congestion, road accidents and inefficient land use.
Many studies address the coexistence of conventional human-driven vehicles and autonomous vehicles with different proportions of traffic. Rey and Levin proposed a new stochastic traffic control policy that accounts for both autonomous vehicles and conventional ones, assuming that autonomous vehicles travel in dedicated lanes and have separate or reserved signal phases at intersections, similar to cyclists [34]. Paper [35] studied a scenario where both autonomous and conventional vehicles share the same road. The autonomous vehicles are controlled by a centralized system, while human drivers dynamically react to traffic conditions. The autonomous vehicle management system involves a control policy designed to indirectly influence the decisions of conventional vehicle drivers in order to minimize congestion [35].
CAVs are capable of forming platoons, thereby reducing headways and improving road capacity. In mixed traffic, however - where RVs and CAVs operate together—platoon intensity is strongly affected by the stochastic arrangement of the two vehicle types. As a result, road capacity remains highly uncertain even under identical flow conditions. To address this challenge, ref. [36] introduces a mixed traffic assignment model designed for worst-case scenarios. The model estimates the minimum network capacity and its corresponding equilibrium flow. This assignment problem is formulated as a bilevel programming approach: the lower-level component is expressed as a variational inequality problem to compute equilibrium flows under fixed link capacities, while the upper-level component determines the optimal inputs for all link capacities within their ranges to minimize overall network performance. To solve this bilevel worst-case assignment problem, the authors propose a partition-based norm-relaxed feasible direction algorithm.
Despite the richness of these studies, several knowledge gaps remain. There is no standardized calibration for RVs and AVs behavioral models, leading to inconsistent findings across studies. For example, some studies [32,34,35] suggest substantial traffic stability improvements at moderate AVs penetration, whereas others [22,24,37,38] report negligible or negative impacts under conservative AVs settings. Additionally, few studies account for spatial–temporal correlations in network-level traffic flow, or systematically examine threshold effects, where mixed traffic behavior changes abruptly.
Recent works introduce advanced modeling approaches that could address these gaps. Jorge A. Laval [39] presents a fluid-dynamics perspective on traffic flow, while Eun Hak Lee and Euntak Lee [40] propose a congestion boundary approach to detect phase transitions in traffic flow. Zhao Liu et al. [41] uses a spatial–temporal graph convolution network model for traffic prediction, and Oikonomou et al. [42] simulate CAV safety from conflicts to crashes. These studies provide frameworks that can be applied to understand complex mixed traffic interactions more systematically.
Our study builds upon these approaches by evaluating the impact of AV-ACC functionality in a complex signalized intersection under mixed traffic conditions. Using field traffic data as input for a microsimulation model in AIMSUN, we analyzed scenarios with varying demand levels and AV-ACC penetration rates, highlighting how increased penetration—particularly beyond 50%—affects traffic stability and efficiency.
(3) Research has also examined control techniques that can optimize CAVs performance and safety. Paper [43] analyzed control techniques for CAVs, which are essential for vehicle safety, passenger comfort, transport efficiency and energy savings. It provides a comprehensive overview of vehicle control technology, starting from trajectory prediction for a single vehicle (microscopic level) to the control of a group of connected vehicles (macroscopic level).
In road transport, human error accounts for nearly 90% of accidents. Vehicle automation contributes to improved safety by mitigating driver fatigue and errors, while also enhancing overall mobility efficiency. However, the large-scale adoption of CAVs will unfold over several decades, during which they must coexist with RVs. In [44], the mobility and safety performance of CAVs under mixed traffic conditions is assessed using the cumulative-anticipative car-following (CACF) model. The study compares the CACF approach with the widely used Wiedemann 99 model and cooperative adaptive cruise control (CACC), within the VISSIM simulation platform. The simulations cover both single-lane and multi-lane scenarios and include sensitivity analyses for key mobility and safety parameters. Additionally, Paper [45] analyzed the impact of AVs on urban traffic network capacity through an experimental microscopic traffic simulation using the SUMO platform. The findings indicate that, for both grid and real-world networks, traffic capacity exhibits a quasi-linear growth as the penetration rate of AVs increases.
Future challenges include potential interactions between AVs and RVs, namely vehicle-to-vehicle (V2V) and vehicle-to-infrastructure (V2I) communication [46,47]. Few studies systematically link control strategies with emergent network-level traffic patterns, leaving uncertainty on how microscopic vehicle control translates into macroscopic flow stability. Advanced AI-based models offer opportunities to bridge this gap. Zhao Liu et al. [41] propose a spatial–temporal graph convolution network model informed by traffic fundamental diagram data, and Oikonomou et al. [42] simulate macroscopic safety outcomes from conflicts to crashes. Integrating these approaches can enhance the predictive power and reliability of AVs control in mixed traffic scenarios.
(4) The management of vehicle traffic at urban intersections is mainly approached in two ways. One is the management of traffic control at isolated intersections, or local treatment, and the other is the management of traffic over a traffic zone, or global treatment. In the first approach, the traffic signal cycle durations are sized independently for each intersection in order to minimize delay times, while in the second, decision variables for all intersections are set to minimize the users’ travel time throughout the network. These methods are addressed in study [48]. In the case of mixed traffic, consisting of both AVs and RVs, isolated intersection control makes sense. Simulating a fleet of AVs under real traffic conditions requires a dynamic approach since vehicle routes may change over time due to traffic conditions.
(5) Finally, several studies focus on the actual effects of AVs penetration rates on traffic performance. There are studies [22,24,37,38,49] that show that mixed traffic involving low-level AVs will initially have a slight negative effect on traffic flow and road capacities. Both ref. [22] and ref. [24] emphasize the fact that AVs can improve traffic capacity and stability, but their impact depends on factors like penetration rate, AVs settings, traffic volume and human behavior. According to those studies, significant benefits are seen when the penetration rate exceeds 40%. In study [37], the authors conclude that AV-ACC systems tend to have, on average, longer time gaps compared to RVs, a finding supported by other European Commission-funded studies such as [38], which also observed comparable or even longer reaction times in AV-ACC than in RVs.
Despite multiple empirical and simulation studies, clear thresholds and conditions for stability improvement remain debated. Contradictions in reported outcomes arise from differences in behavioral assumptions, AVs control logic and network topology.
Our study contributes by systematically analyzing AV-ACC penetration rates in a complex signalized intersection using AIMSUN microsimulation, identifying how varying AV-ACC shares affect traffic performance under both current and 20% growth demand scenarios. This addresses unresolved questions in the literature regarding the threshold effects of partially automated vehicles and provides actionable insights for traffic management and intersection design.

3. Materials and Methods

The overall methodological framework employed in this study is illustrated in Figure 1. The experimental design was developed in accordance with the study’s main objectives, aiming to assess the effects of increasing levels of partially automated vehicles on intersection traffic performance. Simulation scenarios were created by varying key behavioral parameters influencing vehicle interactions and driver decision-making processes, along with adjustments in traffic volumes, signal control plans, and the proportion of AV-ACC. The simulation was carried out using a microsimulation model developed in AIMSUN (version 8.2.1), calibrated with field data collected from inductive loop detectors.
After setting up the simulation environment, all relevant inputs were assigned to each scenario. Each configuration incorporated specific combinations of demand levels, signal timings, and behavior models for both RVs and AV-ACC. Once the scenarios were defined, the simulations were executed, and key performance metrics—including intersection throughput, average vehicle delay and travel speed—were recorded. Finally, the results were compiled, analyzed and interpreted in accordance with the study’s main objectives. Each component of the methodology is described in detail in the following sub-sections.
In urban traffic environments, the primary behavioral sub-models implemented in AIMSUN include car-following, lane-changing, gap acceptance during lane changes, gap acceptance for yielding and anticipatory (look-ahead) behavior. An overview of the main parameters defining the behavioral sub-models in AIMSUN is presented in Table 1.
The car-following model is central to representing longitudinal vehicle interactions, as it determines the clearance between a leading and a following vehicle. In AIMSUN, this model is based on the well-established Gipps model [50,51] and has been extended to incorporate localized behavioral parameters. These parameters vary depending on several contextual factors such as driver type (e.g., compliance with speed limits), roadway geometry (e.g., speed limits per segment or turn), and the influence of neighboring vehicles. The model comprises two components: acceleration, which simulates the effort to attain a desired speed under free-flow conditions, and deceleration, which reflects the behavioral adaptation to the leading vehicle’s speed and position, thereby regulating longitudinal headway for safety and stability.
The implementation of AV-ACC in Aimsun 8.2.1 is limited, as it does not support vehicle platooning functionalities or explicitly model V2V communication latency, which should be considered when interpreting the results. Instead, AV-ACC behavior is represented through individual car-following adjustments such as reaction time, headway and deceleration rate.
A critical factor influencing car-following behavior is the reaction time, which reflects the temporal delay between the perception of a stimulus and the corresponding driving action. In AIMSUN, this parameter is further disaggregated into three distinct types to capture specific traffic conditions and behavioral responses: Reaction time, Reaction time at stop, Reaction time at traffic light. These parameters have a significant influence on traffic flow performance, particularly under congested or signalized conditions.
In the calibration phase, four candidate configurations (C1–C4) were defined to replicate, as accurately as possible, the behavior of regular vehicles (RVs) within the studied complex intersection. This was achieved by adjusting the three reaction time parameters, while the remaining behavioral parameters—related to car-following, lane-changing, and driver characteristics—were set according to values reported in the literature to ensure consistency with empirically observed driving behavior. The GEH statistics were employed as the calibration metric to assess the consistency between simulated and observed traffic volumes at both the entry and exit points of the intersection and are calculated using the following formula:
G E H   =   2 ( Q m     Q c ) 2 Q m   +   Q c
where Qm—output traffic volume from the simulation model (vehicles per hour); Qc—real-world hourly traffic count (vehicles per hour).
According to widely accepted guidelines, a GEH value less than 5% is generally considered indicative of a good fit between simulated and real-world traffic counts [52,53].
In addition to the GEH statistic, the coefficient of determination R2 can be calculated to further assess calibration quality. Values for R2 within the range 0.90–1.00 are commonly considered acceptable for traffic model calibration [54].
Within the simulation framework, the experimental design component was structured to investigate the influence of partially automated vehicles interacting with regular vehicles in the considered scenarios. A series of simulation configurations were defined by systematically varying the penetration rate of AV-ACC (25%, 50%, 75%, and 100%). For each scenario, key performance indicators—including the average values of delay, queue, flow and speed—were extracted to facilitate comparative analysis.

4. Case Study

4.1. Study Area

In the last decade, research on road safety and traffic risk assessment has concluded that identifying locations with frequent accidents is essential to understanding their underlying causes [55].
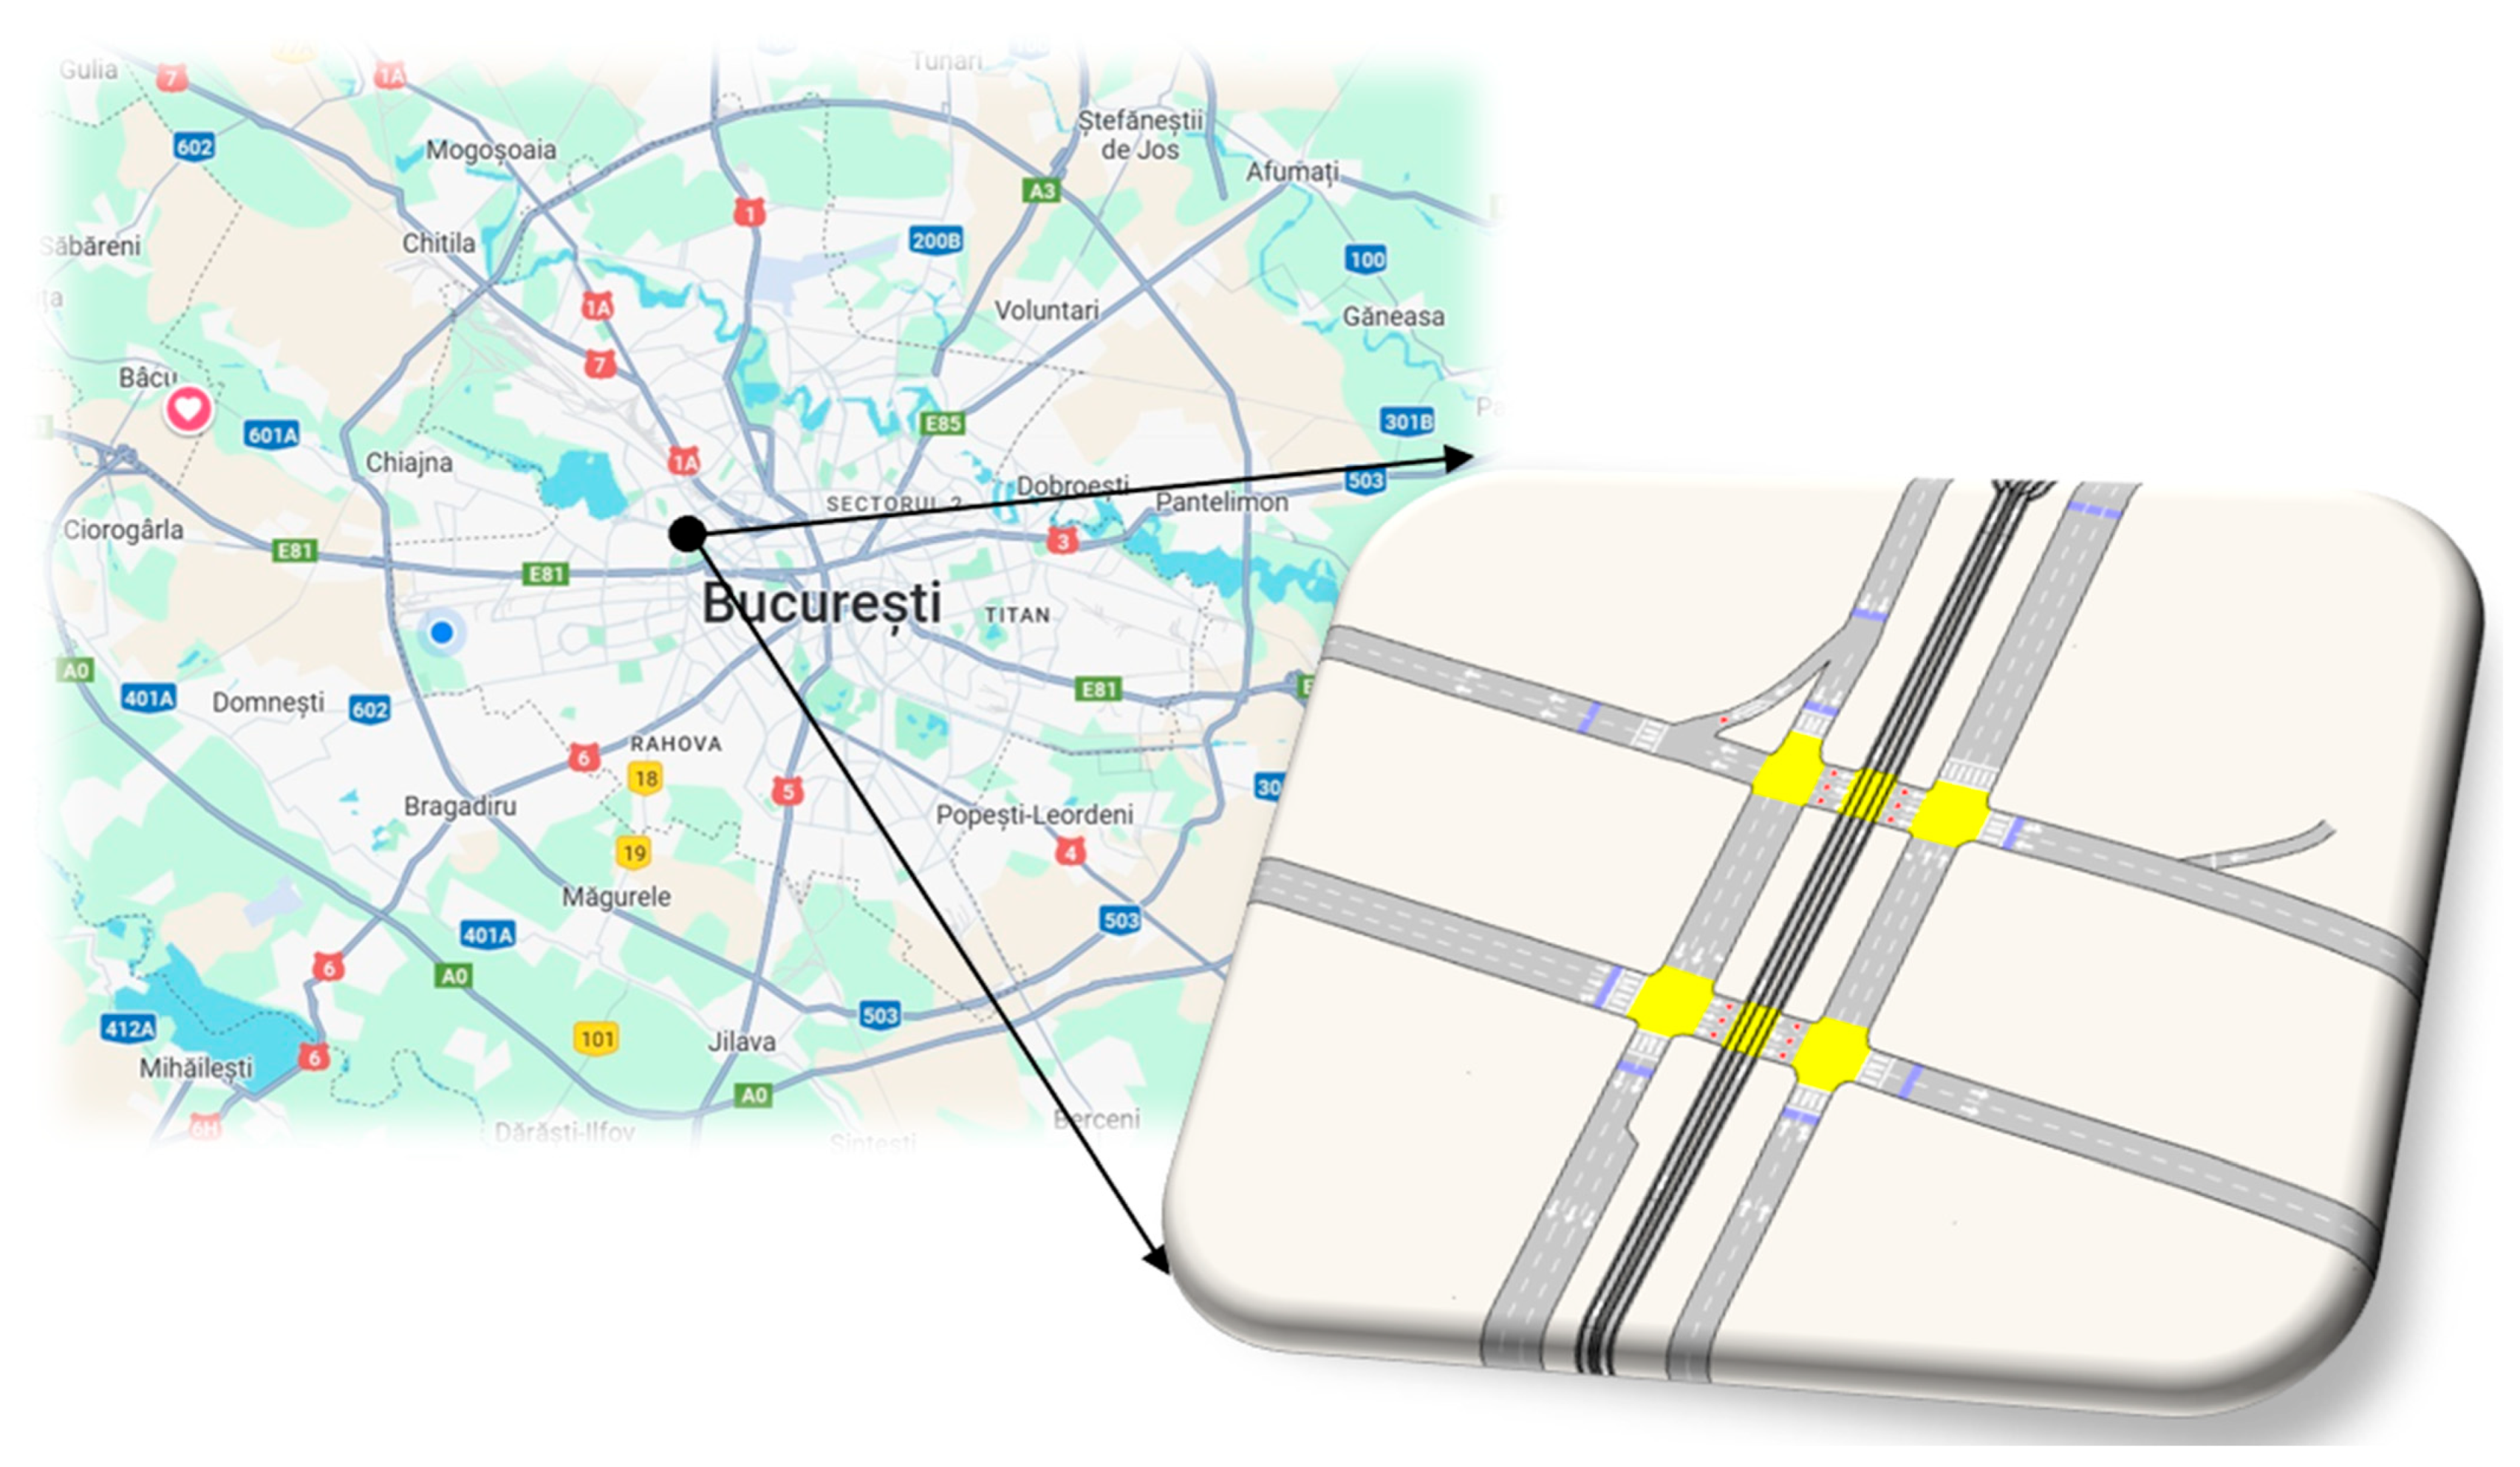
The case study focuses on the intersection ranked number one in Bucharest in the black spot classification (according to the data from Traffic Police Department): Splaiul Independenței × Bd. Doina Cornea × Orhideelor Street (Grozăvești Intersection) (Figure 2). The Basarab overpass is not included in the analysis.
The Grozăvești intersection is a complex junction with a central circular island crossed by a tram line. Traffic is signalized and the intersection is classified as Class I in terms of functionality.
The roads that form the intersection are:
-
Splaiul Independenței—a category I arterial road, separated by the Dâmbovița River, having 2 traffic lanes per direction (approx. 3.00–3.50 m/lane), excepting the West access that has 3 traffic lanes;
-
Bd. Doina Cornea—a category II road, divided by a central tram corridor, having 2 lanes per direction (approx. 3.40–3.50 m/lane),
-
Orhideelor Street—a category II road, having 2 lanes per direction (approx. 3.40–3.50 m/lane).
Traffic priority is marked along the East–West axis (Splaiul Independenței).
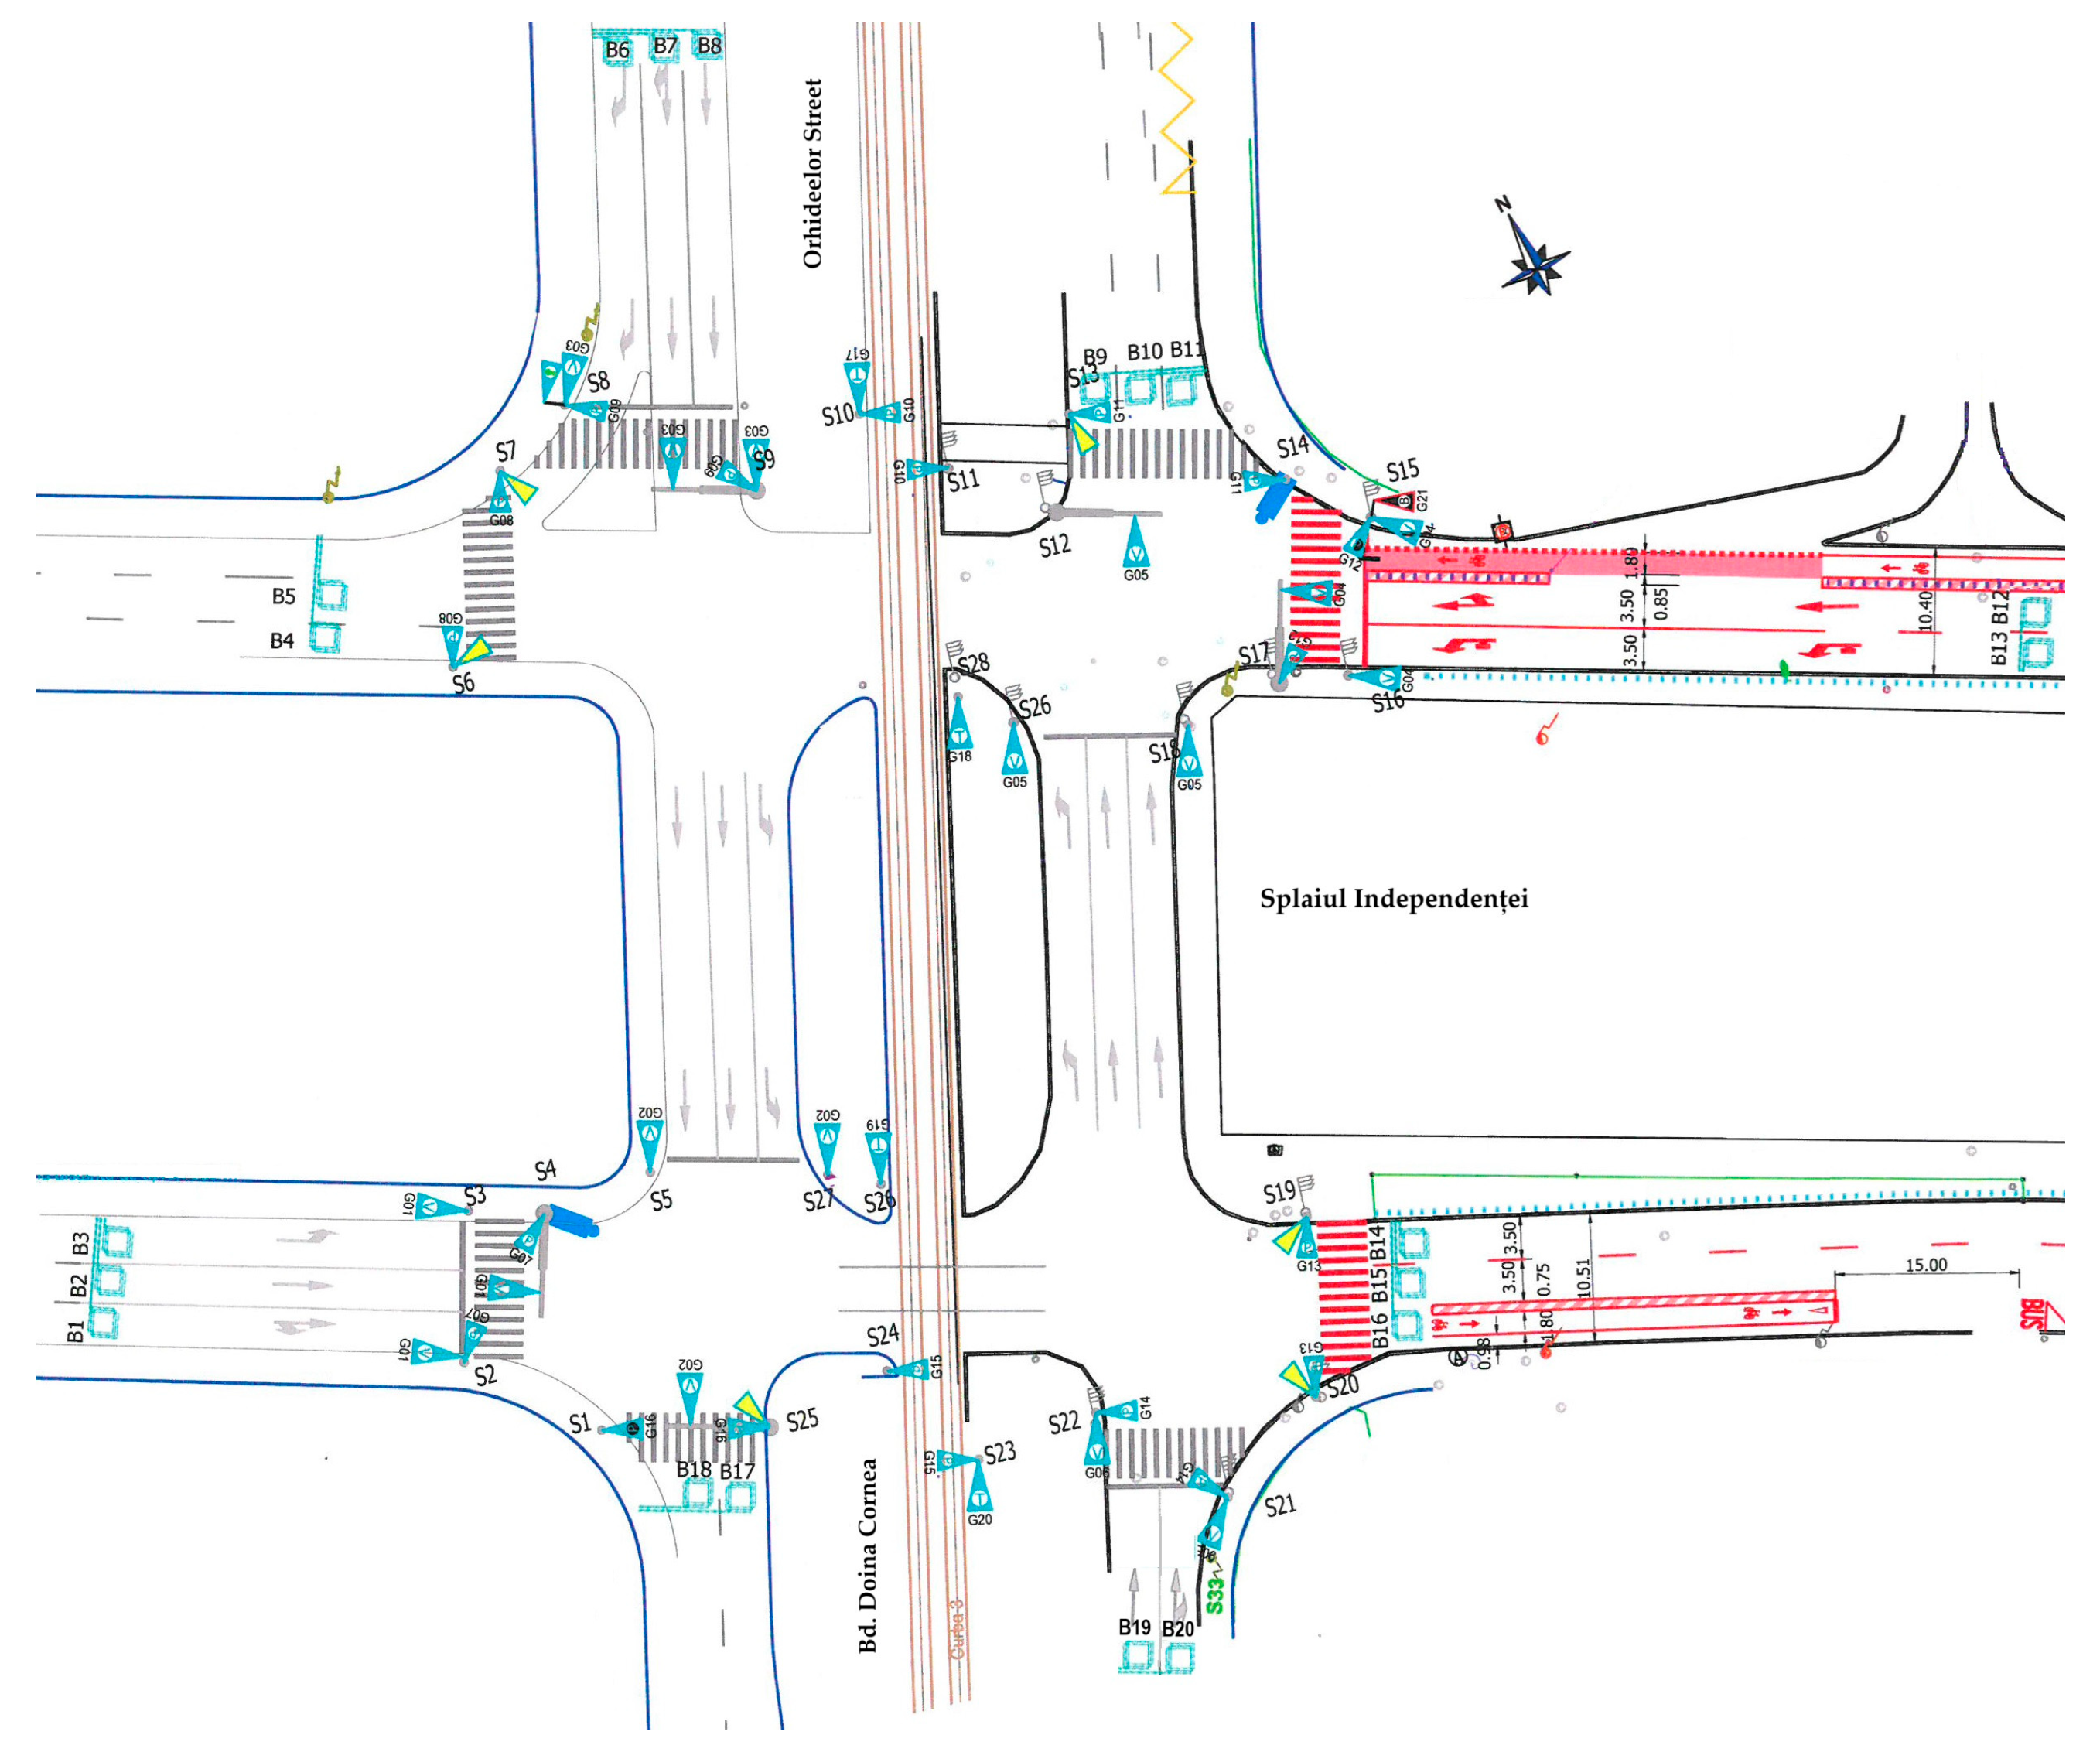
For the traffic analysis, directional traffic counts were carried out. Traffic counts were performed at the intersection using inductive loop detectors installed at each entry and exit point (Figure 2).
Four measurement zones were defined within the intersection, each equipped with inductive loop detectors. One set of loops was assigned to each traffic conflict subzone, as shown in the plan below (Figure 3). Traffic counts were initially collected using inductive loop detectors over a one-week period (31 March–5 April 2025) for 24 h per day. However, due to a malfunction of one of the loops starting on 1 April, only the data from Monday, 31 March 2025, were used for analysis. Measurements were taken under mild weather conditions (19 °C, partly sunny). Table 2 provides an overview of the traffic flows considered in the analysis.
From a traffic signalization perspective, the intersection currently operates as shown in the diagram in Figure 4. The traffic signal control plan has a cycle duration of 120 s and consists of four signal groups, each managing a specific direction or movement:
a.
Signal 1 controls the North (Orhideelor Street)–South (Bd. Doina Cornea) movement, with a green time of 35 s;
b.
Signal 2 controls the East–West (Splaiul Independenței) movement, with a green time of 33 s;
c.
Signal 3 manages the central lanes, providing a green time of 63 s;
d.
Signal 4 is dedicated to public transport (tram line) and has a green time of 15 s.
The diagram shows how these signal phases are interleaved to minimize conflicts and support efficient traffic flow. The overlapping of Signals 1 and 3 indicates the coordination of parallel flows along the NS direction.
To better understand the diagram presented in Figure 4, Figure 5 highlights the physical layout of the intersection, emphasizing the green light phases corresponding to Signals 1 to 4.
The right turn from Orhideelor Street is excluded from signal control and is made via a dedicated slip lane.
The simulation experiments in AIMSUN for the configurations (C1–C4) were conducted under the following assumptions:
  • the values assigned to the behavioral parameters are presented in Table 3;
  • the warm-up period is set to 15 min, which is considered sufficient to mitigate the effects of the initial conditions and to allow the system to reach a stationary state;
  • the simulation step is set to 0.1 s.
  • the simulation duration is one hour, corresponding to the morning peak period between 07:00 and 08:00 AM.
For RVs, reaction times were selected based on typical ranges reported in empirical studies, where general reaction times vary between 0.8 and 1.2 s, reaction times at stop range from 1.0 to 1.5 s, and reaction times at traffic lights can reach 1.5 to 2.0 s, reflecting attention lapses and behavioral variability [56,57].
Each configuration was evaluated by comparing simulated and observed traffic volumes using the GEH statistics and the results are summarized in Table 4.
Among the four simulated configurations (C1–C4), only Configuration C4 yielded GEH values below 5% for all entry and exit detectors, thereby satisfying the generally accepted calibration threshold (which require 100% of the GEH values to fall below 10 and at least 85% below 5 [58]) across the network. In contrast, configurations C1 through C3 exhibited multiple GEH values exceeding this threshold, particularly at the western and eastern access points, indicating suboptimal alignment with observed traffic volumes. As such, Configuration C4 was selected as the calibrated base model for subsequent experimental analysis.
In addition to the GEH statistic, the coefficient of determination (R2) was calculated to further assess calibration quality. The resulting value of R2 = 0.958 (Figure 6) indicates a very high level of concordance between observed and simulated traffic volumes. In the literature, values within the range 0.90–1.00 are commonly considered acceptable for traffic model calibration [54].
Combined with the fact that all GEH values fall below 5, this result confirms that Configuration C4 provides a reliable calibrated base model.
To evaluate the robustness of the calibrated model, a validation procedure was carried out using traffic volumes from an independent time period (12:00–13:00). The comparison between observed and simulated volumes was assessed by means of the GEH statistic, which is widely used for traffic modeling validation. The results, summarized in Table 5, indicate that all GEH values are below the commonly accepted threshold of 5, confirming a good level of agreement between the microsimulation outputs and field measurements.
While the validation presented in Table 5 is based on traffic volumes, future research will include the evaluation of additional performance indicators such as speed, delay, and queue length, in order to provide a more comprehensive assessment of model accuracy.

4.2. Microsimulation Scenarios and Results

The experiment was structured to analyze the dynamic behavior of partially automated vehicles in mixed traffic conditions, focusing on longitudinal motion, lane-changing interactions, and traffic flow stability. Scenarios were developed to reflect varying levels of ACC-equipped vehicle penetration within the traffic stream composition - specifically 25%, 50%, 75%, and 100%. After configuring the simulation environment in AIMSUN and assigning the prepared input data summarized in Table 2 and Table 4, simulations were conducted for each case. Key traffic performance indicators, such as intersection throughput, average delay, queue and speed, were collected to evaluate the influence of automation on operational efficiency.
Two test scenarios were examined reflecting different traffic conditions:
  • A base scenario: this scenario represents the current traffic conditions.
  • A growth scenario: assuming a 20% increase in traffic demand while keeping the network geometry and signal settings unchanged.
For both scenarios, the analysis focused on a one-hour morning peak period (7:00–8:00 a.m.), across five levels of ACC-equipped vehicle penetration (0%, 25%, 50%, 75%, and 100%). Each case incorporated a distinct set of behavioral parameters to differentiate between conventional RVs and partially automated vehicles (ACC-equipped), as implemented in the AIMSUN microsimulation platform (see Table 6). Each scenario was run for ten stochastic replications. Flows were aggregated in 2-minute bins.
For SAE Level 2 vehicles equipped with Adaptive Cruise Control (ACC), reaction times were set to 0.7 s during car-following, 1.0 s when resuming from a stop, and 0.9 s in response to traffic signals. These values reflect the faster and more consistent response behavior of ACC systems, as documented in studies such as [38,59].
In congested urban environments, RVs tend to exhibit higher queue entry speeds (approximately 1.10 m/s), primarily due to their greater behavioral variability and longer reaction times. In contrast, vehicles equipped with Adaptive Cruise Control (ACC) adopt a more conservative and stable car-following behavior, resulting in lower queue entry speeds of approximately 1.00 m/s. Furthermore, while RVs typically accelerate more abruptly when exiting a queue (≈3.70 m/s), ACC-equipped vehicles apply smoother and more controlled acceleration, leading to slightly lower queue exit speeds (around 3.50 m/s), influenced by their shorter reaction times at stop and reduced headway aggressiveness [60]. Headway Aggressiveness value of 0.05 was adopted, reflecting the conservative behavior of commercially available Adaptive Cruise Control (ACC) systems. This parameter setting implies that vehicles maintain relatively large time headways, prioritizing safety and stability over roadway capacity.
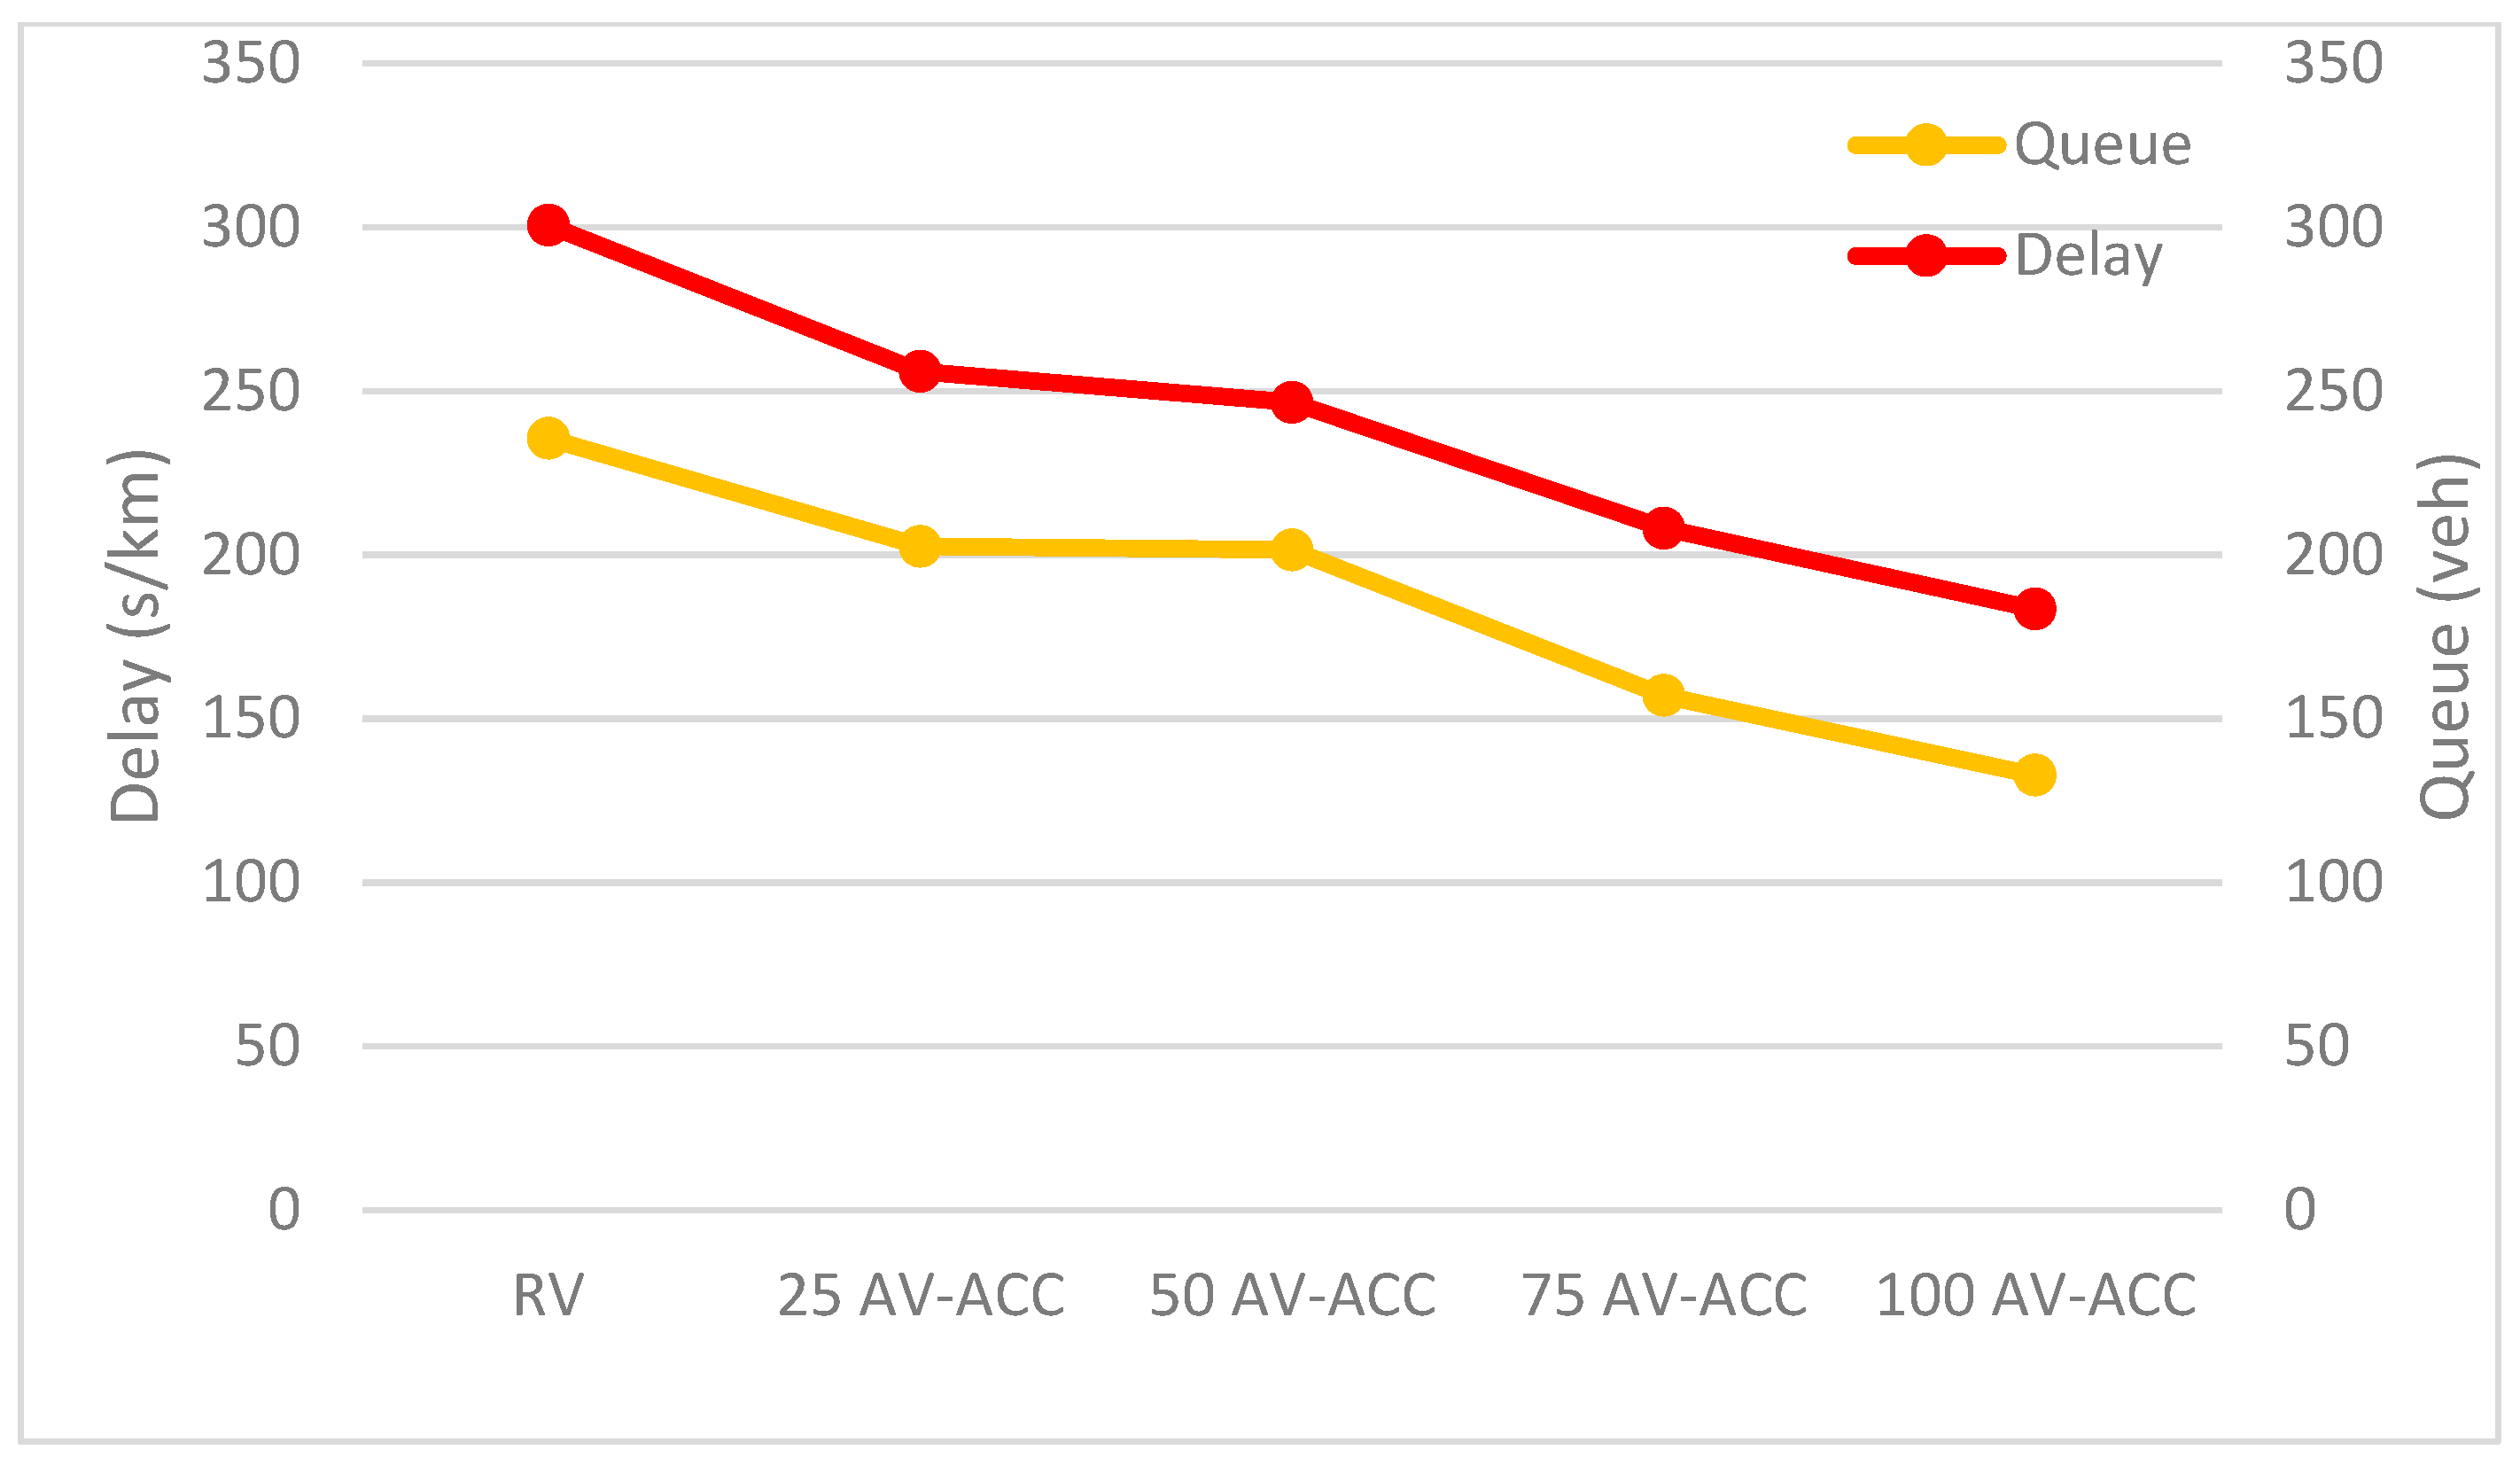
The variation in key performance indicators (delay time, queue, flow and speed) is shown in Figure 7, Figure 8 and Figure 9 for base scenario and in Figure 10 and Figure 11 for growth scenario. In both scenarios we considered the increasing of AV-ACC vehicles penetration (0%, 25%, 50%, 75% and 100%).
In base scenario, traffic conditions are the least efficient for RV. As the proportion of AV-ACC vehicles increases (from 25% to 100%), both the delay time and queue length consistently decrease and both flow and speed display a progressive increase, demonstrating that a higher penetration of AV-ACC vehicles improve traffic performance.
Delay time decreases by 17.99% for mixed traffic (50% AV-ACC) and by 38.97% for full AV-ACC traffic conditions. The queue also decreases by 14.47% for mixed traffic and by 43.68% for full AV-ACC traffic. The speed increases by 5.11% for mixed traffic and by 18.70% for full AV-ACC traffic. Significant improvements in traffic performance are observed when AV-ACC penetration exceeds 75%, underlining the impact of higher automation levels in reducing congestion and improving traffic flow efficiency.
The flow increases by 2.41% for mixed traffic and by 6.15% for full AV-ACC traffic.
To evaluate stability, we analyzed traffic flow using variance and time-series methods. We simulated two scenarios—RV and AV-ACC—each with 10 independent replications over a 1-hour window. At scenario level we report mean across replications, standard deviation (SD), variance, coefficient of variation (CV) and 95% confidence intervals (CI). Equality of variances was assessed with Levene’s test and differences in means with Welch’s t-test.
We obtain the following results:
RV: 3295.7 veh/h (SD = 42.8; CV = 1.30%; 95% CI [3265.1, 3326.3]).
AV-ACC: 3498.4 veh/h (SD = 31.6; CV = 0.90%; 95% CI [3475.8, 3521.0]).
The mean increase is +202.7 veh/h, which corresponds to +6.15% for AV-ACC relative to RV.
Levene’s test indicates no significant difference in variances (stat = 1.6128, p = 0.2203); the RV/AV-ACC variance ratio is 1.832. Welch’s t-test shows a highly significant difference in means (t = 12.0596, p = 1.27 × 10⁻⁹). Mean ± SD bands are narrow for both scenarios (Figure 9); the Δ(t) series is consistently positive; and the ~10-minute rolling SD indicates a stable process with no abrupt variability spikes.
Within the simulated conditions, AV-ACC delivers a robust ≈ 6% increase in hourly flow together with lower relative dispersion (CV) and stable temporal behavior.
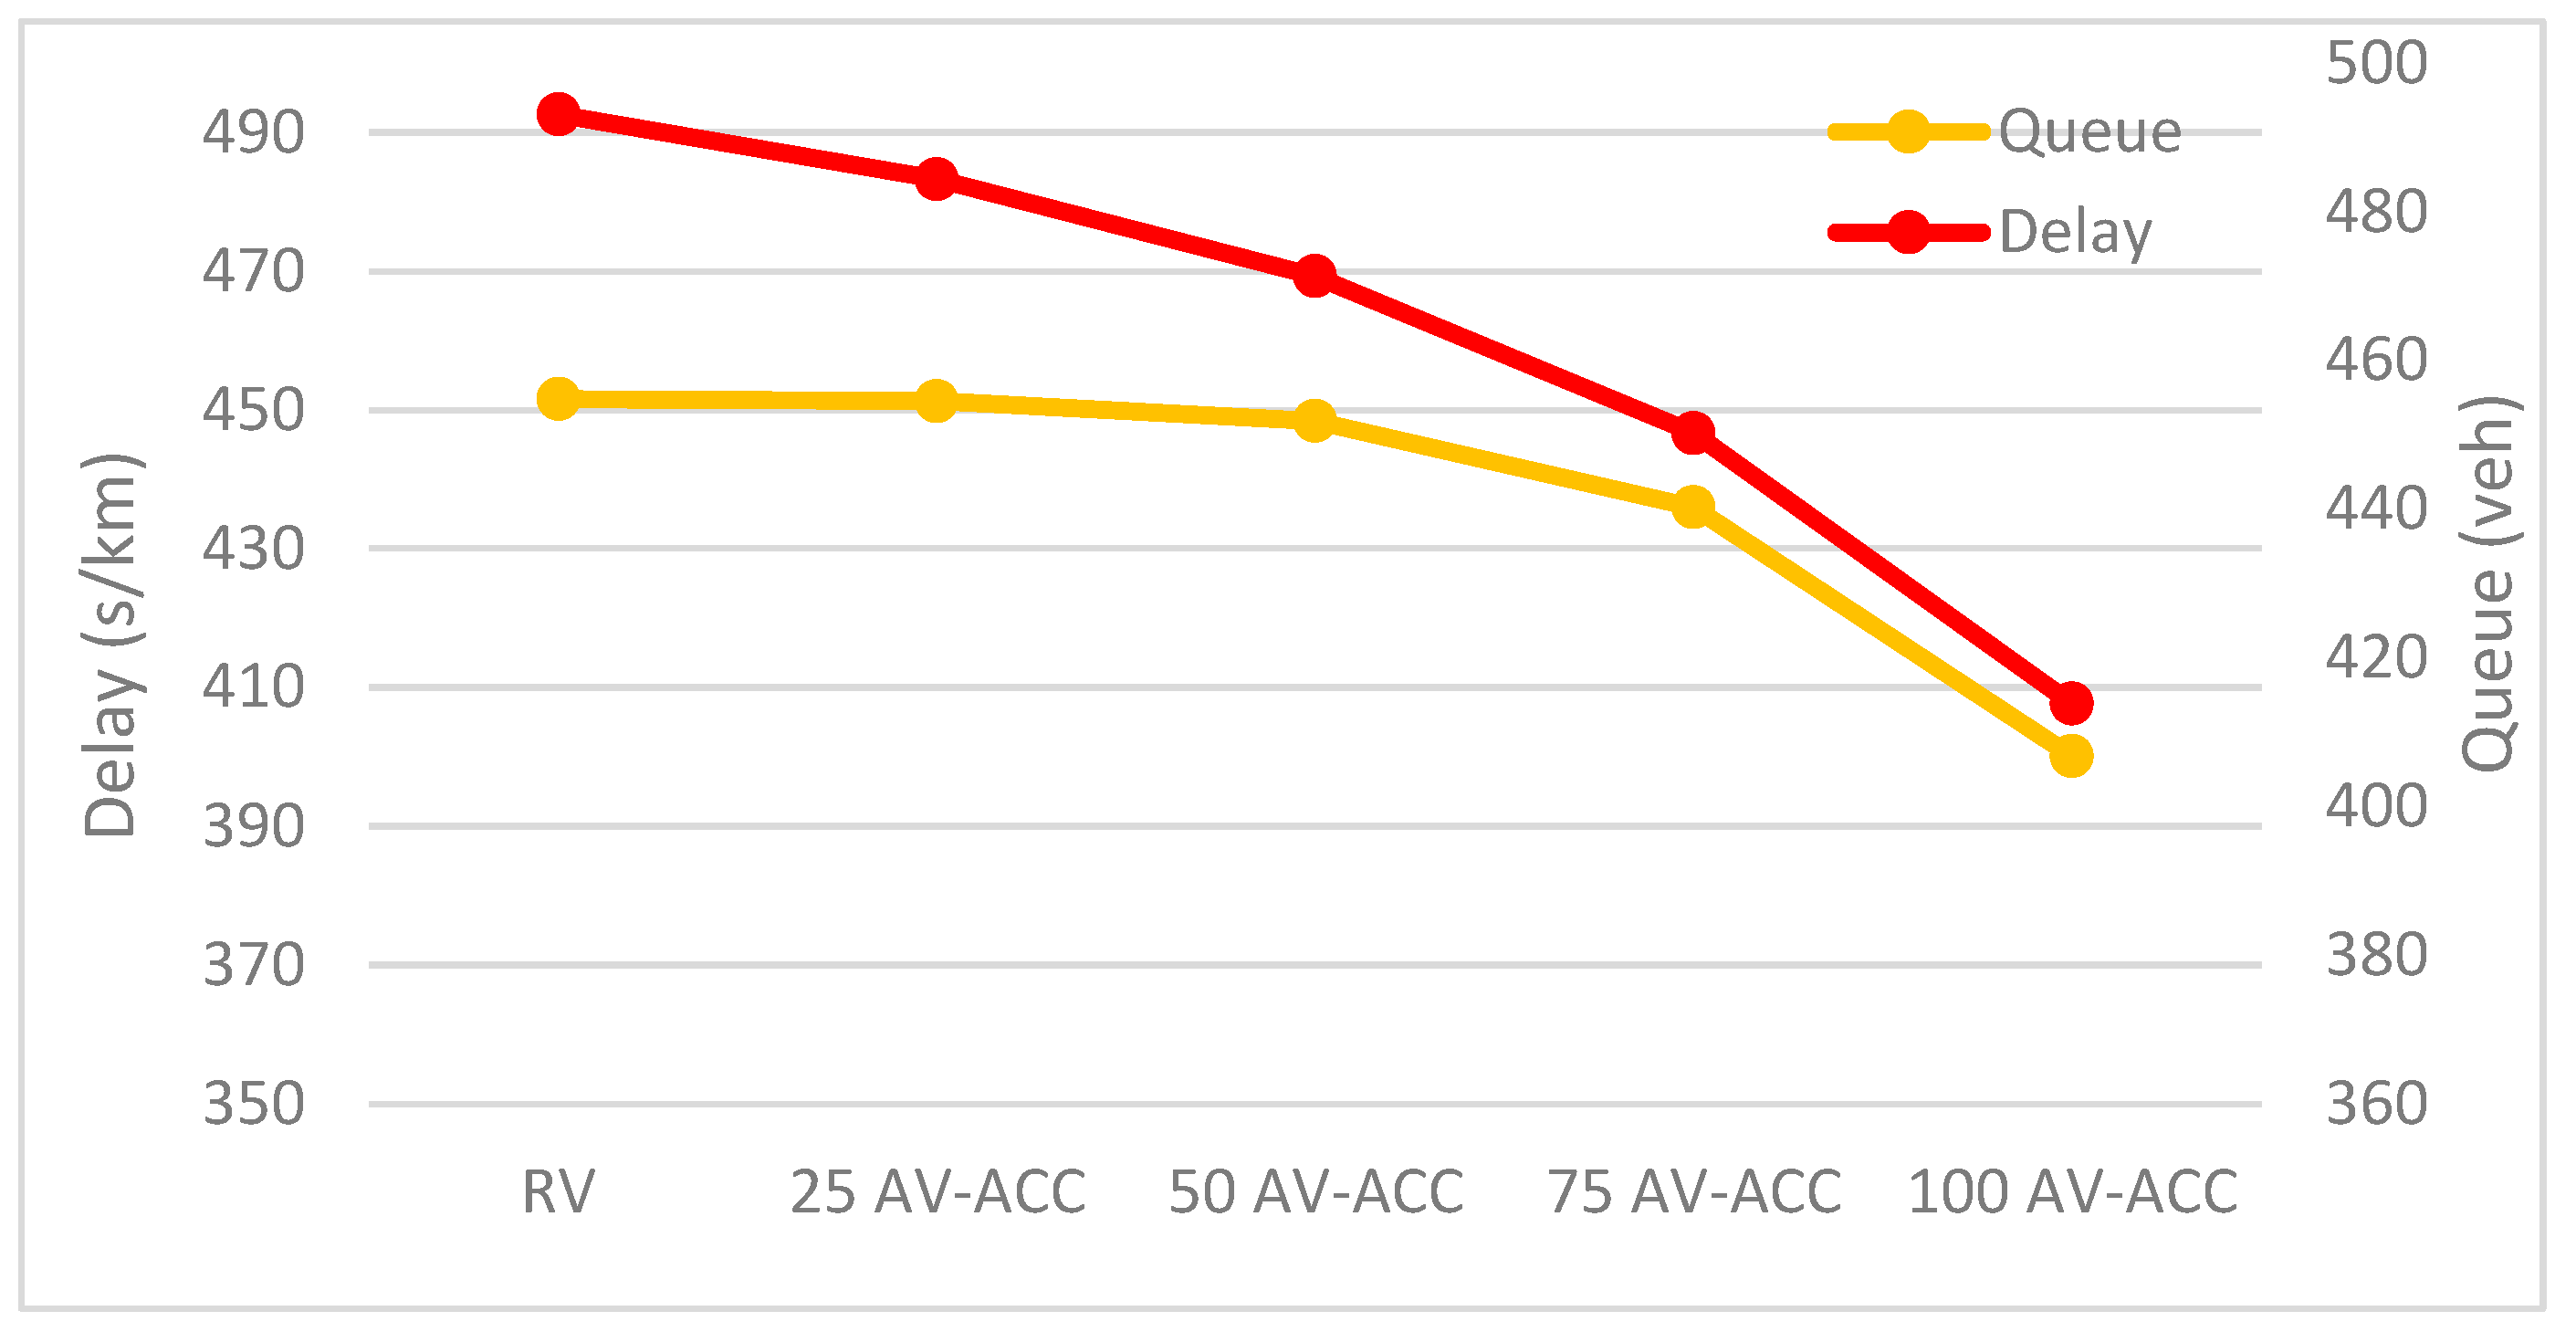
Figure 10 and Figure 11 show the variation in key performance indicators (delay time, queue, flow, and speed) for the growth scenario, with AV-ACC penetration levels of 0%, 25%, 50%, 75%, and 100%.
In the growth scenario, traffic conditions are also the least efficient for RV. Delay time decreases by 4.41% for mixed traffic and by 16.08% for full AV-ACC traffic conditions. The queue decreases by 0.70% for mixed traffic and by 11.41% for full AV-ACC traffic. For AV-ACC penetration exceeding 50%, traffic flow becomes more homogeneous, allowing coordinated vehicle behavior that leads to reduced queues. The speed increases only by 1% under mixed traffic conditions and by 9.12% under full AV-ACC traffic. The flow increases by 2.76% for mixed traffic and by 5.65% for full AV-ACC traffic.
The evolution of queue length with increasing AV-ACC penetration does not follow a strictly monotonic pattern at lower adoption levels (≤50%). This nonlinear variation can be attributed to the interaction mechanisms between heterogeneous driver types. At low penetration rates, AV-ACC vehicles are still strongly influenced by the surrounding regular vehicles, which reduces their stabilizing potential and may even introduce local fluctuations in queue dynamics. Only when penetration levels exceed 50% does the stabilizing influence of AV-ACC become dominant, resulting in a more consistent reduction in both delay time and queue length.
All reported performance indicators (delay time, queue length, flow and speed) were calculated as network-wide averages aggregated over all approaches of the modeled intersection during the one-hour simulation period.
Under higher traffic volumes (growth scenario), variations in traffic performance indicators are smaller compared to those obtained in lower traffic volumes (base scenario).

5. Conclusions

This paper investigates the AV-ACC implementation impacts on the traffic performance in a complex urban intersection, under a mixed traffic environment with RVs. The full or partial implementation of AV-ACC offers several positive impacts that improve the efficiency of the traffic flow in the intersection.
A complex signalized intersection was selected, and field data was collected to use as an input in AIMSUN microsimulation software. In the calibration phase, four configurations were defined to replicate the behavior of RVs. This was achieved by adjusting reaction time in motion, reaction time at stop and reaction time at traffic light, while the remaining behavioral parameters—car-following, lane-changing, driver characteristics—were set according to the values reported in the literature. We chose the configuration with GEH values less than 5% as the calibrated base scenario.
Two traffic demand scenarios—a base scenario and a 20% growth scenario—were analyzed to assess the impact of ACC-equipped vehicles under varying percentages of AV-ACC in traffic composition. The results demonstrated that increasing AV-ACC penetration rates improved traffic performance across both scenarios, with more significant benefits observed under current traffic conditions compared to the growth scenario.
For the base scenario, all traffic performance indicators are improved for mixed traffic. For growth scenarios, mixed traffic for penetration rates below 50% involving automated vehicles with ACC will initially have a slight negative effect on traffic flow. The results of the simulations show that AV-ACC can improve traffic capacity and stability when the penetration rate exceeds 50%.
It should be noted that the performance improvements reported in this study are specific to the fixed signal control plan applied in all scenarios. This constraint was deliberately imposed to isolate the influence of AV driving behavior from that of signal timing optimization. While this approach enhances the internal validity of the results, it also limits their direct applicability to other signal settings. In practice, the magnitude of benefits may differ under alternative control strategies, such as adaptive or traffic-responsive systems. Future research should therefore investigate how varying AV penetration rates interact with different signal control policies to assess the combined effects on intersection performance.
The study was limited to AIMSUN microsimulation software. It is recommended that further evaluations be conducted with other microsimulation models in order to confirm findings and establish principles for the effective use of these models in traffic engineering. Also, it is recommended that behavioral parameters related to car-following, lane-changing and driver characteristics be measured in future research. Collecting real-world data on these parameters would allow a more accurate calibration and validation of simulation models, thereby enhancing their reliability when applied to complex traffic environments.
Although comparative methods were used to maintain interpretability in a controlled simulation setting, future studies could employ machine learning techniques to capture potential nonlinearities and complex interactions among AV behavioral parameters.
Future research should also extend the analysis to multiple intersections and corridor-level networks, investigating how signal coordination and varying traffic patterns influence the performance and stability of mixed traffic with AV-ACC vehicles.
Finally, this study is limited by the unavailability of detailed vehicle trajectory data in the current simulation framework, which prevented the analysis of stability indicators such as acceleration/deceleration distributions or vehicle stops. Future work will address these aspects using extended simulation capabilities.

Author Contributions

Conceptualization, M.A.R. and F.C.O.; methodology, M.A.R.; software, M.A.R. and F.C.O.; formal analysis, V.D.; resources, O.M.D. and S.B.; writing—original draft preparation, M.A.R., F.C.O. and V.D.; writing—review and editing, I.C.; project administration, M.A.R. All authors have read and agreed to the published version of the manuscript.

Funding

The research work contained in this paper was supported within the framework of the grant no. 168/04.12.2023 from the National Program for Research of the National Association of Technical Universities—GNAC ARUT 2023.

Data Availability Statement

Additional data can be obtained from the authors.

Acknowledgments

This work was supported by a grant from the National Program for Research of the National Association of Technical Universities—GNAC ARUT 2023.

Conflicts of Interest

The authors declare no conflicts of interest.

References

  1. Porru, S.; Misso, F.E.; Pani, F.E.; Repetto, C. Smart mobility and public transport: Opportunities and challenges in rural and urban areas. J. Traffic Transp. Eng. 2020, 7, 88–97. [Google Scholar] [CrossRef]
  2. Allam, Z.; Bibri, S.E.; Jones, D.S.; Chabaud, D.; Moreno, C. Unpacking the “15-Minute City” via 6G, IoT, and Digital Twins: Towards a New Narrative for Increasing Urban Efficiency, Resilience, and Sustainability. Sensors 2022, 22, 1369. [Google Scholar] [CrossRef]
  3. Allam, Z.; Sharifi, A. Research Structure and Trends of Smart Urban Mobility. Smart Cities 2022, 5, 539–561. [Google Scholar] [CrossRef]
  4. Christidis, P.; Ibáñez Rivas, J.N. Measuring Road Congestion; Practical Guidance Report EUR 25550 EN; Joint Research Centre, Institute for Prospective Technological Studies: Seville, Spain, 2012; ISBN 978-92-79-27015-4. ISSN 1831-9424. Available online: https://www.researchgate.net/publication/339712526_Measuring_road_congestion (accessed on 12 August 2025).
  5. Counterpoint Technology Market Research. Two-Thirds of Passenger Vehicles Sold in Europe in Q1 2025 Came with ADAS: Chinese OEMs Democratizing the Market; Counterpoint Technology Market Research: London, UK, 2025; Available online: https://www.counterpointresearch.com/en/insights/two-thirds-of-pv-sold-in-europe-in-q1-2025-came-with-adas-chinese-oems-democratizing-market?utm_source=chatgpt.com (accessed on 12 August 2025).
  6. Biyik, C.; Abareshi, A.; Paz, A.; Arce Ruiz, R.; Battarra, R.; Rogers, C.D.F.; Lizarraga, C. Smart Mobility Adoption: A Review of the Literature. J. Open Innov. Technol. Mark. Complex. 2021, 7, 146. [Google Scholar] [CrossRef]
  7. Goumiri, S.; Yahiaoui, S.; Djahel, S. Smart Mobility in Smart Cities: Emerging challenges, recent advances and future directions. J. Intell. Transp. Syst. 2024, 29, 81–117. [Google Scholar] [CrossRef]
  8. Medina-Tapia, M.; Robusté, F. Exploring paradigm shift impacts in urban mobility: Autonomous Vehicles and Smart Cities. Transp. Res. Procedia 2018, 33, 203–210. [Google Scholar] [CrossRef]
  9. Golbabaei, F.; Yigitcanlar, T.; Bunker, J. The role of shared autonomous vehicle systems in delivering smart urban mobility: A systematic review of the literature. Int. J. Sustain. Transp. 2021, 15, 731–748. [Google Scholar] [CrossRef]
  10. Manfreda, A.; Ljubi, K.; Groznik, A. Autonomous vehicles in the smart city era: An empirical study of adoption factors important for millennials. Int. J. Inf. Manag. 2021, 58, 102050. [Google Scholar] [CrossRef]
  11. Richter, M.A.; Hagenmaier, M.; Bandte, O.; Parida, V.; Wincent, J. Smart cities, urban mobility and autonomous vehicles: How different cities needs different sustainable investment strategies. Technol. Forecast. Soc. Change 2022, 184, 121857. [Google Scholar] [CrossRef]
  12. Pérez-Moure, H.; Lampon, J.; Velando-Rodriguez, M.E.; Rodriguez-Comesana, L. Revolutionizing the road: How sustainable, autonomous, and connected vehicles are changing digital mobility business models. Eur. Res. Manag. Bus. Econ. 2023, 29, 100230. [Google Scholar] [CrossRef]
  13. Di, X.; Shi, R. A survey on autonomous vehicle control in the era of mixed-autonomy: From physics-based to AI-guided driving policy learning. Transp. Res. C 2021, 125, 103008. [Google Scholar] [CrossRef]
  14. Campisi, T.; Severino, A.; Al-Rashid, M.A.; Pau, G. The Development of the Smart Cities in the Connected and Autonomous Vehicles (CAVs) Era: From Mobility Patterns to Scaling in Cities. Infrastructures 2021, 6, 100. [Google Scholar] [CrossRef]
  15. Medina-Tapia, M.; Robusté, F. Implementation of Connected and Autonomous Vehicles in Cities Could Have Neutral Effects on the Total Travel Time Costs: Modeling and Analysis for a Circular City. Sustainability 2019, 11, 482. [Google Scholar] [CrossRef]
  16. Cugurullo, F.; Acheampong, R.A.; Gueriau, M.; Dusparic, I. The Transition to Autonomous Cars, the Redesign of Cities and the Future of Urban Sustainability. Urban Geogr. 2021, 42, 833–859. [Google Scholar] [CrossRef]
  17. Saravanos, A.; Pissadaki, E.K.; Singh, W.S.; Delfino, D. Gauging Public Acceptance of Conditionally Automated Vehicles in the United States. Smart Cities 2024, 7, 913–931. [Google Scholar] [CrossRef]
  18. Tettamanti, T.; Varga, I.; Szalay, Z. Impacts of autonomous cars from a traffic engineering perspective. Period. Polytech. Transp. Eng. 2016, 44, 244–250. [Google Scholar] [CrossRef]
  19. Seraj, M.; Li, J.; Qiu, Z. Modeling microscopic car-following strategy of mixed traffic to identify optimal platoon configurations for multiobjective decision-making. J. Adv. Transp. 2018, 2018, 7835010. [Google Scholar] [CrossRef]
  20. SAEJ 3016—SAE Standard J3016_202104; Taxonomy and Definitions for Terms Related to Driving Automation Systems for On-Road Motor Vehicles. SAE International Recommended Practice: Warrendale, PA, USA, 2021.
  21. SAE Levels of Driving AutomationTM Refined for Clarity and International Audience. Available online: https://www.sae.org/site/blog/sae-j3016-update (accessed on 12 August 2025).
  22. Al-Turki, M.; Ratrout, N.T.; Rahman, S.M.; Reza, I. Impacts of Autonomous Vehicles on Traffic Flow Characteristics under Mixed Traffic Environment: Future Perspectives. Sustainability 2021, 13, 11052. [Google Scholar] [CrossRef]
  23. Milanés, V.; Shladover, S.E.; Spring, J.; Nowakowski, C.; Kawazoe, H.; Nakamura, M. Cooperative Adaptive Cruise Control in Real Traffic Situations. IEEE Trans. Intell. Transp. Syst. 2014, 15, 296–305. [Google Scholar] [CrossRef]
  24. Calvert, S.C.; Schakel, W.J.; van Lint, J.W.C. Will Automated Vehicles Negatively Impact Traffic Flow? J. Adv. Transp. 2017, 2017, 3082781. [Google Scholar] [CrossRef]
  25. Wessling, B. Mercedes Rolls Out Level 3 Autonomous Driving Tech in Germany. Available online: https://www.therobotreport.com/mercedes-rolls-out-level-3-autonomous-driving-tech-in-germany/ (accessed on 26 November 2023).
  26. Dent, S. Mercedes Becomes the First Automaker to Sell Level 3 Self-Driving Vehicles in California. Available online: https://www.engadget.com/mercedes-becomes-the-first-automaker-to-sell-level-3-self-driving-vehicles-in-california-103504319.html (accessed on 1 December 2023).
  27. Zhao, C.; Li, L.; Pei, X.; Li, Z.; Wang, F.-Y.; Wu, X. A comparative study of state-of-the-art driving strategies for autonomous vehicles. Accid. Anal. Prev. 2021, 150, 105937. [Google Scholar] [CrossRef] [PubMed]
  28. Makahleh, H.Y.; Ferranti, E.J.S.; Dissanayake, D. Assessing the Role of Autonomous Vehicles in Urban Areas: A Systematic Review of Literature. Future Transp. 2024, 4, 321–348. [Google Scholar] [CrossRef]
  29. D’Emidio, M.; Delfaraz, E.; Di Stefano, G.; Frittella, G.; Vittoria, E. Route Planning Algorithms for Fleets of Connected Vehicles: State of the Art, Implementation, and Deployment. Appl. Sci. 2024, 14, 2884. [Google Scholar] [CrossRef]
  30. Kassens-Noor, E.; Dake, D.; Decaminada, T.; Kotval-K, Z.; Qu, T.; Wilson, M.; Pentland, B. Sociomobility of the 21st century: Autonomous vehicles, planning, and the future city. Transp. Policy 2020, 99, 329–335. [Google Scholar] [CrossRef]
  31. Negash, N.M.; Yang, J. Driver Behavior Modeling toward Autonomous Vehicles: Comprehensive Review. IEEE Access 2023, 11, 22788–22821. [Google Scholar] [CrossRef]
  32. Zheng, F.; Liu, C.; Liu, X.; Jabari, S.E.; Lu, L. Analyzing the Impact of Automated Vehicles on Uncertainty and Stability of the Mixed Traffic Flow. Transp. Res. Part C Emerg. Technol. 2020, 112, 203–219. [Google Scholar] [CrossRef]
  33. Tian, Z.; Feng, T.; Timmermans, H.J.P.; Yao, B. Using autonomous vehicles or shared cars? Results of a stated choice experiment. Transp. Res. C 2021, 128, 103117. [Google Scholar] [CrossRef]
  34. Rey, D.; Levin, M.W. Blue phase: Optimal network traffic control for legacy and autonomous vehicles. Transp. Res. B 2019, 130, 105–129. [Google Scholar] [CrossRef]
  35. Lazar, D.A.; Biyik, E.; Sadigh, D.; Pedarsani, R. Learning how to dynamically route autonomous vehicles on shared roads. Transp. Res. C 2021, 130, 103258. [Google Scholar] [CrossRef]
  36. Wang, J.; Wang, W.; Ren, G.; Yang, M. Worst-case traffic assignment model for mixed traffic flow of human-driven vehicles and connected and autonomous vehicles by factoring in the uncertain link capacity. Transp. Res. C 2022, 140, 103703. [Google Scholar] [CrossRef]
  37. Chaudhry, A.; Sha, H.; Boghani, H.; Thomas, P.; Quddus, M.; Brackstone, M.; Tympakianaki, A.; Bin, H.; Glaser, S.; Papazikou, E.; et al. Behavioural Parameters for Connected and Automated Vehicles Within the LEVITATE Project; LEVITATE Consortium: Loughborough, UK, 2021. [Google Scholar]
  38. Makridis, M.; Mattas, K.; Borio, D.; Giuliani, R.; Ciuffo, B. Estimating reaction time in Adaptive Cruise Control System. In Proceedings of the 2018 IEEE Intelligent Vehicles Symposium (IV), Changshu, China, 26–30 June 2018; IEEE: New York, NY, USA, 2018; pp. 1312–1317. [Google Scholar] [CrossRef]
  39. Laval, J.A. Traffic Flow as a Simple Fluid: Toward a Scaling Theory of Urban Congestion. Transp. Res. Rec. 2023, 2678, 376–386. [Google Scholar] [CrossRef]
  40. Lee, E.H.; Lee, E. Congestion Boundary Approach for Phase Transitions in Traffic Flow. Transp. B Transp. Dyn. 2024, 12, 2379377. [Google Scholar] [CrossRef]
  41. Liu, Z.; Ding, F.; Dai, Y.; Li, L.; Chen, T.; Tan, H. Spatial-Temporal Graph Convolution Network Model with Traffic Fundamental Diagram Information Informed for Network Traffic Flow Prediction. Expert Syst. Appl. 2024, 249, 123543. [Google Scholar] [CrossRef]
  42. Oikonomou, M.G.; Ziakopoulos, A.; Chaudhry, A.; Thomas, P.; Yannis, G. From Conflicts to Crashes: Simulating Macroscopic Connected and Automated Driving Vehicle Safety. Accid. Anal. Prev. 2023, 187, 107087. [Google Scholar] [CrossRef]
  43. Liu, W.; Hua, M.; Deng, Z.; Meng, Z.; Huang, Y.; Hu, C.; Song, S.; Gao, L.; Liu, C.; Shuai, B.; et al. Systematic Survey of Control Techniques and Applications in Connected and Automated Vehicles. IEEE Internet Things J. 2023, 10, 21892–21916. [Google Scholar] [CrossRef]
  44. Ahmed, H.U.; Ahmad, S.; Yang, X.; Lu, P.; Huang, Y. Safety and Mobility Evaluation of Cumulative-Anticipative Car-Follo wing Model for Connected Autonomous Vehicles. Smart Cities 2024, 7, 518–540. [Google Scholar] [CrossRef]
  45. Lu, Q.; Tettamanti, T.; Hörcher, D.; Varga, I. The Impact of Autonomous Vehicles on Urban Traffic Network Capacity: An Experimental Analysis by Microscopic Traffic Simulation. Transp. Lett. 2020, 12, 540–549. [Google Scholar] [CrossRef]
  46. Chen, S.; Hu, J.; Shi, Y.; Peng, Y.; Fang, J.; Zhao, R.; Zhao, L. Vehicle-to-everything (V2X) services supported by LTE-based systems and 5G. IEEE Commun. Stand. Mag. 2017, 1, 70–76. [Google Scholar] [CrossRef]
  47. Gupta, M.; Benson, J.; Patwa, F.; Sandhu, R. Secure V2V and V2I communication in intelligent transportation using cloudlets. IEEE Transp. Serv. Comput. 2020, 15, 1912–1925. [Google Scholar] [CrossRef]
  48. Cascetta, E.; Gallo, M.; Montella, B. Models and algorithms for the optimization of signal settings on urban networks with stochastic assignment models. Ann. Oper. Res. 2006, 144, 301–328. [Google Scholar] [CrossRef]
  49. Milakis, D.; Snelder, M.; van Arem, B.; van Wee, B.; Correia, G.H.A. Development and transport implications of automated vehicles in the Netherlands: Scenarios for 2030 and 2050. Eur. J. Transp. Infrastruct. Res. 2017, 17, 63–85. [Google Scholar] [CrossRef]
  50. Gipps, P.G. A behavioural car-following model for computer simulation. Transp. Res. Part B Methodol. 1981, 15, 105–111. [Google Scholar] [CrossRef]
  51. Gipps, P.G. A model for the structure of lane-changing decisions. Transp. Res. Part B Methodol. 1986, 20, 403–414. [Google Scholar] [CrossRef]
  52. Federal Highway Administration (FHWA). Traffic Analysis Toolbox Volume III: Guidelines for Applying Traffic Microsimulation Modeling Software Publication No FHWA-HRT-04-040; U.S. Department of Transportation: Washington, DC, USA, 2004. [Google Scholar]
  53. Transport for London (TfL). Traffic Modelling Guidelines: Version 4.0; Boice, R., Radia, D., Biggs, J., Finnie, A., Eds.; TfL Traffic Manager and Network Performance Best Practice; Transport for London: London, UK, 2021. [Google Scholar]
  54. Duraku, R.; Atanasova, V. Traffic Synthetic Model Development and Calibration in Anamorava Region. Mach. Technol. Mater. 2019, 13, 173–177. [Google Scholar]
  55. Costescu, D.; Roşca, M.; Burciu, S.; Ruscă, F. On accident prediction functions for urban road intersections. UPB Sci. Bull. Ser. D Mech. Eng. 2016, 78, 55–64. [Google Scholar]
  56. Körber, M.; Gold, C.; Lechner, D.; Bengler, K. The influence of age on the take-over of vehicle control in highly automated driving. Transp. Res. Part F Traffic Psychol. Behav. 2018, 50, 55–68. [Google Scholar] [CrossRef]
  57. Yang, X.; Rakha, H.A.; Ala, M. Modeling driver reaction time to the traffic signal change using queue discharge observations. J. Adv. Transp. 2015, 49, 795–814. [Google Scholar] [CrossRef]
  58. Department for Transport. TAG Unit M3.1—Highway Assignment Modelling. In Transport Analysis Guidance; Department for Transport: London, UK, 2024. Available online: https://assets.publishing.service.gov.uk/media/67ed0e54e9c76fa33048c634/tag-m3-1-highway-assignment-modelling.pdf (accessed on 12 August 2025).
  59. Varotto, S.F.; Mons, C.; Hogema, J.H.; Christoph, M.; van Nes, N.; Martens, M.H. Do adaptive cruise control and lane keeping systems make the longitudinal vehicle control safer? Insights into speeding and time gaps shorter than one second from a naturalistic driving study with SAE Level 2 automation. Transp. Res. Part C Emerg. Technol. 2022, 141, 103756. [Google Scholar] [CrossRef]
  60. Lioris, J.; Pedarsani, R.; Tascikaraoglu, F.Y.; Varaiya, P. Platoons of connected vehicles can double throughput in urban roads. Transp. Res. Part C Emerg. Technol. 2015, 77, 292–305. [Google Scholar] [CrossRef]
Figure 1. General methodology of the study.
Systems 13 00751 g001
Figure 2. Splaiul Independenței × Bd. Doina Cornea × Orhideelor Street intersection: position and geometry.
Systems 13 00751 g002
Figure 3. Traffic signal numbering plan and inductive loop coding.
Systems 13 00751 g003
Figure 4. Traffic signal phasing and green time durations at the studied intersection.
Systems 13 00751 g004
Figure 5. Green light phases corresponding to (a) Signal 1; (b) Signal 2; (c) Signal 3; (d) Signal 4.
Systems 13 00751 g005
Figure 6. Observed vs. simulated traffic volumes.
Systems 13 00751 g006
Figure 7. Variation in delay time and mean queue in the base scenario under different AV-ACC penetration rates.
Systems 13 00751 g007
Figure 8. Variation in average speed and traffic flow in the base scenario under different AV-ACC penetration rates.
Systems 13 00751 g008
Figure 9. Mean flow ± SD over time (RV—orange line, AV-ACC—blue line).
Systems 13 00751 g009
Figure 10. Variation in delay time and mean queue in the growth scenario under different AV-ACC penetration rates.
Systems 13 00751 g010
Figure 11. Variation in average speed and traffic flow in the growth scenario under different AV-ACC penetration rates.
Systems 13 00751 g011
Table 1. Key behavioral parameters in AIMSUN: definitions and functional influence.
ParameterDefinitionInfluences
LengthVehicle lengthEffective vehicle length in Car following
Max. Desired SpeedMinimum between the vehicle’s assigned maximum speed and the product of its speed acceptance factor and the legal speed limit of the road segmentCar following, lane changing, travel time, queue discharge
Speed AcceptanceDegree of acceptance of the speed limitsCar following, travel time, queue discharge
Max. AccelerationThe highest value that the vehicle can achieve under any circumstancesCar following, lane changing, travel time, queue discharge
Normal DecelerationThe maximum deceleration that the vehicle can use under normal conditionsCar following, lane changing, travel time, queue discharge
Maximum DecelerationThe most severe braking can be applied under special circumstancesLane changing, travel time, queue discharge
Headway AggressivenessAllows vehicles to enter shorter gaps without forcing the rear vehicle to brake, followed by a relaxation process to gradually recover the stabilityCar following, lane changing, travel time, queue discharge
ClearenceDistance that vehicle keeps with the preceding one when stoppedEffective vehicle length in car following, capacity, queue length
Maximum give-way timeTime after which the vehicle becomes more aggressive in yield situationLane changing, gap acceptance
Sensitivity FactorHow much the vehicle could be sensitive to the deceleration of the leaderDeceleration component of car following
Imprudent lane changing casesDefines whether a vehicle will still change
lane after assessing an unsafe gap
Lane changing, overtaking
Maximum Speed DifferenceHighest speed difference allowed between a vehicle and another in the target lane for a safe lane change to occur.Two-lane car following model
Reaction TimeDelay of a moving vehicle in responding to speed or acceleration changes in the preceding vehicleAll internal models, sections and on-ramp capacities
Reaction Time at StopTime it takes for a stationary vehicle to begin moving once the vehicle in front starts accelerating.All internal models, stop and go capacity
Reaction time at traffic lightDelay between the green phase initiation and the moment when the first vehicle in the queue begins to move.All internal models
Queue up speedMaximum speed below which a vehicle is considered to be in a queueQueue measures
Queue leaving speedMinimum speed at which a vehicle is considered to have exited a queue after being stopped.Queue measures
Table 2. Input traffic flows by road segment and turn direction at the studied intersection.
Road SegmentTurn DirectionToward%Vehicles/hTotal Vehicles/h
Splaiul Independenței (West)Rightto Bd. Doina Cornea6%62
Straightto Splaiul Independenței (East)57%648
Leftto Orhideelor Street37%4171127
Orhideelor Street (North)Rightto Splaiul Independenței (West)36%267
Straightto Bd. Doina Cornea31%231
Leftto Splaiul Independenței (East)34%252750
Splaiul Independenței (East)Rightto Orhideelor Street21%185
Straightto Splaiul Independenței (West)60%535
Leftto Bd. Doina Cornea19%172892
Bd. Doina Cornea (South)Rightto Splaiul Independenței (East)9%77
Straightto Orhideelor Street71%585
Leftto Splaiul Independenței (West)19%159821
Table 3. Input parameters for RV simulation.
Vehicle AttributesValues Mean ± SD [Min, Max]
Length (m)4.5± 0.3 [4, 5]
Max. Desired Speed (km/h)50 ± 10 [30, 60]
Speed Acceptance1.1 ± 0.1 [0.9, 1.3]
Max. Acceleration (m/s2)2.5 ± 0.25 [2, 3]
Normal Deceleration (m/s2)3.5 ± 0.25 [3, 4]
Maximum Deceleration (m/s2)6 ± 1 [5, 7]
Headway Aggressiveness0.3 ± 0.1 [0.1, 0.5]
Clearence1 ± 0.3 [0.9, 1.3]
Maximum give-way time (s)10 ± 2.5 [5, 15]
Sensitivity Factor1 ± 0.05 [0.9, 1.2]
Imprudent lane changing casesYes
Maximum Speed Difference (km/h)40
C1C2C3C4
Reaction Time (s)1110.8
Reaction Time at Stop (s)1.21.21.51.2
Reaction time at traffic light (s)1.8221.8
Queue up speed (m/s)1.10
Queue leaving speed (m/s)3.70
Table 4. GEH Statistic Values for Input (IN) and Output (OUT) Sections of the Analyzed Area (volumes expressed in veh/h).
Simulation Traffic VolumesObserved Traffic VolumesGEH
AccessC1C2C3C4C1C2C3C4
W-IN902910869107511277.066.808.171.57
N-IN7517517517517500.040.040.040.04
E-IN6966716847668926.967.917.414.38
S-IN8188188188188210.100.100.100.10
W-OUT8488348338899884.625.105.143.23
N-OUT104010351035112212716.806.956.954.31
E-OUT8518578229359834.364.155.361.55
S-OUT4074034024274652.782.983.031.80
Table 5. Validation results based on GEH statistic for traffic volumes (expressed in veh/h).
AccessSimulation Traffic VolumesObserved Traffic VolumesGEH
W-IN101411644.54
N-IN7257210.15
E-IN7748101.28
S-IN8148160.07
W-OUT8468811.19
N-OUT108810072.50
E-OUT8389824.77
S-OUT5175591.81
Table 6. Input parameters for partially automated vehicles simulation.
ParameterValues Mean ± SD [Min, Max]
Length (m)4.5 ± 0.3 [4, 5]
Max. Desired Speed (km/h)54 ± 5 [50, 58]
Speed Acceptance1 ± 0 [1, 1]
Max. Acceleration (m/s2)2.5 ± 0.25 [2, 3]
Normal Deceleration (m/s2)3.25 ± 0.25 [3, 3.5]
Maximum Deceleration (m/s2)5.2 ± 0.5 [4.5, 6]
Headway Aggressiveness0.05 ± 0.05 [0, 0.1]
Clearence1 ± 0 [1, 1]
Maximum give-way time (s)10 ± 2.5 [5, 15]
Sensitivity Factor1 ± 0.05 [0.9, 1.1]
Imprudent lane changing casesNo
Maximum Speed Difference (km/h)30
Reaction Time (s)0.7
Reaction Time at Stop (s)1
Reaction time at traffic light (s)0.9
Queue up speed (m/s)1.00
Queue leaving speed (m/s)3.50
Disclaimer/Publisher’s Note: The statements, opinions and data contained in all publications are solely those of the individual author(s) and contributor(s) and not of MDPI and/or the editor(s). MDPI and/or the editor(s) disclaim responsibility for any injury to people or property resulting from any ideas, methods, instructions or products referred to in the content.