3.1. e-PRL Statistical Breakdown
3.1.1. SOP Step Type Distribution
The analysis revealed substantial differences in the distribution of SOP step types across domains, as shown in
Table 2 and
Figure 2.
While Action-Only steps predominated across all domains (70–80%), their prevalence increased as operator selectivity decreased. Aviation SOPs contained the highest proportion of steps with explicit decision points (18% total), including 4% with complex Decision–Action with Waiting and Verification structures. In contrast, HAL procedures contained no explicit decision steps, despite the highly selective operator population. Autonomous vehicle SOPs had minimal decision steps (4%) despite addressing safety-critical scenarios.
The complete absence of decision steps in HAL procedures was particularly notable given the complex environment and highly trained operators. Further analysis revealed that decisions were typically embedded within action descriptions rather than explicitly delineated, suggesting a domain-specific procedural style rather than an absence of decision-making.
3.1.2. SOP Content Analysis
Table 3 presents the analysis of explicit vs. implicit content in SOP steps across domains.
This analysis revealed several domain-specific patterns: (1) actor specifications, (2) triggering information, (3) input device specifications, (4) verification requirements, and (5) decision information.
Aviation decision steps frequently specified actors (79%), while HAL procedures never identified actors explicitly. This difference reflects aviation’s crew coordination needs versus HAL’s single-operator environment. Additionally, aviation SOPs consistently specified triggering conditions (55–83%), while HAL SOPs rarely did so (1–3%). Autonomous vehicle SOPs showed high trigger specification (70–100%), crucial for time-critical interventions.
Aviation SOPs frequently specified input devices (81–100%), while HAL SOPs rarely did so (1–9%). This suggests greater reliance on operator system knowledge in HAL operations. Additionally, among steps with waiting requirements, aviation SOPs more consistently included verification (71–76%) compared to HAL SOPs (24–76%). Autonomous vehicle SOPs showed high verification specification (75%) but applied to a limited number of steps. While aviation procedures contained explicit decision steps (18% of the total), they rarely specified where to find decision-critical information (0%) or how to interpret it (0%). The single decision step in autonomous vehicle procedures, by contrast, included explicit information on how to make the decision (100%).
These findings demonstrate significant cross-domain variation in the explicitness of procedural content, suggesting different assumptions about operator knowledge and training.
3.1.3. SOP Step Recall Score
The SOP Step Recall Score quantifies memory demands by measuring the percentage of implicit system-description knowledge required.
Figure 3 shows the distribution of recall scores by domain and step type.
Aviation procedures demonstrated moderate recall demands (average 46%, σ = 17%), with significant variation across procedures (range: 25–81%). HAL procedures showed consistently high recall demands (average 71%, σ = 15%), despite being operated by the most selective personnel. Autonomous vehicle procedures presented moderate but variable recall demands (average 44%, σ = 21%).
Table 4 presents the average recall score by SOP and domain.
This analysis revealed that the highest recall scores were in the HAL domain, with HAL 3.1 series procedures imposing extreme memory demands (88–96%). Additionally, there were significant variations within domains, with some procedures requiring nearly four times the recall demands of others (25% vs. 96%). Counterintuitively, some of the most critical autonomous vehicle procedures (Forward Collision Warning and Blind Spot Collision) had relatively low recall demands (25–27%), while non-emergency procedures like Intersection Turn Takeover had much higher demands (80%).
Across all domains, high recall scores were associated with implicit information about where to find relevant data (Trigger Where and Decide Where) and how to manipulate controls (Action How). The pattern suggests that procedures often assume operators know the physical layout of displays and controls without explicit instruction.
3.1.4. Training Requirements
Using the adapted Matessa and Polson model [
15], the training requirements were estimated for each procedure.
Table 5 presents these estimates.
While autonomous vehicle procedures contained fewer steps (4–5), the HAL procedures contained substantially more (10–103). However, when adjusted for recall demands, the step complexity increased across all domains. Also, HAL procedures required the longest training periods (8.5–13.1 days), followed by aviation (9.4–10.4 days), with autonomous vehicle procedures requiring the shortest (5.3–6.9 days). The total repetitions required ranged from 9 (autonomous vehicle) to 316 (HAL), representing a 35-fold difference in practice requirements.
The relationship between procedure length, recall demands, and training requirements was not strictly linear. For example, the HAL 5.111 procedure with 103 steps required 316 repetitions (3.1 per step), while the HAL 3.1 procedure with only 17 steps required 76 repetitions (4.5 per step), indicating that step complexity can be more significant than step quantity.
3.2. Identified Vulnerabilities from Statistical Analysis
The e-PRL statistical breakdown revealed four primary vulnerability patterns across domains:
3.2.1. Structural Completeness Gaps
The largest quantitative domain difference was in SOP structure formality, reflected in overall completeness scores: autonomous vehicle procedures showed the highest average explicit content specification (60.1%), followed by aviation (55.5%), and HAL procedures showing the lowest completeness (32.3%). However, domains exhibited distinct structural emphases—aviation SOPs consistently identified actors in 79% of decision steps and included decision points in 18% of all steps, HAL SOPs rarely specified actors (0%) but emphasized verification elements (42–76% specification rates), and autonomous vehicle SOPs showed variable context specification.
3.2.2. Verification Requirement Gaps
Analysis of steps with waiting requirements revealed systematic omission of verification steps: 70% of aviation waiting steps, 58% of HAL waiting steps, and 25% of autonomous vehicle waiting steps lacked explicit verification requirements. This pattern creates vulnerability to timing-related errors regardless of operator training level.
3.2.3. Memory Burden Distribution
Memory demands showed counterintuitive patterns across domains. HAL procedures imposed the highest memory burdens (71% average recall score) despite having the most selective operators, while domains with less selective operators showed more moderate demands (aviation: 46%; autonomous vehicles: 44%). Individual procedures ranged from 25% to 96% recall requirements.
3.2.4. Cue Specification Inconsistencies
Critical triggering information showed substantial variation in specification rates. Aviation procedures specified triggering conditions in 55–83% of steps and HAL procedures in only 1–3% of steps, while autonomous vehicle procedures specified triggers in 70–100% of steps. Similarly, trigger source specification (where to look for cues) varied dramatically across domains.
3.3. Simulation Results Demonstrating Vulnerability Impact
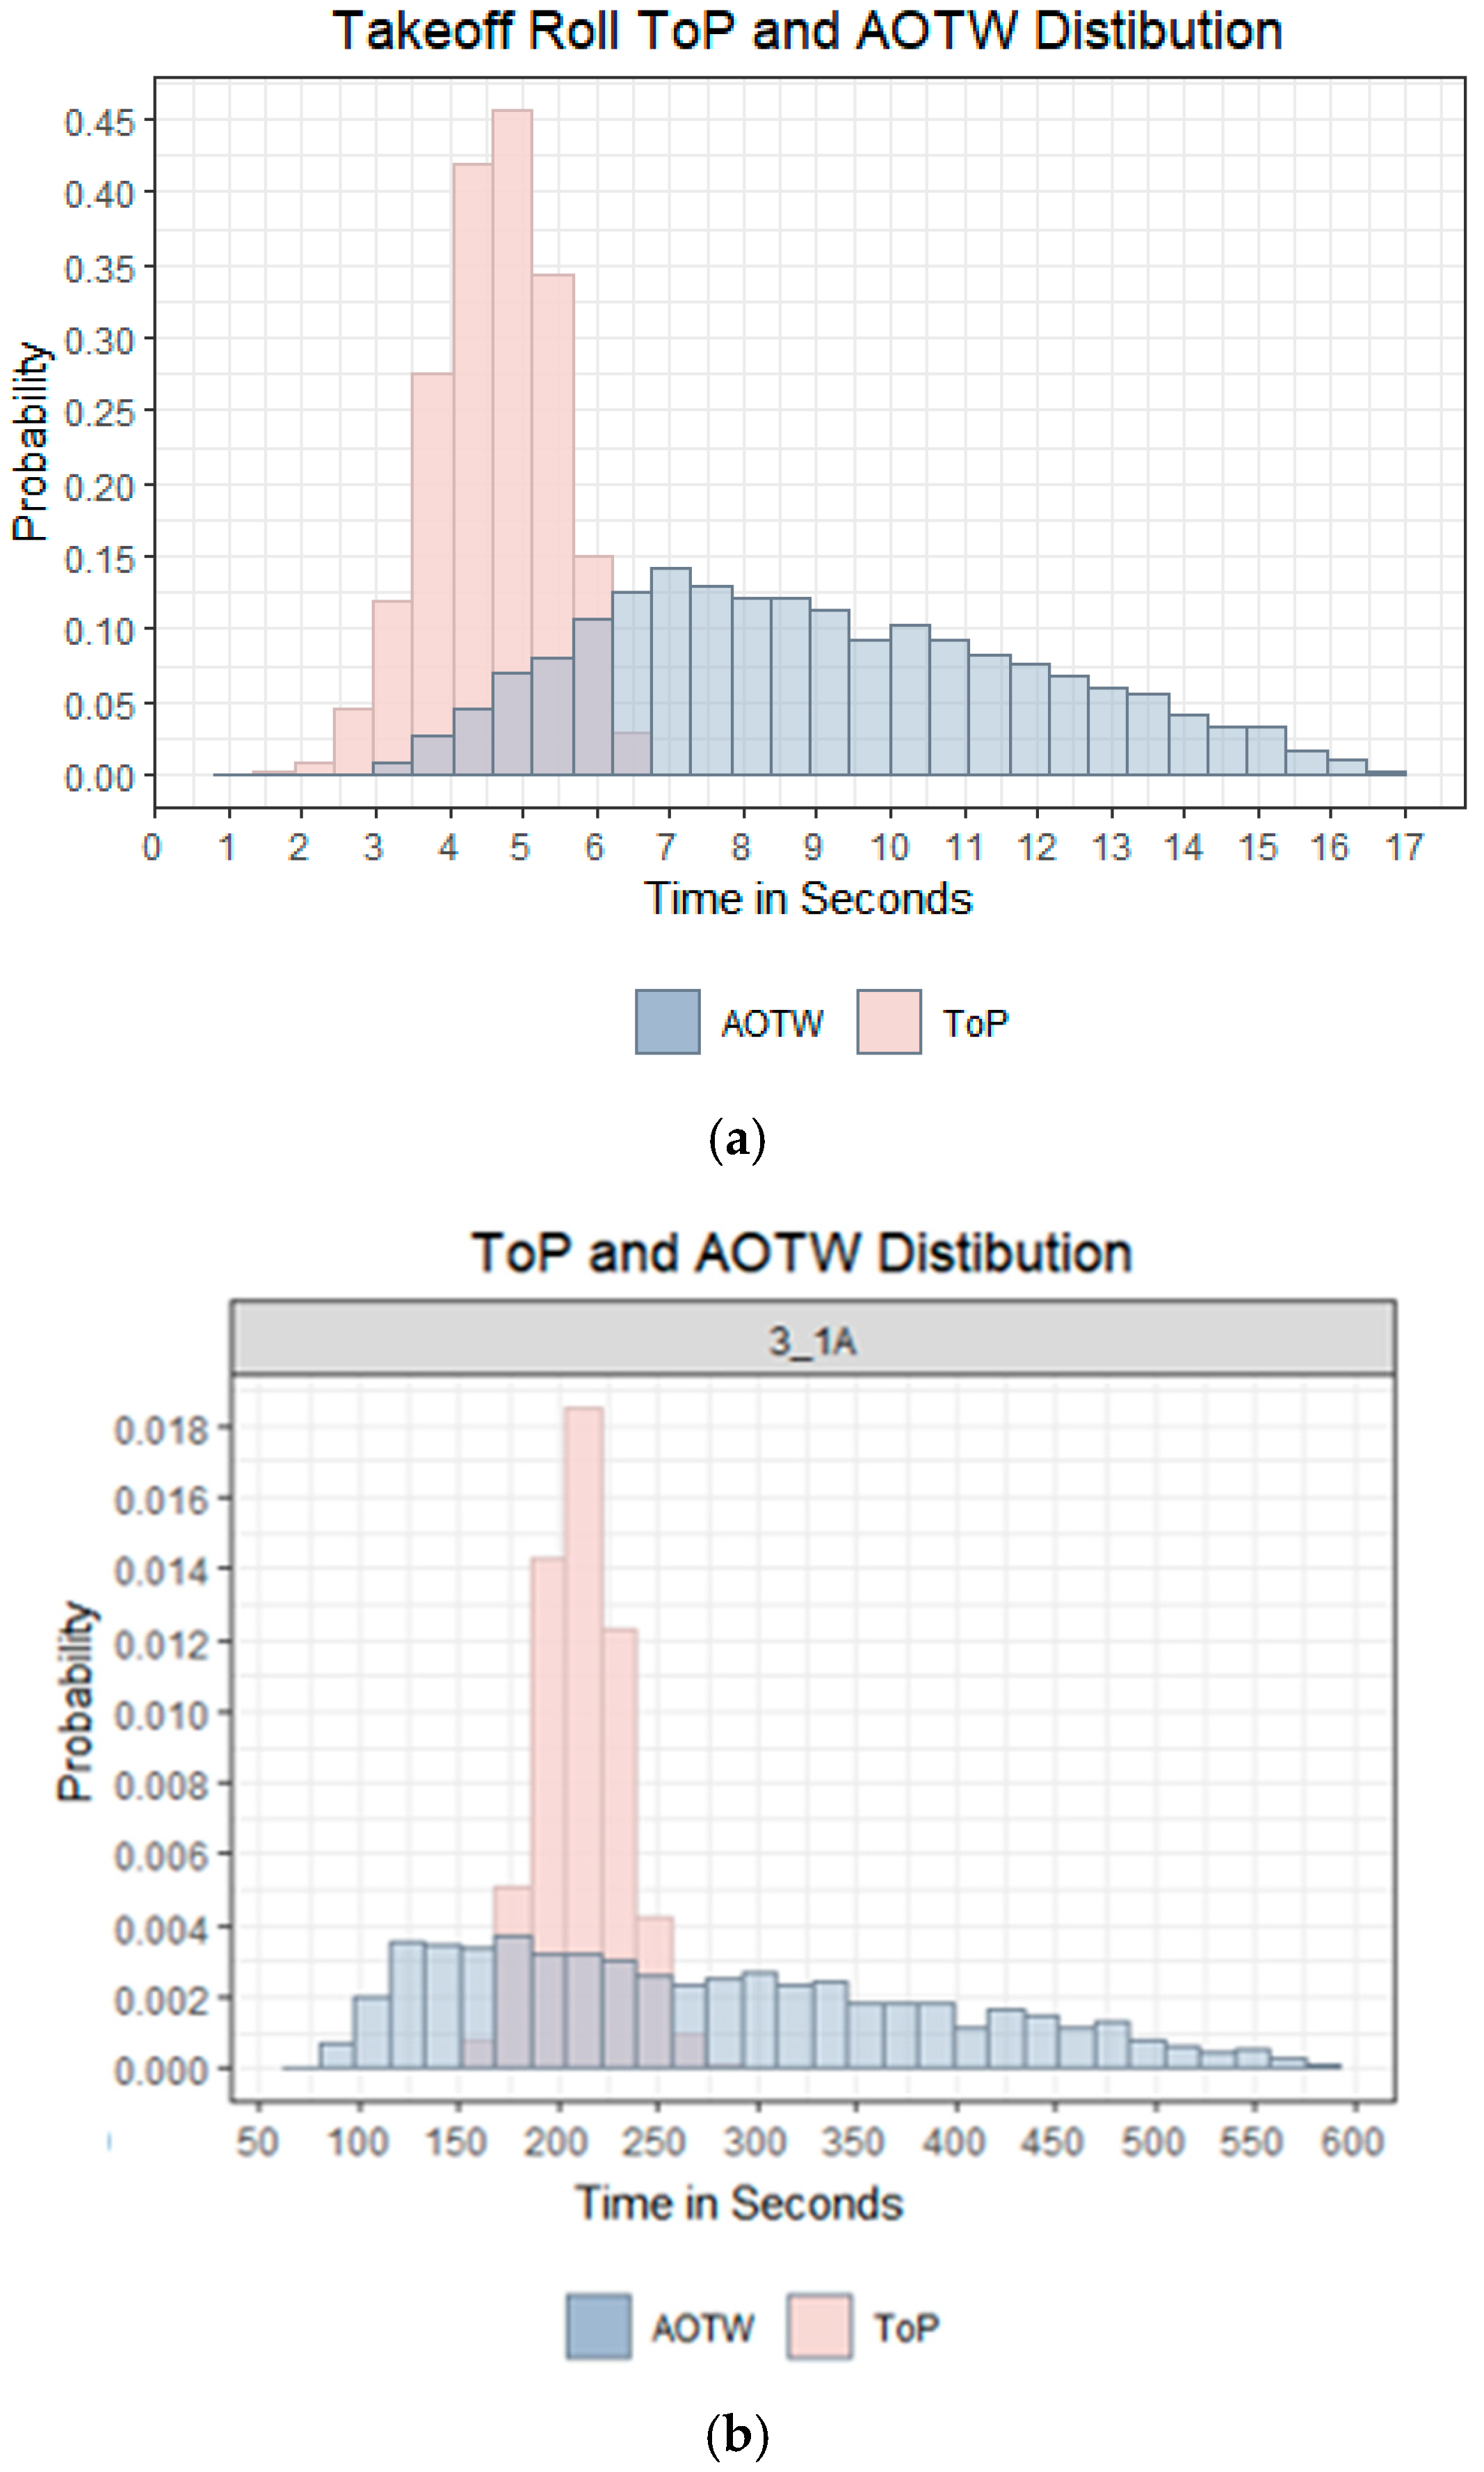
Monte Carlo simulations comparing Time on Procedure (ToP) against the Allowable Operational Time Window (AOTW) demonstrated how the identified statistical vulnerabilities translate into operational failure rates.
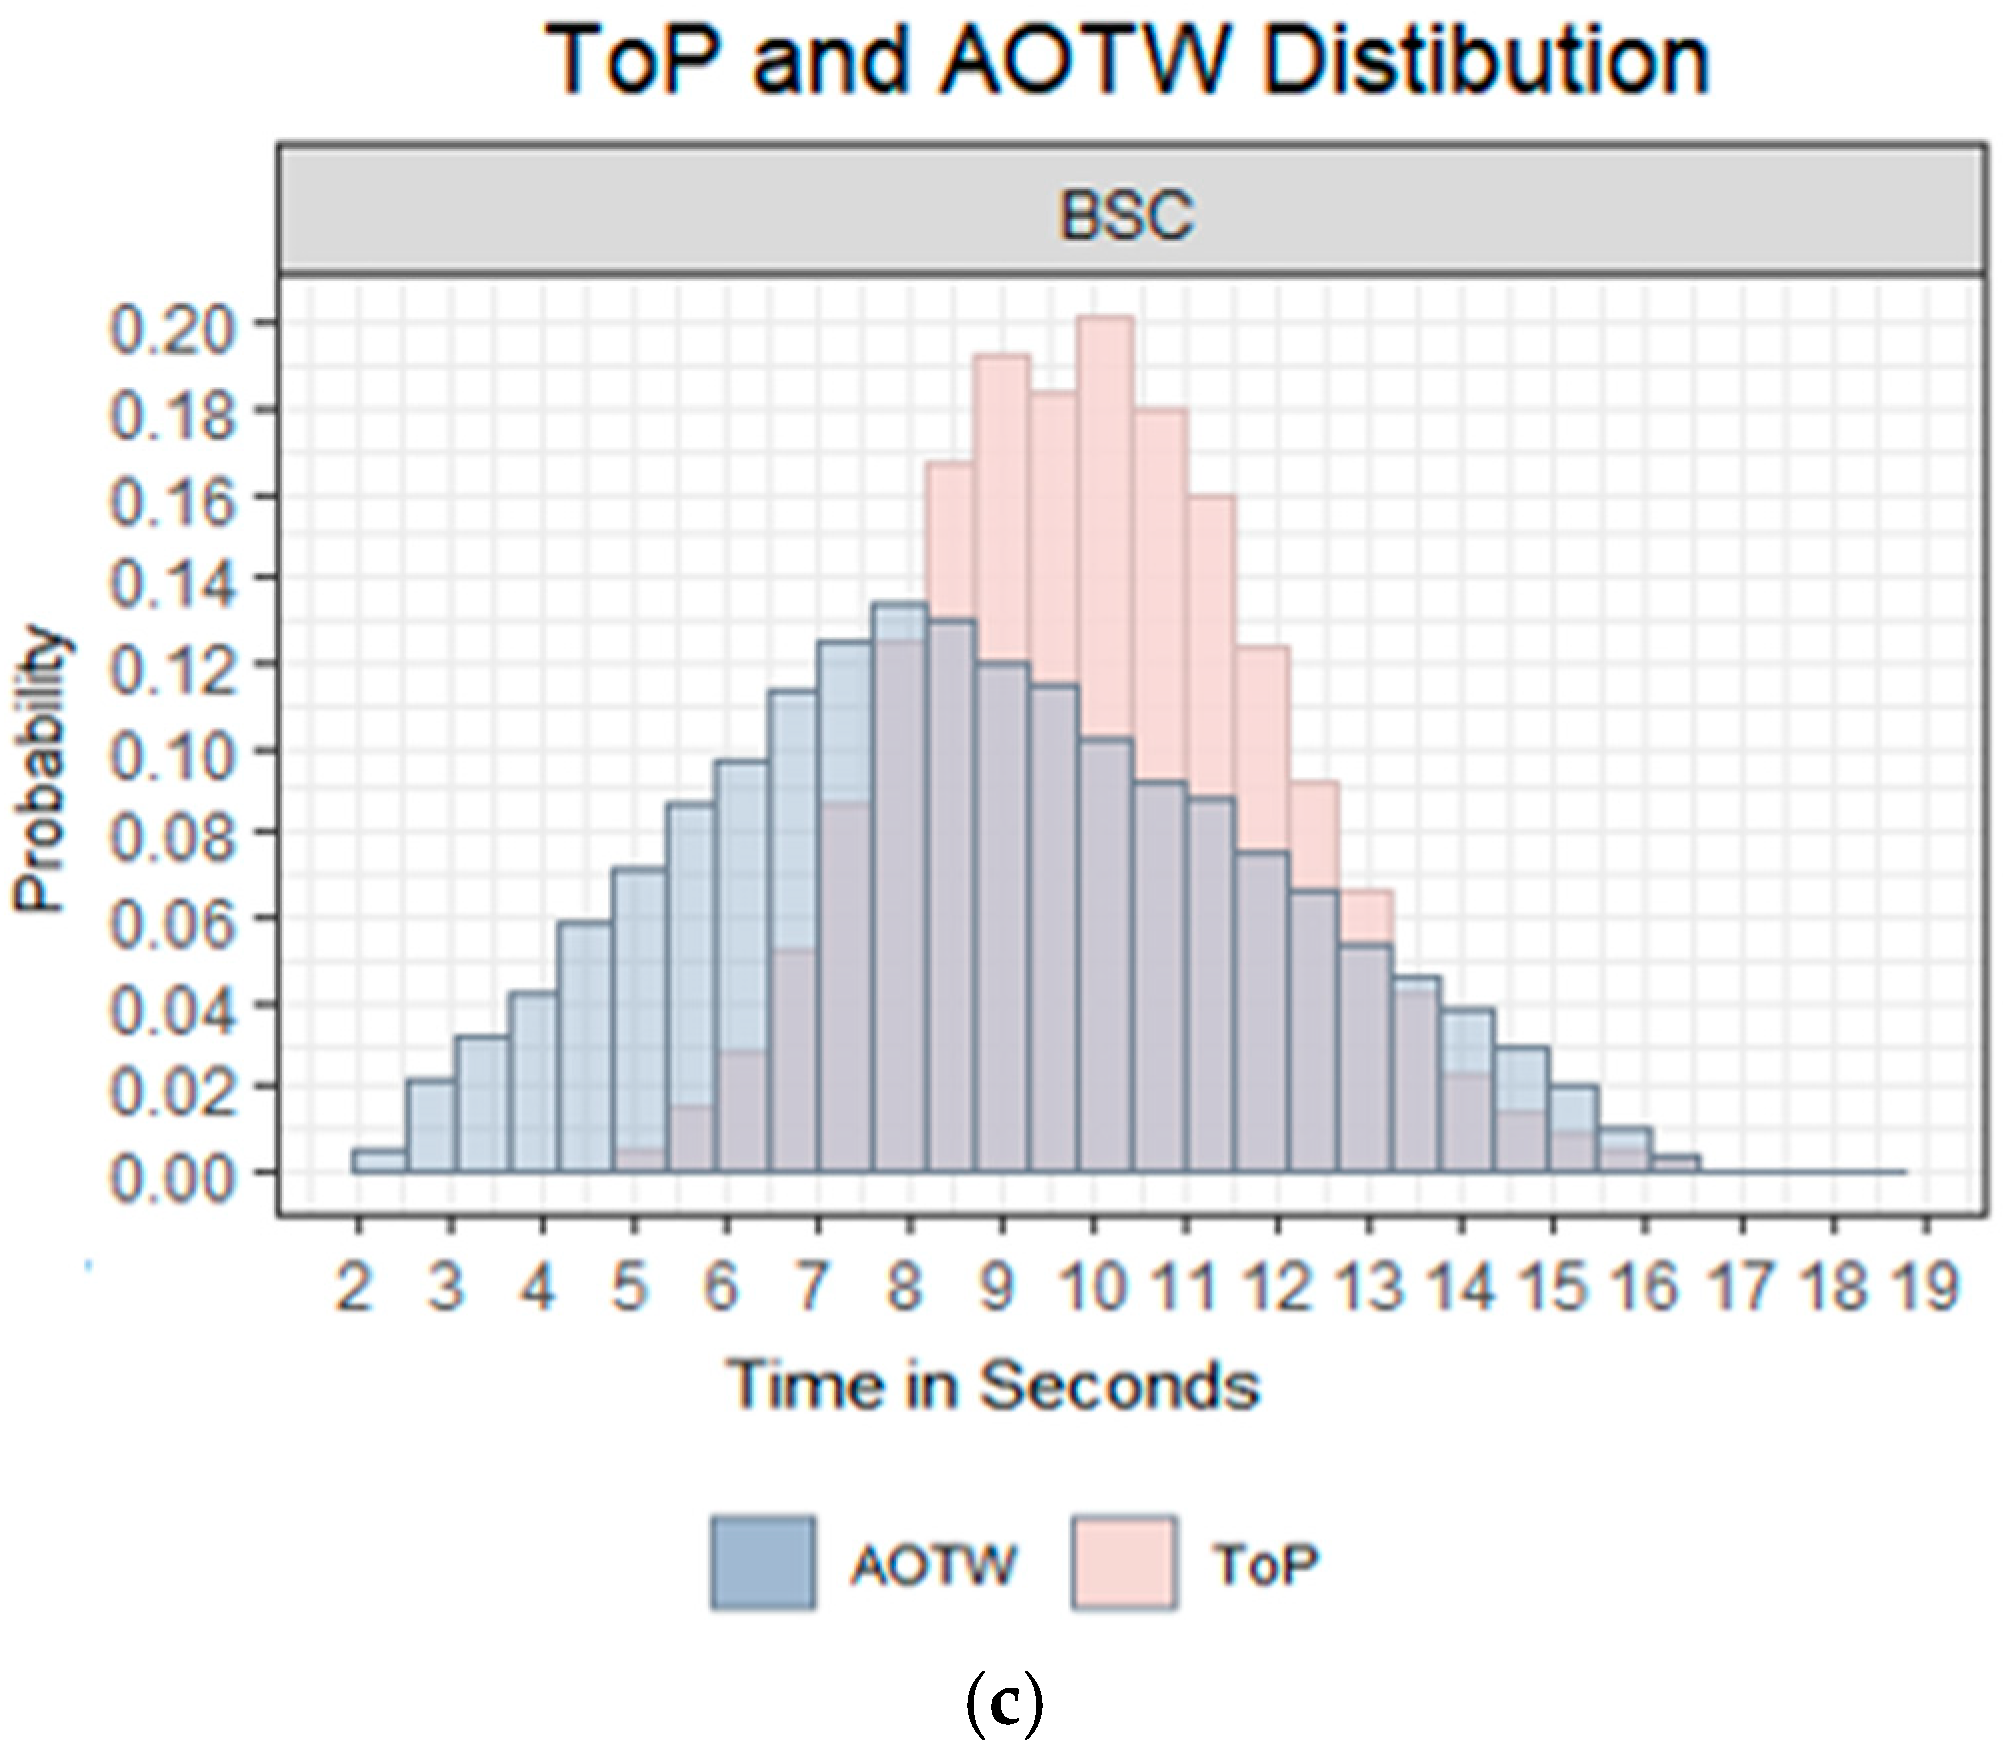
Figure 4 shows representative ToP vs. AOTW distributions for each domain. Aviation procedures (
Figure 4a) demonstrated minimal overlap with wide safety margins. While HAL procedures (
Figure 4b) and autonomous vehicle procedures (
Figure 4c) exhibited substantial overlap, indicating high failure risk.
3.3.1. Probability of Failure to Complete Results
Table 6 presents the simulation results across domains, showing the direct relationship between the identified vulnerabilities and procedure performance.
3.3.2. Domain-Level Performance Patterns
Aviation procedures showed the lowest failure rates (5.72%), whereas HAL procedures exhibited consistently high PFtC rates (31–45%), and autonomous vehicle procedures showed extreme variability (2.69–63.47%). Procedures relying on unambiguous cues (Lane Departure; Autosteer Disable) had significantly lower failure rates than those using ambiguous cues (Blind Spot Collision; Forward Collision).
For aviation procedures, the AOTW distribution was consistently wider than the ToP distribution, providing a margin for variation in execution time. For HAL and autonomous vehicle procedures, the distributions showed substantial overlap, indicating minimal safety margin.
3.3.3. Cue Type Analysis and Failure Correlation
Further analysis of individual steps within the problematic procedures identified specific cue types associated with high failure probabilities.
Table 7 shows the distribution of cue types across domains.
This analysis highlights that autonomous vehicle procedures relied heavily on ambiguous cues (48%), while aviation procedures predominantly used unambiguous cues (67%). HAL procedures showed a concerning reliance on memory-based execution (22% No Cue), consistent with their high recall scores.
3.3.4. Vulnerability–Performance Correlation
The simulation results demonstrate clear correlations between identified statistical vulnerabilities and operational performance. The 48% reliance on ambiguous cues in autonomous vehicle procedures directly correlates with their extreme performance variability, ranging from 2.69% to 63.47% PFtC across different procedures. This wide range demonstrates that cue quality fundamentally determines procedure reliability, with well-designed cues enabling near-perfect performance, while ambiguous cues result in frequent failures.
HAL procedures’ 22% reliance on memory-based execution aligns with their consistently high failure rates of 31–45% across all simulated procedures. Despite having the most selective operators with extensive training, the heavy memory demands create systematic vulnerabilities that manifest as elevated failure probabilities. This finding challenges assumptions about the relationship between operator capability and procedure design requirements.
Aviation’s 67% use of unambiguous cues and wider AOTW distributions result in the most reliable performance, with only 5.72% PFtC. The combination of clear perceptual triggers and adequate time margins creates robust operational conditions that accommodate normal variations in human performance. This design approach demonstrates how proper cue specification can compensate for moderate memory demands and provide reliable procedure execution across varying operational conditions.


