Article

Parallel Export and Differentiated Production in the Supply Chain of New Energy Vehicles

School of Management Science and Engineering, Anhui University of Technology, Maanshan 243032, China
*
Author to whom correspondence should be addressed.
Systems 2025, 13(8), 662; https://doi.org/10.3390/systems13080662
Submission received: 27 June 2025 / Revised: 30 July 2025 / Accepted: 1 August 2025 / Published: 5 August 2025
(This article belongs to the Section Supply Chain Management)

Abstract

Considering the supply chain of new energy vehicles composed of a local manufacturer, an authorized distributor in the domestic market, and a competitive manufacturer in the export market, this paper studies three different cases of parallel export as well as their decisions about prices, sales scale, and the degree of production differentiation. Three game models are constructed and solved under the cases of no parallel exports (CN), authorized distributors’ parallel exports (CR), and third-party parallel exports (CT), respectively, and the equilibrium analysis is carried out, and finally, the influence of relevant parameters is explored through numerical simulation. It is found that (1) the manufacturer’s decisions on production and sales are influenced by the characteristics of consumer preferences in local and export markets, the cost of differentiated production, and the consumer recognition of parallel exports; (2) the manufacturers’ profits will always be damaged by parallel exports; (3) differentiated production can reduce the negative impact of parallel exports under certain conditions, and then improve the profits of manufacturers; (4) manufacturers can increase their profits by improving the purchase intention of consumers in the local market, improve the level of production differentiation in the export market, or reducing the cost of differentiation.

1. Introduction

Parallel export of new energy vehicles refers to the export of new energy vehicles to other countries or regions without the right holder’s authorization. For countries and regions that receive such products, the unauthorized distribution of branded products through non-approved channels should be called parallel importation. On 14 November 2024, China’s annual production of new energy vehicles exceeded 10 million for the first time, making it the first country globally to reach an annual output of 10 million new energy vehicles. This achievement is closely related to the Chinese government’s strong industrial support policies implemented in stages to nurture emerging industries and achieve specific strategic goals (e.g., technological breakthroughs, market share gains, and industrial upgrades), which are usually invested in the early stages of industry development with subsidies designed to quickly create a competitive advantage. As a result, China’s new energy vehicles have been able to achieve more competitive end prices while maintaining a high level of equipment. However, such industry support policies are characterized by a clear phase-in period. As industry development goals are gradually reached (e.g., large-scale production, technological maturity, and market dominance), and as financial burdens and pressure from international trade rules increase, the intensity of subsidy policies is usually expected to be gradually phased out or even eventually withdrawn. As the industry support policy enters the adjustment period, the competition in the domestic market tends to be fierce; at the same time, due to the high configuration and low price of new energy vehicles in China, which have certain advantages in the international market, many automobile practitioners buy new vehicles from the Chinese market and export them to overseas markets in the name of second-hand parallel export vehicles. In 2021, China’s second-hand car exports exceeded 10,000 for the first time, reaching 15,000. In 2023, the parallel export scale of “used cars” reached 275,000 and accounted for about 5% of the 5 million exported cars. These cars are mainly sold in parts of Africa and the Middle East.
Because of the elimination of many intermediate links, this type of new energy parallel export automobile will have an obvious price advantage in the parallel import market. Of course, the most important thing is that these cars receive special preference from local consumers due to their excellent performance. Therefore, these second-hand car dealers (perhaps authorized distributors, or third-party sellers) can obtain rich profits from the price difference and export tax rebate. And the future scale of this market is likely to be quite optimistic because, according to statistics, the annual sales volume of used cars in Japan is more than 1 million, and that in South Korea is more than 400,000.
But, for manufacturers, such unauthorized parallel export vehicles not only have the potential to disrupt their original export plans and pricing system, but also have the potential to affect profitability. To prevent the parallel export of new energy vehicles from harming their interests, some manufacturers are trying operational measures. A common and effective practice is to deny warranty services for new energy parallel export vehicles, which significantly reduces the attractiveness of parallel export vehicles to consumers and increases the risk of their use. In addition, manufacturers may further dampen demand by making the maintenance and repair of parallel export vehicles prohibitively complex or expensive in unauthorized channels through technological or licensing means (e.g., by restricting access to diagnostic software, increasing the price of original parts). At the same time, a more fundamental strategy is to implement product differentiation, i.e., to customize the production of vehicles according to regulations, infrastructure, and consumer preferences (e.g., charging standards, software features, interior configurations, and range) in different target markets. This increases the difficulty for parallel exporters to arbitrage between markets. More importantly, this regional product differentiation allows manufacturers to impose stricter warranty restrictions. For example, when key vehicle components or systems (e.g., battery management systems, in-vehicle infotainment systems, charging modules) are differentially customized, it is often difficult for parallel exporters to obtain the appropriate technical support, diagnostic tools, and genuine parts, leading to difficulties in obtaining reliable warranty services for parallel-exported vehicles, which further magnifies the risks associated with the lack of warranty and significantly reduces its attractiveness to consumers. Therefore, considering the different policies and travel habits of various countries, manufacturers can choose to set up factories overseas, opt to differentiate the production of vehicles sold abroad, and produce new energy vehicles tailored to overseas consumers. For example, Great Wall Motors and BYD have acquired the Mercedes-Benz and Ford plants in the states of São Paulo and Bahia, respectively. BYD announced an investment of approximately BRL 3 billion (USD 560 million) to transform the former Ford plant into a factory that will produce up to 300,000 hybrid and electric vehicles per year starting in 2025, while Great Wall Motor’s newly acquired plant is expected to produce up to 100,000 vehicles annually. With the development of parallel exports of new energy vehicles, how new energy vehicle manufacturers and automotive practitioners make decisions is a question worth studying.
This paper focuses on the supply chain decision optimization problem triggered by the parallel export of new energy vehicles, focusing on the following core issues: (1) how manufacturers formulate the optimal strategies for domestic and international market sales price and product differentiation for parallel export and export volume under the three modes of no parallel exports (CN), parallel exports by authorized distributors (CR), and parallel exports by a third party (CT); (2) the deeper impact of parallel exports on the profit pattern of the new energy vehicle supply chain; (3) the moderating role of product differentiation strategy in mitigating the loss of benefits from parallel export. By constructing a hybrid analytical framework of a Stackelberg game and an asymmetric Nash game, this study will reveal the equilibrium decision-making conditions under different parallel export scenarios and provide a theoretical basis for the internationalization strategy of new energy automobile enterprises.
This paper has important theoretical innovation value and practical guidance significance. At the theoretical level, differentiated production levels are innovatively introduced as a key decision variable, providing a new theoretical perspective for the study of parallel export of new energy vehicles. At the practical level, the impact of parallel export on the supply chain of new energy vehicles is revealed by comparing the optimal pricing, differentiation strategies, and export decisions of manufacturers under different circumstances, which provides a basis for enterprises’ formulation of production differentiation strategies and has an important reference value for standardizing the order of the export market of new energy vehicles and promoting the healthy development of the industry. Compared with the existing literature, the innovation of this paper is that it is the first time that authorized distributors and third-party parallel exports are simultaneously included in the analytical framework, and the key decision-making variable of product production differentiation is introduced, which provides a new research perspective on the issue of parallel exports of new energy vehicles. The research results not only expand the application of parallel export theory in the field of new energy vehicles, but also provide practical solutions allowing enterprises to deal with the challenges of parallel export.
The remainder of this paper is organized as follows: Section 2 summarizes the existing related research and points out the innovation of this paper; Section 3 describes the structures of the supply chain and the relevant assumptions of problem; Section 4 establishes and solves the three models; Section 5 analyzes the optimal results and the impacts of important parameters; Section 6 presents further analysis using numerical simulation; and Section 7 gives the conclusions of the article and the management science recommendations.

2. Literature Review

In recent years, research on supply chain operations and electric vehicles has been of high concern for some scholars. Firstly, some scholars researched parallel imports from different speculative subjects. Zhang [1] investigated the consumer rebate problem by constructing a two-stage Stackelberg game and found that consumer rebates have a deterrent effect and that consumer rebates can effectively combat parallel imports. Ding et al. [2] found that IoT technology has a dampening effect on the parallel import market when parallel imports are carried out by authorized distributors. Cao and Zhang [3] found that when authorized distributors conduct parallel importing practices, manufacturers can manage parallel imports by controlling product quality to maximize profits. Jiang et al. [4] investigated the effect of whether or not authorized distributors disclose demand information on supply chain decisions in the context of speculation by authorized distributors. Iravani et al. [5] found that a small number of services can greatly increase manufacturer profits. Taleizadeh et al. [6] proposed warranty as a strategy for manufacturers to deal with the challenge of parallel imports under the power structure of Nash. The results of the study show that warranty can act as a disincentive to parallel importation and, at the same time, bring some benefits to the manufacturer. Li et al. [7] studied the effect of two different power structures, Stackelberg and Nash games, on manufacturers and parallel importers, and after the study, it was found that manufacturers are better off under Stackelberg, while parallel importers are worse off. Through their study, Huang et al. [8] found that sales strategies can reduce the negative effects of the gray market. Ding et al. [9] used a game-theoretic model to examine the interaction between a manufacturer’s decision to adopt RFID and a third party’s marketing decision to adopt parallel import, and examined the effect of competitive intensity on firms’ profits and decisions. Tsunoda [10] found that in the context of the existence of third-party parallel imports, a profit-maximizing multinational firm should set its prices according to the degree of consumer preference for product quality.
The next stream of the literature closely related to this paper has studied the problems of differentiated production in the supply chain. Wang et al. [11] proposed a differentiated recycling strategy to study and compare the amount and rate of recycling of used products under different regulatory scenarios. Liu et al. [12] proposed a differentiated pricing strategy that examined perishable material sourcing and final product pricing decisions and proposed a differentiated pricing strategy. Chai et al. [13] studied whether a manufacturer that produces two types of products simultaneously chooses to open a direct sales channel to sell its products and how product quality decisions vary with the choice of distribution channel. Stamatopoulos and Tzamos [14] studied different quality designs for different products and showed that sales of quality-differentiated products increase the price of all remaining products. Caravaggio et al. [15] found that although product differentiation can often increase market power and profitability, in this case, it can be a lack of coordination between managers working in each market segment. Zheng et al. [16] studied two quality-differentiated products and analyzed the effect of quality level, endogenous or exogenous, on the optimal pricing decision of the products. Müller [17] considered the use of differential pricing to address the uneven distribution of vehicles across locations in a vehicle sharing system due to uneven demand patterns. Keskin and Birge [18] examined the impact of specifically different quality sensitivities of consumers on firms’ development of quality differentiated products. Tookanlou and Wong [19] considered how manufacturers make decisions about the quality of their products when they are faced with heterogeneity in the values consumers place on product attributes. Lu et al. [20] examined how manufacturers determine the degree of quality differentiation between the highest and lowest quality products when they sell products with quality differences to consumers with product quality sensitivities.
Another type of research closely related to this paper is in-depth research on new energy vehicles. With the acceleration of the global energy reform process, scholars have conducted many studies on the new energy automobile industry. Tang et al. [21], Yan et al. [22], and Zhang et al. [23] analyzed the research and development of new energy vehicles, new energy vehicle supply chain coordination, and decision-making optimization and proposed related optimization and innovation measures. Li et al. [24] designed a revenue-sharing and repurchase contract supply chain and showed that operational costs can be reduced by coordinating supply contracts. Ma et al. [25] discussed a coordination strategy for the supply chain of new energy vehicles considering the alliances between suppliers. Zhao et al. [26] analyzed the impact of different government subsidies on supply chain competitiveness by constructing a model of profit distribution among closed-loop supply chain members without subsidies and with different government subsidy targets. Wang et al. [27] found that government R&D subsidies have a significant impact on the choice of competitive cooperation mode in the new energy vehicle supply chain and that the patent licensing cooperation mode can achieve a “win–win” situation for supply chain members under certain conditions. Zhang et al. [28] found that in a closed-loop supply chain considering government subsidies, R&D investment in the production of power batteries can significantly increase the recycling rate of used batteries, and government subsidies further amplify this effect. Gong et al. [29] established a pricing game model with centralized and decentralized decision-making in a new energy vehicle supply chain to study the impact of changes in the heterogeneity of consumers’ low-carbon preferences on supply chain pricing and members’ profits. Therefore, the existing literature on new energy vehicles mainly focuses on the optimization and coordination of the supply chain of new energy vehicles and government subsidies. Few scholars have conducted research on the issue of parallel export of new energy.
A comparison of the relevant literature is presented in Table 1, which indicates that most of the literature examines parallel imports by a single authorized distributor or third-party speculators, and the majority of the literature lacks a specific area of study.
In conclusion, although there are a significant number of studies analyzing parallel imports and differentiated production separately, there is a marked deficiency in research that concurrently investigates the parallel imports of authorized distributors alongside third-party parallel imports, especially regarding product differentiation strategies. Additionally, most current studies fail to consider the parallel exports of new energy vehicles. Existing literature on parallel imports focuses on the external conditions of the product without considering the product’s own factors, a distinction that needs to be fully taken into account, as it is known that different countries have different policies and travel habits. This study considers the differentiated production of new energy vehicles sold overseas and explores whether differentiated production decisions can be an effective means of managing the parallel import market when both authorized distributors and third parties have incentives to export new energy vehicles in parallel. The contributions of this paper are as follows: (1) investigating the issues related to the parallel export of new energy vehicles; (2) investigating the issues surrounding parallel exports conducted by authorized distributors and third-party speculators; and (3) investigating the parallel export issues related to manufacturers’ differentiated production of products.

3. Problem Description and Assumptions

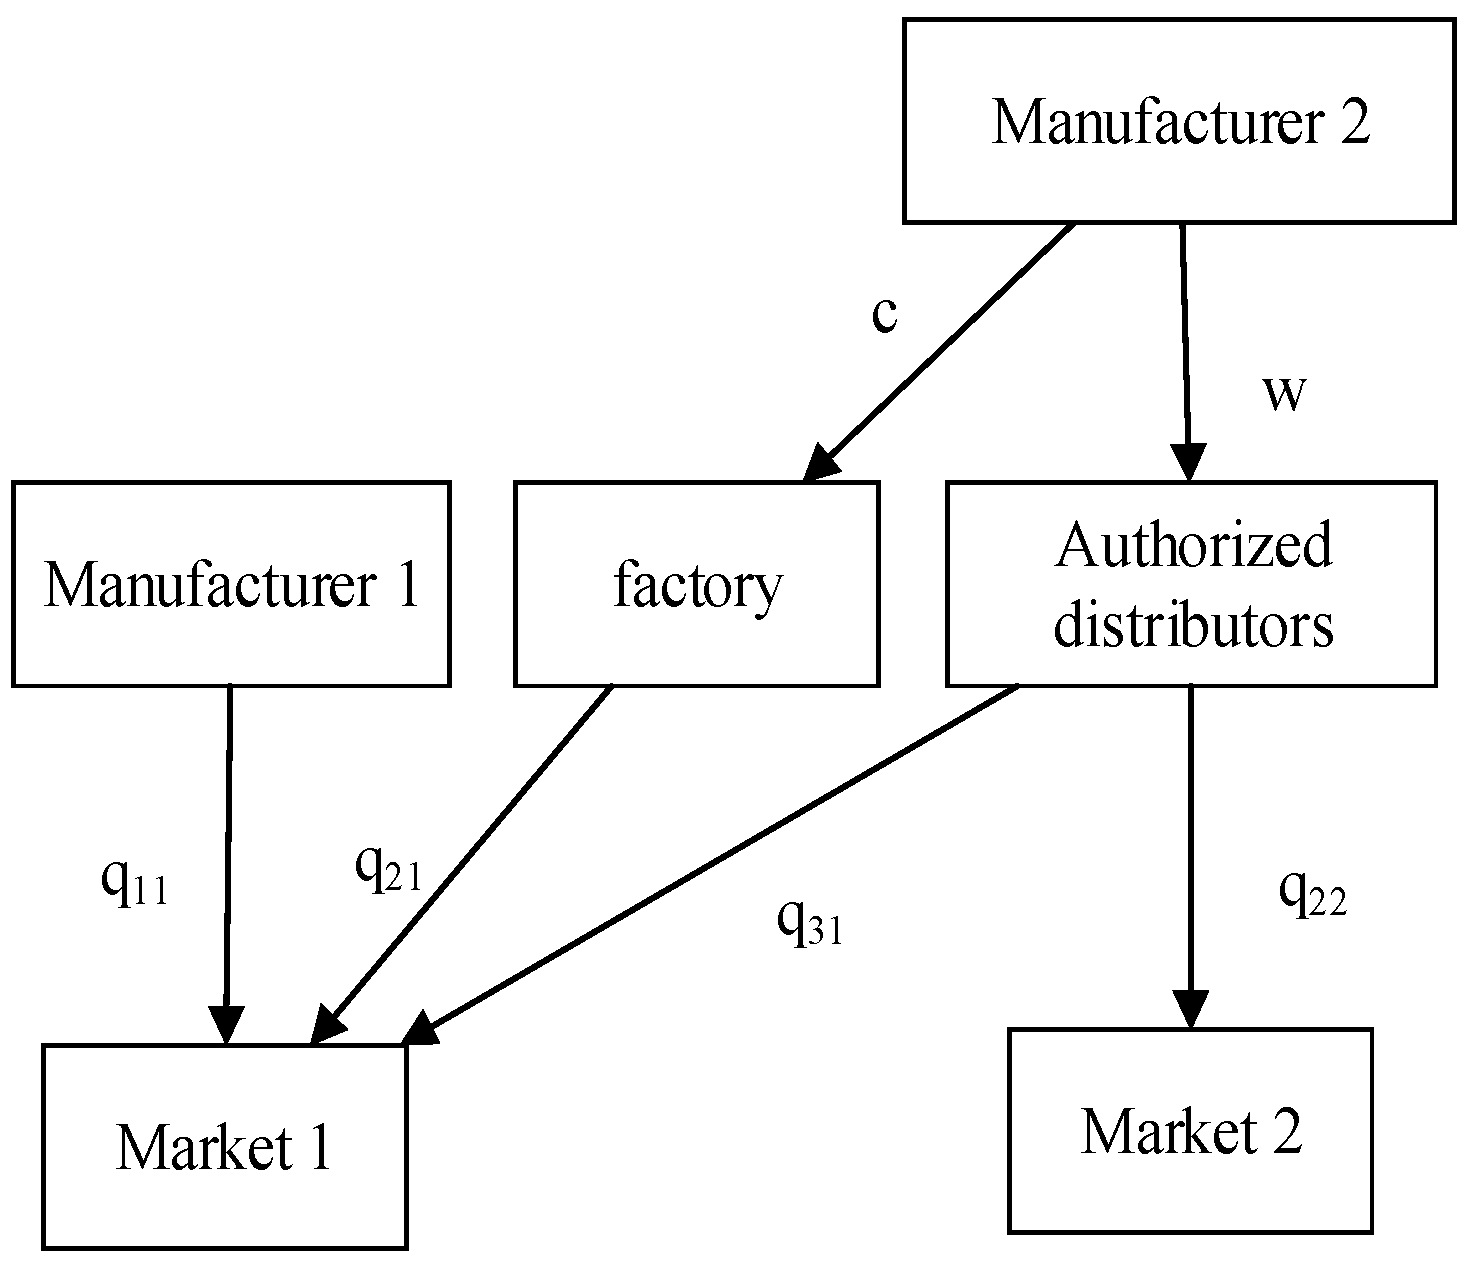
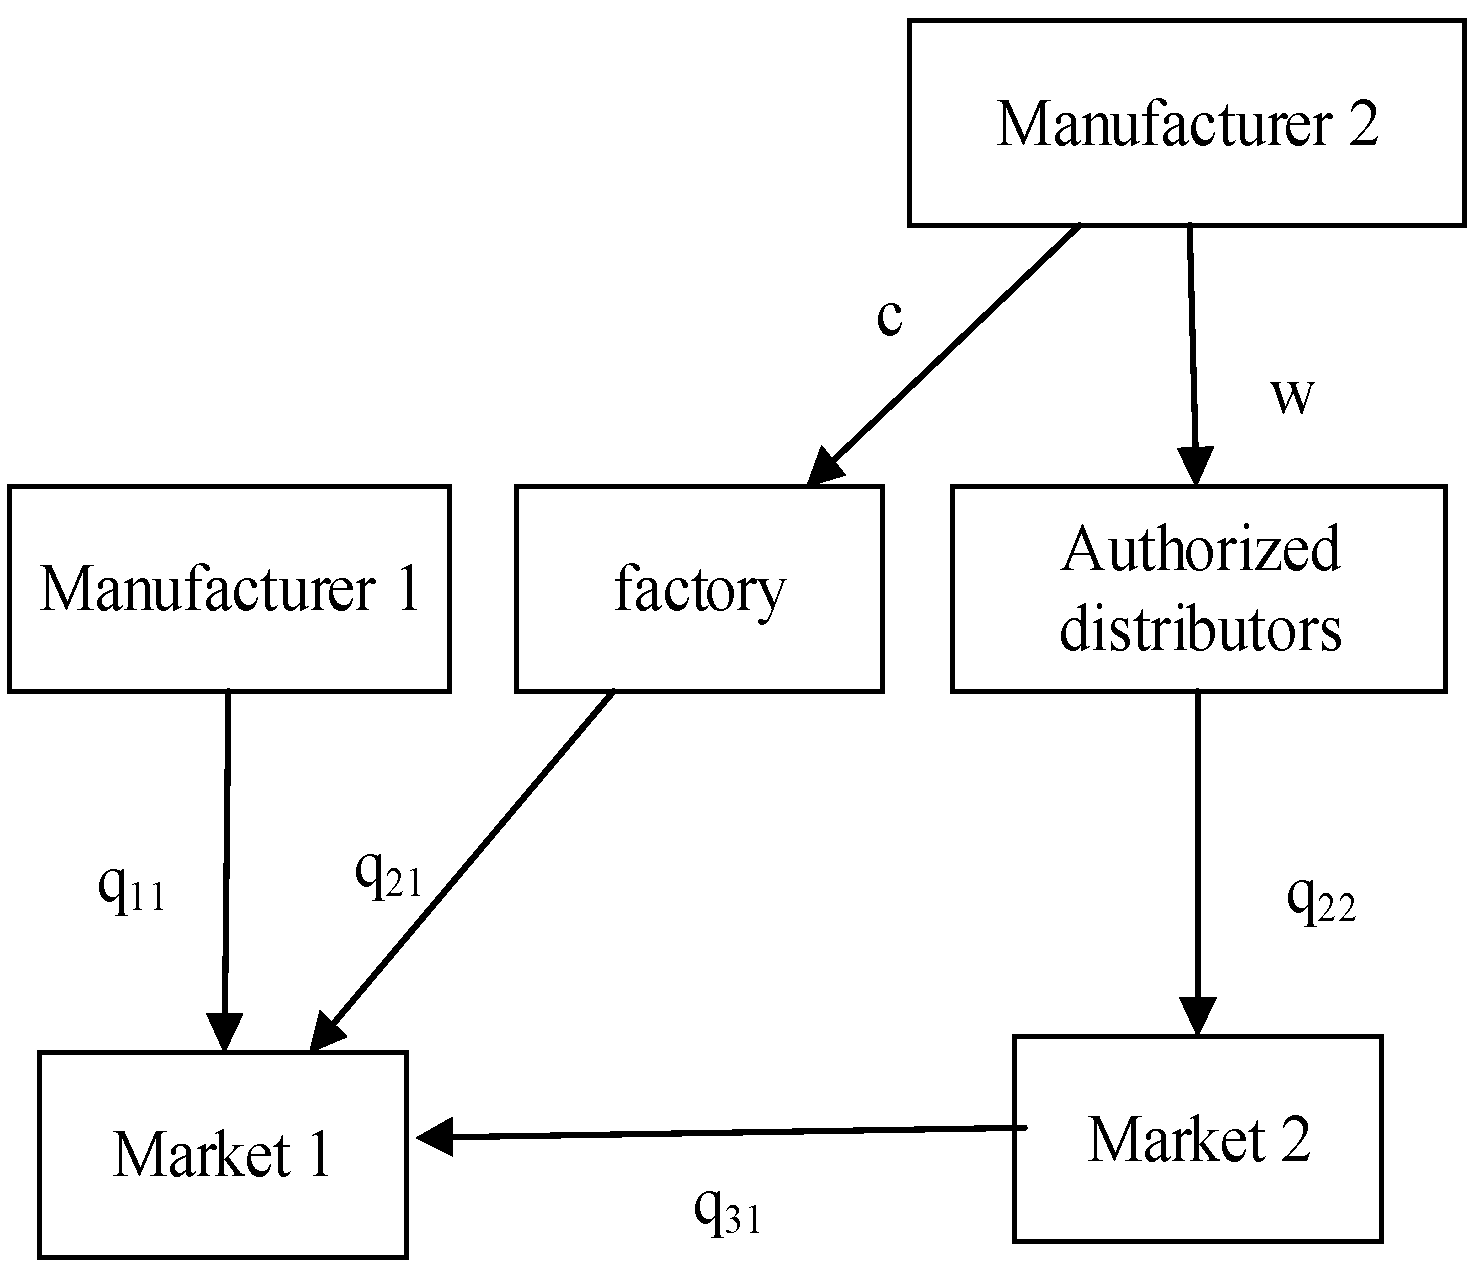
Consider two new energy vehicle markets: Market 1 is an emerging market, like the automotive markets in Southeast Asian countries; Market 2 is a mature market, like the new energy vehicle market in China. In Market 1, Manufacturer 1 determines the production scale of new energy vehicles and then manufactures and sells them locally. In Market 2, Manufacturer 2, on one hand, manufactures new energy vehicles and sells them locally through authorized local distributors with the wholesale price w and, on the other hand, manufactures differentiated products in the factory located in Market 1 and sells them in Market 1, assuming that the level of its differentiated production is c . The differentiated products of new energy vehicles will be designed according to the policies and travel habits of the market. In addition, authorized distributors and third-party sellers in Market 2 make decisions on the scale of parallel exports and the price of domestic sales. Therefore, this paper considers three scenarios: no parallel exports (CN), authorized distributors’ parallel exports (CR), and third-party parallel exports (CT), and the supply chain structures for parallel exports scenarios (CR\CT) are illustrated in Figure 1 and Figure 2.
In both Markets 1 and 2, due to the greater popularity of mature electric vehicles and the influence of brand preferences, consumers are more inclined to purchase product 2. We assume that the product 2’s brand recognition is 1 and the product 1’s brand recognition is δ , where 0 < δ < 1 . In addition, due to the lack of service guarantee for new energy parallel export cars, the recognition of new energy parallel export cars is θ ( 0 < θ < 1 ).
Consumers’ willingness to pay in the two markets varies depending on the penetration rate of the new energy vehicle market and the availability of new energy vehicles in the market. First, the total demand for vehicles in the Southeast Asian automotive market will reach about 3.42 million units in 2023, but according to data, the sales volume of new energy vehicles in Southeast Asia will be 113,600 units in 2023, with a new energy vehicle penetration rate of about 3.3%, suggesting that the market is potentially in high demand and large in size. Further, we assume that Market 1 is a high-willingness-to-pay market with consumers’ willingness to pay v 1 obeying a uniform distribution on 0 , a 1   ( a 1 = 1 ) , and for a more mature new energy vehicle market like China, the market penetration rate is high (31.6% in 2023), and the technology is mature, with sufficient production of new energy vehicles, abundant models, and fierce competition in the market. Therefore, it is assumed that Market 2 is a low-willingness-to-pay market with consumers’ willingness to pay v 2 obeying a uniform distribution on 0 , a 2 . As it is well known that mature new energy vehicles have matured and stabilized in all aspects such as design, space, configuration, electrification, and intelligence, and are generally recognized and accepted by consumers, the willingness of consumers to pay is higher in Market 1; i.e., a 2 < a 1 .
To better describe and establish the model, this paper makes the following assumptions:
Hypothesis 1.
Consumers in Market 1 are unable to purchase products in Market 2 through normal channels due to geographic restrictions.
Hypothesis 2.
In Market 2, authorized distributors are unable to distinguish between regular consumers and third-party speculators.
Hypothesis 3.
Consumers in Market 1 prefer to buy mature new energy vehicles due to brand preference, and it is assumed that  δ < 1 2 θ .
Hypothesis 4.
Manufacturer 2 is the Stackelberg game leader, while Manufacturer 1 and the authorized distributor are the followers.
The key notations involved in this paper are shown in Table 2.

4. Construction and Solution of Models

4.1. No Parallel Export of New Energy Vehicles (CN)

In the base case of no parallel export of new energy vehicles, with the goals of maximizing their own profits, the supply chain members make decisions in the sequence shown in Figure 3: Firstly, Manufacturer 2 decides the wholesale price w in Market 2, the sales volume q 21 in Market 1, and the level of differentiation c ; secondly, Manufacturer 1 decides the sales volume q 11 in Market 1, while the authorized distributor decides the sales volume q 22 in Market 2.
Then, according to the prices of new energy vehicles from supply chain members, consumers in both markets make purchasing decisions based on maximizing their own utility. Firstly, in Market 1, consumers’ utility from product 1 and product 2 is u 21 = v 1 p 21 + β c and u 11 = δ v 1 p 11 , respectively, and the utility of consumers in Market 2 from product 2 is u 22 = v 2 p 22 . Then, the market share of each product in both markets can be obtained as
q 21 = δ 1 c β p 11 + p 21 δ 1 ;
q 11 = c β δ + p 11 δ p 21 δ 1 δ ;
q 22 = 1 p 22 a 2 ,
solving the conditions u 22 ( p 22 ) > 0 , u 11 ( p 21 , p 11 ) > 0 ( u 21 ( p 21 , p 11 ) > u 11 ( p 21 , p 11 ) ) . The reverse demand functions are
p 11 = δ δ q 11 δ q 21 ;
p 21 = 1 + c β δ q 11 q 21 ;
p 22 = a 2 a 2 q 22 .
Next, solving the model in backward induction, the following Theorem 1 can be obtained.
Theorem 1.
In the base case of no parallel export, when
2 β 2 2 + δ < k 1 < 1
the optimal decisions of Manufacturer 2 are
w C N = a 2 2 ;
c C N = β 2 + δ 2 β 2 + 2 + δ k 1 ;
q 21 C N = 2 + δ k 1 2 β 2 + 2 + δ k 1 ,
the optimal local sales volume for Manufacturer 1 is
q 11 C N = 1 4 1 + β 2 β 2 + 2 + δ k 1 ,
the optimal sales volume for authorized distributors is
q 22 C N = 1 4 ;
the equilibrium prices and profit are
p 11 C N = 1 4 δ 1 + β 2 β 2 + 2 + δ k 1 ;
p 22 C N = 3 a 2 4 ;
q 21 C N = 2 + δ 2 k 1 4 β 2 + 2 + δ k 1 ;
π M 1 C N = δ 2 β 2 + 2 + δ k 1 2 16 β 2 + 2 + δ k 1 2 ;
π M 2 C N = 1 8 a 2 2 + δ 2 k 1 β 2 + 2 + δ k 1 ;
π R C N = a 2 16 ;
Proof. 
In the second stage, with the optimal decision of Manufacturer 2 in the first phase, the optimization objectives of Manufacturer 1 and the authorized distributor are
max q 11 π M 1 C N = p 11 q 11
max q 22 π R C N = ( p 22 w ) q 22
Substituting the reverse demand functions into Equations (1) and (2), the first derivative with respect to q 11 , q 22 can be obtained as
π M 1 C N q 11 = δ 1 + 2 q 11 + q 21 ,
π R C N q 22 = w + a 2 1 2 q 22 ,
and the second derivatives satisfy the following conditions:
2 π R C N q 22 2 = 2 a 2 < 0 ,
2 π M 1 C N q 11 2 = 2 δ < 0
Therefore, there exists a unique optimal decision (the optimal response function) for members in this stage. By making the first-order partial derivative equal to zero, the following can be got:
q 11 C N = 1 2 1 q 21 ;
q 22 C N = 1 2 w 2 a 2 .
In the first stage, the optimization objective of Manufacturer 2 is
max w , q 21 , c π M 2 C N = p 21 q 21 + w q 22 1 2 k 1 c 2
Substituting the reverse demand function and the optimal response functions of members into Equation (3), we can get the first derivative with respect to w , c , q 21 as
π M 2 C N c = c k 1 + β q 21 ,
π M 2 C N q 21 = 1 + c β δ 2 + 2 + δ q 21 ,
π M 2 C N w = 1 2 w a 2 .
By finding the Hessian matrix with respect to w , c , q 21 , Equation (4) can be got:
H = 1 a 2 0 0 0 k 1 β 0 β 2 + δ
Here, H 1 = 1 a 2 , H 2 = k 1 a 2 , H 3 = β 2 + 2 + δ k 1 a 2 , and H 1 < 0 , H 2 > 0 , H 3 < 0 . So, the Hessian matrix is negative definite, and there exists a unique optimal solution when β 2 2 + δ < k 1 < 1 .
Letting the first derivatives be zero and linking, we can get
c C N = β 2 + δ 2 β 2 + 2 + δ k 1 ,
w C N = a 2 2 ,
q 21 C N = 2 + δ k 1 2 β 2 + 2 + δ k 1 ,
and both the optimal decision and the equilibrium solution are positive when 2 β 2 2 + δ < k 1 < 1 . □
By comparing the sale volume of two products in the market and Manufacturer 2’s profits, Theorem 2 can be obtained as follows:
Theorem 2.
(1) 
q 21 C N > q 22 C N > q 11 C N .
(2) 
π 1 M 2 C N > π 2 M 2 C N .
Proof. 
(1) Based on the optimal decision of solving above, we can get q 21 C N q 22 C N = β 2 + 2 + δ k 1 4 β 2 + 2 + δ k 1 ; because 2 β 2 2 + δ < k 1 < 1 , β 2 + 2 + δ k 1 < β 2 < 0 , so q 21 C N q 22 C N > 0 ; because q 22 C N q 11 C N = β 2 4 β 2 + 2 + δ k 1 > 0 , q 21 C N > q 22 C N > q 11 C N .
(2) Based on the optimal decision and equilibrium profit solved above, we can get π 1 M 2 C N π 2 M 2 C N = p 21 C N q 21 C N 1 2 k 1 c 2 w C N q 22 C N = β 2 + 2 + δ k 1 2 + δ 2 k 1 a 2 β 2 + 2 + δ k 1 because β 2 + 2 + δ k 1 < 0 and 0 < a 2 < 1 ; we can get 2 + δ 2 k 1 a 2 β 2 + 2 + δ k 1 < 2 + δ 2 k 1 1 + 2 + δ k 1 = 1 2 3 δ + δ 2 k 1 < 0 , and then 2 + δ 2 k 1 a 2 β 2 + 2 + δ k 1 < 0 , π 1 M 2 C N π 2 M 2 C N > 0 . □
The above theorem shows that Manufacturer 2 has the highest sales of new energy vehicles with differentiated production in Market 1; Manufacturer 2’s profit in Market 1 is greater than that in Market 2. These benefits stem from the higher willingness of consumers to pay in Market 1, as well as the competitiveness and high prices resulting from differentiated production. It can be seen that when there is no parallel export, differentiated production by Manufacturer 2 in Market 1 based on consumer preferences can increase its sales volume and profit.

4.2. Authorized Distributors’ Parallel Export (CR)

In the CR model, considering that the authorized distributor exports new energy vehicles in parallel to Market 1, the decision-making sequence of the members can be shown as Figure 4: the order of decision-making in the first two stages is the same as that in the base model; differently, in the third stage, the authorized distributor need to decide the sales scale of new energy vehicles exported in parallel to Market 1 ( q 31 ).
In this situation, the consumers in Market 1 obtain utility by purchasing and consuming parallel-exported cars as
u 31 = θ v 1 p 31 .
Therefore, the demand functions are
q 21 = 1 + c β θ p 21 + p 31 1 θ ;
q 22 = 1 p 22 a 2 ;
q 11 = θ p 11 δ p 31 δ 2 δ θ ;
q 31 = c β δ c β θ 1 + θ p 11 + δ + θ p 21 p 31 + δ p 31 δ θ 1 + θ ;
The reverse demand functions are
p 22 = a 2 a 2 q 22 ;
p 11 = δ δ q 11 δ q 21 δ q 31 ;
p 31 = θ δ q 11 θ q 21 θ q 31 ;
p 21 = 1 + c β δ q 11 q 21 θ q 31 .
Then, a three-stage game model can be constructed as follows:
max w , q 21 , c π M 2 C R = p 21 q 21 + w ( q 22 + q 31 ) 1 2 k 1 c 2 q 11 a n d q 22 s a t i s f y max q 11 π M 1 C R = p 11 q 11 max q 22 π R C R = ( p 22 w ) q 22 + ( p 31 w ) q 31 q 31 s a t i s f y max q 31 π R C R = ( p 22 w ) q 22 + ( p 31 w ) q 31
Based on Manufacturer 2’s optimal decisions on wholesale price, differentiated production level, and production scale in the first stage, the third and second stages in backward induction are solved, and the optimal responses of the authorized distributor and Manufacturer 1 can be obtained as
q 22 C R = 1 2 w 2 a 2 ,
q 31 C R = w θ + δ q 11 + θ q 21 2 θ ,
q 11 C R = w + θ θ q 21 2 δ 4 θ .
By sorting out the above solution results, we can obtain the following Theorem 3 about the scale of parallel export and local sales and Theorem 4 about the authorized distributor’s profit:
Theorem 3.
(1) q 31 C R w < 0 , q 31 C R q 21 < 0 ;
(2) when  0 < a 2 b 1 , q 31 C R q 22 C R ; when  b 1 < a 2 < 1 , q 31 C R < q 22 C R , where  b 1 = 2 w δ 2 θ θ w δ 4 w + δ θ + 3 δ 4 θ θ q 21
Proof. 
(1) Because δ < 1 2 θ , q 31 C R w = δ 4 θ 4 δ θ 8 θ 2 < 0 ; q 31 C R q 21 = 3 δ + 4 θ 4 δ 2 θ < 0 ;
(2) q 31 C R q 22 C R = 2 w θ δ + 2 θ + a 2 w δ 4 w θ δ θ + 3 δ 4 θ θ q 21 4 θ δ + 2 θ a 2 . Because δ < 1 2 θ , 4 θ δ + 2 θ a 2 < 0; for 2 w θ δ + 2 θ + a 2 w δ 4 w θ δ θ + 3 δ 4 θ θ q 21 , analysis shows the value is not strictly greater than zero or strictly less than zero, but rather has a critical point. Therefore, we find this critical point by setting 2 w θ δ + 2 θ + a 2 w δ 4 w θ δ θ + 3 δ 4 θ θ q 21 = 0 . The critical point is b 1 = 2 w δ 2 θ θ w δ 4 w + δ θ + 3 δ 4 θ θ q 21 . Based on the critical value, it is easy to obtain the following: when 0 < a 2 b 1 , 2 w θ δ + 2 θ + a 2 w δ 4 w θ δ θ + 3 δ 4 θ θ q 21 0 , and then when 0 < a 2 b 1 , q 31 C R q 22 C R . Theorem 3(2) is proven. □
With parallel export of new energy vehicles by authorized distributors, Manufacturer 2 can curb the parallel export volume by regulating the Market 2 wholesale price w and sales volume q 21 , as shown in the following:
According to Theorem 3(1), the authorized distributor’s parallel export volume in Market 1 will decrease with the increase in Manufacturer 2’s wholesale price in Market 2 and Manufacturer 2’s sales volume in Market 1. Understandably, the margin of profit for authorized distributors conducting parallel export of new energy vehicles will become narrower with the increase in Manufacturer 2’s wholesale price, and there will be less market space in Market 1 for authorized distributors to conduct parallel export when Manufacturer 2 increases the sales volume in Market 1. Then, the authorized distributors would choose to reduce the volume of parallel export of new energy vehicles to Market 1 in both cases. This phenomenon reflects the fact that manufacturers can curb the volume of parallel export of new energy vehicles through wholesale price regulation and market share expansion.
For the sales volume allocation of authorized distributors, as shown in Theorem 3(2), when the range of consumers’ willingness in Market 2 is small and the maximum critical value is smaller than the threshold, their parallel exports will be larger than domestic sales; when the range of consumers’ willingness is wider and the maximum critical value is larger than the threshold, the aggregate demand in the domestic market increases and the authorized distributors’ sales volume is larger in Market 2, where there is no competitors. In addition, this critical threshold is affected by the manufacturer’s decisions, e.g., Manufacturer 2’s wholesale price w in Market 2 and sales volume q 21 in Market 1. Therefore, manufacturers can effectively curb the extent of parallel exports of new energy vehicles by authorized distributors’ parallel exports by enhancing the willingness to pay of consumers in Market 2 (e.g., by strengthening publicity and promotions, launching marketing campaigns, and increasing advertisements).
Theorem 4.
When  w 1 < w < w 2 , π R C R < π R C R , where  w 1 and  w 2 are placed in  Appendix B.
Proof. 
Similar to that of Theorem 3(2). □
By comparing the authorized distributor’s profits in the cases of no parallel export and the parallel export scenario, it can be seen that when the wholesale price of Manufacturer 2 is higher, the authorized distributor will gain less profit with parallel exports than in the no parallel export scenario because, with the increase in wholesale price, the authorized distributors will increase the sales price to avoid damage to their profits. As a result, the sales volume decreases, and the profits gained from the parallel export of new energy vehicles will not be enough to make up for the loss caused by the decrease in sales volume. So, in other words, Manufacturer 2 can influence the parallel export behavior of authorized distributors by controlling the wholesale price, or even inhibit the parallel export of authorized distributors for some reasons (maintaining brand image, etc.) (which may not be its optimal choice, of course).
Finally, returning to the first stage, the optimization objective for Manufacturer 2 is
max w , q 21 , c π M 2 C R = p 21 q 21 + w ( q 22 + q 31 ) 1 2 k 1 c 2
By substituting the reverse demand functions q 11 C R = w + θ θ q 21 2 δ 4 θ , q 22 C R = 1 2 w 2 a 2 , q 31 C R = w θ + δ q 11 + θ q 21 2 θ into Equation (5), the first derivative with respect to w , c , q 21 can be solved as π M 2 C R c = c k 1 + β q 21 , π M 2 C R w = 1 4 4 + 4 w + δ δ 2 θ 2 w θ 4 w a 2 , π M 2 C R q 21 = δ 4 + 4 c β θ + 4 θ 2 2 c β + θ + 2 δ 4 + θ 4 2 + θ θ q 21 4 δ 2 θ .
The Hessian matrix with respect to w , c , q 21 for Equation (5) is constructed as H = 1 δ 2 θ 1 2 θ 1 a 2 0 0 0 k 1 β 0 β δ 4 + θ 4 2 + θ θ 2 δ 2 θ , where H 1 = 1 δ 2 θ 1 2 θ 1 a 2 , H 2 = 1 δ 2 θ 1 2 θ 1 a 2 , H 3 = 2 δ 2 θ θ + δ 4 θ a 2 2 β 2 δ 2 θ + δ 4 + θ 4 2 + θ θ k 1 4 δ 2 θ 2 θ a 2 . The Hessian matrix will be negative definite, and there exists a unique optimal solution when 2 β 2 δ 2 θ δ 4 + θ 4 2 + θ θ < k 1 < 1 , ensuring H 1 < 0 , H 2 > 0 , H 3 < 0 .
By letting the first derivative be zero and joining, we can obtain the optimal decisions of Manufacturer 2 as c C R = β δ 4 + θ 4 2 + θ θ 4 β 2 δ 2 θ + 2 δ 4 + θ 4 2 + θ θ k 1 , w C R = 5 δ 8 θ θ a 2 4 δ 2 θ θ + 2 δ 4 θ a 2 , q 21 C R = δ 4 + θ 4 2 + θ θ k 1 4 β 2 δ 2 θ + 2 δ 4 + θ 4 2 + θ θ k 1 , when 0 < a 2 < θ 2 δ 4 θ + θ 2 3 δ 2 16 δ θ + 18 θ 2 2 δ 4 θ 2 .
Then, Manufacturer 1’s optimal decision is
q 11 C R = θ a 2 β 2 7 δ + 16 θ 3 A 1 k 1 + θ 2 B 1 A 1 k 1 2 2 δ 2 θ θ + δ 4 θ a 2 B 1 + A 1 k 1
The optimal decisions of the other members in the supply chain are then obtained as
q 31 C R = 3 δ 4 θ θ 2 B 1 + A k 1 + δ 4 θ a 2 β 2 δ A k 1 4 2 δ 2 θ θ + δ 4 θ a 2 B 1 + A 1 k 1 ; q 22 C R = 1 2 + θ 5 δ + 8 θ 8 δ 2 θ θ + 4 δ 4 θ a 2 ;
By analyzing the above optimal decisions and profits (other decisions and profits are placed in Appendix A), the following Theorems 5–7 can be drawn.
Theorem 5.
(1) 
For the sales scales of Manufacturer 2,  q 31 C R + q 22 C R < q 21 C R .
(2) 
For the market composition of new energy vehicles in Market 1, when  0 < a 2 b 3 ,  q 21 C R > q 31 C R q 11 C R ; when  b 3 < a 2 < θ 2 δ 4 θ + θ 2 3 δ 2 16 δ θ + 18 θ 2 2 δ 4 θ 2 ,  q 21 C R > q 11 C R > q 31 C R .
(3) 
For the volume structure of authorized distributors, when  0 < a 2 < b 4 ,  q 31 C R > q 22 C R ; when  b 4 a 2 θ 2 δ 4 θ + θ 2 3 δ 2 16 δ θ + 18 θ 2 2 δ 4 θ 2 ,  q 31 C R q 22 C R .
Proof. 
(1). Based on the optimal decision, it can be obtained that:  q 31 C R + q 22 C R q 21 C R = β 2 5 δ 8 θ δ 4 + θ 4 2 + θ θ k 1 8 β 2 δ 2 θ + 4 δ 4 + θ 4 2 + θ θ k 1 When solving for the Hessian matrix, we get 2 β 2 δ 2 θ δ 4 + θ 4 2 + θ θ < k 1 < 1 . From this equation, we can deduce that δ 4 + θ 4 2 + θ θ k 1 > 2 β 2 δ 2 θ > 0 . Because δ < 1 2 θ , β 2 5 δ 8 θ δ 4 + θ 4 2 + θ θ k 1 < 0 ; 8 β 2 δ 2 θ + 4 δ 4 + θ 4 2 + θ θ k 1 > 8 β 2 δ 2 θ 8 β 2 δ 2 θ = 0 , and then q 31 C R + q 22 C R q 21 C R < 0
(2) Since q 31 C R + q 22 C R < q 21 C R , it follows that q 31 C R < q 21 C R . Based on the optimal decision, it can be obtained that q 21 C R q 11 C R = 1 2 2 δ 3 θ θ + δ θ a 2 2 δ 2 θ θ + δ 4 θ a 2 + β 2 2 δ + 5 θ 2 β 2 δ 2 θ + δ 4 + θ 4 2 + θ θ k 1 . It is clear to see that 2 δ 3 θ θ + δ θ a 2 2 δ 2 θ θ + δ 4 θ a 2 > 0 and β 2 2 δ + 5 θ 2 β 2 δ 2 θ + δ 4 + θ 4 2 + θ θ k 1 > 0 . Then q 31 C R < q 21 C R and q 11 C R < q 21 C R .
For q 11 C R and q 31 C R , the proof procedure is the same as in Theorem 3(2).
Thus the conclusion in Theorem 5(2) is confirmed.
(3) Similar to that of Theorem 3(2). □
Under the differentiated production strategy, Theorem 5(1) shows that the sales volume of new energy vehicles undergoing differentiated production by Manufacturer 2 is greater than the total sales volume of standard products in local Market 2. This is because, in an analysis from the market perspective, the consumers’ willingness to pay in Market 1 is greater than that in Market 2, and therefore, the total demand for new energy vehicles in Market 1 is greater than the total demand for new energy vehicles in Market 2. From the product perspective, in Market 1, Manufacturer 2’s differentiated production of new energy vehicles will better meet the needs of consumers in Market 1. Therefore, when developing markets, manufacturers need to fully assess consumers’ willingness to pay and prioritize markets with higher willingness to pay. Also, they should strive to enhance the irreplaceability of their products and increase their competitiveness.
From Theorem 5(2), firstly, Manufacturer 2’s differentiated products are the most competitive in Market 1 and have the highest sales scale. Secondly, the competitiveness of Manufacturer 1’s products and standard products exported from authorized distributors in parallel is related to consumers’ willingness to pay in Market 2. Specifically, when the range of consumers’ willingness in Market 2 is smaller and the maximum critical value is smaller than the threshold, the sales of product 1 are smaller than those of new energy parallel export vehicles; when the range of consumers’ willingness to pay is wider and the maximum critical value is larger than the threshold, the sales of product 1 are larger than those of new energy parallel export vehicles.
From Theorem 5(3), it can be seen that the sales decisions of authorized distributors are also related to the willingness of consumers in Market 2. For example, when consumers’ willingness is low, the sales volume of new energy vehicles exported by distributors in parallel will be higher than that of local sales. Then, Theorem 5(3) and Theorem 3(2) also show that authorized distributors have a larger sales volume in Market 2, where there are no competitors, when the range of consumers’ willingness to pay in Market 2 is wider and the highest critical threshold is larger than the threshold which can be obtained by substituting Manufacturer 2’s wholesale price w in Market 2 and the sales volume q 21 in Market 1. From Theorems 5(2) and 5(3), it is equally clear that by increasing consumer willingness in Market 2, authorized distributors’ parallel exports will be suppressed, and therefore, Manufacturer 2 should take active measures to increase consumer willingness to pay in Market 2, such as strengthening promotions, marketing campaigns, and increased advertising.
Theorem 6.
π 1 M 2 C R < π 2 M 2 C R ; π M 2 C R < π M 2 C N .
Proof. 
Similar to that of Theorem 5(1). □
As shown in Theorem 6, it is different from Theorem 2(2) that Manufacturer 2 will obtain less profit from the differentiated production of new energy vehicles in Market 1 than from wholesaling the product in Market 2 when there is parallel export of new energy vehicles by the authorized distributor. And, to make matters worse, the total profit of Manufacturer 2 will also be reduced. This is because when consumer recognition of the brand of parallel export of new energy vehicles increases and the authorized distributor carries out parallel export, Manufacturer 2 will increase the level of differentiated production to improve competitiveness, and at the same time, it will increase the wholesale price to inhibit the authorized distributor to carry out the parallel export of new energy vehicles, so that it pays more cost in Market 1 and obtains a higher unit profit in Market 2 (increasing the wholesale price). Therefore, this theorem reveals that Manufacturer 2’s profits will be harmed by the parallel export of new energy vehicles from the authorized distributor.
This paradoxical situation reveals the potential threat of parallel exports to the profitability of manufacturers: if manufacturers rely only on increasing the degree of production differentiation and wholesale prices to cope with the parallel export of new energy vehicles, they may instead fall into the predicament of “increased investment, profits fell”, so manufacturers can take other measures, such as with the construction of a service system for differentiated production, rather than relying solely on price. Therefore, manufacturers can take other measures, such as differentiated production and services, to weaken the incentives for parallel exports, rather than relying solely on price.
Theorem 7.
When  1 3 θ + 2 5 δ 8 θ θ 2 δ 4 θ < a 2 < θ 2 δ 4 θ + θ 2 3 δ 2 16 δ θ + 18 θ 2 2 δ 4 θ 2 , π R C R < π R C N ; when  0 < a 2 < 1 3 θ + 2 5 δ 8 θ θ 2 δ 4 θ , if  k 2 < k 1 < k 3 , then  π R C R < π R C N , and if  k 3 < k 1 < 1 , then  π R C R > π R C N .
Proof. 
Similar to that of Theorem 3(2). □
As shown in Theorem 7, the authorized distributors will obtain less profit in the case of carrying out parallel export of new energy vehicles, when the maximum critical value of consumers’ willingness to pay is greater than the threshold. This is because, with the increase in consumers’ willingness in Market 2, more potential consumers are willing to purchase new energy vehicles. In the case of the authorized distributor’s parallel export of new energy vehicles, Manufacturer 2 will choose to increase the wholesale price, and the authorized distributor will have to increase the sales price. Then, due to the increase in the price, some consumers in Market 2 will choose not to purchase new energy vehicles, and at the same time, the difference between the prices of the two markets decreases. Thus, the profit difference gained by the authorized distributor from conducting parallel export of new energy vehicles decreases, and the profit gained from conducting parallel export of new energy vehicles is not enough to make up for the profit lost in Market 2.
When the range of consumers’ willingness to pay in Market 2 is small and the maximum critical value is smaller than the threshold value, if Manufacturer 2’s differentiated production cost parameters are large (larger than a certain threshold value), the authorized distributor obtains a higher profit from parallel exporting and will choose to carry out parallel exporting, and if the Manufacturer 2 differentiated production cost parameters are smaller than the threshold value, the authorized distributor damages its own profit by carrying out parallel exporting. This is because when the differentiated production cost parameters are smaller for Manufacturer 2, the incentive for Manufacturer 2 to differentiate production is stronger, more consumers will choose to buy the differentiated production of new energy vehicles, and the authorized distributors will make less profit from parallel export. When the differentiated production cost parameters are large for Manufacturer 2, the incentive for Manufacturer 2 to differentiate production is weaker, the difference between differentiated production of new energy vehicles and parallel export of new energy vehicles will be narrower, the price of parallel export of new energy vehicles is lower, more consumers will buy parallel-exported new energy vehicles, and the authorized distributors will be able to gain higher profits from parallel export of new energy vehicles. Therefore, it is possible to reduce the willingness of authorized distributors to carry out parallel export of new energy vehicles by increasing the willingness to pay of the consumers in Market 2 or by reducing Manufacturer 2’s differentiated production cost parameters.

4.3. The Parallel Export of New Energy Vehicles from the Third Party (CT)

For the CT model, the decision-making sequence of the two market members is shown in Figure 5. The order of decision-making in the first two stages is the same as in the base model; in the third stage, the third party decides the sales of parallel export of new energy vehicles to Market 1 will be q 31 .
In this situation, the consumers in Market 1 obtain utility by purchasing and consuming parallel-exported cars as u 31 = θ v 1 - p 31 .
Similarly, the reverse demand functions for new energy vehicles in each market are
p 11 = δ δ q 11 δ q 21 δ q 31 ;
p 31 = θ δ q 11 θ q 21 θ q 31 ;
p 21 = 1 + c β δ q 11 q 21 θ q 31 ;
p 22 = a 2 a 2 q 22 .
Then, the three-stage game model can be constructed as
max w , q 21 , c π M 2 C T = p 21 q 21 + w q 22 1 2 k 1 c 2 q 11 a n d q 22 s a t i s f y max q 11 π M 1 C T = p 11 q 11 max q 22 π R C R = ( p 22 w ) q 22 q 31 s a t i s f y max q 31 π g C T = ( p 31 w ) q 31
By solving the model with backward induction, under the rational expectations of Manufacturer 2’s optimal wholesale price, differentiated production level, and production scale, the optimal responses of the third party, the authorized distributor, and Manufacturer 1 can be obtained as q 22 C T = 1 2 w 2 a 2 , q 31 C T = θ δ q 11 θ q 21 + a 2 1 + q 22 2 θ , q 11 C T = w + 2 θ + a 2 2 θ q 21 4 δ 8 θ .
Theorem 8.
(1) 
q 31 C T w < 0 ,  q 31 C T q 21 < 0 .
(2) 
When  0 < a 2 b 5 ,  q 31 C T q 22 C T q 31 C T ; when  b 5 < a 2 < 1 ,  q 31 C T < q 22 C T q 31 C T .
Proof. 
(1) Because δ < 1 2 θ , q 31 C T w = δ 4 θ 8 δ θ 16 θ 2 < 0 ; q 31 C T q 21 = 3 δ + 4 θ 4 δ 2 θ < 0 ;
(2) q 31 C T ( q 22 C T q 31 C T ) = 2 w θ δ + 2 θ + δ 4 θ a 2 2 + a 2 w δ 4 θ + 4 θ δ + θ + 2 3 δ 4 θ θ q 21 4 θ δ + 2 θ a 2 , because δ < 1 2 θ , 4 θ δ + 2 θ a 2 < 0 ; for 2 w θ δ + 2 θ + δ 4 θ a 2 2 + a 2 w δ 4 θ + 4 θ δ + θ + 2 3 δ 4 θ θ q 21 , analysis shows the value is not strictly greater than zero or strictly less than zero, but rather has a critical point. Therefore, we find this critical point by setting 2 w θ δ + 2 θ + δ 4 θ a 2 2 + a 2 w δ 4 θ + 4 θ δ + θ + 2 3 δ 4 θ θ q 21 = 0 . Then we can derive the critical value b 5 . Based on the critical value, it is easy to conclude that Theorem 8(2) holds. □
From Theorem 8(1), as in the case of CR, the paralleled export volume to Market 1 of the third party decreases with Manufacturer 2’s wholesale price in Market 2 and the sales volume in Market 1. From Theorem 8(2), when the consumers’ willingness to pay is small in Market 2 and the maximum critical value is smaller than the threshold, most new energy vehicles in Market 2 are purchased by third parties for parallel export. This is because when consumer willingness is low, the total demand in the market is low, and fewer consumers actually buy new energy vehicles and use them domestically, so most of the new energy vehicles are new energy vehicles exported by third parties. And when the range of consumers’ willingness to pay is wider and the highest critical value is greater than the threshold value, the total demand in the domestic market increases, and the number of consumers who buy new energy vehicles and use them in the country increases. At this time, the proportion of new energy parallel export vehicle sales decreases. In addition, this critical threshold is affected by the manufacturer’s decisions, e.g., Manufacturer 2’s wholesale price w in Market 2 and sales volume q 21 in Market 1.
From Theorem 3 and Theorem 8, it can be seen that, from the viewpoint of management practice, manufacturers can effectively deal with the parallel export problem by dynamically managing two key factors: firstly, the flexible setting of wholesale prices according to different market conditions, and secondly, the scientific arrangement of the sales volume in each market. In addition, when adopting a differentiated product strategy, manufacturers can set up a market monitoring mechanism to keep abreast of changes in consumer demand and accurately adjust pricing in Market 2 and sales volume in Market 1 accordingly. This management method of combining pricing strategy and sales allocation can give full play to the competitive advantages of differentiated products and effectively reduce parallel exports, providing a practical solution for new energy vehicle enterprises to expand their global markets.
Finally, returning to the first stage, the optimization objective for Manufacturer 2 is
max w , q 21 , c π M 2 C T = p 21 q 21 + w q 22 1 2 k 1 c 2
Substituting the reverse demand functions into Equation (6), the first derivative with respect to w , c , q 21 can be found as π M 2 C T c = c k 1 + β q 21 , π M 2 C T w = 1 4 2 4 w a 2 + 1 + δ 2 δ 4 θ q 21 , π M 2 C T q 21 = 8 + 3 w + 8 c β δ 2 8 + 2 w + 8 c β + δ θ + 8 θ 2 + 3 δ 4 θ a 2 + 4 δ 4 + θ 4 2 + θ θ q 21 8 δ 2 θ .
The Hessian matrix with respect to w , c , q 21 is found, where
H = 1 a 2 0 1 4 1 + δ 2 δ 4 θ 0 k 1 β 3 δ 4 θ 8 δ 16 θ β δ 4 + θ 4 2 + θ θ 2 δ 2 θ , H 1 = 1 a 2 , H 2 = k 1 a 2 , H 3 = 64 β 2 + 32 δ 2 θ δ 4 + θ 4 2 + θ θ + 3 δ 4 θ 2 a 2 k 1 δ 2 θ 2 64 a 2 . And the Hessian matrix is negative definite, and there exists a unique optimal solution when 4 β 2 δ 2 θ 4 3 δ 4 θ θ 3 δ 4 θ a 2 4 θ 3 δ 2 4 + θ + 16 2 + θ θ 2 8 δ θ 5 + 2 θ + M 1 < k 1 < 1 .
Letting the first derivative be zero and jointed, we can obtain the optimal decisions for Manufacturer 2 as
c C T = 4 β δ 2 θ 4 δ 4 + θ 16 2 + θ θ + 3 3 δ + 4 θ a 2 64 β 2 δ 2 θ 2 + 32 δ 2 θ δ 4 + θ 4 2 + θ θ + 3 δ 4 θ 2 a 2 k 1 ,   w C T = a 2 32 β 2 δ 2 θ 2 + 2 11 δ 20 θ δ 4 + θ 4 2 + θ θ 3 δ 4 θ 2 a 2 k 1 64 β 2 δ 2 θ 2 + 32 δ 2 θ δ 4 + θ 4 2 + θ θ + 3 δ 4 θ 2 a 2 k 1 ,   q 21 C T = 4 δ 2 θ 4 δ 4 + θ 16 2 + θ θ + 3 3 δ + 4 θ a 2 k 1 64 β 2 δ 2 θ 2 + 32 δ 2 θ δ 4 + θ 4 2 + θ θ + 3 δ 4 θ 2 a 2 k 1 ,
where M 1 = 16 13 3 θ θ 2 + 27 δ 2 1 + θ 32 δ θ 5 + θ a 2 ; N 1 = 4 13 10 θ θ + 9 δ 3 + 2 θ a 2 .
Manufacturer 1’s optimal decision is
q 21 C T = 8 β 2 δ 2 θ 4 θ + 3 a 2 + 2 4 θ A 1 N 1 k 1 64 β 2 δ 2 θ 2 + 32 δ 2 θ A 1 + 3 δ 4 θ 2 a 2 k 1
The optimal decision of the other members of the supply chain is then obtained as
q 31 C T = 4 β 2 δ 2 θ 4 3 δ 4 θ θ 3 δ 4 θ a 2 + 4 3 δ 4 θ θ A 1 + M 1 k 64 β 2 δ 2 θ 2 θ + θ 32 δ 2 θ A 1 + 3 δ 4 θ 2 a 2 k 1 ; q 22 C T = 16 β 2 δ 2 θ 2 + 5 δ 12 θ A 1 + 3 δ 4 θ 2 a 2 k 1 64 β 2 δ 2 θ 2 + 32 δ 2 θ A 1 + 3 δ 4 θ 2 a 2 k 1 ;
By analyzing and calculating the sales volume of each market and the profit of market members, we can get Theorem 9, similar to the previous case CR, without the corresponding explanations, and Theorem 10.
Theorem 9.
(1) 
For the sales structure of Manufacturer 2’s new energy vehicles, 
q 21 C T + q 31 C T > q 22 C T ;
q 31 C T < q 22 C T ;
q 22 C T < q 21 C T .
(2) 
For the market composition in Market 1, when  0 < a 2 < b 6 ,  q 21 C T > q 31 C T > q 11 C T ; when  a 2 b 6 ,  q 21 C T > q 11 C T q 31 C T .
Theorem 10.
(1) 
π 1 M 2 C T > π 2 M 2 C T ,  π M 2 C T < π M 2 C N .
(2) 
π R C T < π R C N .
Proof. 
The proof process of Theorem 9 and Theorem 10 is similar to that of Theorem 8. □
Different from the case of the authorized distributor, when the third party carries out the parallel export of new energy vehicles, Manufacturer 2 earns more profit in Market 1 than in Market 2. This is because the authorized distributors export new energy vehicles at the wholesale level and the third parties carry out parallel export of new energy vehicles at the selling price level. When the price difference between the two markets and the gap between consumers’ willingness to pay is small, the profit margin for authorized distributors to carry out parallel export of new energy vehicles will be larger, and authorized distributors will still choose to carry out parallel export, while some third parties will give up carrying out parallel export of new energy vehicles. In Market 1, when the sales of new energy parallel export vehicles decrease, Manufacturer 2 gains a higher market share, sales increase, and profits increase. Meanwhile, the wholesale price when the third party carries out the parallel export of new energy vehicles is lower than the wholesale price when the authorized distributor carries out the parallel export of new energy vehicles. Therefore, when the third party carries out parallel export of new energy vehicles, Manufacturer 2 obtains higher profits in Market 1.
From Theorem 10, we can similarly see that the parallel export of new energy vehicles by a third party will still harm the profit of Manufacturer 2 and also the profit of the authorized distributor. Authorized distributors are unable to make profits from the parallel export of new energy vehicles by the third party; on the contrary, as a result of the parallel export of new energy vehicles by the third party, Manufacturer 2 will increase the wholesale price of new energy vehicles, and the authorized distributors will have to increase the sales price. Higher sales prices result in the loss of some consumers and damage to the profits of authorized distributors.
5. Comparative Analysis of Models

This section will first analyze the impact of key parameters in the models on Manufacturer 2’s optimal decision and profit and then compare the optimal decisions and profits in different situations.
Firstly, through derivation and analysis, we can determine the impact of the consumers’ characteristics of Market 1, such as the degree of preference for brand 1 and the preference for parallel export vehicles, on the optimal decision, as shown in Table 3.
k 2 = 64 β 2 δ 2 θ 2 4 θ + 3 a 2 a 2 δ 2 480 444 θ + 64 28 27 θ θ 2 + 32 δ θ 58 + 55 θ + 3 3 δ 4 θ 2 a 2
Proof. 
In the CN case, find the partial derivative of θ and δ for q 21 C N , c C N and w C N . The result is as follows:
q 21 C N θ = c C N θ = w C N θ = w C N δ = 0 ;
q 21 C N δ = β 2 k 1 2 β 2 + 2 + δ k 1 2 > 0 ;
c C N δ = β 3 2 β 2 + 2 + δ k 1 2 > 0 ;
The proof procedure in the CR and CT cases is the same as that for CN, so it is omitted. □
As shown in Table 3, when the authorized distributor chooses to carry out parallel export of new energy vehicles, Manufacturer 2’s national decisions (the level of differentiated production, the sales of new energy vehicles in Market 1, and the sale price for retailers in Market 2) will increase with the brand recognition of new energy parallel export vehicles of consumers in Market 1. This is because Manufacturer 2 will choose to increase the level of differentiated production to improve the competitiveness of its products and raise the sales of new energy vehicles with a high differentiation level as the brand recognition of competitive products increases. This suggests that manufacturers need to be proactive in increasing brand awareness and recognition of their products.
At the same time, when consumers’ recognition of parallel-exported products increases, Manufacturer 2 can inhibit authorized distributors from engaging in the parallel export of new energy vehicles by raising the wholesale prices. However, with the increase in consumers’ brand recognition of product 1, Manufacturer 2, in the cases of parallel export, will lower the wholesale price to enable the authorized distributors to buy more new energy vehicles, and it will gain profits by increasing sales and balancing the cost of carrying out differentiated production.
In addition, in the case of parallel exports, the level of differentiation and production of Manufacturer 2 will increase with the consumers’ preference for the product 1 brand. Unlike the authorized distributor case, with the increase in the consumers’ preference for product 1 brand, Manufacturer 2 will choose to decrease the level of differentiated production when the differentiated production cost is greater than a threshold ( k 2 ). When the cost of differentiated production is so high, the profits from increased sales may not be sufficient to cover the cost of differentiated production.
Next, Table 4 and Theorem 11 show the impact of Manufacturer 2’s cost of product differentiation and the coefficient of the response of consumer demand to this differentiation in Market 1 on Manufacturer 2’s decisions and the profits of supply chain members.
Proof. 
The proof process is the same as above, so it is omitted. □
From Table 4, we can see the effect of product differentiation in production on the optimal decision of Manufacturer 2. From Table 4 above, it can be seen that the response coefficient of differentiation will have a positive impact on the degree of differentiation and differentiated production of Manufacturer 2. On the contrary, the differentiated costs will have a negative impact. On the wholesale price of Manufacturer 2 in Market 2, in the case of CN and CR, the two parameters have no effect, while the response coefficient of differentiation has a positive impact, and the differentiated costs have a negative impact in the case of CT.
Theorem 11.
(1) 
π M 2 ( C N / C R / C T ) β > 0 ,  π M 1 ( C N / C R / C T ) β < 0 ,  π R ( C R / C T ) β < 0 ,  π g ( C T ) β < 0 .
(2) 
π M 2 ( C N / C R / C T ) k 1 < 0 ,  π M 1 ( C N / C R / C T ) k 1 > 0 ,  π R ( C R / C T ) k 1 > 0 ,  π g ( C T ) k 1 > 0 .
Proof. 
The proof process is the same as above, so it is omitted. □
Theorem 11 demonstrates the moderating effect of product differentiation strategies in mitigating the loss of benefits from parallel exports. According to Theorem 11, with the increase in the response coefficient of differentiation, the profits of Manufacturer 2 in all cases will increase, and the profits of other members will decrease; with the increase in differentiated production cost parameters, the profit of Manufacturer 2 decreases, and the profit of other members increases. According to this conclusion, while carrying out differentiated production of products for export, Manufacturer 2 can also improve consumers’ recognition and response to the differentiation of products by significantly identifying and publicizing the differentiation, to improve profits. Of course, the increase in profits is partly due to the expansion of potential consumers in the market and partly due to the crowding out of the share of parallel exports. Therefore, this will inevitably damage the profits of other members in the two markets.
Finally, conclusions can be obtained by comparing the optimal decisions and profit of Manufacturer 2 in three cases, as shown in Theorems 12.
Theorem 12.
c C N < c C R < c C T , q 21 C N < q 21 C R < q 21 C T , w C R > w C T > w C N .
Proof. 
Based on the optimal decision derived in the previous section c C R c C N = β 3 2 δ 2 5 δ θ + 4 θ 2 2 β 2 + 2 + δ k 1 2 β 2 δ 2 θ + δ 4 + θ 4 2 + θ θ k 1 , it is obvious that
2 δ 2 5 δ θ + 4 θ 2 = 2 ( δ 5 4 θ ) 2 + 7 8 θ 2 > 0
In the CR model, we find the range of k 1 as
2 β 2 δ 2 θ δ 4 + θ 4 2 + θ θ < k 1 < 1 ,
and then 2 β 2 δ 2 θ + δ 4 + θ 4 2 + θ θ k 1 > 2 β 2 δ 2 θ 2 β 2 δ 2 θ = 0 ; β 2 + 2 + δ k 1 < β 2 + 2 + δ 2 β 2 δ 2 θ δ 4 + θ 4 2 + θ θ = β 2 ( 2 δ 2 + 5 δ θ 4 θ 2 δ 4 + θ 4 2 + θ θ ) < 0 ; then c C R c C N > 0 .
Other optimal decisions are compared in a similar way, so they are omitted. □
According to Theorem 12, Manufacturer 2 sets the highest level and the largest scale of differentiated production in the case of parallel export of new energy vehicles by a third party. In addition, the level and scale of product differentiation of Manufacturer 2 in the case of parallel export by authorized distributors will also be higher than those in the case of no parallel export. At the same time, in Market 2, Manufacturer 2 sets the highest wholesale price in the case of third-party parallel export, followed by authorized distributors in the case of parallel export. Therefore, the result can be considered that with the improvement of the differentiation level of Manufacturer 2, consumers in Market 1 are more inclined to buy differentiated products, resulting in more competitive differentiated products further occupying the market of product 1 and parallel exports. So, from the perspective of market share and dealing with parallel exports, differentiation is a very good strategy, and it performs best in the case of third-party parallel exports.

6. Numerical Analysis

To obtain more management suggestions, this part will continue to analyze the profitability of the manufacturer and the authorized distributor using numerical analysis.
This part starts by introducing the numerical analysis experiment process, explaining the parameter settings and showing the figures drawn based on the parameters. The next three sections use these figures to systematically analyze how parallel exports affect supply chain members.

6.1. Numerical Analysis Experiment Process

Considering that Manufacturer 2’s wholesale prices and profits vary with consumers’ willingness to pay in a similar range of values, we have combined them and presented them in the same chart in order to effectively compare their dynamics. On the contrary, variation in product differentiated cost parameters leads to a larger difference in the values presented by changes in Manufacturer 2’s profits and changes in its differentiated production levels. In order to avoid interpretation difficulties due to scale mismatches in a single chart and to ensure a clear visualization of the respective trends, Manufacturer 2’s profit and differentiated production level are plotted on separate charts.
(1) According to the statistics, in the Russian market, 90% of parallel exports have no formal warranty, leading to an increase in consumer complaints and a decrease in “reliability trust” of Chinese brands from 52% to 38%. Therefore, under the assumption that the product 2’s brand recognition is 1, we set θ = 0.5 ; under the assumption that δ < 1 2 θ , we set δ = 0.2 . Based on the constraints derived from the previous three cases, we set up k 1 = 0.2 , β = 0.1 . Based on δ = 0.2 , θ = 0.5 , k 1 = 0.2 , β = 0.1 , we draw the profit changes of each member of the supply chain by a 2 as shown in Figure 6, Figure 7 and Figure 8.
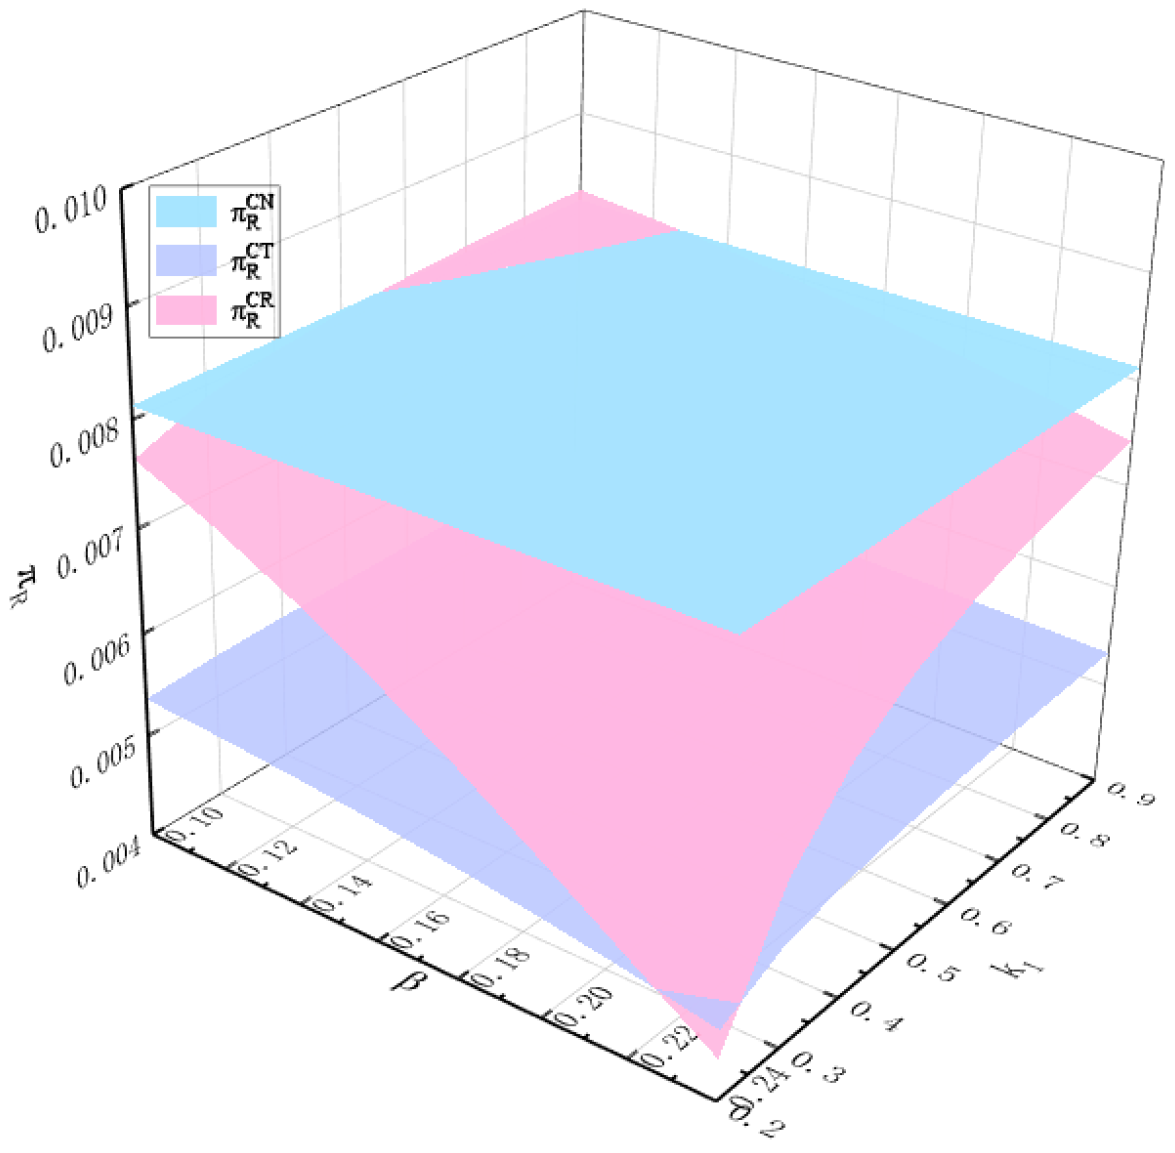
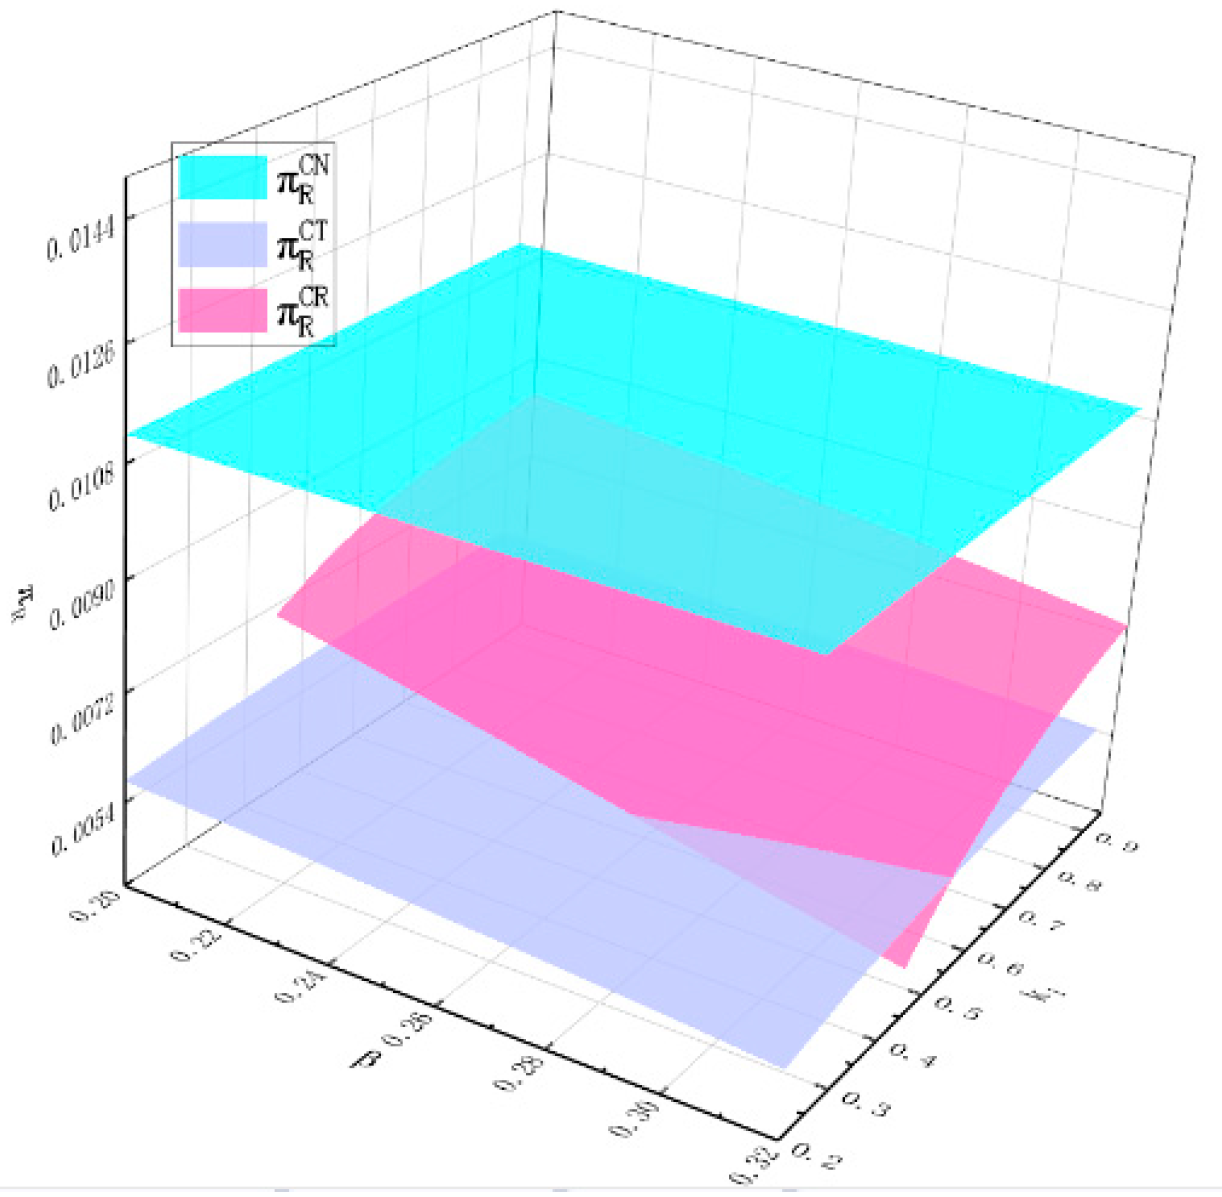
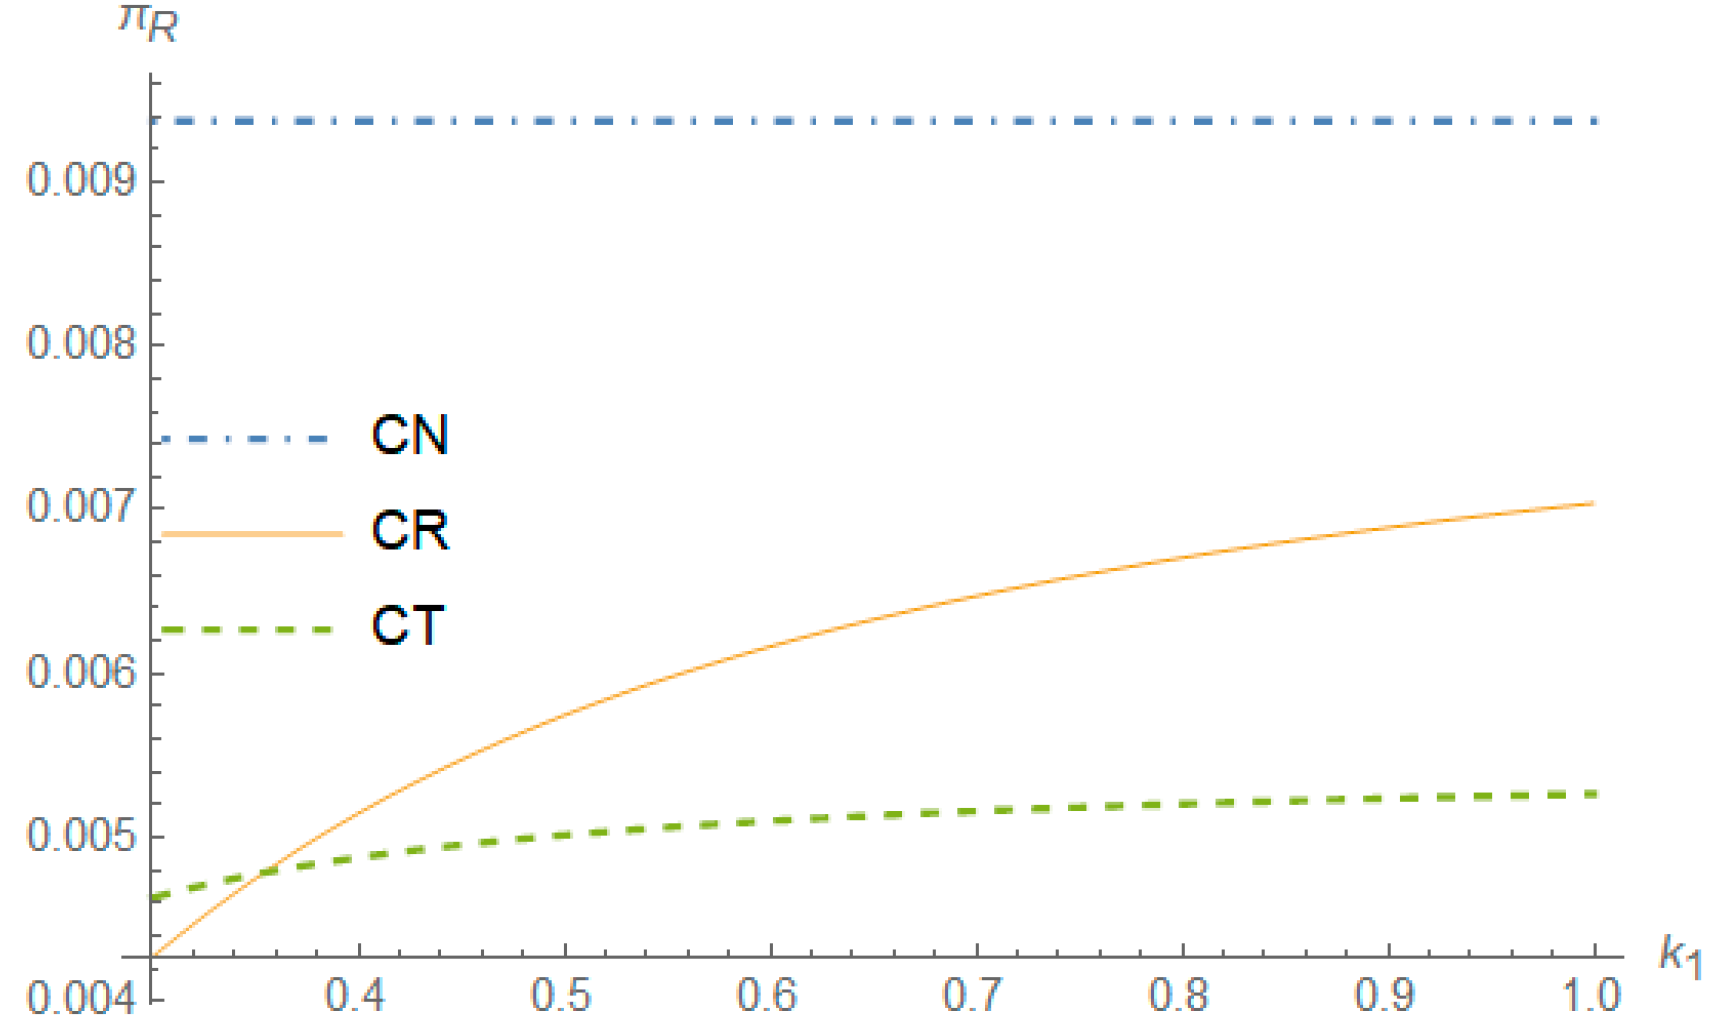
(2) In 2023, the penetration rate of new energy vehicles in Southeast Asia is about 3.3%, while the penetration rate of new energy vehicles in China is 31.6%. As a result, the Southeast Asian market has greater consumption potential. Therefore, assuming a willingness to pay of 1 for Southeast Asian consumers, we set a 2 = 0.1 . Based on the constraints derived from the previous three cases, we set up the δ = 0.2 , θ = 0.5 , β = 0.3 , we draw the profit changes of each member of the supply chain with k 1 as shown in Figure 9, Figure 10 and Figure 11.
(3) According to the conclusion of Theorem 7, we change the value of a 2 while the values of other parameters remain unchanged ( a 2 = 0.15 , δ = 0.2 , θ = 0.5 , β = 0.3 ), and we draw the profit changes of the authorized distributor of the supply chain with k 1 , as shown in Figure 12.
(4) With reference to the above parameter settings, we set the following three sets of parameters: a 2 = 0.1 , δ = 0.2 , θ = 0.5 , β = 0.3 ; a 2 = 0.15 , δ = 0.2 , θ = 0.5 ; a 2 = 0.15 , δ = 0.2 , θ = 0.5 , which are drawn in Figure 13, Figure 14 and Figure 15. Further analysis of the impact of parallel exports on the operational decisions of Manufacturer 2 and on the profits of the authorized distributors’ parallel exports is performed.

6.2. Impact of Parallel Exports on Manufacturer 2 and How Manufacturer 2 Responds to Parallel Exports

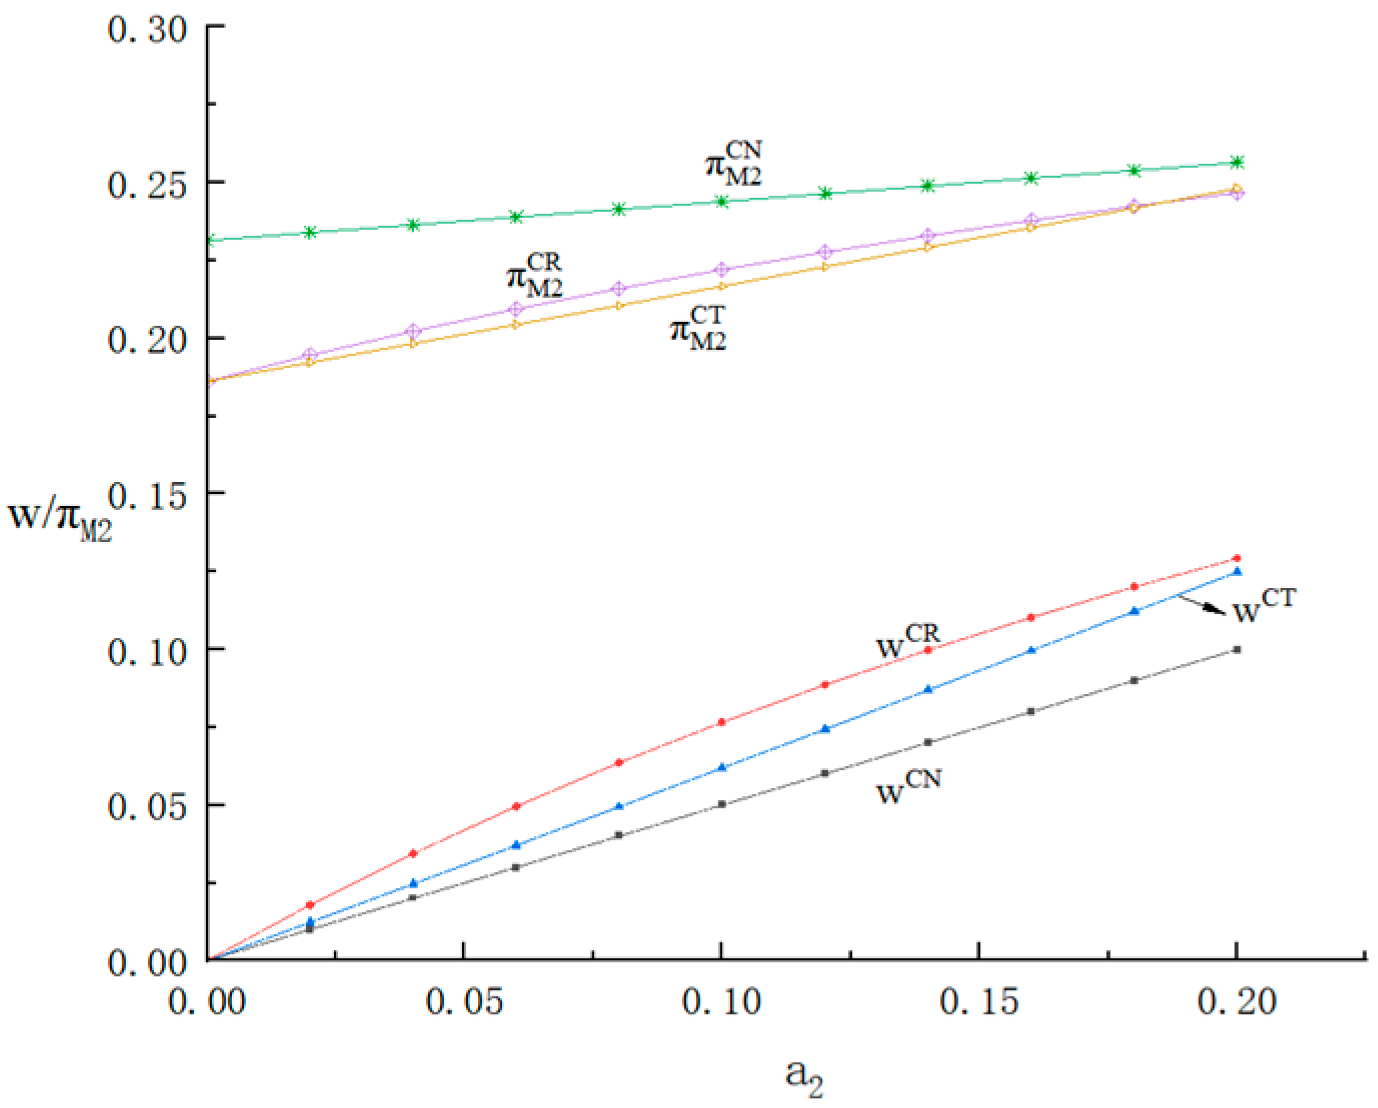
For the effect of parallel exports on Manufacturer 2, Figure 6 and Figure 9 show that parallel export of new energy vehicles harms the profit of Manufacturer 2, which confirms Theorem 6 and Theorem 10. From Figure 6, it can be seen that for the two cases of parallel export of new energy vehicles, there exists a threshold of consumers’ willingness a 2 , lower than which Manufacturer 2 will obtain higher profits in the case of parallel export by authorized distributors, and higher than which Manufacturer 2 will obtain higher profits in the case of parallel export by the third party. This is because, when consumers’ willingness to pay is higher, the total demand in the domestic market increases, and the authorized distributor chooses to increase the selling price to obtain higher profits; at this time, the price difference between the two markets will be lower, and when the price gap between markets is small while the disparity in consumers’ willingness to pay is also small, the authorized distributor’s profit space for the parallel export of new energy vehicles will be bigger, and the authorized distributor still chooses to carry out the parallel export, and some of the third parties will give up carrying out parallel export of new energy vehicles; at this time, Manufacturer 2 gains higher profits from the parallel export of new energy vehicles by the third party. When consumers’ willingness to pay is lower, the price difference between the two markets and the gap in consumers’ willingness to pay are larger; at this time, both the authorized distributor and the third party will choose to carry out the parallel export of new energy vehicles. Based on Theorem 12, Manufacturer 2 sets the highest wholesale price in the case of parallel export by the authorized distributor, and therefore, Manufacturer 2 obtains more profit.
As shown in Figure 13, there is a threshold of differentiated production cost in the two parallel export of new energy vehicles cases, higher than which Manufacturer 2 obtains higher profits when authorized distributors carry out parallel export of new energy vehicles, and lower than which Manufacturer 2 obtains higher profits when the third party carries out parallel export of new energy vehicles. Based on Theorem 12, Manufacturer 2 sets the highest level of differentiated production in the case of parallel export of new energy vehicles by the third party. When the cost of differentiated production is low, Manufacturer 2 pays less and effectively resists some third parties’ parallel export of new energy vehicles by increasing the level of differentiated production, and Manufacturer 2 obtains higher profits when the third parties carry out parallel export of new energy vehicles. When the cost of differentiated production is high, Manufacturer 2 effectively resists some third parties’ parallel export of new energy vehicles by setting the highest level of differentiated production, but the cost paid is too high, resulting in the lowest profit.
For Manufacturer 2 dealing with parallel exports, Figure 6 and Figure 13 confirm Theorem 12. As shown in Figure 6 and Figure 9, in order to resist parallel exports of new energy vehicles, Manufacturer 2 sets the maximum wholesale price in case of parallel exports of new energy vehicles by authorized distributors, and Manufacturer 2 sets the maximum level of differentiated production in case of third-party parallel exports of new energy vehicles. Manufacturers respond to parallel exports by implementing differentiated production and adjusting wholesale prices, which is consistent with reality. For example, in 2025, ZEEKR 001 and 7X will provide English flashing and unlocking support, as well as an “exclusive charging pile supply channel” for overseas users. Therefore, parallel export vehicles that are not purchased through official channels may face charging compatibility issues. At the same time, in order to reduce arbitrage opportunities, ZEEKR will adjust its parallel export policy in 2025, requiring partners to implement a transparent pricing policy of “keeping price differences within 1000 yuan.” XPeng Motors will optimize the seven-seat layout of the X9 to meet the needs of large families in Southeast Asia. This series of practical measures verifies the practical significance of this paper.

6.3. Impact of Parallel Exports on Manufacturer 1

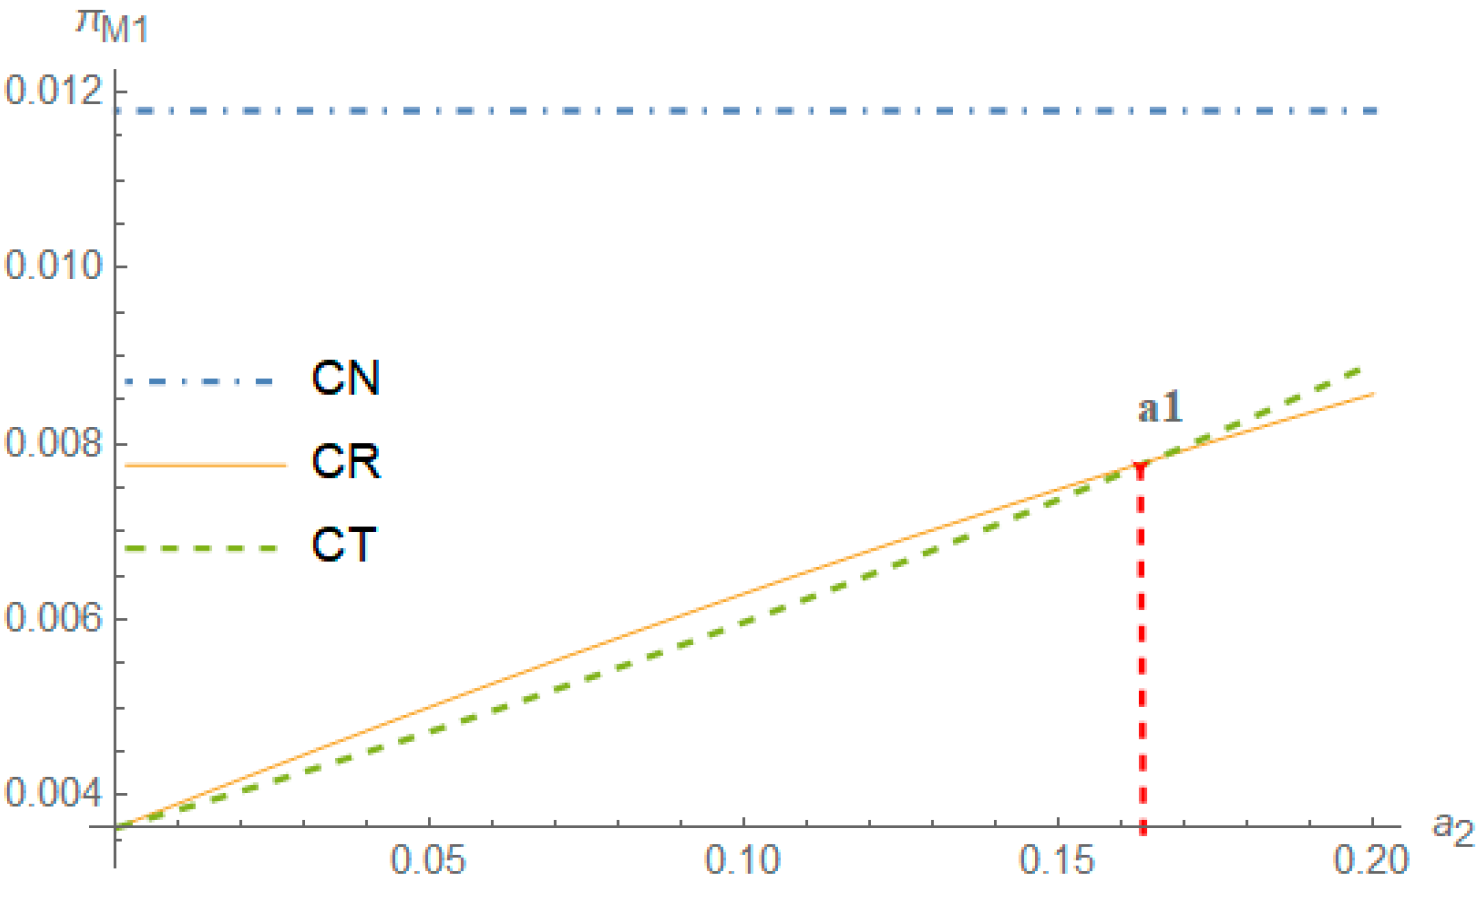
Figure 7 and Figure 10 show that the parallel export of new energy vehicles hurts the profits of Manufacturer 1, because the new energy vehicles from parallel export take away the market share of product 1 in Market 1. Further, we can find from Figure 9 that there exists a threshold of consumers’ willingness to pay in two cases of parallel exports, below which Manufacturer 1 obtains higher profits in the case of parallel export by distributors, and above which Manufacturer 1 obtains higher profits in the case of parallel exports by the third party. The reasons are similar and are related to the willingness to pay of consumers in the market and the price differential between the two markets.
Figure 7 and Figure 10 also show that the profits of Manufacturer 1 can be increased either by increasing the willingness to pay of consumers in Market 2 or by increasing the cost of carrying out differentiated production by Manufacturer 2. Therefore, Manufacturer 1 has the potential motivation to establish a cooperative relationship with Manufacturer 2 in order to collectively address the issue of parallel exports of new energy vehicles. In reality, there are cases of such manufacturer cooperation, such as the cooperation between India’s JSW Group and Chery, where Chery will provide technology and parts support to help India’s JSW Group launch a new energy vehicle brand by 2027, and the cooperation between Malaysia’s Proton and Geely, where Geely Group has helped the company to turn its losses into profits and realize brand revival.

6.4. Authorized Distributors’ Parallel Export Option

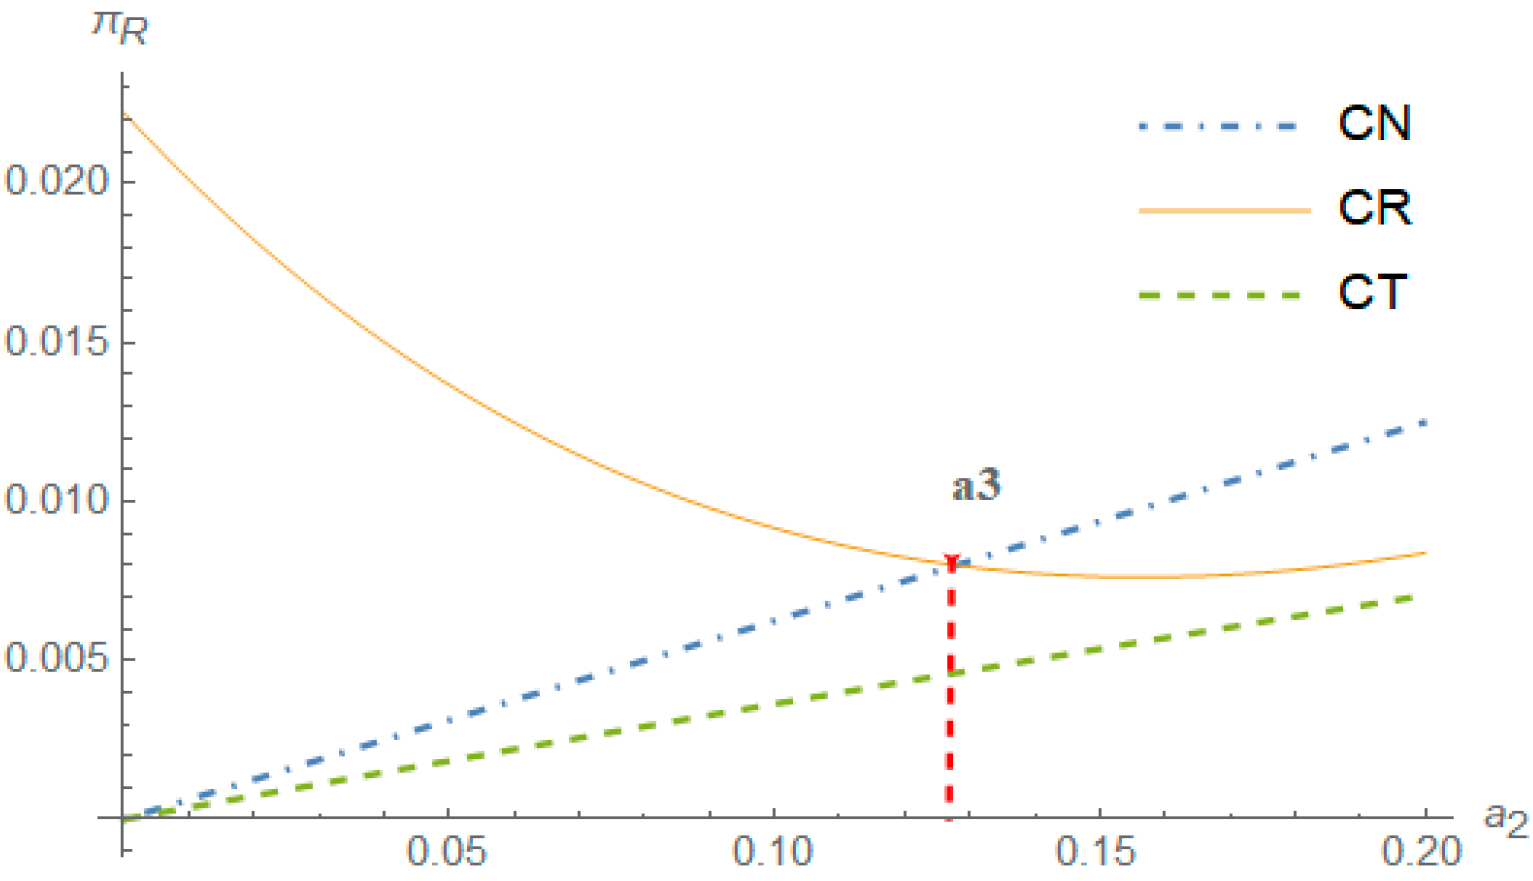
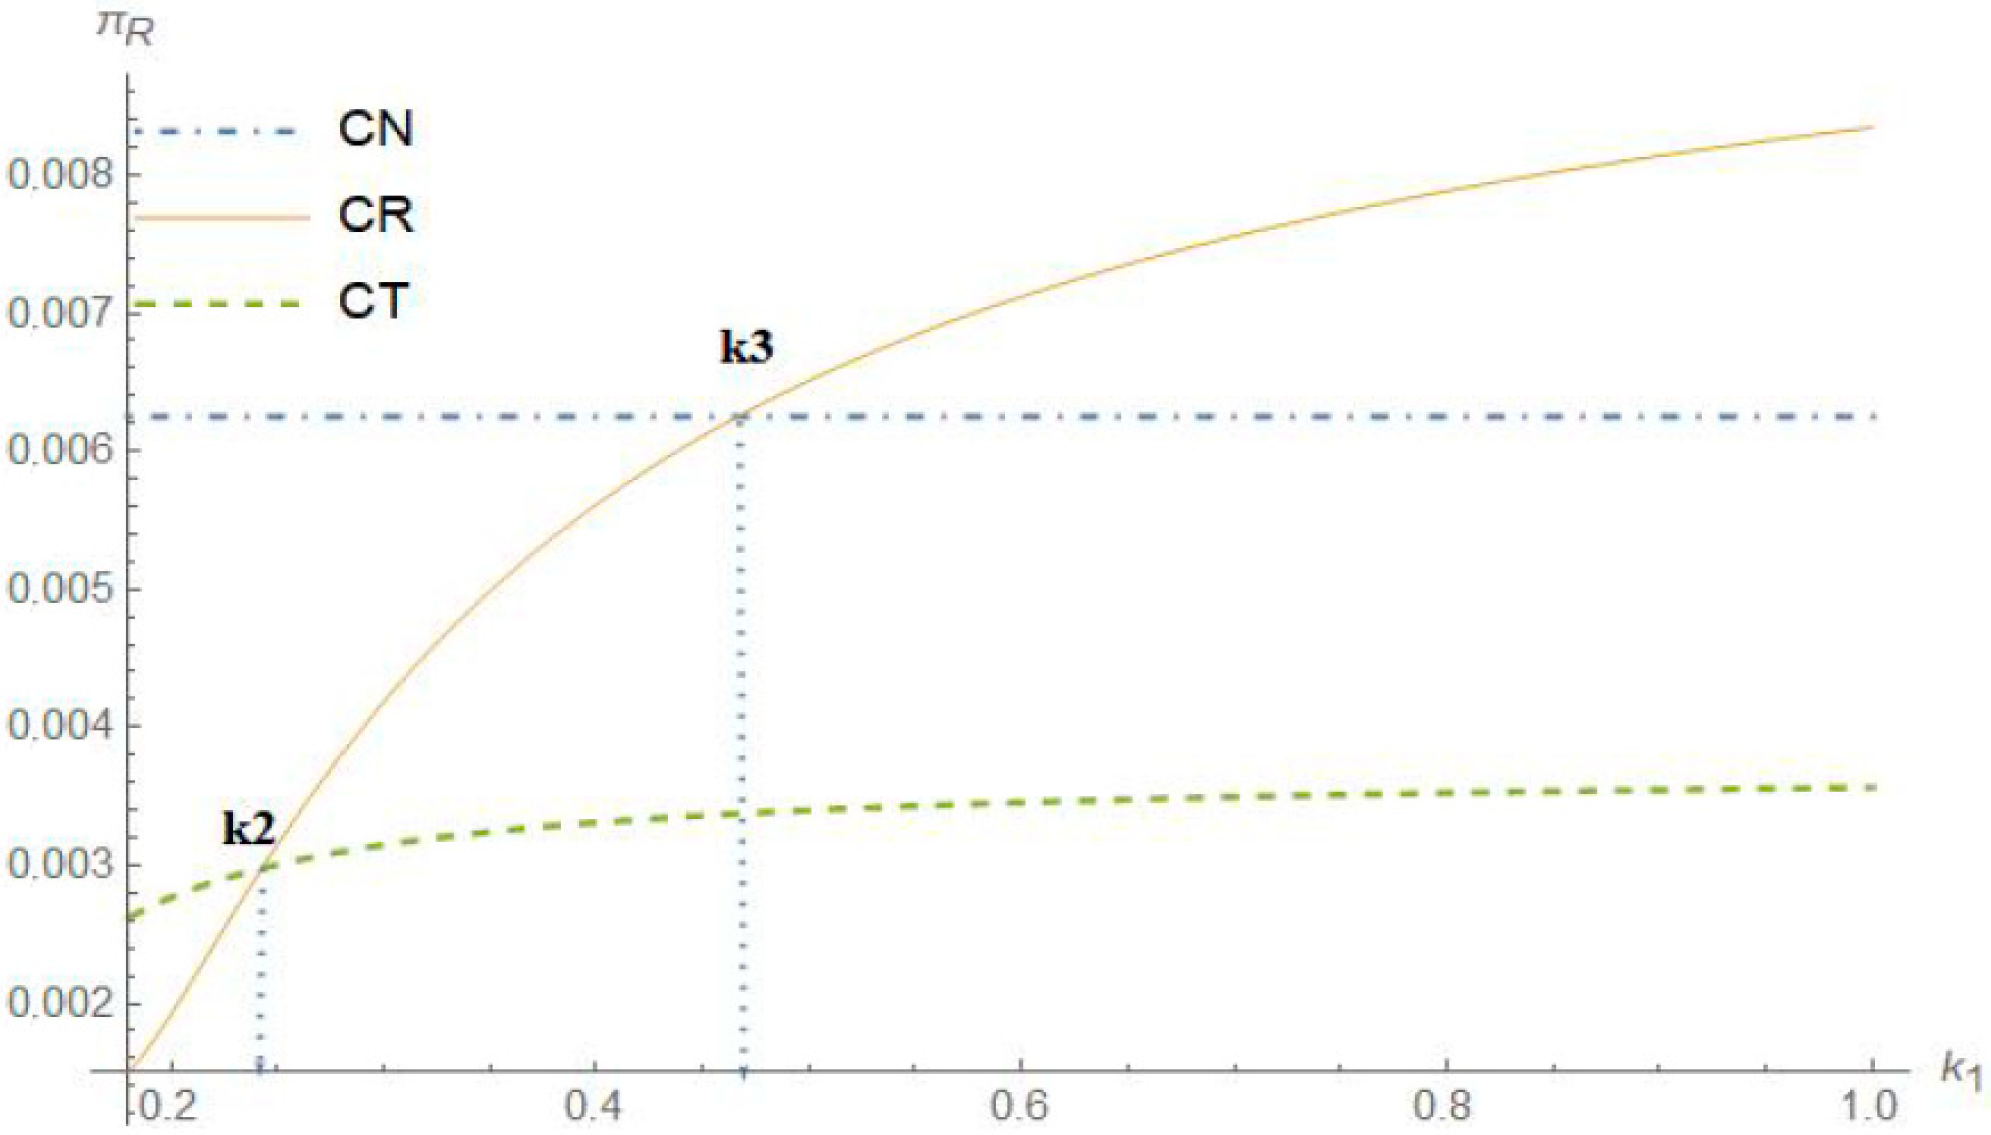
First, Theorem 7 and Theorem 10 can be observed more intuitively in Figure 8, Figure 11 and Figure 12. As can be seen from Figure 11 and Figure 12, there exists a threshold value of differentiated production cost parameters in the two cases of parallel export, below which the authorized distributor obtains higher profits in the case of parallel export by the third party, and above which the authorized distributor obtains higher profits in the case of parallel export by the authorized distributor. This is because, when the cost of differentiated production is low, Manufacturer 2 has a stronger incentive to carry out differentiated production, and in combination with Theorem 12, Manufacturer 2 sets the highest wholesale price in the case of authorized distributors carrying out parallel export of new energy vehicles, and therefore, the authorized distributors pay a higher price for the parallel export of new energy vehicles at this time, and the profit is lower. And when the cost of differentiated production is high, the incentive for Manufacturer 2 to carry out differentiated production decreases, and authorized distributors have a greater chance to gain higher profits by carrying out parallel export of new energy vehicles at this time.
Figure 8 also shows that the profits of authorized distributors will increase with the willingness to pay of consumers in Market 2 in the case of CN and CT, but decrease with that in the case of CR.
Figure 14 and Figure 15 visualize the proof of Theorem 7. There exists a threshold of consumers’ willingness to pay, above which authorized distributor profits are impaired in two cases of parallel exports. Further, we can find from Figure 8 and Figure 11 that there exists a threshold value of differentiated production cost parameters and consumer sensitivity to differentiated products in the two cases of parallel export, and when the level of differentiated production cost parameters is less than the threshold or consumer sensitivity to differentiated products is greater than the threshold, the authorized distributor obtains lower profits in the case of parallel exporting by the authorized distributor. This is because, when the cost of differentiated production is low or consumer sensitivity to differentiated products is high, Manufacturer 2 has a stronger incentive to carry out differentiated production, and in combination with Theorem 12, Manufacturer 2 sets the highest wholesale price in the case of authorized distributors carrying out parallel export of new energy vehicles, and therefore, the authorized distributors pay a higher price for the parallel export of new energy vehicles at this time, and the profit is lower. When the cost of differentiated production is high or consumer sensitivity to differentiated products is low, the incentive for Manufacturer 2 to carry out differentiated production decreases, and authorized distributors have a greater chance to gain higher profits by carrying out parallel export of new energy vehicles at this time.
When consumers in Market 2 are willing to pay more, authorized distributors should choose not to engage in parallel exports; when consumers in Market 2 are willing to pay less, if Manufacturer 2’s differentiated production cost parameter is large (greater than a certain threshold value), authorized distributors can choose to engage in parallel exports, but if Manufacturer 2’s differentiated production cost parameter is less than the threshold value, authorized distributors should choose not to engage in parallel exports.

7. Conclusions

In this paper, in the consideration of differentiated production of new energy vehicles sold overseas, by comparing and analyzing three cases of no parallel export of new energy vehicles, parallel export by authorized distributors and parallel export by the third party, we investigate the issues of differentiated production, members’ decisions on prices and sales scales, and the impact of parallel export of new energy vehicles by different subjects on the equilibrium solution and profits of the manufacturer and other members in supply chain. The main conclusions are as follows:
  • For Manufacturer 2
(1) Impact of parallel exports: Whether there is parallel export of new energy vehicles by the authorized distributor or a third party conducts parallel export of new energy vehicles, Manufacturer 2’s total sales profit is damaged.
(2) Impact of differentiated production: When there is no parallel export scenario, differentiated production by Manufacturer 2 in Market 1 can bring about an increase in sales volume and sales profit; when there is parallel export of new energy vehicles by the authorized distributor, the profit of Manufacturer 2 from differentiated production in Market 1 is lower than the profit of wholesaling the products to the authorized distributor in Market 2; when the third party conducts parallel export of new energy vehicles, Manufacturer 2’s profit from differentiated production in Market 1 is greater than its profit in Market 2.
(3) How manufacturers can strategize against parallel exports: Manufacturer 2 can influence the parallel export behavior of authorized distributors by controlling the wholesale price, or it can increase sales profits by increasing the consumer’s willingness to pay in Market 2 or by lowering the cost of carrying out differentiated production; Manufacturer 2 sets the highest wholesale price in the case of authorized distributors for the parallel export of new energy vehicles, and Manufacturer 2 sets the highest level of differentiated production in the case of the third party for the parallel export of new energy vehicles.
2.
For authorized distributors
(1) When the range of consumers’ willingness to pay in Market 2 is small and the maximum critical value is less than the threshold value, if Manufacturer 2 carries out differentiated production and the cost parameter is large (greater than a certain threshold value), authorized distributors can choose to carry out parallel exporting to obtain higher profits, and if Manufacturer 2 carries out differentiated production and the cost parameter is less than the threshold value, authorized distributors carry out parallel exporting to the damage of their own profits.
(2) Parallel export of new energy vehicles by a third party will harm the profit of authorized distributors.
Based on the above research, our findings have the following managerial implications:
(1) Since parallel exports (in both CR and CT cases) can damage manufacturers’ total profits, manufacturers should actively take measures to curb parallel exports of new energy vehicles, such as trying to enhance the irreplaceability of their products and consumers’ willingness to pay (e.g., by strengthening publicity and promotion, launching marketing campaigns, and increasing advertisements) in order to improve the competitiveness of their products; manufacturers can set up a market monitoring mechanism to keep abreast of the changes in consumers’ demand and accurately adjust the pricing of Market 2 and the sales of Market 1 accordingly; manufacturers need to fully assess the willingness of consumers to pay when exploring markets and prioritize markets with higher sales; when developing markets, manufacturers need to fully assess consumers’ willingness to pay and prioritize markets with higher willingness to pay; when facing authorized distributors’ (CR) parallel exports, Manufacturer 2 can set higher wholesale prices to directly compress the arbitrage space of authorized distributors; when facing third-party (CT) parallel exports, Manufacturer 2 can set higher levels of differentiated production.
(2) For authorized distributors’ parallel exports, the parallel export decision needs to avoid the self-inflicted trap—stop parallel exports immediately when the local willingness to pay and differentiated production costs are found to be high (so that exporting at this time will result in damage to one’s own profitability); since third-party parallel exports of new energy vehicles will damage the profitability of authorized distributors’ parallel exports, the authorized distributors may also cooperate with manufacturers to resist third-party parallel exports of new energy vehicles.
The research in this paper still has some deficiencies and can be further expanded in the future to include measures taken by manufacturers to inhibit the parallel export of new energy vehicles, cooperation between manufacturers and authorized distributors to inhibit the parallel export of new energy vehicles by a third party, and also the consideration of the situation of information uncertainty, which can further enrich the content of the research.

Author Contributions

L.S.: funding acquisition, conceptualization, and writing the original draft, Z.Z.: methodology, writing the original draft, and validation. H.L.: writing—review and editing. X.D.: investigation and supervision. All authors have read and agreed to the published version of the manuscript.

Funding

This work was supported by and the Humanities and Social Sciences Youth Foundation of the Anhui Higher Education Institutions of China (No. 2022AH030041).

Data Availability Statement

Data are contained within this article.

Conflicts of Interest

The authors declare that they have no known competing financial interests or personal relationships that could have appeared to influence the work reported in this paper.

Appendix A

The equilibrium market selling prices and profits.
Equilibrium market selling price and profit in the case of CR:
π M 1 C R = δ δ 2 θ θ β 2 4 δ 2 θ θ + 7 δ 16 θ a 2 + A 1 θ + 3 a 2 k 1 2 8 2 δ 2 θ θ + δ 4 θ a 2 2 B 1 + A 1 k 1 2
π M 2 C R = β 2 5 δ 8 θ 2 θ a 2 A 1 θ A 1 2 δ + 6 δ θ 2 θ 2 + 3 θ a 2 k 1 8 2 δ 2 θ θ + δ 4 θ a 2 B 1 + A 1 k 1
π R C R = a 2 δ θ 2 δ 4 θ a 2 2 B 1 + A 1 k 1 2 + θ 3 δ 4 θ θ 2 B 1 + A 1 k 1 + δ 4 θ a 2 β 2 δ A 1 k 1 2 4 δ 2 θ θ + 2 δ 4 θ a 2 2 2 B 1 + 2 A 1 k 1 2
p 11 C R = δ δ 2 θ θ 2 B 1 + A 1 k 1 + a 2 β 2 7 δ 16 θ + 3 A 1 k 1 4 2 δ 2 θ θ + δ 4 θ a 2 B 1 + A 1 k 1
p 22 C R = 1 2 a 2 1 + 5 δ 8 θ θ 4 δ 2 θ θ + 2 δ 4 θ a 2
p 31 C R = 3 δ 4 θ θ θ 2 B 1 + A 1 k 1 + a 2 β 2 7 δ 16 θ + 3 A 1 k 1 4 2 δ 2 θ θ + δ 4 θ a 2 B 1 + A 1 k 1
p 21 C R = β 2 θ 3 δ + 4 θ 5 δ + 8 θ a 2 A 1 θ A 1 + 4 θ 2 + θ δ 2 + 7 θ a 2 k 1 4 2 δ 2 θ θ + δ 4 θ a 2 B 1 + A 1 k 1
A 1 = δ 4 + θ 4 2 + θ θ ; B 1 = 2 β 2 δ 2 θ
Equilibrium market selling price and profit in the case of CT:
π M 1 C T = 2 δ δ 2 θ 4 β 2 δ 2 θ 4 θ + 3 a 2 + 4 θ A 1 + N 1 k 1 2 θ 64 β 2 δ 2 θ 2 + 32 δ 2 θ A 1 + 3 δ 4 θ 2 a 2 k 1 2
π M 2 C T = 2 A 1 2 k 1 3 δ 4 θ 2 a 2 2 k 1 + a 2 8 β 2 δ 2 θ 2 + 13 δ 20 θ A 1 k 1 64 β 2 δ 2 θ 2 + 32 δ 2 θ A 1 + 3 δ 4 θ 2 a 2 k 1
π R C T = a 2 16 β 2 δ 2 θ 2 + 5 δ 12 θ A 1 + 3 δ 4 θ 2 a 2 k 1 2 64 β 2 δ 2 θ 2 + 32 δ 2 θ A 1 + 3 δ 4 θ 2 a 2 k 1 2
π g C T = 4 β 2 δ 2 θ 4 3 δ 4 θ θ 3 δ 4 θ a 2 + 4 3 δ 4 θ θ A 1 + M 1 k 1 2 θ 64 β 2 δ 2 θ 2 + 32 δ 2 θ A 1 + 3 δ 4 θ 2 a 2 k 1 2
p 11 C T = δ δ 2 θ 4 β 2 δ 2 θ 4 θ + 3 a 2 + 4 θ A 1 + N 1 k 1 64 β 2 δ 2 θ 2 θ + θ 32 δ 2 θ A 1 + 3 δ 4 θ 2 a 2 k 1
p 21 C T = A 1 4 δ 4 + θ 16 2 + θ θ + 3 3 δ + 4 θ a 2 k 1 64 β 2 δ 2 θ 2 + 32 δ 2 θ A 1 + 3 δ 4 θ 2 a 2 k 1
p 22 C T = a 2 48 β 2 δ 2 θ 2 + 27 δ 52 θ A 1 k 1 64 β 2 δ 2 θ 2 + 32 δ 2 θ A 1 + 3 δ 4 θ 2 a 2 k 1
p 31 C T = 3 δ 4 θ 4 β 2 δ 2 θ 4 θ + 3 a 2 + 4 θ A 1 + N 1 k 1 64 β 2 δ 2 θ 2 + 32 δ 2 θ A 1 + 3 δ 4 θ 2 a 2 k 1

Appendix B

w 1 = θ a 2 7 δ 2 + 32 δ θ 32 θ 2 + δ 4 θ 3 δ 4 θ q 21 + δ 2 θ 2 3 δ 4 θ 2 a 2 2 4 3 δ 4 θ 2 θ 2 1 + q 21 2 + 4 θ a 2 7 δ 2 36 δ θ + 36 θ 2 2 δ 4 θ 3 δ 4 θ q 21 δ 2 θ 2 θ a 2 4 δ 2 θ 2 θ + δ 4 θ 2 a 2
w 2 = θ a 2 7 δ 2 32 δ θ + 32 θ 2 δ 4 θ 3 δ 4 θ q 21 + δ 2 θ 2 3 δ 4 θ 2 a 2 2 4 3 δ 4 θ 2 θ 2 1 + q 21 2 + 4 θ a 2 7 δ 2 36 δ θ + 36 θ 2 2 δ 4 θ 3 δ 4 θ q 21 δ 2 θ 2 θ a 2 4 δ 2 θ 2 θ + δ 4 θ 2 a 2
b 3 = 3 δ 2 θ θ 4 β 2 δ 2 θ + δ 4 + θ 4 2 + θ θ k 1 β 2 δ 2 + 10 δ θ 32 θ 2 + δ 2 4 + θ + 2 δ 24 7 θ θ + 40 2 + θ θ 2 k 1
b 4 = 2 θ 7 β 2 δ 2 22 β 2 δ θ + 16 β 2 θ 2 8 δ 2 k 1 + 24 δ θ k 1 + 2 δ 2 θ k 1 16 θ 2 k 1 10 δ θ 2 k 1 + 8 θ 3 k 1 δ + 4 θ 3 β 2 δ + 8 β 2 θ + 12 δ k 1 24 θ k 1 3 δ θ k 1 + 12 θ 2 k 1
k 2 = β 2 4 θ 2 3 δ 2 10 δ θ + 8 θ 2 + δ θ 3 δ + 8 θ a 2 + 4 δ 2 6 δ θ + 8 θ 2 a 2 2 θ 2 3 δ 2 4 + θ + 16 2 + θ θ 2 8 δ θ 5 + 2 θ + 4 θ 2 δ 4 + θ 4 2 + θ θ a 2 2 δ 2 4 + θ 8 δ 3 + θ θ + 16 2 + θ θ 2 a 2 2
k 3 = β 4 δ 4 θ 3 δ 4 θ 2 θ a 2 θ + 3 a 2 2 δ 2 θ θ + δ 4 θ a 2 2 δ 4 + θ 4 2 + θ θ 2 3 δ 4 θ θ δ 4 θ a 2 3 δ 4 θ θ 2 δ 4 θ a 2 2 θ + 3 a 2 2 + k 2
b 5 = w δ 4 w θ 4 δ θ + 4 θ 2 + 6 δ θ q 21 8 θ 2 q 21 + 8 w δ 4 θ δ 2 θ θ + w δ 4 θ + 4 θ δ + θ + 2 3 δ 4 θ θ q 21 2 2 δ 4 θ

References

  1. Zhang, J. The benefits of consumer rebates: A strategy for gray market deterrence. Eur. J. Oper. Res. 2016, 251, 2–509. [Google Scholar] [CrossRef]
  2. Ding, L.; Hu, B.; Ke, C.; Wang, T.; Chang, S. Effects of IoT technology on gray market: An analysis based on traceability system design. Comput. Ind. Eng. 2019, 136, 80–94. [Google Scholar] [CrossRef]
  3. Cao, Q.; Zhang, J. Gray market’s product quality in the circular economy era. Int. J. Prod. Res. 2020, 58, 308–331. [Google Scholar] [CrossRef]
  4. Jiang, Z.; Zhao, J.; Yi, Z.; Zhao, Y. Inducing information transparency: The roles of gray market and dual-channel. Ann. Oper. Res. 2023, 329, 277–306. [Google Scholar] [CrossRef]
  5. Iravani, F.; Dasu, S.; Ahmadi, R. Beyond price mechanisms: How much can service help manage the competition from gray markets? Eur. J. Oper. Res. 2016, 252, 789–800. [Google Scholar] [CrossRef]
  6. Taleizadeh, A.A.; Hadadpour, S.; Cárdenas-Barrón, L.E.; Shaikh, A.A. Warranty and price optimization in a competitive duopoly supply chain with parallel importation. Int. J. Prod. Econ. 2017, 185, 76–88. [Google Scholar] [CrossRef]
  7. Li, H.; Shao, J.; Zhu, S.X. Impacts of power dynamics and gray markets on supply chains. Int. J. Prod. Econ. 2020, 222, 107488. [Google Scholar] [CrossRef]
  8. Huang, H.; He, Y.; Chen, J. Cross-market selling channel strategies in an international luxury brand’s supply chain with gray markets. Transp. Res. Part E Logist. Transp. Rev. 2020, 144, 102157. [Google Scholar] [CrossRef]
  9. Ding, L.; Yuan, H.; Hu, B. Adopt or not: Manufacturers’ RFID decisions for gray marketing in a competitive environment. Comput. Ind. Eng. 2021, 151, 106957. [Google Scholar] [CrossRef]
  10. Tsunoda, Y. When should a firm set its selling price to cope with gray market trade? Manag. Decis. Econ. 2022, 43, 16–25. [Google Scholar] [CrossRef]
  11. Wang, M.; Li, Y.; Li, M.; Wan, L.; Miao, L.; Wang, X. A comparative study on recycling amount and rate of used products under different regulatory scenarios. J. Clean. Prod. 2019, 235, 1153–1169. [Google Scholar] [CrossRef]
  12. Liu, L.; Zhao, Q.; Goh, M. Perishable material sourcing and final product pricing decisions for two-echelon supply chain under price-sensitive demand. Comput. Ind. Eng. 2021, 156, 107260. [Google Scholar] [CrossRef]
  13. Chai, J.; Yan, W.; Li, Y.; Palmer, M.; Huang, Q. Selling vertically differentiated products under one channel or two? A quality segmentation model for differentiated distribution channels. J. Oper. Res. Soc. 2020, 71, 1180–1198. [Google Scholar] [CrossRef]
  14. Stamatopoulos, I.; Tzamos, C. Design and Dynamic Pricing of Vertically Differentiated Inventories. Manag. Sci. 2019, 65, 4222–4241. [Google Scholar] [CrossRef]
  15. Caravaggio, A.; Gori, L.; Sodini, M. Monopolistic Dynamics with Endogenous Product Differentiation. Mathematics 2022, 10, 302. [Google Scholar] [CrossRef]
  16. Zheng, Q.; Pan, X.A.; Carrillo, J.E. Probabilistic Selling for Vertically Differentiated Products with Salient Thinkers. Mark. Sci. 2019, 38, 365–541. [Google Scholar] [CrossRef]
  17. Müller, C. Practicable solution approaches for differentiated pricing of vehicle sharing systems. Cent. Eur. J. Oper. Res. 2025, 33, 145–190. [Google Scholar] [CrossRef]
  18. Keskin, N.B.; Birge, J.R. Dynamic Selling Mechanisms for Product Differentiation and Learning. Oper. Res. 2019, 67, 1069–1089. [Google Scholar] [CrossRef]
  19. Tookanlou, P.B.; Wong, H. Determining the optimal customization levels, lead times, and inventory positioning in vertical product differentiation. Int. J. Prod. Econ. 2020, 221, 107479. [Google Scholar] [CrossRef]
  20. Lu, T.; Chen, Y.J.; Tomlin, B.; Wang, Y. Selling Co-Products through a Distributor: The Impact on Product Line Design. Prod. Oper. Manag. 2019, 28, 1010–1032. [Google Scholar] [CrossRef]
  21. Tang, Z.; Wang, M.; Chen, Z.; Sun, J.; Wang, M.; Zhao, M. Design of Multi-Stage Gear Modification for New Energy Vehicle Based on Optimized BP Neural Network. IEEE Access 2020, 8, 199034–199050. [Google Scholar] [CrossRef]
  22. Yan, S.; Zhang, X.; Gao, Z.; Wang, A.; Zhang, Y.; Xu, M.; Hua, S. Design Optimization of a New Hybrid Excitation Drive Motor for New Energy Vehicles. World Electr. Veh. J. 2023, 14, 4. [Google Scholar] [CrossRef]
  23. Zhang, H.; Li, N.; Lin, J. Modeling the Decision and Coordination Mechanism of Power Battery Closed-Loop Supply Chain Using Markov Decision Processes. Sustainability 2024, 16, 4329. [Google Scholar] [CrossRef]
  24. Li, X.; Li, Y. NEV’s Supply Chain Coordination with Financial Constraint and Demand Uncertainty. Sustainability 2022, 14, 1114. [Google Scholar] [CrossRef]
  25. Ma, M.; Meng, W.; Li, Y.; Huang, B. Supply chain coordination strategy for NEVs based on supplier alliance under dual-credit policy. PLoS ONE 2021, 16, e257505. [Google Scholar] [CrossRef] [PubMed]
  26. Zhao, J.; Zeng, D.; Che, L.; Zhou, T.; Hu, J. Research on the profit change of new energy vehicle closed-loop supply chain members based on government subsidies. Environ. Technol. Innov. 2020, 19, 100937. [Google Scholar] [CrossRef]
  27. Wang, Y.; Zhang, X.; Cheng, T.C.E.; Wu, T. Choice of the co-opetition model for a new energy vehicle supply chain under government subsidies. Transp. Res. Part E Logist. Transp. Rev. 2023, 179, 103326. [Google Scholar] [CrossRef]
  28. Zhang, W.; Liu, X.; Zhu, L.; Wang, W.; Song, H. Pricing and production R&D decisions in power battery closed-loop supply chain considering government subsidy. Waste Manag. 2024, 190, 409–422. [Google Scholar] [CrossRef]
  29. Gong, B.; Xia, X.; Cheng, J. Supply-Chain Pricing and Coordination for New Energy Vehicles Considering Heterogeneity in Consumers’ Low Carbon Preference. Sustainability 2020, 12, 1306. [Google Scholar] [CrossRef]
  30. Li, H.; Shao, J.; Zhu, S.X. Parallel importation in a supply Chain: The impact of gray market structure. Transp. Res. Part E Logist. Transp. Rev. 2018, 114, 220–241. [Google Scholar] [CrossRef]
  31. Ishikawa, J.; Morita, H.; Mukunoki, H. Parallel imports and repair services. J. Econ. Behav. Organ. 2020, 172, 137–160. [Google Scholar] [CrossRef]
  32. Hu, Q.; Mizuno, T. Profitable gray market with asymmetric costs. Appl. Econ. Lett. 2024, 2319, 1–5. [Google Scholar] [CrossRef]
  33. Fauli Oller, R.; Poddar, S.; Sandonis, J. Mergers and Licensing with Horizontal Differentiation. J. Public Econ. Theory 2024, 26, 70004. [Google Scholar] [CrossRef]
  34. Wang, Y.; Hug, S.; Irek, J.; Finger, R. Product differentiation, quality, and milk price stability: The case of the Swiss cheese market. Appl. Econ. Perspect. Policy 2025, 47, 416–435. [Google Scholar] [CrossRef]
  35. Wang, Z.; Zhu, C.; Tian, S.; Li, P. Differentiation and pricing power of online retailers. Front. Bus. Res. China 2019, 13, 5. [Google Scholar] [CrossRef]
  36. Xu, Y.; Han, L.; Li, X.; Zhu, W.; Ren, H. Evolutionary Game-Based New Energy Vehicle Supply Chain Strategies That Consider Carbon Reduction and Consumers’ Low-Carbon Preferences. Systems 2024, 12, 328. [Google Scholar] [CrossRef]
  37. Guo, R.; He, Y.; Tian, X.; Li, Y. New energy vehicle battery recycling strategy considering carbon emotion from a closed-loop supply chain perspective. Sci. Rep. 2024, 14, 688. [Google Scholar] [CrossRef]
  38. Yang, D.; Qiu, L.; Yan, J.; Chen, Z.; Jiang, M. The government regulation and market behavior of the new energy automotive industry. J. Clean. Prod. 2019, 210, 1281–1288. [Google Scholar] [CrossRef]
Figure 1. The supply chain structure of CR.
Systems 13 00662 g001
Figure 2. The supply chain structure of CT.
Systems 13 00662 g002
Figure 3. The sequence of game stages in the scenario of CN.
Systems 13 00662 g003
Figure 4. The sequence of game stages with authorized distributors’ parallel export.
Systems 13 00662 g004
Figure 5. The sequence of game stages when the third party conducts parallel export.
Systems 13 00662 g005
Figure 6. M2’s profits and wholesale vary with a 2 .
Systems 13 00662 g006
Figure 7. M1’s profits vary with a 2 .
Systems 13 00662 g007
Figure 8. R’s profits vary with a 2 .
Systems 13 00662 g008
Figure 9. M2’s profits vary with k 1 .
Systems 13 00662 g009
Figure 10. M1’s profits vary with k 1 .
Systems 13 00662 g010
Figure 11. R’s profits vary with k 1 ( a 2 < a * ).
Systems 13 00662 g011
Figure 12. R’s profits vary with k 1 ( a 2 > a * ).
Systems 13 00662 g012
Figure 13. Differentiated production levels vary with k 1 .
Systems 13 00662 g013
Figure 14. R’s profits vary with k 1 and β ( a 2 < a * ).
Systems 13 00662 g014
Figure 15. R’s profits vary with k 1 and β ( a 2 > a * ).
Systems 13 00662 g015
Table 1. Comparison of related literature.
PaperParallel Import ParticipantsWhether to Consider DifferentiationField of Research
Jiang et al. (2023) [4]Authorized distributorsnonone
Li et al. (2018) [30]Authorized distributors, third-party speculatorsnonone
Ishikawa et al. (2020) [31]Third-party speculatorsnonone
Hu and Mizuno (2024) [32]Third-party speculatorsnonone
Fauli Oller et al. (2024) [33]Noneyesnone
Wang et al. (2025) [34] Noneyescheese market
Wang et al. (2019) [35]Noneyesnone
Xu et al. (2024) [36]Noneyesnew energy vehicle
Guo et al. (2024) [37] Nonenonew energy vehicle
Yang et al. (2019) [38]Nonenonew energy vehicle
This paperAuthorized distributors, third-party speculatorsyesnew energy vehicle
Table 2. Key notations in the model.
NotationDefinition
u i j Consumers’ utility gained from purchasing a product i in the market j ( i = 1, 2, 3; j = 1, 2)
δ Product 1’s brand recognition
θ New energy parallel export recognition
w Wholesale prices for product 2
v 1 Consumer willingness to pay in Market 1
c Manufacturer 2 differentiated production levels
β Consumer sensitivity to differentiated products
k 1 Differentiated production cost parameters
v 2 Consumer willingness to pay in Market 2
p i j Selling price of the product i in the market j
q i j Sales of the product i in the market j
π M 1 Manufacturer 1’s profit
π M 2 Manufacturer 2’s profit
π 1 M 2 Manufacturer 2’s profit in Market 1
π 2 M 2 Manufacturer 2’s profit in Market 2
π R Authorized distributor’s profit
π g Profitability of the parallel export of new energy vehicles by a third party
Table 3. Effect of parameters on the optimal decisions (+: increasing; −: decreasing).
Case θ δ
CN q 21 0 +
c 0 +
w 00
CR q 21 + +
c + +
w +
CT q 21 + k 1 < k 2 + ; k 1 k 2
c + k 1 < k 2 + ; k 1 k 2
w +
Table 4. The impact of parameters on the optimal decisions (+: increasing; −: decreasing).
CNCRCT
β k 1 β k 1 β k 1
q 21 + + +
c + + +
w 0000 +
Disclaimer/Publisher’s Note: The statements, opinions and data contained in all publications are solely those of the individual author(s) and contributor(s) and not of MDPI and/or the editor(s). MDPI and/or the editor(s) disclaim responsibility for any injury to people or property resulting from any ideas, methods, instructions or products referred to in the content.