Article

A System Dynamics-Based Hybrid Digital Twin Model for Driving Green Manufacturing

1
School of Economics and Management, Nanjing Tech University, Nanjing 211186, China
2
School of Economics and Management, Nanjing University of Aeronautics and Astronautics, Nanjing 210016, China
*
Author to whom correspondence should be addressed.
Systems 2025, 13(8), 651; https://doi.org/10.3390/systems13080651 (registering DOI)
Submission received: 4 June 2025 / Revised: 20 July 2025 / Accepted: 23 July 2025 / Published: 1 August 2025
(This article belongs to the Section Systems Engineering)

Abstract

Green manufacturing has emerged as a critical objective in the evolution of advanced production systems. Although digital twin technology is widely recognized for enhancing efficiency and promoting sustainability, the majority of existing research focuses exclusively on physical systems. They neglect the impact of soft systems, including human behavior, decision-making, and operational strategies. To address this limitation, the present study introduces an innovative hybrid digital twin model that integrates both physical and soft systems to support green manufacturing initiatives comprehensively. The primary contributions of this work are threefold. First, a novel hybrid architecture is developed by coupling real-time physical data with virtual soft system components that simulate factory operations. Second, lean production principles are systematically incorporated into the soft system, thereby facilitating reduced energy consumption and minimizing environmental impact. Third, a parameter-driven programming model is formulated to correlate critical variables with green performance metrics, and a genetic algorithm is utilized to optimize these variables, ultimately enhancing sustainability outcomes. This integrated approach not only expands the applicability of digital twin technology but also offers a data-driven decision-support tool for the advancement of green manufacturing practices.

1. Introduction

Digital twin (DT) technology has rapidly emerged as a cornerstone of Industry 4.0, conferring unparalleled capabilities for real-time monitoring, predictive analysis, and process optimization across sectors such as aerospace, healthcare, transportation, and manufacturing [1,2,3]. By constructing high-fidelity virtual counterparts of physical assets—integrating sensor streams, historical records, and advanced analytics—digital twins enable stakeholders to anticipate equipment failures, streamline workflows, and accelerate design iterations [4,5,6]. Despite the wealth of studies demonstrating DTs’ capacity to enhance throughput and reduce maintenance costs, their strategic deployment for environmental sustainability remains relatively underexplored [7]. In response, the present study harnesses the inherent strengths of DTs to propel green manufacturing, advancing beyond conventional production-centric applications to target reductions in energy intensity, material waste, and carbon footprint throughout the product lifecycle [1].
In pursuit of this objective, we introduce a hybrid digital twin framework grounded in system dynamics (SD) modeling. Unlike traditional DT implementations that focus narrowly on the geometric and mechanical fidelity of machinery [8,9], our approach integrates the feedback structures and time-delay effects characteristic of complex socio-soft systems. System dynamics offers a rigorous means to capture nonlinear interactions among inventory levels, production rates, and resource utilization, while concurrently accommodating the dynamic behaviors of human operators and decision-making protocols. By embedding these human-centric elements alongside the physical asset models, the proposed hybrid DT more faithfully mirrors real-world shop-floor operations [10], thereby overcoming mismatches between virtual simulations and actual performance that have received limited prior exploration.
Moreover, this framework extends beyond the “machine-and-sensor” paradigm by incorporating enterprise-level operational mechanisms into the digital twin. Contemporary DT studies largely emphasize equipment health and process variables, yet often neglect managerial levers such as production planning, quality assurance, and sustainability policy enforcement [11,12,13,14]. Our model bridges this gap by mapping how alterations in organizational policies propagate through production workflows and manifest as changes in environmental indicators. Consequently, manufacturers can employ the digital twin not only to detect equipment anomalies but also to evaluate strategic interventions—such as adjusting batch sizes or modifying supplier selection criteria—in energy consumption and emissions.
A further innovation lies in embedding lean manufacturing principles within the system dynamics layer of the digital twin. Lean tools are systematically represented as feedback loops that influence both process efficiency and resource flow [15,16,17]. This integrative treatment permits simulation of lean interventions at multiple scales, from workstation layout changes to enterprise-wide policy shifts, enabling a holistic appraisal of how waste-reduction strategies contribute to sustainability targets. By aligning lean and green objectives within a unified digital environment, the model furnishes decision makers with a powerful tool for optimizing operations in harmony with environmental imperatives.
In summary, this study makes four key contributions: (1) the development of a system dynamics-based hybrid digital twin that synthesizes physical, human, and organizational dynamics; (2) the inclusion of human operator behavior to enhance predictive accuracy in shop-floor simulations; (3) the integration of enterprise governance mechanisms to extend the DT’s utility to strategic decision support; and (4) the formal embedding of lean methodologies to quantify their impact on sustainability performance. Collectively, these innovations offer a comprehensive, scalable architecture for driving green manufacturing, thereby equipping enterprises with the analytical foresight needed to achieve both operational excellence and environmental stewardship.

2. Literature Review

Digital twins are driven by multi-dimensional virtual models and integrated data, and through the establishment of high-fidelity, multi-scale, and multi-physical-field dynamic virtual mappings of physical entities, they achieve real-time monitoring, simulation analysis, predictive optimization, and closed-loop control. In products, processes, or systems, digital twins can be applied to various levels of manufacturing through multiple potential ways [18]. Digital twins play a significant role in industrial operations, covering aspects such as production, predictive maintenance, and after-sales services [19]. With the development of technologies such as the Internet of Things (IoT), artificial intelligence, cloud computing, big data, and advanced modeling and simulation, the connotation of digital twins is constantly expanding. Digital twins involve information exchange between the two spaces of sensors, data, and models [20]. Each physical device will have its network part as the digital representation of the real device, eventually forming a digital twin model [21]. Therefore, digital twins can monitor and control physical entities, while physical entities can send data to update and synchronize their virtual models. More recently, scholars have proposed considering human digital twins, emphasizing the people-oriented digital twins based on human–machine cooperation [22,23]. Although the definition of digital twins is constantly changing, the two-way communication between the physical space and the virtual space remains one of its significant characteristics.
Digital twins are currently widely applied in many fields: initially in aerospace and high-end manufacturing, and then expanding to energy, agriculture, transportation, and smart cities [24]. However, the soft operational systems have not yet been studied and designed. Digital twin technology plays a significant role in the maintenance field, the construction sector, as well as product design and development. [25,26,27]. The application of digital twins in urban development, engineering, and other fields still faces challenges and limitations [28,29]. As digital twins develop, they are gradually being used to support manufacturing process decisions, promoting research on production scheduling problems. The dynamic production scheduling strategy for the workshop, constructed based on digital twin technology, successfully dealt with unexpected situations in production and improved the production efficiency of the workshop [30]. When applying digital twin technology in workshop production scheduling, human factors are gradually being taken into consideration. For the workshop scheduling problem, some studies have incorporated the multi-memory process of workers and proposed a dynamic scheduling strategy driven by a digital twin [31]. Moreover, the dynamic scheduling strategy based on digital twin technology effectively solved the re-scheduling problems caused by unexpected events such as order insertion and employee absence [32]. Although current research considers human behavior, it lacks consideration of soft operational system factors such as management and organizational coordination. Traditional digital twins focus on the physical mapping of equipment, while soft operational systems achieve simulation of complex operational systems through integrated management strategies and human behavior integration.
The soft operation system in the production workshop is essentially a complex network composed of multiple layers of soft elements, including lean management systems, material flow systems, organizational behaviors, etc. These elements not only have dynamic characteristics of their own, but also have nonlinear feedback structures with interconnections. The intricate relationships are difficult to capture using traditional modeling methods. Systems dynamics has unique advantages in analyzing feedback loops and modeling delay effects. System dynamics is a modeling approach designed to analyze and simulate the behavior of dynamically complex systems over time [33]. In SD, a complex world can be realized, which includes feedback loops composed of root causes; can integrate multiple data scales of heterogeneous physical fields existing on various platforms; and can control multiple event ranges, thereby better constructing integrated models [34]. SD (system dynamics) can effectively handle unexpected situations in multi-entity collaboration and is an ideal tool for constructing complex networks of “organization–personnel–process”. A collaborative evolution model has been proposed, which explains the interrelationships among multiple digital twins and determines the qualitative and quantitative characteristics of system behavior [35]. Another study shows that the digital twin models of complex network systems established using dynamic methods have a high degree of match with reality [36]. When this capability is extended to the strategic level, researchers have proposed an integrated knowledge visualization and enterprise digital twin system, which utilizes system dynamics modeling to support strategic management decisions [37]. Their work demonstrates how SD within a DT framework can provide continuous adaptation and improved practices for dynamic business environments by simulating future scenarios and visualizing the impact of decisions.
The modeling capability of system dynamics for complex networks provides a foundation for accurately depicting and optimizing the core operational logic of manufacturing systems within the digital twin framework, especially for eliminating waste in lean production activities. The management concept of lean production prioritizes the reduction or elimination of waste in value chain processes, applying all principles, methods, and procedures for modern organization and management within the company [38]. There have been studies conducted on the relationship between the use of lean manufacturing, factory digitization, and operational performance [39]. The research results showed that both lean manufacturing and factory digitization contribute to improving operational performance, demonstrating the significant role of lean production in enterprise operations. Incorporating lean methods into the modeling helps accelerate processes, reduce waste, and thereby promote green manufacturing and sustainable development. The use of digital twins in manufacturing can also enhance the effectiveness of manufacturing [40]. In summary, integrating the lean production concept into the system dynamics level of digital twins helps enterprises conduct strategic evaluations based on both lean and green goals, and expand the digital twin system to strategic decision-making.

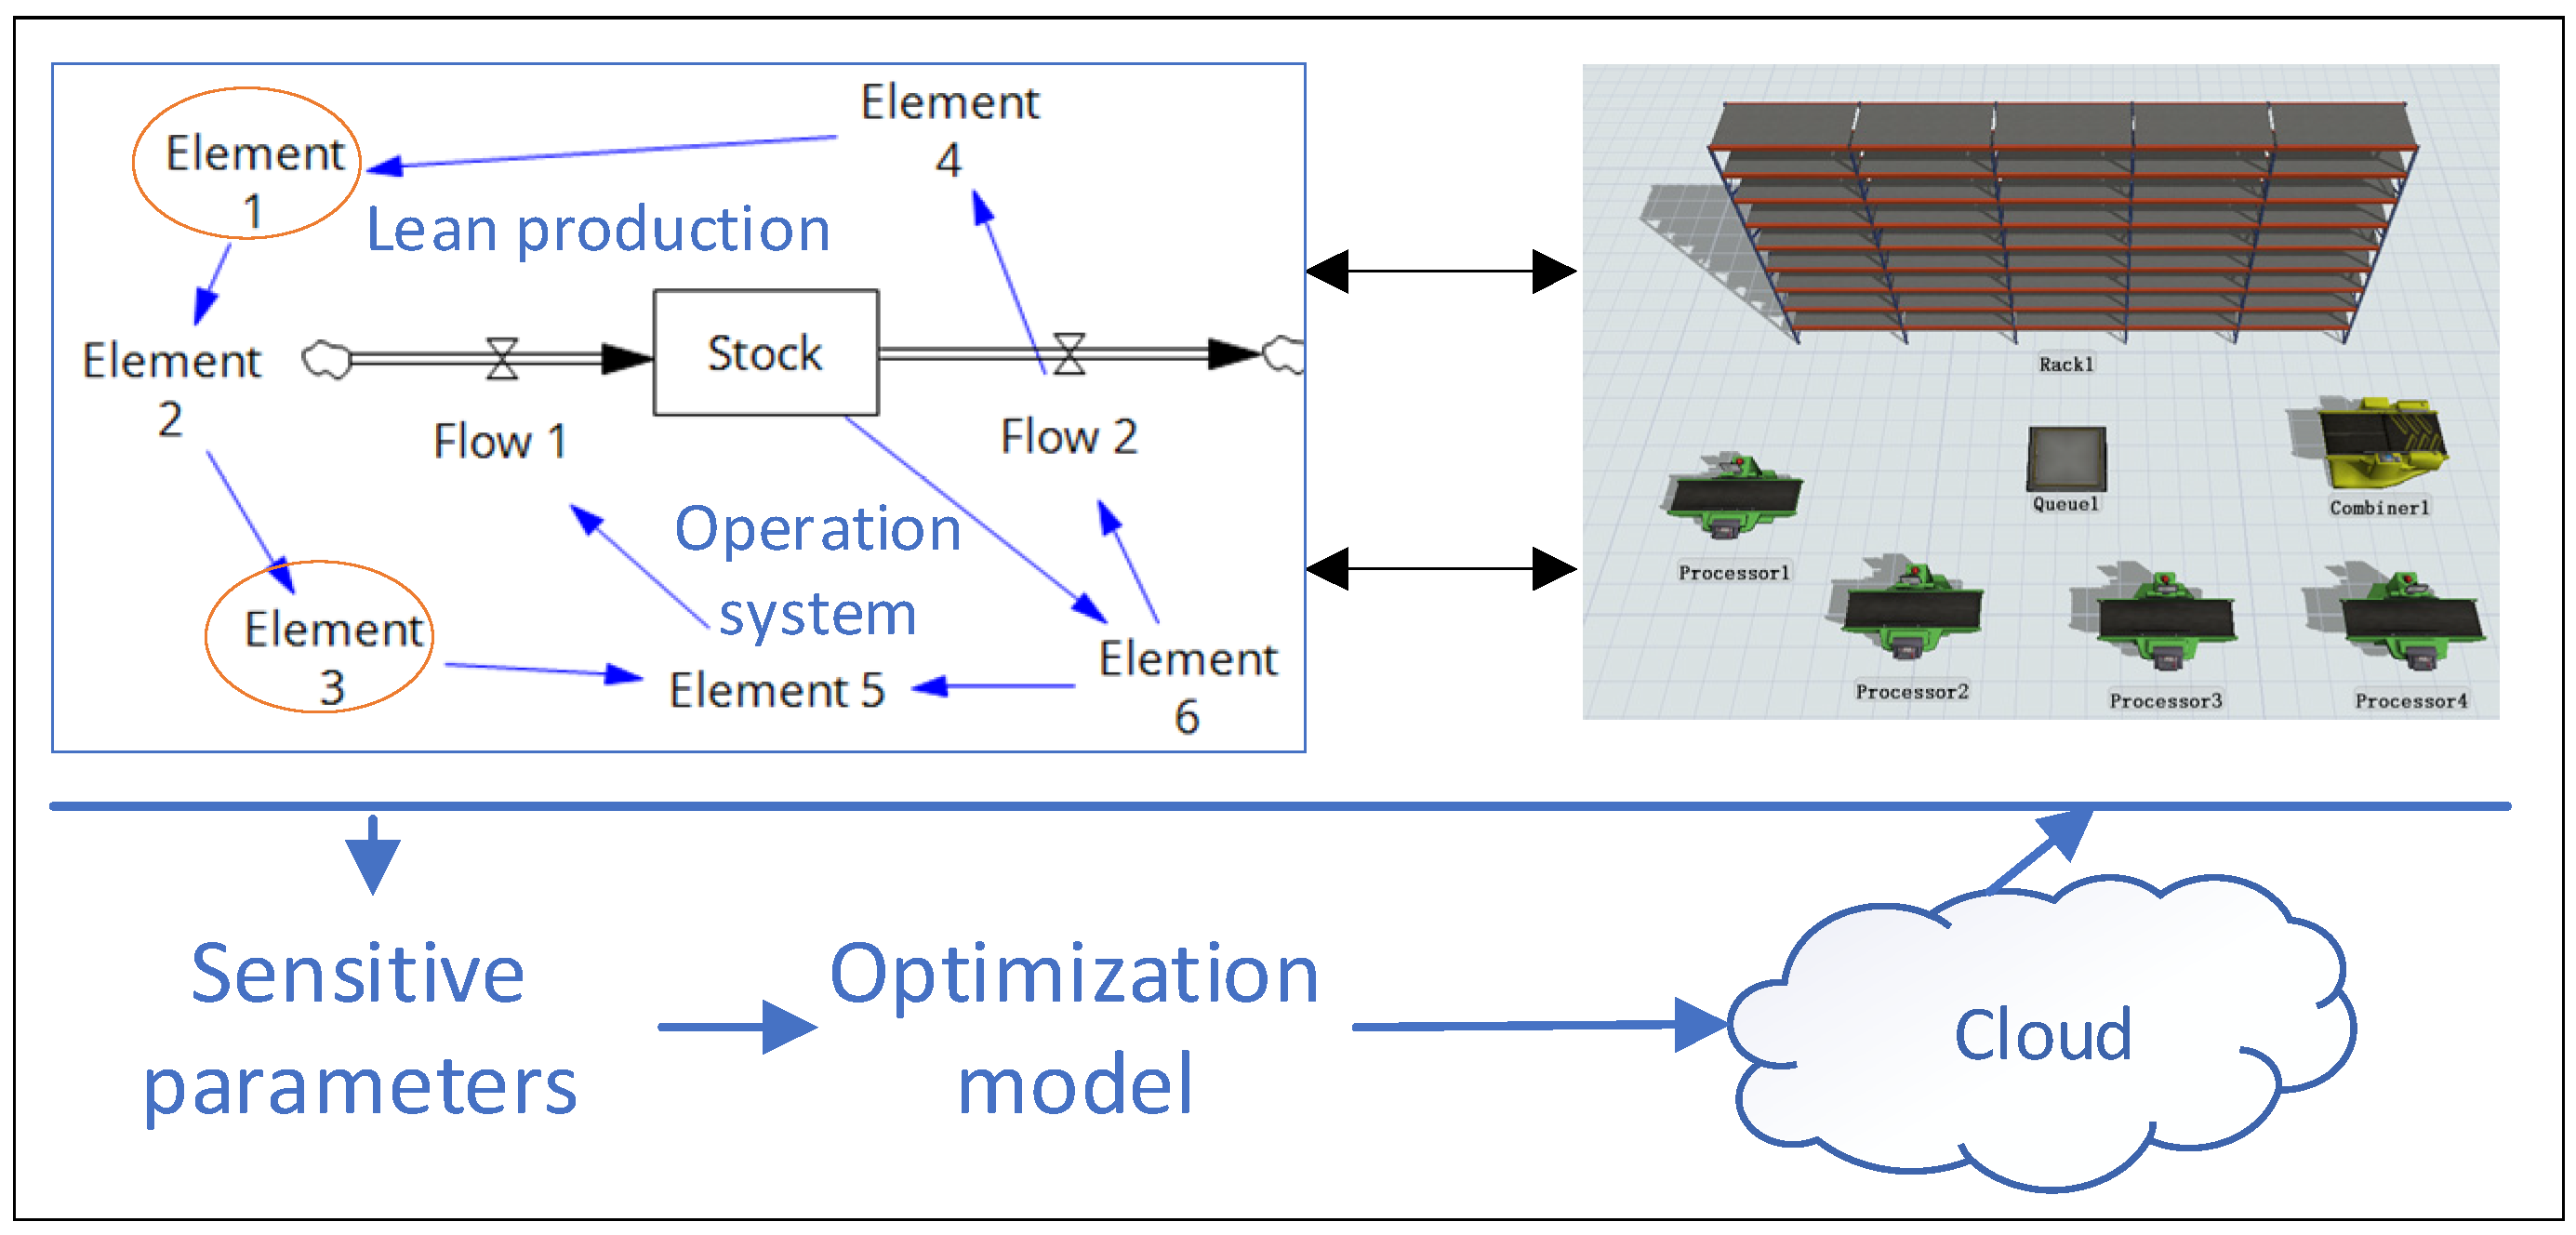
3. The Operation of the Hybrid Digital Twin Model

In this section, we introduce how to establish the hybrid digital twin model. Firstly, we should define the boundary of the digital twin model. We only focus on the operation in the factory. The finance of enterprises, organizational structure, and remuneration are not considered in our system. Certainly, we divide the digital twin model into the soft system and the physical system in the factory. The soft systems include the working time inspection system, etc. The physical system includes the equipment and the logistics equipment. The framework is shown in Figure 1.
In this study, we develop a hybrid system framework to represent and support production processes in modern manufacturing. While existing digital twin research predominantly focuses on physical systems—machines, materials, and shop-floor data flows—soft systems, encompassing production philosophies, human behaviors, and managerial decision-making, have received limited attention. To address this gap, we integrate both physical and soft dimensions within a unified modeling architecture. Specifically, we extend the digital twin paradigm by incorporating soft system elements—including production culture, worker psychological dynamics, and their interactions—often overlooked in previous studies.
First, departing from prior work that treats physical and non-physical aspects separately, we model their bidirectional interactions. This enables the soft system to transfer intention, decision, and constraint data to guide the physical system, while the physical system provides real-time feedback to update and refine soft system states, establishing a closed feedback loop. Second, to ensure synchronization between the subsystems, we propose a cloud-based architecture facilitating real-time data exchange, consistency maintenance, and mutual adaptation. Third, we embed lean production principles directly into the soft system layer. Rather than treating lean tools as isolated practices, we model interdependencies among elements such as waste elimination, value stream mapping, and continuous improvement, analyzing their interactions within the broader socio-technical system. This integrative approach addresses a clear gap in the literature and offers a more holistic understanding of how soft and physical systems co-evolve in green and intelligent manufacturing environments.
The proposed hybrid digital twin integrates physical systems (machines, logistics equipment, inventory areas) and soft systems (quality control, maintenance, production planning) into a unified architecture. This integration enables bidirectional data flow:
(1)
Physical System Layer: Captures real-time equipment states and material flows via IoT sensors;
(2)
Soft System Layer: Embeds system dynamics (SD) to model human/organizational factors (e.g., operator behavior, mutual influence) and lean principles (e.g., SMED, 5S);
(3)
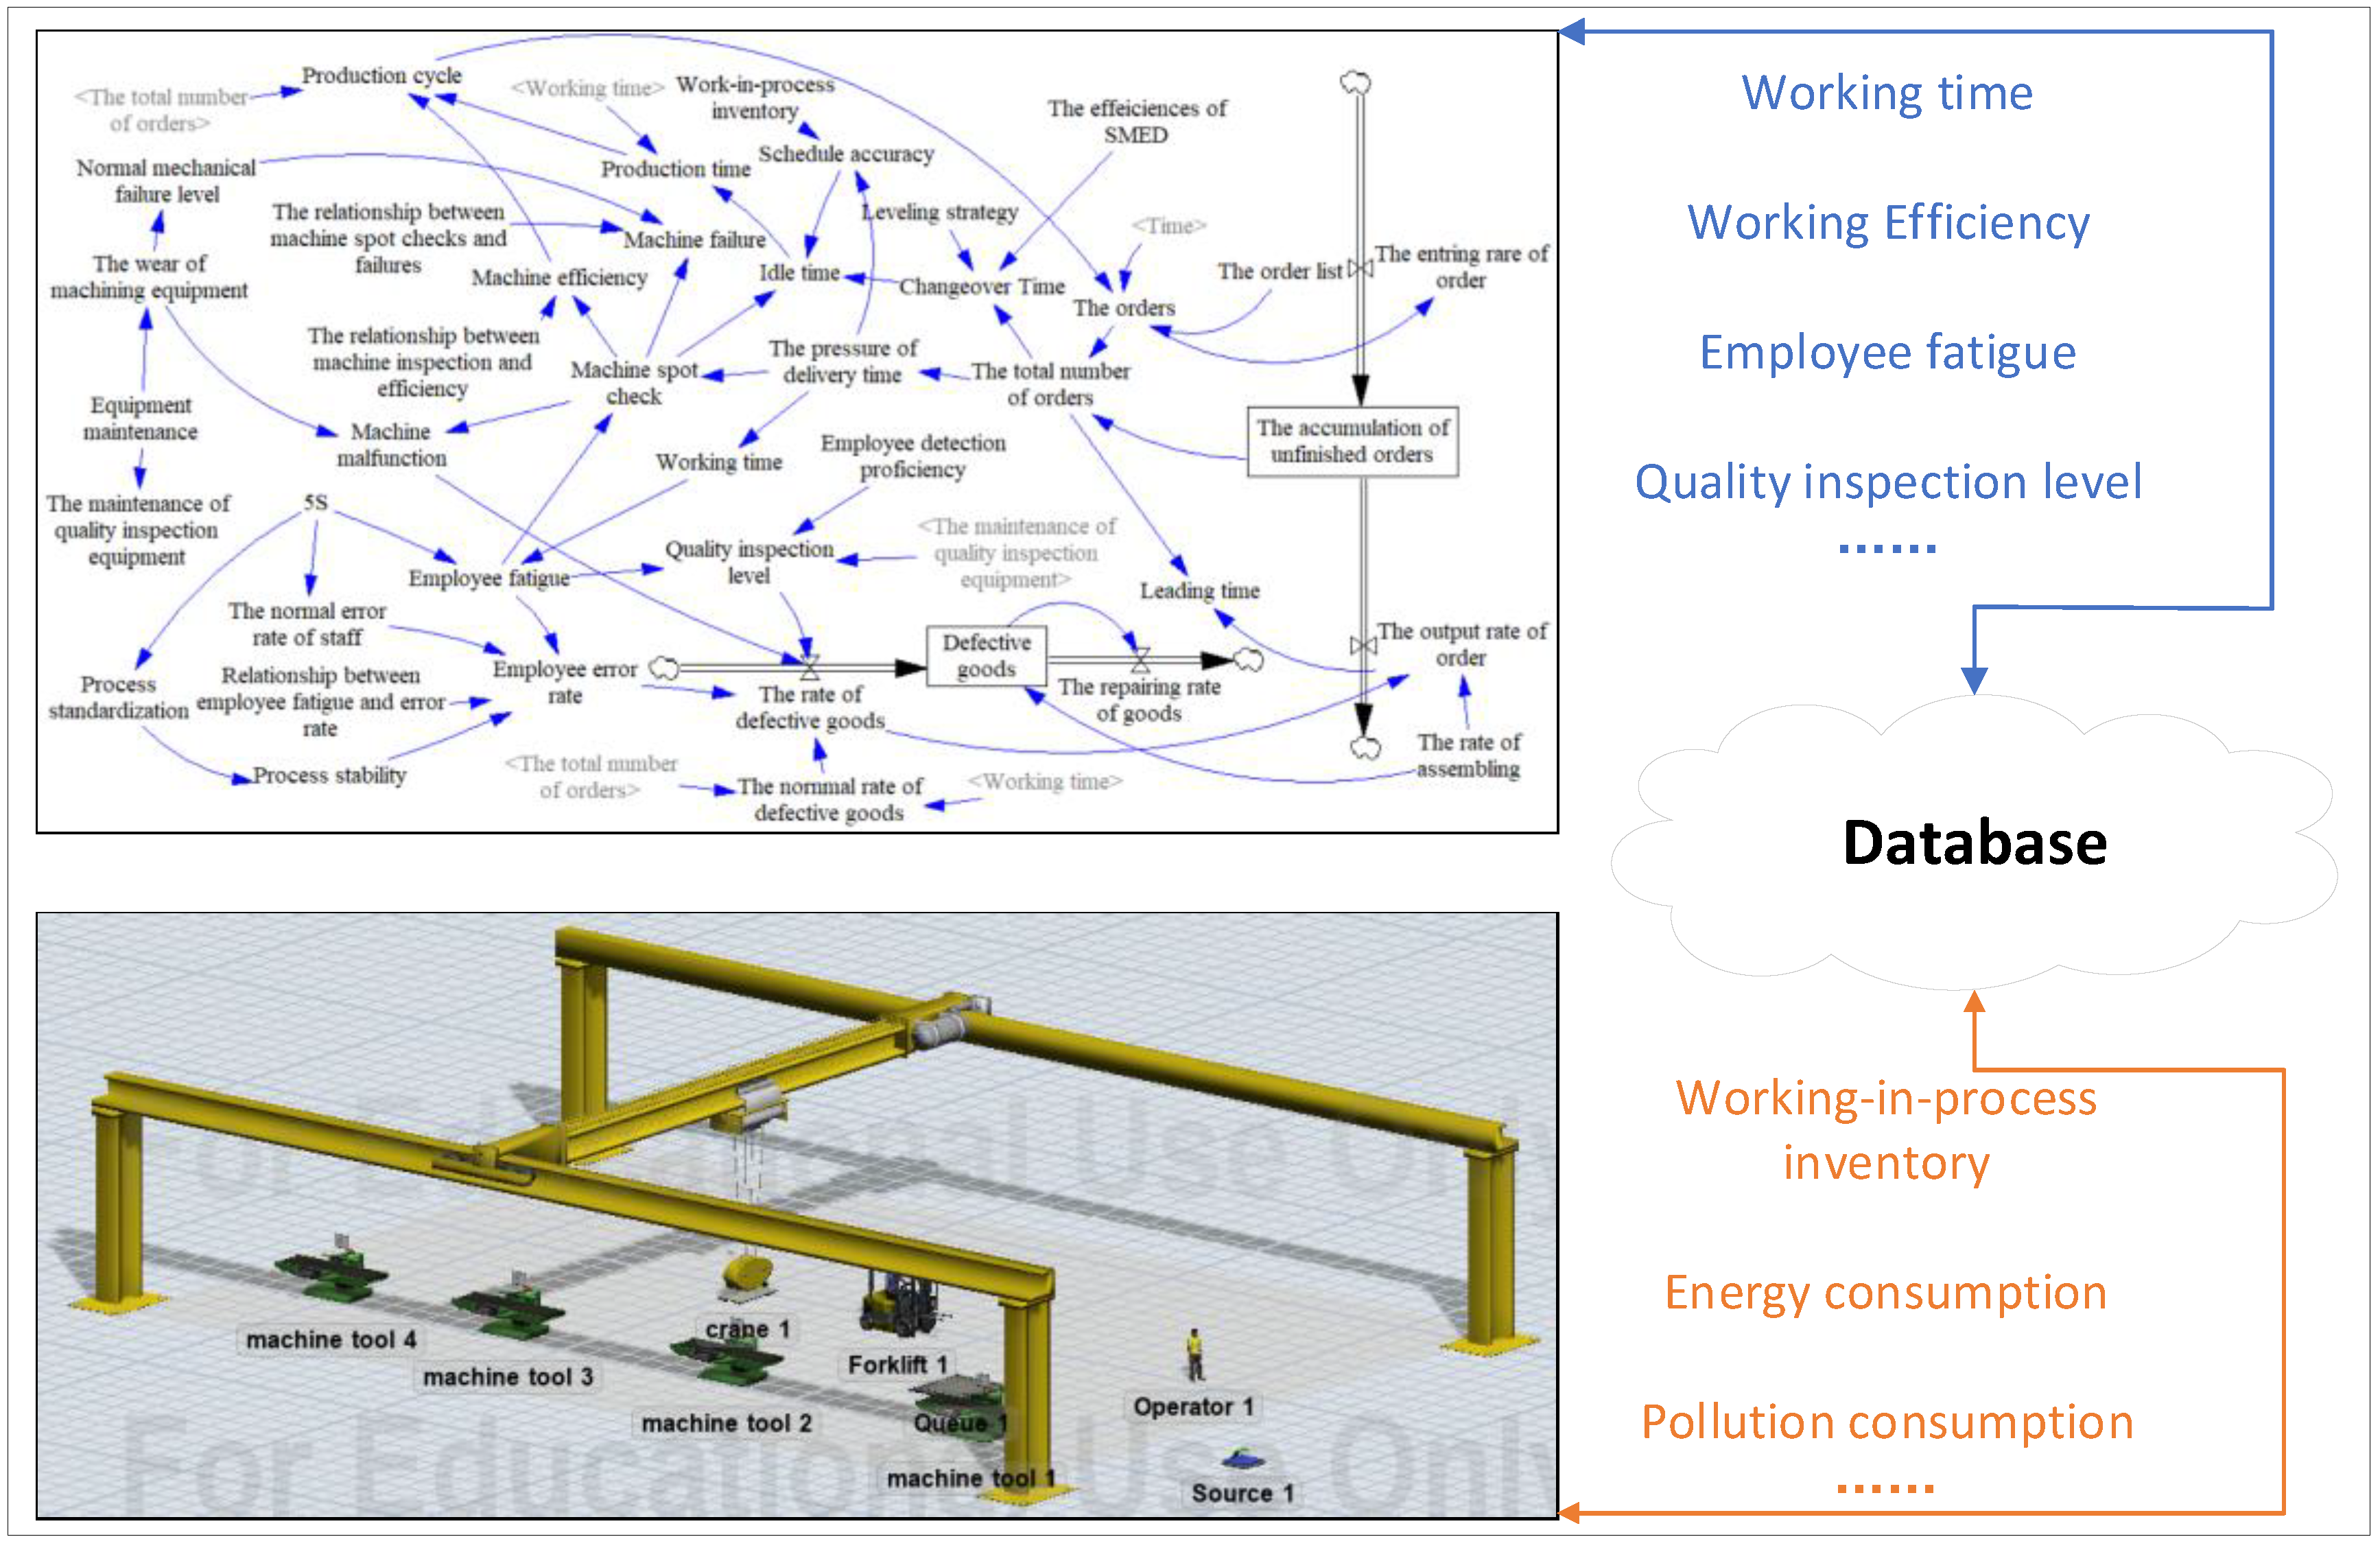
Data Integration Layer: A centralized database synchronizes physical simulations (FlexSim 22) and SD-based soft system variables, allowing dynamic feedback between operational decisions and environmental outcomes.

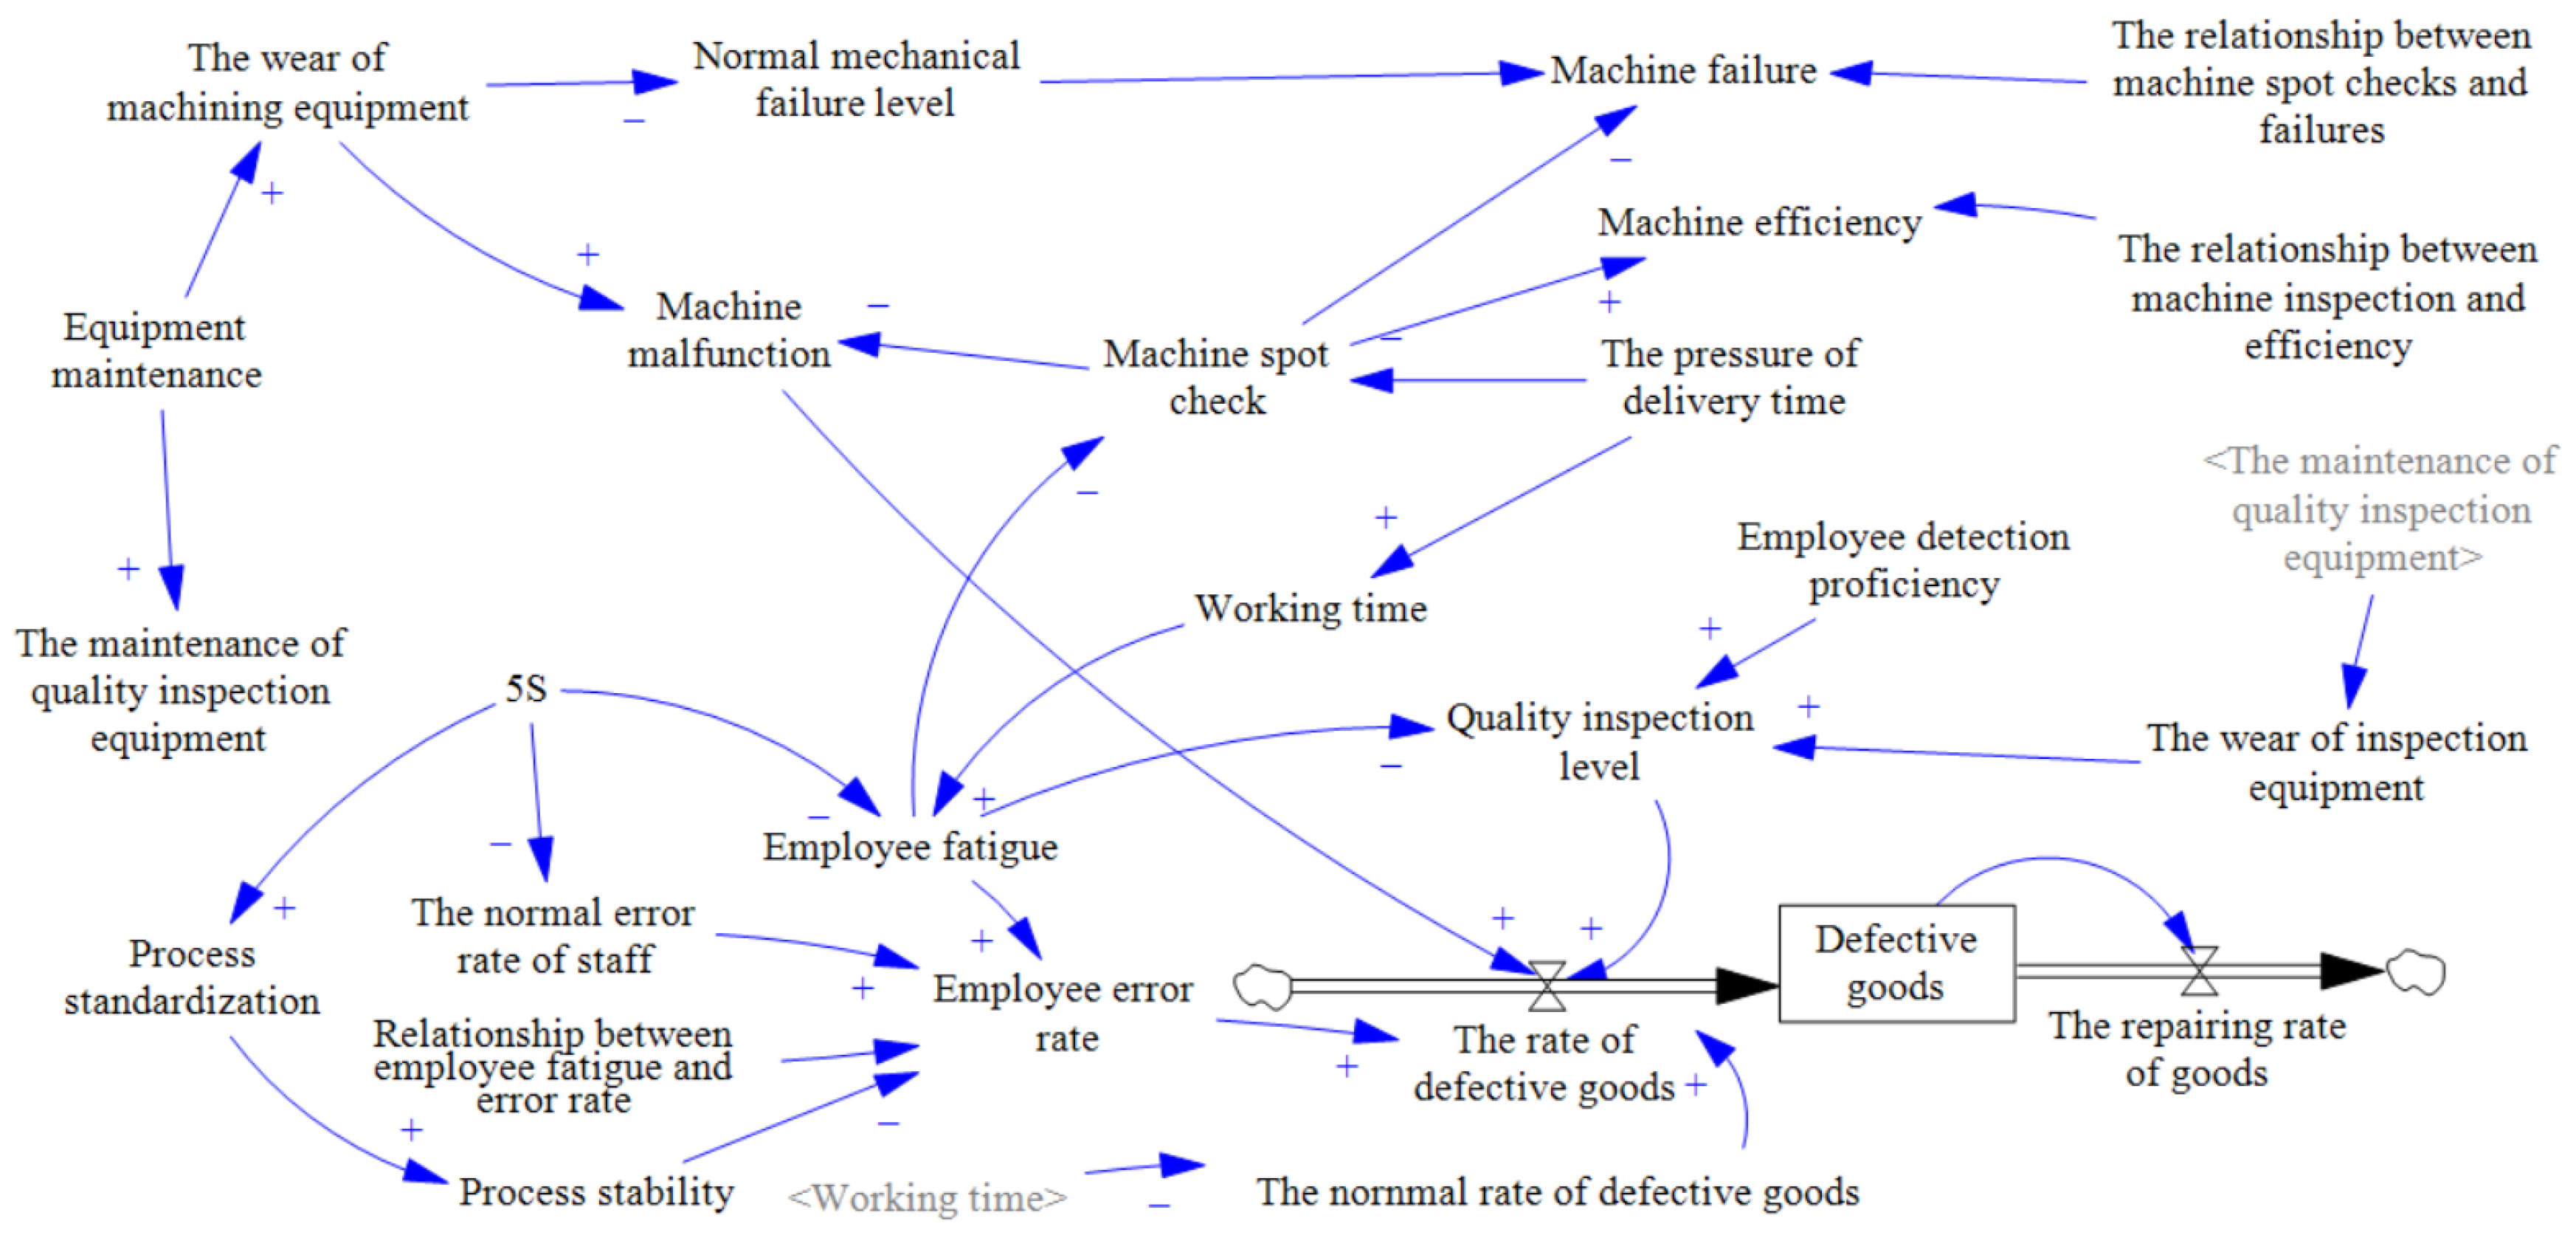
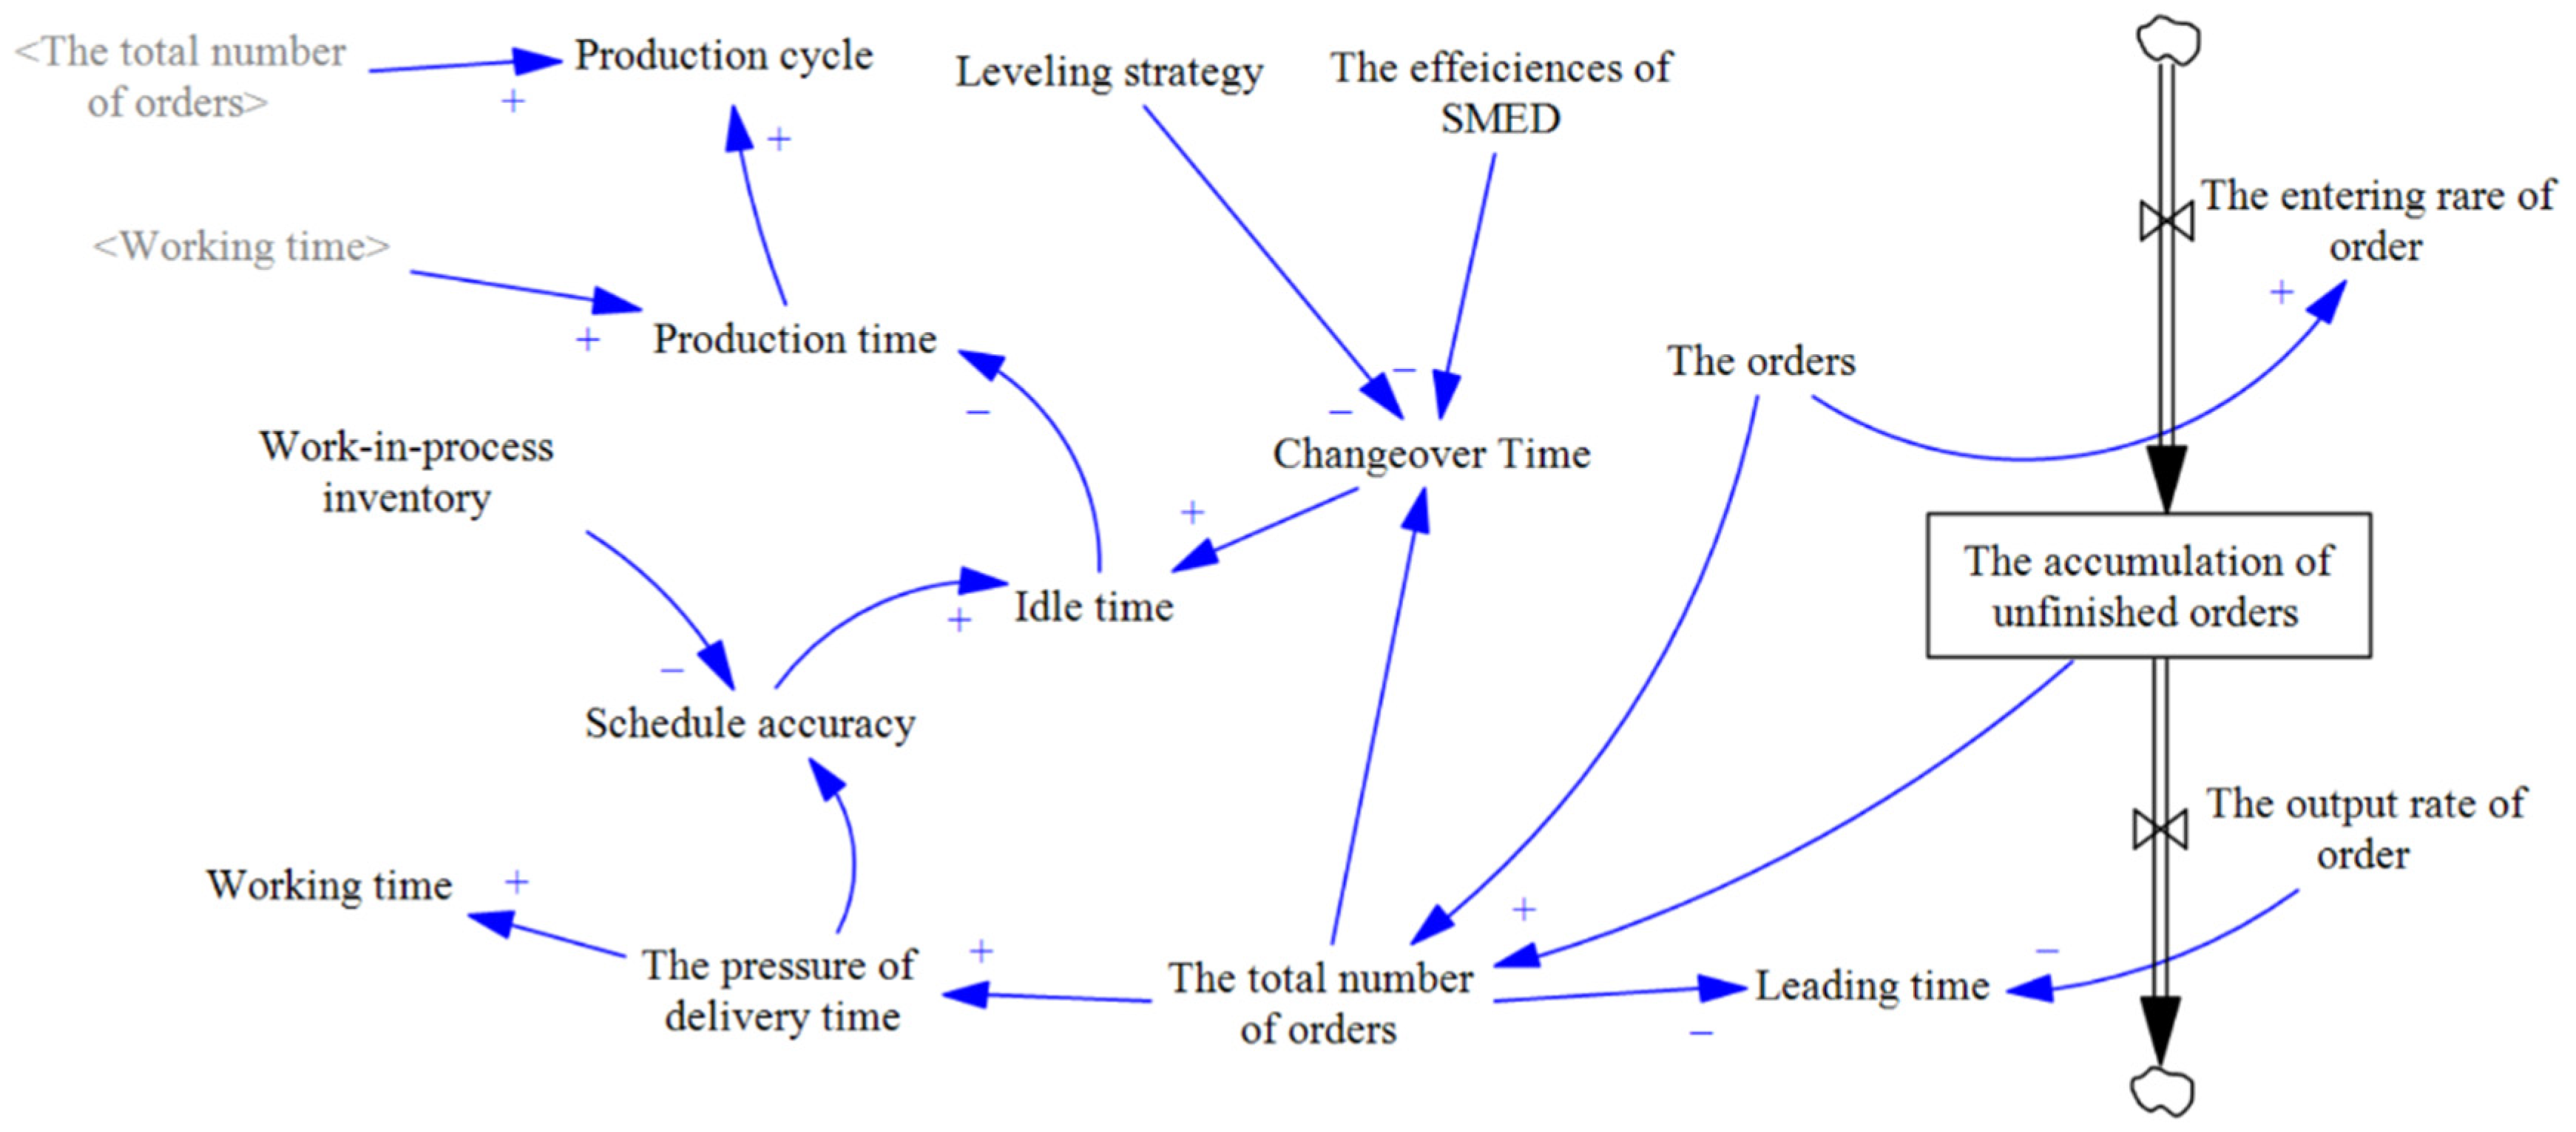
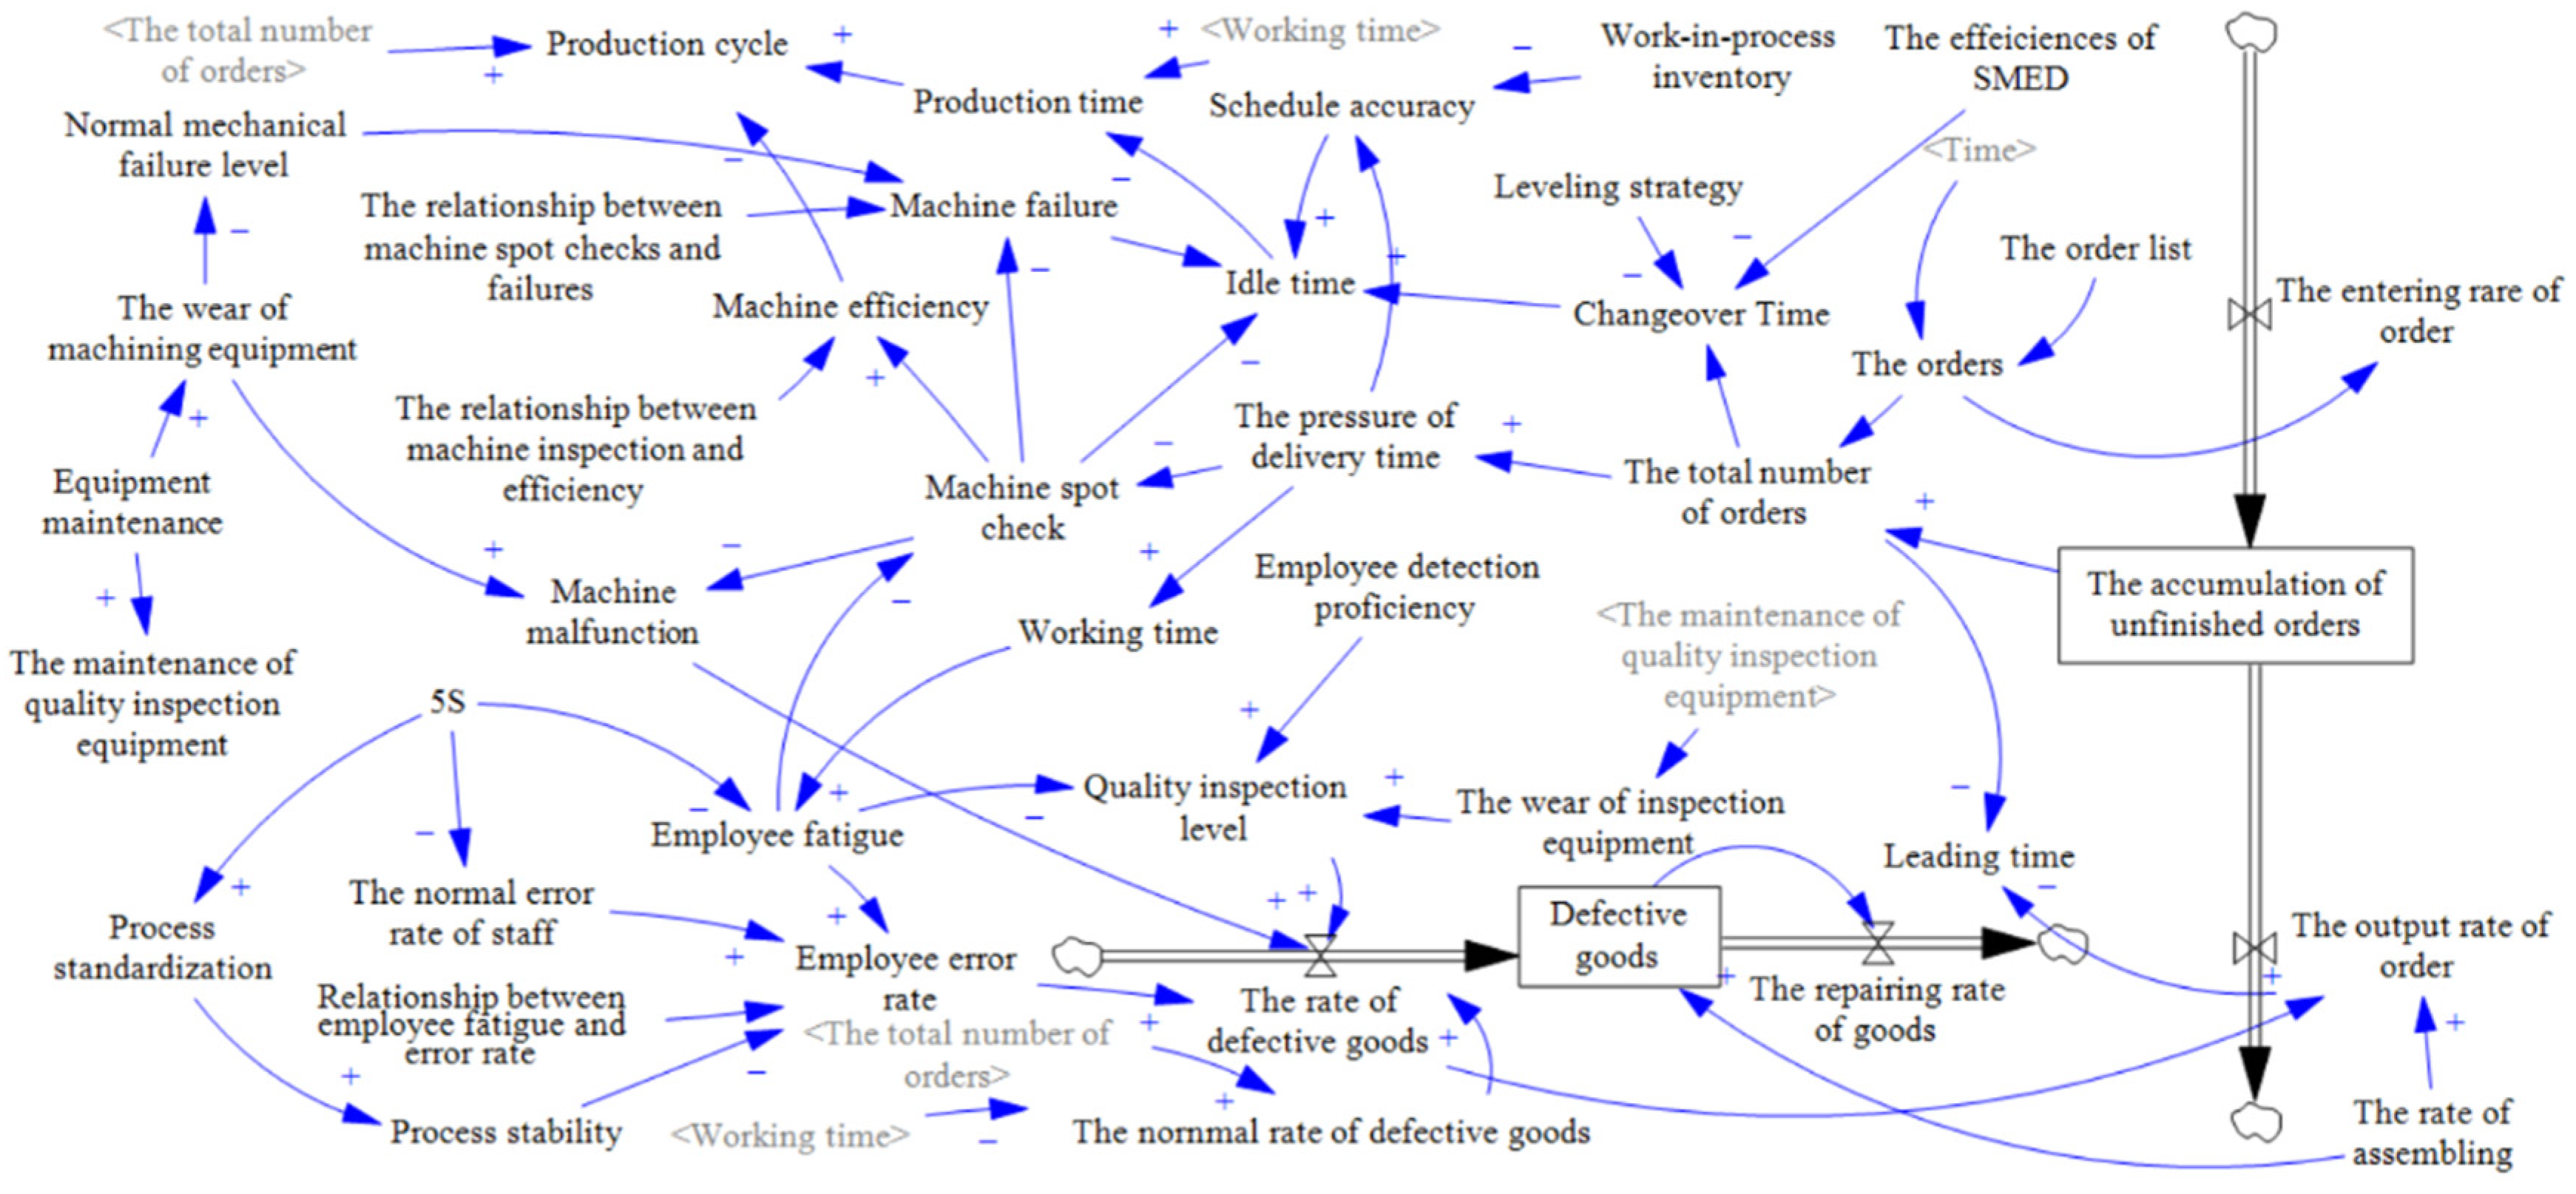
3.1. The Establishment of the Soft System

The soft system is composed of the quality checking system (QCS) and the maintenance system of equipment (MSE). The soft system is composed of many elements, like the working time, the error rate of employee operations, and the number of total orders. To better model the soft system, we divide the whole system into two parts: the quality checking system and the equipment system. Also, all the elements are included in the two systems.
First, the QCS is used to reflect the performance of quality checking. The QCS is composed of the employee, the original performance of the machine, and the level of detection method. The error rate of employee operation is related to the working time, the normal error rate of employee operation, and employee fatigue. Then, the performances of the machine depend on the machine spot check and machine malfunction. Finally, the level of detection method is related to the ability of quality detection and the performance of inspection equipment. Hence, the QCS is shown in Figure 2.
Second, we should establish the operation of the production (OOP) system. The OOP system is composed of the changeover time, working time, single-minute exchange of die (SMED), production cycle, idle time, and the process of orders. First, the changeover time is related to the SMED, leveling strategy, and the total number of orders. Second, the idle time is influenced by the changeover time and schedule accuracy, and influences the production time. Third, the unfinished orders are an accumulation of differences due to the entering rate of orders and the output rate of orders. Hence, the whole OOP is shown in Figure 3.
Third, we combine the OOP and QCS. The whole soft system is shown in Figure 4.
After drawing the soft system, we should identify the mathematical model of the different components. The operation of system dynamics relies on the mathematical relationships between different modules. Hence, we should identify the relationship. Furthermore, because the mathematical relationship between different components may not be adequately captured by a specific formula, a table function was employed to represent this relationship. The table function is shown in Table 1.
The mathematical functions are shown in Table 2.
In Table 2, α 1 ,   α 2 ,   α 3 , α 4 , α 5 , α 6 , α 7 , α 8 , and α 9 represent the parameters. According to the historical data in the real factory, we adjusted the parameters to better align with real-world production data. Parameter values typically vary across different cases. For table function, the first variable in the bracket indicates the inputting variables (like machine spot checks, machine inspection, and employee fatigue) and the second variable in the bracket indicates the outputting variables (like failures, efficiency, and error rate).

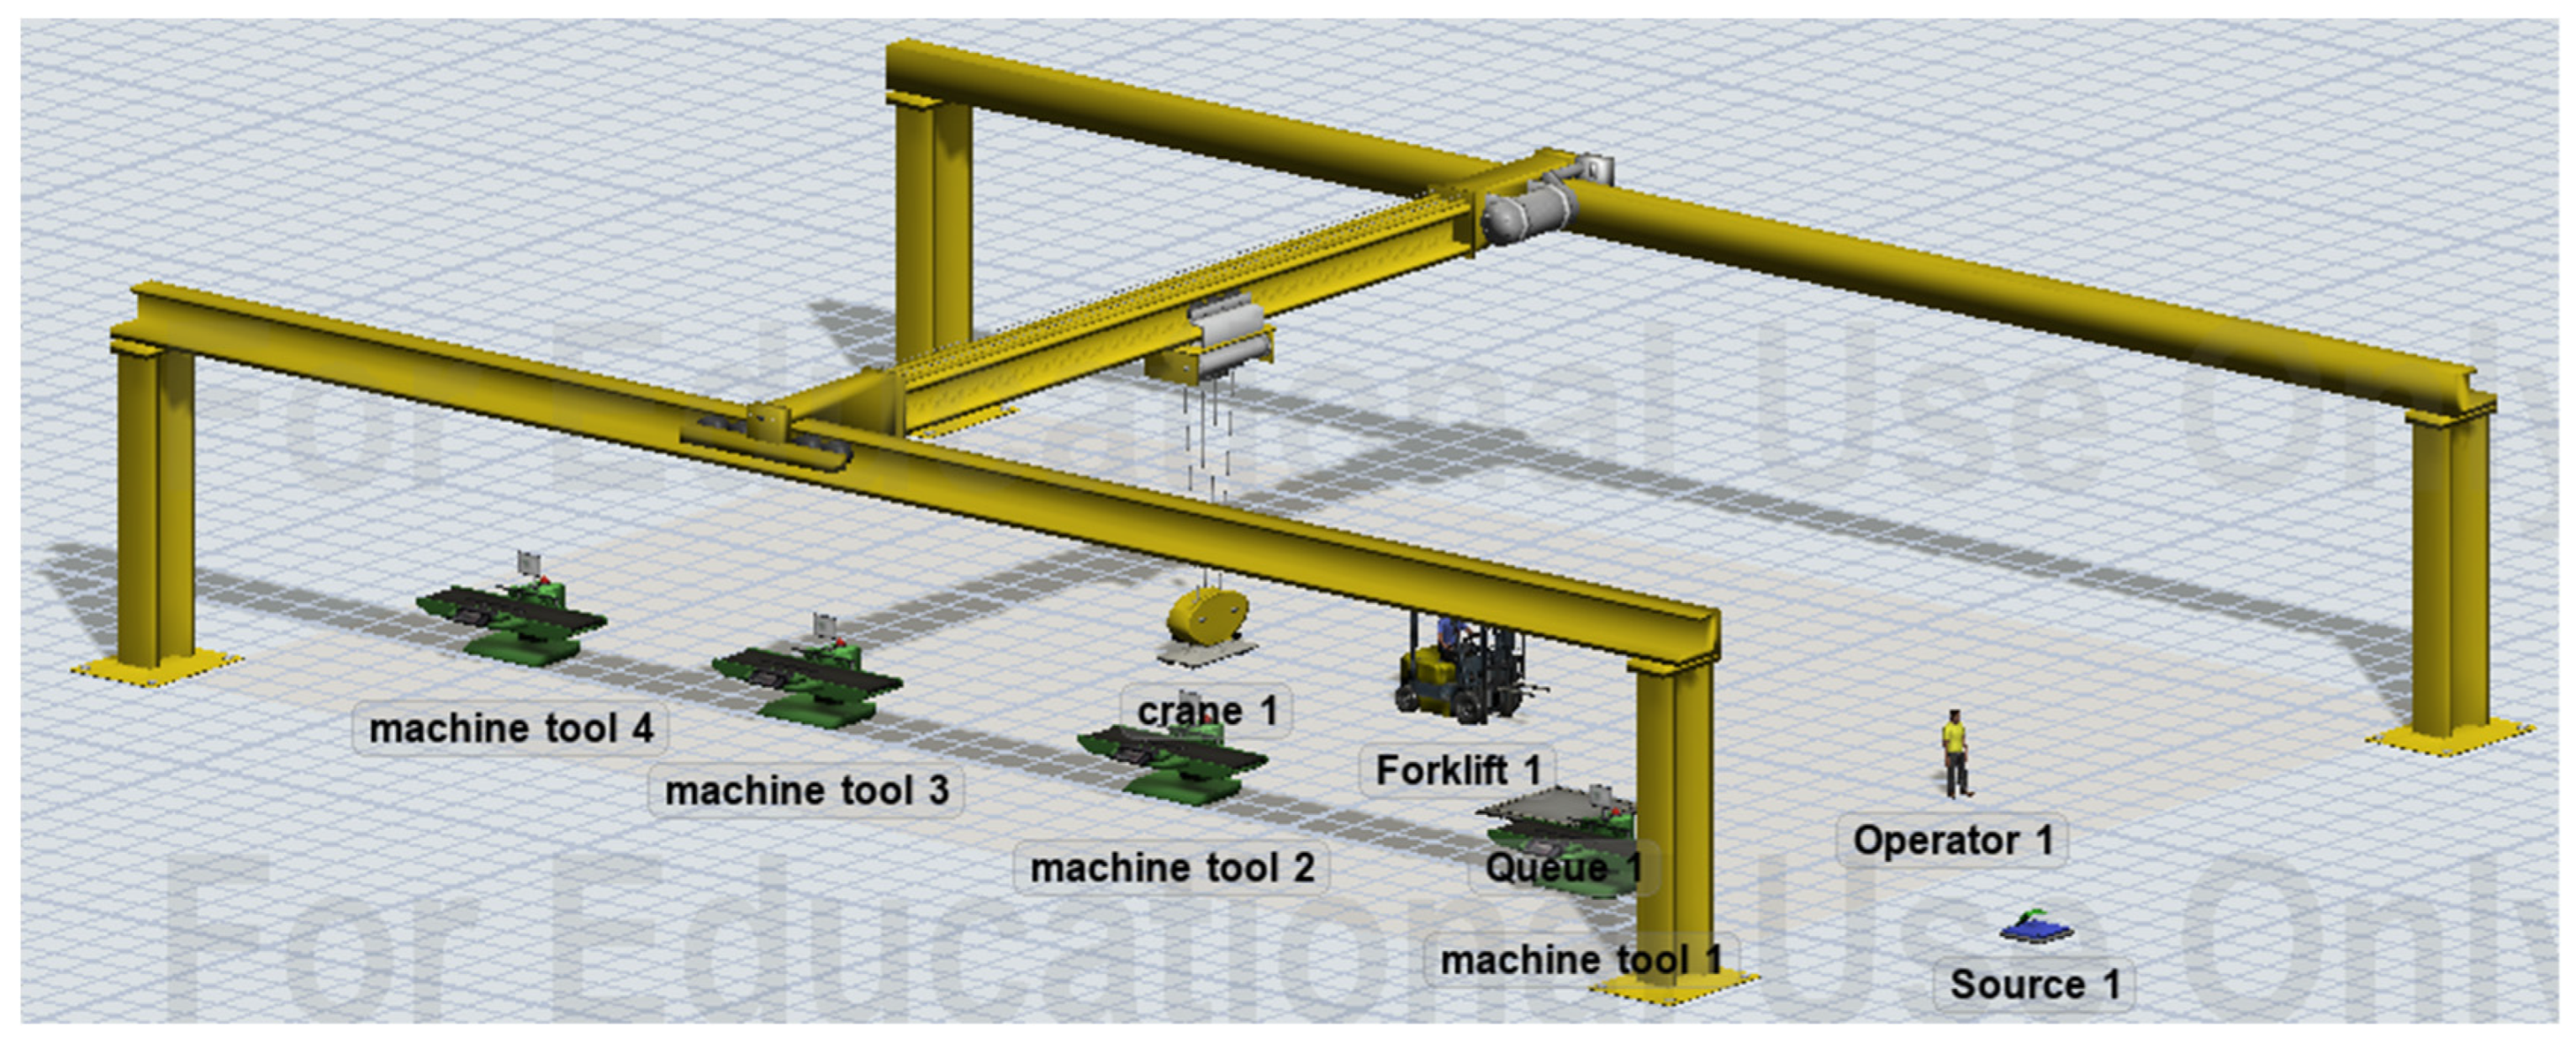
3.2. The Establishment of the Physical System

In this section, we establish the physical system. The physical system is used to perform the production process, which is composed of the machines, the transportation equipment, the human, and the inventory area. Considering the disadvantages of system dynamics, we use FlexSim to simulate the processes. The physical system is shown in Figure 5.

3.3. The Combinations of Soft Systems and Physical Systems

Furthermore, we should combine the physical system and the soft system. Because FlexSim and system dynamics are different, we should connect the two systems. In our work, we establish a database to serve the two systems. The system dynamics model exchanges the necessary information with FlexSim through the database. The exchange process is shown in Figure 6.
In our study, we integrate FlexSim with system dynamics to simulate the operational processes of the factory. Initially, a shared database is established for both systems. Subsequently, a communication mechanism is developed between the two systems based on this database to enable data exchange. After that, we design the communication frequency for the two systems. Generally, to maintain the two systems’ consistency, we should ensure the communication frequency. Considering the constraints of system dynamics, the computation frequency for system dynamics calculations is set to once per minute. The communication frequency between the two systems is per minute, which could ensure the consistency of the two systems as much as possible. Furthermore, the production has certain stability, and the requirement of communication frequency is not high. Per minute is enough for consistency.
Next, we emphasize the novelty of the combination of SD and FlexSim. The novelties could be concluded into three perspectives. First, the integrated system can take into account both the software and hardware systems of the factory. The factory was composed of the physical system and the soft system. Previous works mainly focused on the physical system and rarely focused on the soft system, which may result in low predictive accuracy. Second, we present the lean production based on the system dynamics. A lean system was adopted in many factories, and many previous works have discussed the impact of lean production. Our work describes the mutual effect among the components in lean production and presents the whole system through system dynamics. Third, we propose a new method to ensure consistency between two systems. In our work, two systems were combined. We establish the database to ensure the consistency of the two different systems.

4. The Sensitive Parameters-Based Multi-Objective Scheduling Model

In this section, we establish the scheduling model. The real production model is composed of many complex components, and the traditional approach is hard to perform all the complex components. Although the complex components help reflect the real production, they raise the difficulties of scheduling. To address the problem, we design a new approach to perform the scheduling results based on the hybrid digital twin model.

4.1. Establishing the Optimization Model Based on the Parameters

In our study, we should identify the decision variables for each objective. Like previous works, the sensitivity parameters are determined through Formula (1).
S X = Y X + Δ X Y X Y X X + Δ X X X
In Formula (1), X indicates the changing variables, Δ X indicates the changing value, Y ( X ) indicates the corresponding outputting value of X , and S ( X ) indicate the sensitivity of X . Also, like previous works, S X > 1 indicates that the parameters are sensitive. Otherwise, the parameter is not sensitive.
Second, we establish the scheduling model based on the sensitive parameters. The hybrid digital twin model is constructed by complex relationships, which are a kind of high-order nonlinear equations. In our work, we use the regression model to examine the relationship between the decision variables and the objective value based on the hybrid digital twin model. Considering the differences in the objectives’ dimension, we assign a coefficient for each objective.
In our work, the kinds of objectives, including the operation and green performances, should be considered. Like the operation performances, the objectives are reducing the inventory of work-in-progress, decreasing defective products, and shortening the production lead time. Hence, the objectives are shown in Formula (2).
min f y = k 1 y 1 + k 2 y 2 + k 3 y 3
In Formula (2), y 1 , y 2 , and y 3 indicate the inventory of work-in-progress, defective products, and the average production cycle. k 1 , k 2 , and k 3 indicate the coefficient of the objectives.
The objectives are to minimize carbon emissions and pollution. The formula is shown below:
min f z = l 1 z 1 + l 2 z 2
In Formula (3), z 1 and z 2 indicate carbon dioxide and polluting emissions. l 1 and l 2 indicate the coefficient. Furthermore, y 1 , y 2 , y 3 , z 1 , and z 2 represent the regression model, which is obtained by the sensitive parameters.

4.2. The Solution of the Optimization Model
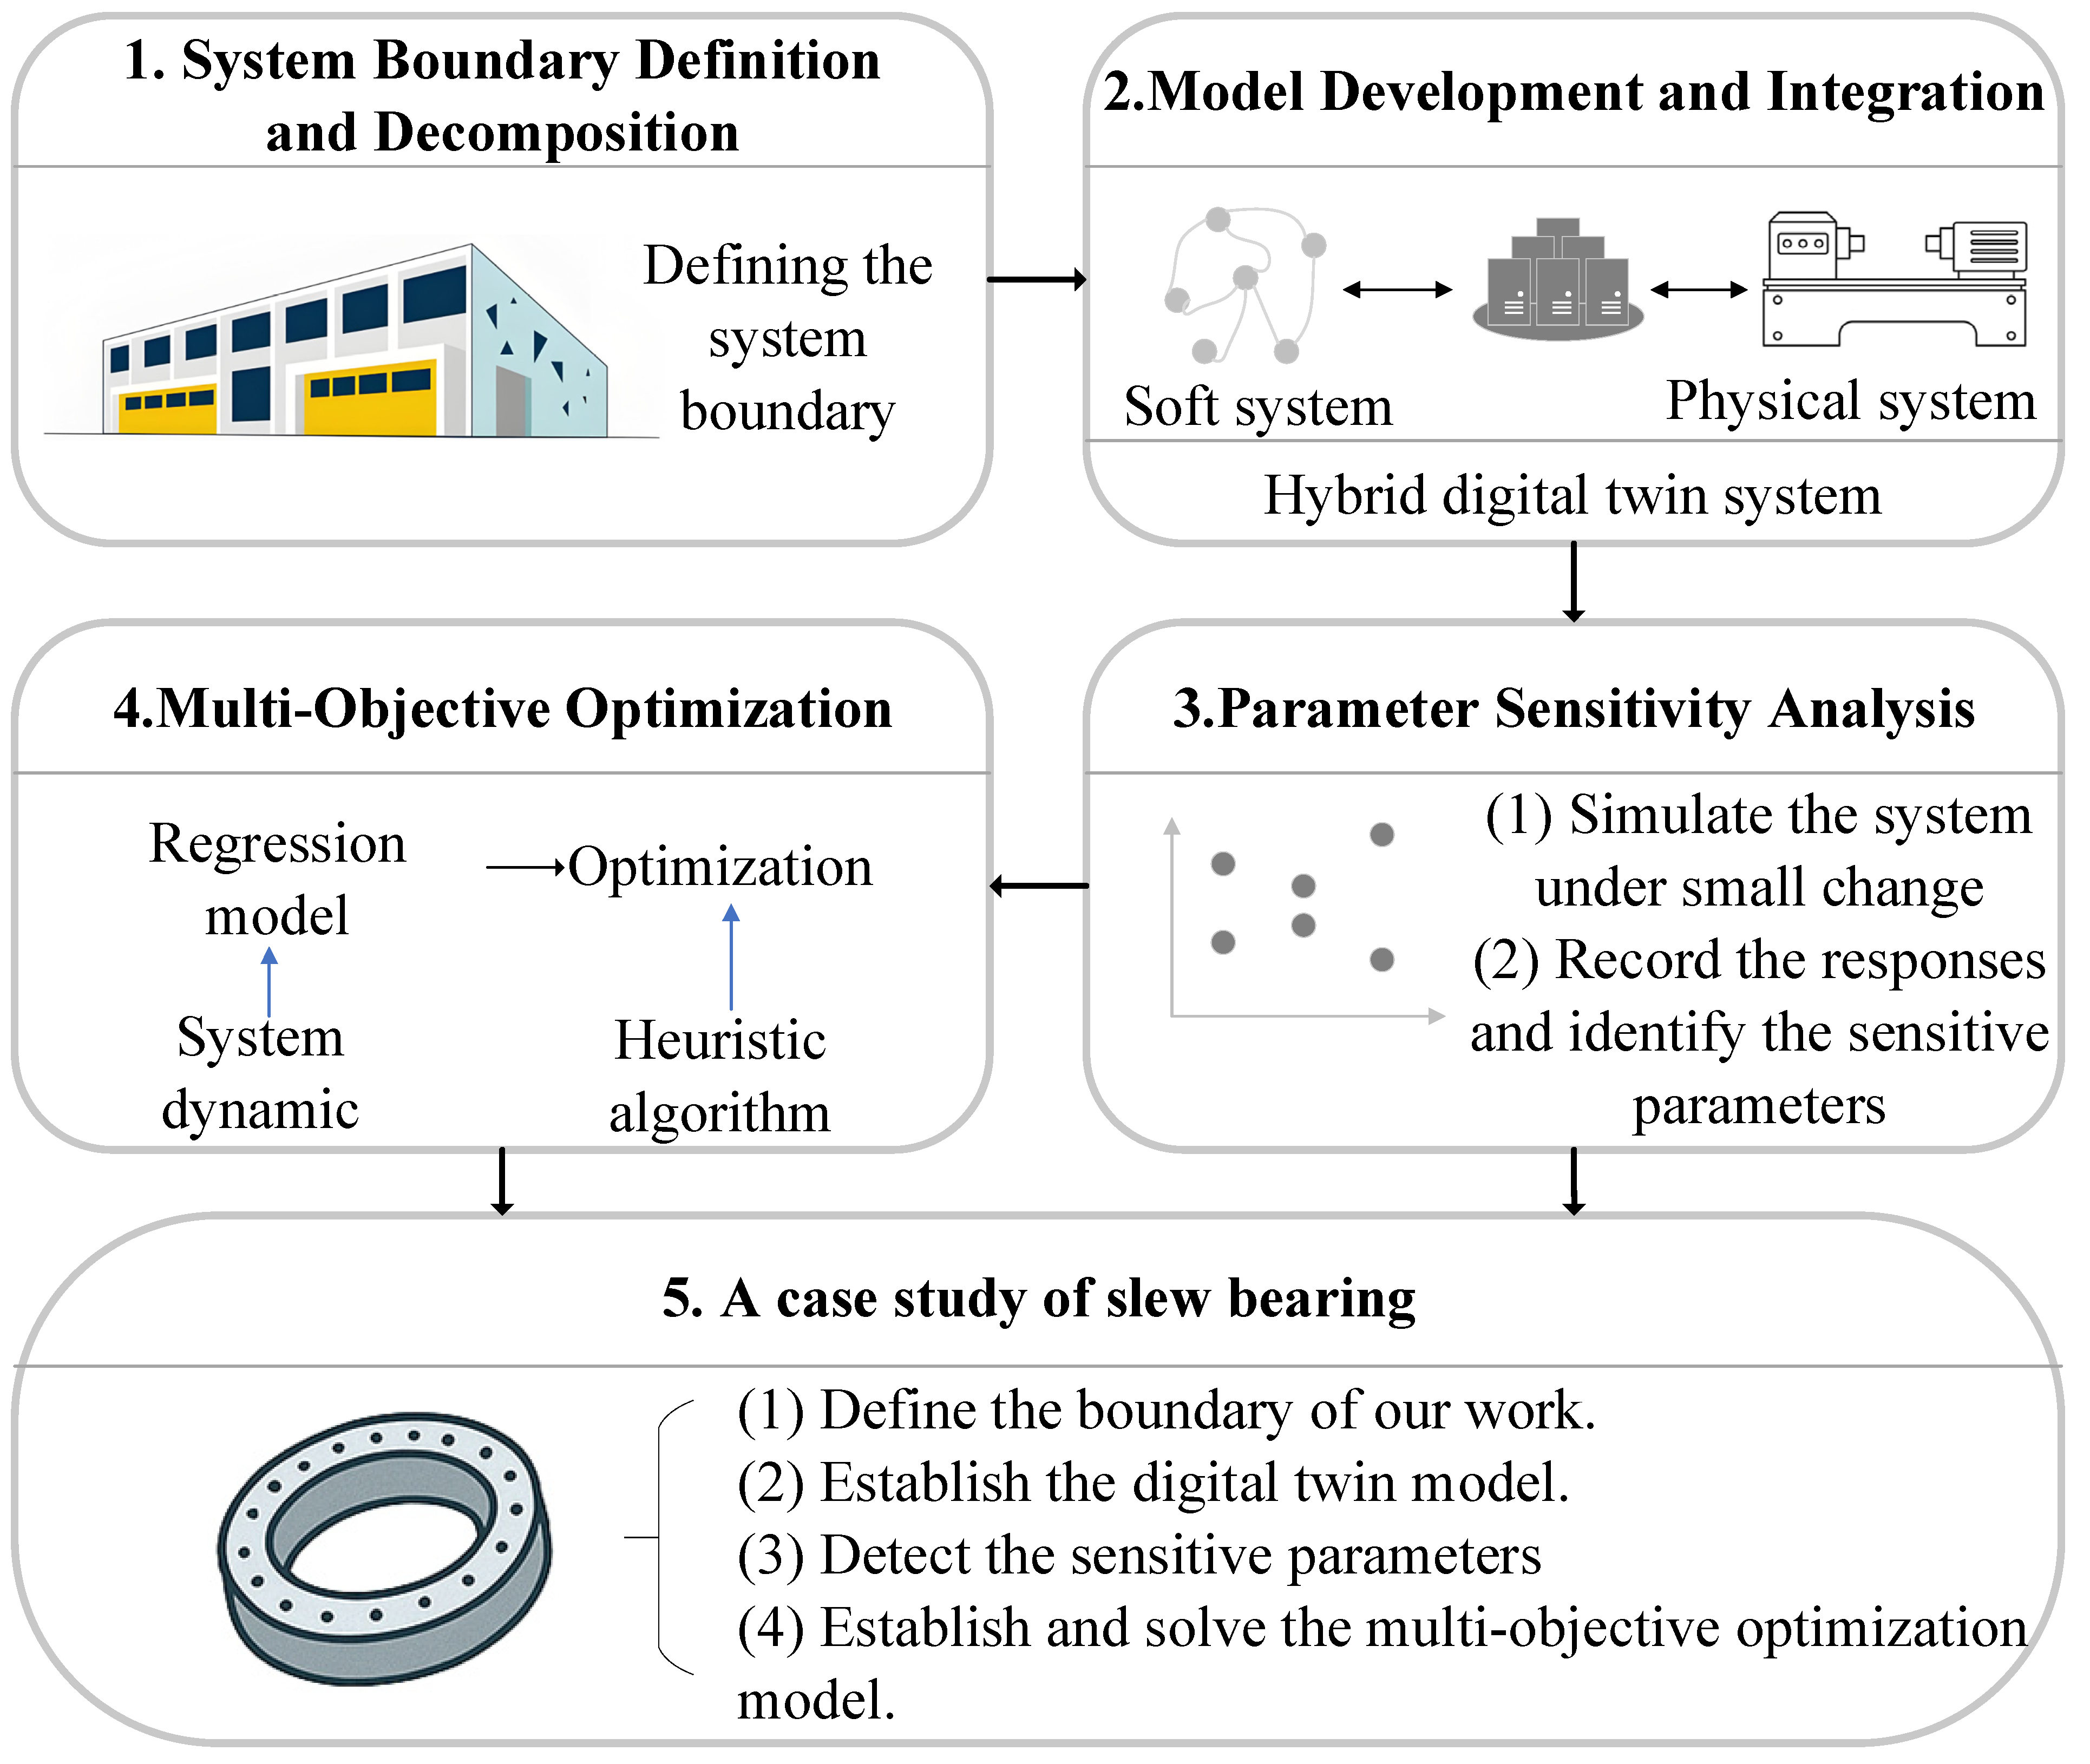
In our study, we designed the genetic algorithm to solve the programming model. The optimization model is obtained through the regression between the parameters and the objectives. Because of the complex environment, the programming model is always nonlinear. Hence, considering the requirements of high efficiency, the heuristic algorithm is adopted to solve the programming model. A genetic algorithm is a kind of heuristic algorithm, which has been applied in many scenarios and has achieved good performance. The procedures are shown in Table 3.

5. Research Design

In our work, we establish a hybrid digital twin model to support green manufacturing by integrating both physical and soft systems. While the physical system captures real-time production data and operational behaviors, the soft system models organizational factors such as decision-making processes and human interactions. This integration enables a comprehensive representation of the manufacturing environment, allowing for more effective monitoring, optimization, and sustainability assessment. Next, we introduce how to establish and use the hybrid system.
Step 1: System Boundary Definition and Decomposition
We begin by defining the system boundary of the study, which focuses exclusively on in-factory operations and excludes enterprise-level finance or human resource structures. The hybrid digital twin model is decomposed into two subsystems. First, the soft system captures human decision-making, lean practices, quality inspection, and maintenance mechanisms using system dynamics. Second, the physical system simulates material flow, equipment usage, and production layout using FlexSim. This decomposition enables a holistic yet tractable modeling of both tangible and intangible elements of the factory.
Step 2: Model Development and Integration
After defining the components, we develop the two subsystems and integrate them through a shared data infrastructure. The soft system is modeled as a causal feedback structure, incorporating key factors such as SMED efficiency, working time, equipment wear, and inspection accuracy. Meanwhile, the physical system simulates shop-floor logistics, bottlenecks, and queue dynamics based on real process flows. To ensure dynamic consistency, we construct a relational database that allows both systems to exchange real-time data, e.g., using the equipment status from FlexSim to adjust fatigue or maintenance rates in the soft system. This enables bidirectional feedback between the physical and decision-making layers.
Step 3: Parameter Sensitivity Analysis
With the hybrid model established, we conduct a sensitivity analysis to determine which parameters have the greatest impact on production and environmental outcomes. First, we simulate the system under various parameter configurations and record the responses of key indicators such as production cycle time, WIP inventory, defective rate, energy consumption, and cutting fluid evaporation. Second, we calculate the sensitivity coefficients for each input parameter by analyzing the marginal effects on outputs. The most sensitive parameters, such as equipment maintenance, 5S practices, and cutting settings, are selected as decision variables for optimization.
Step 4: Multi-Objective Optimization
In the final step, we build a multi-objective optimization model based on regression relationships between the sensitive parameters and performance indicators. First, regression models are trained using data from the hybrid simulation to approximate complex nonlinear dependencies. Second, both operational objectives (e.g., lead time, WIP, defect rate) and environmental objectives (e.g., energy and emission reductions) are incorporated into the model. Finally, we apply a genetic algorithm to identify Pareto-optimal solutions, from which decision makers can select according to strategic preferences, such as prioritizing quality over emissions, or vice versa.
Step 5: A Case Study of Slewing Bearings
In our study, we adopt the data from a slewing bearing factory. Based on our work, we first define the boundary of our work. Then, we fully study the operation of the factory and the equipment. Also, we establish the digital twin model based on the operation and physical system. After that, the sensitive parameters are detected based on the hybrid digital twin. Finally, we establish the multi-objective optimization model and solve the model.
The whole research design is shown in Figure 7.

6. A Case Study About Slewing Bearings

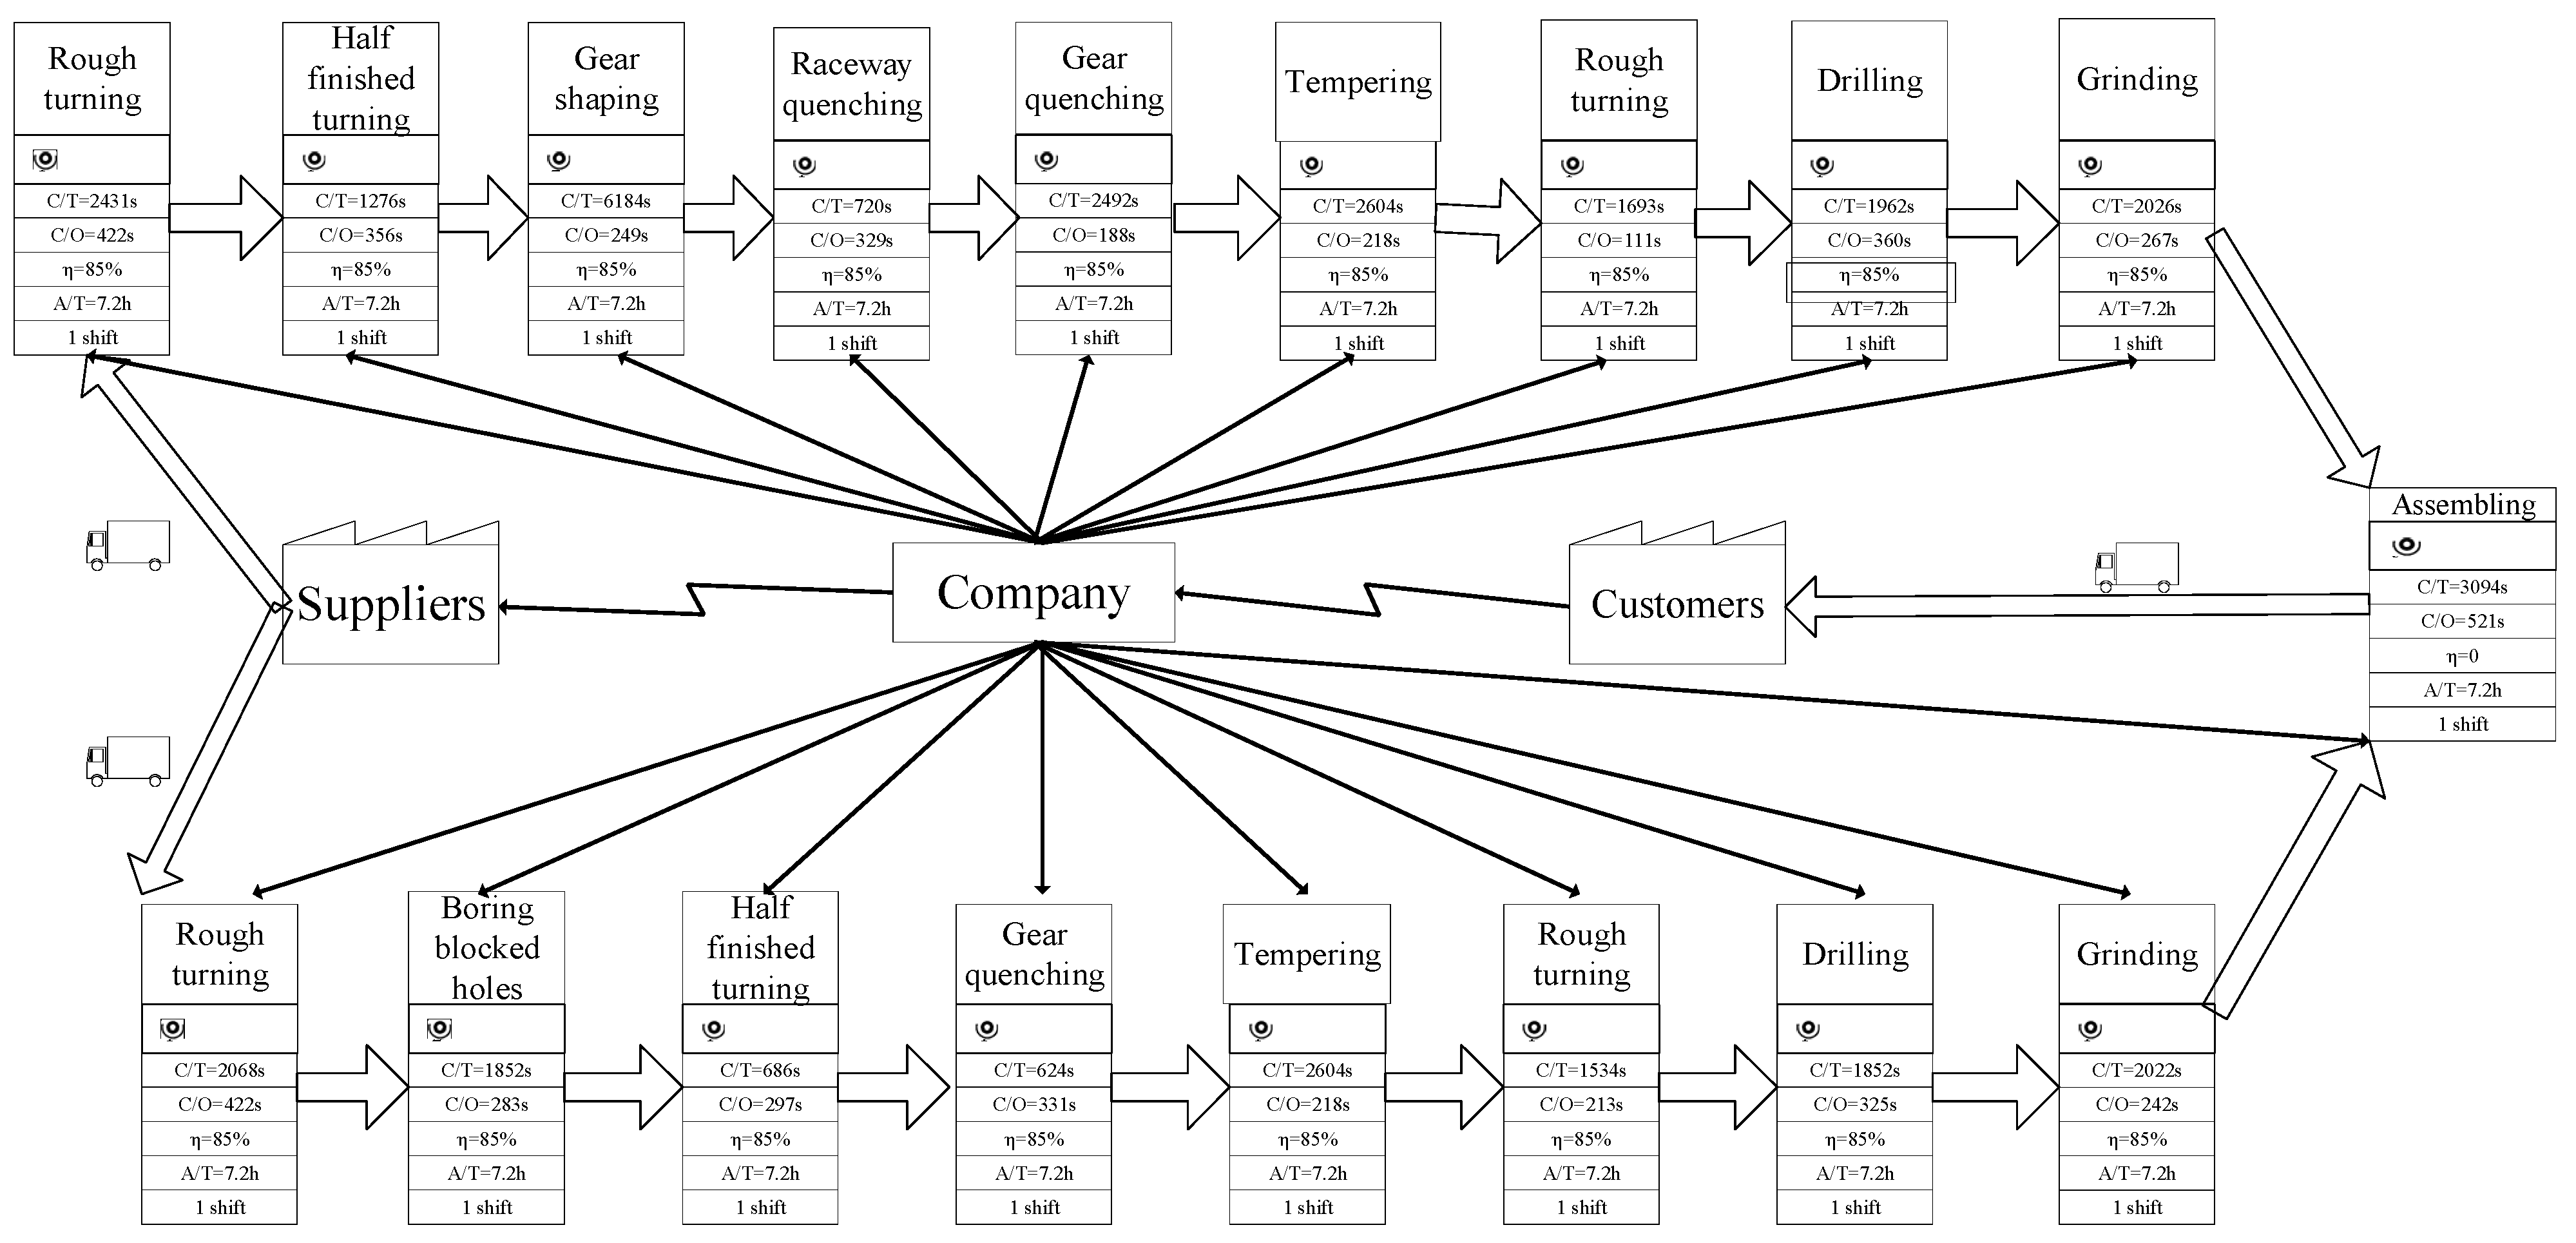
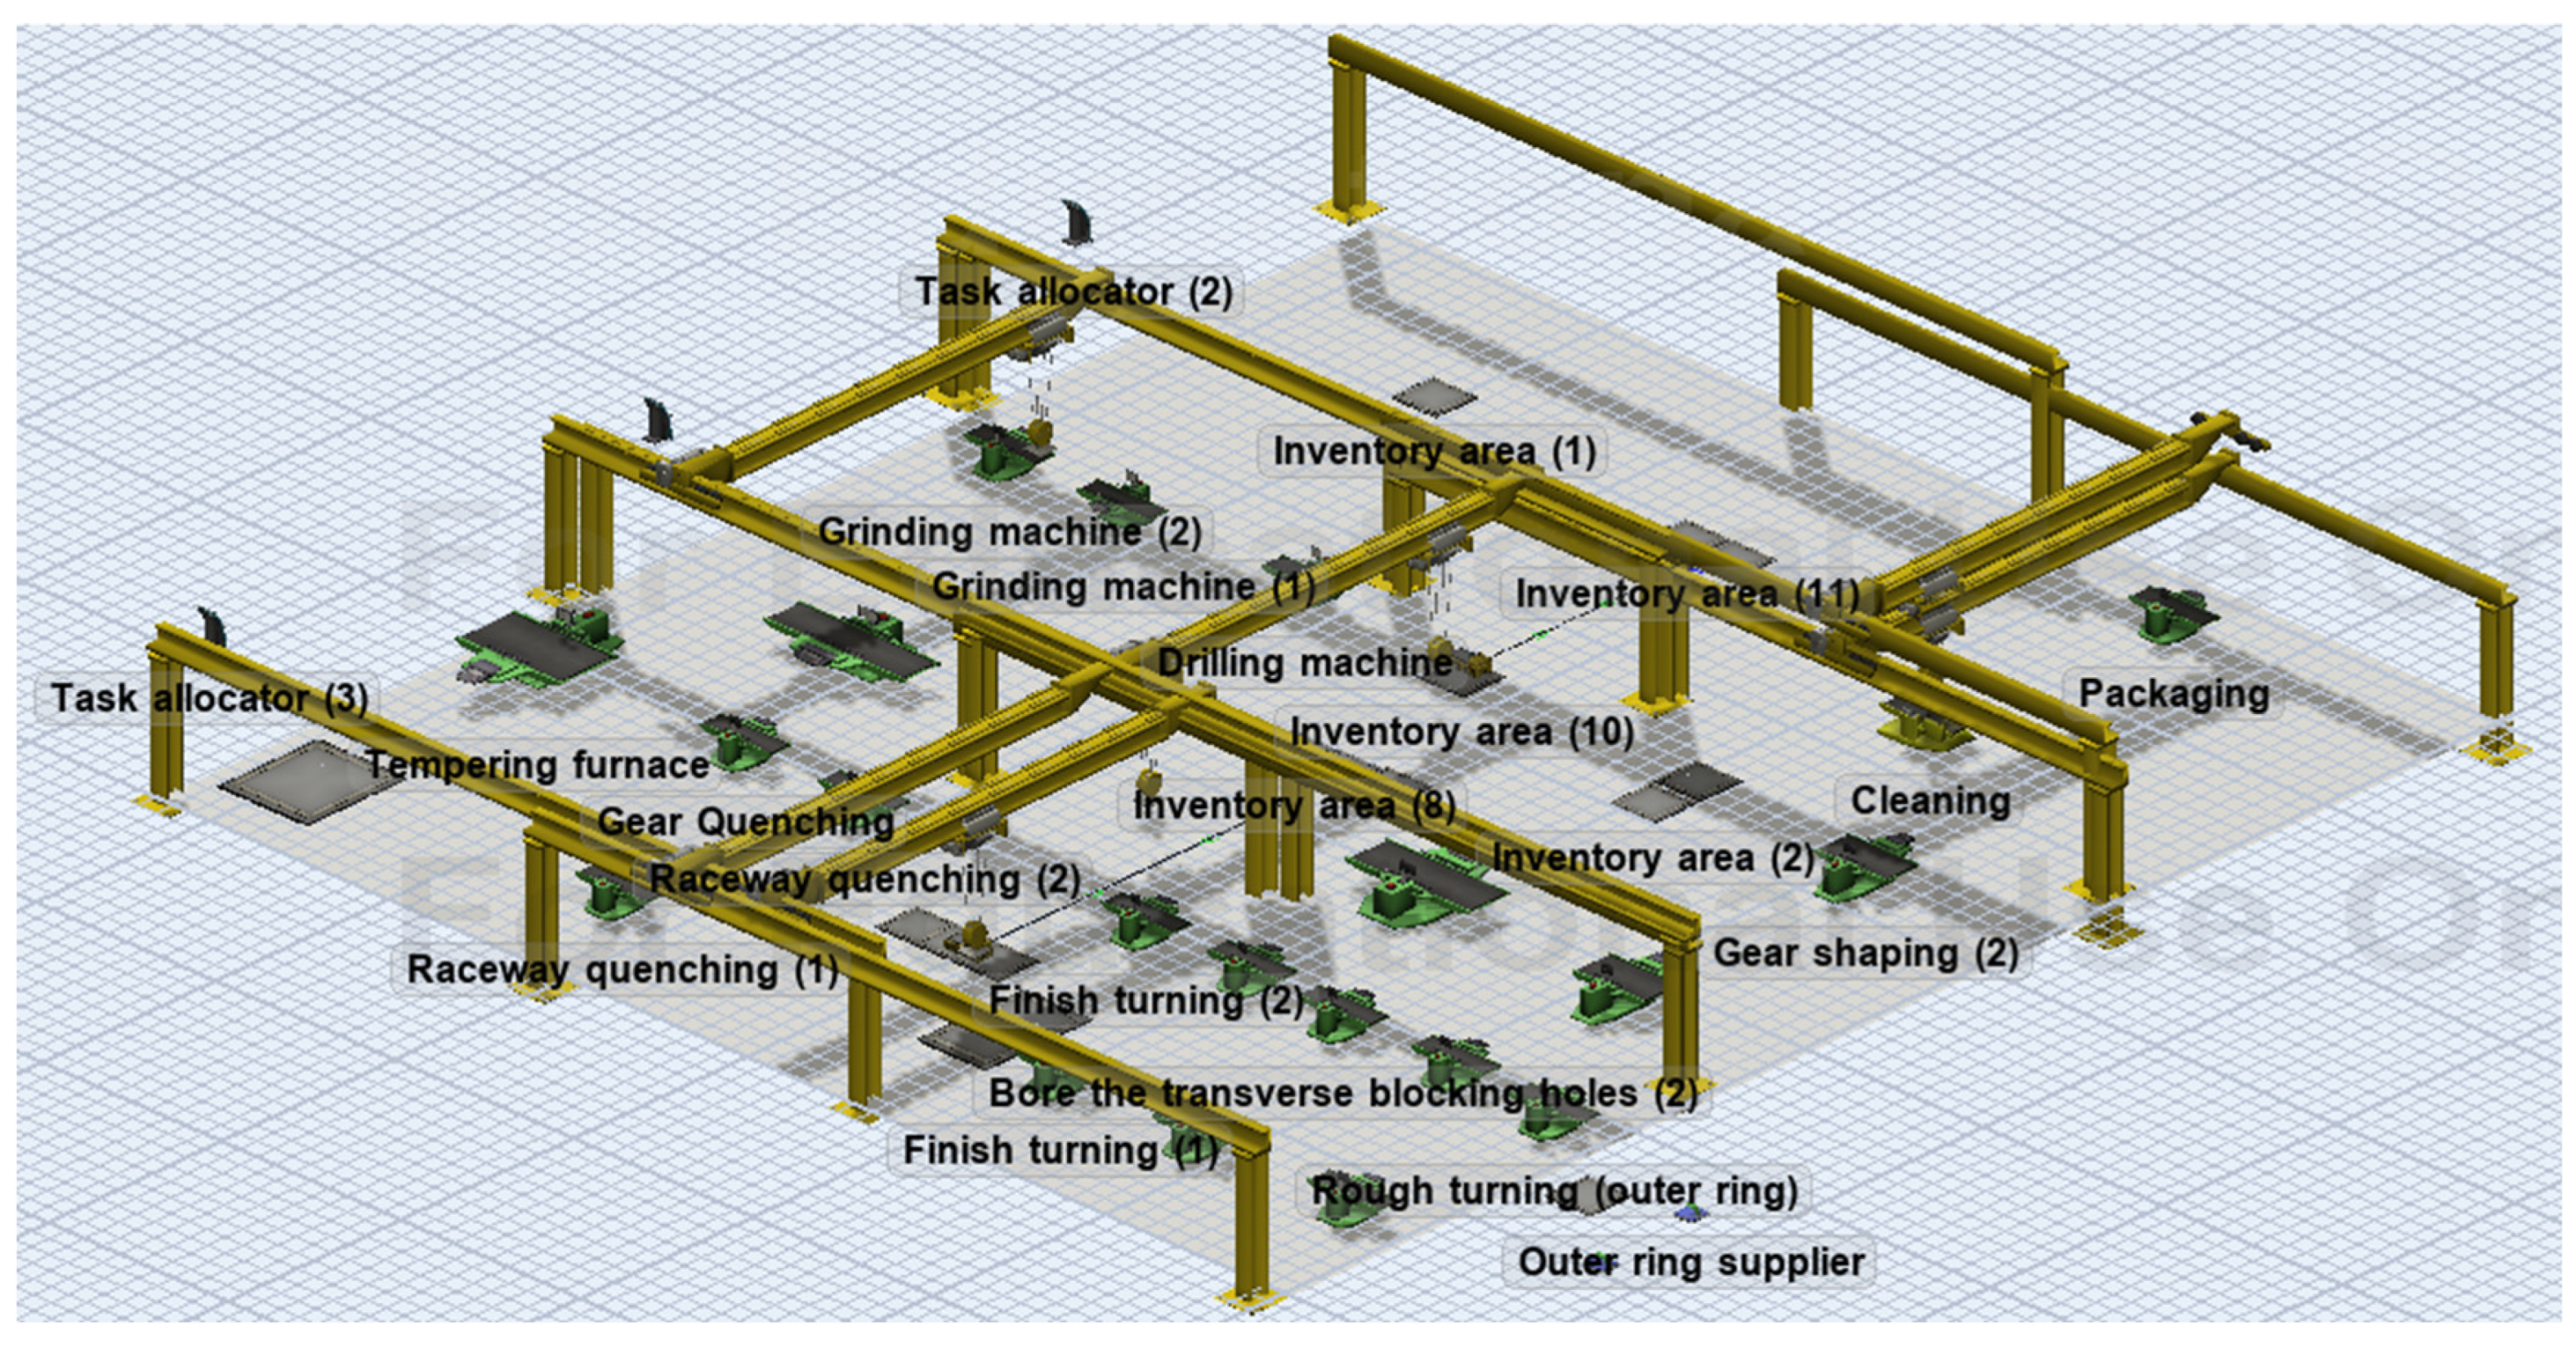
6.1. The Background of the Factory

The primary product of the factory is the slewing bearing, which is assembled from an inner ring and an outer ring. The manufacturing process for the inner ring comprises seven sequential operations: rough turning, semi-finishing turning, heat treatment, finish turning, drilling, turning–grinding, and assembly. The outer ring production involves eight processes: rough turning, semi-finishing turning, gear shaping, heat treatment, finish turning, drilling, turning–grinding, and assembly.
Among these processes, all operations except rough turning, semi-finishing turning, and finish turning are completed through automated machining systems, with their processing durations remaining almost constant. The machining times for rough turning, semi-finishing turning, and finish turning are directly influenced by the selected cutting parameters. The ranges of these cutting parameters are predetermined by engineering technicians following a hierarchical optimization approach: first determining the optimal parameters for finish turning, then specifying parameters for semi-finishing turning, and finally deriving rough turning parameters based on raw material dimensions. This parameter determination methodology ensures optimal cutting conditions for the finish turning process while minimizing the risk of defective products during manual operations.
According to the factory’s operational characteristics, the critical factors affecting its green manufacturing performance are energy consumption during machining and cutting fluid volatilization. Consequently, the energy consumption and cutting fluid evaporation in the rough turning, semi-finishing turning, and finish turning processes have become key improvement priorities for the enterprise.

6.2. The Hybrid Digital Twin Model of the Factory

In this section, we introduce how to establish the digital twin model of the factory. The factory is composed of the soft system and the physical system. The soft system is the same as the simulation model proposed in Section 2. Then, we establish the physical system based on the processes of production. The establishment of physical system could be concluded into four steps, including drawing the distribution diagram of equipment, setting the equipment in the factory, defining the production logic, and connecting the machine tools in the factory.
First, we deduce the distribution of equipment in the factory. The production of a slew bearing is composed of the inner ring and outer ring. The two rings are assembled at the packaging area. Considering the requirements of different processes, the factory should assign a machine tool for the process. The distribution of machine tools influences manufacturing. Certainly, we should give the distributions of machine tools, and the distribution is shown in Figure 8.
Second, we illustrate the processing logic of our proposed method. The production could be divided into inner and outer sides. To perform the whole process, we should calculate the processing time. The final processing time is shown in Figure 9.
Third, we establish the hybrid digital twin model. Like the previous presentation, we should establish the soft and the physical system. The soft system is shown in Figure 4. The physical system is established based on Figure 8 and Figure 9. Hence, the physical system is shown in Figure 10.

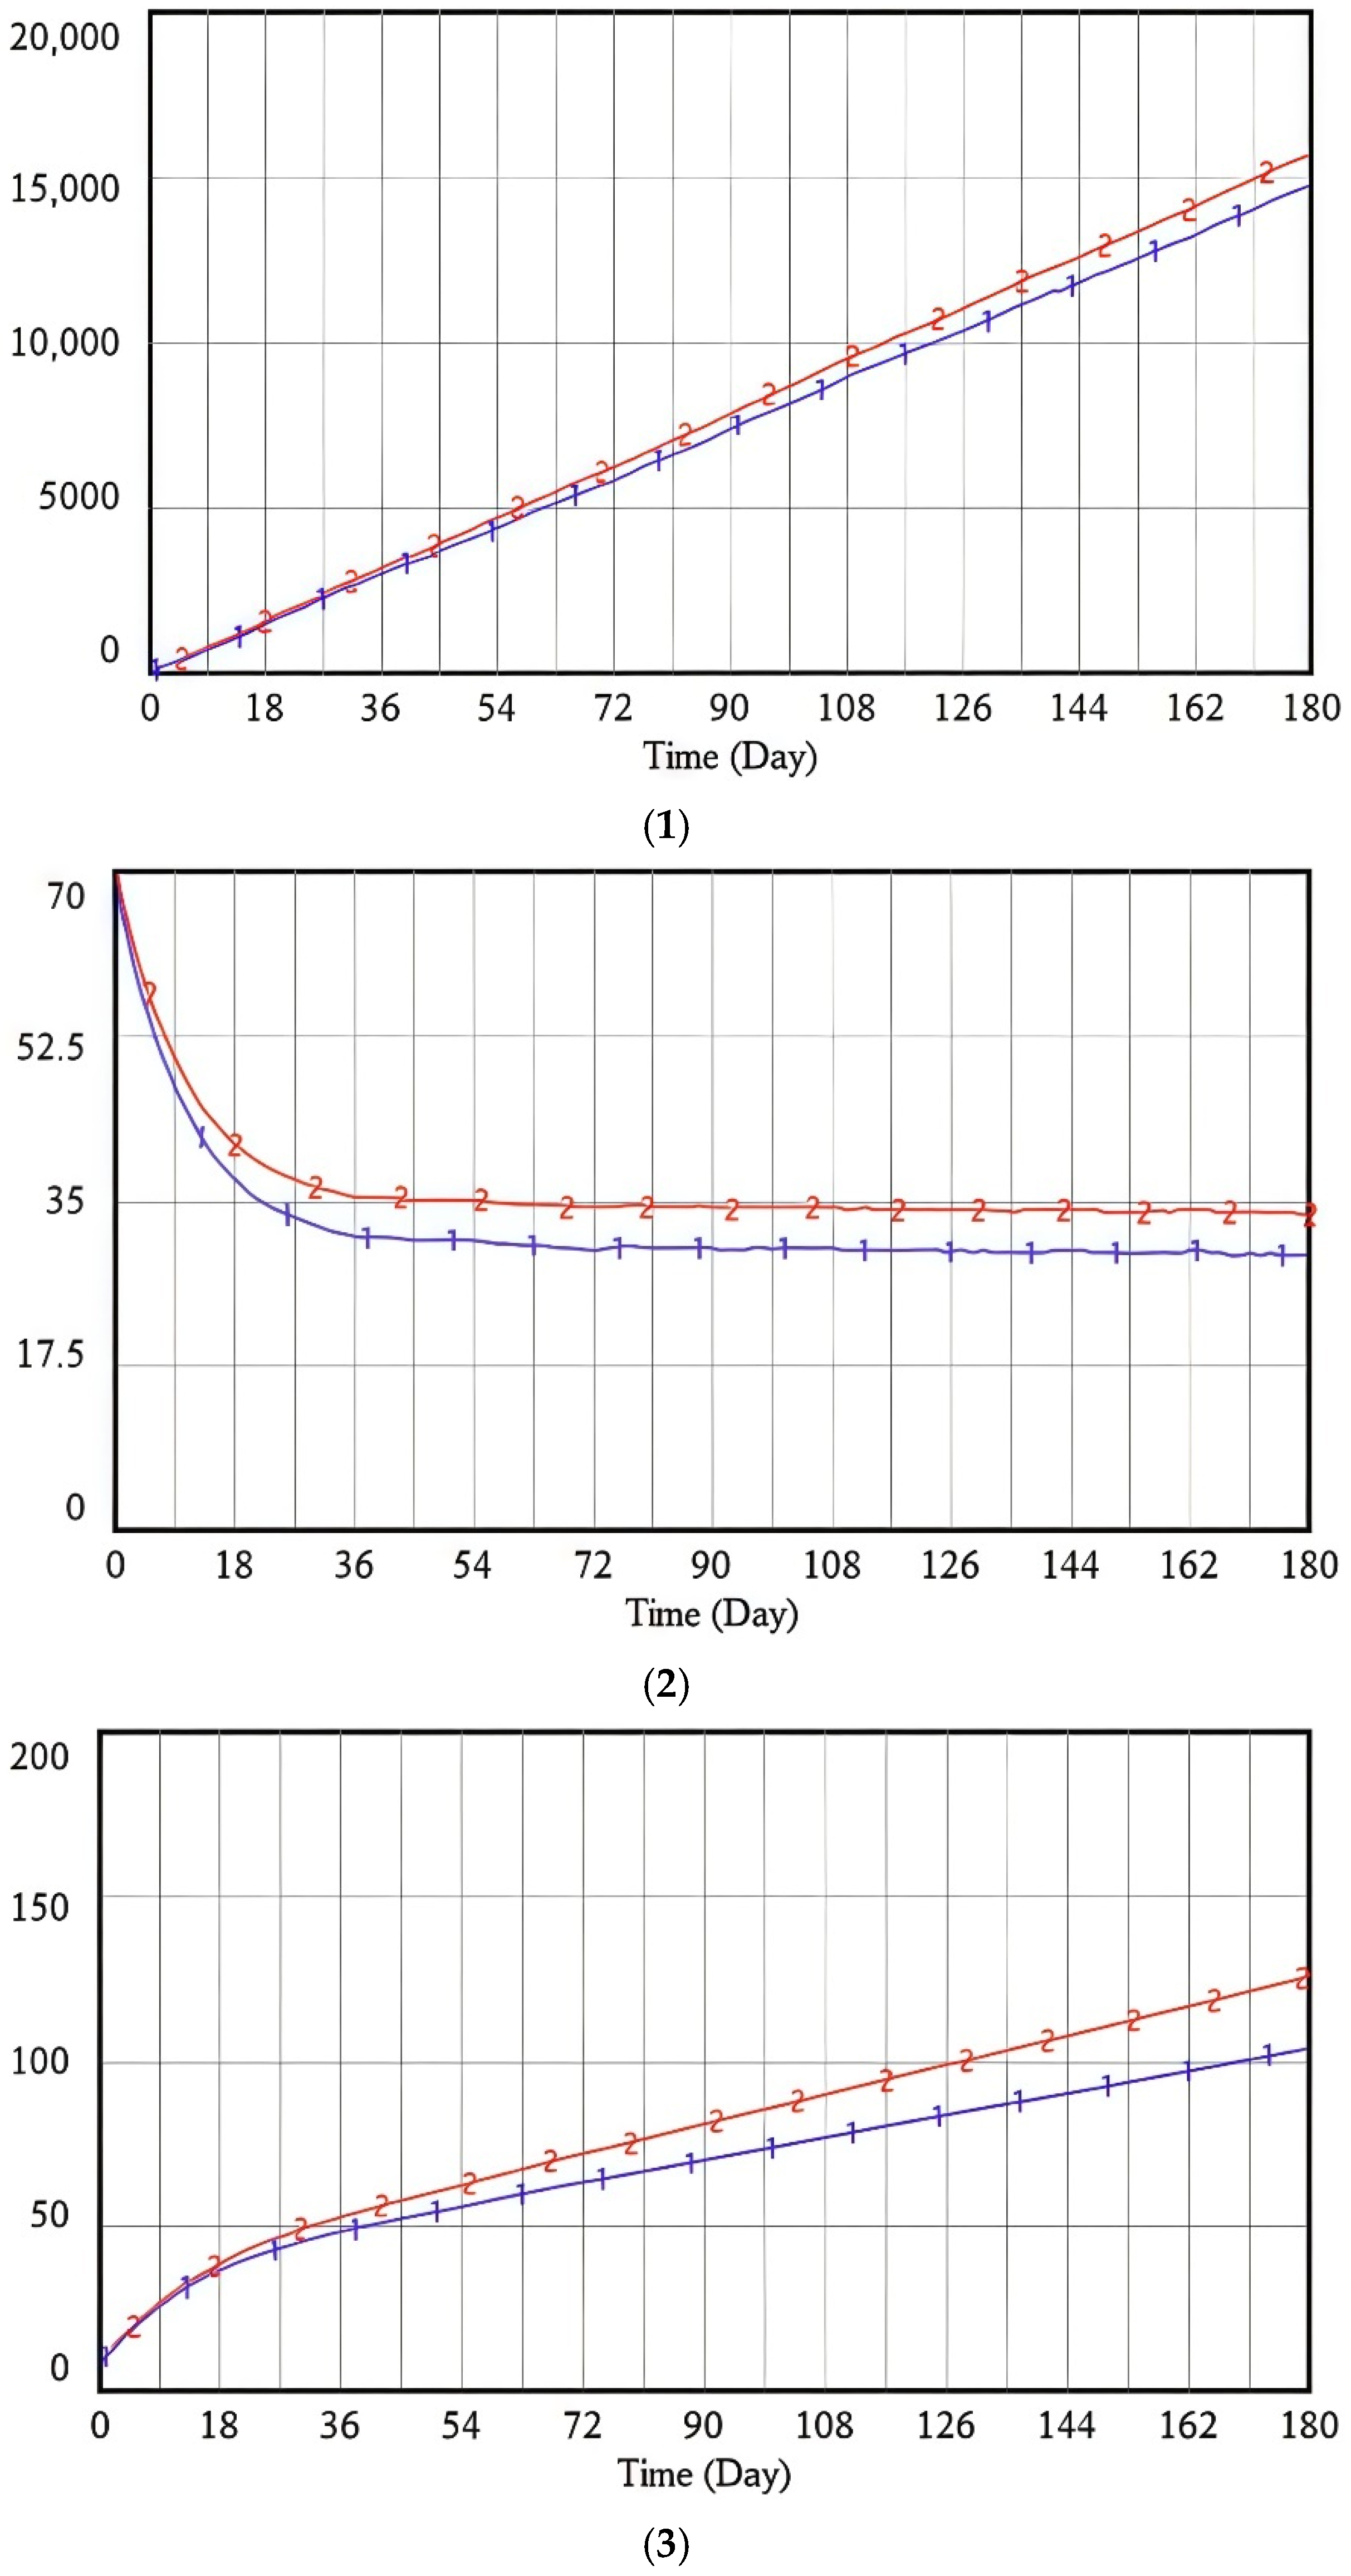
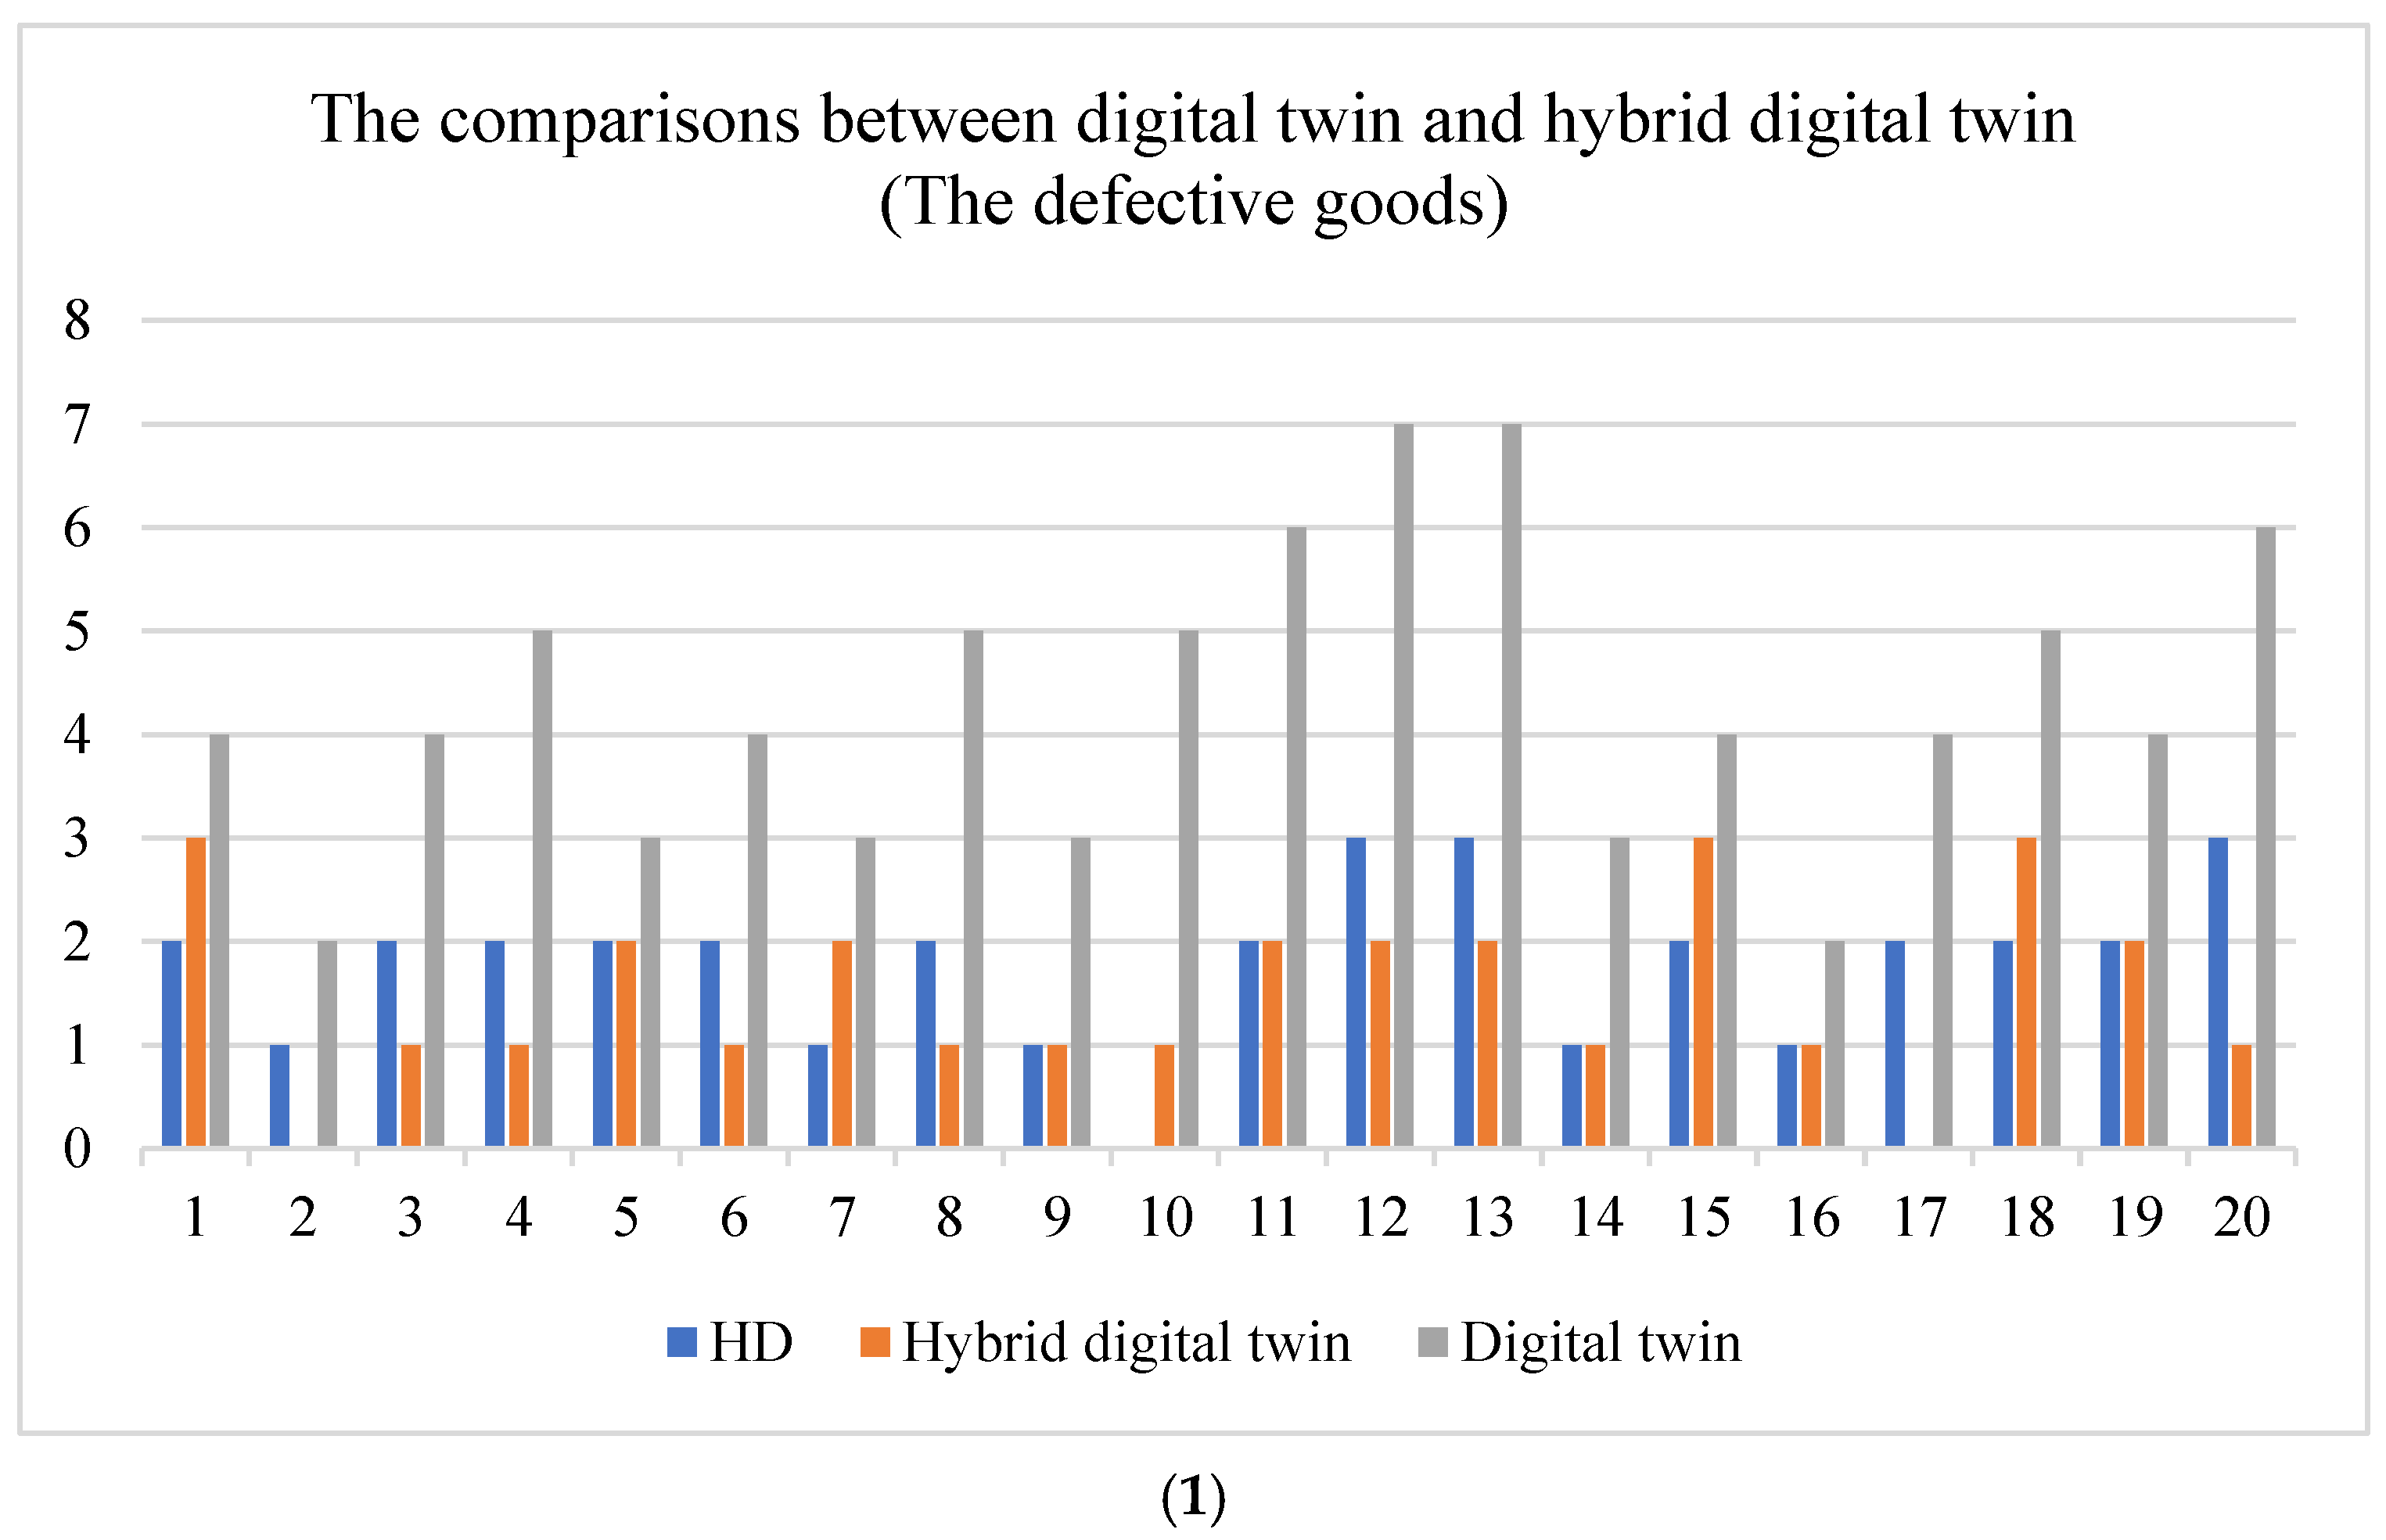
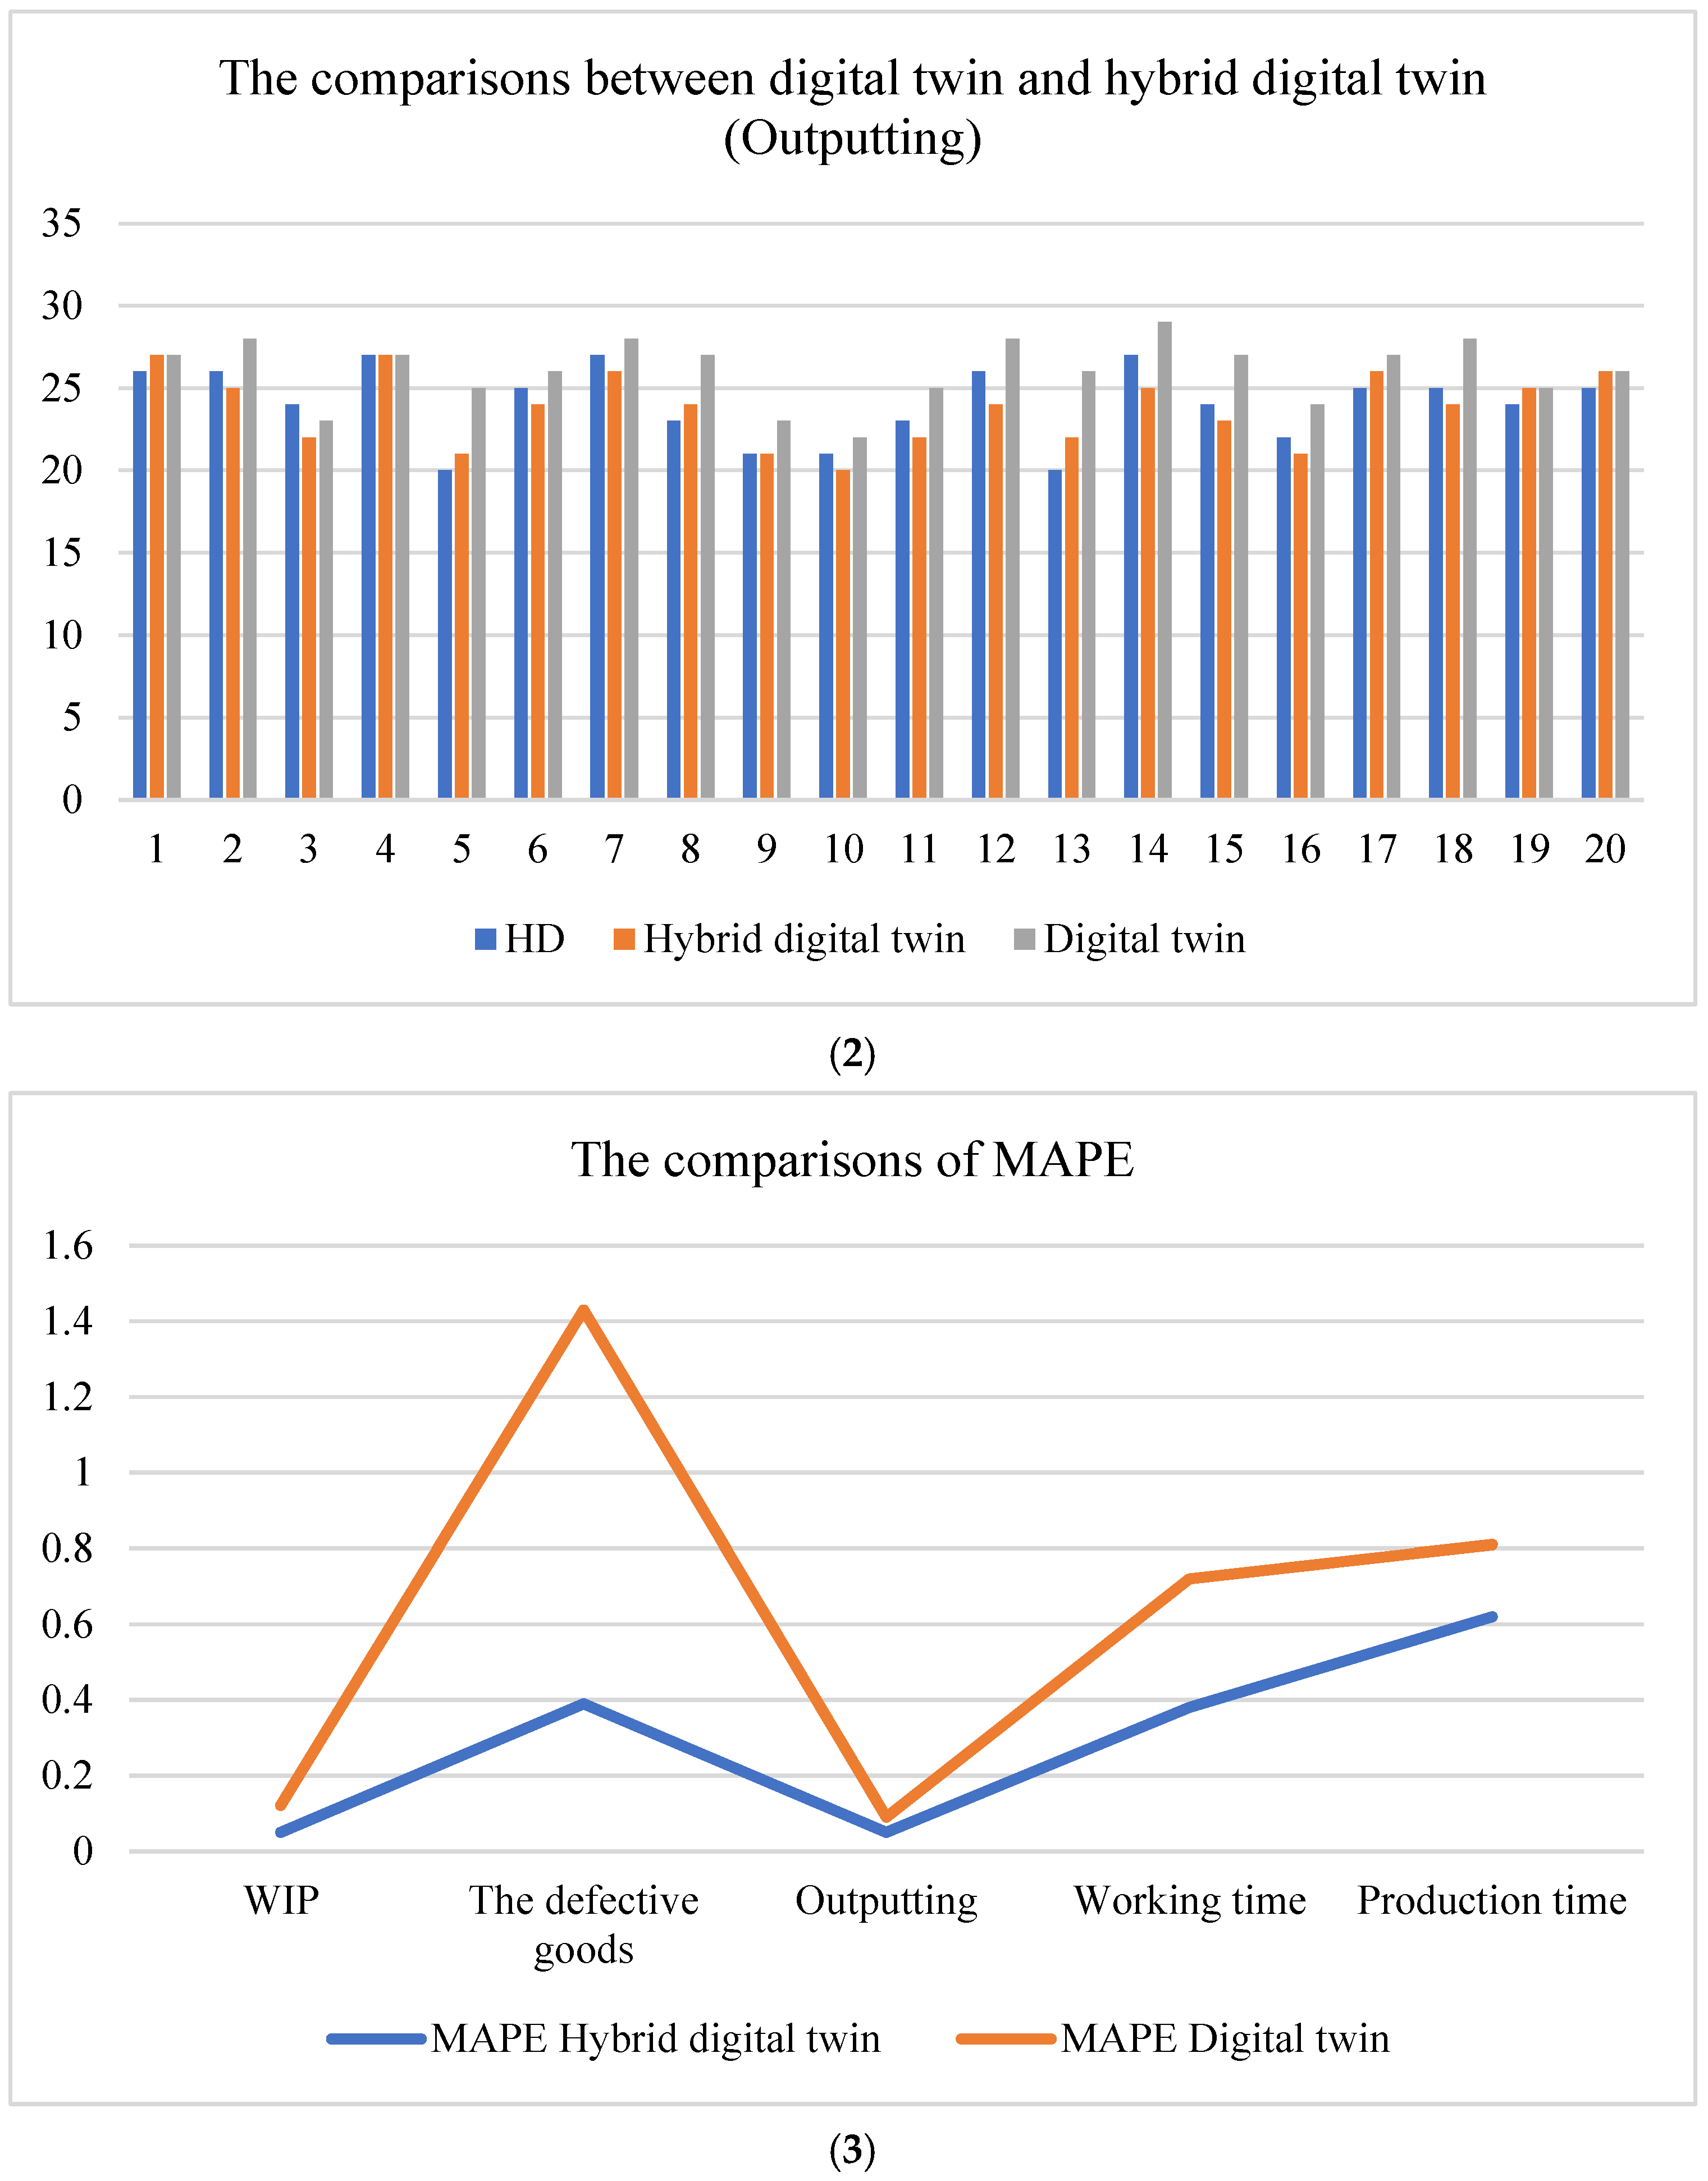
6.3. The Verification of the Hybrid Digital Twin Model

To further validate the predictive performance, we incorporated additional factory data. Several key metrics were evaluated, including work-in-progress (WIP), defect rates, output, working time, and production time. Table 4 compares the historical data (HD) predictions against the hybrid digital twin (HDT) data for WIP, defect rates, and output. Additionally, we calculated the Mean Absolute Percentage Error (MAPE) for each of these metrics, with the corresponding MAPE values presented in Table 5.
According to the comparisons, the difference is small. Certainly, the hybrid digital twin model could be used to reflect the real factory.

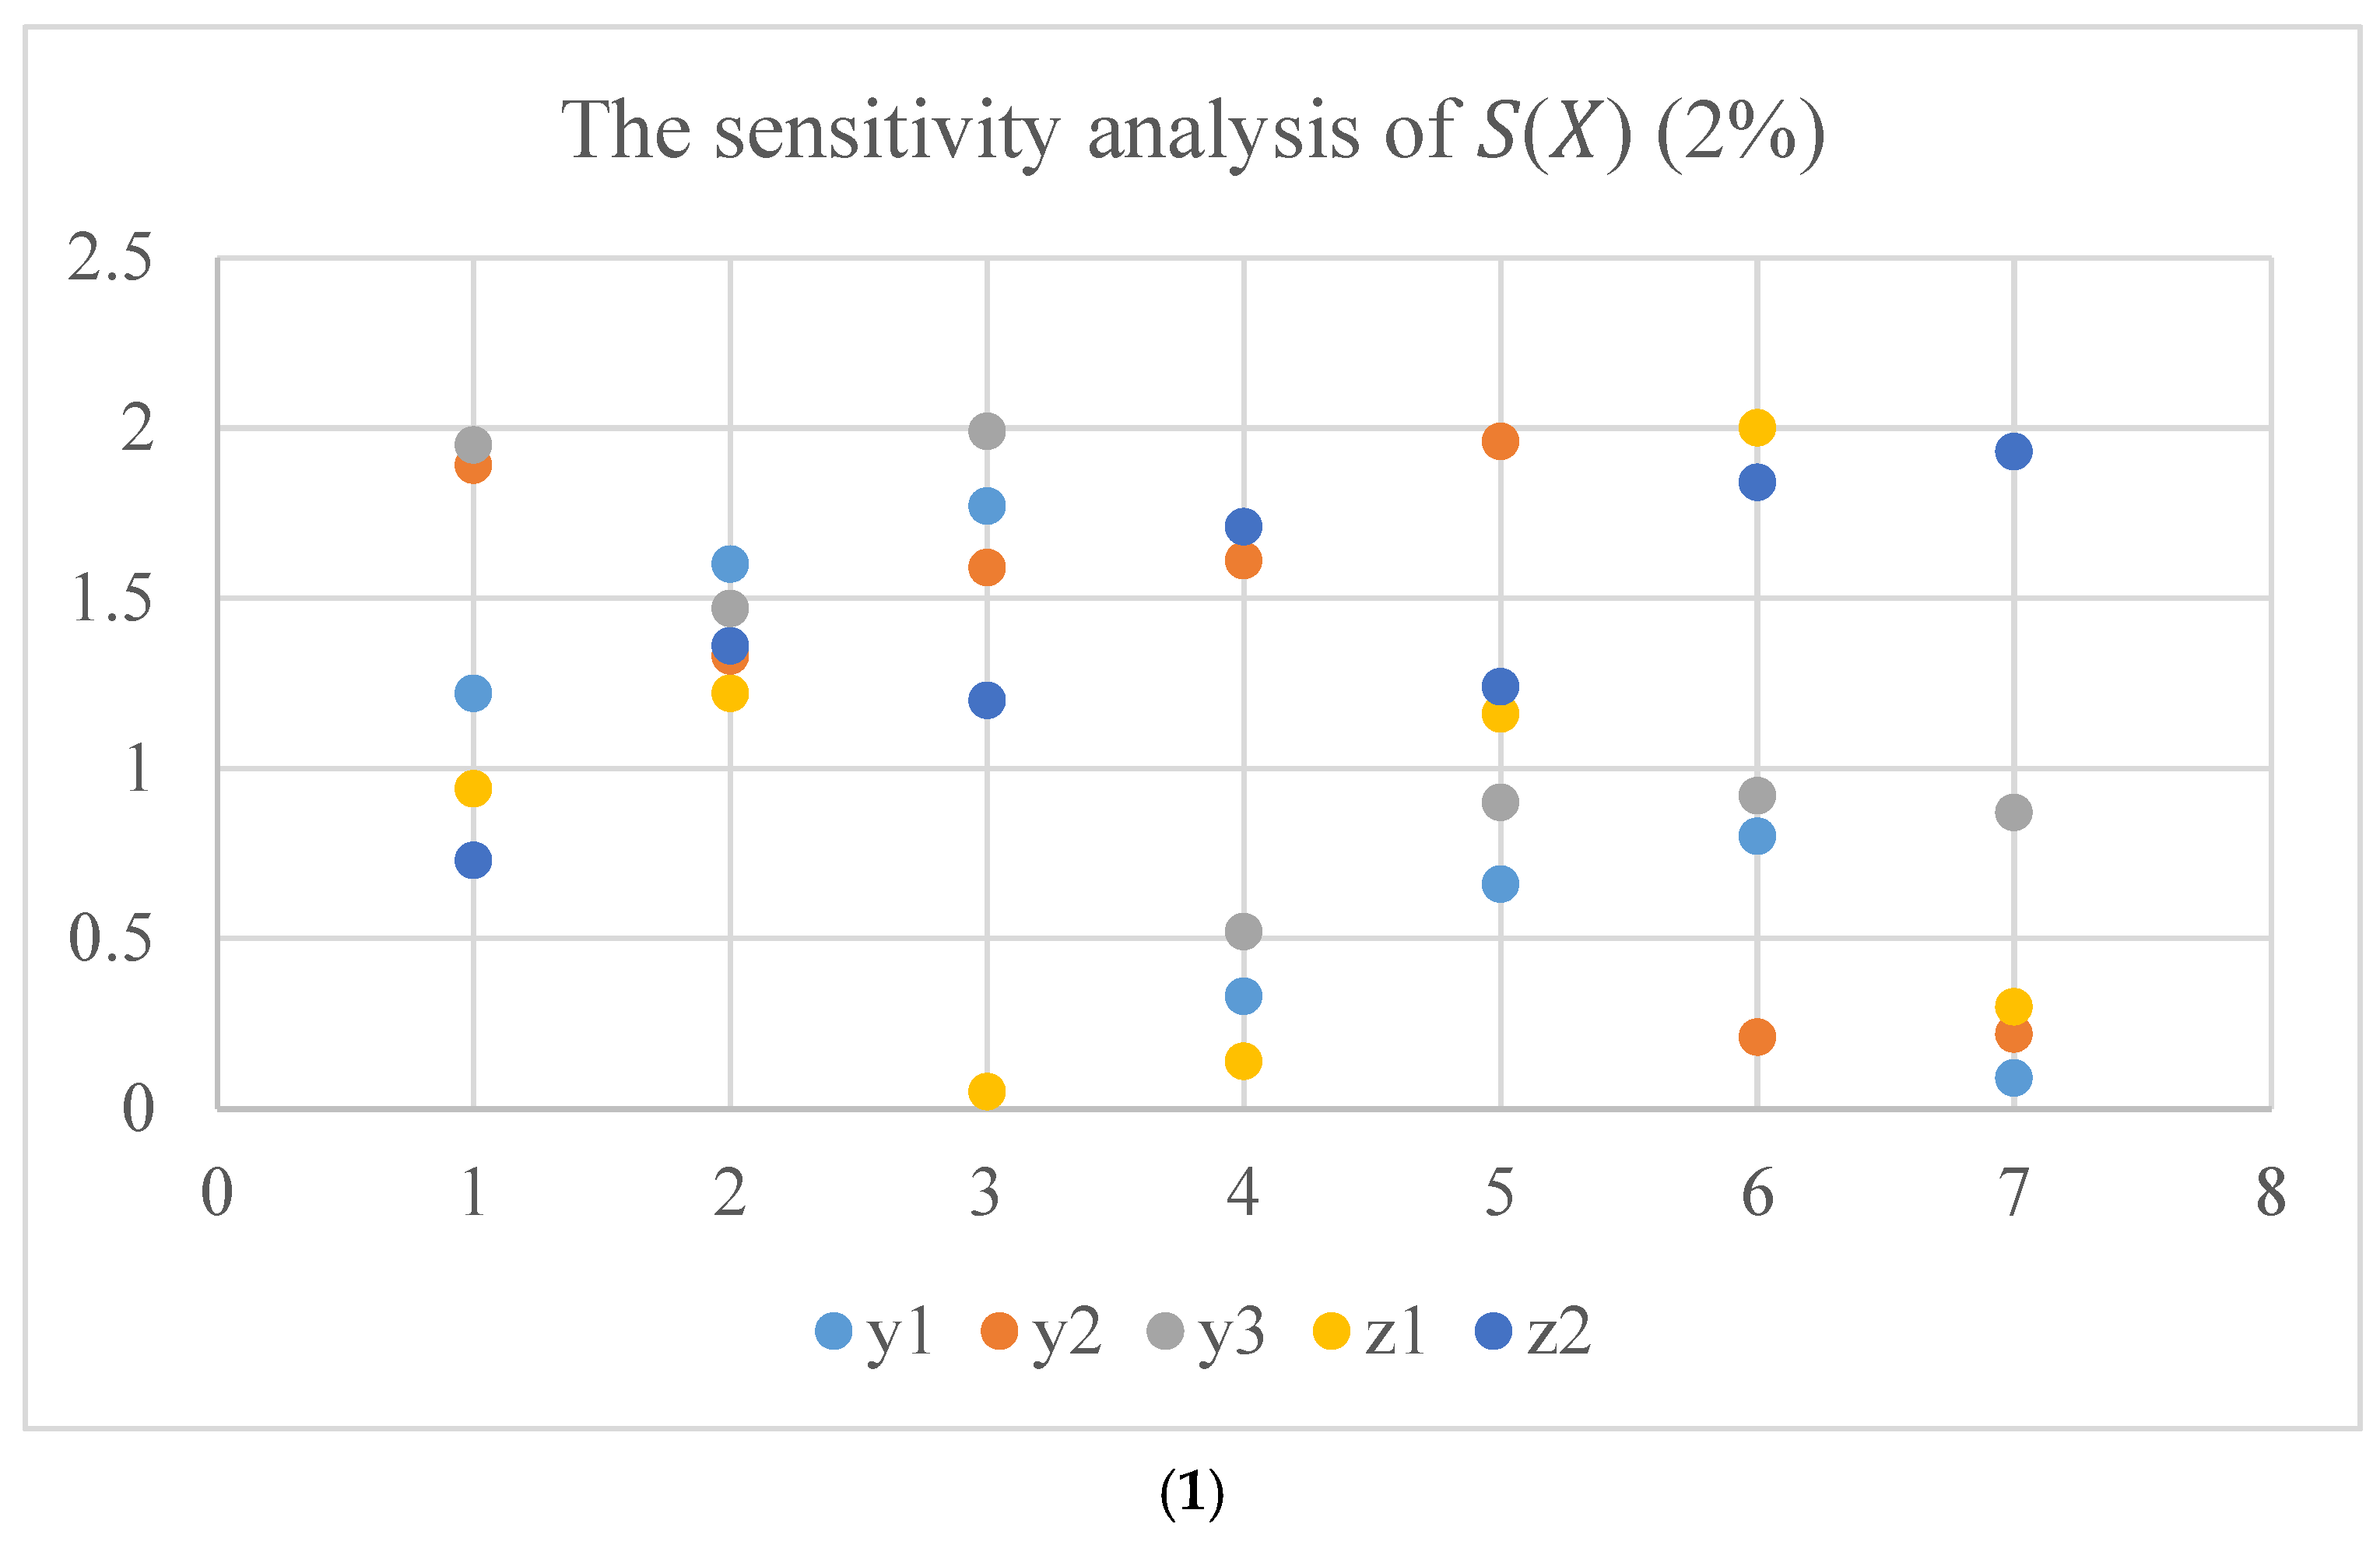
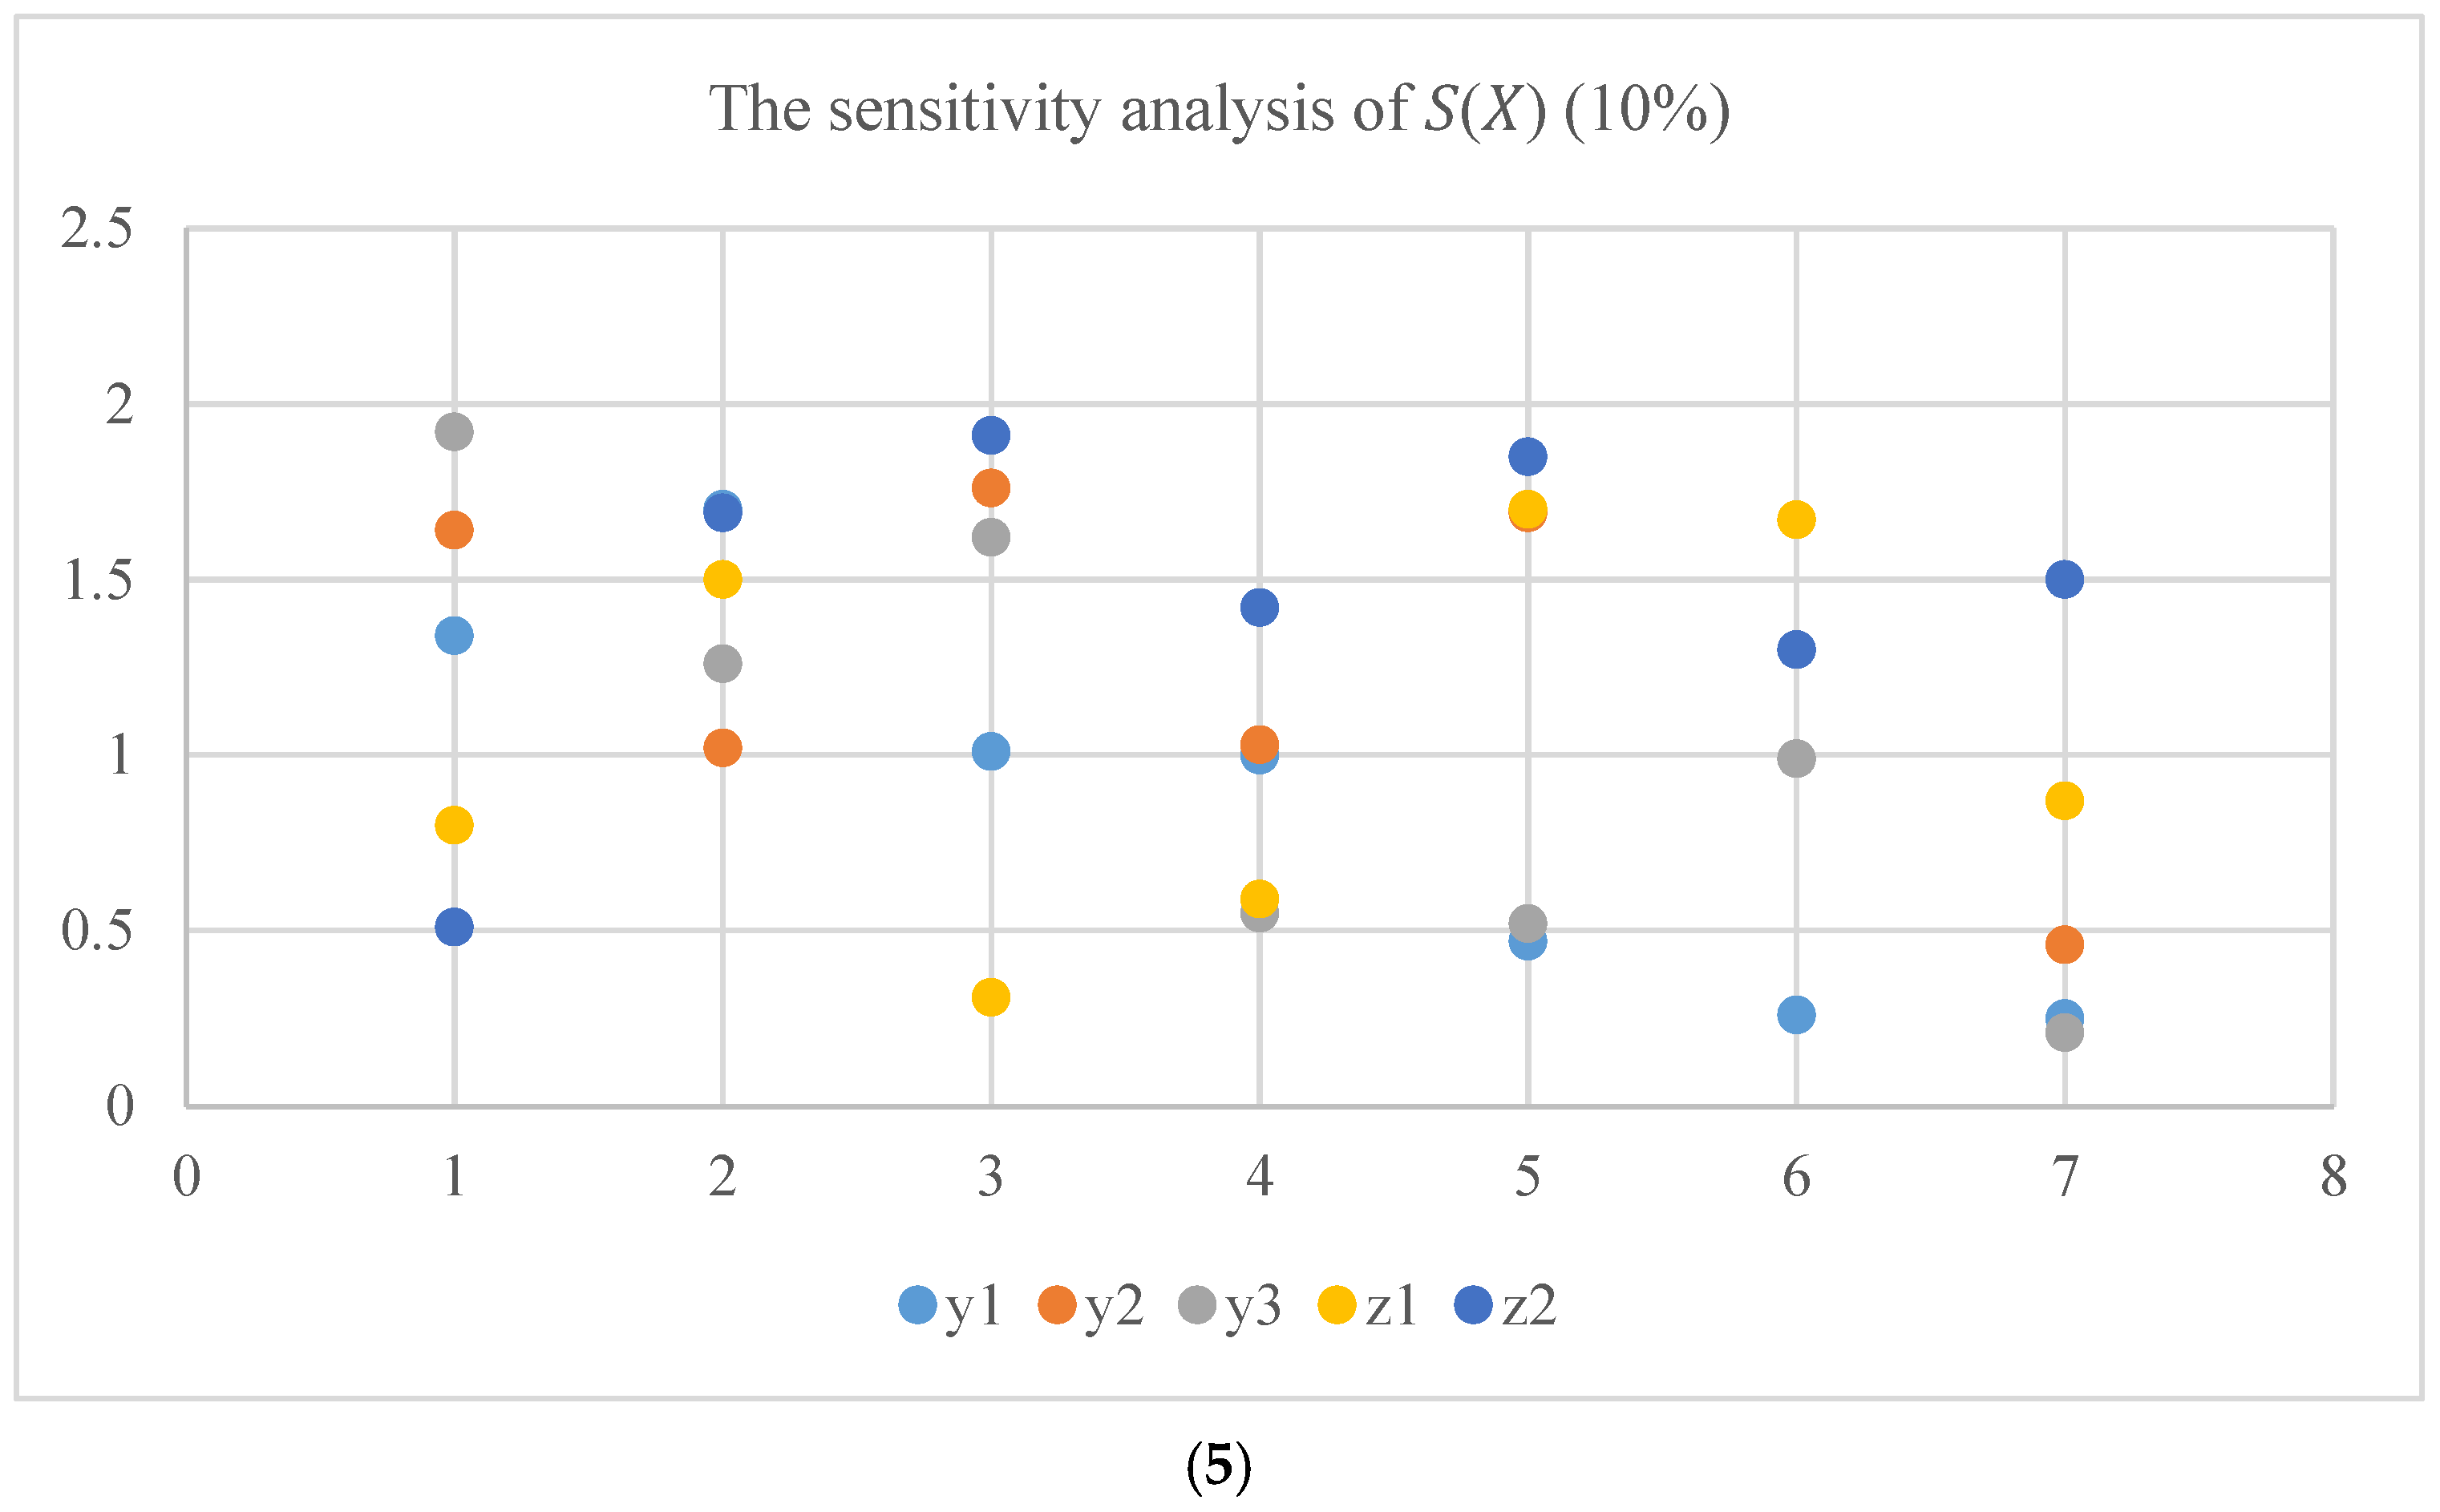
6.4. The Scheduling Based on the Hybrid Digital Twin Model

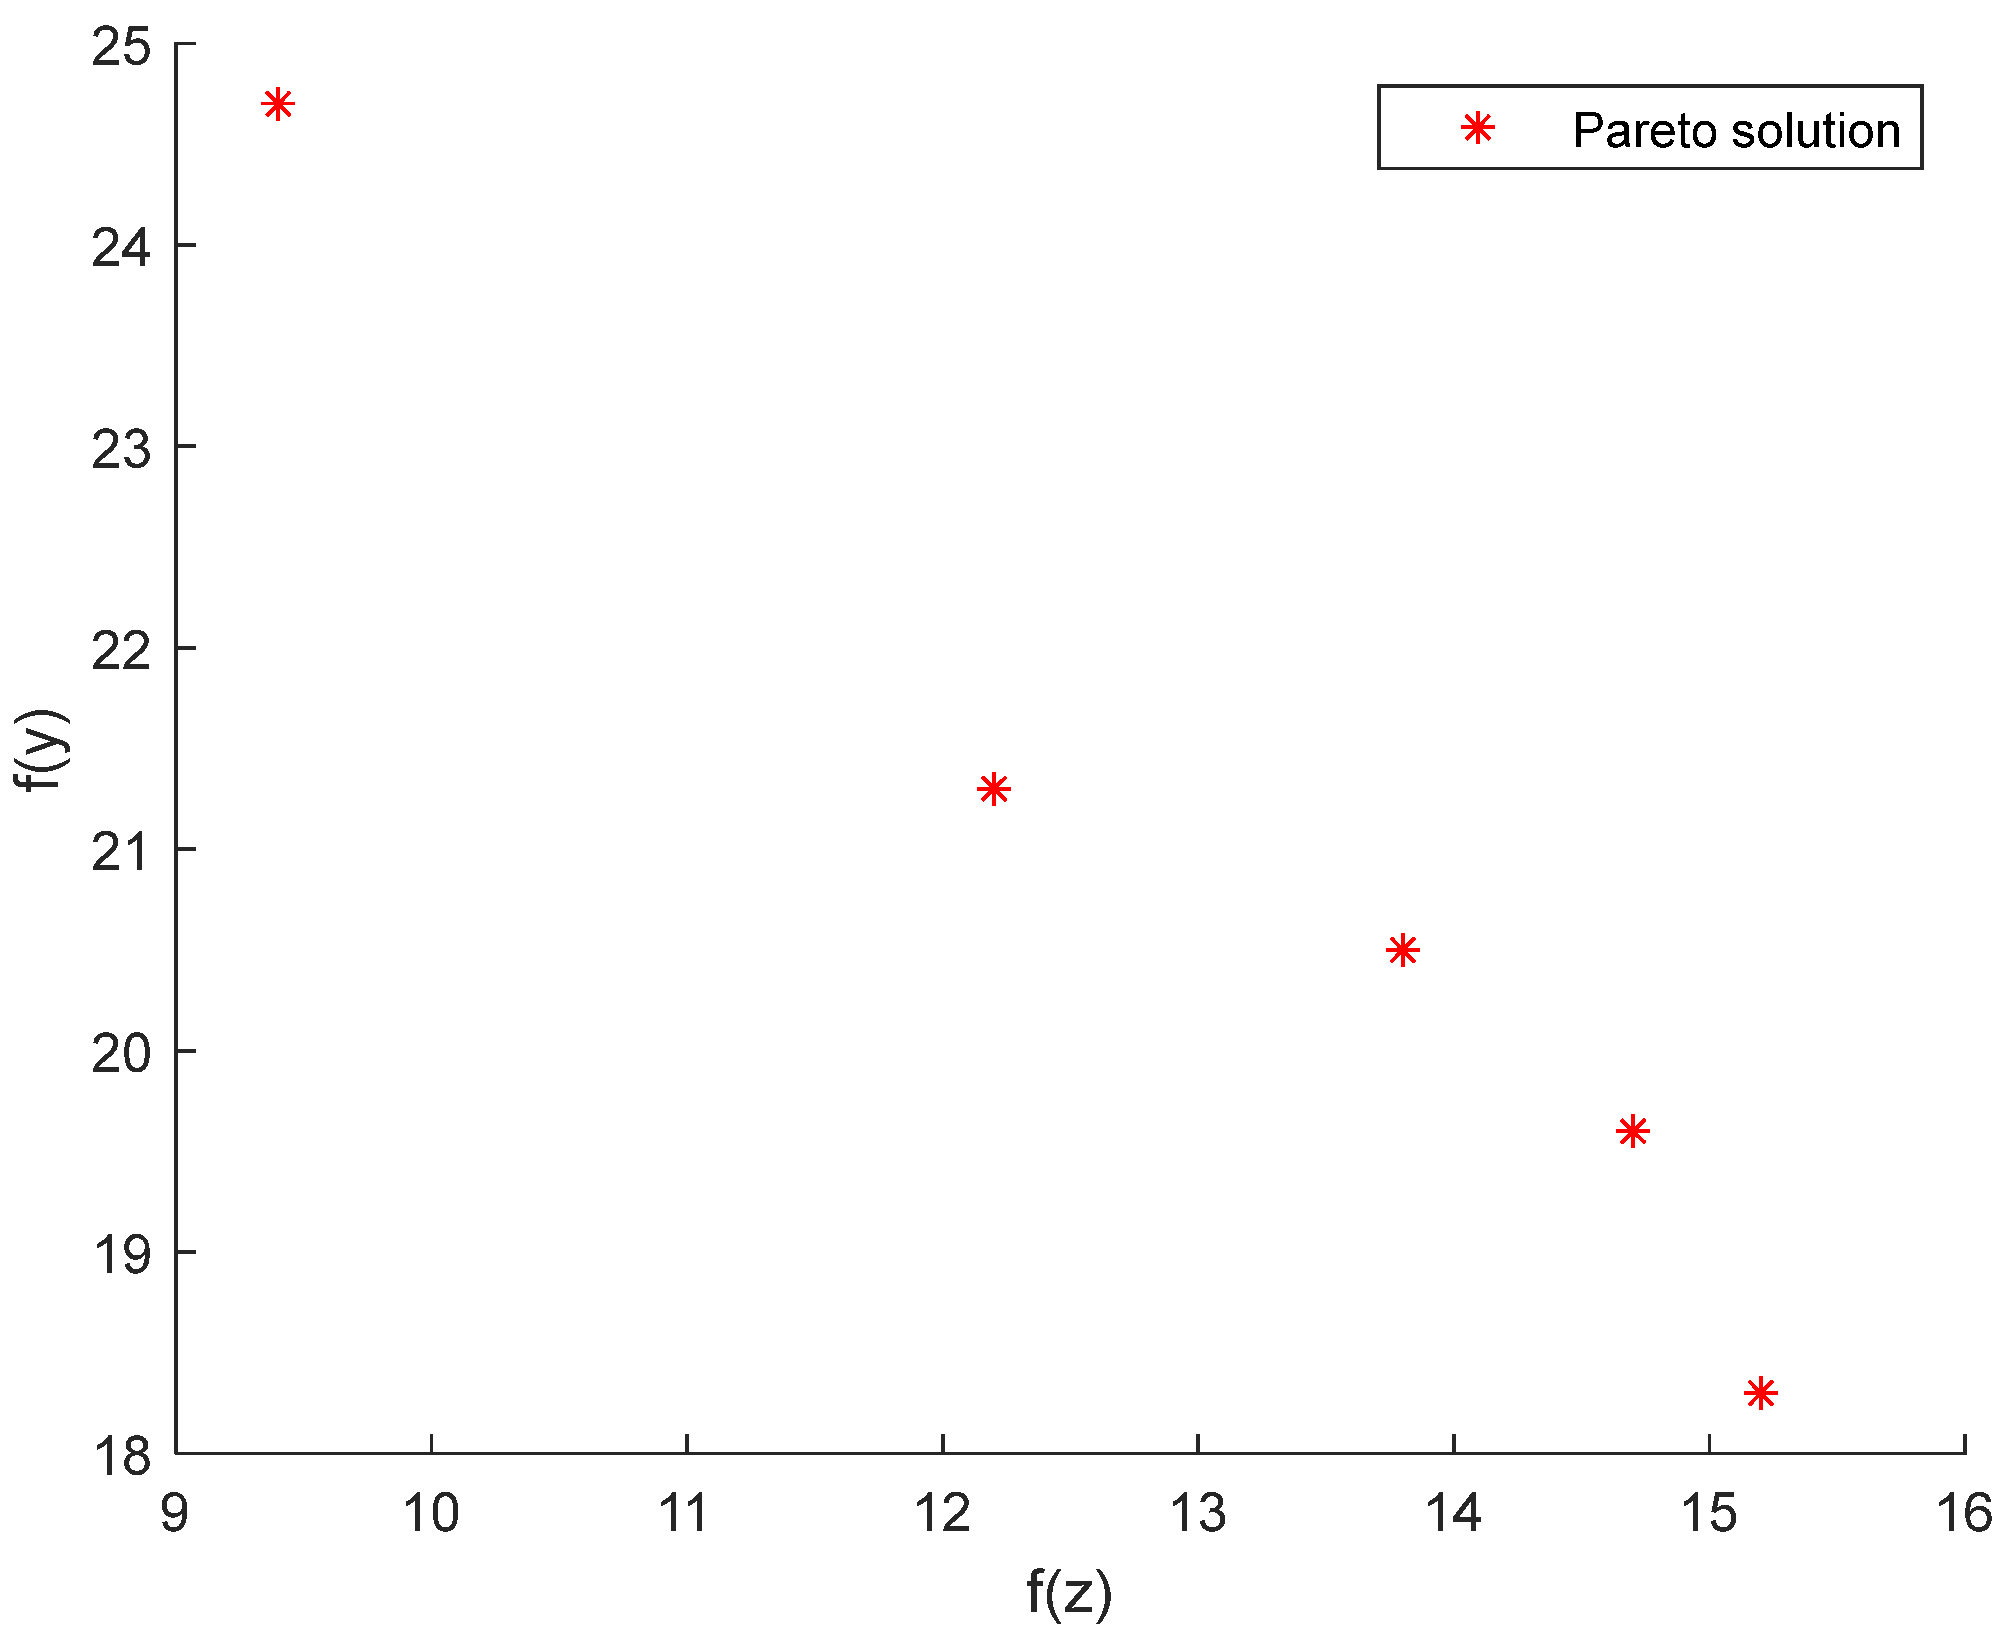
6.4.1. The Scheduling Results of Our Study

In our study, we use the hybrid digital twin model to find the scheduling. First, we should find the sensitive parameters of the hybrid digital twin model. Then, we establish the regression model between the objectives and sensitive parameters. After that, we solve the regression optimization model through the heuristic algorithm.
First, the sensitive parameters are detected based on the hybrid digital twin model. The objective of an enterprise’s lean implementation is to shorten the production cycle, reduce the work-in-progress inventory, and minimize defective products. The goal of green manufacturing is to decrease energy consumption and mitigate the evaporation of cutting fluid. Generally, like previous works, we increased the decision variables by ten percent and studied the changes in the target values. By applying Equation (1), the sensitivity parameters corresponding to each indicator—that is, the decision variables—are determined. Through analysis, it is revealed that the sensitivity parameters associated with the production cycle are equipment maintenance, 5S practices, and SMED efficiency. Those related to work-in-process inventory include equipment maintenance, 5S practices, SMED efficiency, semi-finishing (outer) cutting parameters, and semi-finishing (inner) cutting parameters. The sensitivity parameters linked to defective products encompass equipment maintenance, 5S practices, and SMED efficiency. The sensitivity parameters tied to energy consumption involve 5S practices, semi-finishing (inner) cutting parameters, and finishing (outer) cutting parameters. Finally, the sensitivity parameters concerning the evaporation of cutting fluid comprise 5S practices, semi-finishing (outer) cutting parameters, semi-finishing (inner) cutting parameters, finishing (outer) cutting parameters, and finishing (inner) cutting parameters.
To better present the results, we use some notations to represent the sensitive parameters. The results are shown in Table 6.
Also, we verify the robustness of our work. Primarily, we set a different range of fluctuation for each decision variable. Then, we calculate the S ( X ) of different objectives based on the fluctuation. Finally, we present the results in Figure 11.
According to Figure 11, although the sensitive value is not the same in different fluctuations, the conclusion is the same. The corresponding sensitive parameters for each objective remain the same across diverse runs. Certainly, the robustness of our result is verified.
Second, we establish the optimization model based on a regression model. After obtaining parameters, we use the regression model to perform the optimization. Also, we give the constraints of the model. The optimization model is shown in Formulas (4)–(10).
min f y i = k 1 y 1 + k 2 y 2 + k 3 y 3
min f z i = l 1 z 1 + l 2 z 2
y 1 = 21.67 0.38 × x 1 2.36 × x 2 7.6 × x 3 3.84 × x 1 2 0.72 × x 3 2 + 1.43 × x 1 × x 3
y 2 = 0.31 + 15.8 × x 1 + 19.21 × x 2 + 24.43 × x 3 2.47 × x 4 2.72 × x 5 0.28 × x 4 × x 5
y 3 = 125.21 14.55 × x 1 76.21 × x 2 40.49 × x 3 + 16.10 × x 1 × x 2 + 13.73 × x 2 × x 3
z 1 = 0.23 + 0.836 × x 5 + 1.31 × x 6 2.26 × x 2
z 2 = 0.77 + 0.95 × x 4 + 0.12 × x 5 + 0.55 × x 6 + 0.67 × x 7 0.34 × x 2 0.22 × x 3 × x 5 0.39 × x 4 × x 5
In Formulas (4)–(10), x 1 , x 2 , and x 3 , respectively, represent equipment maintenance, 5S, and SMED efficiency. x 4 , x 5 , x 6 , and , x 7 , respectively, represent the semi-finishing turning (external) cutting parameters, semi-finishing turning (internal) cutting parameters, finishing turning (external) cutting parameters, and finishing turning (internal) cutting parameters.
The rigorous validation techniques are adopted to verify the imitative effect. R2(Goodness of fit) is a traditional index, which is used to indicate the explanatory effect. Root Mean Square Error (RMSE) is also used to measure the predictive performances. Hence, we also used the index to measure the performance. The R2 of different fitted equations is shown in Table 7, and the RMSE is shown in Table 8.
Also, in addition to the objectives, we need to give other constraints. Equipment maintenance is restricted by the time it takes for the enterprise to obtain spare parts and the response time of the maintenance team. The upper limit of equipment maintenance is the downtime (in days) stipulated by the factory for the downtime accident. The constraints of equipment maintenance are shown in Formula (11).
0.2 x 1 0.6
Based on the regulations of Company A on overtime hours and the basic on-site maintenance time (in days) that workers complete, the constraints of the company’s “5S” are derived as shown in Formula (12).
0.6 x 2 1.3
According to the limitations of the factory’s fixtures and handling tools, the constraint conditions of SMED efficiency are as shown in Formula (13).
0.6 x 3 1
The selection of cutting parameters should not only meet the dimensional requirements but also the surface roughness requirements. According to the process instructions of the factory, the constraint conditions for each cutting parameter (in millimeters) are obtained in Formula (14):
2 x 4 3 2 x 5 3 1 x 6 1.5 0.8 x 7 1.2
The slewing bearing must undergo a cutting process, which involves a significant amount of material removal. Specifically, three machining stages are required: rough turning, semi-finishing turning, and finish turning. Considering the constraint of coarse machine tools, the remaining chipping allowance should meet the operation requirements of coarse turning. The remaining chipping allowance must exceed a minimum value to activate rough turning, yet remain below a maximum value to limit processing time. The sensitive parameters are x 4 and x 6 , and the chipping allowance of coarse turning equals certain value minus x 4 +   x 6 . If we set the range of x 4 +   x 6 , the requirement of chipping allowance could be met. Hence, we set the constraint for the remained chipping allowance of rough turning. The constraint is shown in Formula (15).
3     x 4 + x 6   5
Similarly, the inner slew bearing is shown in Formula (16).
3 x 5 + x 7 4
Certainly, the final objectives are shown in Formula (17).
min f y i , f z i
s . t . 0.2 x 1 0.6   0.6 x 2 1.3 0.6 x 3 1   2 x 4 3 2 x 5 3   1 x 6 1.5 0.8 x 7 1.2 3 x 4 + x 6 5 3 x 5 + x 7 4
Third, we use the NSGA-II to solve the problem. The computing results are shown in Figure 12.
The enterprise hopes that the final implemented plan can minimize the amount of defective products as much as possible. Therefore, the fifty groups of non-inferior solutions solved by the improved artificial bee colony algorithm are, respectively, substituted into the system dynamics model, and the system dynamics model is run. The plan with the lowest defective products is taken as the implementation plan. The values of the decision variables in the final implementation plan are 0.28, 1.18, 0.81, 2.3, 2.6, 1.1, and 1.15 for x 1 , x 2 , x 3 , x 4 , x 5 , x 6 , and x 7 , respectively.
As shown in Figure 13, compared with the original plan, after the enterprise implemented the improvement plan, its energy consumption decreased from 15,716.5 KW to 14,773.6 KW, a reduction of 6%; the amount of cutting fluid evaporation decreased from 129.7 units to 108.5 units, a reduction of 14.03%. The inventory of work-in-progress decreased from 33 pieces to 28 pieces, a reduction of 15.15%; the production cycle also decreased from 8.3 days to 6.9 days, a reduction of 16.87%. Therefore, the improved lean plan can further enhance the implementation level of lean production and reduce the enterprise’s impact on the environment.

6.4.2. The Advantages of Our Work

In our study, we propose a hybrid digital twin model to simulate the production activities within a factory. This hybrid system integrates both the physical system and the soft system, the latter of which has been largely overlooked in previous research. The omission of the soft system, encompassing elements such as scheduling, human factors, and operational policies, may limit the predictive accuracy of traditional digital twin models. The comparisons are shown in Figure 14.
Based on the analysis, three key findings can be drawn. First, the prediction values generated by the hybrid digital twin are consistently closer to the historical data than those from the physical-only model. Second, the MAPE values of our model are significantly lower across all five selected indicators, reaffirming its superior predictive capability. As MAPE is widely used in evaluating forecast accuracy, this result highlights the effectiveness of our approach. Third, the integration of the soft system proves to be essential for enhancing the fidelity of the digital twin. Since the soft system captures factory-level operational dynamics, it directly influences physical system outcomes. Consequently, the hybrid model offers a more holistic and accurate simulation of real-world manufacturing processes.

7. Conclusions and Future Work

In our study, we establish a hybrid digital twin model to support green manufacturing. The previous works mainly focused on the physical system, but neglected the soft system. Certainly, we address a critical gap in existing digital twin research, namely the lack of integration between physical systems and soft systems.
The main contributions of this study are as follows. First, we developed a hybrid modeling framework that integrates system dynamics with a physical simulation model. This framework allows for the simultaneous representation of shop-floor production and managerial operations. Second, we incorporated lean manufacturing principles into the soft system layer, enabling the simulation of how operational improvements affect production efficiency and sustainability. Third, we introduced an optimization method based on sensitive parameters, in which key decision variables are identified through sensitivity analysis. Regression models are then built to formulate a multi-objective scheduling problem, and an NSGA-II is used to find optimal solutions that improve both operational and environmental performance. Also, we validated the proposed approach using a real-world case study of a slew bearing factory. The results show that the hybrid digital twin model achieves higher prediction accuracy than conventional physical-only models.
Looking forward, several directions are worth exploring in future research. More advanced optimization algorithms could be applied to improve the efficiency of solving complex scheduling problems. Additional contextual variables such as supply disruptions, labor constraints, and dynamic policy changes could be included to enhance the realism of the model. Furthermore, the development of autonomous digital twin agents capable of learning from real-time data and adapting their behavior dynamically may help build more responsive and intelligent manufacturing systems.

Author Contributions

Conceptualization, S.W.; Methodology, S.F. and H.T.; Software, S.F.; Validation, S.F., H.T. and S.W.; Formal Analysis, S.F.; Investigation, H.T.; Resources, H.T.; Data Curation, S.F. and S.W.; Writing—Original Draft Preparation, S.F. and H.T.; Writing—Review & Editing, S.F. and H.T.; Visualization, S.W.; Supervision, H.T.; Project Administration, S.W.; Funding Acquisition, S.W. All authors have read and agreed to the published version of the manuscript.

Funding

This research was funded by Basic Science (Natural Science) Research Project of Higher Education Institutions of Jiangsu Province [23KJB62006], the Humanities and Social Sciences Program of the Ministry of Education [23YJCZH201], Jiangsu Social Science Foundation (23GLLC015), National Natural Science Foundation of China [72401128], and the Natural Science Foundation of Jiangsu Province [BK20240537]. The APC was funded by the Natural Science Foundation of Jiangsu Province [BK20240537].

Data Availability Statement

The original contributions presented in this study are included in the article. Further inquiries can be directed to the corresponding author.

Acknowledgments

Thank you for the FlexSim company’ permission.

Conflicts of Interest

The authors declare no conflict of interest.

References

  1. Duran, K.; Canberk, B. Digital Twin Enriched Green Topology Discovery for Next Generation Core Networks. IEEE Trans. Green Commun. Netw. 2023, 7, 1946–1956. [Google Scholar] [CrossRef]
  2. Ivanov, D. Conceptualisation of a 7-element digital twin framework in supply chain and operations management. Int. J. Prod. Res. 2024, 62, 2220–2232. [Google Scholar] [CrossRef]
  3. Kumbhar, M.; Ng, A.H.; Bandaru, S. A digital twin based framework for detection, diagnosis, and improvement of throughput bottlenecks. J. Manuf. Syst. 2023, 66, 92–106. [Google Scholar] [CrossRef]
  4. Jia, W.; Wang, W.; Zhang, Z. From simple digital twin to complex digital twin part II: Multi-scenario applications of digital twin shop floor. Adv. Eng. Inform. 2023, 56, 101915. [Google Scholar] [CrossRef]
  5. Kim, H.; Ben-Othman, J. Eco-Friendly Low Resource Security Surveillance Framework Toward Green AI Digital Twin. IEEE Commun. Lett. 2022, 27, 377–380. [Google Scholar] [CrossRef]
  6. Wang, Y.; Wang, S.; Yang, W.; Shen, C.; Li, J. A digital-twin-based adaptive multi-objective Harris Hawks Optimizer for dynamic hybrid flow green scheduling problem with dynamic events. Appl. Soft Comput. 2023, 143, 110274. [Google Scholar] [CrossRef]
  7. van Eyk, L.; Heyns, P.S. A framework to define, design and construct digital twins in the mining industry. Comput. Ind. Eng. 2025, 200, 110805. [Google Scholar] [CrossRef]
  8. Li, D.; Li, J. Big data of enterprise supply chain under green financial system based on digital twin technology. Kybernetes 2024, 53, 543–556. [Google Scholar] [CrossRef]
  9. Tao, F.; Zhang, H.; Zhang, C. Advancements and challenges of digital twins in industry. Nat. Comput. Sci. 2024, 4, 169–177. [Google Scholar] [CrossRef] [PubMed]
  10. Javaid, M.; Haleem, A.; Suman, R. Digital Twin applications toward Industry 4.0: A Review. Cogn. Robot. 2023, 3, 71–92. [Google Scholar] [CrossRef]
  11. Chen, Z.; Surendraarcharyagie, K.; Granland, K.; Chen, C.; Xu, X.; Xiong, Y.; Davies, C.; Tang, Y. Service oriented digital twin for additive manufacturing process. J. Manuf. Syst. 2024, 74, 762–776. [Google Scholar] [CrossRef]
  12. Sun, X.; Zhang, F.; Wang, J.; Yang, Z.; Huang, Z.; Xue, R. Digital twin for smart manufacturing equipment: Modeling and applications. Int. J. Adv. Manuf. Technol. 2025, 137, 4929–4946. [Google Scholar] [CrossRef]
  13. Wright, L.; Davidson, S. Digital twins for metrology; metrology for digital twins. Meas. Sci. Technol. 2024, 35, 051001. [Google Scholar] [CrossRef]
  14. Xia, T.; Sun, H.; Ding, Y.; Han, D.; Qin, W.; Seidelmann, J.; Xi, L. Digital twin-based real-time energy optimization method for production line considering fault disturbances. J. Intell. Manuf. 2025, 36, 569–593. [Google Scholar] [CrossRef]
  15. Elemure, I.; Dhakal, H.N.; Leseure, M.; Radulovic, J. Integration of Lean Green and Sustainability in Manufacturing: A Review on Current State and Future Perspectives. Sustainability 2023, 15, 10261. [Google Scholar] [CrossRef]
  16. Porras, J.E.O.; Erquínigo, A.M.B.; Chávez, T.C.C.; Palma, L.M.H.; Torres, R.K.M.; Gomez, O.R.T. Green Lean Six Sigma model for waste reduction of raw material in a nectar manufacturing company of Lima, Peru. J. Ind. Eng. Manag. 2023, 16, 169–185. [Google Scholar] [CrossRef]
  17. Yadav, V.; Kaswan, M.S.; Gahlot, P.; Duhan, R.K.; Garza-Reyes, J.A.; Rathi, R.; Chaudhary, R.; Yadav, G. Green Lean Six Sigma for sustainability improvement: A systematic review and future research agenda. Int. J. Lean Six Sigma 2023, 14, 759–790. [Google Scholar] [CrossRef]
  18. Shao, G.; Helu, M. Framework for a digital twin in manufacturing: Scope and requirements. Manuf. Lett. 2020, 24, 105–107. [Google Scholar] [CrossRef] [PubMed]
  19. Melesse, T.Y.; Di Pasquale, V.; Riemma, S. Digital twin models in industrial operations: A systematic literature review. Procedia Manuf. 2020, 42, 267–272. [Google Scholar] [CrossRef]
  20. Negri, E.; Fumagalli, L.; Macchi, M. A Review of the Roles of Digital Twin in CPS-based Production Systems. Procedia Manuf. 2017, 11, 939–948. [Google Scholar] [CrossRef]
  21. Leng, J.; Zhang, H.; Yan, D.; Liu, Q.; Chen, X.; Zhang, D. Digital twin-driven manufacturing cyber-physical system for parallel controlling of smart workshop. J. Ambient. Intell. Humaniz. Comput. 2019, 10, 1155–1166. [Google Scholar] [CrossRef]
  22. Asad, U.; Khan, M.; Khalid, A.; Lughmani, W.A. Human-Centric Digital Twins in Industry: A Comprehensive Review of Enabling Technologies and Implementation Strategies. Sensors 2023, 23, 3938. [Google Scholar] [CrossRef]
  23. Ramasubramanian, A.K.; Mathew, R.; Kelly, M.; Hargaden, V.; Papakostas, N. Digital Twin for Human–Robot Collaboration in Manufacturing: Review and Outlook. Appl. Sci. 2022, 12, 4811. [Google Scholar] [CrossRef]
  24. Hananto, A.L.; Tirta, A.; Herawan, S.G.; Idris, M.; Soudagar, M.E.M.; Djamari, D.W.; Veza, I. Digital Twin and 3D Digital Twin: Concepts, Applications, and Challenges in Industry 4.0 for Digital Twin. Computers 2024, 13, 100. [Google Scholar] [CrossRef]
  25. Errandonea, I.; Beltrán, S.; Arrizabalaga, S. Digital Twin for maintenance: A literature review. Comput. Ind. 2020, 123, 103316. [Google Scholar] [CrossRef]
  26. Opoku, D.-G.J.; Perera, S.; Osei-Kyei, R.; Rashidi, M. Digital twin application in the construction industry: A literature review. J. Build. Eng. 2021, 40, 102726. [Google Scholar] [CrossRef]
  27. Lo, C.; Chen, C.; Zhong, R.Y. A review of digital twin in product design and development. Adv. Eng. Inform. 2021, 48. [Google Scholar] [CrossRef]
  28. Shahat, E.; Hyun, C.T.; Yeom, C. City digital twin potentials: A review and research agenda. Sustainability 2021, 13, 3386. [Google Scholar] [CrossRef]
  29. Botín-Sanabria, D.M.; Mihaita, A.-S.; Peimbert-García, R.E.; Ramírez-Moreno, M.A.; Ramírez-Mendoza, R.A.; Lozoya-Santos, J.d.J. Digital Twin Technology Challenges and Applications: A Comprehensive Review. Remote Sens. 2022, 14, 1335. [Google Scholar] [CrossRef]
  30. Ding, G.; Guo, S.; Wu, X. Dynamic Scheduling Optimization of Production Workshops Based on Digital Twin. Appl. Sci. 2022, 12, 10451. [Google Scholar] [CrossRef]
  31. Li, Z.; Chen, Y. Dynamic scheduling of multi-memory process flexible job shop problem based on digital twin. Comput. Ind. Eng. 2023, 183, 109498. [Google Scholar] [CrossRef]
  32. Gao, Q.; Liu, J.; Li, H.; Zhuang, C.; Liu, Z. Digital twin-driven dynamic scheduling for the assembly workshop of complex products with workers allocation. Robot. Comput. Manuf. 2024, 89, 102786. [Google Scholar] [CrossRef]
  33. Forrester, J.W. Industrial dynamics. J. Oper. Res. Soc. 1961, 48, 1037–1041. [Google Scholar] [CrossRef]
  34. Choi, J.; Moon, S.; Min, S. Digital twin simulation modeling process with system dynamics: An application to naval ship operation. Int. J. Robust Nonlinear Control 2023, 33, 10136–10150. [Google Scholar] [CrossRef]
  35. Tong, X.; Bao, J.; Tao, F. Co-evolutionary digital twins: A multidimensional dynamic approach to digital engineering. Adv. Eng. Inform. 2024, 61, 102554. [Google Scholar] [CrossRef]
  36. Wen, J.; Gabrys, B.; Musial, K. Toward Digital Twin Oriented Modeling of Complex Networked Systems and Their Dynamics: A Comprehensive Survey. IEEE Access 2022, 10, 66886–66923. [Google Scholar] [CrossRef]
  37. Yan, M.-R.; Hong, L.-Y.; Warren, K. Integrated knowledge visualization and the enterprise digital twin system for supporting strategic management decision. Manag. Decis. 2022, 60, 1095–1115. [Google Scholar] [CrossRef]
  38. Florescu, A.; Barabas, S. Development Trends of Production Systems Through the Integration of Lean Management and Industry 4.0. Appl. Sci. 2022, 12, 4885. [Google Scholar] [CrossRef]
  39. Buer, S.-V.; Semini, M.; Strandhagen, J.O.; Sgarbossa, F. The complementary effect of lean manufacturing and digitalisation on operational performance. Int. J. Prod. Res. 2021, 59, 1976–1992. [Google Scholar] [CrossRef]
  40. Bazaz, S.M.; Lohtander, M.; Varis, J. 5-dimensional definition for a manufacturing digital twin. Procedia Manuf. 2019, 38, 1705–1712. [Google Scholar] [CrossRef]
Figure 1. Framework of the hybrid digital twin system.
Systems 13 00651 g001
Figure 2. System dynamics model of QCS. (“+” means positive; “−” means negative.).
Systems 13 00651 g002
Figure 3. The whole OOP. (“+” means positive; “−” means negative.).
Systems 13 00651 g003
Figure 4. The operation system of the production. (“+” means positive; “−” means negative.).
Systems 13 00651 g004
Figure 5. The physical system of the production process.
Systems 13 00651 g005
Figure 6. The exchange process of the system dynamics model.
Systems 13 00651 g006
Figure 7. The research design of our work.
Systems 13 00651 g007
Figure 8. The distributions of machine tools.
Systems 13 00651 g008
Figure 9. The processing time of each process.
Systems 13 00651 g009
Figure 10. The physical digital twin model of the factory.
Systems 13 00651 g010
Figure 11. The sensitivity analysis of S(X). (1) The sensitivity analysis of S(X) (2%). (2) The sensitivity analysis of S(X) (4%). (3) The sensitivity analysis of S(X) (6%). (4) The sensitivity analysis of S(X) (8%). (5) The sensitivity analysis of S(X) (10%).
Systems 13 00651 g011aSystems 13 00651 g011bSystems 13 00651 g011c
Figure 12. The Pareto solutions of our work.
Systems 13 00651 g012
Figure 13. The performance of our method. Note: “1” indicates the result after optimization; “2” indicates the result of the original model. (1) The energy consumption. (2) The products waiting in the process. (3) The evaporation of cutting fluid. (4) The production cycle time.
Systems 13 00651 g013aSystems 13 00651 g013b
Figure 14. The comparisons between the digital twin and the hybrid digital twin. (1) The defective goods (HD means historical data, which is shown in the manuscript before). (2) Outputting. (3) The comparisons of MAPE.
Systems 13 00651 g014aSystems 13 00651 g014b
Table 1. The meaning of table function in operation system.
NameMeaning
The relationship between machine spot checks and failuresIndicating the relationship between the machine spot checks and failure
The relationship between machine inspection and efficiencyIndicating the relationship between machine inspection and efficiency
Relationship between employee fatigue and error rateIndicating the relationship between employee fatigue and error rate
Table 2. The formulas in the system dynamics model.
The NotationThe Formulas
The pressure of the delivery timeThe total number of orders × α 1
Machine malfunctionThe wear of machining equipment ×   α 2 Machine spot check ×   α 3
Employee fatigueWorking time ×   α 4 5S ×   α 5
Quality inspection levelEmployee detection proficiency/Employee fatigue + The wear of inspection equipment ×   α 6
Employee error rateThe normal error rate of staff +   Relationship between employee fatigue and error rate-Process stability ×   α 7
The rate of defective goods(Machine malfunction + Quality inspection level + Employee error rate)/3 × The normal rate of defective goods
Production timeWorking time-Idle time
Idle timeSchedule accuracy ×   (Changeover Time   + Machine spot check + Machine failure)
Schedule accuracyThe pressure of delivery time ×   α 8 + Work-in-process inventory ×   α 9
Normal mechanical failure level α 10 The wear of machining equipment
The accumulation of unfinished ordersThe entering rate of order The output rate of order
Defective goods(The rate of defective goods The repairing rate of goods) ×   The rate of assembling
Working timeThe pressure of delivery time ×   α 11 + 8
The relationship between machine spot checks and failuresTable function (machine spot checks, failures)
The relationship between machine inspection and efficiencyTable function (machine inspection, efficiency)
Relationship between employee fatigue and error rateTable function (employee fatigue, error rate)
Table 3. The pseudocode of NSGA-II.
Algorithm: NSGA-II (Real-Coded)
1. Input: N (population size), G (generations), Pc, Pm, D (dimensions), LB, UB
2. Initialize population P 0
3. Encode x [ L B ,   U B ] as real vector (random initialization)
4. Set generation t   =   0
5. while t   <   G :
6.      Perform non-dominated sorting on P t
7.      Assign the crowding distance
8.      Select parents by binary tournament (rank + distance)
9.      Apply crossover ( S B X ) and mutation to generate offspring Q t
10.    Decode and evaluate Q t
11.    Combine P t and Q t R t
12.    Perform non-dominated sorting on R t
13 .         t = t + 1
14. End
15. Return Pareto front
Table 4. The comparison between HD and HDT.
WeekWIPThe Defective GoodsOutputting
HDHDTDifferencesHDHDTDifferencesHDHDTDifferences
1161519234262727
2272531102262528
3394042214242223
4525457215272727
5161720223202125
6323538214252426
7474851123272628
8586163215232427
9181715113212123
10343234115212022
11494754226232225
12605858327262428
13141317327202226
14303031113272529
15454749234242327
16626158112222124
17151619204252627
18303234235252428
19414247224242525
20515154316252626
Table 5. The MAPE of different indices (HD and HDT).
WIPThe Defective GoodsOutputtingWorking TimeProduction Time
MAPE0.050.390.050.380.62
Table 6. The explanation of notations.
NotationsExplanations
x 1 Equipment maintenance
x 2 5S
x 3 SMED efficiency
x 4 Semi-finishing turning (external) cutting parameters
x 5 Semi-finishing turning (internal) cutting parameters,
x 6 Finishing turning (external) cutting parameters
x 7 Finishing turning (internal) cutting parameters
y 1 Inventory of work-in-progress
y 2 Defective products
y 3 The average production cycle
z 1 Carbon dioxide
z 2 Polluting emission
Table 7. The R2 of different fitted equations.
y 1 y 2 y 3 z 1 z 2
R20.820.840.790.880.85
Table 8. The RMSE of different regression models.
WIPDefective ProductsLead TimeCarbon EmissionPollution Emission
RMSE2.062.130.163.767.49
Disclaimer/Publisher’s Note: The statements, opinions and data contained in all publications are solely those of the individual author(s) and contributor(s) and not of MDPI and/or the editor(s). MDPI and/or the editor(s) disclaim responsibility for any injury to people or property resulting from any ideas, methods, instructions or products referred to in the content.

