1. Introduction
Promoting the green, high-quality development of urban agglomerations stands as a crucial pathway toward advancing China’s economy onto a high-quality trajectory. At present, making full use of the advantages of innovation agglomeration in urban agglomerations and giving full play to the radiation effect of high-quality green innovation in center cities are effective ways for urban agglomerations to break through the bottlenecks of development and realize green transformation, and they are also the intrinsic requirements for constructing a high-level and open new development pattern. Practice shows that as the engine of urban agglomeration and innovation highland, center cities have obvious advantages in promoting low-carbon technology innovation, optimizing energy structure, and improving resource utilization efficiency, and GIQ is constantly improving. It is conducive to driving the development of peripheral cities through its agglomeration externality. The synergistic evolution of China’s national market integration and urban agglomeration development has unlocked the latent potential of its mega-market, thereby intensifying the centrality externalities of hub cities within these agglomerations. However, the spillover effects of high-quality green innovation in center cities are not beneficial; they may exacerbate market competition and distort the allocation of innovation resources. While empirical evidence highlights the role of GIQ in center cities, academic consensus on its net impact remains elusive. Therefore, examining how center cities’ GIQ affects peripheral economic growth and the underlying mechanisms provides critical insights for fostering sustainable urban agglomeration development and optimizing the economic spillover effect of central nodes.
Theoretically, green innovation can reduce energy consumption by enhancing energy-use efficiency and accelerating industrial structure optimization. Within urban agglomeration, both the scale and sophistication of green innovation in center cities demonstrate significant spatial effects. This study specifically investigates how Green Innovation Quality (GIQ)—a metric reflecting the complexity and replicability barriers of eco-technological advancements—in center hubs influences the economic trajectories of peripheral regions. The emphasis on GIQ stems from its unique capacity to drive rapid progress in sustainable technologies, positioning it as a critical lever for regional green transitions. Particularly when local governments increase subsidies for green innovation, some enterprises may prioritize innovation quantity over quality to obtain policy benefits [
1], resulting in urban GIQ significantly lagging behind quantity. Enhancing the GIQ of center cities and its spatial effects can substantially improve total factor productivity and energy efficiency in peripheral cities, thereby promoting economic growth. Beyond acquiring cutting-edge green technologies, peripheral cities can benefit from citing center cities’ green innovation achievements, facilitating industrial collaboration, talent mobility, knowledge exchange, and other factor flows that improve their economic development conditions.
On the other hand, the improvement of GIQ in center cities represents more than just technological upgrades in individual production processes—it significantly influences industrial agglomeration patterns. As hubs of green innovation agglomeration, center cities attract diverse innovation entities and establish complete chains encompassing “basic research-technological breakthrough-commercialization,” collectively driving industrial chain upgrading. These effects extend beyond accelerating the green transformation of traditional manufacturing to diverse fields, including green energy, clean production, the circular economy, ecological restoration, and green services. Moreover, the enhancement of GIQ in center cities is typically accompanied by changes in market access standards and innovation resource allocation, playing a crucial role in industrial gradient transfer between center and surrounding cities. Enterprises will also reassess their location choices and adjust production scales based on market changes and their comparative advantages while strengthening knowledge transfer through both online and offline interactions.
Currently, developing economies continue to undergo rapid industrialization and urbanization, confronting the dual challenge of sustaining economic expansion while mitigating climate risks. This renders many development paradigms adopted by industrialized nations inadequate for direct replication. As the world’s largest developing economy, China has explored new green development pathways through ecological civilization construction, establishing innovative mechanisms in world-class urban agglomerations like the YRD, including hierarchical ecological red line management, cross-regional industrial coordination, and polycentric urban networks. The YRD—one of China’s most economically dynamic and innovative regions—exemplifies how integrated policies can foster balanced regional development while addressing environmental constraints. The successful replication of the “China-Singapore cooperation” model of Suzhou Industrial Park in countries like Vietnam verifies the potential synergy between green regulation and market mechanisms in developing country contexts. These experiences not only provide alternative solutions for late-developing countries to overcome the “Environmental Kuznets Curve” trap but also contribute Chinese wisdom to the sustainable development of Global South urban agglomerations through channels like the Belt and Road green production capacity cooperation.
Based on this context, this study primarily examines three research questions: (a) What spatial clustering patterns characterize green innovation activities within this urban agglomeration? (b) Can center cities’ GIQ reshape the economic development patterns of urban agglomerations? (c) How do these effects differ across geographical space and urban networks? The aim is to integrate center cities’ green innovation with regional economic development, exploring solutions for urban agglomeration economic development from a network externality perspective.
2. Literature Review
Building upon existing scholarship, the current research aligns with two primary academic streams: the first examines spatial disparities in regional green innovation advancement. This fundamental economic geography concern has been investigated through multiple analytical lenses, with researchers consistently identifying center–periphery differentiation patterns across geographical contexts [
2]. For example, Juracka et al. [
3] found that EU member states generally promote active green development policies, among which countries such as Denmark, Luxembourg, and Austria have become leaders in green innovation. Jo et al. [
4] analyzed the level of green innovation in Asian countries by constructing an evaluation system containing four dimensions, namely, green capacity, supportive environment, innovative activities, and performance comparative analysis. Their taxonomy positions East Asian economies like Japan, South Korea, Singapore, and China as innovation frontrunners, contrasting with developing Southeast Asian nations. Chinese researches reveal pronounced regional stratification, with innovation capacity declining along an east–west gradient. Three key metropolitan regions—the Beijing–Tianjin–Hebei cluster, the Yangtze River Delta Urban Agglomeration, and the Guangdong–Hong Kong–Macao Greater Bay Area—emerge as the nation’s primary green innovation poles [
5,
6,
7]. Cities like Beijing, Shanghai, and Shenzhen serve as regional green innovation hubs [
8]. Existing studies reveal that green policy tools [
9], green financial services [
10], green credit guidelines [
11], spatial structure of urban agglomerations [
12], and quality of innovation institutions [
13] significantly affect the GIQ of a city. Corradini [
14] points out that emerging green innovation firms prefer to choose regions with strong technological bases, significant knowledge spillover effects, and strong innovation dynamics for their layout. In terms of measurement methods, scholars employ either composite indices measuring institutional capacity and policy environments [
4] or output-based metrics using patent statistics [
15], citation impacts [
16], and technological complexity indices [
17]—approaches that inform this study’s indicator design.
The second collection of literature is about the spatial dynamics of green innovation within urban agglomerations. Building upon urban agglomeration theory, metropolitan cores with superior innovation endowments emerge as regional innovation hubs through the dual mechanisms of resource concentration and knowledge diffusion, while surrounding municipalities form complementary peripheral nodes, establishing a hierarchical innovation geography [
18]. Small and medium-sized cities can leverage their proximity to these innovation cores to access spillover benefits, capitalizing on metropolitan advantages, including expanded market access and specialized labor pools. In this context, some scholars have emphasized that the positive externality effect of the center cities of urban agglomerations should be fully brought into play and its radiation scope as the center of green innovation should be gradually expanded, so as to improve the overall green development level and comprehensive competitiveness of urban agglomerations as a whole [
19,
20]. This positive effect will be further amplified with the increasing frequency of factor mobility between cities [
21], the gradual narrowing of cultural differences [
22], and the continuous enhancement of technological complementarity [
23,
24]. On the other hand, urban green innovation spillovers may also have negative impacts [
25]. Green innovation activities attract the concentration of R&D talents, capital, and knowledge factors [
26], thus strengthening the green innovation “center-periphery” structure. With the improvement of the high-speed rail network, the Internet, and other modern infrastructures, the market potential of center cities has been significantly increased, prompting high-end service industries, such as finance, science and technology research and development, to accelerate the agglomeration of center cities, while the manufacturing industry has gradually shifted and spread to peripheral cities [
27]. This process of industrial spatial reorganization, while improving overall efficiency, may also cause peripheral cities to face new challenges in the process of industrial structure transformation and upgrading.
Current scholarship has made substantial progress in examining the diffusion effects of metropolitan green innovation, yet more gaps remain in understanding quality-driven spillovers within urban agglomeration cores. The literature exhibits three notable limitations that this study seeks to address: (a) While numerous studies have documented aggregate spillover effects from center cities, few have systematically distinguished between quantitative and qualitative dimensions of innovation diffusion, leaving unresolved debates about the directional patterns of high-quality green innovation transmission. (b) The extant research adopts micro-level analyses of labor market dynamics and firm performance using national samples, with insufficient attention to how innovation quality in specific urban agglomeration centers reshapes regional economic geography. This oversight leaves unexplored crucial mechanisms for optimizing positive spillovers from the center cities’ green innovation advancement. (c) Methodological constraints persist as conventional spatial econometric approaches rely on symmetrical interaction assumptions that poorly reflect real-world asymmetries in urban influence hierarchies (e.g., the intensity of Shanghai’s economic radiation on Nantong is much higher than that of the inverse effect). It is difficult to establish the assumption of the stability of the effect of the individual processing of the traditional model [
28]. These modeling limitations likely lead to systematic underestimation of center cities’ true innovation spillover potential.
This study advances the field through three substantive contributions to the understanding of green innovation quality (GIQ) spillover effects in the YRD: (a) In terms of research perspective, based on the green innovation agglomeration characteristics of the YRD city-pair, we identify samples of the center cities and peripheral cities of the city-pair. The number of forward citations of listed companies’ green technology patents is used to construct a quantitative indicator of the GIQ of the center cities and to analyze its spillover effect on the economic development of the peripheral cities. (b) Our investigation reveals the dual mechanisms through which center cities influence peripheral development—through both factor concentration and industrial relocation processes—while demonstrating how these effects vary across geographical scales and urban hierarchies. These findings offer practical paths for effectively exerting the effect of the GIQ of center cities, which enriches the research content of the spatial effect of city GIQ and has a clearer revelatory significance at the policy level. (c) At the level of research methodology, our city-pair design effectively addresses the endogeneity concerns arising from spatial interdependence, establishing stronger causal evidence for interurban innovation spillovers.
3. Theoretical Analysis and Research Hypotheses
3.1. Background of the Study
Improving GIQ in the center of urban agglomeration will lead to synergistic development in the peripheral cities, which will help to build a more efficient and stable new pattern of regional development. A city’s suitability as a green innovation frontrunner depends on its capacity to translate internal innovation quality improvements into spatially extensive growth externalities that positively transform the broader urban agglomeration economy. We elaborate from two perspectives: the internal aspects of cities and inter-city connections. First, from the perspective of cities themselves, GIQ implies faster progress in green technologies. The spatial concentration of high-performance green innovation systems correlates strongly with optimized energy efficiency and reduced systemic risks in sustainability transitions. Research shows that city differences significantly affect GIQ. Factors such as technology-driven, market-driven, and environmental regulation all have a significant impact on the level of green innovation in cities and the development of regional green innovation systems [
29]. Second, from the aspect of intercity linkage, with the improvement of GIQ in center cities, the task of city green development will shift from local green technology patent generation to promoting green patent industrialization, so as to better serve and support the overall sustainable development goals. This requires the support of the peripheral cities in terms of material supply, device design, manufacturing, packaging, logistics, and other industries; peripheral cities in the urban agglomeration can achieve more significant economic returns by learning from the center cities.
Against the background of reality, to realize the goal of “carbon peak and carbon neutrality” and promote green economic growth among cities, the Chinese government has adopted a tiered diffusion strategy for green innovation initiatives. This framework operates through a core-hub-network mechanism, beginning with experimental breakthroughs in strategically selected cities, extending to regional hubs, and ultimately achieving nationwide scalability. For instance, the National Development and Reform Commission (NDRC) launched its inaugural low-carbon city pilots in 2010 to identify replicable models of sustainable urban development. Subsequent phases in 2012 and 2017 expanded the program to 81 cities and 6 provinces. Within the pilot cities, most had advanced innovation ecosystems, strong resource agglomeration, and proven green growth performance. Theoretical and empirical analyses classify these pilot cities as innovation centers within urban agglomerations, based on their capacity to concentrate green technologies and drive systemic change. We examine how their GIQ influences economic outcomes in adjacent peripheral cities, addressing a critical gap in spatial spillover research.
3.2. The Spatial Effects of GIQ in the Center Cities
Urban development theory suggests that regional innovation activities are always in a non-equilibrium state due to the heterogeneity of cities’ innovation resource endowments; under the effect of path dependence, innovation factors continue to cluster to a certain region, making it a regional growth pole, while regions with less innovation concentration become innovation holes, and the two together constitute the spatial pattern of innovation [
30]. This disequilibrium has further evolved in the era of globalization and the knowledge economy, creating an innovation network that brings together local and cross-regional interactions. In the context of open urban systems, the boundaries of cities gradually become blurred, and the construction of urban agglomeration continues to improve. Urban economic growth is not only determined by its own endowment structure but is also influenced by external factors. Combined with the analyses, the main research idea is shown in
Figure 1.
According to the growth pole theory and center–periphery theory, the improvement of GIQ in center cities is a process of polarization, attracting factors such as high-end innovative talents, capital, etc., driving the development of local green industries. The self-reinforcing nature of innovation accumulation perpetuates regional development asymmetries, systematically diverting growth potential from outlying municipalities through center-oriented resource drainage. When the intensity of green innovation polarization continues to increase, the non-core industries of the center city begin to move outward, starting to release the positive externality of green development and gradually forming a complex field of radiation and siphoning effect coexisting within the urban agglomeration. The radiation effect promotes the agglomeration of factors and the growth of service-oriented economies in urban fringe areas and fosters new economic growth points in the neighboring cities. However, the siphoning effect may suck away innovation factors, leading to the transfer of high-end manufacturing and service industries from peripheral cities to center cities. A center city’s green innovation advancement creates competing spatial externalities—centrifugal knowledge diffusion versus centripetal factor attraction—whose relative intensity determines the heterogeneous economic outcomes observed in distinct peripheral city contexts. The preceding theoretical foundation generates the following hypothesis:
Hypothesis 1: GIQ improvement in urban agglomeration center cities has multidimensional spatial effects.
Whether peripheral cities in urban agglomerations can effectively leverage high-quality green innovation outcomes from center cities and translate them into economic performance constitutes another crucial determinant of the radiating effects of center cities’ GIQ. The key to this transformation process lies in the dynamic evolution of peripheral cities’ own absorptive capacity. The upgrading of innovation functions in center cities reshapes peripheral cities’ absorptive capacity, thereby influencing their economic productivity metrics. From a spatial economic perspective, the endogenous factor agglomeration within peripheral cities and inter-city industrial division and coordination serve as primary channels through which these cities identify, acquire, assimilate, and apply green innovation spillovers from center cities.
From the perspective of radiation effects, the GIQ of the center cities in urban agglomeration can reshape the regional economic pattern through multiple transmission paths, mainly manifested in three aspects. First, center cities, as the core of the urban agglomeration innovation network, can transfer the knowledge and technology solidified locally to the periphery through face-to-face exchanges and communication among enterprises, universities and research institutes, and micro-individuals, so as to enhance the technical coefficients of the production function and improve the efficiency of urban production. Second, the industrial spillover effect, along with the green technologies and green products in the center cities, is conducive to enhancing the utilization efficiency and reorganization capabilities of capital and labor in the urban agglomeration, thereby improving production efficiency and reducing the costs of peripheral cities. Third, the green technology standards, green patent agglomeration, and brand effects in the center cities constitute a regional quality endorsement, significantly reducing the market entry barriers and transaction costs for related products in the peripheral cities. The enhancement of GIQ in center cities generates positive spatial externalities that incentivize peripheral municipalities to engage in regional sustainable development initiatives, ultimately amplifying aggregate economic performance across the urban agglomeration.
From the perspective of the siphoning effect, improving GIQ in the center cities will form the re-agglomeration of innovation factors and exert a constraining influence on peripheral urban economic expansion. First, as a green innovation factor agglomeration center in the YDR, it attracts talents and technological resources from all over the country and abroad and jointly creates an open and inclusive green innovation ecological environment, and these resources first come from the peripheral cities, leading to the loss of innovation factors. Second, the advancement of GIQ in center cities tends to establish resilient, path-dependent innovation networks characterized by exclusive collaboration patterns, leading to the “lock-in effect” of geographic proximity [
31]. Under the industrial division of labor in urban agglomeration, peripheral cities are responsible for low-to-medium tech production segments, such as manufacturing and packaging. The transfer of productive service industries from peripheral to center regions has been precipitated by three key factors: rising raw material costs, the loss of innovative talents, and increased trade friction. This has resulted in insufficient innovation momentum in peripheral cities and constraints on the industrial division of labor. These developments pose a serious challenge to the industrial transformation and upgrading of many peripheral cities. The above mechanism indicates that an improvement in GIQ in the center cities will weaken the radiation and driving effect of the growth pole and affect the economic growth of peripheral cities. The preceding theoretical foundation generates the following hypotheses:
Hypothesis 2a: GIQ improvement in the center cities of the urban agglomeration has a positive spillover effect and promotes economic growth in the peripheral cities.
Hypothesis 2b: GIQ improvement in the center cities of urban agglomeration has a negative siphoning effect and inhibits the economic growth of the peripheral cities.
4. Research Design
4.1. Research Area and Center City
According to the Outline of the Yangtze River Delta Regional Integrated Development Plan promulgated by China’s State Council in 2019, the Yangtze River Delta urban agglomeration (YRD) comprises 41 cities spanning the municipalities of Shanghai and the provinces of Zhejiang, Jiangsu, and Anhui. These cities are geographically adjacent, linguistically similar, and share consistent sociocultural characteristics. They are further interconnected through robust transportation infrastructure (including railways and highways) and advanced communication networks, which together establish comprehensive multidimensional linkages across economic, social, and cultural domains.
Maximizing the spatial multiplier effects of premium green innovation in regional hubs emerges as a universal policy dilemma, transcending the YRD context to encompass all urban agglomerations engaged in sustainable development. Regarding the determination of the sample of city-pair center cities, existing studies mainly select from green innovation inputs, outputs, innovation ecology, etc. Drawing on Chattergoon et al.’s methodology [
32] for judging science and technology innovation centers in China and the U.S., we rank the level of green innovation of each city of the YDR in terms of the size and density of green innovation agglomeration, which needs to simultaneously satisfy two conditions: First, the number of green patent applications and authorizations, the number of green invention patent applications and authorizations, and the proportion of employees in the scientific research and technical services and geological exploration industries in the city, all benchmarked against top-decile performance within the urban agglomeration. Second, the national proportion of the above indicators is higher than the proportion of its population.
Table 1 shows center cities in YDR that have met the conditions since 2003. The YDR has a strong concentration of green innovation and is gradually forming a cluster led by Shanghai, Nanjing, and Hangzhou. As of the end of 2022, these three cities accounted for 3.2% of the population and contributed 16.11% of green innovation patents and 12.8% of the research and development industry workforce. Therefore, we identify these three cities as the urban agglomeration center cities and the remaining 38 cities as their peripheral cities.
4.2. Data Sources
The article used two types of data: (1) Green Patent Forward Citation Data for listed companies from the China Research Data Platform (CNRDS) (
https://www.cnrds.com/, accessed on 12 May 2025). During processing, name matching was considered for listed companies and their participating companies, as well as patent self-citation and company name changes. The database contains the following fields: listed company stock code, cited green patent number, and application and grant date. In this study, the number of forward citations of green invention patents in each city from 2003 to 2022 was measured according to the two dimensions of “the city where the listed company is located and the year of citation”. (2) The indicators of urban economic development are derived from the China City Statistical Yearbook (
http://www.stats.gov.cn/, accessed on 12 May 2025). Missing values are supplemented by consulting government work reports and other official publications. Data that could not be obtained were supplemented using the linear interpolation method. Given the margin of error in GDP, this study used annual per capita GDP as the correction coefficient and applied a nonlinear weighted sum method. To eliminate the influence of price factors, all value variables are based on 2003 and deflated using the CPI index of each province. Ultimately, we obtained panel data on 114 center–periphery city-pairs in the YDR over several years.
4.3. Model
This paper investigates the heterogeneous spatial effects of GIQ in center cities on the economic growth of peripheral cities. Using Stata 15.0 software for panel data in the YDR from 2003 to 2022, the paper pairs center cities with peripheral cities and applies a two-way fixed effects model. The baseline regression model is as follows:
In the formula, PGDP denotes the GDP per capita of peripheral cities, GIQ denotes the spatial spillover variable of GIQ in center cities, Control denotes a set of control variables, represents the dyad-specific fixed effects capturing persistent characteristics of center–periphery city-pairs (e.g., locational advantages, cultural norms, governance structures, etc.), denotes temporal fixed effects accounting for period-specific shocks, and constitutes the idiosyncratic error term. To account for temporal correlation in policy implementation across the YRD, we employed year-clustered standard errors.
4.4. Variable Description
Economic development in peripheral cities (PGDP): This paper employs real GDP per capita (constant 2003 prices, log-transformed) as the principal metric for assessing peripheral municipalities’ economic development.
Green innovation quality in center cities (
GIQ): This paper uses the number of forward citations to patents for urban green inventions as a measure. It has been widely recognized that patent forward citation is a kind of innovation diffusion behavior, which is an effective measure of the city’s innovation capability. In the process of constructing
GIQ in the center cities. This paper adopts these treatments: (a) Limiting the patent samples to invention patents in the field of green technology, including traditional energy clean use, new energy use, energy saving and efficiency, etc. We quantify green innovation impact through forward citation counts of corporate green patents and eliminate self-citations to ensure external validation. Considering that there is an average lag of 24 months from filing to granting of green invention patents and that patent citation behaviors mostly start at the technology disclosure stage, we follow the practice of patent metrology and use the year of patent application as the benchmark for the cited time. (b) Summing to obtain the number of forward citations of green patents for inventions in the center cities for each year. With reference to the general practice of Hall and Jaffe [
33] and others on the analysis of city intellectual capital, the cumulative number of forward citations of green patents in each city-pair is depreciated using a depreciation rate of 15% to obtain the number of forward citations of green patents in different cities (
Patent). (c) Based on the framework of the gravity model, the green innovation potential indicator of the center city is constructed to reflect the relative potential of the peripheral cities to receive the green innovation overflow from the center city. Drawing on Zhao et al. [
34], the spatial spillover variable of the GIQ for center cities is constructed using the city scale borrowing index, as shown in the following formula:
where
Patent is the number of forward citations for green patents in center cities, and
Dist is the geographic distance between center cities
and peripheral cities
.
In this paper, based on the Green Technology Patent Classification System issued by the State Intellectual Property Office of China, this study measures the number of forward citations of the three major cities in different green technology fields. The specializations corresponding to the highest values of cumulative citations by city as of 2022 are as follows: Shanghai, Electricity-saving technology (16,519); Hangzhou, Commuting areas such as carpool lanes and telecommuting (6038); and Nanjing, Carbon emissions trading (21,086).
Control variables: Population density (
Size), which is measured using the number of permanent residents per unit of land area in the built-up area of the city. Potential human capital (
Stu), which is measured by using the logarithmic value of the number of general tertiary students per 10,000 people (including higher vocational colleges, undergraduate and postgraduate programs). Industrial structure (
Indus), measured using the ratio of the secondary industry to the tertiary industry in the city. Government intervention (
Gov), measured using the proportion of local general public budget expenditure to GDP. Opening up of the city to the outside world (
Fdi), measured using the amount of foreign direct investment. Transportation infrastructure (
Road), measured using the road area per capita.
Table 2 presents the summary statistics for all variables included in our panel regression analysis.
5. Empirical Results
5.1. Benchmark Regression
The estimation results for our baseline specification are presented in
Table 3. Center cities’ GIQ exerts significant negative spatial spillovers on peripheral economic growth across the YRD region. While metropolitan green patent citations robustly predict local GIQ improvements, these innovation enhancements constrain neighboring cities’ development. Specifically, column (1) in
Table 3 indicates that, after controlling for city-pair and yearly fixed effects, the frequency of green patents in the center cities exhibits a negative correlation with the PGDP of the peripheral cities, with it reaching a level of 1%. Column (2) in
Table 3 introduces the negative impact of GIQ in center cities that remains robust after introducing control variables such as the size of peripheral cities, the index of advanced industrial structure, foreign direct investment, and human capital level. Regression analysis reveals a significant negative elasticity (−0.019,
p = 0.004) between center cities’ green patent citations and peripheral GDP per capita, indicating that each percentage point increase in metropolitan innovation impact corresponds to a 0.019% contraction in neighboring regions’ economic performance, and this elasticity coefficient is economically significant. Column (3) in
Table 3, after including the multi-dimensional fixed effects of center city, peripheral city, and year, respectively, accounting for the heterogeneity of the control city and the temporal fluctuations, the impact coefficient of the GIQ of the center cities remains negative and significant. The results provide robust empirical support for our proposition that metropolitan green innovation quality generates centripetal forces in regional development, consistent with theoretical predictions of innovation-driven spatial polarization.
5.2. Endogenous Identification Strategy
We acknowledge that endogeneity may arise from three primary sources: (a) Reverse causality. Peripheral cities may actively cite green innovation outputs from center cities to absorb advanced technologies and boost their own economic development, thereby artificially inflating the measured GIQ of center cities. (b) Omitted variables: Unobserved factors—such as cross-city collaborative policies, transportation and communication infrastructure, or industrial partnerships—may simultaneously influence both inter-city green innovation and economic development levels. (c) Measurement error: Due to data limitations, our core explanatory variable—forward citations of green invention patents from listed companies—may underestimate center cities’ GIQ by excluding citations from SMEs and research institutions. These issues could bias the baseline regression results.
To address endogeneity, we employed an IV regression framework. A valid instrument must strongly predict the center cities’ GIQ while remaining orthogonal to the error term. Following Pan and Dong and Tang et al. [
35,
36], we use the ratio of government R&D expenditure to total fiscal revenue (lagged by two periods) as our IV. This choice is justified by the following: (a) Relevance: Center governments’ R&D spending directly enhances GIQ through subsidies for corporate R&D and investments in national laboratories. Additionally, higher R&D expenditure signals policy commitment, attracting private capital to green technology sectors and increasing high-value patent output. (b) Exogeneity: Under China’s fiscal decenterization system, center cities’ R&D budgets are determined locally based on socioeconomic conditions, with no direct fiscal linkage to peripheral cities’ economies. By lagging the IV by two periods, we further ensure that historical fiscal expenditures affect peripheral cities’ current economic outcomes only through center cities’ innovation outputs. We theoretically satisfied instrumental variable correlations and exogeneity prerequisites. The first-stage regression is specified in Equation (3):
The instrumental variable (
IV) regression results in
Table 4 demonstrate that our approach effectively mitigates potential endogeneity concerns. The Kleibergen–Paap rank LM test statistic (13.793,
p = 0.0002) provides strong evidence against the null of instrument underidentification, satisfying the relevance condition for our
IV analysis. The Kleibergen–Paap Wald rk F-statistic of 119.20 significantly exceeds the Stock-Yogo critical value of 8.96 for 15% maximal
IV size, allowing us to reject the null hypothesis of weak instruments. The second-stage estimates further confirm that center cities’ GIQ has a strongly negative impact on peripheral cities’ economic development. These findings collectively indicate that the baseline regression results are robust to endogeneity concerns.
5.3. Robustness Regression Analysis
To ensure the reliability of our principal results, we conducted comprehensive robustness checks in three ways:
Regarding the robustness of indicator design: First, we replaced the depreciation rate of green invention patents with a rate of 5%, rather than 15%, and recalculated the GIQ of center cities. Additionally, other depreciation rate levels were tried. Second, we replaced the dependent variable with the logarithmic form of GDP (
ln GDP) in peripheral cities. Third, to address potential reverse causality concerns, we employed one-period-lagged GIQ (
L.GIQ) as an alternative explanatory variable. As shown in
Table 5, all robustness checks confirm that our core findings remain statistically and economically significant across these alternative specifications.
Regarding the robustness of the model, we implemented three key sensitivity checks: (a) Wewe adjusted the study window to account for potential truncation bias. Given that the patent examination process typically takes 2–4 years from application to grant, some cited patents in our original sample (through 2022) may not yet have been authorized. To mitigate this concern, we restricted the sample period to 2003–2019. The results are presented in column (4) of
Table 5. (b) We addressed potential outliers by applying a 1% bilateral winsorization to both the core explanatory and dependent variables. Regression estimates using the winsorized sample, shown in columns (5 and 6) of
Table 5, confirm the robustness of our results. Third, we modified the error structure by employing two-way clustered standard errors at the city-pair and year levels. As demonstrated in column (7) of the subsequent table, the estimates align closely with our baseline specifications.
Regarding the impact of other factors, (a) we conducted a disaggregated analysis to separate the effects of innovation quantity and quality. After controlling the quantity of green invention patents (
GIPQ) in center cities, our key findings persisted, with the coefficient for innovation quality exhibiting greater economic and statistical significance. (b) To control for environmental policy interference, we controlled for environmental policy effects using a dummy variable for China’s Low-Carbon City Pilot Program (1 post-designation year, 0 otherwise), with Shanghai (2012), Nanjing (2017), and Hangzhou (2010) as designated cities in our sample. This accounts for time-varying policy shocks in our baseline specification (
POLICY). Third, to account for potential spillover effects from other urban agglomerations and their center cities, we controlled for intercity linkages at the national scale within China’s open urban system. Peripheral regions of the YRD (e.g., northern and western Anhui and southern Zhejiang) may be simultaneously influenced by the spatial spillovers of green innovation from adjacent urban agglomerations, including the Central Plains Urban Agglomeration (Zhengzhou as a center city); the Middle Yangtze River Urban Agglomeration (Wuhan); and the Fujian–Zhejiang Coastal Urban Agglomeration (Fuzhou). In column (10) of
Table 5, we incorporated the GIQ (
C.GIQ) of these neighboring center cities as an additional control; the findings show considerable alignment with the baseline regression results.
5.4. The Spatial Extent of GIQ Effects in Center Cities
The benchmark regression assumes that the radiation scope of high-quality green innovation (GIQ) from center cities extends across the entire urban agglomeration. Using paired panel data of center–peripheral cities, we conducted empirical analyses and robustness tests with multiple methods. The economic radiation effect of center cities’ GIQ is inherently constrained by geographical distance. This operates through two countervailing mechanisms. On the one hand, the existence of geographical distance limits intercity factor flows and technology diffusion. It reduces collaboration among economic agents, weakening GIQ’s impact on peripheral cities’ development. On the other hand, with the progressive upgrading of regional transport and digital networks, the peripheral cities that are farther away from the center cities are able to reduce the cost of knowledge factor flow and promote the cross-regional flow of factors, so as to increase the opportunities of local knowledge asset accumulation and industrial upgrading and strategically engage in the specialized production networks of the metropolitan region, thus enhancing the radiation effect of GIQ in center cities.
We calculated pairwise straight-line distances between YRD cities using ArcGIS 10.2 and then stratified center–peripheral city-pairs into six 100 km interval groups for regression analysis (
Figure 2). The findings reveal a non-linear spatial pattern: center cities’ GIQ demonstrates significant positive spillovers for peripheral cities within a 300 km radius, with marginal effects following an inverted-U trajectory that peaks at intermediate distances. Beyond this threshold, the effects diminish or turn negative, reflecting the dual role of distance in simultaneously constraining factor mobility while being mitigated by improved infrastructure. This spatial heterogeneity underscores the importance of regional innovation policies tailored to specific distance bands, particularly for optimizing the 300-km “effective innovation radiation zone” where knowledge spillovers are most potent. These findings demonstrate the multifaceted spatial economics of urban green innovation quality, where center cities’ GIQ advancement produces competing centrifugal and centripetal forces that reconfigure intercity growth patterns.
5.5. Differences in GIQ Effects Across Center Cities
Given the substantial variations in innovation endowments and radiation capacity across center cities, we examine the spatial heterogeneity of GIQ effects by city tier. Shanghai, as the national-level center city and primary hub of the YRD, demonstrates unparalleled advantages in innovation factor agglomeration. Since 2013, it has consistently led all YRD cities in patent applications/grants (including green inventions) and researcher density. This comprehensive superiority in capital, technology, and talent enables Shanghai to rapidly adapt to market demands and advance green innovation, significantly propelling its dual role as a national innovation hub and low-carbon pioneer. However, amid intensifying domestic and international competition, Shanghai could further amplify its GIQ impact on peripheral cities by deepening factor mobility and industrial linkages across the cluster.
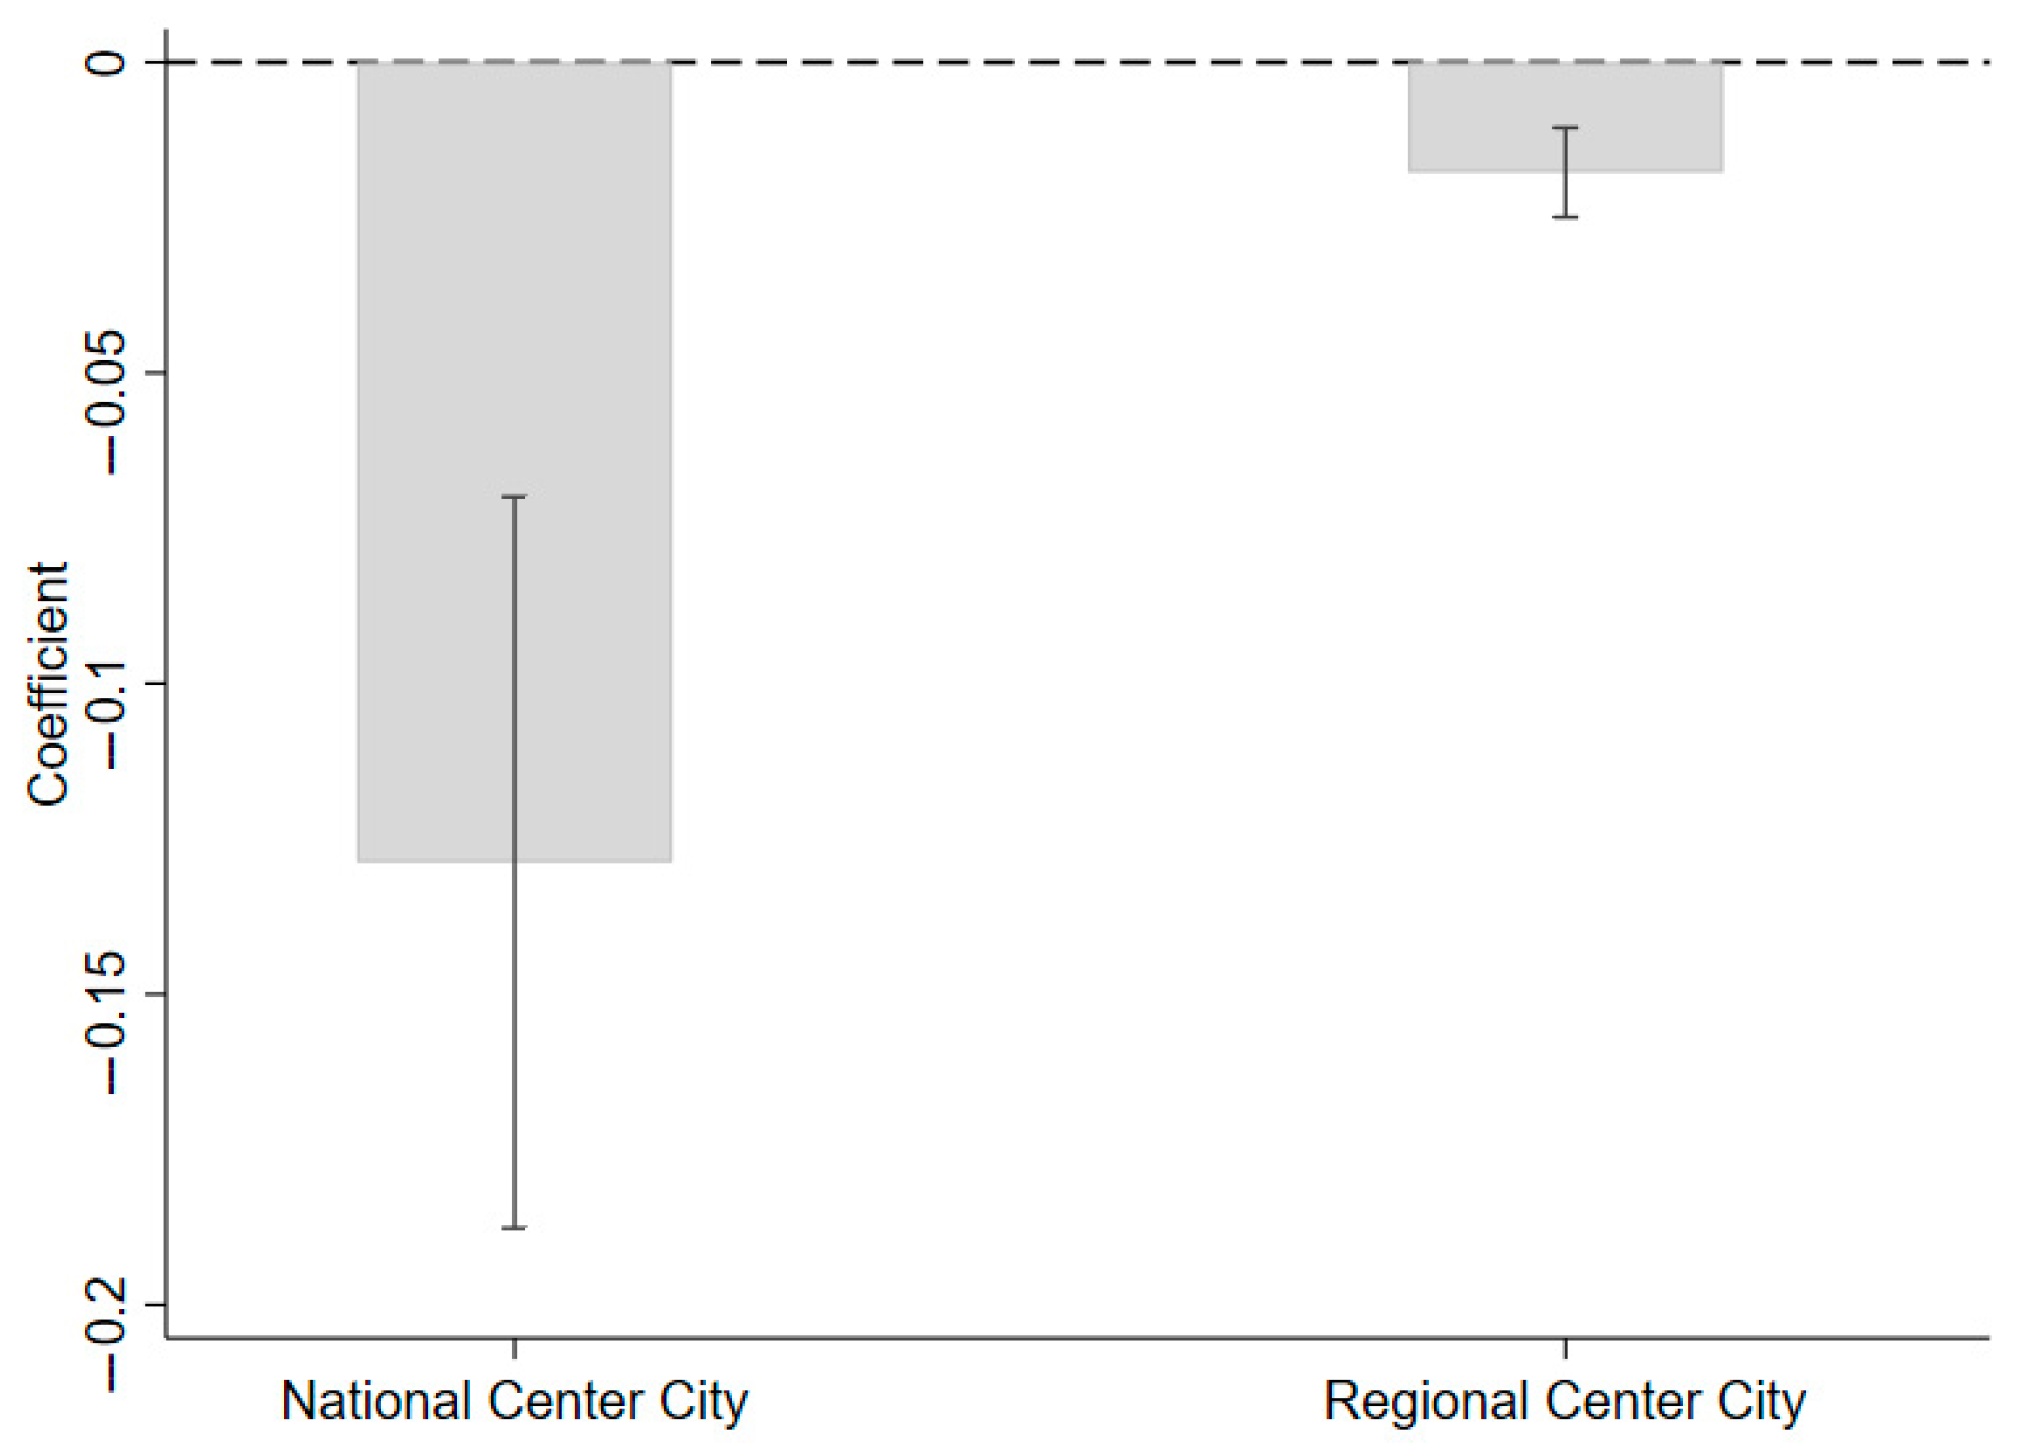
Based on the above analysis, we divided the sample into two groups of national center cities (Shanghai) and regional center cities (Nanjing and Hangzhou) according to the city level for regression analysis (
Figure 3). The data reveal a clear urban hierarchy in innovation externalities—metropolitan centers with national strategic status generate inhibitory impacts 7.2 times (β = −0.129,
p < 0.001) stronger on peripheral economies compared to their regional cities (β = −0.018,
p < 0.001). This aligns with the theoretical expectation that higher-tier cities exhibit more pronounced spatial siphoning effects, as Shanghai’s innovation preeminence paradoxically constrains peripheral development through resource concentration. The findings underscore the need for tier-differentiated policies to mitigate polarization risks while harnessing innovation spillovers.
7. Conclusions and Policy Proposals
7.1. Conclusions
To achieve the coordinated development of urban agglomeration, it is important to enhance the advantages of innovation factor agglomeration in center cities and release the effectiveness of GIQ in cities. How can we understand the important role of green development of urban agglomeration center cities and their GIQ? This paper takes the green invention patent citation data of listed companies in the YRD city-pair and the economic development data of each city from 2003 to 2022, re-identifies the center cities and peripheral cities by using the degree of innovation factor agglomeration, constructs the GIQ index of the center cities, systematically examines the heterogeneous spatial effect of the center cities’ GIQ on the economic growth of the city-pair cities, and obtains the following conclusions:
(a) It was found that the GIQ of urban agglomeration center cities has a spatial siphoning effect. The innovation factor agglomeration in the YRD presents a typical center–periphery distribution pattern, and every 1% increase in the number of forward citations of green invention patents in the center cities will lead to a 0.019% decrease in peripheral cities’ GDP per capita, a result that verifies the existence of a spatial siphoning effect.
(b) The spatial effect of GIQ in center cities is characterized by distance heterogeneity and city heterogeneity. The enhancement of GIQ in center cities produces a clustering effect within a 300 km radius and promotes the economic growth of neighboring cities; however, it shows a significant inhibitory effect on peripheral cities beyond 300 km. As national center cities, the intensity of the spatial siphoning effect of GIQ in Shanghai is significantly higher than that in regional center cities such as Nanjing and Hangzhou.
(c) The results of the mechanism test show that the factor agglomeration mechanism and industry transfer mechanism are important channels for the spatial effect of high-quality green innovation in center cities. On the one hand, the increase in GIQ in center cities accelerates the speed of factor agglomeration and knowledge accumulation and reduces the willingness of high-skilled migrants to live in peripheral cities, especially affecting the younger groups more significantly, which in turn affects the economic returns of peripheral cities; on the other hand, the improvement of GIQ in the YRD reconfigures the pattern of regional industrial division of labor and contributes to the decline of the proportion of tertiary industry in peripheral cities.
(d) The results of further analysis show that the increased green government attention (GGA) and cooperation between industry, academia, and research (IURC) have a significant positive moderating effect on the economic radiation effect of GIQ in the center cities.
7.2. Policy Proposals
To maximize the radiation potential of green agglomeration quality in center cities within urban agglomerations, we propose the following policy recommendations:
(a) Promote the continuous improvement of GIQ in center cities. First, improve the level of public services and social security capacity to attract more innovation factors, such as talent and capital, to center cities, expanding the economies of scale and GIQ of center cities; second, focus on improving the talent structure of center cities, expanding the supply of complex, applied, and skilled service talents and optimizing the ecological environment of green innovation in center cities. Third, there is a need to enhance infrastructure development and service levels within center cities, such as transportation and communications, to reduce the cost of movement of green innovation factors and to improve the efficiency of the allocation of innovation factors.
(b) Making full use of the radiation effect of GIQ in center cities. First, in terms of policy formulation, center cities should accelerate the construction of the green development policy system and guide different types of enterprises to pay attention to innovative activities in the field of green technology and enhance the GIQ of green technological innovation through green industrial policies or innovation policies of a formal institutional nature. Second, in terms of implementation paths, center cities should give full play to the synergistic effect of cooperation among multiple innovation subjects, enhance the level of scientific research cooperation among different industries, fields, and subjects, and incentivize relevant enterprises to carry out green innovation activities.
(c) The role of differential innovation between center cities and peripheral cities should be brought into play. First, responsible bodies should pay attention to the leading role of center cities as the source of green technology, establish a cross-regional talent co-cultivation mechanism, encourage peripheral cities to carry out more activities such as talent interoperability and green park co-construction with enterprises in center cities, and adjust the allocation of elements in each link of the industrial chain to ensure that the supply of talent resources and the demand for industrial interoperability match, so as to promote the green and high-quality development of the urban agglomeration. Second, peripheral cities should actively integrate into the green development system of the urban agglomeration, strengthen the information linkage and product circulation mechanism between the center cities and peripheral cities by means of the highly interconnected characteristics of the urban agglomeration, and ensure in-depth communication and exchange among the cities in the urban agglomeration, which will help to break the difficulties of their own development and, at the same time, realize the green industrial chain and supply chain of the urban agglomeration in a smooth cycle.
7.3. Discussion
While this study provides meaningful insights into the heterogeneous effects of center cities’ GIQ on peripheral cities’ economic growth in the Yangtze River Delta (YRD) urban agglomeration using city-pair panel data (2003–2022), some limitations should be noted and addressed in the future: (a) Simplified urban network representation. Due to space constraints, our analysis necessarily simplified the complex intercity relationships within the YRD agglomeration by primarily considering distance and institutional differences. This approach may not fully capture the nuanced evolution process of both China’s overall urban system and the YRD’s specific developmental trajectory. (b) Static threshold assumption. The spatial boundary analysis of green innovation spillovers treated the balance between spillover and siphoning effects as a fixed theoretical value. This simplification precludes examination of the dynamic threshold evolution process that likely occurs in reality. (c) Policy implementation gaps. Our research offers a limited exploration of specific spatial restructuring strategies and policy frameworks for optimizing the YRD’s urban structure. These practical dimensions warrant deeper investigation in subsequent studies.


