Article

Dynamic Decoding of VR Immersive Experience in User’s Technology-Privacy Game

School of Management, Shanghai University, Shanghai 200444, China
*
Author to whom correspondence should be addressed.
Systems 2025, 13(8), 638; https://doi.org/10.3390/systems13080638 (registering DOI)
Submission received: 5 June 2025 / Revised: 19 July 2025 / Accepted: 24 July 2025 / Published: 1 August 2025

Abstract

The formation mechanism of Virtual Reality (VR) Immersive Experience (VRIE) is notably complex; this study aimed to dynamically decode its underlying drivers by innovatively integrating Flow Theory and Privacy Calculus Theory, focusing on Perceptual-Interactive Fidelity (PIF), Consumer Willingness to Immerse in Technology (CWTI), and the applicability of Loss Aversion Theory. To achieve this, we analyzed approximately 30,000 user reviews from Amazon using Latent Semantic Analysis (LSA) and regression analysis. The findings reveal that user attention’s impact on VRIE is non-linear, suggesting an optimal threshold, and confirm PIF as a central influencing mechanism; furthermore, CWTI significantly moderates users’ privacy calculus, thereby affecting VRIE, while Loss Aversion Theory showed limited explanatory power in the VR context. These results provide a deeper understanding of VR user behavior, offering significant theoretical guidance and practical implications for future VR system design, particularly in strategically balancing user cognition, PIF, privacy concerns, and individual willingness.

1. Introduction

Virtual Reality (VR) technology, by providing novel interactive methods and immersive sensory experiences, is reshaping the paradigm of human–computer interaction [1,2]. The core value of VR systems, especially those equipped with sophisticated wearable devices such as head-mounted displays and motion controllers, lies in their ability to induce a deep Virtual Reality Immersive Experience (VRIE) in users [3,4]. VRIE is not only a key indicator for measuring the success of VR system design but also a core factor driving user satisfaction and the effectiveness of applications in e-commerce [5,6], education [7], and healthcare [8]. However, despite rapid technological advancements, academia still lacks a profound understanding of the dynamic formation mechanism of VRIE, especially within the complex cognitive and emotional interaction processes of users, an understanding that transcends linear thinking and isolated theoretical applications.
Existing VRIE research either focuses on the direct impact of technical factors [9] or applies certain user behavior theories in isolation. These approaches have failed to fully reveal the non-linear dynamic characteristics of user attention allocation in actual use. They have also not adequately distilled the unified, multidimensional core construct underlying the device attributes that influence VRIE—what we propose as “Perceptual-Interactive Fidelity”. PIF refers to a unified, multidimensional core construct that encapsulates the underlying mechanism by which VR device attributes influence VRIE. It acts as a crucial bridge, connecting the system’s specific technical parameters (e.g., refresh rate, tracking accuracy) with the user’s deep psychological experience (e.g., sense of immersion, flow). Therefore, understanding the composition of PIF and its impact on user attention is a key step in dynamically decoding the formation mechanism of VRIE and a core entry point for this study.
Furthermore, they have not deeply explored the inherent trade-offs users face between the experiential enhancements brought by technological progress and potential risks, especially data privacy [10,11,12], nor how these factors synergistically affect VRIE fluctuations. In particular, the following three aspects urgently require in-depth decoding from an integrated and dynamic perspective:
Q1: Is user attention to specific VR device attributes, which collectively constitute the system’s “Perceptual-Interactive Fidelity” (PIF), related to VRIE in a manner as traditionally intuited as “the more, the better”? Does an “optimal attention interval” exist, beyond which insufficient or excessive attention—potentially leading to information overload or cognitive load—might instead undermine the immersive experience?
Q2: Are psychological shortcuts widely validated in traditional consumer contexts, such as “Loss Aversion Theory” [13], still effective in the highly experiential and novel human–computer interaction environment of VR?
Q3: While enjoying the personalization and immersion brought by VR technology, such as eye tracking, how do users weigh the resulting core dilemma of personal data privacy risks? What role does their Consumer Willingness to Immerse in Technology (CWTI) [14] play in this “technology-privacy game”, and how does it influence their decision-making process?
To address these challenges, this study aims to propose an integrated theoretical perspective to dynamically decode the formation mechanism of VRIE. We select two core theories as pillars: Flow Theory [15], to explain the nature of VRIE and its dependence on the dynamic balance between user attention, skills, and the “Perceptual-Interactive Fidelity” determined by device attributes; and Privacy Calculus Theory [16], to analyze the “technology-privacy game” users face when confronted with the conflict between “technological experiential benefits” and “privacy risk concerns” in data-intensive VR applications. The core innovation of this study lies in the first in-depth integration of these two theories. This is combined with an examination of the non-linear dynamics of attention, the introduction and operationalization of “Perceptual-Interactive Fidelity” and its sub-dimensions as a key mediating mechanism, and a critical review of traditional behavioral heuristic theories. This approach provides a more comprehensive and dynamic analytical framework for understanding user behavior in VR contexts. By analyzing large-scale, long-term user-generated data [17,18], we not only verify the Longitudinal Association Effect (LAE) [19,20] of changes in attention to device attributes on changes in VRIE. More importantly, we reveal complex non-linear patterns in this process, the key moderating role of CWTI in privacy calculus, and the limitations of Loss Aversion Theory. Compared to previous studies, this significantly enhances the depth and breadth of the understanding of VR user psychology and behavioral mechanisms, offering new insights for human–computer interaction design that transcend traditional linear thinking and simplistic theoretical applications.

2. Theoretical Framework and Research Hypotheses

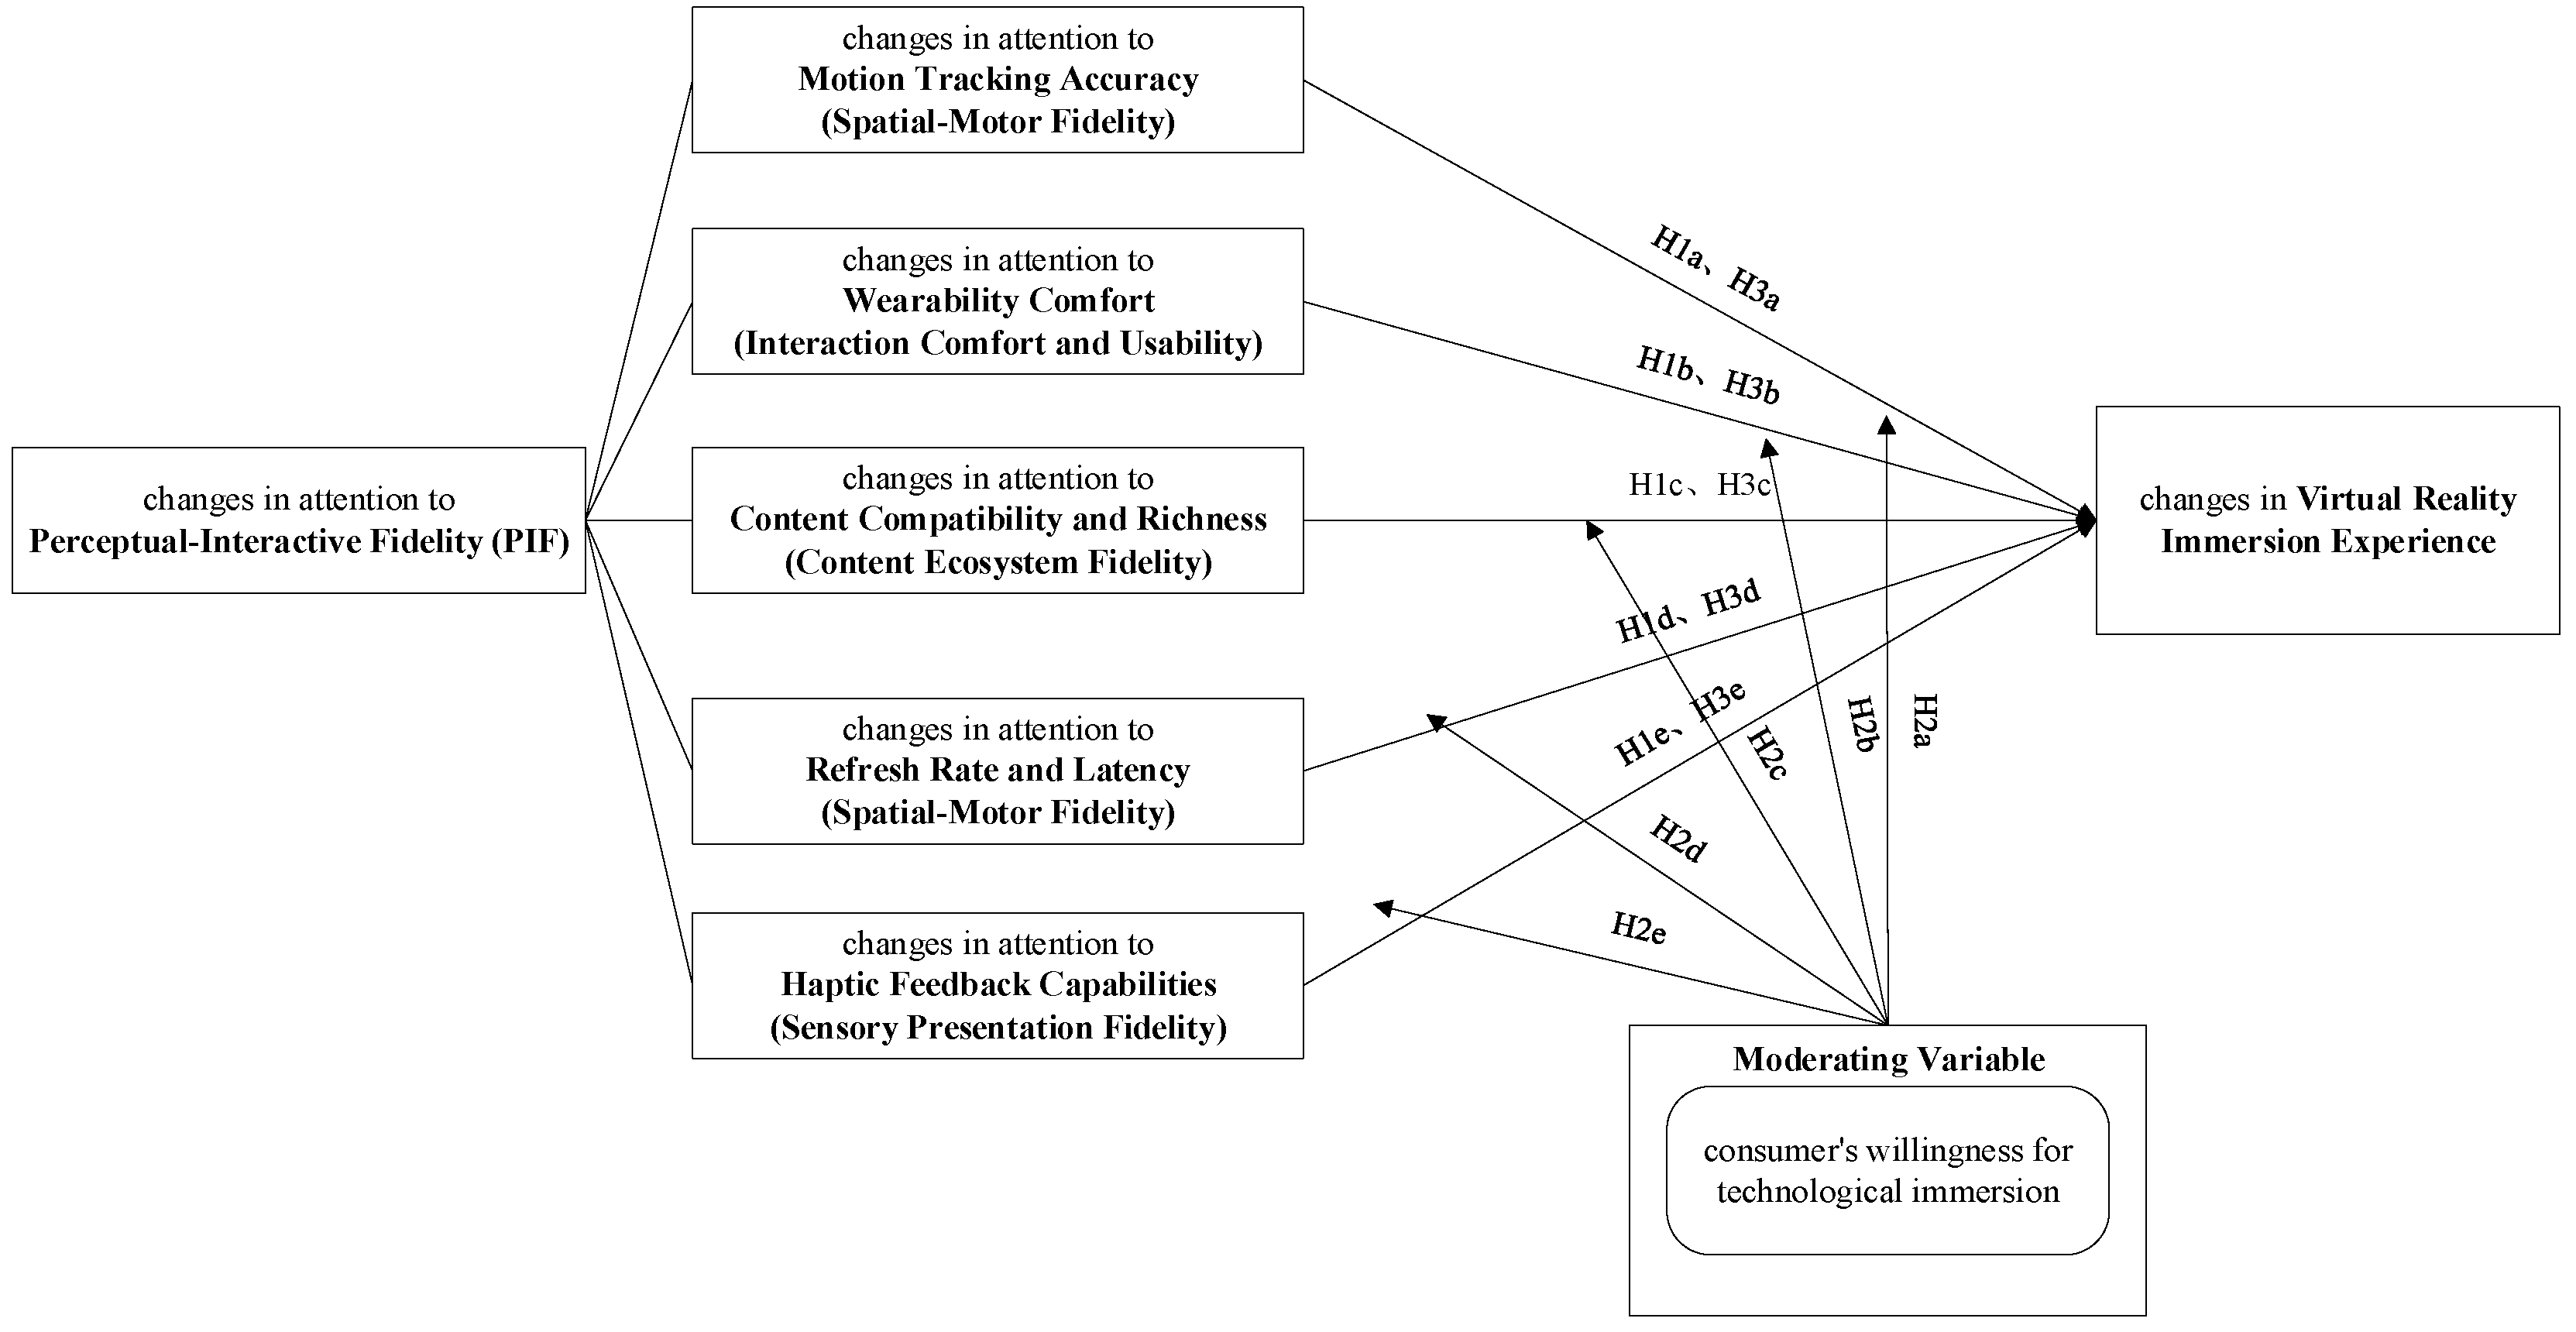
2.1. Dynamic Decoding of VRIE: The Central Role of Flow Theory, Perceptual-Interactive Fidelity, and the Non-Linear Mechanism of Attention

Flow Theory provides a solid theoretical foundation for understanding the nature of VRIE. Flow is described as an optimal state of experience in which an individual is fully immersed in an activity, deriving great pleasure and satisfaction from it. In the VR context, the ideal state of VRIE is when the user enters a state of flow. The generation of flow depends on the balance between the challenge perceived by the individual and their own skills, as well as clear goals, immediate feedback, and highly focused attention.
This study proposes PIF as a core construct. PIF refers to the extent to which a VR system can present a credible and consistent virtual world to the user and support natural, intuitive, and seamless interaction, thereby ensuring that the user’s sensory inputs and interactive behaviors receive accurate and immediate responses within the virtual environment. A high level of PIF is fundamental to achieving deep VRIE, particularly the flow experience. It facilitates immersion by reducing perceptual conflicts, lowering cognitive load, and enhancing the sense of control and presence. We further divide PIF into the following key sub-dimensions, which are manifested by the specific unique attributes of VR wearable devices:
  • Spatial-Motor Fidelity: This refers to the system’s ability to accurately track user body movements, especially head and hands, and map them into the virtual space with low latency. It also includes the stability of the virtual space and the fluidity and responsiveness of visual presentation. This dimension is crucial for synchronizing users’ physical actions with feedback in the virtual world, directly impacting their proprioception and sense of control. It is specifically manifested by motion tracking accuracy and refresh rate and latency, the latter emphasizing the immediate visual response to actions and the smoothness of visuals during movement.
  • Sensory Presentation Fidelity: This pertains to the authenticity, clarity, and richness of information presented through sensory channels such as vision (static image quality, color, detail, etc.), audition, and touch. It focuses more on the quality of the sensory stimuli themselves rather than dynamic visual fluidity related to motion. It is specifically manifested by haptic feedback capabilities. Although not directly isolated in this study’s data, display resolution, color accuracy, and sound quality also belong to this category.
  • Interaction Comfort and Usability: This refers to the physiological comfort experienced by users during prolonged wear and use of VR devices, as well as the convenience and intuitiveness of interaction operations. It is specifically manifested by wearability comfort.
  • Content Ecosystem Fidelity: This indicates whether the content provided by the VR platform—in terms of quantity, quality, diversity, and alignment with the system’s hardware capabilities—can meet user expectations to deliver sustained and meaningful virtual experiences. It is specifically manifested by content compatibility and richness.
These sub-dimensions of PIF collectively influence whether users can interact smoothly, effectively control the environment, and maintain attentional focus, thereby achieving a balance between skills and challenges, which is a core condition for entering a state of flow.
We consider changes in user attention to these device attributes, which manifest different sub-dimensions of PIF, as a LAE process. Each user interaction experience, to varying degrees, reinforces or weakens their positive or negative perception of a specific attribute and, consequently, of the overall PIF and its particular sub-dimensions. This cumulative perception dynamically shapes their overall VRIE, i.e., flow state, through LAE. Unlike existing studies that primarily focus on the static influence of attributes, this study emphasizes the dynamic accumulation of their influence and the synergistic effect of these attributes as integral parts of the overall PIF and its respective sub-dimensions.
Furthermore, we challenge the assumption of a simple linear relationship between attention and VRIE. From the perspective of Flow Theory, the allocation of attention is crucial for maintaining flow. However, it is not necessarily true that more attention paid to VR device attributes is always better. On one hand, insufficient attention to certain attributes, such as inadequate spatial-motor fidelity, may cause users to frequently “break presence” due to technical obstacles like perceived low fidelity, delays, or misalignments, thus failing to enter flow. On the other hand, excessive attention to these attributes might stem from users’ high sensitivity and demanding expectations regarding technical performance. Any minor flaws could be magnified, thereby distracting their investment in the task itself. Alternatively, attributes with overly complex designs or an overload of information might also cause users to experience high cognitive load, disrupting the “effortless” sense of concentration required for flow and creating negative effects beyond an “optimal attention interval”. Therefore, we predict a potential non-linear relationship between attention and VRIE, i.e., flow, such as the classic “inverted U-shaped” curve. This implies the existence of an optimal level or range of attention, where attention levels that are too low or too high are detrimental to deep immersion. This aligns with the less explored concepts of attention “threshold effects” or “overload effects” in previous studies.
H1: 
Changes in attention to the unique attributes of VR wearable devices, which reflect different sub-dimensions of “Perceptual-Interactive Fidelity”, affect VRIE, i.e., flow experience, through the LAE. This influence may exhibit a non-linear pattern, such as an inverted U-shape, indicating an optimal attention interval within which attention to attributes best promotes the generation and maintenance of flow.

2.2. The Technology-Privacy Game in VR: The Moderating Role of Privacy Calculus Theory and CWTI

As VR technology becomes increasingly intelligent and personalized, its reliance on user data is also growing. For example, eye-tracking technology can optimize interactions and provide personalized content by analyzing users’ gaze points, thereby enhancing sensory presentation fidelity and interaction usability, and consequently, the potential of VRIE. However, it also records users’ highly sensitive biometric data, raising significant data privacy concerns. In this context, users face a typical “technology-privacy game”: on one hand, they desire the better experiences brought by new technologies, i.e., improvements in VRIE, often associated with higher PIF; on the other hand, they worry about the leakage and misuse of their personal privacy. This inherent conflict represents a core dilemma for users when making decisions related to the outcome variable, VRIE.
Privacy Calculus Theory provides a core framework for understanding this game. The theory posits that when users decide whether to accept a technology, especially one involving the disclosure of personal data, they subconsciously conduct a cost–benefit analysis, or privacy calculus. They weigh the perceived benefits of the technology against perceived privacy risks. Only when the perceived benefits significantly outweigh the perceived risks are users more inclined to accept and actively use the technology.
However, this privacy calculus process is not uniform but is significantly affected by individual differences. This study introduces CWTI [21] as a key individual moderating variable. CWTI reflects a user’s inherent tendency and enthusiasm to embrace and immerse themselves in emerging technologies. We argue that CWTI influences users’ privacy calculus processes, thereby moderating their decisions in the technology-privacy game. Specifically, users with high CWTI, when performing privacy calculus, may assign greater weight to the immersive experiences brought by technology and its PIF. They may also have a higher tolerance for, or lower perception of, potential privacy risks. Consequently, their privacy calculus is more likely to result in a “benefits outweigh risks” conclusion. This makes them more willing to embrace and utilize technological attributes that enhance VRIE, even if these attributes involve some data collection. Their positive attention to these attributes is also more easily translated into VRIE improvements through LAE. Conversely, users with low CWTI may be more sensitive to privacy risks and assign higher weight to these risks in their privacy calculus. Such concerns can weaken their motivation to pursue VRIE improvements and may even cause privacy concerns themselves to act as a cognitive interference hindering their entry into a flow state [22], even if the device’s PIF is excellent.
H2: 
CWTI, by influencing users’ privacy calculus processes, moderates the relationship between the LAE of changes in attention to the unique attributes of VR wearable devices and their impact on VRIE. Specifically, in the technology-privacy game context, the privacy calculus results of users with higher CWTI are more inclined towards “benefits outweigh risks”, allowing their positive changes in attention to device attributes to be more effectively converted into VRIE improvements through LAE.

2.3. Challenges to Behavioral Heuristics in VR Contexts: Re-Examination of Loss Aversion Theory
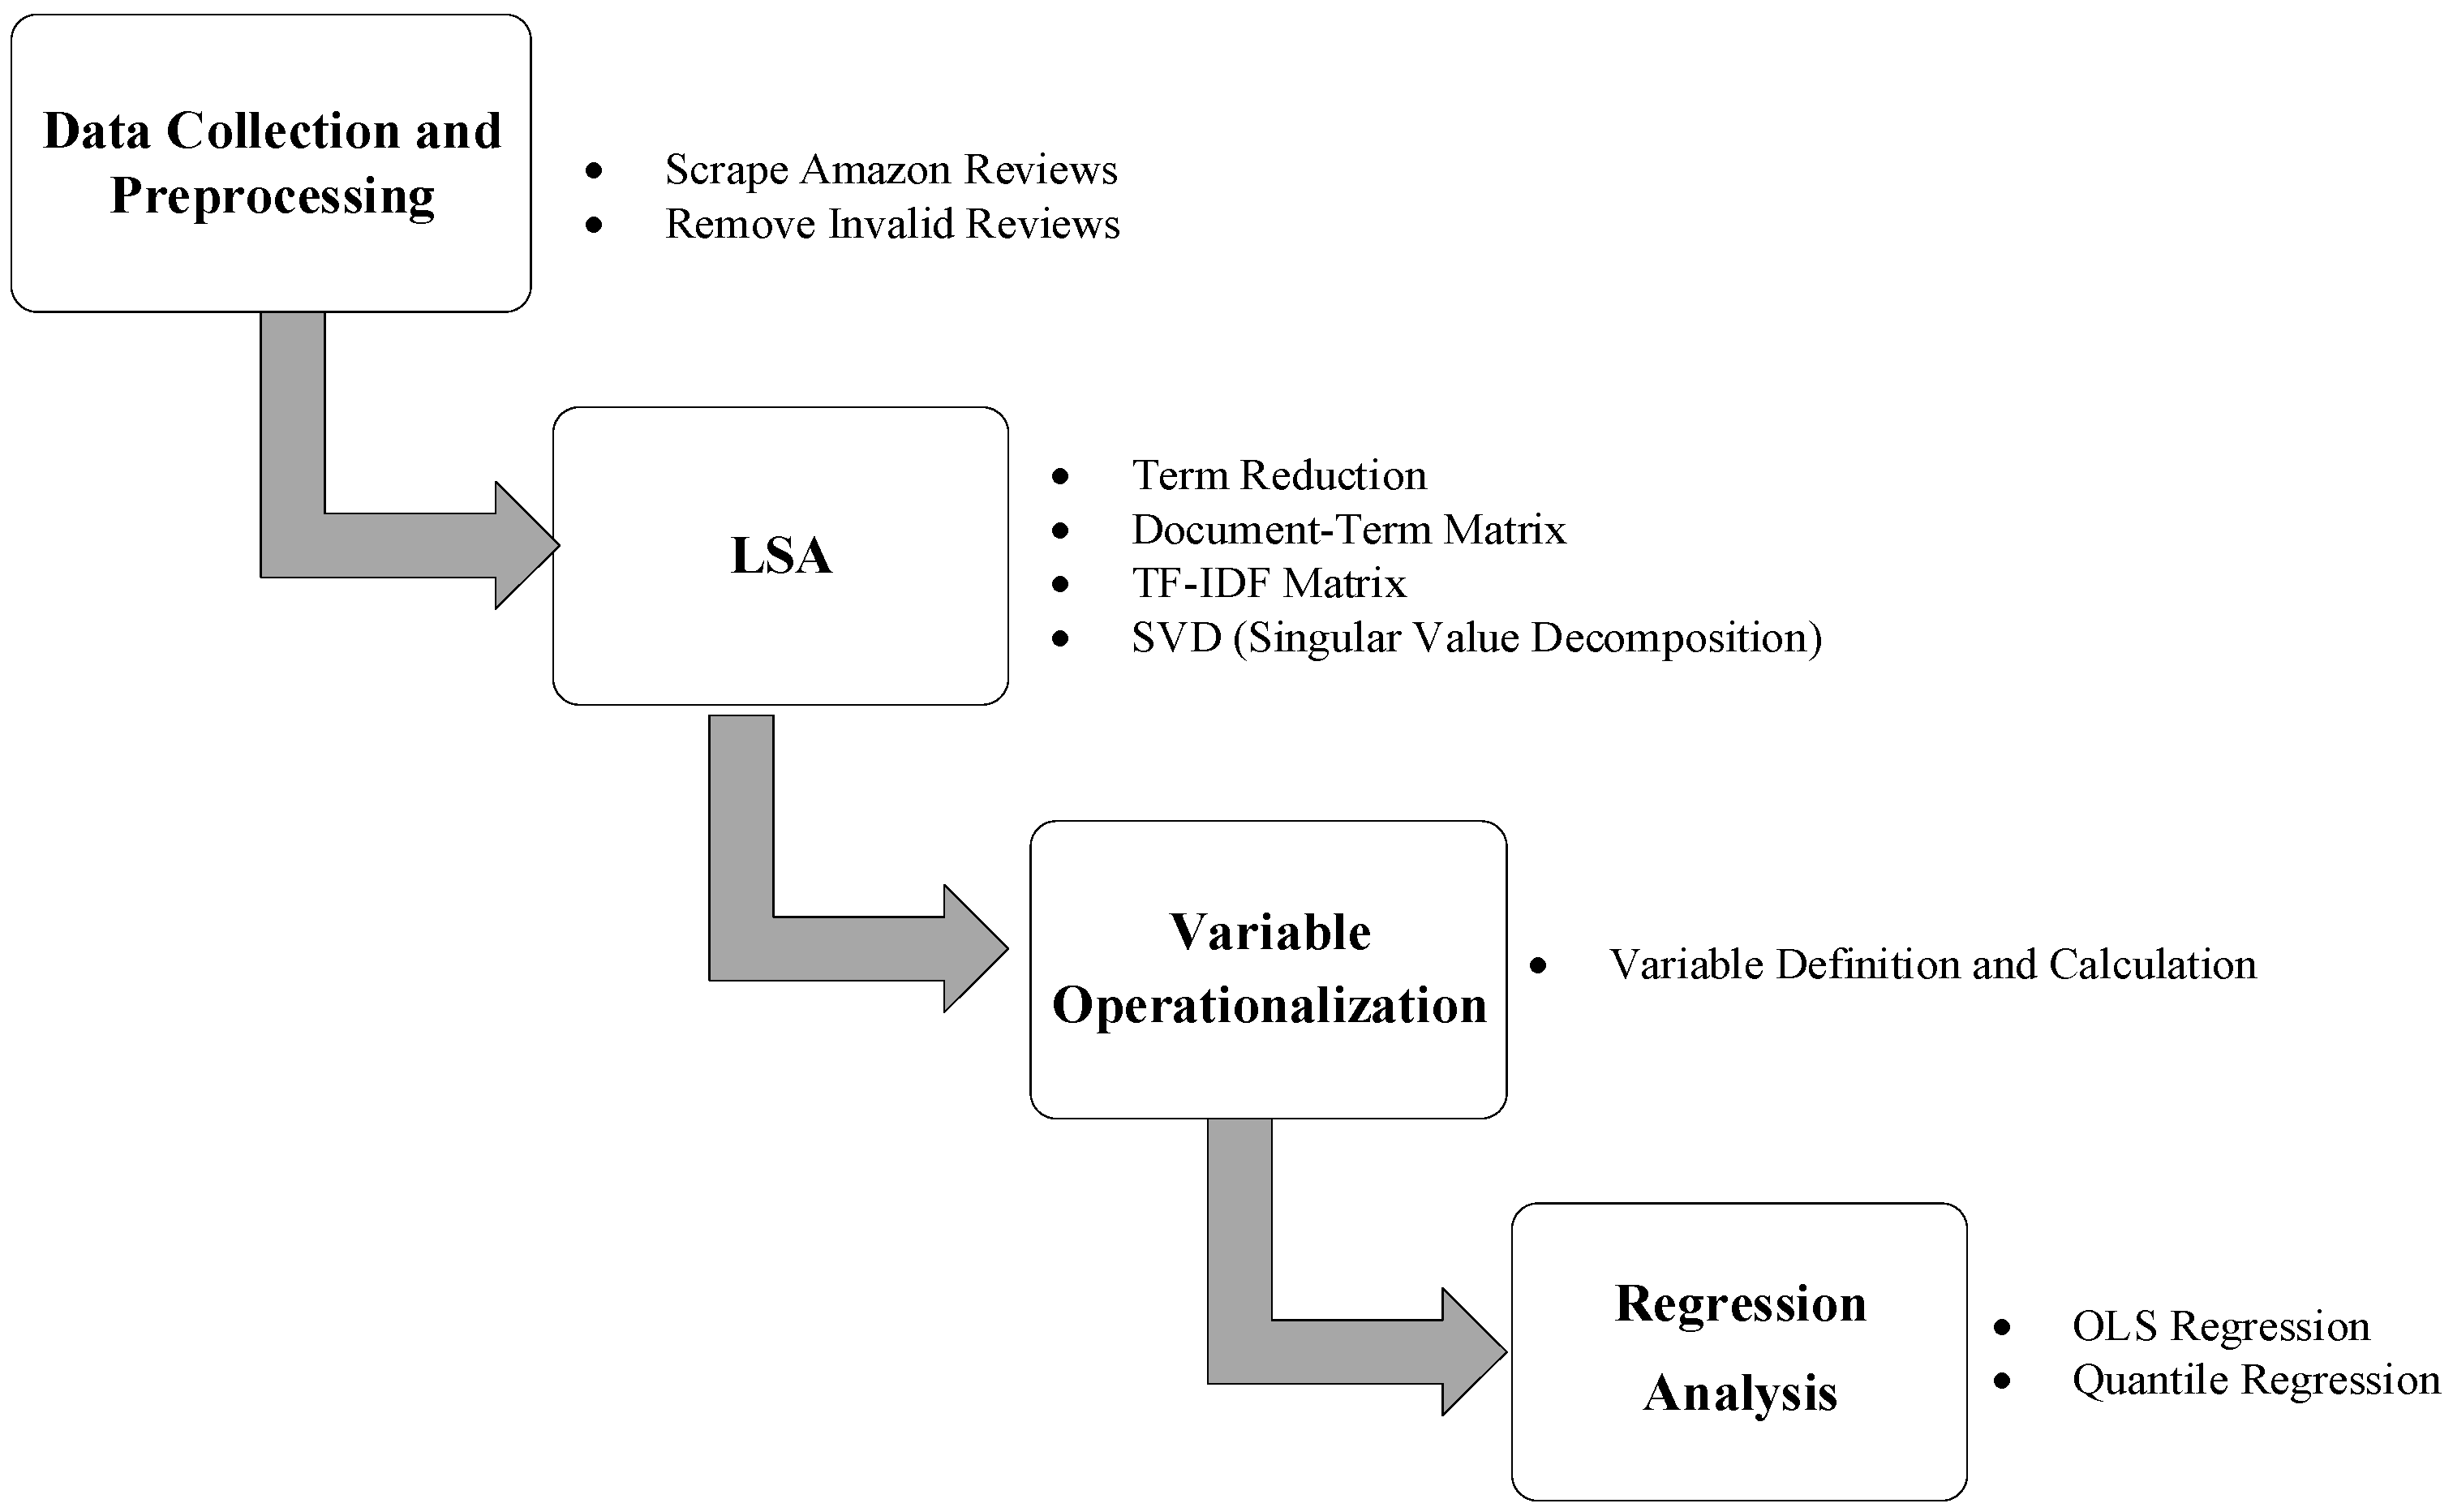
Loss Aversion Theory, originating from Prospect Theory [23] in traditional behavioral economics, states that people’s psychological feelings about “losses” are usually stronger than those about an equivalent amount of “gains”. If this theory were directly applicable to VR scenarios, then the negative impact of a negative change in user attention to a device attribute, such as a perceived decrease in tracking accuracy, on VRIE should be greater than the positive improvement on VRIE from an equivalent positive change, such as a perceived increase in tracking accuracy.
However, VR experiences are highly novel, entertaining, and exploratory. These characteristics may alter users’ information processing frameworks and risk perception modes. First, the primary motivation of users in VR may be to pursue pleasant and novel experiential “gains”, often associated with high PIF, rather than simply avoiding potential “losses” as in standard utility-based environments; this focus on experiential rewards is a hallmark of hedonic consumption [24,25]. Second, the entertaining and exploratory nature of VR may create a “gain-framing” effect, making users more sensitive to positive attributes that enhance the experience (e.g., better graphics, smoother tracking) while increasing their tolerance for negative attributes. Third, the state of deep immersion itself might act as a psychological buffer, reducing the intensity of negative emotional responses to minor device flaws (i.e., “losses”). This aligns with findings in game psychology, where intrinsic motivations like competence and autonomy often supersede simple loss-gain calculations [26]. Therefore, these unique aspects of the VR context challenge the direct applicability of Loss Aversion Theory.
H3: 
In the dynamic formation process of VRIE, the negative impact of negative changes in user attention to the unique attributes of VR wearable devices, which reflect different sub-dimensions of PIF, is not necessarily significantly stronger than the positive impact of equivalent positive changes. This challenges the universality of Loss Aversion Theory in VR contexts.
Compared with existing studies, the core innovations of this paper are as follows: (1) Depth and unity of theoretical integration. Unlike most previous studies that applied a single theory in isolation, this study is the first to deeply integrate two core theories, Flow Theory and Privacy Calculus Theory. It uses this unified perspective to dynamically decode the complex formation mechanism of VRIE under the joint action of attention non-linearity, the technology-privacy game, and individual differences (CWTI). This integration provides a more comprehensive and dynamic analytical framework for understanding user experience in advanced human–computer interaction. (2) Empirical focus on the non-linear mechanism of attention and PIF with its sub-dimensions. The non-linear effect of attention, such as the inverted U-shape, is explicitly taken as a core hypothesis, and its internal mechanism is explained based on Flow Theory. Concurrently, PIF and its key sub-dimensions are proposed, defined, and tested as the crucial mechanism linking specific device attributes to user flow experience. This transcends the simple linear assumptions about attention’s influence and the isolated view of device attributes found in traditional research. (3) Critical testing of classic behavioral heuristic theories. In the unique context of VR, explicitly challenging the applicability assumptions of classic theories like Loss Aversion and conducting empirical tests helps reveal how specific human–computer interaction environments reshape user psychology and behavioral patterns. The research framework and hypotheses are depicted in Figure 1.

3. Research Methods

3.1. Data Source and Feature Extraction: Capturing Dynamic Attention Trajectories and Manifestations of Perceptual-Interactive Fidelity

The data for this study were sourced from the Amazon e-commerce platform, encompassing approximately 30,000 online user reviews for 88 mainstream VR wearable devices from January 2012 to November 2022. Online reviews were chosen as the data source because they can capture users’ genuine concerns about various aspects of product attributes in a large-scale, long-term natural language format. These aspects collectively constitute perceptions of PIF and its various sub-dimensions [27]. This provides a solid data foundation for studying the dynamics of LAE, attention, and the practical manifestations of PIF. The complete research process is shown in Figure 2.
We employed Latent Semantic Analysis (LSA) [28] technology to process and quantify these textual data. LSA can objectively and efficiently extract core semantic concepts from massive reviews and quantify their discussion intensity, i.e., “attention”, across different time periods. This study uses LSA to identify and quantify changes in attention for the following key variables:
  • Dependent Variable: Changes in attention to semantic clusters related to Virtual Reality Immersive Experience.
  • Independent Variables: Changes in attention to semantic clusters related to unique attributes of VR devices. These attributes are operationally mapped to the respective sub-dimensions of “Perceptual-Interactive Fidelity”.
  • Moderating Variable: CWTI is indirectly measured and operationalized through the overall sentiment tendency, i.e., positive or negative, expressed in user reviews or words related to the acceptance of new technology features. To clarify this procedure, we employed a lexicon-based sentiment analysis method to process the reviews. The rationale for using sentiment as a proxy for CWTI is that users who express strong positive emotions towards a technology are generally considered to have a higher willingness to accept and immerse themselves in it, as emotions significantly influence technology acceptance behaviors [29]. Operationally, we calculated the sentiment polarity score for each review. This score was then binarized: reviews with a positive score (>0) were coded as representing high CWTI (value = 1), while those with a negative or neutral score (≤0) were coded as representing low CWTI (value = −1).
Table 1 lists the results of LSA, in which six factors, or concepts, were identified. The singular values in Table 1 indicate the amount of variance explained by each factor, signifying the frequency with which these factors appear. The textual data in consumer reviews contain many concepts and themes, some of which describe key product features; these features collectively reflect different aspects of the product’s PIF. These concepts and themes reflect the degree of consumer attention to different product factors. High-load items in each factor point to specific attributes of VR wearable devices. For example, the factor related to the VRIE of VR wearable devices (Concept 4) is mainly associated with terms such as immersion, presence, realism, engagement, and environment. For each factor, we retain the top 5 high-load items, considering them as key terms defining consumer reviews or the main content constituting that factor [30,31].

3.2. Model Setting and Analysis Strategy: Revealing Non-Linearity and Moderating Effects

To test the above hypotheses, especially the non-linear effect of attention and the moderating role of CWTI in privacy calculus, this study constructed a series of regression models and used Ordinary Least Squares (OLS) and Quantile Regression for parameter estimation. OLS regression is used to evaluate the average impact of independent variables on dependent variables. In contrast, quantile regression can reveal the heterogeneous impact of independent variables at different distribution points of the dependent variable, such as the 15th, 35th, 55th, 75th, and 95th percentiles. This is crucial for accurately capturing and verifying non-linear relationships [32].
To verify the impact of attention to other attributes on the attention to VRIE in VR wearable devices, this study proposes four models to analyze both the overall and individual effects, including the impact of changes in attention to each attribute on changes in attention to VRIE, as well as the impact of average changes in attention to attributes on changes in attention to VRIE.
For each hypothesis, this study conducts an analysis from two aspects: the overall effect and the individual effect. For product i, to test whether the change in attention to attribute h ( R i , h ) has an impact on the change in attention to VRIE ( C i ), this study proposes the following four models:
Model 1 is used to test the overall effects of H1 and H2. It analyzes the impact of the average change in attention to the attributes constituting PIF on the change in VRIE attention:
C i = α 1 + β R ¯ R i ¯ + γ S i + δ ( R i ¯     S i ) + ε i , 1
R i ¯ = R i , t + 1 ¯ R i , t ¯ = 1 H h = 1 H R i , h , t + 1 1 H h = 1 H R i , h , t
where C i is the change in VRIE attention, R i ¯ is the average change in attention to attributes of VR wearable device i between time t and t + 1, β R ¯ represents the impact of the average change in attention to other attributes ( R i ¯ ) on the change in VRIE attention ( C i ). S i represents the sentiment of consumer reviews, 1 represents positive sentiment, and −1 represents negative sentiment; the coefficient γ reflects the initial level of VRIE attention change influenced by the positivity or negativity of sentiment. The interaction term coefficient δ reflects the impact of consumer sentiment on the average change in attention to other attributes, that is, the combined effect of sentiment positivity or negativity and attribute attention change. α 1 is a constant, ε i , 1 is the error term, and H represents the number of attributes.
Model 2 extends Model 1 to test the individual effects within H1 and H2. It tests the impact of each attribute’s attention change ( R i , h ) on the change in VRIE attention ( C i ):
C i = α 2 + h = 1 H β h R i , h + γ S i + h = 1 H δ h ( R i , h ) S i + ε i , 2
R i , h = R i , h , t + 1 R i , h , t
where R i , h is the change in attention to attribute h of VR wearable device i from time t to t + 1, β h is the impact of the change in attention to attribute h ( R i , h ) on the change in VRIE attention ( C i ), the interaction term coefficient δ h reflects the impact of the interaction between the change in attention to attribute h and sentiment on the change in VRIE attention. α 2 is a constant, ε i , 2 is the error term, and H represents the number of attributes.
Model 3 is mainly used to detect the potential asymmetry of positive and negative changes in the average attention to attributes constituting PIF, thereby testing the overall effects of H3. The model is expressed as follows:
C i = α 3 + β R ¯ p R i p ¯ + β R ¯ n R i n ¯ + γ S i + δ p R i p ¯     S i   +   δ n R i n ¯     S i   + ε i , 3
R i p ¯ = R i , t + 1 ¯ R i , t ¯ D 1 , w h e r e   D 1 = 1   i f   R i , t + 1 ¯ R i , t ¯ > 0 , a n d   D 1 = 0   o t h e r w i s e
R i n ¯ = R i , t + 1 ¯ R i , t ¯ D 2 , w h e r e   D 2 = 1   i f   R i , t + 1 ¯ R i , t ¯ < 0 , a n d   D 2 = 0   o t h e r w i s e
where β R ¯ p and β R ¯ n respectively represent the positive and negative changes in the average attention to other attributes, δ p and δ n respectively reflect the impact of the interaction between positive changes in the average attention to other attributes and sentiment, and the interaction between negative changes in the average attention to other attributes and sentiment on the change in VRIE attention. α 3 is a constant, ε i , 3 is the error term, and H represents the number of attributes.
Model 4 extends Model 3 to test the individual effects within H3. It is designed to examine the potential asymmetry of the impacts of positive and negative changes in attention to individual attributes.
C i = α 4 + h = 1 H β h p R i , h p + h = 1 H β h n R i , h n + γ S i + h = 1 H δ h p R i , h p + h = 1 H δ h n R i , h n + ε i , 4
R i , h p = R i , h , t + 1 R i , h , t D 1 , w h e r e   D 1 = 1   i f   R i , h , t + 1 R i , h , t > 0 , a n d   D 1 = 0   o t h e r w i s e
R i , h n = R i , h , t + 1 R i , h , t D 2 , w h e r e   D 2 = 1   i f   R i , h , t + 1 R i , h , t < 0 , a n d   D 2 = 0   o t h e r w i s e
Here, β h n β h p represent the impacts of positive and negative changes in attention to attribute h on the change in attention to VRIE, respectively. δ p and δ n reflect the interactive effects of positive and negative changes in attention to attribute h with sentiment on the change in attention to VRIE. α 4 is a constant, ε i , 4 is the error term, and H denotes the number of attributes.
The estimated parameters are then obtained by minimizing the following function for the Models 1 to 4, as shown in Table 2.
The specific model settings are designed to test the following:
  • LAE part of H1 and H2: Through Models 1 and 2, we analyze the impact of changes in attention to device attributes (manifesting different sub-dimension indicators of PIF)—both average and individual—on changes in VRIE, as well as the moderating effect of CWTI in this relationship.
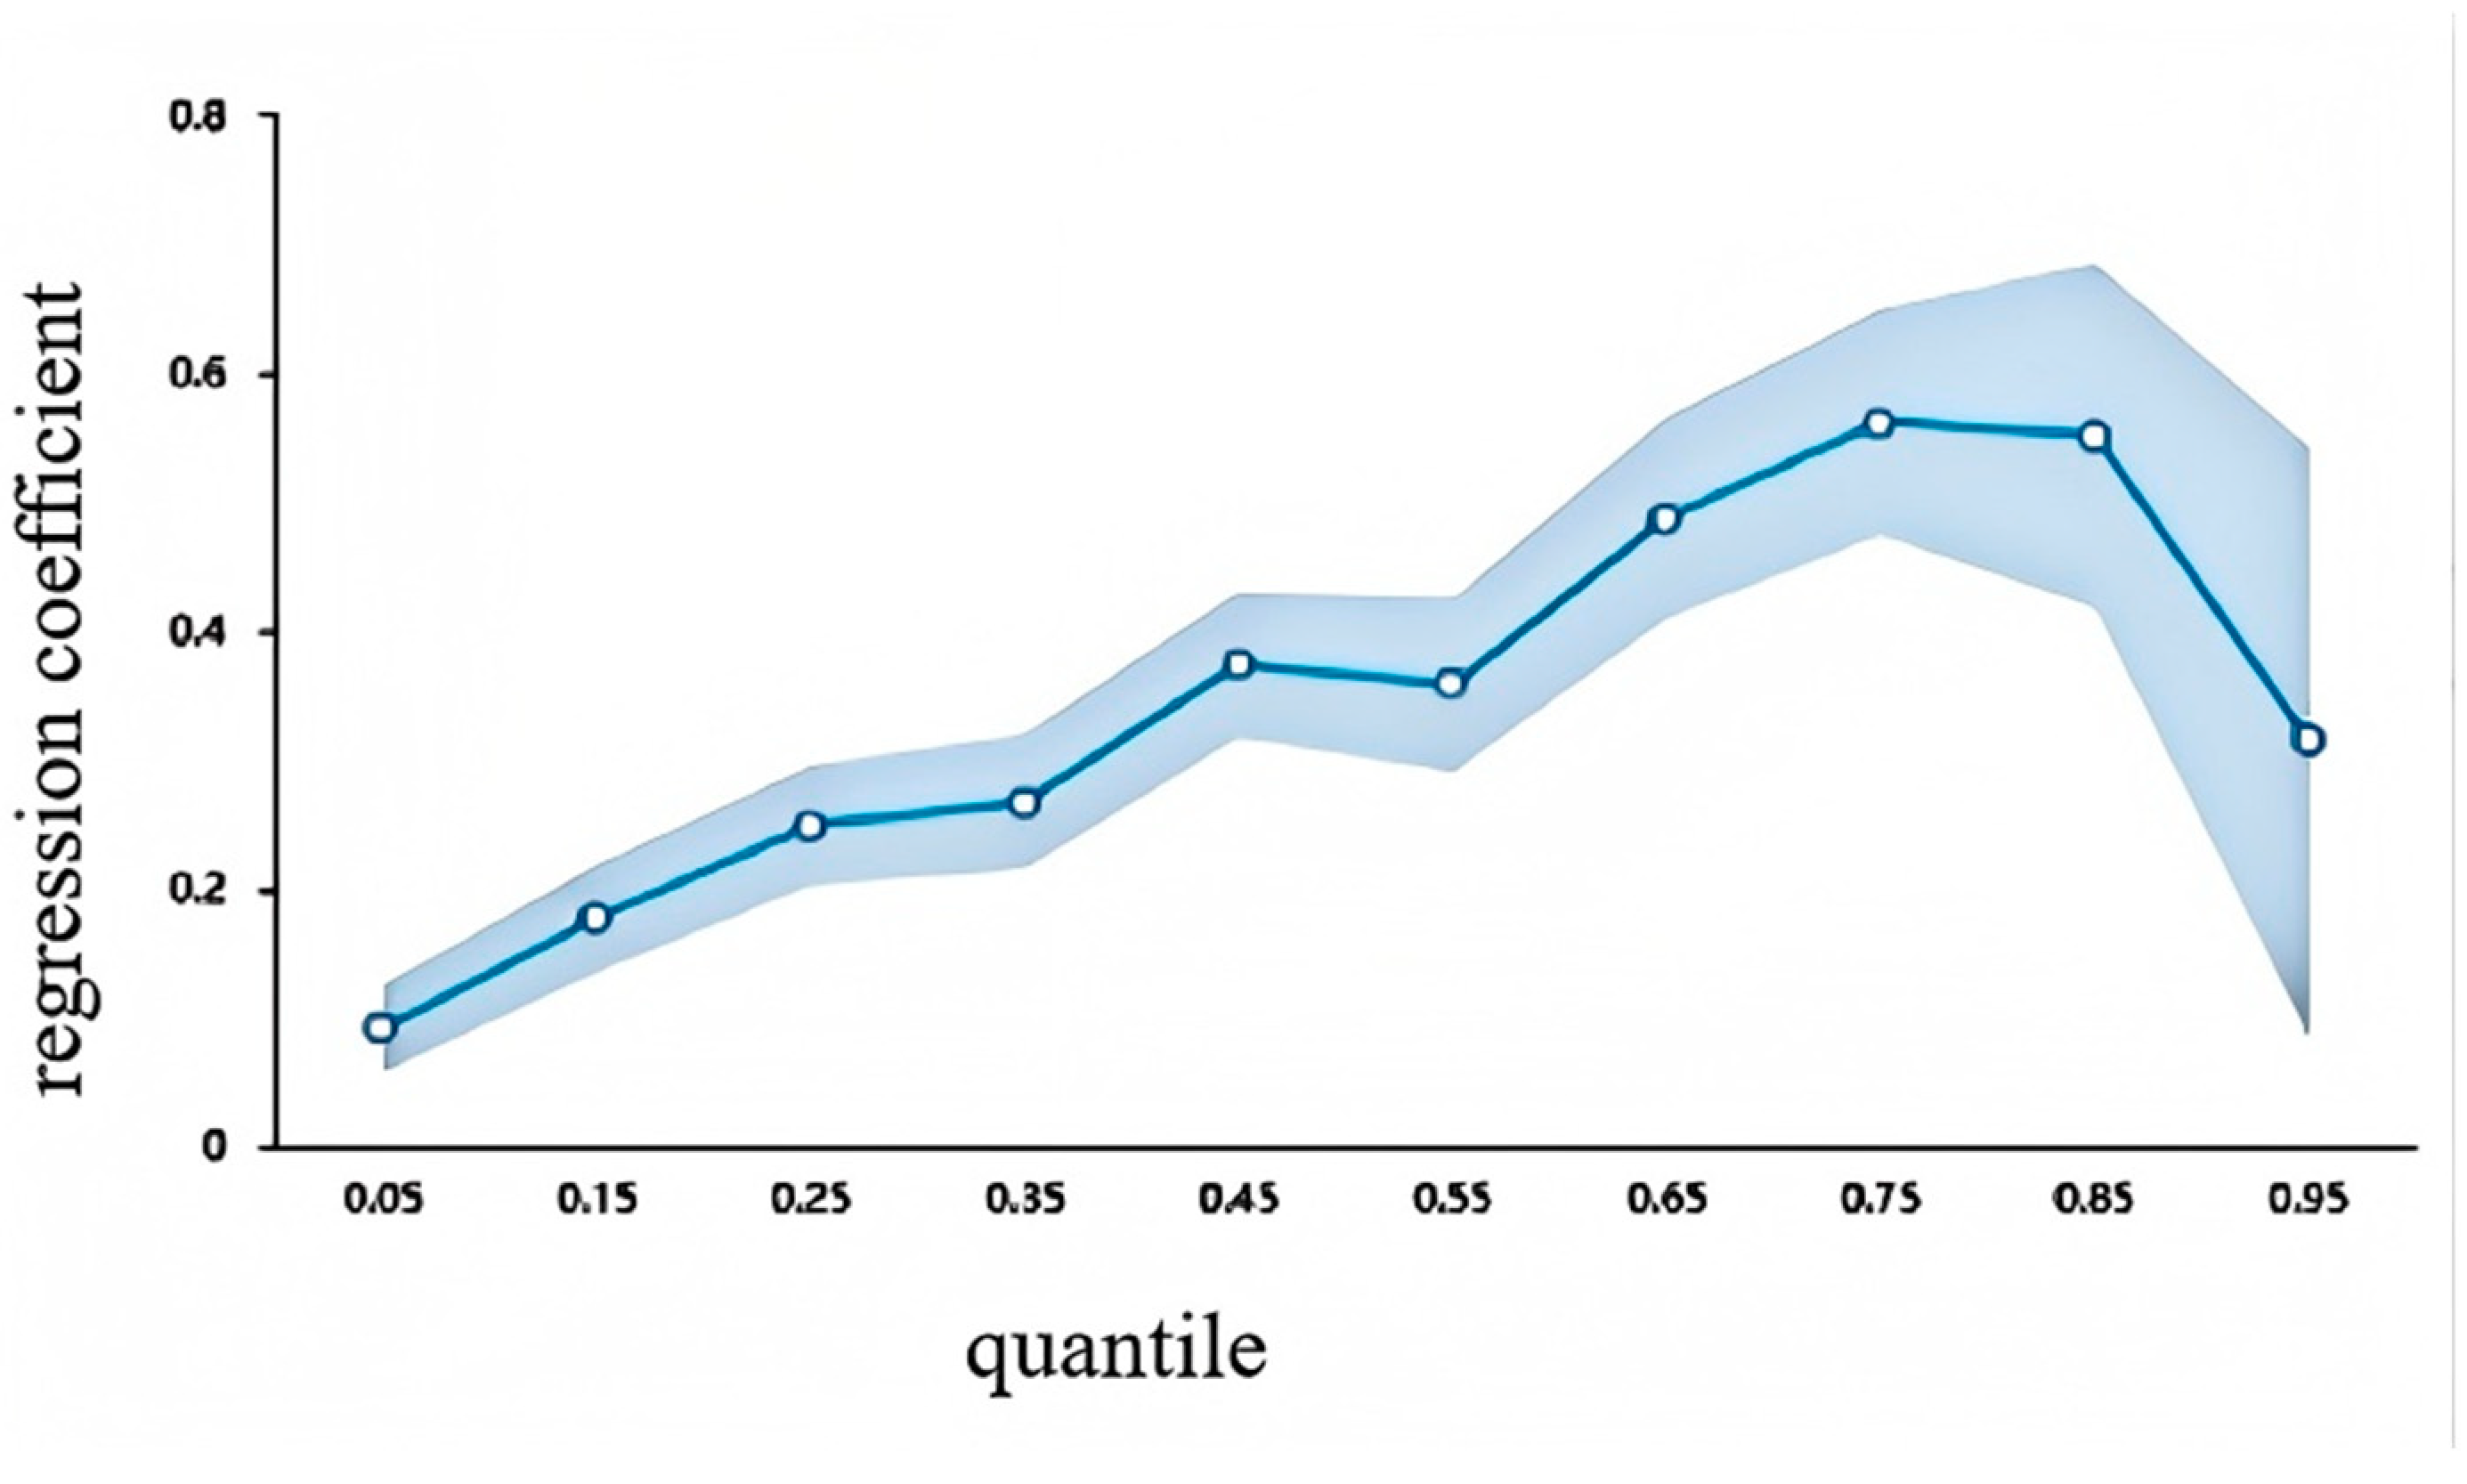
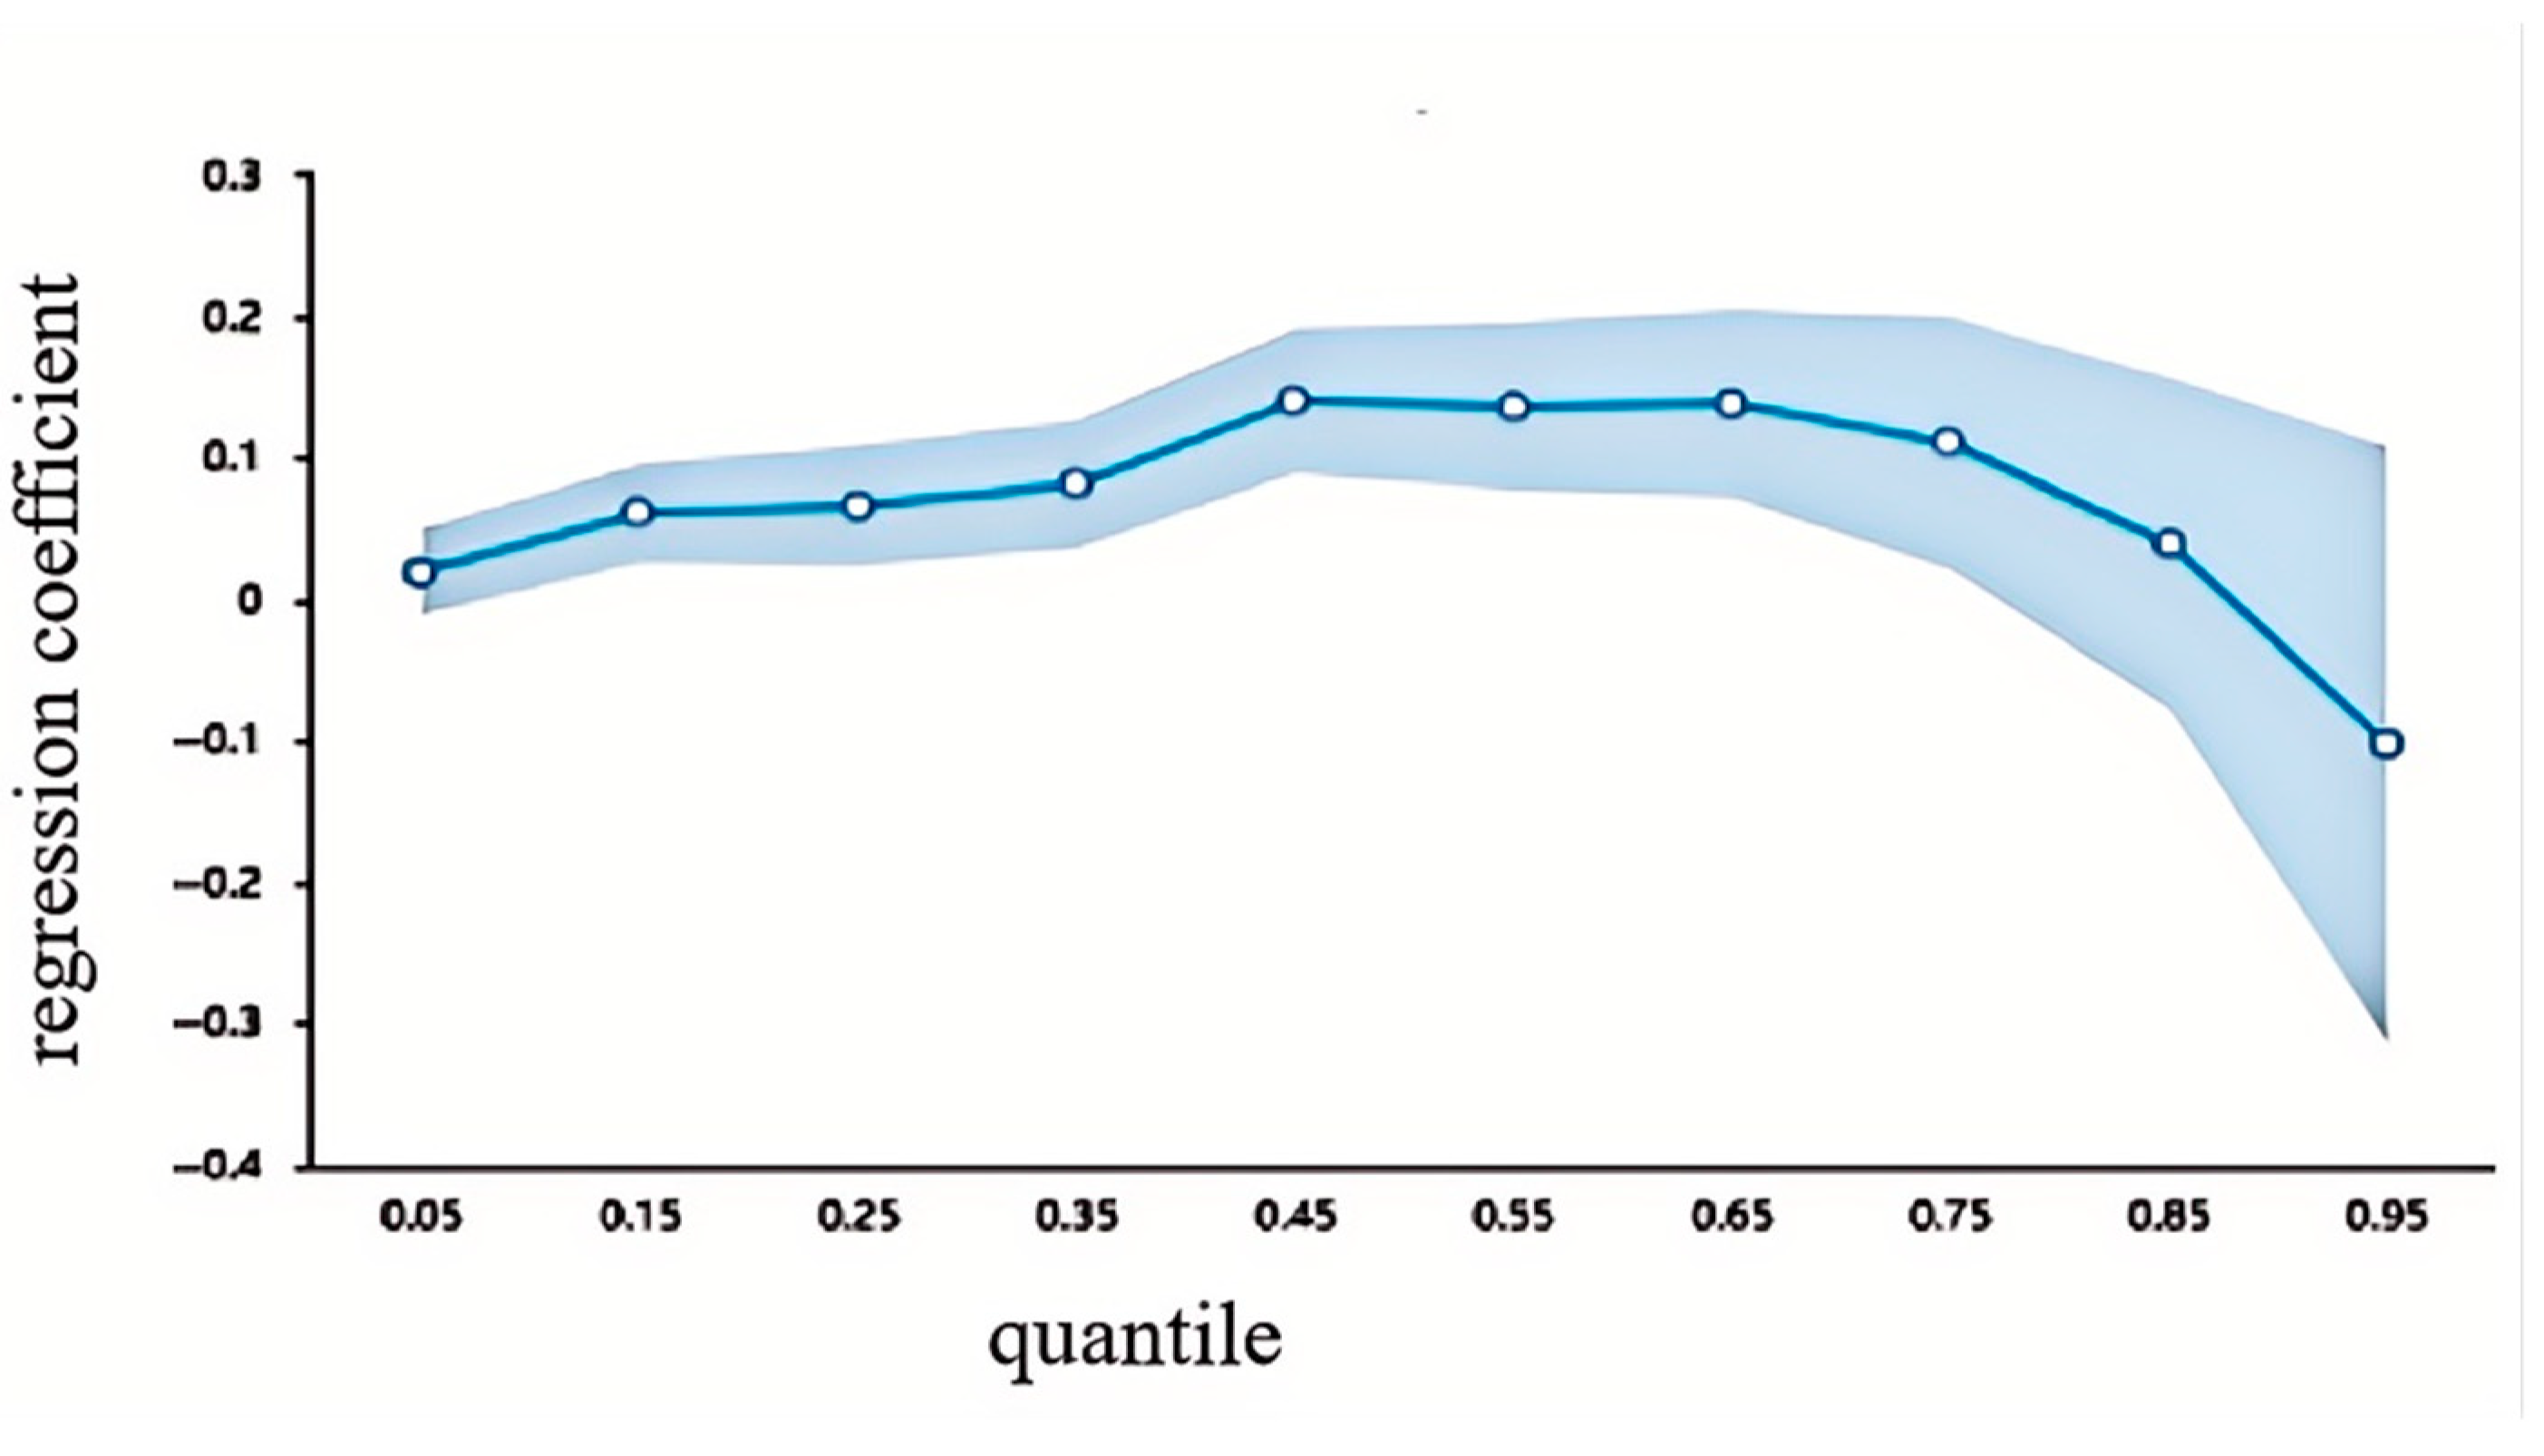
  • Non-linear part of H1: We focus on analyzing the regression coefficients of Model 2 at different quantiles to see whether they present a systematic non-linear pattern. This reflects the optimal interval of attention to various aspects of PIF.
  • H3 (Loss Aversion): Through Models 3 and 4, we compare the coefficients of the effects of positive and negative changes in attention to attributes (manifesting different sub-dimension indicators of PIF) on VRIE to test whether there is significant asymmetry.
All models were subjected to rigorous statistical tests to ensure the robustness of the results (for example, the VIF test for multicollinearity [33,34], and the DW test for serial correlation [35]).

4. Research Results

4.1. Confirmation of LAE, Non-Linear Characteristics of Attention, and VRIE

Table 3 clearly shows that the average increase in attention to the unique attributes of VR devices, which collectively reflect the overall level of their PIF, significantly and positively promotes the improvement of VRIE attention (β > 0, p < 0.01). This strongly supports the existence of LAE as proposed in H1. This indicates that users’ positive perceptions and attention to device attributes accumulate over time, continuously enhancing their overall immersive experience.
More importantly, Figure 3 and Figure 4 provide strong evidence for the non-linear effect of attention predicted in H1.
As shown in Figure 3, the impact of changes in attention to Motion Tracking Accuracy, a key indicator of Spatial-Motor Fidelity, on changes in VRIE exhibits a significant inverted U-shape. This finding suggests that while good tracking is necessary, when users become overly focused on the technical details of tracking or have excessively high demands for its performance, they may be pulled out of the virtual world task. This excessive awareness of the technology itself can disrupt the sense of immersion, which supports the concept of an “optimal challenge–skill balance” in Flow Theory.
These non-linear results are one of the core findings of this study. They clearly show that in VR human–computer interaction, attention to device attributes is not simply “the more, the better”. Instead, there is a dynamic “optimal attention interval” that depends on the attribute type (i.e., the specific fidelity sub-dimension) and user characteristics (such as CWTI).

4.2. CWTI in the Technology-Privacy Game

The regression results of Model 1 and Model 2 (as shown in Table 3 and Table 4) both consistently demonstrate that CWTI plays a significant moderating role in the relationship between the LAE of attention to device attributes and VRIE. This supports H2. Specifically, in the user group with high CWTI (positive emotion or high technology acceptance), positive changes in device attributes can be more effectively converted into an improvement in VRIE (flow). For example, the OLS results show that the effect coefficient of Motion Tracking Accuracy (an indicator of Spatial-Motor Fidelity) in high CWTI users (0.335, p < 0.01) is significantly greater than its effect coefficient in low CWTI users (0.275, p < 0.01). This result clearly reveals the mechanism of privacy calculus at play: for users with a high willingness to immerse in technology, the experiential benefits in the ‘technology-privacy’ trade-off are weighted more heavily, thus allowing technological advancements to more effectively translate into an enhanced immersive experience.
This finding profoundly reveals the operating mechanism of Privacy Calculus Theory in the VR context, and the crucial decision-making influence of CWTI when users face the core dilemma of “technological experiential benefits” versus “privacy risk concerns”. When high CWTI users engage in the technology-privacy game (i.e., privacy calculus), they tend to believe that the immersive benefits brought by the technology and its “Perceptual-Interactive Fidelity” outweigh the potential privacy costs. Therefore, their “privacy calculus” results are more optimistic. This allows them to more fully benefit from the technical advantages of the device and enter a state of flow. In contrast, low CWTI users are more sensitive to privacy. Their negative privacy calculus results or persistent privacy concerns may become a cognitive interference, weakening the positive role of technology attributes in promoting flow. Eye-tracking technology is a typical example: its contribution to VRIE will be highly dependent on the user’s CWTI level and the privacy calculus results associated with the collection of accompanying biodata.

4.3. Challenges in the Applicability of Loss Aversion Theory in VR Contexts

The regression results of Model 3 and Model 4 (as shown in Table 5 and Table 6) failed to provide consistent support for the universality of Loss Aversion Theory in the VR context, thus confirming the prediction of H3. In most cases, whether considering changes in average attention to overall attributes that collectively reflect the overall level of “Perceptual-Interactive Fidelity”, or changes in attention to a single attribute reflecting a sub-dimension, the absolute value of the negative impact of a negative change on VRIE is not always significantly greater than the positive impact of an equivalent positive change. In other words, in the experience-driven context of VR, the ‘gain’ from a feature improvement can be just as impactful, or even more so, than the ‘loss’ from a flaw of similar magnitude. This contrasts with the traditional economic assumption that ‘losses loom larger than gains.
This result raises an important caution against directly applying traditional behavioral heuristics such as Loss Aversion to VR, a highly experience-driven, novel, and stimulating human–computer interaction system. Possible explanations include: the “gain frame” effect of VR experience—users are more focused on pursuing novel and enjoyable experiential gains rather than avoiding potential experiential “losses”; the immersiveness and entertainment of VR may temporarily change users’ emotional and cognitive evaluation patterns, making them less sensitive to negative feedback; or, when faced with a negative change in a certain attribute, users may actively adjust their attention to or cognition of other attributes to maintain an overall positive experience. This finding opens up new theoretical space for human–computer interaction research, namely, how specific interactive technology environments reshape or even subvert users’ traditional decision-making heuristics.

5. Discussion

5.1. Dynamic Decoding of VRIE Through Flow and Privacy Calculus Theories: Core Insights from an Integrated Perspective

The core contribution of this study lies in providing a unified and more explanatory analytical framework for dynamically decoding the complex formation mechanism of VRIE. By integrating Flow Theory and Privacy Calculus Theory and introducing PIF as a key concept, this framework successfully links users’ internal psychological states (CWTI), cognitive processes (attention, privacy calculus), and external technical factors (VR device attributes).
Our empirical finding of a non-linear (e.g., inverted U-shaped) relationship between attention and VRIE serves as a critical supplement to Flow Theory in the VR context. It demonstrates that to maintain or promote flow, it is not simply a case of “the more attention to PIF, the better”. Instead, there is an “optimal stimulation interval”. Insufficient attention or excessive attention can both disrupt the formation and maintenance of flow. This challenges the intuition of “performance maximization” in traditional HCI design and emphasizes the importance of “moderation” in pursuing high PIF while managing user cognition.
Furthermore, the moderating role of CWTI reveals the nuanced operation of Privacy Calculus Theory in VR. The finding illustrates that when users face the “technology-privacy game”, their inherent willingness to immerse in technology is a decisive factor. For users with high CWTI, the perceived benefits of an enhanced experience, driven by high PIF, appear to outweigh privacy costs. Their positive privacy calculus allows technological improvements to translate more effectively into VRIE. Conversely, for those with low CWTI, privacy concerns may act as a “cognitive barrier”, diminishing the positive impact of high-fidelity technology and hindering their ability to enter a deep flow state.
Finally, our re-examination of Loss Aversion Theory highlights the unique psychological context of VR. The finding that negative attribute changes did not have a significantly stronger impact than positive ones contributes to a growing body of literature suggesting that classical behavioral heuristics are reshaped in digital and experiential environments [36]. For instance, the nature of psychological ownership for digital goods can differ from that for physical ones, potentially weakening the endowment effect that underpins loss aversion [37]. Furthermore, in highly engaging and goal-oriented environments like VR, users’ cognitive frames may shift towards maximizing performance and experiential gains, making them less sensitive to minor setbacks or ‘losses’, a phenomenon also observed in studies on user engagement and motivation in interactive systems [38]. This not only enriches applied research in behavioral economics but also provides new ideas for HCI to explore how to optimize experience design by understanding users’ reshaped cognitive biases.

5.2. Theoretical Innovation: Comparison with Existing Research

This study’s theoretical innovations advance the understanding of VR user experience in three main ways.
First, by constructing a novel VRIE dynamic decoding framework, we deeply integrate Flow Theory and Privacy Calculus Theory, transcending the limitations of single theoretical perspectives in previous research. Unlike existing VR research that often adopts isolated frameworks, this work places experience formation (flow), risk trade-off (privacy calculus), and individual differences (CWTI) within a unified analytical framework, revealing the dynamic processes and psychological motivations behind VRIE formation.
Second, this study deepens the mechanistic understanding by proposing PIF and its multidimensional composition as the core mechanism through which VR device attributes influence VRIE, and by empirically testing the non-linear mechanism of attention’s impact. This provides a more integrated theoretical construct for how technical parameters synergistically affect user experience. Concurrently, by quantifying the non-linear effects, we provide precise, data-driven insights into how attention thresholds shape user experiences, linking these findings to cognitive load and optimal stimulation theories.
Third, this study critically tests the applicability of a classic behavioral heuristic theory, Loss Aversion, in the unique context of VR. The finding that VR users’ responses deviate from the predictions of Loss Aversion highlights the necessity of re-examining traditional behavioral theories in specific technological and psychological contexts, advancing research on how emerging technologies reshape cognitive and behavioral patterns. This aligns with the Technology Acceptance Model, which posits that perceived usefulness and ease of use are primary drivers of technology adoption, often overriding other behavioral factors [39].

6. Conclusion and Implications

This study, by using Flow Theory and Privacy Calculus Theory as core pillars and introducing PIF and its sub-dimensions as a key concept, deeply decodes the dynamic formation mechanism of Virtual Reality Immersive Experience (VRIE). The main conclusions and implications are as follows:
  • The dynamic formation of VRIE depends on the achievement and maintenance of flow, with PIF being its crucial foundation: User attention to the unique attributes of VR devices, which collectively reflect the various sub-dimensions of their PIF, affects VRIE through the LAE, but this process is not a simple linear superposition. The non-linear effects of attention are prevalent. This indicates the existence of an “optimal attention threshold” or “optimal stimulation interval” for promoting flow; excessive or insufficient attention can impair the immersive experience.
  • The technology-privacy game is a key contextual factor in VRIE formation, with CWTI playing a core moderating role: Users engage in privacy calculus when weighing the immersive benefits brought by VR technology and its PIF against concerns about privacy risks. CWTI significantly moderates their decisions by influencing their privacy calculus processes. Users with high CWTI are more inclined to accept potential risks for the sake of experience, making it easier for their positive attention to technological attributes to translate into VRIE improvement.
  • Traditional behavioral heuristics face applicability challenges in VR: The study did not consistently support the predictive power of Loss Aversion Theory in VR contexts. This suggests that the unique interactive and experiential characteristics of VR may alter users’ traditional response patterns to positive and negative information.
To design effective Human–Computer Interfaces (HCI), the focus for VR systems must shift from merely maximizing technical parameters to enhancing user experience by optimizing overall PIF and by incorporating careful attention management. VR system design should not blindly pursue the extreme of all technical parameters or the infinite accumulation of information. Through user research, the optimal attention interval for key attributes constituting aspects of PIF should be identified to avoid cognitive load caused by information overload, complex operations, or excessive emphasis on technical details, thereby preserving flow. Design should guide users to focus on core tasks and the smooth experience itself, ensuring that PIF enhancements genuinely serve the user experience rather than becoming a new burden.
Integrating privacy by design into the user experience journey is crucial while respecting users’ privacy calculus needs. For VR functions that involve the collection of personal data, highly transparent notifications and user-friendly control options must be provided. The differentiated needs of users with varying CWTI should be fully considered, offering a “privacy-friendly” mode for low-CWTI users without sacrificing the core experience, or enhancing perceived benefits to encourage more active privacy calculus.
To further tailor the VR experience, segmenting user groups and implementing differentiated immersion strategies and communications is essential. Profiling and segmenting users based on their CWTI levels and other relevant psychological traits (such as technology readiness and privacy concerns) allows for targeted approaches. For high-CWTI users, the focus can be on promoting the ultimate immersion brought by cutting-edge technology, emphasizing the advantages of high PIF. For low-CWTI users, prioritizing safety, controllability, and ease of use, while gradually improving their technology acceptance through education and trust-building, is key.
In light of these tailored strategies, rethinking “nudge” strategies based on traditional behavioral economics theory becomes necessary. Given that theories such as Loss Aversion may not be fully applicable in VR, designers and marketers need to carefully evaluate the effectiveness of “user guidance” or “behavioral nudge” strategies that rely on traditional cognitive biases. It may be necessary to explore new incentive and guidance mechanisms that are better adapted to the unique characteristics of the VR experience.

Limitations and Future Research

This study has several limitations that open avenues for future research. First, our reliance on online review data introduces potential sample bias. The reviewers may not be representative of all VR users, often reflecting more extreme positive or negative opinions. Second, the use of text data alone is a limitation. It restricts our ability to capture non-verbal dimensions of the user experience. For instance, we cannot objectively verify self-reported immersion with physiological metrics (e.g., heart rate, electrodermal activity) or analyze emotional cues from facial expressions. Third, there is a lack of demographic data. The anonymity of Amazon reviews prevents us from accessing key demographic variables such as age, gender, cultural background, or prior VR experience, which could significantly influence CWTI and privacy concerns. Fourth, the cultural context of the reviews is limited. The data are primarily from the English-speaking Amazon platform, and the generalizability of our findings to other cultural contexts remains to be tested.
Based on these limitations and our findings, we propose several directions for future research. Experimental studies could be conducted in a lab setting to precisely manipulate sub-dimensions of PIF (e.g., latency, refresh rate) and directly validate the non-linear attention effects found in this study. Multi-modal data fusion, combining large-scale text analysis with smaller-scale lab studies that incorporate physiological data (e.g., EEG, eye-tracking), could build a more comprehensive model for measuring and decoding VRIE. Cross-cultural comparative studies, replicating this research on e-commerce platforms in different cultural contexts, would test the cultural universality of the relationships between PIF, CWTI, and privacy calculus. Finally, longitudinal panel studies, tracking a cohort of VR users over an extended period, would provide a more authentic capture of the individual-level LAE, complementing the cross-sectional time-series analysis of this study.

Author Contributions

Conceptualization, S.L. and Z.Q.; methodology, Z.Q. and Z.L.; software, M.L.; validation, Z.Q. and Y.W.; formal analysis, M.L.; investigation, Z.Q.; resources, Z.Q.; data curation, Z.L. and J.Z.; writing—original draft, Z.Q. and Z.L.; writing—review and editing, M.L. and J.Z.; visualization, M.L., J.Z. and Y.W.; supervision, S.L.; project administration, S.L.; funding acquisition, S.L. All authors have read and agreed to the published version of the manuscript.

Funding

This research was supported by the National Natural Science Foundation of China (No. 72271155 and No. 71871135).

Data Availability Statement

The data presented in this study are available upon reasonable request. from the corresponding author.

Conflicts of Interest

The authors declare no conflicts of interest.

Abbreviations

The following abbreviations are used in this manuscript:
VRIEVirtual Reality Immersion Experience
CWTIConsumers’ Willingness for Technological Immersion
LAELongitudinal Associative Effects
PIFPerceptual-Interactive Fidelity

References

  1. Slater, M.; Sanchez-Vives, M.V. Enhancing our lives with immersive virtual reality. Front. Robot. AI 2016, 3, 74. [Google Scholar] [CrossRef]
  2. Lee, H.; Chung, N.; Lee, S. Presence in virtual golf simulators: The effects of presence on perceived enjoyment, perceived value, and behavioral intention. New Media Soc. 2013, 15, 930–946. [Google Scholar] [CrossRef]
  3. Slater, M.; Wilbur, S. A framework for immersive virtual environments (FIVE): Speculations on the role of presence in virtual environments. Presence Teleoperators Virtual Environ. 1997, 6, 603–616. [Google Scholar] [CrossRef]
  4. Steuer, J. Defining virtual reality: Dimensions determining telepresence. J. Commun. 1992, 42, 73–93. [Google Scholar] [CrossRef]
  5. Javornik, A. Augmented reality: Research agenda for studying the impact of its media characteristics on consumer behavior. J. Retail. Consum. Serv. 2016, 30, 252–261. [Google Scholar] [CrossRef]
  6. Li, S.; Zhang, J.; Qin, Z. The Impact of Cue-Interaction Stimulation on Impulse Buying Intention on Virtual Reality Tourism E-commerce Platforms. J. Bus. Res. 2023, 155, 113456. [Google Scholar] [CrossRef]
  7. Li, L.; Yu, F.; Shi, D.; Shi, J.; Tian, Z.; Yang, J.; Wang, X.; Jiang, Q. Application of virtual reality technology in clinical medicine. Am. J. Transl. Res. 2017, 9, 3867. [Google Scholar]
  8. Loureiro, S.M.C.; Guerreiro, J.; Ali, F. 20 years of research on virtual reality and augmented reality in tourism context: A text-mining approach. Tour. Manag. 2020, 77, 104028. [Google Scholar] [CrossRef]
  9. Suh, A.; Prophet, J. The state of immersive technology research: A literature analysis. Comput. Hum. Behav. 2018, 86, 77–90. [Google Scholar] [CrossRef]
  10. Slater, M.; Spanlang, B.; Corominas, J. Simulating virtual environments within virtual environments as the basis for a psychophysics of presence. ACM Trans. Graph. TOG 2010, 29, 1–9. [Google Scholar] [CrossRef]
  11. Madary, M.; Metzinger, T.K. Real virtuality: A code of ethical conduct. Recommendations for good scientific practice and the consumers of VR-technology. Front. Robot. AI 2016, 3, 3. [Google Scholar]
  12. Duchowski, A.T. A breadth-first survey of eye-tracking applications. Behav. Res. Methods Instrum. Comput. 2002, 34, 455–470. [Google Scholar] [CrossRef] [PubMed]
  13. Tversky, A.; Kahneman, D. Availability: A heuristic for judging frequency and probability. Cogn. Psychol. 1973, 5, 207–232. [Google Scholar] [CrossRef]
  14. Shin, D. Empathy and embodied experience in virtual environment: To what extent can virtual reality stimulate empathy and embodied experience? Comput. Hum. Behav. 2018, 78, 64–73. [Google Scholar] [CrossRef]
  15. Csikszentmihalyi, M. Flow: The Psychology of Optimal Experience; Harper & Row: New York, NY, USA, 1990. [Google Scholar]
  16. Dinev, T.; Hart, P. An extended privacy calculus model for e-commerce transactions. Inf. Syst. Res. 2006, 17, 61–80. [Google Scholar] [CrossRef]
  17. Zhang, J.; Zheng, W.; Wang, S. The study of the effect of online review on purchase behavior Comparing the two research methods. Int. J. Crowd Sci. 2020, 4, 73–86. [Google Scholar] [CrossRef]
  18. Kousha, K.; Thelwall, M. Can Amazon. com reviews help to assess the wider impacts of books? J. Assoc. Inf. Sci. Technol. 2016, 67, 566–581. [Google Scholar] [CrossRef]
  19. Landauer, T.K.; Dumais, S.T. A solution to Plato’s problem: The latent semantic analysis theory of acquisition, induction, and representation of knowledge. Psychol. Rev. 1997, 104, 211. [Google Scholar] [CrossRef]
  20. Paivio, A. Dual coding theory: Retrospect and current status. Can. J. Psychol./Rev. Can. De Psychol. 1991, 45, 255. [Google Scholar] [CrossRef]
  21. Makransky, G.; Lilleholt, L. A structural equation modeling investigation of the emotional value of immersive virtual reality in education. Educ. Technol. Res. Dev. 2018, 66, 1141–1164. [Google Scholar] [CrossRef]
  22. Keith, M.J.; Thompson, S.C.; Hale, J.; Lowry, P.B.; Greer, C. Information disclosure on mobile devices: Re-examining privacy calculus with actual user behavior. Int. J. Hum. Comput. Stud. 2013, 71, 1163–1173. [Google Scholar] [CrossRef]
  23. Kahneman, D.; Tversky, A. Prospect theory: An analysis of decision under risk. In Handbook of the Fundamentals of Financial Decision Making: Part I; World Scientific: Singapore, 2013; pp. 99–127. [Google Scholar]
  24. Hirschman, E.C.; Holbrook, M.B. Hedonic consumption: Emerging concepts, methods and propositions. J. Mark. 1982, 46, 92–101. [Google Scholar] [CrossRef]
  25. Voss, K.E.; Spangenberg, E.R.; Grohmann, B. Measuring the hedonic and utilitarian dimensions of consumer attitude. J. Mark. Res. 2003, 40, 310–320. [Google Scholar] [CrossRef]
  26. Ryan, R.M.; Rigby, C.S.; Przybylski, A. The motivational pull of video games: A self-determination theory approach. Motiv. Emot. 2006, 30, 344–360. [Google Scholar] [CrossRef]
  27. Zhang, J.; Liu, M.; Li, Z. Impact of peer-to-peer online experience on cultural tourism marketing. Tour. Manag. 2022, 90, 104488. [Google Scholar]
  28. Kulkarni, S.S.; Apte, U.M.; Evangelopoulos, N.E. The use of latent semantic analysis in operations management research. Decis. Sci. 2014, 45, 971–994. [Google Scholar] [CrossRef]
  29. Beaudry, A.; Pinsonneault, A. The other side of acceptance: Studying the direct and indirect effects of emotions on information technology use. MIS Q. 2010, 34, 689–710. [Google Scholar] [CrossRef]
  30. Ahmad, S.N.; Laroche, M. Analyzing electronic word of mouth: A social commerce construct. Int. J. Inf. Manag. 2017, 37, 202–213. [Google Scholar] [CrossRef]
  31. Kwok, L.; Xie, K.L. Factors contributing to the helpfulness of online hotel reviews: Does manager response play a role? Int. J. Contemp. Hosp. Manag. 2016, 28, 2156–2177. [Google Scholar] [CrossRef]
  32. Gan, X.; Fernandez, I.C.; Guo, J.; Wilson, M.; Zhao, Y.; Zhou, B.; Wu, J. When to use what: Methods for weighting and aggregating sustainability indicators. Ecol. Indic. 2017, 81, 491–502. [Google Scholar] [CrossRef]
  33. Hair, J.F., Jr.; Black, W.C.; Babin, B.J.; Anderson, R.E.; Tatham, R.L. Multivariate Data Analysis; Prentice Hall: Upper Saddle River, NJ, USA, 1998; Volume 5. [Google Scholar]
  34. Neter, J.; Kutner, M.H.; Nachtsheim, C.J.; Wasserman, W. Applied Linear Statistical Models; Irwin: Chicago, IL, USA, 1996; Volume 4. [Google Scholar]
  35. Durbin, J.; Watson, G.S. Testing for serial correlation in least squares regression. II. In Breakthroughs in Statistics; Springer: New York, NY, USA, 1992; pp. 260–266. [Google Scholar]
  36. Lambrecht, A.; Tucker, C. Algorithmic bias? An empirical study of apparent gender-based discrimination in the display of STEM career ads. Manag. Sci. 2019, 65, 2966–2981. [Google Scholar] [CrossRef]
  37. Atasoy, O.; Morewedge, C.K. Digital goods are valued less than physical goods. J. Consum. Res. 2018, 44, 1343–1357. [Google Scholar] [CrossRef]
  38. O’Brien, H.L.; Toms, E.G. What is user engagement? A conceptual framework for defining and measuring engagement with technology. J. Am. Soc. Inf. Sci. Technol. 2008, 59, 938–955. [Google Scholar] [CrossRef]
  39. Davis, F.D. Perceived usefulness, perceived ease of use, and user acceptance of information technology. MIS Q. 1989, 13, 319–340. [Google Scholar] [CrossRef]
Figure 1. Research framework and hypotheses.
Systems 13 00638 g001
Figure 2. Research methodology.
Systems 13 00638 g002
Figure 3. U-shaped effect of changes in attention to content compatibility and richness on changes in VRIE under high willingness.
Systems 13 00638 g003
Figure 4. Inverted U-shaped effect of changes in attention to content compatibility and richness on changes in VRIE under low willingness.
Systems 13 00638 g004
Table 1. Variable operationalization.
ConceptLabelSingular ValueHigh-Load Item
Concept 1Motion Tracking Accuracy933.43Tracking, precision, accuracy, sensor, movement…
Concept 2Wearability Comfort282.40Comfort, fit, experience, adjust, feel…
Concept 3Content Compatibility and Richness255.69App, support, service, email, contact…
Concept 4VRIE238.58Immersion, presence, realism, engagement, environment…
Concept 5Refresh Rate and Latency221.61Refresh rate, response time, latency, smoothness…
Concept 6Haptic Feedback Capabilities217.30Haptic, feedback, tactile, vibration, force feedback…
Table 2. Minimization functions for models 1 to 4.
ModelFunction
Model 1 min i τ Δ C i ( α 1 + β R ¯ τ R i ¯ + γ S i + δ ( R i ¯     S i ) ) + i ( 1 τ ) Δ C i ( α 1 + β R ¯ τ R i ¯ + γ S i + δ ( R i ¯     S i ) )
Model 2 min i τ Δ C i ( α 2 + h = 1 H β h τ R i , h + γ S i + h = 1 H δ h ( R i , h     S i ) ) + i ( 1 τ ) Δ C i ( α 2 + h = 1 H β h τ R i , h + γ S i + h = 1 H δ h ( R i , h     S i ) )
Model 3 min i τ Δ C i ( α 3 + β R ¯ p τ R i p ¯ + β R ¯ n τ R i n ¯ + γ S i + δ p R i p ¯     S i + δ n R i n ¯     S i ) + i ( 1 τ ) Δ C i ( α 3 + β R ¯ p τ R i p ¯ + β R ¯ n τ R i n ¯ + γ S i + δ p R i p ¯     S i + δ n R i n ¯     S i )
Model 4 min i τ Δ C i ( α 4 + h = 1 H β h p τ R i , h p + h = 1 H β h n τ R i , h n + γ S i + h = 1 H δ h p R i , h p     S i + h = 1 H δ h n ( R i , h n     S i ) ) + i ( 1 τ ) Δ C i ( α 4 + h = 1 H β h p τ R i , h p + h = 1 H β h n τ R i , h n + γ S i + h = 1 H δ h p R i , h p     S i + h = 1 H δ h n ( R i , h n     S i ) )
Table 3. Regression results.
Model 1 Regression Results Under Consumer Positive Sentiment
IndicatorOLS Coefficient15th Percentile35th Percentile55th Percentile75th Percentile95th Percentile
Constant-−0.605 *
(−60.447)
−0.375 **
(−28.773)
−0.101 **
(−5.983)
0.283 **
(11.818)
1.279 ** (20.358)
Changes in Average Attributes0.598 **
(24.929)
0.176 ** (17.339)0.379 ** (29.002)0.606 **
(36.136)
0.884 **
(42.377)
1.667 ** (36.911)
R 2 0.358
Model 1 Regression Results under Consumer Negative Sentiment
IndicatorOLS Coefficient15th Percentile35th Percentile55th Percentile75th Percentile95th Percentile
Constant-−0.710 **
(−42.932)
−0.424 **
(−21.921)
−0.109 **
(−4.264)
0.323 **
(9.239)
1.578 ** (20.640)
Changes in Average Attributes0.501 ** (17.075)0.181 ** (12.161)0.348 ** (17.376)0.512 **
(20.490)
0.740 **
(23.992)
1.600 ** (29.260)
R 2 0.251
Note: * p < 0.05, ** p < 0.01.
Table 4. Model 2 regression results.
Model 2 Regression Results Under Consumer Positive Sentiment
IndicatorOLS Coefficient15th Percentile35th Percentile55th Percentile75th Percentile95th Percentile
Constant-−0.597 **
(−58.972)
−0.358 **
(−28.837)
−0.083 **
(−4.978)
0.307 **
(14.758)
1.259 **
(21.341)
Change in Concept 10.335 **
(9.022)
0.141 **
(8.461)
0.203 **
(9.852)
0.294 **
(10.775)
0.460 **
(13.266)
0.255
(1.679)
Change in Concept 20.337 **
(11.588)
0.061 **
(4.472)
0.179 **
(11.379)
0.303 **
(14.293)
0.376 **
(14.828)
0.842 **
(12.391)
Change in Concept 3−0.06 **
(−2.145)
−0.016
(−1.151)
−0.016
(−0.956)
−0.039 *
(−1.972)
−0.027
(−1.146)
0.352 **
(6.002)
Change in Concept 50.172 **
(6.054)
0.013
(1.137)
0.115 **
(7.520)
0.177 **
(8.367)
0.374 **
(13.391)
0.433 **
(5.142)
Change in Concept 6−0.031
(−0.96)
0.045 **
(2.825)
0.013
(0.738)
0.041
(1.720)
−0.031
(−1.036)
0.017
(0.240)
R 2 0.431
Model 2 Regression Results under Consumer Negative Sentiment
IndicatorOLS Coefficient15th Percentile35th Percentile55th Percentile75th Percentile95th Percentile
Constant-−0.694 **
(−42.349)
−0.406 **
(−21.566)
−0.074 **
(−3.052)
0.367 **
(10.816)
1.511 **
(23.374)
Change in Concept 10.275 **
(7.424)
0.160 **
(8.039)
0.202 **
(7.721)
0.249 **
(8.102)
0.465 **
(10.804)
1.025 **
(9.156)
Change in Concept 20.145 **
(3.9)
0.004
(0.214)
0.115 **
(4.871)
0.193 **
(6.123)
0.344 **
(7.448)
0.568 **
(6.206)
Change in Concept 30.132 **
(3.717)
0.062 **
(3.507)
0.084 **
(3.683)
0.137 **
(4.580)
0.111 *
(2.448)
−0.102
(−0.953)
Change in Concept 50.178 **
(5.456)
0.037
(1.895)
0.066 **
(3.174)
0.197 **
(7.078)
0.233 **
(5.773)
0.539 **
(5.689)
Change in Concept 6−0.026
(−0.755)
−0.004
(−0.239)
0.002
(0.074)
−0.033
(−1.147)
−0.035
(−0.877)
0.127
(1.478)
R 2 0.291
Note: * p < 0.05, ** p < 0.01.
Table 5. Model 3 regression results.
Model 3 Regression Results Under Consumer Positive Sentiment
IndicatorOLS Coefficient15th Percentile35th Percentile55th Percentile75th Percentile95th Percentile
Constant-−0.637 **
(−62.566)
−0.444 **
(−32.412)
−0.179 **
(−8.802)
0.269 **
(7.817)
1.545 **
(17.380)
Positive Change in Average Attributes0.361 **
(−12.73)
0.105 **
(11.030)
0.194 **
(13.427)
0.314 **
(15.235)
0.486 **
(14.118)
1.035 **
(15.013)
Negative Change in Average Attributes−0.346 **
(13.289)
−0.073 **
(−6.512)
−0.176 **
(−13.107)
−0.280 **
(−13.652)
−0.536 **
(−15.572)
−1.009 **
(−13.881)
R 2 0.205
Model 3 Regression Results under Consumer Negative Sentiment
IndicatorOLS Coefficient15th Percentile35th Percentile55th Percentile75th Percentile95th Percentile
Constant-−0.738 **
(−45.916)
−0.462 **
(−22.150)
−0.158 **
(−5.872)
0.350 **
(7.595)
1.569 **
(14.877)
Positive Change in Average Attributes0.34 **
(10.367)
0.079 **
(5.014)
0.205 **
(9.674)
0.287 **
(10.344)
0.566 **
(11.785)
0.876 **
(8.175)
Negative Change in Average Attributes−0.323 **
(−9.826)
−0.127 **
(−8.437)
−0.231 **
(−11.024)
−0.326 **
(−11.527)
−0.477 **
(−10.994)
−0.795 **
(−7.960)
R 2 0.153
Note: ** p < 0.01.
Table 6. Model 4 regression results.
Model 4 Regression Results under Consumer Positive Sentiment
IndicatorOLS Coefficient15th Percentile35th Percentile55th Percentile75th Percentile95th Percentile
Constant-−0.633 **
(−161.593)
−0.429 **
(−76.035)
−0.150 **
(−16.736)
0.250 **
(19.638)
1.529 **
(36.148)
Positive Change in Concept 10.225 **
(18.996)
0.080 **
(21.593)
0.162 **
(29.256)
0.246 **
(27.349)
0.348 **
(28.884)
0.508 **
(13.384)
Negative Change in Concept 1−0.184 **
(−15.488)
−0.062 **
(−19.658)
−0.116 **
(−21.170)
−0.179 **
(−20.073)
−0.270 **
(−22.365)
−0.437 **
(−11.956)
Positive Change in Concept 20.21 **
(17.71)
0.065 **
(19.342)
0.112 **
(20.135)
0.199 **
(21.856)
0.296 **
(22.432)
0.535 **
(13.376)
Negative Change in Concept 2−0.191 **
(−16.111)
−0.042 **
(−9.566)
−0.115 **
(−20.268)
−0.178 **
(−19.764)
−0.269 **
(−20.406)
−0.555 **
(−13.158)
Positive Change in Concept 30.146 **
(12.294)
0.035 **
(6.488)
0.085 **
(13.676)
0.135 **
(15.401)
0.280 **
(23.193)
0.578 **
(18.948)
Negative Change in Concept 3−0.143 **
(−12.066)
−0.033 **
(−6.094)
−0.080 **
(−13.154)
−0.182 **
(−20.399)
−0.262 **
(−23.284)
−0.491 **
(−15.052)
Positive Change in Concept 50.17 ** (14.301)0.059 **
(16.599)
0.098 **
(16.575)
0.165 **
(18.645)
0.270 **
(21.422)
0.480 **
(11.314)
Negative Change in Concept 5−0.185 **
(−15.586)
−0.052 **
(−14.660)
−0.125 **
(−23.254)
−0.163 **
(−18.316)
−0.294 **
(−22.302)
−0.497 **
(−10.314)
Positive Change in Concept 60.163 **
(13.785)
0.048 **
(12.366)
0.088 **
(15.146)
0.161 **
(18.499)
0.261 **
(22.405)
0.543 **
(17.779)
Negative Change in Concept 6−0.164 **
(−13.884)
−0.049 **
(−14.370)
−0.126 **
(−23.409)
−0.165 **
(−18.437)
−0.259 **
(−22.243)
−0.412 **
(−12.476)
R 2 0.228
Model 4 Regression Results under Consumer Negative Sentiment
IndicatorOLS Coefficient15th Percentile35th Percentile55th Percentile75th Percentile95th Percentile
Constant-−0.749 **
(−119.295)
−0.494 **
(−56.568)
−0.194 **
(−15.103)
0.300 **
(13.319)
1.753 **
(28.384)
Positive Change in Concept 10.153 **
(10.417)
0.067 **
(10.135)
0.121 **
(12.960)
0.165 **
(12.744)
0.235 **
(10.399)
0.359 **
(6.892)
Negative Change in Concept 1−0.156 **
(−10.57)
−0.077 **
(−12.566)
−0.103 **
(−10.828)
−0.157 **
(−12.260)
−0.229 **
(−10.381)
−0.389 **
(−4.966)
Positive Change in Concept 20.144 **
(9.753)
0.034 **
(5.045)
0.108 **
(12.424)
0.156 **
(11.888)
0.194 **
(8.565)
0.361 **
(6.100)
Negative Change in Concept 2−0.125 **
(−8.482)
−0.058 **
(−7.814)
−0.102 **
(−10.898)
−0.137 **
(−10.608)
−0.172 **
(−7.879)
−0.390 **
(−6.556)
Positive Change in Concept 30.119 **
(8.079)
0.056 **
(10.347)
0.096 **
(10.730)
0.135 **
(10.264)
0.150 **
(6.124)
0.283 **
(3.017)
Negative Change in Concept 3−0.075 **
(−5.069)
−0.026 **
(−4.442)
−0.037 **
(−4.199)
−0.062 **
(−4.733)
−0.104 **
(−4.346)
−0.347 **
(−6.912)
Positive Change in Concept 50.051 **
(3.459)
0.025 **
(3.503)
0.045 **
(4.994)
0.059 **
(4.544)
0.073 **
(3.327)
0.125 *
(2.032)
Negative Change in Concept 5−0.056 **
(−3.819)
−0.015 *
(−2.438)
−0.025 **
(−2.765)
−0.039 **
(−3.037)
−0.069 **
(−3.223)
−0.329 **
(−5.989)
Positive Change in Concept 60.043 **
(2.922)
0.008
(1.163)
0.013
(1.407)
0.024
(1.877)
0.059 **
(2.734)
0.174 **
(3.824)
Negative Change in Concept 6−0.07 **
(−4.757)
−0.020 **
(−2.802)
−0.058 **
(−6.423)
−0.070 **
(−5.451)
−0.129 **
(−5.735)
−0.267 **
(−5.478)
R 2 0.283
Note: * p < 0.05, ** p < 0.01.
Disclaimer/Publisher’s Note: The statements, opinions and data contained in all publications are solely those of the individual author(s) and contributor(s) and not of MDPI and/or the editor(s). MDPI and/or the editor(s) disclaim responsibility for any injury to people or property resulting from any ideas, methods, instructions or products referred to in the content.

