Article

An Evolutionary Game Analysis of AI Health Assistant Adoption in Smart Elderly Care

School of Management, Harbin Institute of Technology, Harbin 150001, China
*
Authors to whom correspondence should be addressed.
Systems 2025, 13(7), 610; https://doi.org/10.3390/systems13070610 (registering DOI)
Submission received: 31 May 2025 / Revised: 27 June 2025 / Accepted: 14 July 2025 / Published: 19 July 2025
(This article belongs to the Section Systems Practice in Social Science)

Abstract

AI-powered health assistants offer promising opportunities to enhance health management among older adults. However, real-world uptake remains limited, not only due to individual hesitation, but also because of complex interactions among users, platforms, and public policies. This study investigates the dynamic behavioral mechanisms behind adoption in aging populations using a tripartite evolutionary game model. Based on replicator dynamics, the model simulates the strategic behaviors of older adults, platforms, and government. It identifies evolutionarily stable strategies, examines convergence patterns, and evaluates parameter sensitivity through a Jacobian matrix analysis. Results show that when adoption costs are high, platform trust is low, and government support is limited, the system tends to converge to a low-adoption equilibrium with poor service quality. In contrast, sufficient policy incentives, platform investment, and user trust can shift the system toward a high-adoption state. Trust coefficients and incentive intensity are especially influential in shaping system dynamics. This study proposes a novel framework for understanding the co-evolution of trust, service optimization, and institutional support. It emphasizes the importance of coordinated trust-building strategies and layered policy incentives to promote sustainable engagement with AI health technologies in aging societies.

1. Introduction

The global acceleration of population aging presents unprecedented challenges for healthcare systems. According to the World Population Prospects 2024 released by the United Nations Department of Economic and Social Affairs, the global proportion of adults aged 65 and above is projected to rise from 6.8% in 2000 to over 21% by the late 21st century [1]. China, undergoing the world’s most rapid aging process, exemplifies this demographic transformation [2]. In response, AI-powered health technologies have emerged as promising tools to support healthy aging, offering functionalities such as real-time health monitoring, medication reminders, and emotional companionship [3]. Early pilot projects show encouraging results—for example, in Thailand, 81.8% of elderly users reported satisfaction with AI health assistants and improved mental health outcomes [4]. However, widespread adoption remains limited, revealing deeper systemic issues beyond individual-level barriers [5].
Despite these promising signs, the adoption rate of AI health assistants remains low in practice. This gap cannot be explained by user-level factors alone. Existing studies have primarily relied on static, user-centric frameworks such as the Technology Acceptance Model (TAM) or the Unified Theory of Acceptance and Use of Technology (UTAUT), focusing on digital literacy, perceived usefulness, and privacy concerns [6,7]. However, such frameworks fail to capture the dynamic behavioral interactions among three critical actors: elderly users, platform providers, and government policymakers. Qualitative evidence reveals fundamental misalignments: while older adults emphasize emotional comfort and ease of use, developers focus on performance metrics and governments on fiscal sustainability [8,9,10]. As highlighted by the grounded theory research and cross-sectoral interviews, these conflicting priorities influenced older adults’ adoption of an AI health assistant.
This persistent misalignment underscores the need for a system-level explanation. To fill this gap, we developed a tripartite evolutionary game framework that captures how trust, platform investment, and public incentives co-evolve over time. Specifically, we modeled how user adoption behavior responds to changing platform service quality and policy support, and vice versa. The model identifies conditions under which a virtuous cycle of high trust, platform optimization, and sustained policy incentives can emerge, as well as conditions that trap systems in low-adoption equilibria.
The marginal contribution of this study lies in its integration of multi-agent behavioral feedback into the AI health assistant adoption literature. By employing replicator dynamics in a three-player evolutionary game model, this study provides a dynamic analytical lens to explain both the success and failure of digital health initiatives targeting older populations. The findings enrich theoretical understanding and offer practical insights for more adaptive, participatory, and trust-driven AI health systems.

2. Literature Review and Theoretical Background

2.1. Adoption of AI Health Assistants Among Older Adults

AI health assistants are typically interactive systems based on speech recognition and natural language processing. They support older adults through real-time monitoring, emotional interaction, and independent living assistance. Their adoption is shaped by both facilitating attributes (e.g., usability, emotional responsiveness, autonomy support) and barriers such as interface complexity, privacy concerns, and sensory limitations [11,12,13,14,15]. Individual characteristics (e.g., age, education, prior technology use) further moderate the willingness to adopt [16].
Dominant frameworks such as the Technology Acceptance Model and the Unified Theory of Acceptance and Use of Technology emphasize perceived usefulness and social influence [17,18]. These have been extended in recent studies to incorporate risk perception, trust, and health status. However, most existing research focuses on static, individual-level determinants and overlooks dynamic interactions among older users, platforms, and policy actors.
While individual-level attributes remain important, recent literature emphasizes the role of social environment and peer influence in shaping older adults’ digital behavior. The concept of network externalities suggests that technology adoption is not only an individual decision but is also influenced by the perceived adoption levels among peers and community members. This mechanism is particularly salient among older adults who rely on social cues and observational learning when evaluating unfamiliar technologies [19]. These insights point to the need for frameworks that account for interdependent decisions and trust dynamics across users and platforms.

2.2. Platform Responsibility and Service Optimization Strategies

Platforms assume two primary roles in the delivery of AI health services: they act as technical providers and simultaneously as builders of user trust. Key service characteristics such as feedback timeliness, semantic accuracy, and emotional responsiveness are essential in shaping user satisfaction and encouraging continued engagement. This is especially relevant for older adults, who are more likely to evaluate technological tools based on their perceived care and responsiveness to user needs [20,21,22,23]. However, maintaining high service quality requires a continuous investment in infrastructure, algorithm development, and personnel training. In the face of uncertain or delayed returns, platforms may adopt cost-reduction strategies that result in a decline in service quality and increased user attrition. This phenomenon often leads to a negative cycle of underinvestment and poor retention outcomes [24,25]. The situation becomes more complex in competitive markets where platforms must balance service improvement with operational cost management [26]. Although studies have shown that the intensity of competition influences platform innovation and differentiation, most existing models have not formally addressed how varying degrees of market competition shape strategic decisions [27].
In addition, recent research has highlighted the significance of platform reputation in influencing user trust and behavioral continuity. Reputation, viewed as a form of accumulated social capital, plays a crucial role in reducing perceived risk and enhancing users’ willingness to adopt services. This is particularly important for older adults who may have limited confidence in digital technologies. Nevertheless, despite its practical importance, reputation is rarely incorporated as a dynamic factor in models of platform decision-making. This gap restricts our understanding of how reputation interacts with service quality and feedback mechanisms to shape long-term behavioral strategies.
Taken together, the literature demonstrates that platform behavior in digital health services is shaped by multiple factors. Yet, current research still lacks a dynamic, integrative framework that can account for the joint effects of incentive design, market competition, and trust formation.

2.3. Government Incentive Mechanisms for Digital Health Promotion

Governments serve as both institutional architects and coordinators in digital health adoption. Structural barriers such as digital illiteracy, limited trust in AI systems, and insufficient infrastructure often hinder older adults’ engagement, especially in underserved or aging communities—challenges that market mechanisms alone cannot resolve [28,29]. In response, various governments have adopted multi-pronged incentive strategies such as fiscal subsidies, community-based pilot programs, and platform reputation rewards to stimulate AI health adoption [30]. For example, smart elderly care programs in Foshan and Shanghai integrate neighborhood terminals, personalized data feedback, and policy support to reduce user burdens and enhance adoption likelihood [31,32].
However, empirical research suggests that these incentive mechanisms often suffer from two core limitations. First, the absence of embedded feedback structures weakens the system’s capacity for adaptive adjustment, leading to inefficiencies or unintended outcomes. Second, policy instruments subsidies may function as ambiguous signals that influence actors not only through direct financial impact but also via their perceived credibility and commitment [33,34].
Drawing on signaling theory, policy interventions can be viewed as informative cues that shape stakeholder expectations and strategic responses [35]. For instance, a government subsidy may not only reduce a platform’s short-term cost burden but also act as a symbolic endorsement of the AI system’s legitimacy and safety, thus indirectly boosting public confidence. This conceptual lens explains how public policy can produce behavioral spillover effects that exceed its immediate material scope. Despite this insight, few studies have formally captured these signaling effects within dynamic behavioral models. As a result, existing research underrepresents the indirect yet critical role of government incentives in shaping the co-evolution of user adoption and platform response over time.

2.4. Evolutionary Game Theory and Digital Health Behavior

The replicator dynamics framework, widely used in EGT, explains how advantageous strategies proliferate through imitation and adaptation [36,37,38]. This makes it suitable for modeling long-term behavior in elderly technology adoption, platform optimization, and government policy response. EGT enables the identification of evolutionarily stable strategies (ESS) and helps simulate equilibrium paths under different interventions.
Recent studies have applied EGT to wearable device adoption, chronic disease prevention programs, and digital health service platforms [39,40]. These applications confirm its value in modeling multi-agent systems with dynamic feedback loops. This study adopts EGT to analyze AI health assistant adoption, aiming to uncover the co-evolutionary mechanisms of trust, investment, and public incentives.

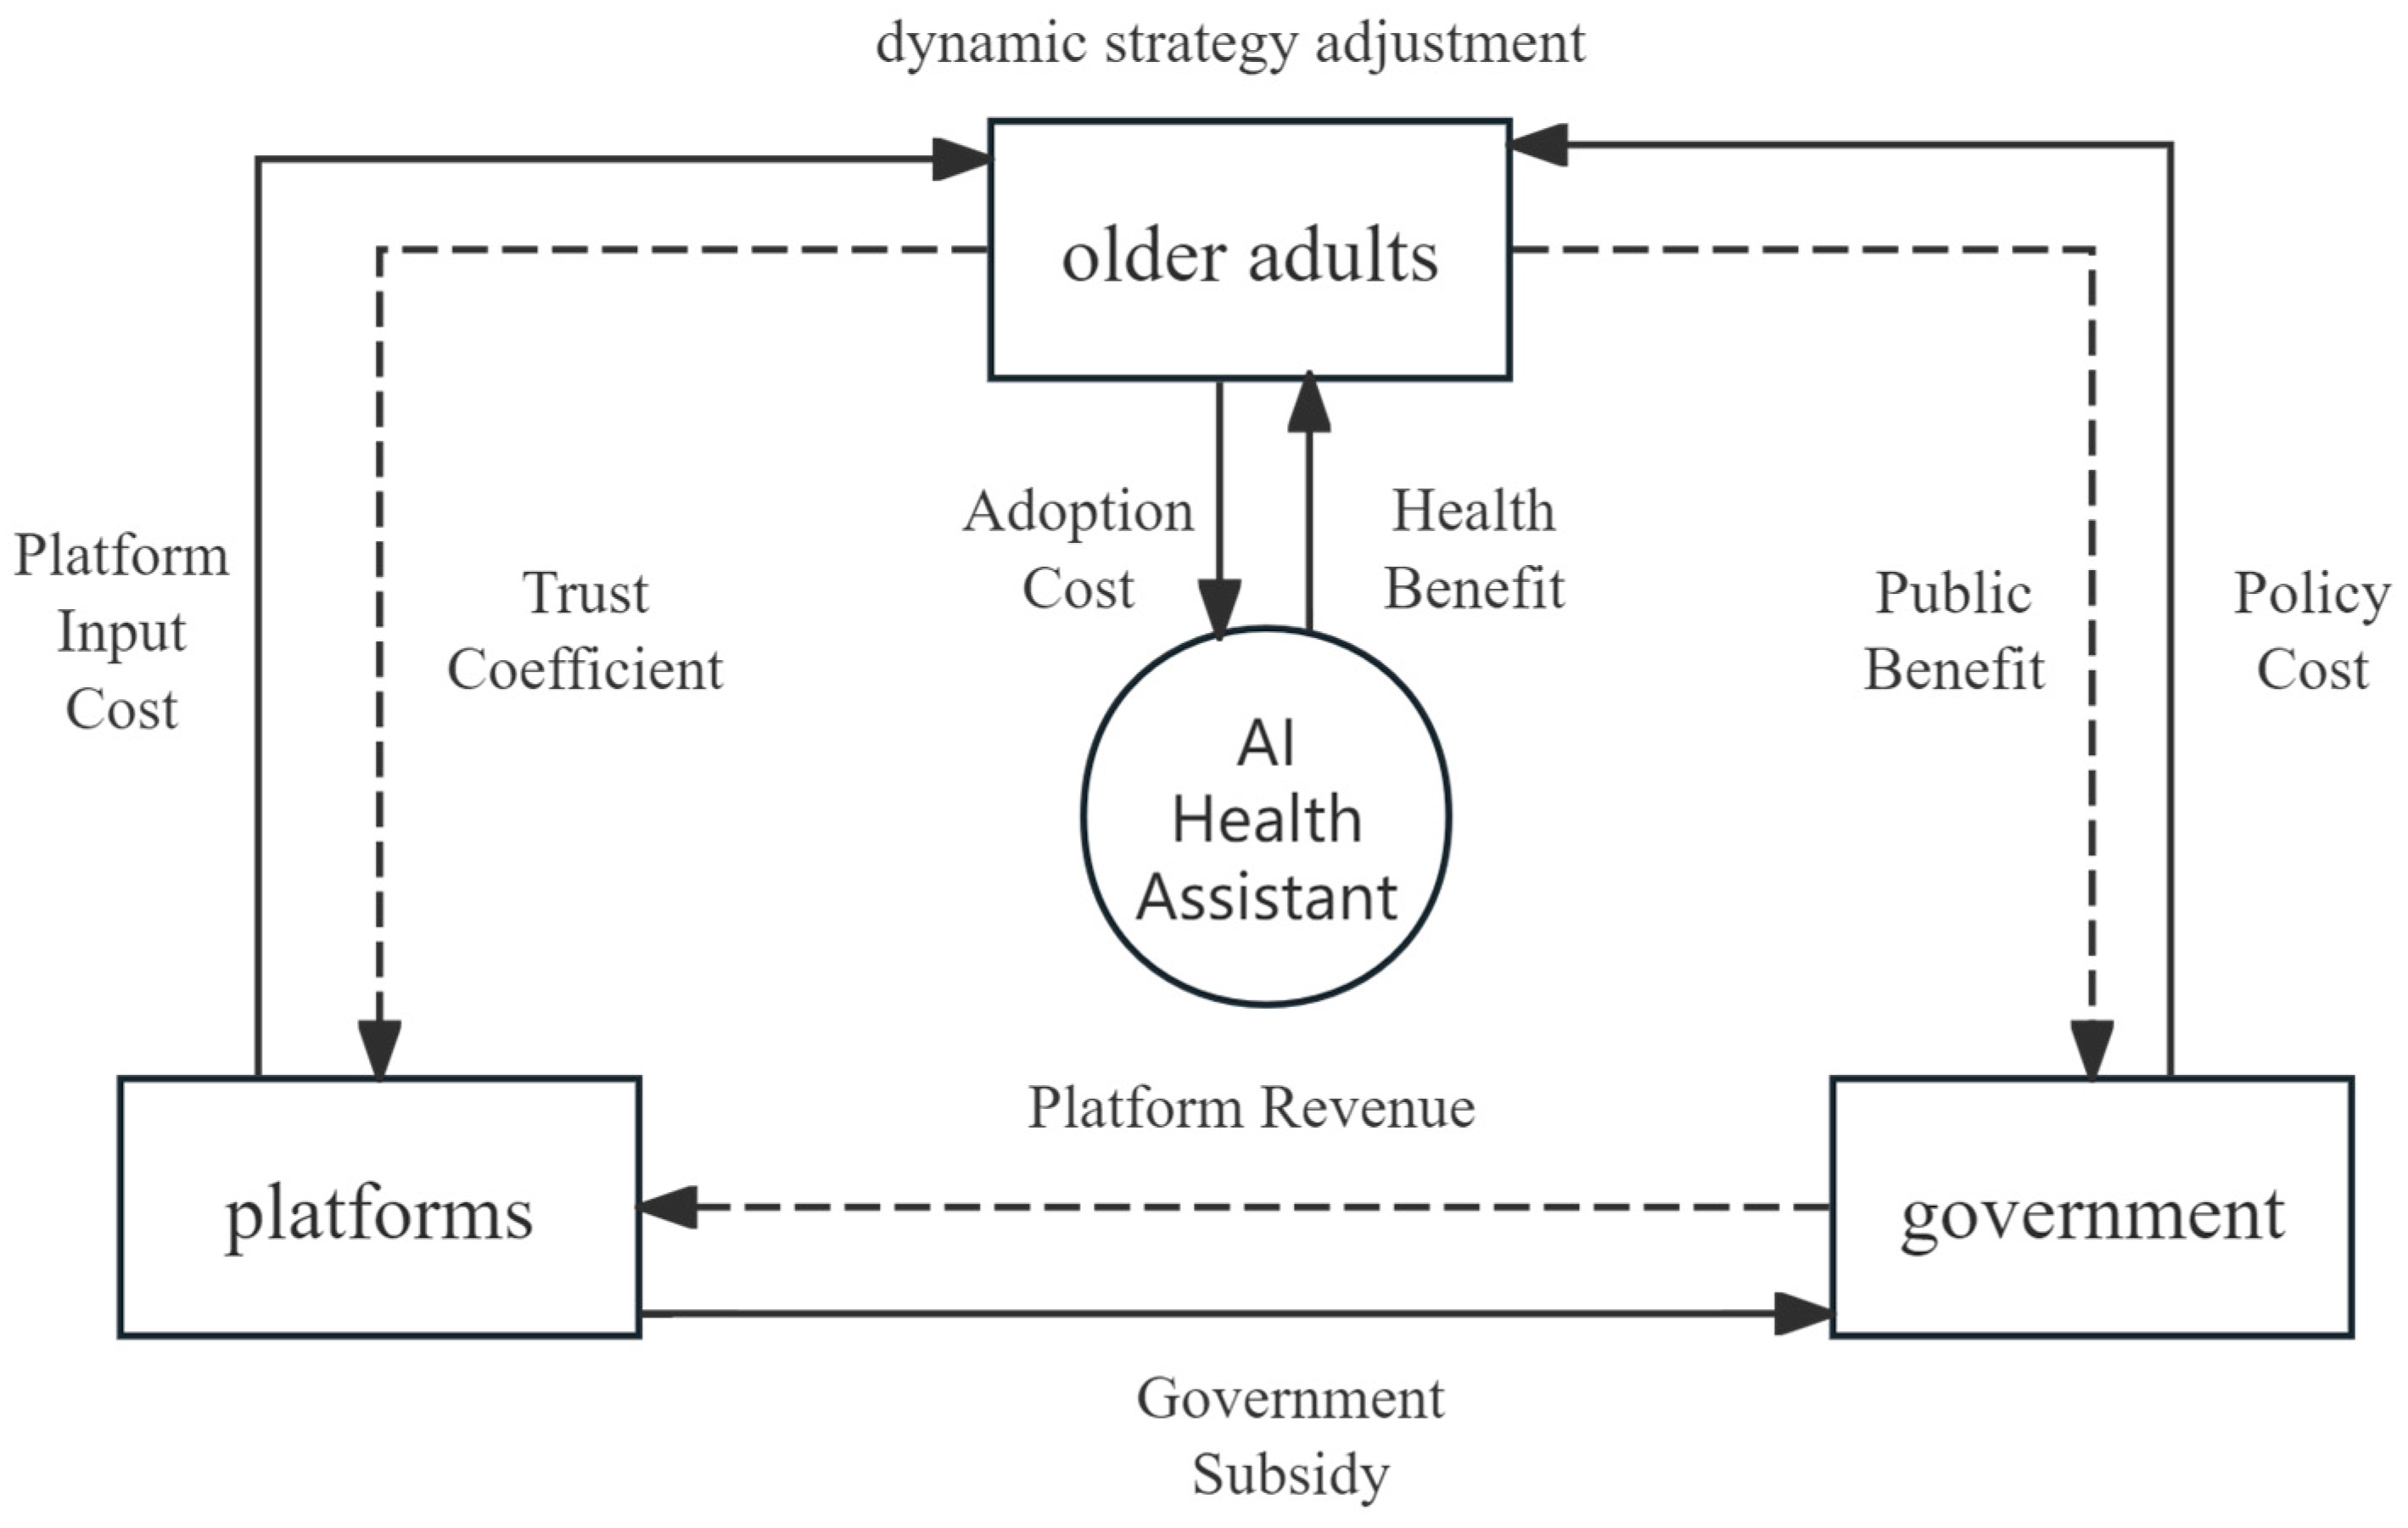
3. Model Construction

With the acceleration of global population aging and the rapid development of digital health technologies, AI health assistants have demonstrated significant potential in the domain of smart elderly care. However, their adoption among older adults remains constrained by multiple factors, including insufficient trust, fluctuating platform service quality, and inadequate policy incentives. To uncover the behavioral interactions and dynamic co-evolution mechanisms among older adults, platforms, and governments during the adoption process of AI health assistants, this study constructs a tripartite evolutionary game model based on Evolutionary Game Theory (EGT). The model aims to analyze the coupling mechanism between trust formation, platform investment willingness, and the strength of government incentives. The conceptual diagram of the three-party game is shown in Figure 1.
Figure 1 illustrates the interaction dynamics among older adults, platforms, and government actors in the AI health assistant ecosystem. Arrows represent the flow of benefits and costs, including trust coefficients, platform input costs, adoption costs, and public benefits. The feedback loops demonstrate how strategic behaviors influence the evolution of adoption outcomes.

3.1. Definition of Participants and Strategies

This model involves three main participants: older adults (Elderly, EE), platforms (Platform, PP), and government (Government, GG), representing the end-users, technology providers, and policy makers of AI health assistants, respectively. Each participant has two strategic choices that reflect their core decision-making behaviors in the adoption and promotion of AI health assistants.
Specifically, the strategy set of older adults (EE) as end-users includes Adopt (A) and Not Adopt (NA). Adoption implies that older adults are willing to use AI health assistants for health management, such as monitoring health indicators through smart devices or receiving personalized health advice, thus gaining potential health benefits. However, adoption behavior is accompanied by learning costs (e.g., the time and effort required to adapt to the new technology), privacy concern costs (e.g., the risk of data breaches), and psychological barriers (e.g., a lack of trust in the technology). Conversely, a non-adoption strategy means that older adults maintain their traditional health management practices, avoiding the aforementioned costs but also failing to enjoy the health improvements brought about by AI technologies. Older adults’ strategy choices are influenced by the quality of the platform’s services and their own level of trust; the higher the level of trust, the stronger the willingness to adopt.
The set of strategies for platforms (PP) as providers of AI health assistants includes High-Quality Continuous Optimization (HQ) and Low-Cost Perfunctory Operation (LC). The High-Quality Optimization strategy requires platforms to invest significant resources in technology R&D, algorithm improvement, user experience optimization, and data security, thereby improving service quality and user trust, and thus promoting adoption by older adults. However, this strategy requires high operational costs, including technology development, system maintenance, and user support costs. A low-cost operation strategy, on the other hand, implies that the platform maintains service operation with minimal resource investment, which may lead to service quality degradation, poor user experience, and trust loss, but can significantly reduce cost expenditures. Platforms’ strategy choices are not only driven by their own revenues, but are also influenced by feedback from government incentives and older adults’ adoption behaviors.
The government (GG), as the policy maker of smart aging ecosystems, has a strategy set that includes Subsidization Incentive (Subsidize, S) and No Intervention (No Intervention, NI). The subsidy incentive strategy reduces the operating costs of platforms through financial subsidies, tax incentives, or pilot roll-outs, encourages high-quality services, and indirectly increases the willingness of older adults to adopt. However, the implementation of incentives requires the government to bear the cost of financial expenditure, and the effect depends on the platform and the degree of response of older people. A non-intervention strategy means that the government does not provide any direct support, which avoids the financial burden but may result in a lack of incentive for platforms to optimize and an insufficient adoption by older adults. The government’s strategy choice aims to balance public health benefits (e.g., savings in healthcare resources, a reduced burden on an aging society) with policy costs.
Based on the above definition, the set of tripartite strategies can be formalized as follows: older adults S E E = { A , N A } , platforms S P P = { H Q , L C } , and governments S G G = { S , N I } . Given that each of the three agents—older adults, platforms, and government—has two strategic options, the model yields a total of eight possible strategy combinations. The eight different strategy combinations correspond to different game scenarios, and the payoffs of the three parties in each scenario are jointly determined by their strategy choices and the behavior of other participants.

3.2. Modeling Assumptions

To facilitate analytical tractability and focus on the core mechanisms driving the adoption dynamics of AI health assistants, this study introduces the following assumptions regarding agent behavior, interaction structure, and model parameters:
  • Bounded Rationality: All three actors—older adults (users), platforms (service providers), and the government (policy makers)—are assumed to exhibit bounded rationality. Instead of seeking globally optimal strategies, they adjust their behaviors based on observed payoff differences over time. This aligns with the foundational principle of evolutionary game theory and reflects real-world decision-making constraints such as incomplete information and cognitive limitations.
  • Replicator Dynamics and Continuous Time: Strategy evolution follows continuous-time replicator dynamics. Agents are more likely to adopt strategies with above-average payoffs. This mechanism applies to platforms optimizing services based on feedback, older adults following peer behavior, and governments adjusting subsidies based on system performance.
  • Sequential Decision Structure: The model assumes a three-stage sequential decision structure reflecting real-world decision-making: (1) The government first determines whether to implement subsidies. (2) The platform observes policy and decides its service investment level. (3) The user decides whether to adopt, based on perceived service quality and trust.
  • Trust and Reputation Mechanism: Platform service quality influences user trust through a reputation mechanism represented by coefficient δ 0 , 1 . High-quality service leads to increased trust ( δ →1), while poor service reduces trust ( δ →0).
  • Market Competition: Multiple platforms compete in the market. Competition intensity is captured by λ 0 , 1 , with larger λ indicating fiercer competition.
  • Network Externalities: Older adult adoption exhibits network effects. The adoption rate x influences perceived value through externality coefficient α 0 , 1 .
  • Policy Spillover Effects: Government subsidies not only reduce platform costs directly, but also enhance user confidence indirectly via signaling. This is captured by spillover coefficient β 0 , 1 .
  • Parameter Stability and Population Homogeneity: Key parameters such as service cost, user benefit, and incentive coefficients are held constant in the baseline model for clarity. All actor groups are assumed to be homogeneous within, meaning individuals in the same group respond similarly to payoffs.

3.3. Evolutionary Game Payoff Matrix Constructing

To quantify the payoffs of the three parties under different strategy combinations, this study constructs a detailed benefit function that reflects the trade-offs between costs and benefits for each party. The design of the benefit function integrates the health benefits and adoption costs of older adults, the operational revenue and input costs of the platform, and the public benefits and policy costs of the government. Additionally, the trust coefficient is introduced as a key moderating variable to capture the impact of service quality on user behavior.
To further clarify the behavioral logic of this tripartite interaction, the decision-making process is conceptualized as a three-stage sequential structure:
  • Stage 1: Government Decision-Making Stage. The government acts first, evaluating whether to implement subsidy incentives based on the anticipated public health returns and fiscal constraints S G = { S , N I } .
  • Stage 2: Platform Response Stage. Platforms make strategic decisions in response to observed government policies, considering factors such as incentive strength, market competition, and expected user demand. This determines their level of investment in service quality S P = { H Q , L C } .
  • Stage 3: User Adaptation Stage. Older adults respond lastly by observing actual platform service performance and policy support. Their adoption decisions are shaped primarily by trust levels, which are influenced by the preceding stages S E = { A , N A } .
This sequential logic reflects real-world behavioral dependencies and supports the evolutionary modeling assumptions used in subsequent derivations. In the following sections, we first define the core variables in the benefit functions, and then derive the payoffs associated with each of the eight possible strategy combinations.

3.3.1. Definition of Core Variables

  • Health Benefit ( b ): The health management benefits gained by older adults from using AI health assistants, such as early disease detection and personalized health recommendations. The values are normalized within the range b 0 , 1 , reflecting the potential value of the technology.
  • Adoption Cost ( c ): The cost incurred by older adults when adopting AI health assistants, including learning costs, privacy risk, and psychological barriers. The values are normalized in the range c 0 , 0.5 , estimated based on the technology adoption literature.
  • Trust Coefficient ( δ ): Represents the level of trust older adults place in the service quality of the platform, with δ 0 , 1 . When the platform adopts a high-quality optimization (HQ) strategy, δ approaches 1; when it opts for low-cost operation (LC), δ tends toward 0.
  • Platform Input Cost ( c p ): The resource cost borne by the platform under a high-quality optimization strategy, including R&D and system maintenance. The values are normalized within the range c p 0.2 , 0.8 , reflecting the realistic cost spectrum of technology development.
  • Government Subsidy ( g ): The financial support provided by the government to incentivize service optimization by the platform, such as direct subsidies or tax relief. This is normalized to the range   g 0 , 0.5 , with references to digital health policy literature.
  • Public Benefit ( θ ): The public health benefits obtained by the government as a result of older adults adopting AI health assistants, such as reduced medical resource consumption and enhanced social welfare. Values are normalized within the range θ 0 , 1 .
  • Policy Cost ( c g ): The fiscal cost incurred by the government when implementing subsidy incentives. This is normalized to the range c g 0 , 0.5 .
  • Platform Revenue ( R ): The benefits earned by the platform from older adult adoption, such as subscription fees, data value, or other commercial returns. This is normalized within R 0 , 1 ;   R is assumed to be a constant for model simplification.
In addition, to capture the core mechanisms of platform reputation, market competition, network interaction, and policy signaling, the model incorporates four extended parameters:
  • Reputation Influence Coefficient ( ρ ): ρ 0 , 1 , portraying the strength of reputation’s influence on users’ adoption decisions.
  • Market Competition Intensity ( λ ): λ 0 , 1 , reflecting the impact of market competition on platforms’ strategy choices.
  • Network Externality Coefficient ( α ): α 0 , 1 , capturing the network effect of user adoption.
  • Policy Spillover Coefficient ( β ): β 0 , 1 , measuring the signaling effect of government subsidies.

3.3.2. Three-Party Game Payoff Matrix

  • Based on the defined variables above, the benefit functions under the eight possible combinations of strategies are derived as follows:
  • Strategy combination (A, HQ, S): The older adult adopts the AI assistant under high trust (i.e., high-quality service), the platform invests in service optimization and receives government subsidy, and the government bears policy costs but gains public benefit. The older adult’s utility is the trust-weighted health benefit minus the adoption cost: U E E = δ b c . The platform’s utility is the user-derived revenue minus optimization cost plus subsidy: U P P = R c p + g . The government’s utility is public benefit minus policy cost: U G G = θ c g .
  • Strategy combination (A, HQ, NI): The older adult adopts under high trust, the platform invests in high-quality optimization without subsidy, and the government incurs no cost but still gains public benefit,   U E E = δ b c . The platform’s utility decreases due to no subsidy: U P P = R c p . The government’s utility is U G G = θ , as no expenditure is involved.
  • Strategy combination (A, LC, S): The older adult adopts under low trust (i.e., low-quality service), the platform opts for low-cost operation and receives a subsidy, and the government pays the policy cost. Due to lower trust, the older adult’s utility is U E E = 1 δ b c . The platform incurs no optimization cost and gains: U P P = R + g . Government utility: U G G = θ c g .
  • Strategy combination (A, LC, NI): The older adult adopts under low trust, the platform chooses a low-cost operation without subsidy, and the government does not intervene. Older adult utility: U E E = 1 δ b c . Platform utility:   U P P = R . Government utility: U G G = θ .
  • Strategy combination (NA, HQ, S): The older adult does not adopt; the platform invests in high-quality service and receives a subsidy; the government pays the policy cost but gains no public benefit. Older adult utility: U E E = 0 . Platform utility (no user gain but incurs cost): U P P = c p + g . Government utility: U G G = c g .
  • Strategy combination (NA, HQ, NI): The older adult does not adopt, the platform optimizes without subsidy, and the government does not intervene. Older adult utility:   U E E = 0 . Platform utility: U P P = c p . Government utility: U G G = 0 .
  • Strategy combination (NA, LC, S): The older adult does not adopt, the platform operates at low cost and receives a subsidy, the government pays policy cost. Older adult utility: U E E = 0 . Platform utility: U P P = g . Government utility: U G G = c g .
  • Strategy combination (NA, LC, NI): The older adult does not adopt, the platform operates at low cost without subsidy, and the government does not intervene. All parties receive zero utility: U E E = 0 , U P P = 0 , U G G = 0 .
The utility matrix is summarized in Table 1, clearly presenting the distribution of benefits across strategy combinations and providing a basis for subsequent evolutionary dynamic analysis.

4. Dynamics and Analytical Derivations

To analyze the strategic interactions and long-term evolutionary dynamics among older adults (EE), platforms (PP), and the government (GG) in the adoption of AI health assistants, this study employs the replicator dynamics method based on Evolutionary Game Theory. Replicator dynamics describe how the proportion of strategies evolves over time within a population, capturing the behavioral adjustment process of boundedly rational agents who tend to imitate strategies with higher payoffs.
This section first derives the replicator dynamic equations for the three parties, identifying the conditions under which evolutionary directions and equilibrium points emerge. Then, it conducts an analysis of Evolutionarily Stable Strategies (ESS) to explore the system’s stability properties under different parameter settings, and to identify key factors that may lead to a vicious cycle of low adoption, minimal optimization, and insufficient incentives. To strengthen the analytical rigor, a Jacobian matrix analysis is also introduced to evaluate the local stability of equilibrium points, thereby providing theoretical support for informed policy design.

4.1. Derivation of Tripartite Evolutionary Equations

In this tripartite game model, the strategic choices of older adults, platforms, and the government are represented by the proportions of individuals in each group adopting the following strategies: adoption (A), high-quality optimization (HQ), and subsidization (S), respectively. Let
x denote the proportion of older adults choosing to adopt AI health assistants (A), and 1 x denote those choosing not to adopt (NA);
y denote the proportion of platforms choosing high-quality optimization (HQ), and 1 y denote those opting for low-cost operation (LC);
z denote the proportion of government entities choosing to provide subsidies (S), and 1 z denote those choosing non-intervention (NI).
Here, x , y , z 0 , 1 represent the internal strategic distributions within each population. According to the principle of replicator dynamics, the rate of change of each strategy proportion is proportional to the difference between the strategy’s expected payoff and the average payoff within the group. The following subsection derives the replicator dynamic equations for each actor and analyzes the existence conditions for evolutionary directions and equilibrium points.

4.1.1. Replicator Dynamics of Older Adults

The expected payoff for older adults depends on their strategy choice (Adopt, A, or Not Adopt, NA), as well as the strategy distributions of platforms and the government. Based on the payoff matrix defined in Section 3, the expected payoff U E E A for an older adult who chooses to adopt (A), as shown in Equation (1), is as follows:
U E E A = y z δ b c + y 1 z δ b c + 1 y z 1 δ b c + 1 y 1 z 1 δ b c ,
simplified to
U E E A = y δ b c + 1 y 1 δ b c .
The payoff for choosing not to adopt (NA) is assumed to be zero ( U E E N A = 0 ). The average payoff for the entire older adult is given by Equation (3):
U E E = x U E E A + 1 x U E E N A = x y δ b c + 1 y 1 δ b c .
According to the replicator dynamics, the rate of change in the proportion of adopters is given as follows, as shown in Equation (4):
x ˙ = x U E E A U E E = x 1 x y δ b c + 1 y 1 δ b c .
To further simplify the interpretation, let δ b c , 1 δ b c , and define the net payoff gap Δ b = δ b 1 δ b = 2 δ 1 b . The dynamic equation can be rewritten as illustrated in Equation (5):
x ˙ = x 1 x y Δ b + 1 δ b c .
This equation illustrates that the evolution of the adoption rate among older adults is influenced by the platform’s service quality (through   y and δ ), as well as the trade-off between health benefits and adoption costs. When the expected payoff from adopting exceeds the group average, y Δ b + 1 δ b c > 0 , the proportion x will increase over time; otherwise, x will decrease. The evolutionary phase diagram for older adults is shown in Figure 2.
Figure 2 illustrate the evolutionary dynamics under different conditions of the variable x , with the purple surfaces representing subsets of the state space. Arrows indicate the trajectory direction within each plane: when x = x * , the system exhibits transitional stability; when x < x * , trajectories converge downward, suggesting decay into a low-cooperation state; and when x > x * , trajectories flow upward toward V A 2 , indicating a shift toward stable cooperation. These diagrams highlight the bifurcation effect around the critical threshold x * .

4.1.2. Replicator Dynamics of Platforms

The expected payoff U P P H Q   for platforms choosing high-quality optimization is calculated as follows:
U P P H Q = x z R c p + g + x 1 z R c p + 1 x z c p + g + 1 x 1 z c p ,
and the expression can be simplified to
U P P H Q = x R c p + z g c p .
The expected payoff for platforms choosing low-cost operation U P P L C is given by
U P P L C = x z R + g + x 1 z R + 1 x z g + 1 x 1 z 0 = x R + z g ,
and the average payoff of the platform is
U P P = y U P P H Q + 1 y U P P L C = y x R c p + z g c p + 1 y x R + z g .
According to the replicator dynamics, the equation is given by Equation (10):
y ˙ = y U P P H Q U P P = y 1 y x R c p + z g c p x R + z g = y 1 y x R c p R c p = y 1 y x c p c p ,
which can be further simplified as
y ˙ = y 1 y c p x + 1 .
As shown in Equations (10) and (11), the platform’s willingness (y) to optimize is affected by both the adoption level among older adults (x) and the cost ( c p ) of delivering high-quality services. Since HQ always incurs additional costs, platforms will only sustain such strategies if the benefits from higher user engagement or governmental incentives are sufficient to offset the investment burden. The evolutionary phase diagram for platforms is shown in Figure 3.
Figure 3 illustrate the evolutionary dynamics under different values of the platform optimization rate y . The purple surfaces represent the constrained state spaces where the other variables are held constant. When y = y * , the system rests on a critical surface with a neutral evolutionary tendency. For y < y * , trajectories flow upward from V A 1   toward V A 2 , indicating a cooperative acceleration driven by external incentives. Conversely, when y > y * , the trajectory direction shifts downward, suggesting an over-optimization trap that may undermine long-term cooperation. These plots reveal the non-monotonic effect of platform effort intensity on system stability.

4.1.3. Replicator Dynamics of Government

The expected payoff U G G S for the government when choosing to provide subsidies (S) is given by
U G G S = x y θ c g + x 1 y θ c g + 1 x y c g + 1 x 1 y c g ,
and simplifying this, we obtain
U G G S = x θ c g .
The expected payoff U G G N I for the government when choosing no intervention (NI) is as follows:
U G G N I = x y θ + x 1 y θ + 1 x y 0 + 1 x 1 y 0 = x θ ,
and the average payoff of the government population is
U G G = z U G G S + 1 z U G G N I = z x θ c g + 1 z x θ = x θ z c g .
According to the replicator dynamics, the equation is given by Equation (16):
z ˙ = z U G G S U G G = z 1 z x θ c g x θ z c g = z 1 z c g 1 z ,
which can be further simplified as
z ˙ = z 1 z c g .
As shown in Equations (16) and (17), the government’s willingness to provide subsidies (z) is negatively influenced by the cost of the incentive policy ( c g ) . Governments tend to reduce subsidies unless either the public benefit ( θ ) or the adoption rate among older adults ( x ) significantly increases. The evolutionary phase diagram for government is shown in Figure 4.
Figure 4 illustrate the evolutionary trajectories under different values of the government subsidy rate z . When z = z * , the system lies on a critical surface where V A 1   and V A 2 coexist in a transitional equilibrium. In the case of z < z * , trajectories flow downward, suggesting that insufficient policy support leads the system to retreat toward the low-cooperation state V A 1 . When z > z * , the dynamics shift upward toward V A 2 , indicating that enhanced government incentives can effectively stabilize cooperation. This demonstrates the threshold effect of public policy in guiding collective behavioral convergence.

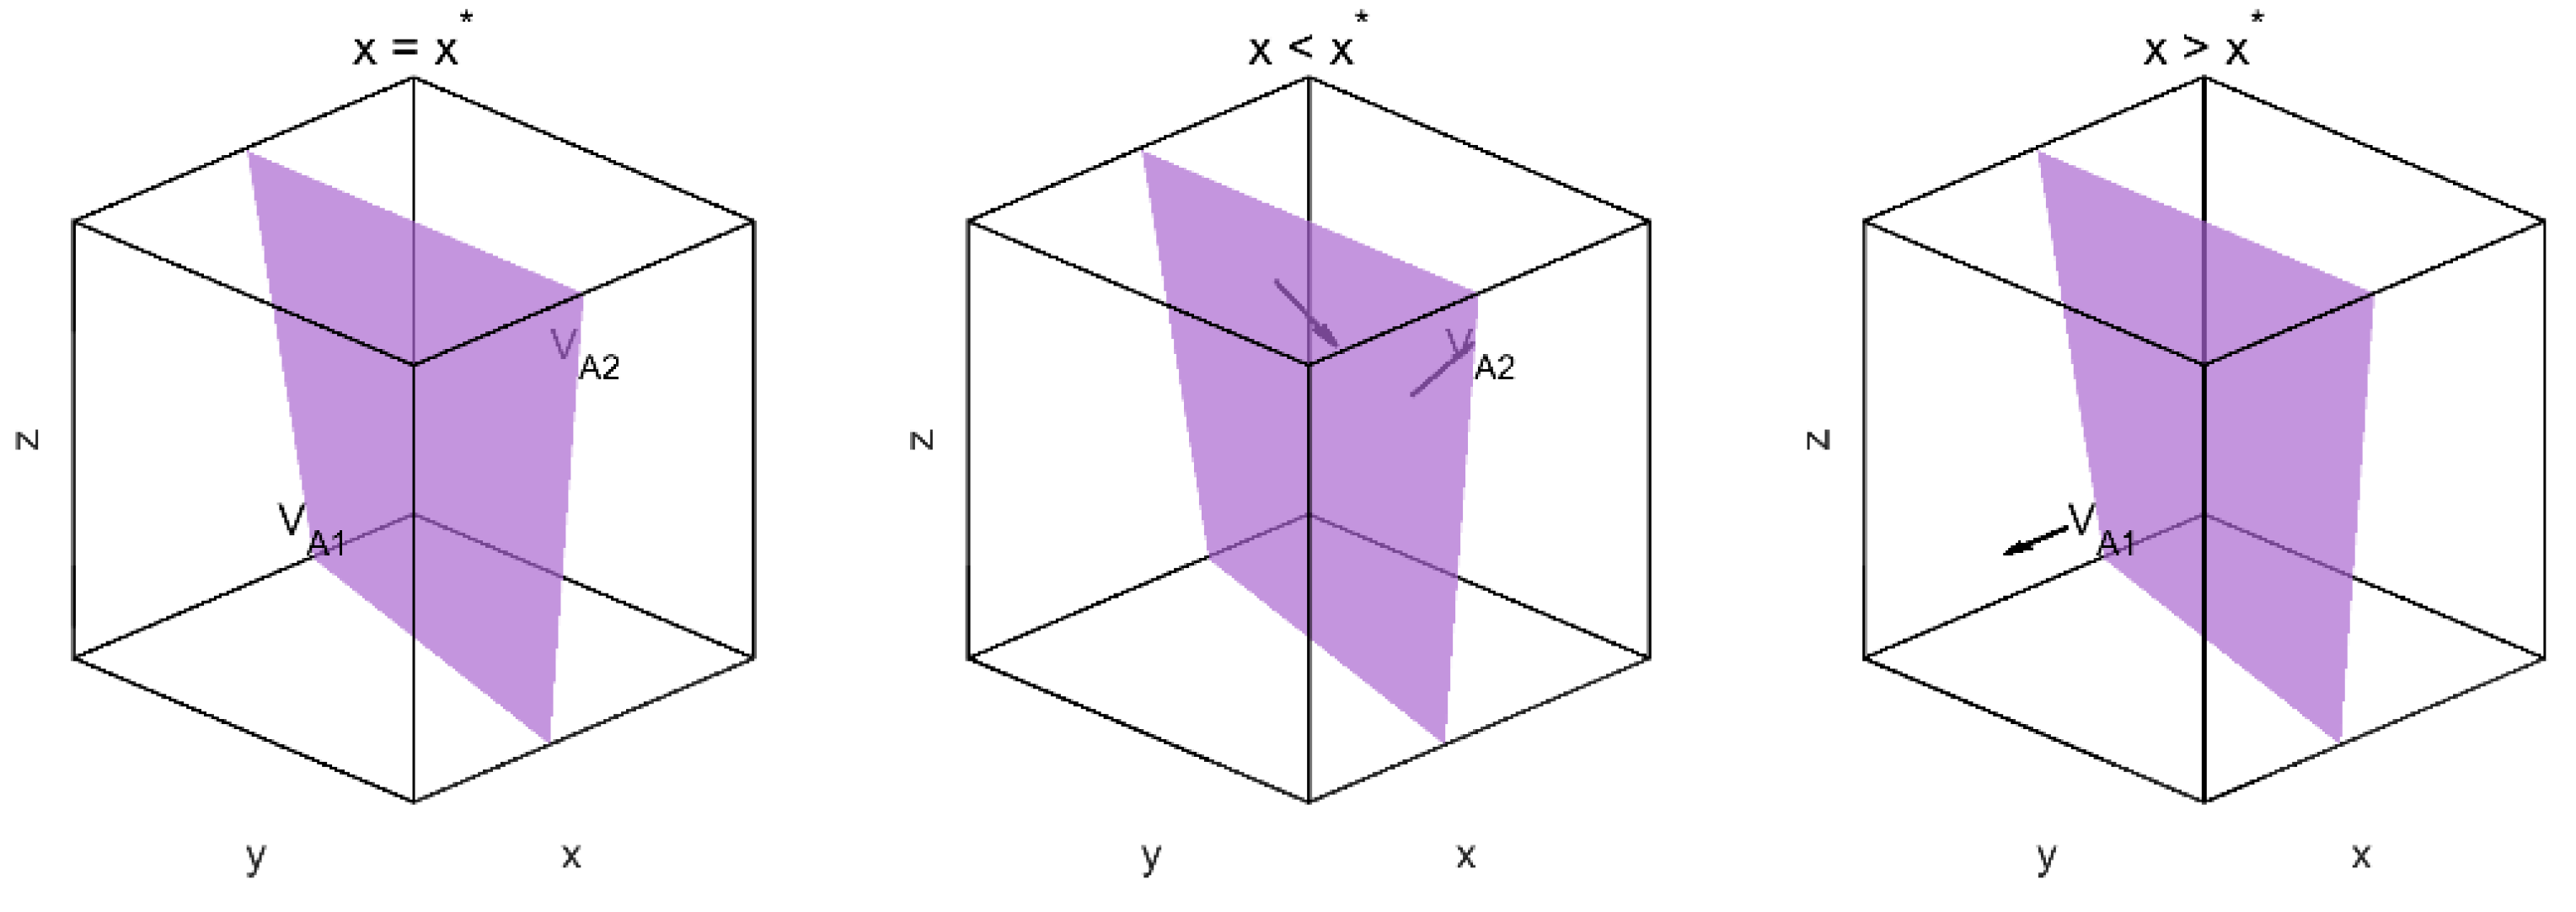
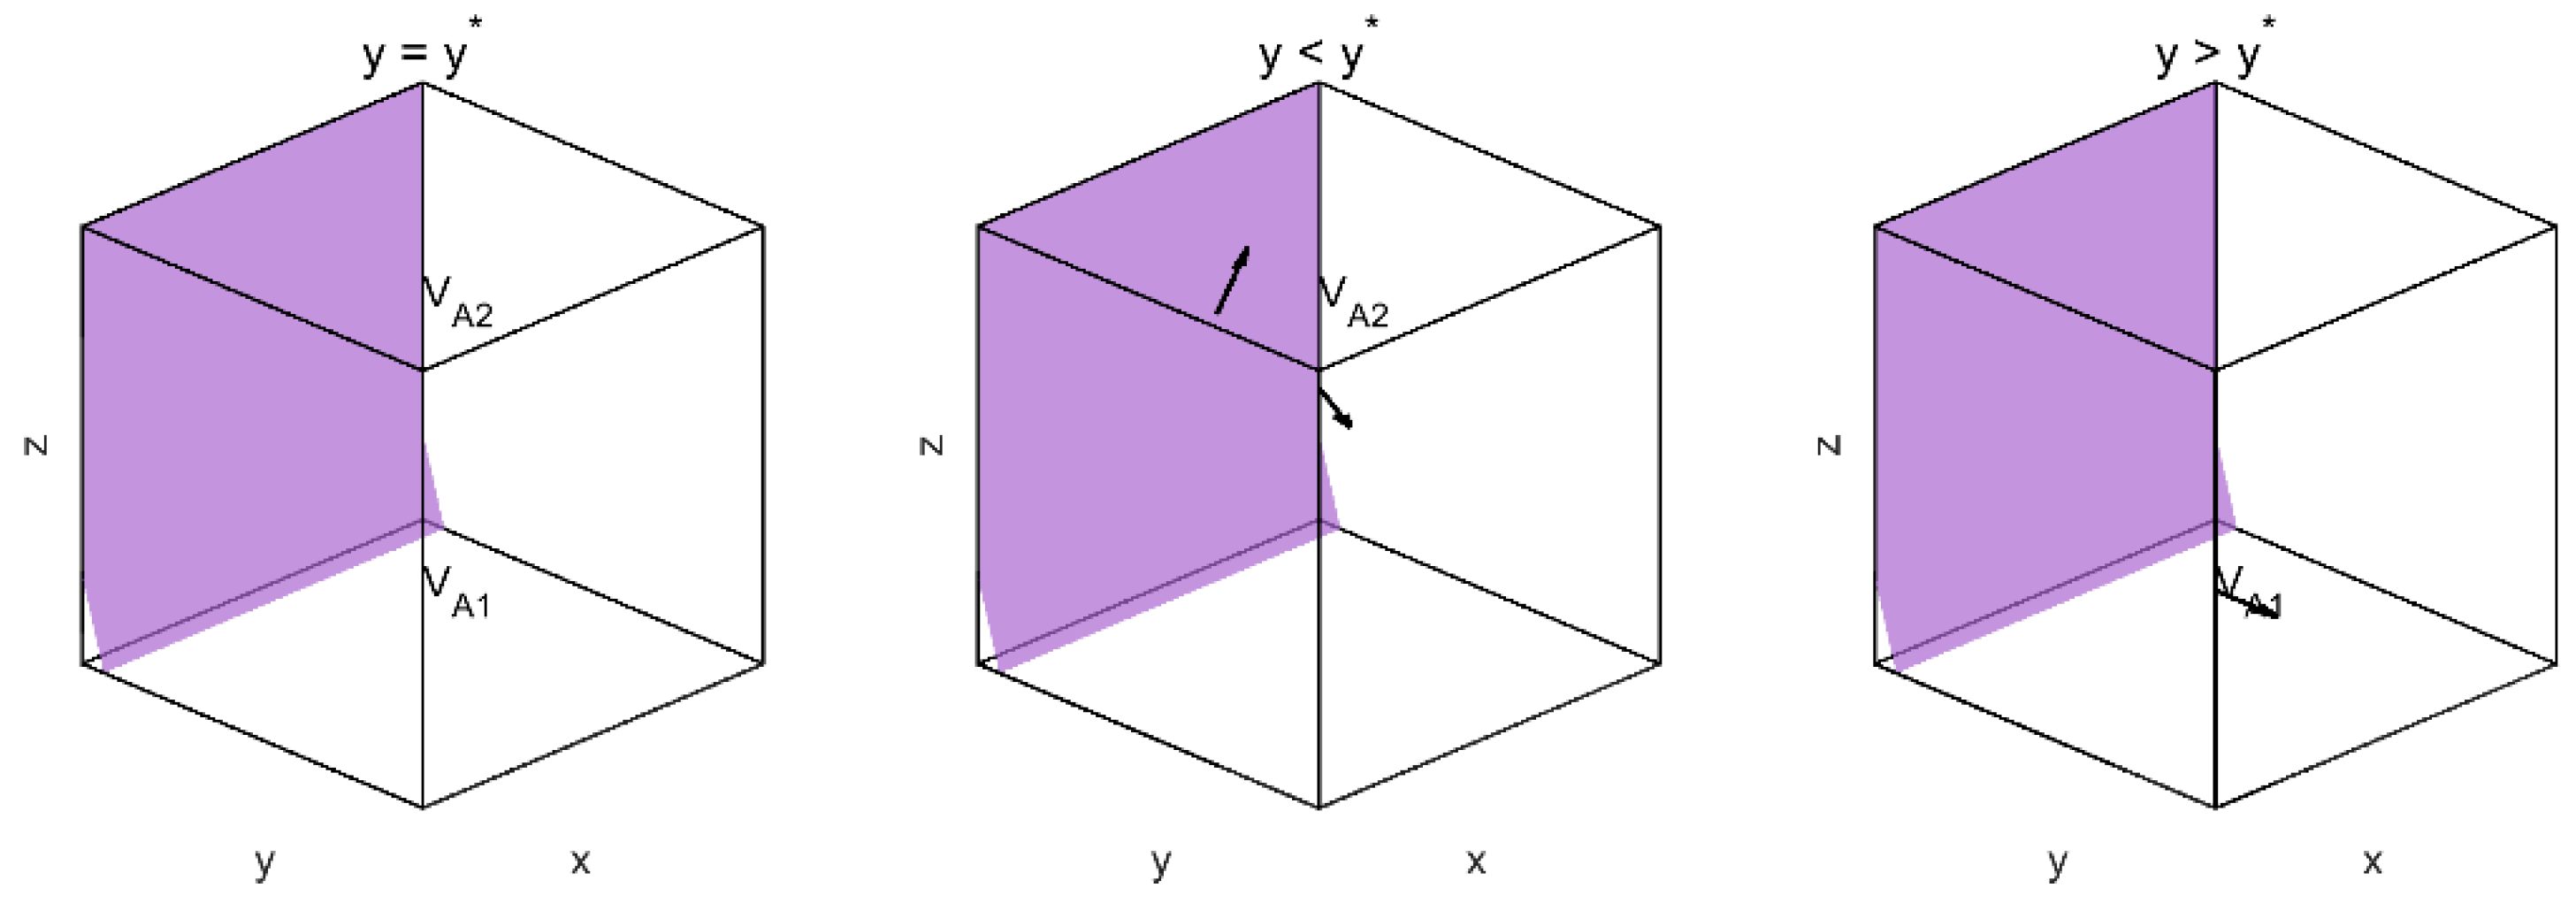
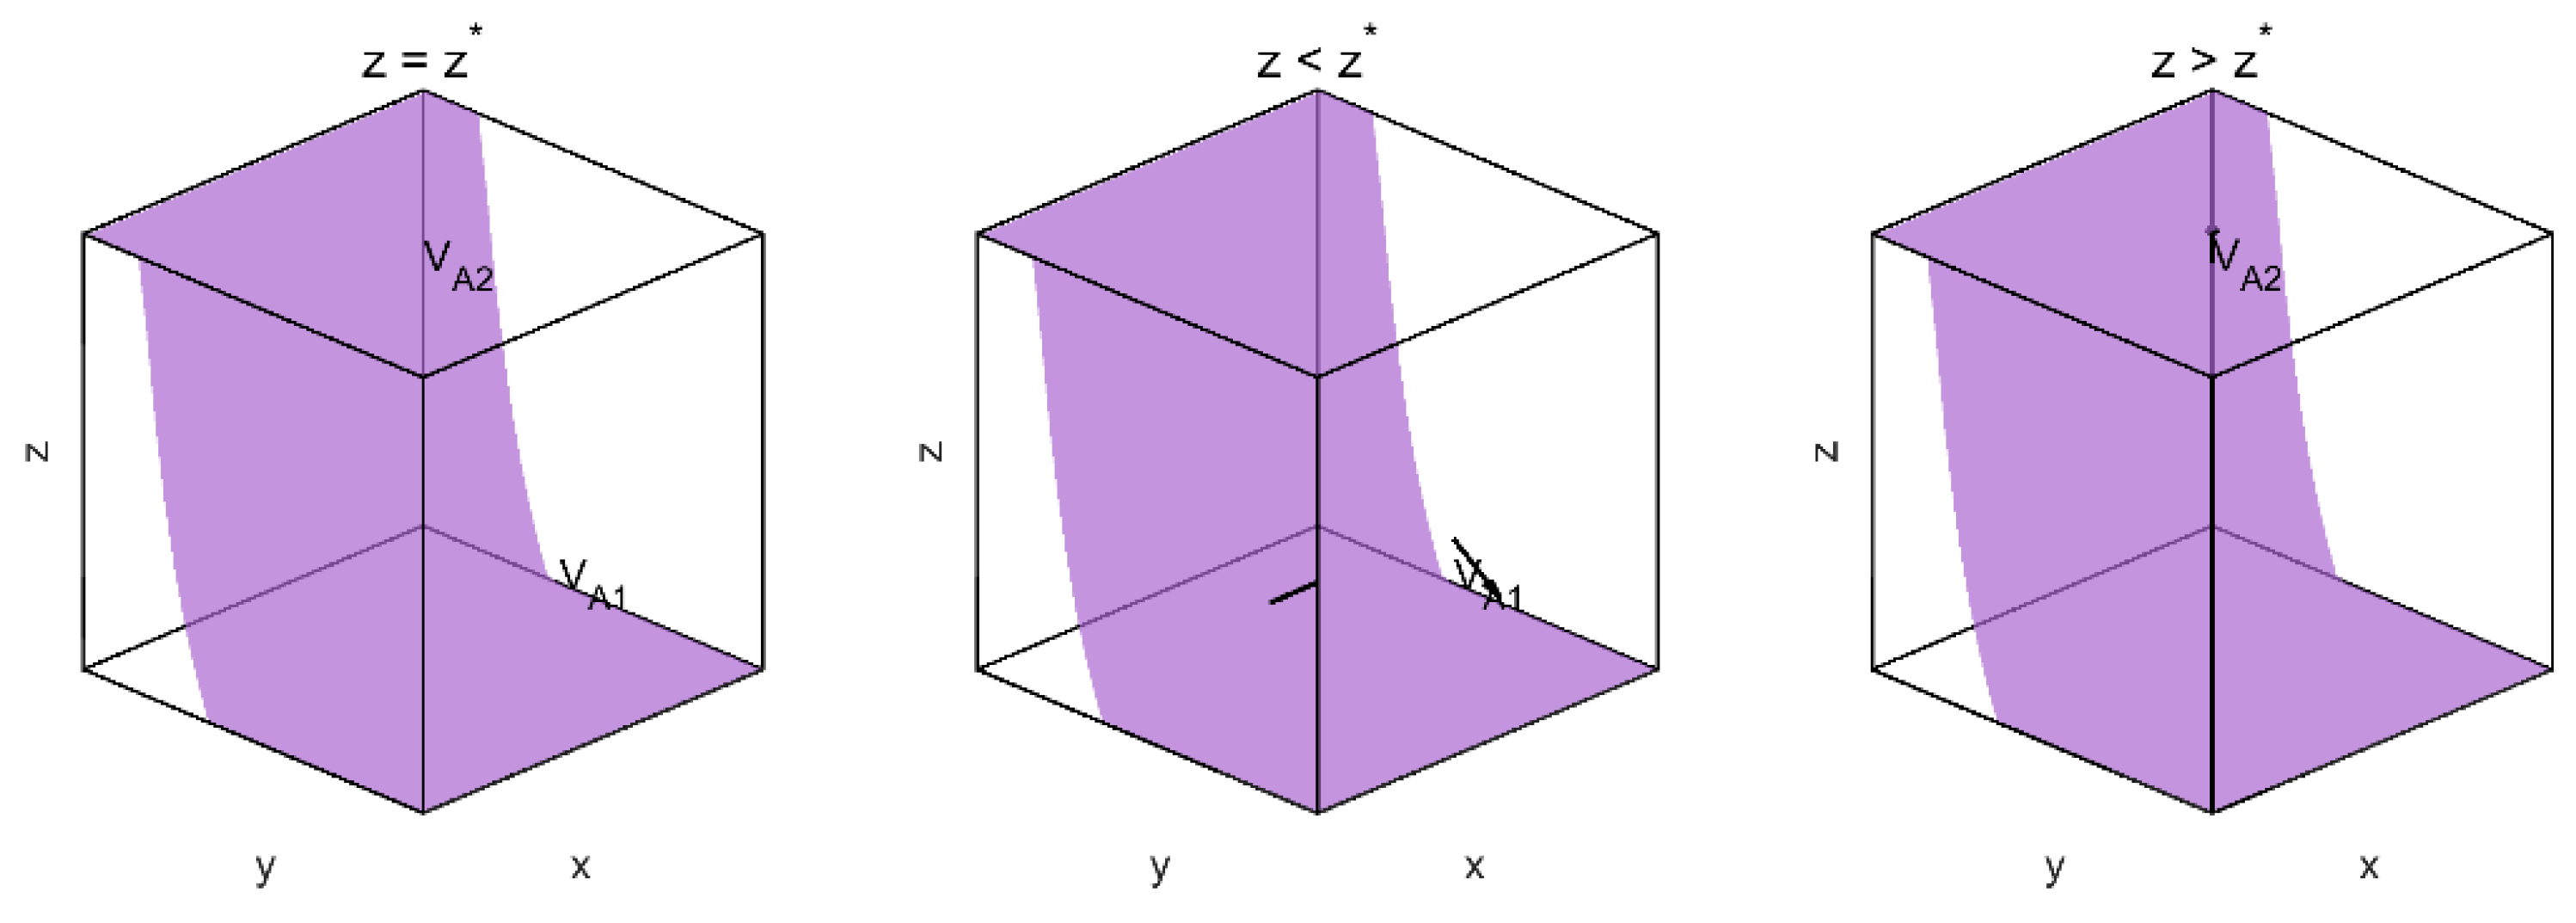
4.1.4. Evolutionary Direction and Equilibrium Conditions

Based on the extended parameters and the gain function, the three-way replicator dynamic equation is as follows:
x ˙ = x 1 x y ( δ b 1 + ρ + 1 y 1 δ b c + α x b y ˙ = y 1 y x R 1 + λ / 2 c p + z g 1 + β λ R / 4 z ˙ = z 1 z x θ 1 + α c g + β g
and the Jacobian matrix at the equilibrium point x , y , z is
J = x ˙ x x ˙ y x ˙ z y ˙ x y ˙ y y ˙ z z ˙ x z ˙ y z ˙ z
where the key partial derivatives are
x ˙ x = 1 2 x y δ b 1 + ρ + 1 y 1 δ b c + x 1 x α b
y ˙ y = 1 2 y x R 1 + λ 2 c p + z g 1 + β λ R 4
z ˙ z = 1 2 z x θ 1 + α c g + β g .
For interior equilibria where 0 < x , y , z < 1 , the following conditions must be satisfied,
y Δ b + 1 δ b c ^ = 0   y = c 1 δ b Δ b
c p x + 1 = 0 ,   ( No   solution ,   since   c p > 0   and   x + 1 > 0 )
c g = 0 ,   ( No   solution ,   since   c g > 0 ) .
As shown in Equations (20) and (21), there is no feasible interior equilibrium for y ˙ and z ˙ , due to the strictly negative values of their replicator dynamics caused by the constant costs c p and c g . Therefore, the system is structurally inclined to converge toward boundary equilibria.
The above analysis reveals that the proportions y (platforms adopting high-quality optimization) and z (governments providing subsidies) tend to decrease over time and ultimately approach 0, driven by persistent cost burdens. In contrast, the evolution of the elderly adoption ratio x depends on a trade-off among the net benefit difference Δ b , the discount factor δ , the health benefit b , and the perceived cost c . This highlights the conditional and sensitive nature of older adults’ adoption decisions, which are significantly shaped by incentive structures and platform behavior.

4.2. ESS Analysis and Stability Conditions

To identify the system’s Evolutionarily Stable Strategies (ESS), we analyze the stability of boundary equilibrium points and examine how key parameters influence long-term dynamics. ESS requires not only that the system reaches a steady state, but also that the equilibrium resists small perturbations. Using replicator dynamics and the Jacobian matrix analysis, we assess the local stability of critical points and identify risks of degenerative cycles.

4.2.1. Conditions for Evolutionary Stability

We focus on the following two typical boundary equilibrium points:
  • (0,0,0): Non-adoption by older adults, low-cost operation by platforms, and no intervention by government, indicating a degenerative cycle;
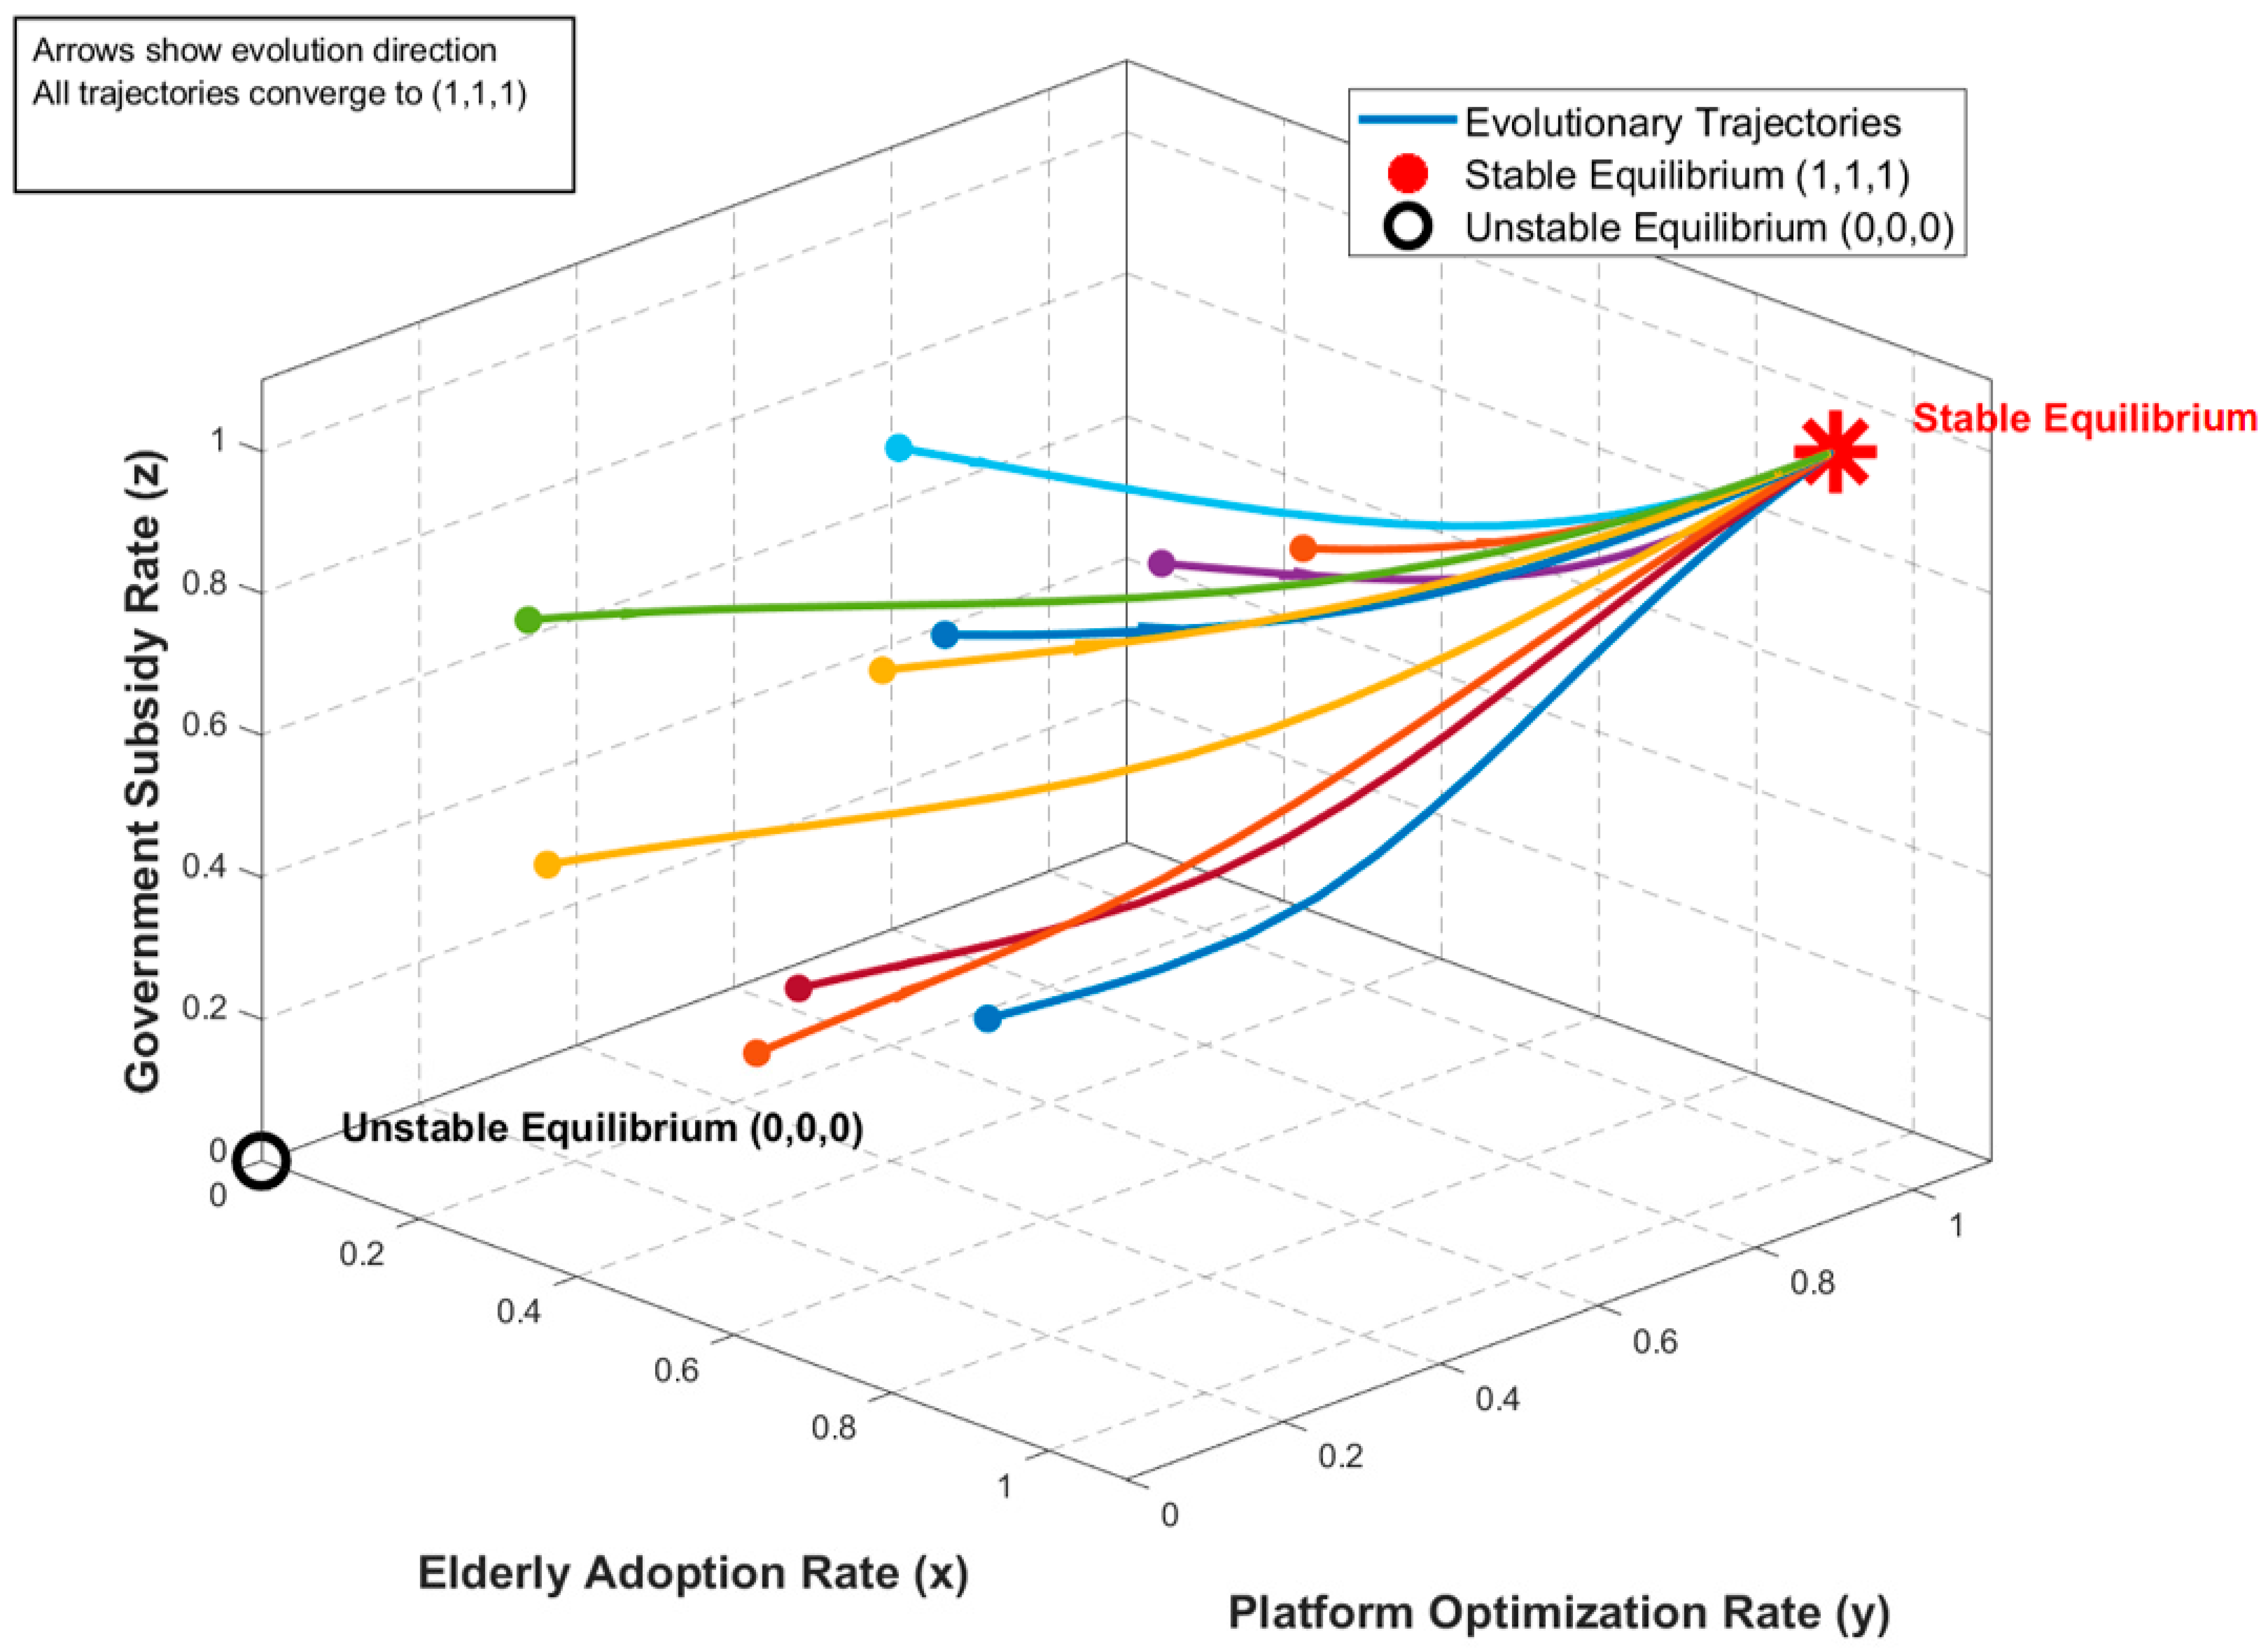
  • (1,1,1): Full adoption by older adults, high-quality optimization by platforms, and subsidization by the government, indicating a desirable high-performance state.
At point (0,0,0), the dynamic system simplifies to
x ˙ = 0 1 0 0 Δ b + 1 δ b c = 0 , y ˙ = 0 1 0 c p 0 + 1 = 0 , z ˙ = 0 1 0 c g = 0 .
  • Although (0,0,0) is a steady state, its local stability must be verified using the Jacobian matrix. The Jacobian matrix is defined as follows:
    J = x ˙ x x ˙ y x ˙ z y ˙ x y ˙ y y ˙ z z ˙ x z ˙ y z ˙ z .
At the point (0,0,0), the partial derivatives are computed as follows:
x ˙ x = 1 2 x y Δ b + 1 δ b c | 0 , 0 , 0 = 1 δ b c , x ˙ y = x 1 x Δ b | 0 , 0 , 0 = 0 , x ˙ z = 0 , y ˙ x = y 1 y c p | 0 , 0 , 0 = 0 , y ˙ y = 1 2 y c p x + 1 | 0 , 0 , 0 = c p , y ˙ z = 0 , z ˙ x = 0 , z ˙ y = 0 , z ˙ z = 0 .
The Jacobian matrix is reduced to
J = 1 δ b c 0 0 0 c p 0 0 0 c g .
Its eigenvalues are diagonal elements: λ 1 = 1 δ b c , λ 2 = c p , λ 3 = c g . Since c p , c g > 0 , λ 2 , λ 3 < 0 . When λ 1 = 1 δ b c < 0 , i.e.,   c > 1 δ b , all the eigenvalues are negative, and (0,0,0) is a locally stable equilibrium point, it indicates that the system is caught in a vicious circle of low adoption, low optimization, and no incentive.

4.2.2. Parameter Conditions Leading to Degenerative Cycles

Degenerative outcomes are driven by the following parameters δ , b , c , c p , c g . When the adoption cost c is high, the trust coefficient δ is low (due to low-quality services), or the health benefit b is insufficient, 1 δ b c < 0 , older adults lack incentives to adopt, leading to x 0 . Meanwhile, the platform tends to operate at low cost ( y 0 ) due to a high optimization cost c p and lack of sufficient user adoption (low x ). The government tends to not intervene ( z 0 ) due to policy costs c g and low adoption (low x , leading to low θ ). The key parameters include the following:
  • High adoption costs: c > 1 δ b , older adults are reluctant to adopt due to high costs;
  • Low trust level: δ 0 , the low-cost operation of the platform erodes user trust;
  • High optimization cost: c p is too high, platforms lack incentive to optimize;
  • High policy cost: c g > θ , the government is unwilling to bear subsidies.
Key Threshold Conditions for Avoiding Vicious Cycles:
  • Conditions for adoption by older adults: δ b 1 + ρ + α x b > c ;
  • Conditions for platform optimization: R 1 + λ / 2 + g 1 + β > c p + λ R / 4 ;
  • Conditions for government incentives: θ 1 + α + β g > c g .
The stability analysis of key equilibrium points is shown in Table 2.

5. Numerical Simulation and Results

5.1. The Simulation Settings

The simulation parameters are set as shown in Table A1 (see Appendix A). Simulations were performed using the MATLAB R2023a, and getting through r a n d 10 , 3     0.8 + 0.1 was performed by generating 10 sets of random initial conditions in the range of [0.1, 0.9] covering the three variables x (elderly adoption rate), y (platform optimization), and z (government subsidy). The dynamic process was simulated by the ode45 solver, which calculates the variation of each variable over time based on replicated dynamic equations with a time step of 0.1 and a simulation duration of 50 units to ensure that the trajectory is smooth and the data points are sufficiently dense; the 3D phase diagrams use a manual convergence force to ensure that convergence to (1,1,1) is achieved, while the 2D sensitivity analysis maintains the natural dynamics to reflect parameter impacts.

5.2. Results and Path Analysis

The 3D phase diagram in Figure 5 presents the system’s evolutionary behavior, showing multiple trajectories from varied initial conditions that consistently converge to a stable equilibrium point. This highlights the system’s inherent stability under the combined influences modeled. The 3D phase plot is shown in Figure 5.
Figure 5 illustrates the 3D phase diagram of the system under the interplay of three key variables: elderly adoption rate, platform optimization rate, and government subsidy rate (variables x, y, and z). Different colored trajectories represent evolutionary paths starting from multiple randomly selected initial conditions within the interval [0.1, 0.9]; the color differentiation helps visually distinguish each trajectory’s starting point and evolution process. All trajectories clearly converge toward the stable equilibrium point (1,1,1), marked by a red star, indicating that under the synergistic effects of health benefits, platform optimization, and government subsidies, the system exhibits a stable evolutionary trend with all three variables ultimately reaching their maximal stable state. Additionally, the figure shows an unstable equilibrium point at (0,0,0), from which the system state moves away along the evolutionary direction. Arrows clearly indicate the dynamic trends. Overall, the diagram effectively captures the system dynamics and its stability characteristics.

6. Sensitivity Analysis

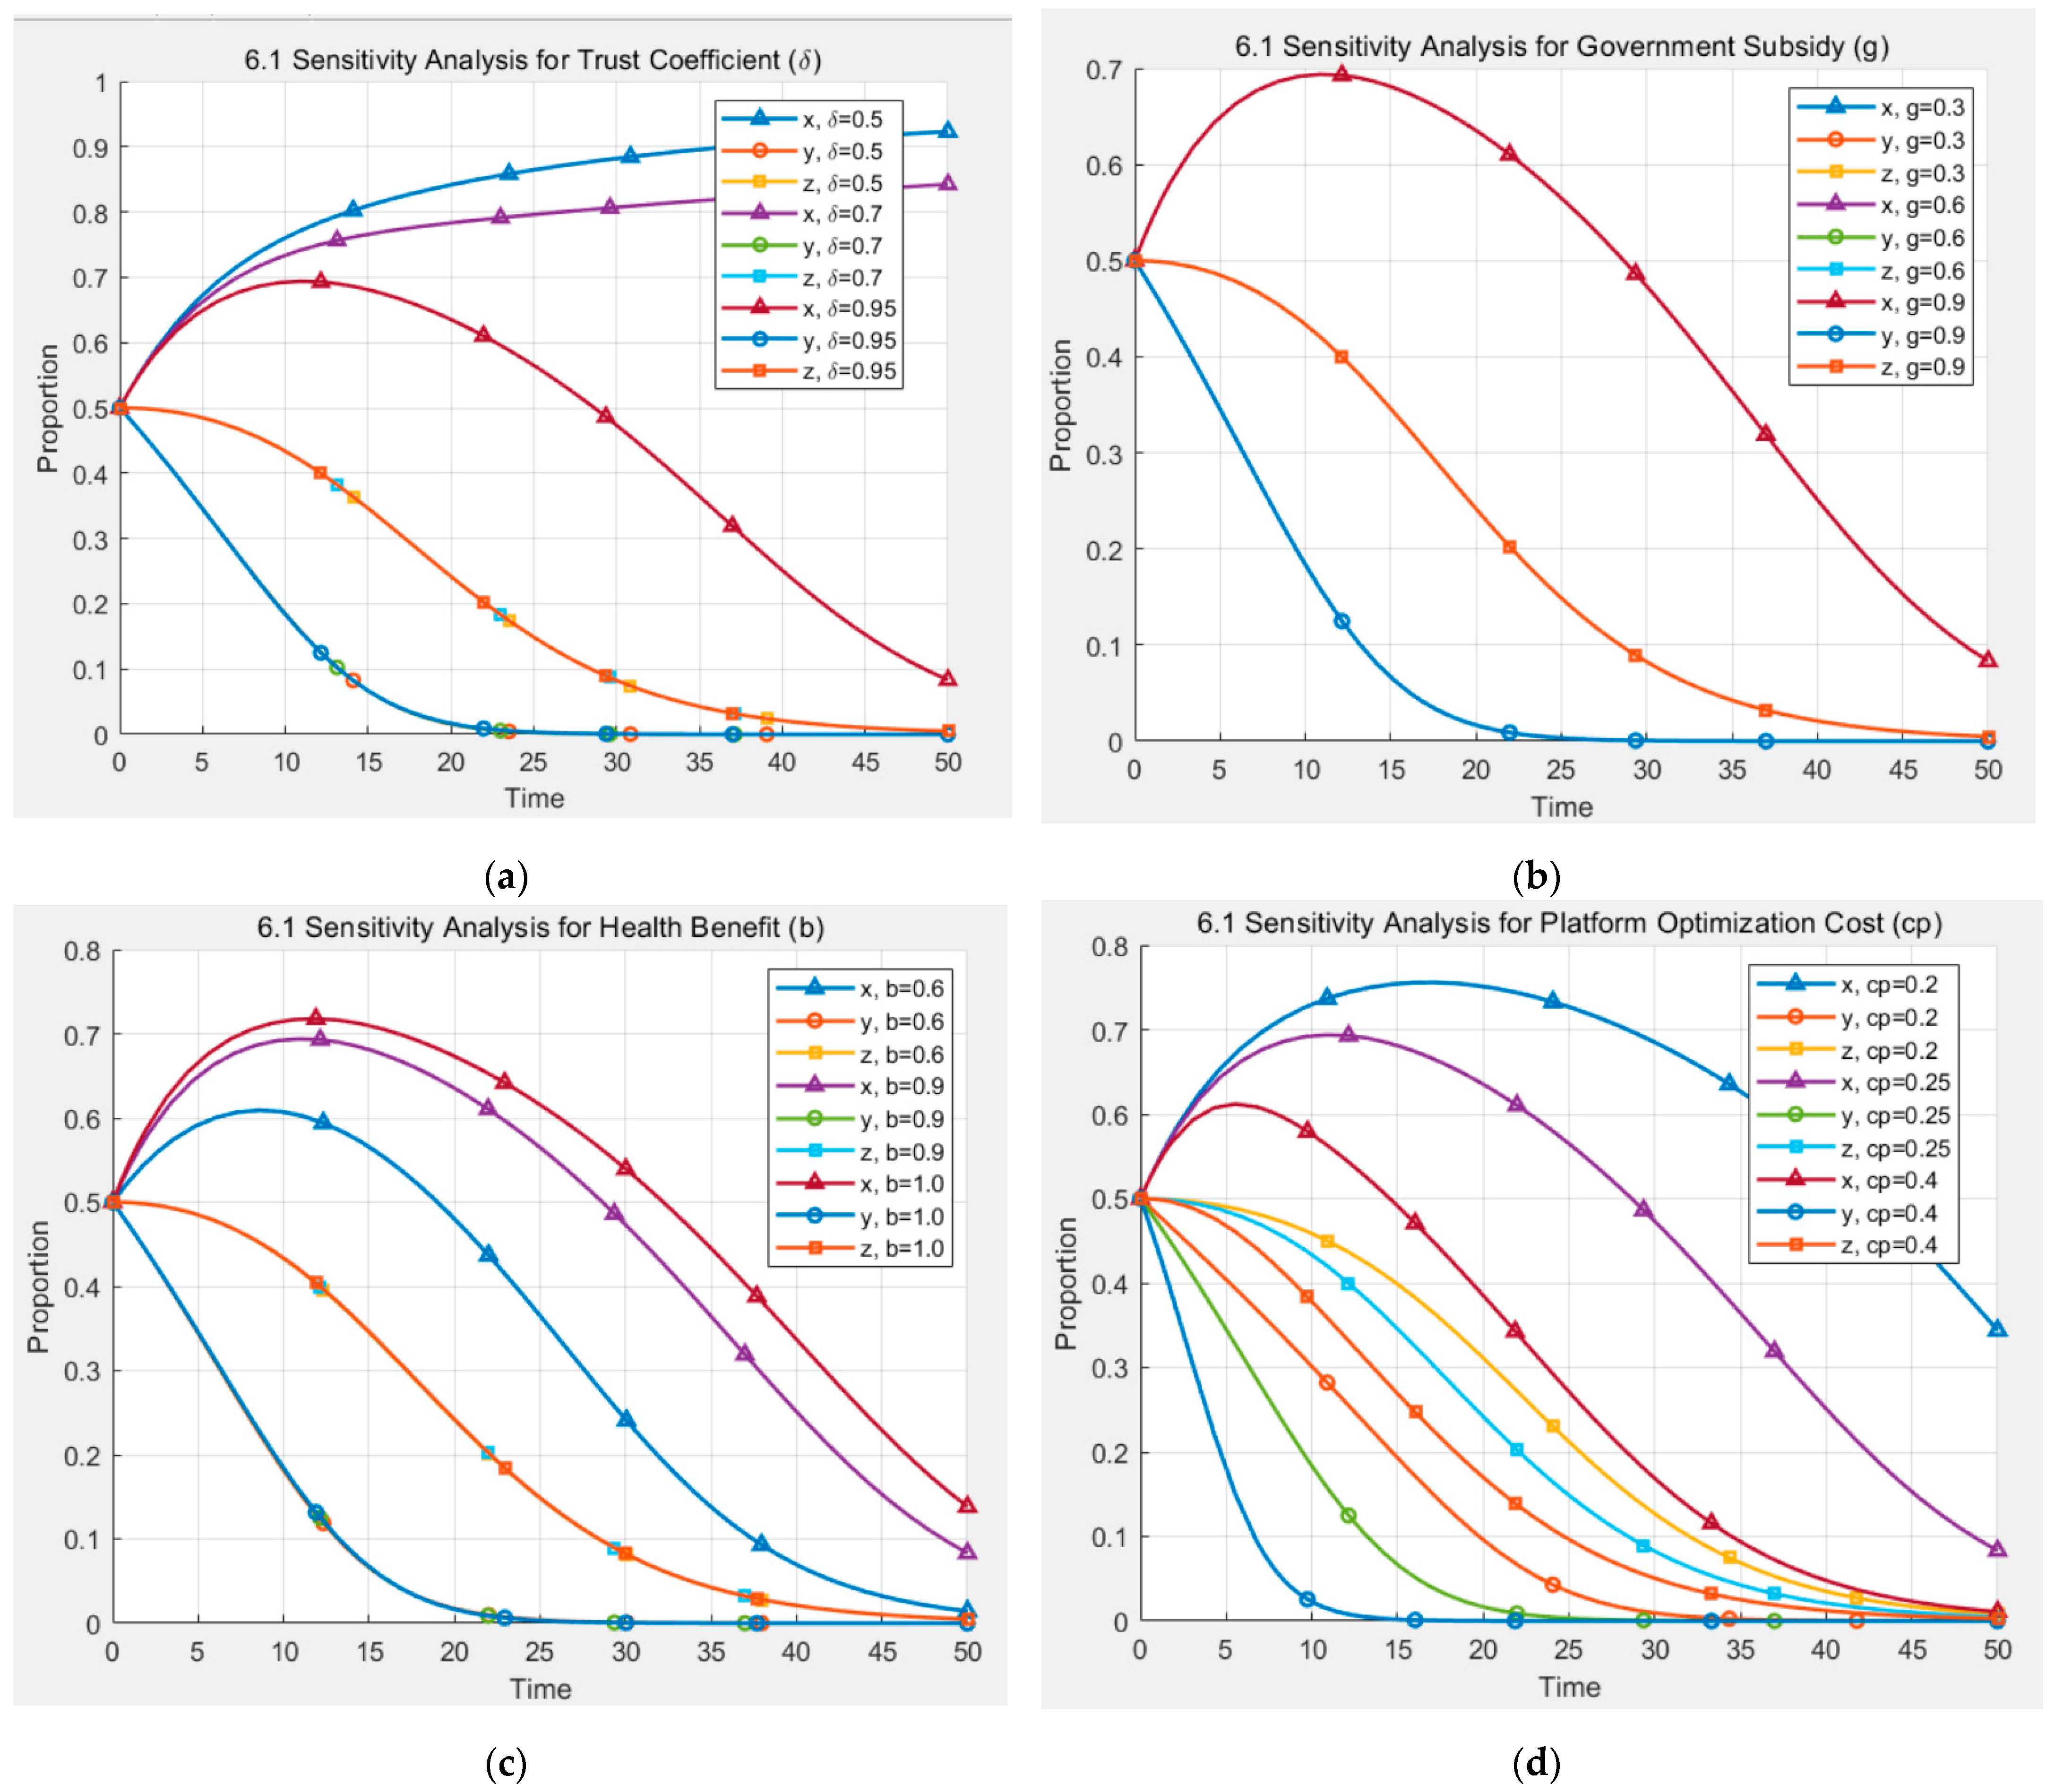
6.1. Sensitivity Analysis of Parameters

The sensitivity analysis of each parameter and its visualization results are shown in Figure 6.
Figure 6a illustrates the sensitivity of system dynamics to changes in the trust coefficient δ under initial conditions (0.5, 0.5, 0.5). When δ takes values of 0.5, 0.7, and 0.95, the trajectories of variables x, y, and z differ significantly. Trajectories are marked with triangles, circles, and squares (5–6 markers per line), indicating that higher trust levels promote greater adoption, optimization, and government support. The curves are smooth, capturing the system’s dynamic responsiveness to trust variations.
Figure 6b presents the sensitivity analysis of government subsidies g, with values set at 0.3, 0.6, and 0.9 under the same initial conditions. The trajectories for x, y, and z are distinguished using triangle, circle, and square markers. Higher subsidy levels lead to clear divergence in system behavior, promoting increased adoption, service optimization, and policy engagement. Smooth curves and evenly spaced markers reflect the long-term influence of fiscal incentives on system evolution.
Figure 6c depicts the system trajectories under different health benefit levels b = 0.6, 0.9, and 1.0. Using the same initial conditions, variations in x, y, and z are visualized with triangular, circular, and square markers (5–6 per line). The results indicate that higher perceived health benefits encourage user participation, platform quality improvement, and government intervention, reflecting the role of health value in driving favorable system dynamics.
Figure 6d shows how changes in platform optimization cost cp (set at 0.2, 0.25, and 0.4) affect the trajectories of x, y, and z. Starting from initial values of (0.5, 0.5, 0.5), the curves are marked with triangles, circles, and squares (5–6 markers per trajectory). As cp increases, the platform’s willingness to invest in quality declines, inhibiting system-level adoption and subsidy feedback. The smooth trajectories provide a clear picture of how cost sensitivity influences system dynamics.

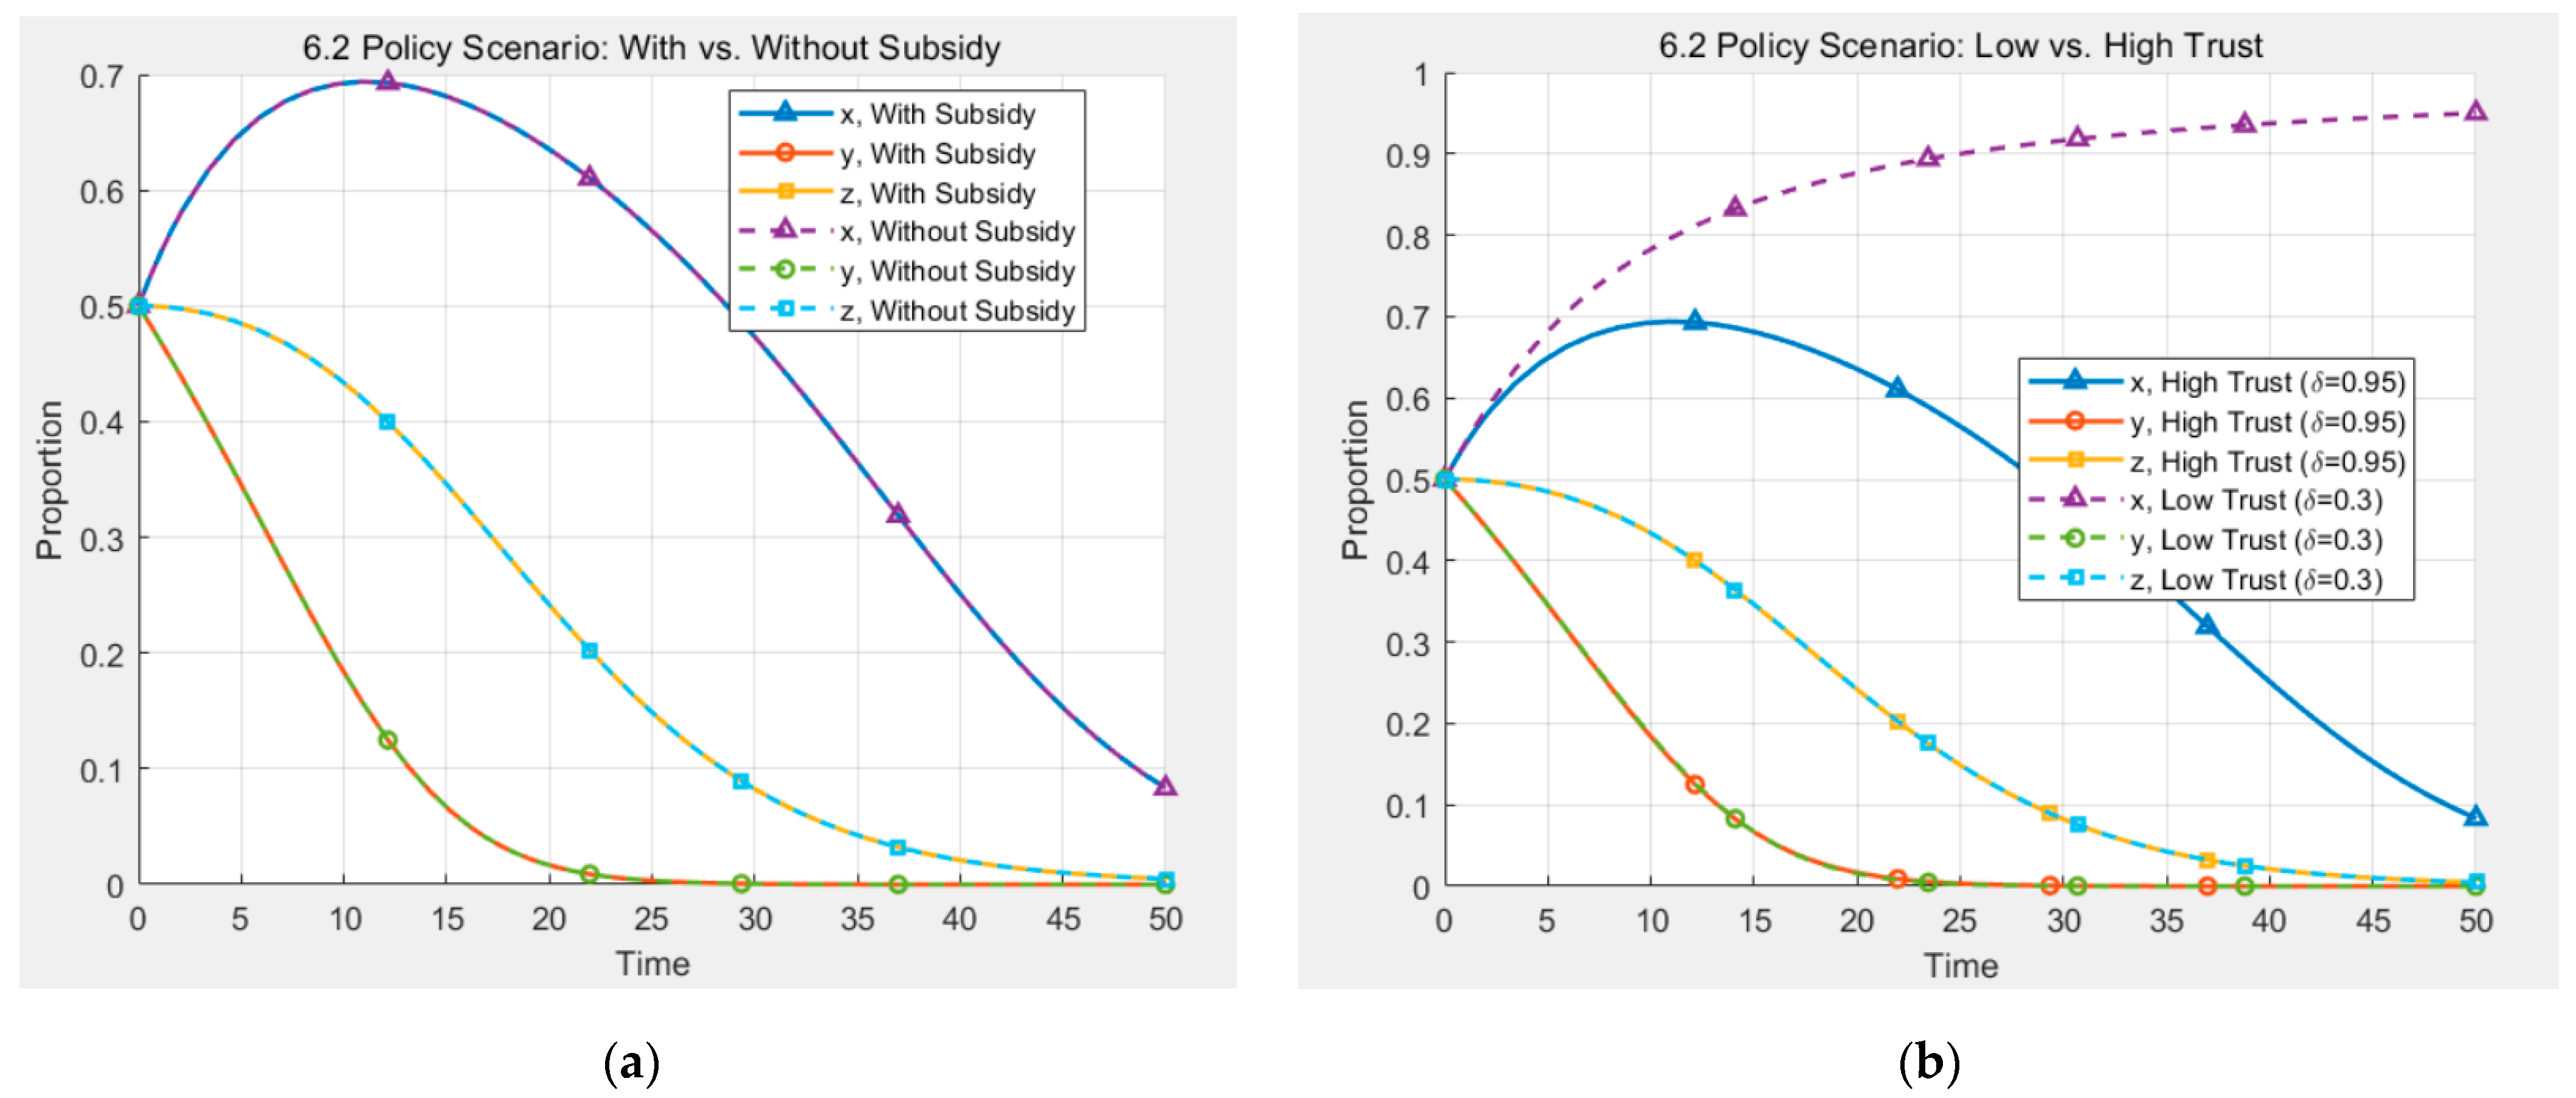
6.2. Policy Simulation and Scenario Comparison

Figure 7 shows the visualization results of the older adults adoption simulation under different policy scenarios.
Figure 7a compares the system trajectories of x, y, and z under two policy scenarios—government subsidy g = 0.7 versus no subsidy g = 0 with the same initial condition (0.5, 0.5, 0.5). Solid lines indicate the subsidy scenario, while dashed lines represent the no-subsidy condition. Each curve is marked with triangles, circles, and squares (5–6 markers per line). The results reveal that in the presence of subsidies, system variables rise more rapidly and converge toward a favorable equilibrium, highlighting the critical role of financial incentives in promoting user adoption, platform optimization, and sustained policy support. The trajectories are smooth and clearly distinguishable across scenarios.
Figure 7b compares the evolutionary trajectories of system variables under two trust levels—low trust ( δ = 0.5) and high trust ( δ = 0.95). The same initial condition (0.5, 0.5, 0.5) is used, with solid lines representing high-trust scenarios and dashed lines for low-trust cases. Trajectories are marked with triangles, circles, and squares (5–6 markers per curve). The simulation indicates that under high trust, user adoption, platform optimization, and government subsidy rates grow more quickly and converge toward a positive equilibrium. These findings underscore the importance of trust mechanisms in shaping favorable system dynamics and should inform future policy design.
To further examine how the extended parameters influence the system’s evolutionary dynamics, we conducted sensitivity simulations focusing on two key coefficients: the reputation sensitivity ( δ ) and the market competition intensity ( λ ). We varied δ within the range [0.2, 0.8] and observed that higher δ values significantly accelerated users’ trust accumulation and increased the convergence speed toward the high-adoption equilibrium. This result highlights that platform reputation plays a catalytic role in driving behavioral feedback loops. Similarly, we adjusted λ between [0.1, 0.9] to simulate environments with weak to strong market competition. The findings reveal that higher λ values prompt platforms to invest earlier and more aggressively in service quality to retain competitive advantage. This behavior in turn reinforces user confidence and adoption rates. Together, these simulations validate the behavioral relevance of δ and λ , and confirm the theoretical argument that both reputation systems and competition mechanisms are indispensable drivers of sustainable AI health adoption ecosystems.

7. Discussion

7.1. Theoretical Contributions and Model Significance

This study proposes a tripartite evolutionary game model to explore how strategic interactions among older adults, platform providers, and governments shape the dynamic trajectory of AI health assistant adoption. Instead of viewing adoption behavior as a one-sided or static decision, the model conceptualizes it as a multi-actor co-evolutionary process involving feedback loops, strategic learning, and mutual adjustment.
Specifically, the model formalizes a sequential decision-making structure: governments initiate the process by choosing whether to provide policy incentives; platforms then respond by adjusting service quality investments; and finally, older adults adapt their adoption behaviors based on observed platform quality and perceived trust. This temporally structured logic reflects the practical coordination challenges of digital health governance and offers a more realistic analytical framework than conventional static models.
The use of replicator dynamics and a Jacobian matrix stability analysis allows for identifying conditions under which a system transitions from a low-trust, low-optimization equilibrium to a high-adoption, high-incentive virtuous cycle. In doing so, the model extends the theoretical frontier of technology adoption research in aging societies by highlighting how multi-level coordination determines system outcomes over time.

7.2. Practical Implications

The results of the study have some practical value. First, from a policy perspective, governments should implement tiered and adaptive incentive strategies that respond to different stages of user engagement. For example, startup subsidies can help reduce the initial threshold for adoption, while maintenance support and performance-based rewards can sustain long-term usage. Additionally, the government can utilize behavioral incentives, such as public recognition or symbolic rewards, to reinforce commitment and signal credibility to hesitant users. These strategies not only improve individual adoption rates but also foster systemic stability by aligning private motivation with public objectives.
First, governments should implement tiered incentive strategies to promote technology adoption among older adults, including startup subsidies, maintenance support, and reward mechanisms tailored to different adoption phases. Second, platforms must prioritize dynamic trust-building through service quality enhancement, transparent algorithm design, and continuous engagement to strengthen user loyalty and willingness to optimize. Finally, establishing a tripartite coordination mechanism among early adopters, platforms, and public institutions can catalyze the transition from individual trust to collective adoption.
Second, platform providers should prioritize long-term trust-building over short-term user acquisition. Trust-enhancing strategies may include simplifying the user interface, increasing the transparency of AI decision-making, and tailoring service pacing to suit the needs of older adults. Equally important is the establishment of ongoing engagement mechanisms to reduce uncertainty and enhance user satisfaction. By investing in these measures, platforms can foster user loyalty and improve their own reputational capital, which in turn reinforces adoption behavior.
Third, the study highlights the importance of cross-sector coordination mechanisms among users, platforms, and public institutions. By institutionalizing a tripartite governance model, stakeholders can enable timely service optimization, co-design more responsive policies, and facilitate information flow between citizens and the system. Community organizations, in particular, can play a key role as intermediaries by mobilizing early adopters, organizing local training, and bridging digital divides. This bottom-up engagement complements top-down policy efforts and enhances the system’s adaptability to local conditions.
Lastly, digital inclusion for older adults should be redefined as a long-term process of capacity-building rather than simply improving access. Public and private actors must invest in intergenerational learning initiatives, local AI ambassadors, and the integration of AI health assistants into existing community-based care systems. These efforts ensure that technology not only reaches elderly users but also becomes meaningfully embedded in their daily health routines. Such a shift from availability to capability is essential for equitable and sustainable digital health governance.

7.3. Research Limitations and Future Directions

This study has several limitations that should be acknowledged. First, it assumes homogeneity within participant groups and does not incorporate network structures or individual-level heterogeneity. Second, to ensure analytical tractability and theoretical clarity, the model employs several simplifying assumptions, including normalized parameters, binary strategy sets, and linear payoff functions. While these assumptions are common in evolutionary game modeling, they may limit the model’s ability to fully capture the complexity of real-world interactions. Future research may enhance the model’s behavioral realism by introducing more granular strategy sets—e.g., platforms choosing among multiple service levels or governments designing phased subsidies; and embedding network structures to simulate peer influence, trust contagion, or information diffusion among older adults. These extensions could better capture emergent group dynamics and improve the policy sensitivity of the framework. It should be noted that the current model is primarily suitable for exploratory analysis in contexts where system-level policy mechanisms are dominant but micro-level behavioral data remain limited.
In addition, the current study has not yet been empirically validated with real-world behavioral or survey data, which limits the external generalizability of its conclusions. To address this, future studies could employ three complementary approaches: (1) structured surveys to examine how trust, perceived costs, and policy awareness shape older adults’ adoption decisions; (2) platform behavioral logs to validate platform-user feedback dynamics; and (3) comparative case studies across smart aging initiatives in different regions to assess the effectiveness of policy incentives in practice. These empirical directions will help strengthen the external validity of the theoretical framework developed in this study. Together, these theoretical and empirical directions provide a roadmap for future studies seeking to integrate complex behavioral dynamics into the design and governance of AI-enabled health systems for aging populations.

8. Conclusions

By modeling the tripartite interactions among older adults, platforms, and governments, this study elucidates the co-evolutionary pathway linking trust, incentives, and optimization in the adoption of AI health assistants. Findings indicate that without adequate trust and policy support, the system is prone to a vicious cycle of low adoption, minimal service optimization, and withdrawn subsidies. In contrast, coordinated positive feedback among all actors can lead to a stable and desirable system equilibrium. Therefore, promoting AI health governance in aging societies requires a robust coupling mechanism of technology, trust, and policy to translate digital accessibility into meaningful adoption and sustained engagement. In summary, this study contributes a theoretically grounded and policy-relevant model of AI health assistant adoption. Its core innovation lies in integrating trust dynamics, platform strategies, and government incentives within a tripartite evolutionary game framework. By uncovering the behavioral conditions that lead to either sustained adoption or systemic stagnation, the model provides valuable insights for scholars and policymakers alike.

Author Contributions

Conceptualization, R.S. and J.M.; methodology, R.S.; software, R.S.; validation, R.S. and J.M.; formal analysis, R.S.; investigation, R.S.; resources, J.M.; data curation, R.S.; writing—original draft preparation, R.S.; writing—review and editing, J.M.; visualization, R.S.; supervision, J.M.; project administration, J.M. All authors have read and agreed to the published version of the manuscript.

Funding

This research received no external funding, and The APC was funded by the Harbin Institute of Technology.

Institutional Review Board Statement

Not applicable.

Informed Consent Statement

Not applicable.

Data Availability Statement

The data presented in this study are available on request from the corresponding author.

Conflicts of Interest

The authors declare no conflicts of interest.

Appendix A

Table A1. Description of model parameters.
ParameterValueMeaning
b 0.9Health benefit
c 0.2Adoption cost
δ 0.95Trust coefficient
c p 0.25Platform optimization cost
g 0.7Government subsidy
θ 0.8Public welfare gain
c g 0.15Policy cost
R 0.5Platform revenue
α 0.5Trust spillover effect
β 0.6Subsidy amplification effect
k 0.1Convergence constant (for phase diagram only)
t s p a n [0, 50]Time span
d t 0.1Time step

References

  1. United Nations Department of Economic and Social Affairs. World Population Prospects. 2024. Available online: https://www.un.org/zh/node/219470 (accessed on 10 April 2025).
  2. Liu, Y.; Tamura, R.; Xiao, L. Barriers to Older Adults Adapting Smart Homes: Perceived Risk Scale Development. Buildings 2024, 14, 1226. [Google Scholar] [CrossRef]
  3. Ramirez, D.E.A.; Grasse, L.; Stone, S.; Tata, M.; Gonzalez, C.L. AI-powered speech device as a tool for neuropsychological assessment of an older adult population: A preliminary study. Acta Psychol. 2025, 257, 105084. [Google Scholar] [CrossRef] [PubMed]
  4. Imkome, E.U.; Soonthornchaiya, R.; Lakanavisid, P.; Deepaisarn, S.; Wongpatikasereeb, K.; Suebnukarn, S.; Matthews, A.K. Ai-Aun Chatbot: A Pilot Study on the Effectiveness of an Artificial Intelligence Intervention for Mental Health Among Thai Older Adults. Nurs. Health Sci. 2025, 27, e70093. [Google Scholar] [CrossRef] [PubMed]
  5. Wu, P.F.; Summers, C.; Panesar, A.; Kaura, A.; Zhang, L. AI Hesitancy and Acceptability—Perceptions of AI Chatbots for Chronic Health Management and Long COVID Support: Survey Study. JMIR Hum. Factors 2024, 11, e51086. [Google Scholar] [CrossRef]
  6. Wang, A.; Zhou, Y.; Ma, H.; Tang, X.; Li, S.; Pei, R.; Piao, M. Preparing for aging: Understanding middle-aged user acceptance of AI chatbots through the technology acceptance model. Digit. Health 2024, 10, 20552076241284903. [Google Scholar] [CrossRef]
  7. Al-Somali, S.A. Integrating artificial intelligence (AI) in healthcare: Advancing older adults’ health management in Saudi Arabia through AI-powered chatbots. PeerJ Comput. Sci. 2025, 11, e2773. [Google Scholar] [CrossRef]
  8. Schoenborn, N.L.; Chae, K.; Massare, J.; Ashida, S.; Abadir, P.; Arbaje, A.I.; Unberath, M.; Phan, P.; Cudjoe, T.K.M. Perspectives on AI and Novel Technologies Among Older Adults, Clinicians, Payers, Investors, and Developers. JAMA Netw. Open 2025, 8, e253316. [Google Scholar] [CrossRef]
  9. Luo, C.; Yang, C.; Yuan, R.; Liu, Q.; Li, P.; He, Y. Barriers and facilitators to technology acceptance of socially assistive robots in older adults-A qualitative study based on the capability, opportunity, and motivation behavior model (COM-B) and stakeholder perspectives. Geriatr. Nurs. 2024, 58, 162–170. [Google Scholar] [CrossRef]
  10. Kim, K.M.; Kim, S.H. Experience of the Use of AI Conversational Agents Among Low-Income Older Adults Living Alone. SAGE Open 2024, 14, 21582440241301022. [Google Scholar] [CrossRef]
  11. Wu, Y.H.; Damnée, S.; Kerhervé, H.; Ware, C.; Rigaud, A.S. Bridging the digital divide in older adults: A study from an initiative to inform older adults about new technologies. Clin. Interv. Aging 2015, 10, 193–201. [Google Scholar] [CrossRef]
  12. Jiang, T.; Huang, C.; Xu, Y.; Zheng, H. Cognitive vs. emotional empathy: Exploring their impact on user outcomes in health-assistant chatbots. Behav. Inf. Technol. 2025, 1–16. [Google Scholar] [CrossRef]
  13. Dino, M.J.S.; Dion, K.W.; Abadir, P.M.; Budhathoki, C.; Huang, C.-M.; Padula, W.V.; Ong, I.; Himmelfarb, C.R.D.; Davidson, P.M.; Thiamwong, L. What drives older adults’ acceptance of virtual humans? A conjoint and latent class analysis on virtual exercise coach attributes for a community-based exercise program. Comput. Hum. Behav. 2025, 164, 108507. [Google Scholar] [CrossRef]
  14. Wolfe, B.H.; Oh, Y.J.; Choung, H.; Cui, X.; Weinzapfel, J.; Cooper, R.A.; Lee, H.-N.; Lehto, R. Caregiving artificial intelligence chatbot for older adults and their preferences, well-being, and social connectivity: Mixed-method study. J. Med. Internet Res. 2025, 27, e65776. [Google Scholar] [CrossRef] [PubMed]
  15. Yang, H.J.; Lee, J.H.; Lee, W. Factors Influencing Health Care Technology Acceptance in Older Adults Based on the Technology Acceptance Model and the Unified Theory of Acceptance and Use of Technology: Meta-Analysis. J. Med. Internet Res. 2025, 27, e65269. [Google Scholar] [CrossRef] [PubMed]
  16. Zhang, Y.; Ma, Y.; Liang, C. Understanding older adults’ continuance intention toward wearable health technologies: An empowerment perspective. Behav. Inf. Technol. 2025, 44, 1277–1294. [Google Scholar] [CrossRef]
  17. Davis, F.D. Perceived Usefulness, Perceived Ease of Use, and User Acceptance. MIS Q. 1989, 13, 319–340. [Google Scholar] [CrossRef]
  18. Venkatesh, V.; Morris, M.G.; Davis, G.B.; Davis, F.D. User Acceptance of Information Technology. MIS Q. 2003, 27, 425–478. [Google Scholar] [CrossRef]
  19. Li, Z.; Duan, J.A.; Ransbotham, S. Coordination and dynamic promotion strategies in crowdfunding with network externalities. Prod. Oper. Manag. 2020, 29, 1032–1049. [Google Scholar] [CrossRef]
  20. Jin, J.; Ryu, M.H. Sustainable Healthcare in China: Analysis of User Satisfaction, Reuse Intention, and Electronic Word-of-Mouth for Online Health Service Platforms. Sustainability 2024, 16, 7584. [Google Scholar] [CrossRef]
  21. Yu, S.; Chen, T. Understanding older adults’ acceptance of Chatbots in healthcare delivery: An extended UTAUT model. Front. Public Health 2024, 12, 1435329. [Google Scholar] [CrossRef]
  22. Fan, M.; Ukaegbu, O.C. Information literacy and intention to adopt e-pharmacy: A study based on trust and the theory of reasoned action. BMC Health Serv. Res. 2024, 24, 912. [Google Scholar] [CrossRef]
  23. Ho, M.T.; Le, N.T.B.; Mantello, P.; Ghotbi, N. Understanding the acceptance of emotional artificial intelligence in Japanese healthcare system: A cross-sectional survey of clinic visitors’ attitude. Technol. Soc. 2024, 72, 102166. [Google Scholar] [CrossRef]
  24. Kane, G.C.; Palmer, D.; Phillips, A.N.; Kiron, D.; Buckley, N. Strategy, not technology, drives digital transformation. MIT Sloan Manag. Rev. 2015, 14, 1–25. [Google Scholar]
  25. Guo, P.; Feng, G.; Wang, K.; Hua, J. Analysis of financing strategies for digital technology investment under privacy concerns and competition. Int. J. Prod. Econ. 2024, 274, 109294. [Google Scholar] [CrossRef]
  26. Sazvar, Z.; Zokaee, M.; Tavakkoli-Moghaddam, R.; Salari, S.A.S.; Nayeri, S. Designing a sustainable closed-loop pharmaceutical supply chain in a competitive market considering demand uncertainty, manufacturer’s brand and waste management. Ann. Oper. Res. 2022, 315, 2057–2088. [Google Scholar] [CrossRef]
  27. Zhang, M.; Wei, X.; Zeng, D.D. A matter of reevaluation: Incentivizing users to contribute reviews in online platforms. Decis. Support Syst. 2020, 128, 113158. [Google Scholar] [CrossRef]
  28. Wong, A.K.C.; Lee, J.H.T.; Zhao, Y.; Lu, Q.; Yang, S.; Hui, V.C.C. Exploring Older Adults’ Perspectives and Acceptance of AI-Driven Health Technologies: Qualitative Study. JMIR Aging 2025, 8, e66778. [Google Scholar] [CrossRef]
  29. Campmas, A.; Iacob, N.; Simonelli, F. How can interoperability stimulate the use of digital public services? An analysis of national interoperability frameworks and e-Government in the European Union. Data Policy 2022, 4, e19. [Google Scholar] [CrossRef]
  30. Lindgren, I.; Madsen, C.Ø.; Hofmann, S.; Melin, U. Close encounters of the digital kind: A research agenda for the digitalization of public services. Gov. Inf. Q. 2019, 36, 427–436. [Google Scholar] [CrossRef]
  31. Municipal Civil Affairs Bureau. Online and Offline Linkage to Meet Diversified Elderly Service Needs (2024 Edition). Available online: https://www.mca.gov.cn/n2623/n2684/n2703/c1662004999979998399/content.html (accessed on 10 April 2025).
  32. Shanghai Smart City Development Institute. “Healthy Cloud” Ageing Adaptation Transforms Across the Digital Divide, Creating a New Ecology of Intelligent Services for the Elderly (2022 Edition). Available online: https://www.sscdi.cn/index.php?id=552 (accessed on 10 April 2025).
  33. Wen, H.; Sun, S.; Huang, T.; Xiao, D. An intrinsic integrity-driven rating model for a sustainable reputation system. Expert Syst. Appl. 2024, 249, 123804. [Google Scholar] [CrossRef]
  34. Lin, T.K.; Werner, K.; Witter, S.; Alluhidan, M.; Alghaith, T.; Hamza, M.M.; Herbst, C.H.; Alazemi, N. Individual performance-based incentives for health care workers in Organisation for Economic Co-operation and Development member countries: A systematic literature review. Health Policy 2022, 126, 512–552. [Google Scholar] [CrossRef]
  35. Connelly, B.L.; Certo, S.T.; Reutzel, C.R.; DesJardine, M.R.; Zhou, Y.S. Signaling theory: State of the theory and its future. J. Manag. 2025, 51, 24–61. [Google Scholar] [CrossRef]
  36. Weibull, J.W. Evolutionary Game Theory; MIT Press: Cambridge, MA, USA, 1997. [Google Scholar]
  37. Hofbauer, J.; Sigmund, K. Evolutionary Games and Population Dynamics; Cambridge University Press: Cambridge, UK, 1998. [Google Scholar]
  38. Nowak, M.A. Five rules for the evolution of cooperation. Science 2006, 314, 1560–1563. [Google Scholar] [CrossRef]
  39. Shi, T.; Xiao, H.; Han, F.; Chen, L.; Shi, J. A regulatory game analysis of smart aging platforms considering privacy protection. Int. J. Environ. Res. Public Health 2022, 19, 5778. [Google Scholar] [CrossRef]
  40. Yang, S.; Wang, H. Evolutionary Game Analysis of Medical System Information Collaboration under Government Incentives. Int. J. Innov. Comput. Inf. Control. 2024, 20, 1449–1461. [Google Scholar]
Figure 1. The conceptual diagram of the three-party game.
Systems 13 00610 g001
Figure 2. The evolutionary phase diagram for older adults.
Systems 13 00610 g002
Figure 3. The evolutionary phase diagram for older platforms.
Systems 13 00610 g003
Figure 4. The evolutionary phase diagram for government.
Systems 13 00610 g004
Figure 5. Three-Dimensional phase plot.
Systems 13 00610 g005
Figure 6. Dynamic analysis of sensitivity graphs: (a) Sensitivity analysis for trust coefficient; (b) Sensitivity analysis for government subsidy; (c) Sensitivity analysis for health benefit; (d) Sensitivity analysis for platform optimization cost.
Systems 13 00610 g006
Figure 7. Policy simulation and scenario comparison (a) Comparison of Subsidy vs. No-Subsidy Policies; (b) Comparison of Low vs. High Trust Environments.
Systems 13 00610 g007
Table 1. Three-party game payoff matrix.
(EE, PP, GG)Older Adults Earnings (UEE)Platform Earnings (UPP)Government Earnings (UGG)
(A, HQ, S) δ b 1 + α x + ρ c R 1 + λ / 2 c p + g 1 + β θ 1 + α x c g
(A, HQ, NI) δ b 1 + α x + ρ c R 1 + λ / 2 c p θ 1 + α x
(A, LC, S) 1 δ b 1 + α x c R λ c p / 2 + g 1 + β θ 1 + α x c g
(A, LC, NI) 1 δ b 1 + α x c R λ c p / 2 θ 1 + α x
(NA, HQ, S)0 c p + g 1 + β λ R / 4 c g
(NA, HQ, NI)0 c p λ R / 4 0
(NA, LC, S)0 g 1 + β λ R / 8 c g
(NA, LC, NI)000
Table 2. The stability analysis of key equilibrium points.
Equilibrium PointStability ConditionsEigenvaluesMeaning
(0,0,0) c > 1 δ b 1 δ b c , c p , c g Stable: Low adoption, low optimization, no incentive; the system falls into a degenerative cycle.
(1,0,0) c > 1 δ b 1 δ b c , c p , c g Unstable: Adoption without optimization; low trust undermines sustainability.
(0,1,0) 1 δ b c > 0 1 δ b c , 2 c p , c g Unstable: Optimization without adoption; high cost drives platform to cut quality.
(0,0,1) c > 1 δ b 1 δ b c , c p , c g Unstable: Subsidy without adoption; high cost leads to withdrawal of support.
(1,1,0) δ b c < 0 δ b c , 2 c p , c g Unstable: Adoption and optimization without subsidy; high platform cost weakens sustainability.
(1,0,1) c > 1 δ b 1 δ b c , c p , c g Unstable: Adoption and subsidy without optimization; trust deficit undermines uptake.
(0,1,1) 1 δ b c > 0 1 δ b c , 2 c p , c g Unstable: Optimization and subsidy without adoption; high cost destabilizes system.
(1,1,1) δ b c > 0 , g > c p , θ > c g δ b c , c p , c g Stable: High adoption, high optimization, continuous subsidy; the system reaches a virtuous cycle.
Disclaimer/Publisher’s Note: The statements, opinions and data contained in all publications are solely those of the individual author(s) and contributor(s) and not of MDPI and/or the editor(s). MDPI and/or the editor(s) disclaim responsibility for any injury to people or property resulting from any ideas, methods, instructions or products referred to in the content.

