Abstract
This study investigates the evaluation of housing policies for migrants in China, focusing on the interplay between rental and purchase decisions under the rent-and-purchase policy (RPP) framework. Employing a system dynamics model, we simulate migrant housing choices from 2001 to 2023 and forecast market trends from 2024 to 2030. The results indicate that RPPs significantly improve housing quality and reduce costs for migrants by mitigating institutional disparities and market distortions. Scenario analyses demonstrate that a coordinated approach combining supply-side interventions (e.g., affordable housing expansion) with rights-based policies (e.g., equalizing renter and buyer rights) effectively balances affordability and demand stability. The findings emphasize the critical role of addressing rights inequalities and advocate for a holistic policy framework to tackle migrant housing challenges, offering actionable insights for policymakers in system science and urban planning.
1. Introduction
Internal migrants (hereafter referred to as “migration”) have long been a distinct social group in China. Due to ongoing disparities in economic growth across different regions of the country, some people choose to relocate from their hometowns to wealthier cities in search of higher incomes and better living conditions. However, the household registration system, known as hukou, creates a difference between where they are officially registered to live and where they actually reside. These individuals are referred to as “the floating population” [1].
China’s hukou system, as a basic administrative system, is based on registering citizens as “permanent residents” in a specific area based on their birthplace and family background, and it is usually divided into “agricultural households” and “non-agricultural households” (although the latter designation is gradually being reformed). This registration is directly linked to the public services and social welfare system provided by local governments. For example, migrants whose registered hukou location is in other provinces often find it difficult to enjoy the same social welfare, such as education and medical care, as local permanent residents due to institutional restrictions [2,3,4]. They are also often subject to invisible discrimination in daily activities such as employment and social interaction, which also causes major difficulties for migrant workers in their daily lives [5,6].
For many years, migrants have formed a significant portion of China’s population. According to the Seventh National Population Census, published in 2020, China’s migrant population has reached 376 million people, making up 27% of the total population (as illustrated in Figure 1 (Data Source: National Bureau of Statistics. https://data.stats.gov.cn/ (accessed on 18 March 2025))). The steady rise in migration has intensified the strain on land resources in regions experiencing an influx of people, with one clear outcome being the persistent increase in housing costs [7]. For example, consider Beijing, a city that attracts a large number of migrants. Data from the National Bureau of Statistics and the Beijing Statistical Yearbook show that, in 2022, the house price-to-income ratio—calculated based on construction area—stood at 17.71, a level regarded as high by international standards.
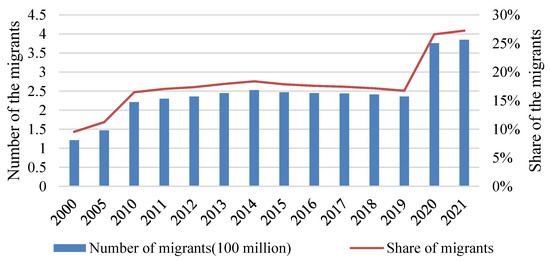
Figure 1.
Trends of migrants during 2000–2021 in China.
However, in practice, whether or not an immigrant owns a house with independent property rights in the local area has become a prerequisite for determining whether he or she can obtain a household registration. This institutional requirement has in fact driven a large influx of migrants into the commercial housing market, leading to an institutional distortion of demand in the rental and housing markets, causing premiums introduced by property rights, and thus resulting in a high rental-to-purchase ratio (i.e., the ratio of housing prices to rent).
High housing property premiums have posed a huge challenge to low-income and low-education migrants in purchasing houses in the places they migrate to. Coupled with the lack of local public rights and interests and the existence of hidden discrimination, the migrant population has increased its willingness to stay for a long time. The lack of ability and willingness to stay has caused these residents to face low-quality living conditions for a long time and to lack the motivation to improve their living conditions, which has led to serious housing problems for the migrants [8,9,10,11]. Compared to the local population, migrants are suffering more severe housing challenges [12]. According to the 2018 China Migrants Dynamic Survey (CMDS), approximately 61% of China’s migrants face housing issues to varying degrees, with the average housing expenditure for local residents being approximately 1.38 to 4.88 times that of migrants’ average housing expenditure (considering that the housing market is open to permanent residents and migrant workers under the same conditions, the difference in housing consumption expenditure actually represents the difference in housing quality between the two). Addressing the housing issues of migrants, whose number is more than a quarter of total population, should become one of China’s key development goals for the future.
Therefore, the Chinese government has introduced a series of policies aimed at addressing the housing challenges faced by migrants. Proposed by the Chinese government in 2016, rent-and-purchase policies (RPPs) seek to safeguard renters’ interests by promoting the development of the rental market, offering a diverse array of rental housing options, and diminishing the connection between housing ownership and access to public services. The policies aim to (a) support residents who have the ability to purchase housing to purchase commercial housing; (b) support residents who do not have the ability or willingness to purchase housing to rent housing through the rental housing market; (c) ensure the basic housing needs of eligible low-income families with housing difficulties by providing public rental housing or issuing rental subsidies. A key aspect is the effort to gradually decouple access to public services from homeownership, meaning a family holding a long-term rental contract might gain similar rights to enroll their children in local schools as a family who owns their home in the same area. These policies have effectively enhanced the living conditions of migrants, who usually choose renting as their primary mode of residence, alleviating the housing difficulties of migrants and attracting significant attention from the academic community [13].
Existing research has examined the policy effects of RPPs from multiple perspectives. For instance, Guo et al. and Chen et al. have investigated the interactive relationship between RPPs and urban housing prices based on adaptive expectation theory and agent-based modeling, respectively [13,14]. Lou et al. [15], using the fsQCA method, discovered the role of RPPs in alleviating disparities in public services. Overall, RPPs, by continuously promoting equal rights for renters and purchasers [15], have reduced the additional value of housing ownership due to institutional discrimination combined with housing property rights [16], increased housing value, and lowered perceived risks [17]. Therefore, RPPs have altered renting and purchasing habits and have promoted an improvement in the housing quality for migrants.
In the real estate sector, scholars have been applying system dynamics methods to urban economics research since the last century [18]. Specifically within real estate, system dynamics is widely used in areas like property development [19], business cycles [20], and asset pricing [21]. As a widely used policy analysis tool [22], system dynamics is also broadly applicable to analyzing policies related to the housing market [23]. These studies primarily cover topics such as the impact of fiscal investment on the supply of green buildings [24], emergency management during COVID-19 [25], and the effects of tax and pre-sale policies on the real estate market [26]. Therefore, when studying RPPs, this paper selects the system dynamics model as the baseline research tool to capture nonlinear behavior within the system.
Upon reviewing the existing research, we have identified the following key deficiencies: (i) existing studies merely highlight a linear relationship between policies and housing prices, with a relatively insufficient exploration of the underlying mechanisms; (ii) few studies establish a connection between RPPs and the housing decisions of migrants; (iii) there is a notable absence of a quantitative analytical frameworks for RPPs to investigate optimal pathways for future policy development. Our study conceptualizes the relationship between RPPs and the housing choices of migrants as a complex system, innovatively employing system dynamics as an analytical tool to capture the nonlinear interactions among various economic variables, and ultimately exploring the evaluation of diverse policy instruments within the rent-and-purchase framework through policy scenario simulations.
Our study is structured as follows: Section 2 primarily discusses the inter-relationship of migrants and the housing market, providing a rationale for employing a systematic approach to identify optimal policy pathways. Section 3 introduces the model framework and model assumptions. Section 4 presents the model baseline results. Section 5 details the simulation results under various policy scenarios. Section 6 provides policy suggestions and conclusions.
2. System Dynamics and Housing Issue
Under the current policy context, among China’s migrants, renters and homeowners often enjoy different rights to public services. For a long time, access to public services in China has been closely tied to housing ownership. On one hand, higher-quality public services—such as education, social security, and community participation—often require housing ownership. On the other hand, local housing ownership is also one of the key conditions for migrants to obtain local hukou registration.
The inequality in social public services between renting and buying has, in fact, led to a premium on housing ownership [27]. Migrants, in pursuit of access to public services, has flooded the housing purchase market, distorting the reasonable allocation relationship between rental and purchase demand, and consequently leading to the failure of the price allocation mechanism. As can be seen from Figure 2 (data source: Fangchan.com. Survey report on purchase to rent ratio of key 50 cities in the first half of 2024. http://m.fangchan.com/data/13/2024-08-08/7227136331791798861.html (accessed on 20 March 2025)), before the cooling of the housing purchase market in 2024, China’s rent-to-price ratio (also known as annual rental yield) had been on a declining trend.
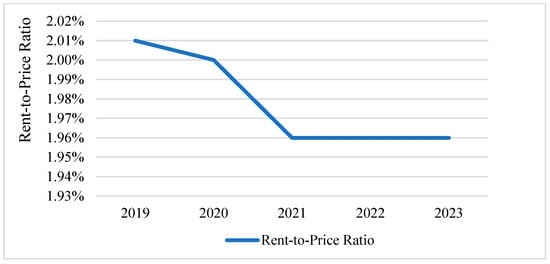
Figure 2.
The distortion of the Chinese housing market during 2019–2023.
Therefore, the high threshold for purchasing houses and the relative lack of public services in the rental market have jointly led to a decline in migrants’ ability and willingness to improve their situation in the rental market, resulting in a relative insufficiency of demand and, consequently, the occurrence of housing problems. To address the housing issue, it is important to take those premiums of housing property rights into consideration to fix the distortion of demand.
However, the housing problem of migrants is an issue of social equity and economic development. Effectively addressing the housing problem of migrants not only pertains to enhancing overall standards of living and achieving inclusive growth but also constitutes a critical measure for ensuring regional labor supply and promoting long-term economic stability and growth. As a key variable in the modernized economy, the housing demand of migrants is subject to multiple influences, including the labor market, regional economic development levels, and the social security system. Consequently, analyzing the housing issue of migrants using traditional linear thinking often reveals its limitations. In contrast, complex system methods integrates numerous interacting components into a unified analytical framework, exhibiting characteristics such as holism, dynamism, and emergence, thereby serving as a vital approach for studying the migrant housing problem. Therefore, this paper employs a systematic approach to analyze the housing issue of migrants.
System dynamics is a structured methodology for studying the dynamic behavior of complex systems [28]. Its fundamental principle is that the constituent elements within a system are not independent but interact through feedback loops, which can be either reinforcing loops that amplify change or balancing (regulating) loops that counteract change. The methodology focuses on the dynamic relationships between “stocks” (accumulative variables such as housing stock and population) and “flows” (the rates that change these stocks), as well as the impact of various time delays on system behavior [29,30]. By constructing mathematical models and utilizing computer simulation techniques, system dynamics aims to reveal how a system’s internal structure drives its patterns of evolution over time and to analyze the potential long-term impacts and unintended consequences of different strategies or interventions.
System dynamics offers a powerful approach to analyzing complex systems, utilizing key modeling elements like stocks, flows, feedback loops, and time delays to capture the dynamic behavior of phenomena such as the real estate sector [28,29]. Unlike traditional macroeconomic models that often rely on simplifying linearization assumptions and struggle with intricate problems, system dynamics excels at handling dynamic, nonlinear, and time-lagged relationships [31]. This makes it particularly suitable for real-world applications, where complexity is inherent [18,32]. Moreover, system dynamics research emphasizes a strong connection to practical applications, employing actual data for model calibration to generate scenarios and conclusions that are both realistic and practically relevant.
The system dynamics model categorizes various influencing factors and economic variables into multiple subsystems and examines the interactive relationships between these subsystems and variables within a single system. This approach effectively captures the holistic, dynamic, and nonlinear characteristics of the problem, establishing it as an essential method for investigating complex system issues. Leveraging feedback loops and time delay mechanisms, the system dynamics approach can effectively simulate the dynamic interaction processes among population migration, housing supply, policy interventions, and economic output, rendering it particularly well-suited for policy simulation processes. Based on the foregoing analysis, this paper adopts the system dynamics approach to investigate the appropriate path for resolving the migrant housing issue.
3. Model Development and Parameter Configuration
3.1. Model Introduction
We used Vensim PLE 10.2to build a system dynamics model in the real estate field to simulate the real estate market and conduct policy analysis [33]. Building upon the foregoing discussion, this paper develops a system dynamics model composed of an economic factor subsystem, a population dynamics subsystem, a commercial housing market subsystem, and a rental housing market subsystem.
The relationships among the subsystems are illustrated in Figure 3. Economic growth influences the supply of commercial housing, while commercial housing transactions, in turn, promote economic growth (feedback loop 1, F1). There exists a complex price equilibrium relationship between the commercial housing market and the rental housing market (F2). Economic growth drives population mobility, which in turn generates new housing demand and impacts economic growth through both the rental and commercial housing markets (F3 and F4). This model aims to simulate the intricate interplay between the housing market and population mobility and to analyze the dynamic mechanisms through which external policy interventions influence the residential choices of the migrant population.
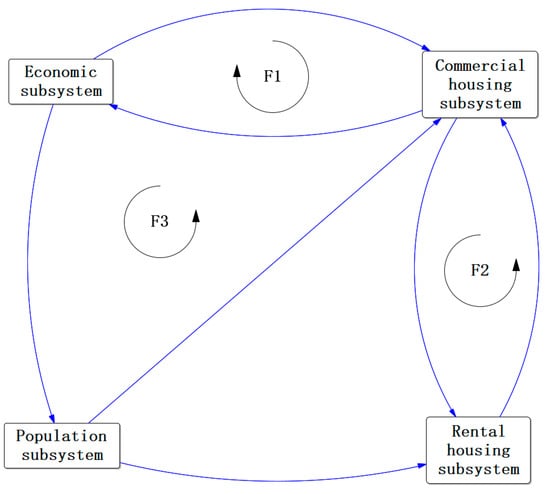
Figure 3.
Causal links between subsystems.
3.2. Development of the Causal Loop Diagrams
Figure 4 primarily depicts the operational logic of the causal loops related to GDP. The GDP measured by the output method is actually the sum of all output within the economy. Considering that our research is mainly focused on the real estate market, for the sake of simplicity, we assume, based on the potential output theory [34], that the GDP growth of the region is determined by the endogenously determined real estate output value and the exogenously given GDP potential output who is independent from the real estate market. Based on this assumption, GDP growth in this model mainly depends on two factors: latent GDP growth rate and the commercial house sales value. The GDP growth automatically translates into the GDP for the next period (reinforcing loop, R1), which determines the GDP per capita and further stimulates the growth of real estate development investment based on the input–output theory proposed by Leontief [35]. Through this subsystem, we can link economic growth with the housing market, achieving the long-term sustainable development of the economy.
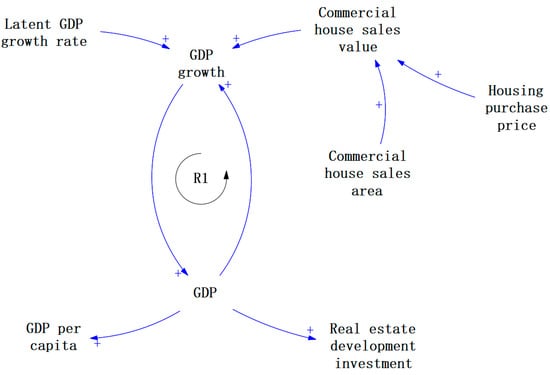
Figure 4.
Causal Loop Diagram of Economic Factor Subsystem.
Figure 5 mainly illustrates the causal feedback mechanisms within the population subsystem. In this model, population growth is primarily driven by two factors: natural population growth occurring at an exogenous rate and net migration influenced by the income disparity between the local area and the national average [36]. Notably, the local average income is primarily determined by GDP per capita, thereby linking the economic and population loops. The growth of the natural population and migrants ultimately translates into new housing demand in different forms. Migrant population growth is allocated between the rental and purchase housing markets based on rent–purchase decisions (to be discussed further later), while the local natural population growth, influenced by socio-cultural factors, primarily opts to purchase commercial housing due to intergenerational decision making caused by Chinese culture [37].
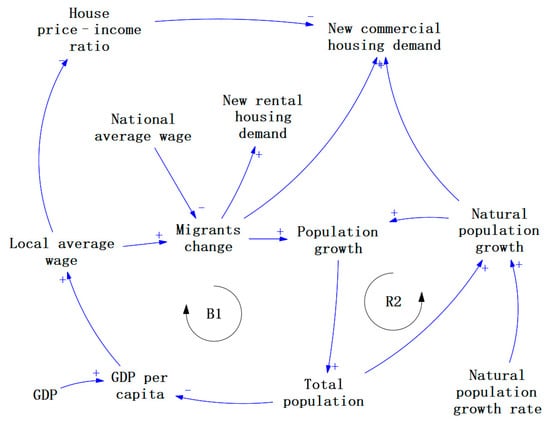
Figure 5.
Causal Loop Diagram of Population Dynamics Subsystem.
Figure 6 illustrates the key dynamics within the rental housing subsystem. It represents the market equilibrium between supply and demand. The unmet demand and supply in the market determine the supply–demand ratio, which in turn influences the rental housing price [38,39]. The rental price, together with the housing purchase price, affects the rent-to-price ratio. This ratio, along with the rent–purchase social security ratio—which reflects the disparity in housing benefits between renting and buying—influences rent–purchase decisions, just as we discussed in Section 1. These decisions regulate the distribution of housing demand from the migrants between the commercial housing market and the rental housing market, resulting in new rental housing demand (balancing loop, B5). At the same time, the rent-to-price ratio also promotes the conversion of latent rental housing supply into new housing supply, together with affordable rental housing supply as a part of social security policies, forming a supply-side feedback loop (B4). The deal of rental houses is jointly determined by rental housing demand and supply, with realization loops closing for both demand (B3) and supply (B2).
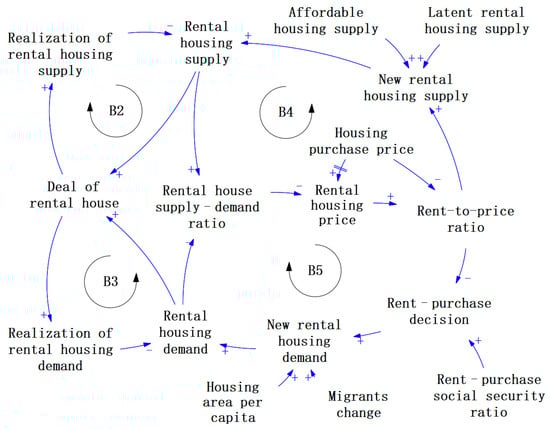
Figure 6.
Causal Loop Diagram of the Rental Housing Market.
Figure 7 shows the commercial housing market’s dynamics, involving interconnected supply, demand, and price factors. Similarly to the rental housing market, unmet demand and supply in the commercial housing market determine the market supply–demand ratio. On one hand, the supply–demand ratio influences the proportion of GDP allocated to real estate investment, which ultimately contributes to new commercial housing supply and creates a feedback regulation on the supply side (B6) [35]. On the other hand, according to the cost-plus pricing theory [40], the market supply–demand ratio and housing construction costs affect housing purchase prices. These prices, in turn, influence new commercial housing demand through two channels: (a) Increased price is expected to reduce the rent-to-price ratio given the purchase price is unchanged, thereby crowding out demands towards the rental market. (b) Increased price may also increase the house price–income ratio, suppressing housing demand directly [41]. Together, these form feedback loops on the demand side for commercial housing (B7, B8). The commercial house sales area is jointly determined by commercial housing demand and supply, with realization loops closing for both demand (B10) and supply (B9).
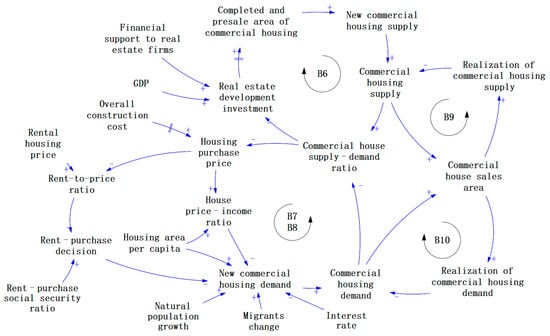
Figure 7.
Causal Loop Diagram of the Commercial Housing Market.
The whole causal loop diagram can be found in Figure 8. The central driving force of this causal loop diagram is regional economic growth, which influences the real estate market through two main pathways. On the supply side, economic growth incentivizes real estate enterprises to increase investment, thereby expanding the supply of new housing. On the demand side, economic prosperity raises residents’ average wage levels and attracts an external population, jointly boosting population growth and housing demand. Local governments employ comprehensive measures, such as the supply of affordable housing and adjustments to rental and purchase rights, to leverage the transmission pathways of supply–demand relationships and prices. These interventions guide rent–purchase decisions in the housing market and optimize the structure of living costs to achieve regulatory objectives.
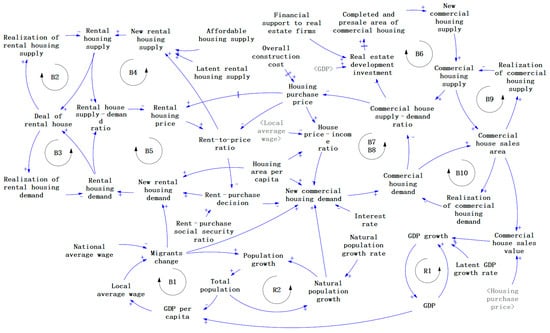
Figure 8.
Causal Loop Diagram of the System Dynamics Model.
It is worth noting that the core variable in this model, the rent–purchase decision, primarily controls the allocation of new demand—arising from population growth—between the housing purchase market and the rental market. In this paper, this proportion is mainly influenced by two factors: the rent–purchase ratio and the rent–purchase social security ratio. The former primarily measures the allocation mechanism between the two markets based on their relative price mechanisms, a hypothesis established on the substitutability of housing commodities in the rental and commercial housing markets. The latter mainly measures the distortion of the price mechanism caused by public service rights associated with housing property ownership. Based on the theory we proposed in Section 1, a higher rent–purchase social security ratio is more likely to lead to resources flowing into the commercial housing market, resulting in a greater distortion of the price mechanism.
The core policy output variables in this paper include (a) the actual prices in the rental market and the housing purchase market, which primarily measure the absolute living costs for migrants; (b) the rent-to-price ratio, which mainly measures the degree of price distortion between the rental market and the housing purchase market; (c) the migrants’ average rental area per capita, which primarily measures the extent of improvement in housing quality for migrants; and (d) the rent–purchase decision index, which mainly measures the extent to which the introduction of policies can correct the demand allocation mechanism between the housing purchase market and the rental market.
3.3. Development of the Stock and Flow Diagram
Figure 9 illustrates the system dynamics flow diagram designed for this system. The model’s core stock variables encompass (i) GDP, (ii) total population, and (iii) the supply and demand of housing purchase/rent, corresponding to subsystems including (i) the economic subsystem, (ii) population subsystem, (iii) housing purchase subsystem, and (iv) rental housing subsystem. Variables associated with changes in these stocks are treated as flow variables. The feedback loops within and between these subsystems are consistent with those shown in the CLDs. However, in order to quantify the relationships among variables, we introduced necessary constants and coefficients in the Stock and Flow Diagram. For clarity and simplicity, some constants, which only appear in the equations and do not participate in the feedback loops, are omitted in the figure but are reflected in the subsequent equations.
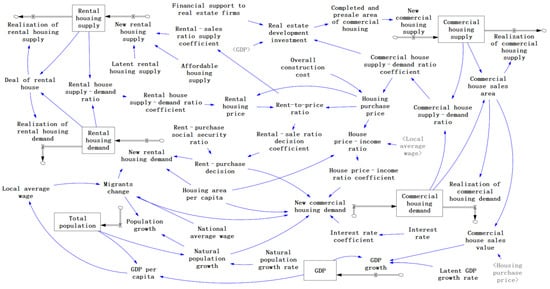
Figure 9.
Stock and Flow Diagram of the System Dynamics Model.
3.4. Data Source and Equation Formulation
In this study, we developed a model to simulate the housing choices of migrants under the context of RPPs. Constrained by data availability, the simulation period was set from 2001 to 2023, spanning 23 years. Using a system dynamics model of migrant residential decision making, we attempted to forecast the commercial housing market and the rental housing market from 2024 to 2030. Additionally, we adjusted model parameters to simulate the effects of policy implementation and provided recommendations for future policy formulation based on the simulation results.
To ensure the model’s accuracy, we utilized official data from the National Bureau of Statistics of China (NBS) and the China Real Estate Statistics Yearbook. We employed methods including trend extrapolation, mathematical deduction, and panel data regression analysis to calibrate the relationship among variables within the model. The data sources are detailed in Table 1.

Table 1.
Definition of the Variables and Datasets.
Stock variables are variables in the system that describe the accumulation effect and serve as the foundation for characterizing the system states and behaviors. These stock variables require initial values at the onset of the simulation. In this study, we utilize data from the National Bureau of Statistics of China and the China Real Estate Statistics Yearbook to set the initial values for the stock variables. Specifically, the total population and gross domestic product (GDP) are initialized using the corresponding actual statistical data from Guangdong Province at the base period. For rental–purchase market supply and demand, initial values were derived through backward calculation based on conversion relationships between actual economic indicators and housing demand/supply, following the methodology established by Mou et al. [26]. The initial values for each variable are detailed in Table 2.
Table 2.
Basis for Setting Initial Values.
Flow variables are the core elements that drive the dynamic state transitions in the system, quantifying the rate of change in stock variables per unit of time. By connecting a wide range of external auxiliary variables, the system’s complex dynamic behavior is shaped. The variation in flow variables directly determines the overall system’s behavioral patterns, such as growth, decline, or oscillation. In this paper, we formulate flow variables through an integrated approach combining fundamental mathematical equations with econometric modeling frameworks.
The Vensim equations between stock variables and flow variables are listed in Table 3.
Table 3.
The Vensim Equations for Stock Variables and Related Flow Variables.
The relationships between auxiliary variables were established through panel econometric modeling and time-series analysis techniques. During the fitting process, various functional forms were tested, including linear regression, models incorporating lagged variables, and polynomial regression. Ultimately, the model with the best fit was selected for subsequent simulation analysis. The equations governing the auxiliary variables are presented in Table 4 and the coefficient and constant variables are shown in Table 5.
Table 4.
The System Dynamics Equations for Auxiliary Variables.
Table 5.
The Coefficient and Constant Setting.
Table functions serve as specialized functional tools in system dynamics to characterize nonlinear relationships between variables. These functions enable the quantification of qualitative associations within a model in a simple and intuitive way, such as the impact factor of the housing supply/demand ratio and the price-to-income ratio coefficient. The following section will provide a detailed explanation of the primary table functions utilized in the model.
The income distribution of migrant populations typically exhibits a pronounced pyramidal structure, dominated by low-income cohorts with diminishing higher-income tiers. Furthermore, given the inherent price inelasticity of housing demand, housing prices exert nonlinear and marginally decreasing effects on demand elasticity. This arises because, as housing prices rise, lower-income groups will be the first to be affected by demand crowding-out due to affordability constraints. Consequently, when the price-to-income ratio is relatively low, significant crowding-out effects on new housing demand occur. As the ratio increases, its impact extends progressively to higher-income groups. The size of these higher-income groups tends to decline with price growth, leading to a crowding-out effect that exhibits a marginally decreasing pattern. Such characteristics are commonly observed in the influence of price variables on housing demand.
Building on this analysis, we implement table functions to describe the interaction among variables. These table functions are designed to capture the feature whereby the impact on actual economic variables exhibits marginally decreasing returns as the magnitude of influencing factors increases. The specific configurations of these table functions are elaborated in Table 6.
Table 6.
Table function (graphical inputs) in the system dynamics model.
3.5. Validation Test
3.5.1. Dimensional Analysis Test
To ensure the internal consistency and credibility of the model, a dimensional analysis test was conducted using Vensim’s built-in unit check feature. This test verifies that all variables and equations maintain consistent units across the entire model structure. The results confirmed that the equations are dimensionally balanced, with all units matching appropriately. This validation step reinforces the reliability of the model’s formulation and ensures that simulation outcomes are based on logically sound relationships.
3.5.2. Relative Error Test
The validation of the system dynamics model is assessed by comparing the simulation results with actual historical data over various time periods [28,43]. To quantify this comparison, we calculate the relative error between the simulated and actual values for each time period, thereby evaluating the model’s consistency with empirical data. The formula for the relative error is as follows:
In the formula, denotes the -th variable in the system, represents the total number of variables, and denotes the year. The term indicates the relative error of the -th variable, where is the simulated value of the -th variable at time , and is the actual value of the -th variable at time . It is generally accepted that if the absolute value of the relative error is less than or equal to 5% for more than 70% of the variables, and the absolute value of the average error across all variables remains within 10%, the simulation results of the model are deemed to possess high credibility [44]. This paper examines two key indicators: regional gross domestic product (GDP) and total population. The actual values, simulated values, and corresponding errors for these indicators from 2001 to 2023 are presented in Figure 10 and Figure 11, respectively.
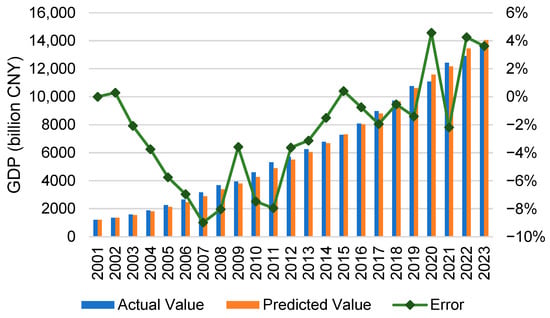
Figure 10.
Comparison Between Simulation Results and Actual Values of Regional GDP.
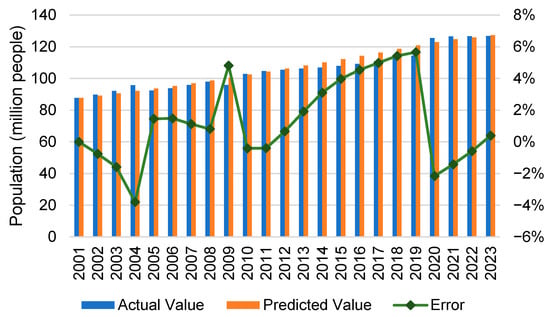
Figure 11.
Comparison Between Simulation Results and Actual Values of Population Size.
From Figure 10 and Figure 11, it can be observed that the average relative errors between the actual and simulated values for regional gross domestic product (GDP) and total population are 3.60% and 2.24%, respectively. Furthermore, the number of variables with an absolute relative error within 5% constitutes 82.6% of the total variables, exceeding the empirical threshold of 70%. Additionally, the absolute average error across all variables remains within 10%. Consequently, the model successfully passes the validity test.
While these aggregate metrics indicate a good fit, it is important to acknowledge that any economic model, including this system dynamics model, serves as an approximation of a complex macroeconomic system. Such systems are influenced by a multitude of variables, not all of which can be feasibly captured or perfectly controlled within a model structure. Unmodeled factors such as external shocks and changes in industrial structure are hardly to be controlled in a highly simplified system dynamics model, which can lead to deviations, and potentially even patterns in errors for specific variables like GDP, as the model may primarily focus on certain facets of economic operation due to complexity constraints.
Taking China as an example, since its accession to the World Trade Organization (WTO) in 2003, the Chinese economy has experienced a period of rapid growth often referred to as the “Chinese Miracle”. In a system dynamics model that only considers a closed economy, it is understandably difficult to capture the strong driving effects of such exogenous events on economic growth. This limitation is reflected in our model’s persistent underestimation of GDP between 2003 and 2014. However, the primary purpose of employing a system dynamics model in this study is to provide a quantitative assessment of policy implementation effects, rather than to precisely forecast the trajectory of macroeconomic variables. Therefore, we consider a certain degree of deviation in economic variable predictions to be acceptable. Moreover, the gap between the predicted value and real regional GDP notably narrows after 2015, and we believe it does not significantly affect the subsequent analytical results. Nevertheless, we acknowledge that the question of how to incorporate changes in the external economic environment into this modeling framework remains an important direction for future research.
3.5.3. Extreme Condition Test
The core objective of the extreme condition test is to verify whether the model’s output variables aligns with theoretical expectations and fundamental scientific principles when input parameters are set to critical thresholds [29,43]. This test is conducted by artificially imposing extreme boundary conditions, such as adjusting a key parameter to its upper or lower limit within the physically feasible domain (i.e., extreme values), to systematically observe the dynamic evolution of the model’s internal states. In this paper, we primarily perform an extreme value test on the supply of commercial housing by reducing it to half of its original level (because when the housing supply is strictly equal to 0, demand alone will not generate any transaction orders in the market, and the housing market will not work), in order to examine the changing trends in both the commercial housing market and the rental housing market. The specific results of this test are presented in Figure 12.
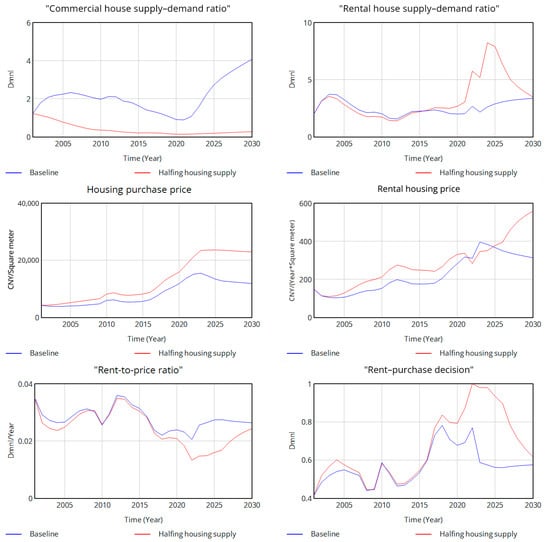
Figure 12.
Trends in Core Variables.
There is no doubt that, with market demand remaining unchanged, a reduction in housing supply will cause the supply–demand ratio in the market to decline rapidly and remain low throughout the simulation period. This leads to a housing shortage, which in turn continues to drive up market prices. As the rent-to-price ratio adjusts, the excess housing demand spills over into the rental market, causing the supply–demand ratio in the rental market to decline in the short term. Influenced by the high price of commercial housing, the rent-purchase decision ratio continues to rise, reaching a peak close to 1 in 2022, indicating that all migrants choose to rent rather than buy.
However, in the long run, as population and GDP growth slow down and the housing price-to-income ratio continues to rise, more local residents begin to migrate to other regions. This leads to a decline in the total population and a corresponding decrease in housing demand. As a result, the growth of housing prices begins to stabilize. Meanwhile, rental prices continue to rise due to the lagged effects of price stickiness, which attracts some demand back from the rental market to the housing market. This shift gradually drives the relevant economic variables toward a new equilibrium. These dynamics align with economic intuition and demonstrate the model’s strong explanatory power in capturing the dynamic behavior of the real estate market.
3.5.4. Sensitivity Analysis
Given that the estimated parameter settings in the model may deviate to some extent from their true values, examining the degree to which changes in the parameter values of key model variables affect the model’s results can validate its effectiveness and robustness to perturbations [29].
This paper primarily focuses on the rental housing decisions of migrants. Therefore, the sensitivity analysis concentrates on the coefficients related to migration-related variables and rental price-related variables. While keeping other parameters unchanged, the mean and variance of the migrants change coefficient and rental price coefficient obtained from panel regression were incorporated into the model for Monte Carlo simulations to observe their impact on migrants’ rent-or-buy decisions. The detailed settings for the SA are shown in Table 7.
Table 7.
Setting of Sensitivity Analysis in the System Dynamic Model.
The results of the SA are shown in Figure 13. The shaded areas in the figure represent the distribution ranges of the model outputs under 50%, 75%, 95%, and 100% confidence levels. Overall, the model demonstrates strong robustness to parameter perturbations across most of the simulation period, as indicated by the relatively narrow confidence intervals. This suggests that the model’s conclusions remain stable under minor variations in key parameters. Around the year 2018, as the rent–purchase decision values increased significantly, the confidence intervals also widened accordingly, indicating greater sensitivity and higher uncertainty during periods of decision shifts. Nevertheless, even during such volatile phases, the overall trends and core conclusions of the model remain consistent, reflecting the structural robustness and reliability of the results.
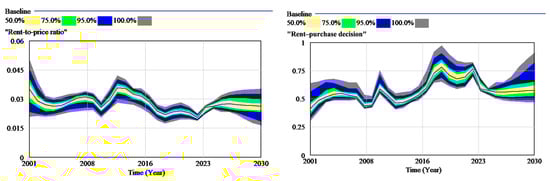
Figure 13.
Sensitivity Analysis of the System Dynamics Model.
4. Results
4.1. Policy Scenario Setting
The parameters of the variables in the Guangdong real estate economic system constructed in this paper are derived from estimates based on economic data from 2001 to 2023. Additionally, it is assumed that during the period from 2024 to 2030, the overall economic conditions remain unchanged, and the Guangdong provincial government does not implement any additional regulatory policies. This assumption allows for the prediction of the future development of the rental and purchase housing markets under a baseline scenario.
This paper establishes two policy scenarios for simulation: enhancing the protection of equal rights between renters and property owners and increasing the supply of affordable housing. Enhancing equal rights between renters and property owners can reduce institutional disparities in social entitlements by granting tenants the same or similar social security benefits as homeowners, thereby reducing the disparity in entitlements caused by institutional factors. This diminishes the additional value of public services associated with property ownership, thereby encouraging a shift in housing demand among migrants from purchasing to renting, ultimately strengthening their propensity to rent. Increasing the supply of affordable housing can regulate the rental market equilibrium by introducing a substantial volume of low-cost housing units, thereby reducing the prices of rental housing for migrant populations and naturally steering more migrants toward choosing rental housing through market-driven price mechanisms.
4.2. Baseline Results
As illustrated in Figure 14, influenced by the 2018 housing boom and real estate destocking policies, the supply in the housing market was continuously declining until 2022. However, with the sustained implementation of policy measures aimed at stabilizing the real estate market, the housing supply is expected to gradually recover in the coming years. On the demand side, factors such as declining fertility rates and slowing population growth have led to a sustained decrease in housing demand since 2020, reaching a projected low in 2025, followed by a gradual rebound.
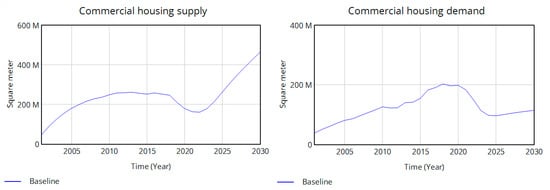
Figure 14.
Trends in Housing Supply and Demand.
As depicted in Figure 15, the rental housing market and the purchase housing market demonstrate significant interconnectedness: the decrease in the commercial housing market propagates to the rental market via potential housing stock, resulting in a continuous decline in rental supply until reaching a nadir in 2024. Subsequently, the rental supply enters a phase of slow and stable recovery. On the demand side, constrained by both the deceleration of natural population growth and the diminishing scale of cross-regional migration, the rental demand curve declines in parallel with the purchase market. This decreasing cycle persists until 2026, after which it gradually stabilizes.
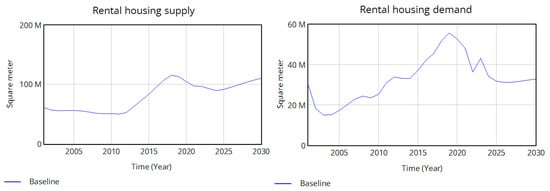
Figure 15.
Trends in Rental Housing Supply and Demand.
In terms of pricing, as illustrated in Figure 16, the rent-to-price ratio in the housing market fluctuates within the 0.02–0.03 range from 2020 to 2030. Further analysis indicates that, given the heightened sensitivity of commodity housing market prices to economic fluctuations, demand shocks tend to exert a relatively stronger influence on market prices. Consequently, the rent-to-price ratio exhibits a brief rebound following its low point in 2022, peaking at 0.027 in 2024, before resuming a gradual downward trend. The rent–purchase decision index peaks in 2022, subsequently declines as the rent-to-price ratio rises, and thereafter maintains a slow recovery around a value of 0.6.
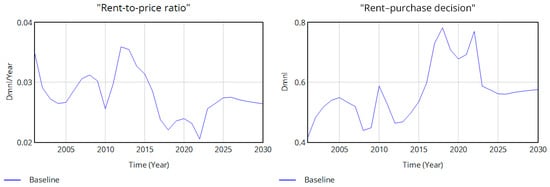
Figure 16.
Trends in price-to-rent ratio and rental housing decisions.
5. Policy Scenario Analysis
The main issue explored in this paper is as follows: what methods should policymakers use to correct market distortions caused by the premiums of public services, guide rental market prices to return to a reasonable range, reduce the actual housing costs of migrants, and stimulate their ability and willingness to improve their housing conditions? To facilitate our understanding of these issues, we have provided the parameter settings for various policy scenarios at the beginning of this paper in Table 8. More detailed explanations can be found in the corresponding sections of each policy scenario.
Table 8.
Setting of Policy Scenarios in System Dynamics Model.
5.1. Single-Policy Scenario
5.1.1. Policy Scenario 1: Strengthening Equal Rights for Renters and Buyers
In the model, the rent–purchase social security ratio is employed as a coefficient to describe the degree of equalization of public rights within the region. This scenario assumes that the government continues to advance the institutional framework for equal rights between renters and buyers and enhance rental rights protection. Depending on the intensity of policy implementation and resource allocation, three distinct policy efforts are considered. Specifically, it is assumed that under measures to strengthen equal rights, the rent–purchase social security ratio coefficient increases linearly from 0.7 in 2023 to 0.75, 0.8, and 0.9 by 2030. The simulation results are presented in Figure 17, Figure 18 and Figure 19.
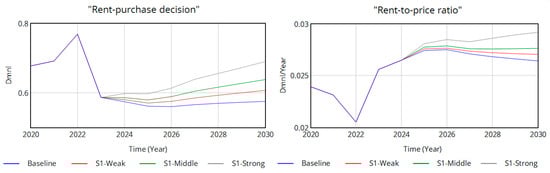
Figure 17.
Trends in Price-to-Rent Ratio and Rental Housing Decisions in Scenario 1.
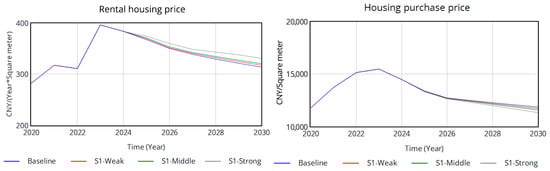
Figure 18.
Trends in Rental Prices and Purchase Prices in Scenario 1.
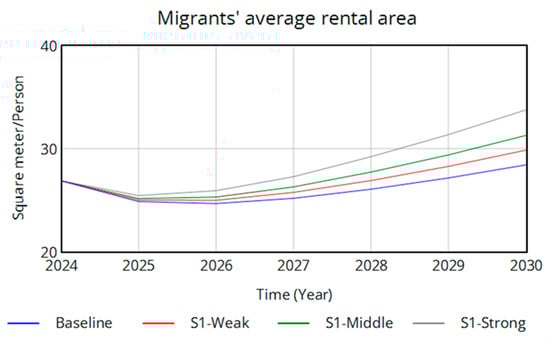
Figure 19.
Trends in Rental Housing Area per Migrant in Scenario 1.
The variation in the rent–purchase decision ratio exhibits a significant correlation with policy efforts. Under the three policy strengths, the rent–purchase decision ratio consistently increases after 2023, showing growths of 5.5%, 10.9%, and 20% relative to the baseline scenario in 2030. This trend indicates that strengthening equal rights for renters and buyers effectively encourages more residents to opt for renting, thereby achieving the intended policy objectives.
However, due to the relative decline in the value of additional rights associated with commodity housing, a portion of the migrant population, previously excluded by institutional barriers, shifts their housing demand from purchasing to renting. This transition leads to an increase in rental market demand, driving up the relative prices of rental housing. By 2030, rental prices are projected to rise by 1.1%, 2.1%, and 5.4% compared to the baseline scenario under the respective policy intensities. Conversely, the reduction in demand for purchasing results in a decrease in housing purchase prices of 1.1%, 2.3%, and 4.5% relative to the baseline. These dynamics are ultimately reflected in the rent-to-price ratio, which increases by 2.4%, 4.5%, and 10.3% compared to the baseline. This suggests that, under the current market mechanisms, while the enactment of rights-based policies effectively reduces the premium associated with property ownership and restores the rent-to-price ratio to a more reasonable range, it also leads to a relative increase in rental housing prices for migrants. This, in turn, may result in some loss of social welfare. Consequently, it may be necessary to coordinate supply-side and demand-side policies to mitigate this increased housing price pressure.
Under this scenario, the rights-based policy enhances renters’ willingness and affordability of long-term living by ensuring equal access to education, healthcare, and other public services. This, in turn, stimulates renters’ willingness to improve their living standards. The effect is evident in rental area per capita, with migrants’ average rental area in 2030 increasing by 5.0%, 10.0%, and 18.7% relative to the baseline under the three policy strengths. This trend demonstrates that the heightened desire for improved living standards encourages renters to opt for larger and better housing, thereby enhancing their overall quality of life.
In summary, strengthening equal rights for renters and buyers effectively increases the attractiveness of renting, leading more residents to opt for renting. The policy enhances renters’ rights protection, reduces the risks and uncertainties associated with renting, and thereby improves the relative utility of renting. By stimulating renters’ willingness and affordability, the policy leads renters to choose larger and more rights-secure housing, ultimately elevating their living quality and welfare. However, it is also important to note that because the “equal rights for renters and buyers” policy eliminates the implicit social welfare benefits associated with housing property ownership, it corrects the price distortion mechanism that arises from this. This can lead to a reflux of some demand from the housing purchase market to the rental market in both the short and long term, which in turn increases demand in the rental market, thereby causing an increase in the prices of rental housing. Therefore, when implementing such policies, more consideration should be given to the existence of this side effect, and other policies should be adopted to mitigate the upward pressure on rental prices.
5.1.2. Policy Scenario 2: Increasing Affordable Housing Supply
This scenario assumes that the government will enlarge its input of affordable housing projects via the construction of low-rent housing, public rental housing, and other forms of affordable housing. Depending on the intensity of policy investment, the annual supply of affordable housing is projected to increase by 25%, 50%, or 100% over the period from 2024 to 2030. The simulation results are presented in Figure 20, Figure 21 and Figure 22.
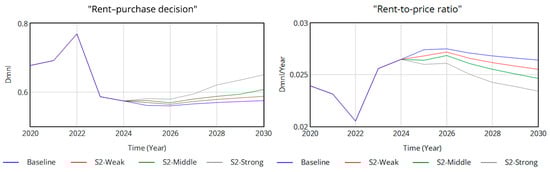
Figure 20.
Trends in Price-to-Rent Ratio and Rental Housing Decisions in Scenario 2.
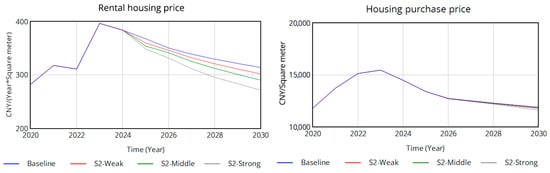
Figure 21.
Trends in Rental Prices and Purchase Prices in Scenario 2.
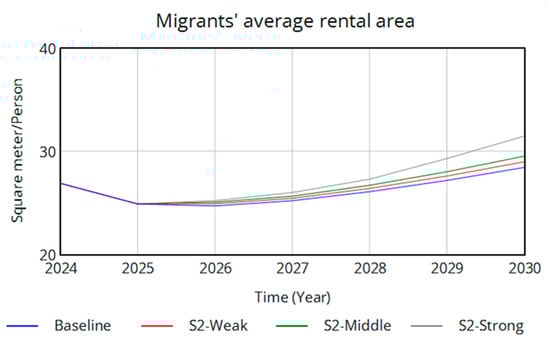
Figure 22.
Trends in Rental Housing Area per Migrant in Scenario 2.
In Scenario 2, the implementation of the affordable housing supply expansion policy increases the availability of rental housing, thereby reshaping the supply–demand dynamics of the rental market. This shift reduces rental housing prices for migrants and enhances their capacity to afford rental housing. As a result, under this policy scenario, the prices of rental housing in 2030 decrease by 3.8%, 7.5%, and 13.4% relative to the baseline scenario, while the rent-to-price ratio declines by 3.4%, 6.8%, and 11.3%, respectively. These findings confirm that the policy effectively meets rental market demand and reduces rental housing prices.
Moreover, the reduction in rental housing prices increases the utility of renting, influencing the micro-level housing decisions of migrants. This leads to a greater preference for renting, with the rent–purchase decision ratio rising by 2.1%, 5.5%, and 13.1% compared to the baseline scenario in 2030. As more migrants opt for the rental market, new demand in the housing purchase market diminishes. This alteration in the supply–demand equilibrium results in a slight decline in housing purchase prices.
The affordable housing supply policy, by lowering the prices of rental housing, enhances renters’ financial capacity to bear housing expenses, freeing up additional disposable income for investment in improved housing. This increased capacity enables renters to select larger housing units, while also improving the allocation of housing resources. This effect is evident in the average rental area per migrant, which rises by 1.9%, 3.9%, and 10.7% in 2030 relative to the baseline scenario. This trend suggests that the reduction in living costs unlocks demand for improved housing, encouraging renters to choose larger rental spaces and thereby enhancing their living quality.
The policy of increasing affordable housing supply effectively recalibrates the supply–demand balance in the rental market, reduces rental housing prices, and promotes a greater inclination toward renting among residents. Furthermore, through the transmission mechanism of demand equilibrium between the rental and purchase markets, it exerts a modest downward pressure on housing purchase prices. Collectively, these outcomes lower the overall housing costs for migrants, facilitate the realization of improved housing demand, enhance migrants’ living quality, and ultimately elevate residential welfare.
5.2. Combined-Policy Scenario
By applying a combination of regulatory policies, superior policy outcomes can be achieved. The policy goals of this paper are to guide residents into the rental market, maintain the rent-to-price ratio within a reasonable range, reduce the actual housing costs for migrants, enhance the quality of housing for migrants, and promote the long-term stable growth of the commodity housing market.
Considering the trade-off between policy implementation costs and policy outcomes, we design different policy intensity combinations under this combined scenario. These include (1) a strong affordable housing supply paired with a weak equal rights policy, (2) a balanced policy combination with both at middle levels, and (3) a strong equal rights policy combined with a weak affordable housing supply. The policy impact parameters are consistent with those in the preceding single-policy scenario simulations. It is expected that advancing the equal rights system will guide demand into the rental market while simultaneously increasing affordable housing supply to provide additional rental options. These policy combinations are expected to balance rental supply and demand, thereby reducing the prices of rental housing. The simulation results are presented in Figure 23, Figure 24 and Figure 25.
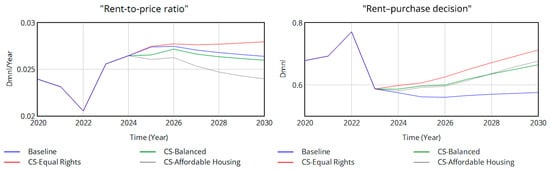
Figure 23.
Trends in price-to-rent ratio and rental housing decisions under combined policies.
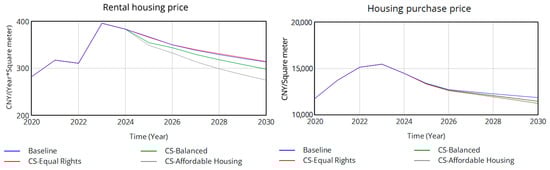
Figure 24.
Trends in rental prices and purchase prices under combined policies.
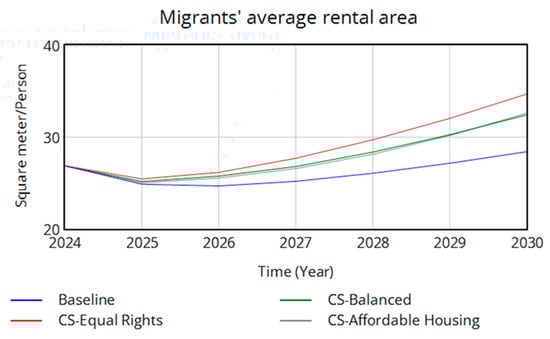
Figure 25.
Trends in rental housing area per migrant under combined policies.
In the combined-policy scenarios, rental housing prices are most directly influenced by two primary policy types. By 2030, rental housing prices under the high affordable housing combination, balanced combination, and high equal rights combination shift by −12.3%, −4.8%, and +0.3%, compared with the baseline scenario. Under the high affordable housing combination and the balanced combination, the increased supply from affordable housing policies surpasses the additional demand spurred by equal rights policies, resulting in an overall reduction in rental housing prices. In contrast, the high equal rights combination generates excessive new rental demand, driving actual rental housing prices upward. Across all three scenarios, housing purchase prices experience a slight decline. When integrating the rental and purchase markets, the rent-to-price ratios relative to the baseline scenario adjust by −9.2%, −1.6%, and +5.9%, respectively.
In terms of the rent–purchase decision, the high equal rights combination exerts the most significant impact in steering residents toward renting, with a 23.7% increase compared to the baseline scenario. Under the high affordable housing combination, shortcomings in rental rights protection are counterbalanced by a lower rent-to-price ratio, leading to a stronger impact on the rent–purchase decision than the balanced combination. Specifically, the rent–purchase decisions under these two combinations rise by 17.5% and 15.4%, respectively, compared to baseline. Across all three combined scenarios, both the willingness and capacity of migrants to enhance their housing conditions are improved, as evidenced by increases in per capita rental area of 14.8%, 14.1%, and 22.1%, respectively, relative to the baseline.
Among the three combined policy approaches, the high equal rights combination delivers the most substantial improvement in housing quality for migrants. However, this comes at the cost of a slight increase in rental expenses, thereby elevating living costs for migrants. The balanced combination and the high affordable housing combination yield similar outcomes in enhancing migrant housing quality, while the high affordable housing combination proves more effective in reducing living costs, thereby contributing to a broader enhancement of residents’ overall housing welfare.
5.3. Policy Implications
From the analysis results in Section 5.1 and Section 5.2, it can be seen that implementing either the “Strengthening Equal Rights for Renters and Buyers” policy or the “Increasing Affordable Housing Supply” policy in isolation often leads to certain negative effects. For example, compared to the baseline scenario, although a strong equal rights policy would correct the price distortion between the rental and property purchase markets—increasing the rent-to-price ratio by 10% and raising the proportion of rental housing by about 20%—it would also lead to an increase of 5% in yearly rental prices by 2030. This would exacerbate the housing burden on renters. On the other hand, while the introduction of a standalone affordable housing policy could reduce yearly rents by 13.4% through supply-side measures and redirect demand from the home purchase market to the rental market by 13.1%, this approach would instead widen the existing price distortion between the rental and purchase markets. Consequently, it would lower the rent-to-price ratio by 11.3% by 2030, undermining the achievement of long-term policy objectives.
Therefore, the combined use of both policies is crucial for addressing the housing problems of migrants. The analysis in Section 5.2 indicates the significant trade-off of balancing multiple policy targets through policy combinations. Compared to the baseline scenario, by 2030, all three policy scenarios effectively increased the per capita housing area for the migrant population and achieved the fundamental policy objective of redirecting the demand for housing purchase to the rental market. However, different policy combinations exhibited distinct characteristics in narrowing the price distortion between the rental and home purchase markets and reducing housing costs. By 2030, the policy combination emphasizing equal rights outperformed the other two scenarios in improving migrants’ housing quality and correcting price distortion mechanisms. Yet, relative to the baseline, this approach did not significantly reduce rental housing costs. In contrast, the policy mix prioritizing affordable housing effectively lowered residents’ rental costs compared to the baseline but exacerbated price distortions between the rental and home purchase markets, reducing the rent-to-price ratio by 9.2%. Therefore, for policymakers, prioritizing among multiple policy objectives is the most critical task in advancing the RPPs. It is essential to integrate rights protection policies with supply-side interventions and dynamically adjust their balance to achieve an optimal trade-off between conflicting policy goals. This is also the core policy recommendation that this paper hopes to convey.
6. Conclusions
This paper, grounded in systematic thinking and employing a system dynamics model, examines the impact pathways of combining rent-and-purchase policies (RPPs) in addressing the housing challenges faced by migrants. Additionally, it conducts simulations of policy scenarios based on simulation outcomes to identify alternative policy solutions for the future. The findings reveal that RPPs effectively contribute to addressing the housing difficulties of migrants. Both housing supply policies and equal rights policies significantly enhance the housing quality available to this population.
Specifically, a diversified housing supply reduces the price of rental housing through market mechanisms, thereby redirecting excess demand from the purchasing market to the rental market. However, this reduction in relative rental prices may further depress the rent-to-price ratio. Meanwhile, the implementation of equal rights policies diminishes the premium tied to housing property rights, thus reducing demand distortions across the rental and purchasing markets. Yet, this policy may unintentionally intensify the upward pressure on the prices of rental housing.
The analysis of combined policy approaches demonstrates that coordinating the advancement of equal rights for renting and purchasing with the development of affordable housing most effectively balances the dual objectives of price stability and demand management. This strategy ensures that housing rents remain free of systemic fluctuations while substantially mitigating price and demand distortions between rental and purchasing markets. Consequently, policymakers should prioritize addressing price mechanism distortions arising from inequalities in rights. By holistically integrating supply-side and rights-based policies, the housing issues confronting migrants can be resolved to the greatest possible extent.
However, it is important to acknowledge certain limitations in this model that offer avenues for future improvement. Firstly, data availability necessitated simplifications in some parameter estimations, potentially impacting the model’s precision. For instance, actual market demand, being largely unobservable, was estimated by back-calculating from existing transaction volumes. Future research could enhance estimation accuracy by incorporating more direct and observable demand indicators as data such as real estate agency client numbers or housing website portal traffic becomes more accessible. Secondly, as discussed in Section 3.5.2, the inherent complexity of system dynamics modeling led to certain simplifications of the actual economic operational processes. We anticipate that future research will allow for the integration of a broader range of factors and more nuanced mechanisms into the model framework.
Author Contributions
Conceptualization, Y.J. and J.D.; methodology, Y.J.; software, J.G.; validation, J.G., C.G. and X.L.; formal analysis, C.G.; investigation, J.G.; resources, J.D.; data curation, C.G.; writing—original draft preparation, Y.J. and J.G.; writing—review and editing, J.G., C.G. and X.L.; visualization, J.G.; supervision, X.L. and J.D.; project administration, Y.J.; funding acquisition, J.D. All authors have read and agreed to the published version of the manuscript.
Funding
This research was funded by National Natural Science Foundation of China grant number 72334006, 71974180.
Data Availability Statement
The original contributions presented in this study are included in the article. Further inquiries can be directed to the corresponding author.
Conflicts of Interest
The authors declare no conflict of interest.
References
- Goodkind, D.; West, L.A. China’s floating population: Definitions, data and recent findings. Urban Stud. 2002, 39, 2237–2250. [Google Scholar] [CrossRef]
- Lu, C.; Chen, J.; Li, J.; Wang, X. How urban welfare affects the hukou selection of rural migrants that belong to dual-hukou families in china. Comp. Migr. Stud. 2025, 13, 4. [Google Scholar] [CrossRef]
- Afridi, F.; Li, S.X.; Ren, Y. Social identity and inequality: The impact of China’s hukou system. J. Pub. Econ. 2015, 123, 17–29. [Google Scholar] [CrossRef]
- Lin, L.; Zhu, Y. Types and determinants of migrants’ settlement intention in China’s new phase of urbanization: A multi-dimensional perspective. Cities 2022, 124, 103622. [Google Scholar] [CrossRef]
- Qian, Y.; Fan, W. Who loses income during the COVID-19 outbreak? Evidence from China. Res. Soc. Stratif. Mobil. 2020, 68, 100522. [Google Scholar] [CrossRef]
- Song, Y. Hukou-based labour market discrimination and ownership structure in urban China. Urban Stud. 2016, 53, 1657–1673. [Google Scholar] [CrossRef]
- Luo, J.; Zhang, X.; Wu, Y.; Shen, J.; Shen, L.; Xing, X. Urban land expansion and the floating population in China: For production or for living. Cities 2018, 74, 219–228. [Google Scholar] [CrossRef]
- Bernard, A.B.; Dhyne, E.; Magerman, G.; Manovaet, A.; Moxnesal, A. The Origins of Firm Heterogeneity: A Production Network Approach. J. Political Economy 2022, 130, 1765–1804. [Google Scholar] [CrossRef]
- Fan, C.C.; Sun, M.; Zheng, S. Migration and Split Households: A Comparison of Sole, Couple, and Family Migrants in Beijing, China. Environ. Plan. A 2011, 43, 2164–2185. [Google Scholar] [CrossRef]
- Li, B.; Duda, M.; An, X. Drivers of Housing Choice among Rural-to-Urban Migrants: Evidence from Taiyuan. J. Asian Pub. Policy 2009, 2, 142–156. [Google Scholar] [CrossRef]
- Zheng, S.; Long, F.; Fan, C.C.; Gu, Y. Urban Villages in China: A 2008 Survey of Migrant Settlements in Beijing. Eurasian Geogr. Econ. 2009, 50, 425–446. [Google Scholar] [CrossRef]
- Shen, J.; Huang, Y. The working and living space of the ‘floating population’ in China. Asia Pac. Viewp. 2003, 44, 51–62. [Google Scholar] [CrossRef]
- Guo, J.; Xia, T. The Evolution and Simulation of the Residential Adaptive Expected Price under Rent-Purchase Policy the Impact of the Pace of Project Construction and Development and that of Land Supply on Housing Price. China Soft Sci. 2019, 9, 51–60. [Google Scholar]
- Chen, J.; Luo, Z.; Shen, Y.; Zhou, D. A Simulation-based Study on the Rent-purchase Decision-making of Real Estate Under Different Housing Policies. J. Eng. Manag. 2020, 34, 142–147. [Google Scholar]
- Lou, W.; Li, J. The configuration path of the balanced compulsory education resources supply in the context of equal rights to rent and purchase: Based on the fsQCA analysis of 31 cities in China. PLoS ONE 2024, 19, e0308286. [Google Scholar] [CrossRef]
- Jiang, Y.; Wei, S.; Geng, C.; Li, X.; Dong, J. Policy of Combining Rent-purchase and Residence Choice of the Floating Population: An Empirical Study Based on CFPS. Macroeconomics 2024, 12, 40–51+87. [Google Scholar]
- Beracha, E.; Seiler, M.; Johnson, K. The rent versus buy decision: Investigating the needed property appreciation rates to be indifferent between renting and buying property. J. Real Estate Pract. Educ. 2012, 15, 71–87. [Google Scholar] [CrossRef]
- Forrester, J.W. Urban dynamics. IMR; Ind. Manag. Rev. 1970, 11, 67. [Google Scholar] [CrossRef]
- Abdel-Latif, A.S.; Saad-Eldien, A.; Marzouk, M.M. System dynamics approaches in managing real estate development crises: Conceptual versus scenario-based. Manag. Dyn. Knowl. Econ. 2019, 7, 381–407. [Google Scholar] [CrossRef]
- Kummerow, M. A system dynamics model of cyclical office oversupply. J. Real Estate Res. 1999, 18, 233–256. [Google Scholar] [CrossRef]
- Grimes, A.; Aitken, A. Housing supply, land costs and price adjustment. Real Estate Econ. 2010, 38, 325–353. [Google Scholar] [CrossRef]
- Ghaffarzadegan, N.; Lyneis, J.; Richardson, G.P. How small system dynamics models can help the public policy process. Syst. Dyn. Rev. 2011, 27, 22–44. [Google Scholar] [CrossRef]
- Eskinasi, M. Towards Housing System Dynamics: Projects on Embedding System Dynamics in Housing Policy Research; Eburon Academic Publishers: Delft, The Netherlands, 2014. [Google Scholar]
- Teng, J.; Xu, C.; Wang, W.; Wu, X. A system dynamics-based decision-making tool and strategy optimization simulation of green building development in China. Clean Technol. Environ. Policy 2018, 20, 1259–1270. [Google Scholar] [CrossRef]
- Marçal, K.E.; Fowler, P.J.; Hovmand, P.S. Feedback dynamics of the low-income rental housing market: Exploring policy responses to COVID-19. Syst. Dyn. Rev. 2023, 39, 371–403. [Google Scholar] [CrossRef]
- Mou, X.; Li, X.; Dong, J. The impact of population aging on housing demand in China based on system dynamics. J. Syst. Sci. Complex. 2021, 34, 351–380. [Google Scholar] [CrossRef]
- Lai, Y.; Zheng, X.; Choy, L.H.; Wang, J. Property rights and housing prices: An empirical study of small property rights housing in Shenzhen, China. Land Use Policy 2017, 68, 429–437. [Google Scholar] [CrossRef]
- Forrester, J.W. Industry Dynamics; Taylor & Francis: Cambridge, MA, USA, 1961. [Google Scholar]
- Sterman, J. System Dynamics: Systems Thinking and Modeling for A Complex World; Massachusetts Institute of Technology: Cambridge, MA, USA, 2002. [Google Scholar]
- Richardson, G.P.; Pugh, A.L., III. Introduction to system dynamics modeling with DYNAMO. J. Operational Res. Soc. 1997, 48, 1146. [Google Scholar] [CrossRef]
- Repenning, N.P. Selling system dynamics to (other) social scientists. Syst. Dyn. Rev. J. Syst. Dyn. Soc. 2003, 19, 303–327. [Google Scholar] [CrossRef]
- Forrester, J.W. Warfield J N. World dynamics. IEEE Tran. Syst. Man Cybern. 1972, 4, 558–559. [Google Scholar] [CrossRef]
- Eberlein, R.L.; Peterson, D.W. Understanding models with Vensim™. Eur. J. Operational Res. 1992, 59, 216–219. [Google Scholar] [CrossRef]
- Okun, A.M. Potential GNP: Its Measurement and Significance; Cowles Foundation for Research in Economics at Yale University: New Haven, CT, USA, 1963. [Google Scholar]
- Leontief, W.W. Quantitative input and output relations in the economic systems of the United States. Rev. Econ. Stat. 1936, 18, 105–125. [Google Scholar] [CrossRef]
- Zhu, N. The impacts of income gaps on migration decisions in China. China Econ. Rev. 2002, 13, 213–230. [Google Scholar] [CrossRef]
- Chen, L.; Guo, S.; Zhang, W.; Li, X.; Dong, J. Like father, like son? Intergenerational Transmission of household housing preference: Evidence from China. Heliyon 2024, 10, e40710. [Google Scholar] [CrossRef]
- Marshall, A. Principles of Economics; Springer: Berlin/Heidelberg, Germany, 2013. [Google Scholar]
- Been, V.; Ellen, I.G.; O’Regan, K. Supply skepticism: Housing supply and affordability. Hous. Policy Debate 2019, 29, 25–40. [Google Scholar] [CrossRef]
- Amaral, J.V.; Guerreiro, R. Factors explaining a cost-based pricing essence. J. Bus. Ind. Mark. 2019, 34, 1850–1865. [Google Scholar] [CrossRef]
- Dong, Z.; Hui, E.C.M.; Jia, S.H. How does housing price affect consumption in China: Wealth effect or substitution effect? Cities 2017, 64, 1–8. [Google Scholar] [CrossRef]
- Xie, W. Research on Expected Supply and Demand Disequilibrium in the Housing Rental Market Based on Grey Markov Prediction Model. Econ. Res. Guide 2024, 20, 51–56. [Google Scholar]
- Senge, P.M.; Forrester, J.W. Tests for building confidence in system dynamics models. Syst. Dyn. TIMS Stud. Manag. Sci. 1980, 14, 209–228. [Google Scholar]
- Song, M.; Cui, X.; Wang, S. Simulation of land green supply chain based on system dynamics and policy optimization. Int. J. Prod. Econ. 2019, 217, 317–327. [Google Scholar] [CrossRef]
Disclaimer/Publisher’s Note: The statements, opinions and data contained in all publications are solely those of the individual author(s) and contributor(s) and not of MDPI and/or the editor(s). MDPI and/or the editor(s) disclaim responsibility for any injury to people or property resulting from any ideas, methods, instructions or products referred to in the content. |
© 2025 by the authors. Licensee MDPI, Basel, Switzerland. This article is an open access article distributed under the terms and conditions of the Creative Commons Attribution (CC BY) license (https://creativecommons.org/licenses/by/4.0/).