1. Introduction
The ability to predict loan defaults is of critical importance for financial institutions, as it directly impacts risk management, profitability, and operational efficiency. Loan default occurs when a borrower fails to meet their repayment obligations, and understanding the likelihood of default is essential for informed decision making in credit underwriting, pricing, and portfolio management. Despite the availability of extensive customer and loan-related data, accurately predicting loan defaults remains a challenging task due to factors such as data imbalance, the complexity of borrower behavior, and the diversity of contributing features [
1,
2].
Machine learning techniques have emerged as powerful tools for tackling predictive modeling problems in finance, including credit scoring and loan classification. Unlike traditional statistical models, machine learning models can capture complex, non-linear relationships within the data, leading to improved prediction accuracy. Advanced algorithms such as Gradient Boosting, XGBoost, and Random Forest have gained prominence due to their robust performance in classification tasks [
3,
4]. Studies have demonstrated that incorporating feature engineering and addressing class imbalance can significantly enhance model performance [
5,
6]. Additionally, ensemble methods such as voting classifiers have been shown to outperform individual models in accuracy and robustness [
7].
Despite these advancements, challenges persist. For example, imbalanced datasets can bias machine learning models toward majority classes, leading to suboptimal predictions for minority classes [
8,
9]. Furthermore, financial institutions require explainable models to satisfy regulatory requirements and build trust with stakeholders [
10]. These challenges underscore the need for comprehensive evaluations of machine learning algorithms that combine predictive performance with interpretability.
This paper investigates the effectiveness of three popular machine learning models—XGBoost, Gradient Boosting, and Random Forest—in predicting loan defaults using a real-world dataset. By systematically comparing the models’ performance across key metrics such as accuracy, F1-score, ROC AUC, and confusion matrix, we aim to identify the strengths and limitations of each algorithm. The study incorporates preprocessing techniques, including categorical encoding, feature engineering, and class balancing, to optimize model performance [
11,
12].
The primary contributions of this paper include a comprehensive comparative analysis of leading machine learning models—specifically XGBoost, Gradient Boosting, and Random Forest—in predicting loan defaults. Unlike traditional credit scoring approaches, our study emphasizes not only predictive accuracy but also the interpretability of model outputs, thereby addressing the critical regulatory and practical concerns of financial institutions. Additionally, this study integrates advanced feature engineering and rigorous feature selection techniques. Through systematic preprocessing—including categorical variable encoding, feature extraction, and class imbalance mitigation—we significantly enhance model robustness and predictive power. Such preprocessing steps are meticulously documented and benchmarked against existing practices, highlighting their effectiveness and potential adoption in real-world lending scenarios. Furthermore, model performance is thoroughly evaluated using multiple robust metrics, including accuracy, F1-score, ROC AUC, and confusion matrix analyses. Our results are visualized through clear, interpretable graphical representations, providing financial institutions with actionable insights into the risk factors and predictive patterns underlying borrower default. By focusing on both accuracy and interpretability, our findings help bridge the gap between theoretical advancements in machine learning and their practical implementation within the regulated financial sector.
The remainder of the paper is structured to facilitate clear progression and logical coherence:
Section 2 synthesizes existing literature on loan default prediction, explicitly identifying gaps our study addresses.
Section 3 describes the dataset’s origin, preprocessing methodology, and experimental design in detail.
Section 4 presents the comparative results of our modeling approaches. These results are then discussed comprehensively in
Section 5, providing theoretical insights and practical implications for financial institutions. Finally,
Section 6 summarizes key findings, highlights the study’s novel contributions, and offers targeted recommendations for future research directions.
2. Literature Review
Machine learning has increasingly been applied to financial risk prediction and decision-making processes, particularly in the domain of loan default prediction, due to its ability to model complex, non-linear relationships in data. As financial institutions adopt data-driven business process management (BPM), predictive analytics and artificial intelligence (AI) offer a robust framework for automating risk assessment, optimizing decision making, and ensuring regulatory compliance. This section provides an overview of prior studies on loan default prediction, explores the role of machine learning in BPM, and identifies existing research gaps.
2.1. Theoretical Foundations of AI-Driven BPM in Financial Decision-Making
The integration of machine learning in BPM builds upon key theories in decision making, information asymmetry, and process optimization. Decision theory, which informs business process automation, emphasizes the use of data-driven decision making to improve organizational efficiency [
13,
14]. Within financial BPM, loan default prediction models enable automated and real-time credit risk assessments, reducing human bias and improving risk mitigation strategies.
Information asymmetry theory is particularly relevant to loan default prediction, as lenders and borrowers possess unequal information regarding financial risks. Financial institutions rely on historical transaction data, credit scores, and alternative behavioral data to predict borrower risk [
3,
15]. AI-powered predictive analytics reduce information gaps by identifying hidden risk patterns, improving financial decision-making efficiency.
Moreover, process optimization theory in BPM emphasizes AI-driven automation to enhance decision-making transparency, resource allocation, and operational efficiency [
16]. The integration of AI in BPM has been shown to optimize financial services, particularly in risk assessment and lending workflows [
17,
18]. AI-based risk models have been shown to improve financial decision-making by offering real-time risk assessments, which significantly enhance BPM efficiency in financial institutions [
19].
2.2. Application of Machine Learning to Loan Default Prediction
Several studies have demonstrated the effectiveness of machine learning techniques in predicting loan defaults. For example, the authors of [
1] explored decision trees, support vector machines (SVMs), and logistic regression for the prediction of loan default based on mobile models. The study found that decision trees performed well in handling categorical variables and nonlinear relationships. A comparative analysis of traditional models and machine learning techniques concluded that Gradient Boosting and Random Forest achieved significantly higher accuracy and F1 scores compared to logistic regression [
3].
Beyond model selection, feature engineering plays a key role in improving loan default prediction. Authors of [
20] introduced a block-diagonal-guided DBSCAN clustering method, which enhances high-dimensional data clustering and anomaly detection. This technique can be particularly beneficial in identifying hidden patterns in financial datasets, supporting robust feature selection for predictive modeling. Credit risk models have also been optimized by integrating deep learning with advanced feature engineering, achieving significant improvements in classification performance [
21].
Ensemble methods have also been extensively studied in loan default classification. Abhi [
8] showed that a voting classifier combining Gradient Boosting, Random Forest, and XGBoost yielded superior results compared to individual models. Ensemble learning enhances model robustness and predictive reliability, reducing variance in classification tasks [
22]. Recent studies have demonstrated that integrating multiple ML models with feature engineering significantly improves risk assessment accuracy, further enhancing predictive reliability in financial decision-making [
23].
Furthermore, big data-driven models have been successfully applied to financial risk assessment in BPM. Studies show that AI-powered financial systems leverage large-scale transaction data to enhance fraud detection and default prediction [
24,
25]. This integration enables real-time credit risk assessment and decision automation, significantly reducing processing time and operational costs [
26,
27]. Artificial neural networks and Bayesian network models have proven effective in modeling credit risk, especially in capturing complex dependencies within financial data [
28].
2.3. Handling Imbalanced Data in Loan Default Prediction
Loan default datasets are often highly imbalanced, with far fewer instances of defaulted loans compared to non-defaulted ones. This class imbalance can bias models toward predicting non-default cases, leading to poor recall for defaulters. Several studies have addressed this challenge by implementing class balancing techniques such as class weighting, synthetic oversampling (e.g., SMOTE), and under-sampling.
For example, in [
7], it was demonstrated that SMOTE combined with ensemble learning significantly improved recall for defaulted loans, while authors of [
4] integrated SMOTE with Random Forest to balance datasets, achieving higher recall without sacrificing precision. Similarly, authors of [
5] explored feature selection techniques for improving model interpretability and predictive performance in credit risk modeling.
Recent research on AI-driven BPM has emphasized the importance of handling class imbalance when developing automated financial decision systems. Studies suggest that adaptive re-weighting of misclassified samples and cost-sensitive learning can further enhance classification performance in financial BPM [
29,
30]. The alignment of causal variables in machine learning models has also been shown to improve classification performance in imbalanced financial datasets [
31].
2.4. Interpretability and Regulatory Compliance in Machine Learning-Based BPM
While machine learning models such as XGBoost and Gradient Boosting outperform traditional models, their complexity often limits interpretability, making regulatory compliance a critical challenge for financial institutions [
25]. Regulatory agencies require transparency in automated decision-making, necessitating the use of explainable AI (XAI) techniques [
32].
Jackson and Wood [
10] highlighted the necessity of balancing performance and interpretability, suggesting that decision trees and rule-based models could be used alongside black-box models for enhanced explainability. Zhang and Li [
7] introduced post hoc interpretability methods, analyzing feature importance in AI-based loan default prediction, demonstrating how explainable machine learning can support financial risk mitigation strategies [
33].
Recent advancements in interpretable AI for BPM have led to the development of hybrid approaches, where deep learning models are augmented with rule-based explanations [
26]. Recent studies have called for integrating SHAP (Shapley Additive Explanations) into BPM workflows to improve transparency. Future work should explore integrating LIME (Local Interpretable Model-Agnostic Explanations) and counter-factual explanations into BPM workflows to improve transparency in financial decision-making [
34,
35]. Diffusion-based methods have been explored as a means to enhance structured data modeling, providing potential benefits for improving interpretability in financial risk assessment [
36].
Another critical aspect of regulatory compliance is ensuring the auditability and documentation of the entire model development process. According to the “audit trail” principle, financial institutions must be able to reconstruct the reasoning and evolution behind automated decisions. This includes systematic documentation of key phases such as data sourcing, preprocessing, feature selection, model training, hyperparameter tuning, validation procedures, and deployment workflows.
To support this requirement, recent studies have highlighted the use of version control and experiment tracking tools (e.g., MLflow, DVC) that maintain a transparent and reproducible record of model development stages [
26,
27]. These tools facilitate traceability by capturing changes in datasets, model configurations, and evaluation results. Moreover, integrating our deep analysis with automated reporting frameworks enables the generation of human-readable audit reports, further supporting compliance and stakeholder transparency [
10,
26]. As machine learning models continue to be deployed in regulated financial environments, embedding such audit mechanisms is essential for both external regulatory obligations and internal risk governance practices [
25].
2.5. Research Gaps and Future Directions
Despite advancements in loan default prediction using AI-driven BPM, several research gaps remain. First, most studies focus on individual machine learning models, while few explore the synergy between ensemble learning and feature engineering. Although ensemble methods have been shown to improve performance, their application in cost-sensitive financial decision-making remains underexplored [
8,
19].
Second, the challenge of class imbalance persists, as highlighted by Zhu et al. [
7]. While oversampling and class weighting techniques improve recall, their application in conjunction with deep learning and advanced ensemble methods requires further research [
21].
Lastly, interpretability remains a major concern in AI-driven financial BPM. Regulatory compliance demands transparent, explainable models, yet current implementations focus primarily on performance optimization rather than explainability. Comparative evaluations of ensemble models combined with class balancing techniques have demonstrated substantial improvements in predictive performance on imbalanced datasets. These approaches can inform the design of robust AI-driven financial models for risk-sensitive domains such as loan default prediction [
37]. Future research should investigate hybrid AI-XAI frameworks to ensure both predictive accuracy and interpretability in financial BPM [
28,
38]. Causal modeling in business decision-making has also been explored, revealing the potential of integrating explainable AI into financial BPM [
39].
Table 1 provides a comprehensive summary of the key literature findings discussed in this review.
3. Materials and Methods
3.1. Dataset
The dataset used in this study is a synthetic version inspired by the original Credit Risk dataset on Kaggle (available at
https://www.kaggle.com/datasets/taweilo/loan-approval-classification-data (accessed on 11 November 2024)) and enriched with additional variables based on Financial Risk for Loan Approval data. SMOTENC was used to simulate new data points to enlarge the instances. The dataset is structured for both categorical and continuous features. It contains customer and loan-related features that are relevant to predicting loan defaults. The selected input variables for the models, as listed by the data provider, include ‘person_income’ (annual income), ‘person_home_ownership’ (e.g., RENT, OWN, MORTGAGE), ‘loan_amnt’ (loan amount requested), ‘loan_intent’ (purpose of the loan), ‘loan_int_rate’ (interest rate of the loan), ‘credit_score’ (borrower’s credit score), ‘previous_loan_defaults_on_file’ (binary indicator of previous defaults), and ‘debt_to_income’ (ratio of debt to income). An initial analysis was performed to assess the correlation between these variables and the loan default status, ensuring their relevance for the prediction task. Key features include demographic information (e.g., income, homeownership, age), financial metrics (e.g., credit score, loan amount, interest rate), and historical loan behavior (e.g., previous defaults, debt-to-income ratio). To ensure a robust analysis, the dataset is preprocessed and split into training and testing subsets using stratified sampling to preserve the class distribution. The dataset contains a mix of numerical and categorical features, each providing distinct information about the borrower and the loan. A comprehensive breakdown of the key variables used for modeling is as follows:
Numerical Features:
- −
person_age: Age of the borrower.
- −
person_income: Annual income of the borrower.
- −
loan_amnt: The amount of money requested for the loan.
- −
loan_int_rate: The interest rate assigned to the loan. A higher rate often signifies higher perceived risk.
- −
debt_to_income: The ratio of the borrower’s total debt to their gross income, a key indicator of financial health.
- −
credit_score: A numerical value representing the borrower’s creditworthiness.
Categorical Features:
- −
person_home_ownership: The borrower’s homeownership status, with possible values like RENT, OWN, MORTGAGE.
- −
loan_intent: The stated purpose for the loan, such as DEBTCONSOLIDATION, HOMEIMPROVEMENT, etc.
- −
previous_loan_defaults_on_file: A binary feature indicating if the borrower has defaulted on a loan previously.
An initial analysis was performed to assess the correlation between these variables and the loan default status, ensuring their relevance for the prediction task. To ensure a robust analysis, the dataset was preprocessed and split into training and testing subsets using stratified sampling to preserve the class distribution.
3.2. Exploratory Data Analysis
An exploratory data analysis was conducted to understand the characteristics of the dataset and inform the modeling process. The visualizations in
Figure 1,
Figure 2,
Figure 3,
Figure 4,
Figure 5,
Figure 6 and
Figure 7 provide insights into key variables. The age distribution (
Figure 1), while not perfectly normal, is handled effectively by the non-parametric tree-based models used in this study, which do not require normally distributed data. The purpose of this plot is to offer a descriptive overview of the age variable, whose predictive power is formally assessed in the feature importance analysis (
Section 4.4).
Figure 2 shows the distribution of credit scores. Outliers were present, but they were not removed, as tree-based models like Random Forest and Gradient Boosting are inherently robust to them by isolating them in separate leaf nodes. The significance of this variable is confirmed in the feature importance results (
Section 4.4). The income distribution (
Figure 3) is right-skewed, but again, the chosen models are robust to such distributions. The variable’s high variance suggests it could be a strong predictor. The relationship between income and loan amount is visualized in
Figure 4, providing a qualitative understanding of the data that informs features like the debt-to-income ratio. The multi-modal distribution of loan interest rates (
Figure 5) suggests that applicants are being categorized into different risk tiers, making it a critical feature for prediction, which is later confirmed by the model’s feature importance scores. Similarly, the distribution of requested loan amounts (
Figure 6) helps contextualize the model’s predictions, as the financial implications of misclassification are tied to this value. Finally, the comparison of loan default rates by gender (
Figure 7) is included for a descriptive and fairness-oriented analysis. While this variable was not a top predictor in our models, monitoring such features is a crucial step in responsible AI to ensure models do not perpetuate bias.
3.3. Preprocessing and Feature Engineering
To prepare the data for machine learning, the following preprocessing and feature engineering steps were applied.
3.3.1. Categorical Encoding
Categorical variables such as person gender, person home ownership, loan intent, and loan status were encoded using LabelEncoder. This ensures that machine learning algorithms, which primarily operate on numerical data, can process these features effectively. For instance, LabelEncoder transforms each category within a feature (e.g., ’RENT’, ’OWN’, ’MORTGAGE’ for ’person_home_ownership’) into a unique integer (e.g., 0, 1, 2). While LabelEncoder provides a direct numerical mapping, other techniques like one-hot encoding produce binary vector representations (transformation matrices) for each category; however, for this study, direct integer encoding was utilized for tree-based models which can handle such inputs effectively. The specific integer mappings are determined by the unique values present in each categorical column and their order of appearance during the fitting process of the encoder.
3.3.2. Feature Engineering
Feature engineering is critical for enhancing predictive performance by creating meaningful representations of raw data. In this study, we derived specific features informed by domain expertise and relevant literature. The first engineered feature is the debt-to-income ratio, computed as the proportion of a borrower’s total debt to their income. This ratio is a standard financial indicator, extensively used in credit scoring literature, that measures an individual’s capacity to manage and repay debt. Higher ratios generally indicate increased financial vulnerability and have been empirically linked to higher default probabilities.
Additionally, we introduced the age-to-experience ratio, defined as the ratio of a borrower’s age to their years of professional experience. This feature captures nuanced aspects of financial maturity and stability, reflecting how accumulated professional experience corresponds to financial decision-making capabilities. Younger borrowers with disproportionately short experience might demonstrate less financial stability, potentially correlating to higher default risk. These features were carefully selected and designed based on their theoretical relevance and empirical validation in previous credit-risk modeling research.
3.3.3. Feature Selection
The feature selection process adopted in this study involved a rigorous two-stage procedure to identify the most informative and predictive variables while eliminating redundancy and noise. Initially, Recursive Feature Elimination with Cross-Validation (RFECV) was employed. RFECV systematically removes the least significant features, iteratively evaluating model performance using cross-validation to identify an optimal subset of predictive features. This method ensures robust feature selection by objectively assessing feature relevance and minimizing the risk of model overfitting.
Following RFECV, we applied a secondary feature selection step using SelectFromModel with tree-based algorithms (e.g., Random Forest and Gradient Boosting). This method leverages feature importance metrics generated from tree ensembles, selecting features that consistently exhibit high predictive power. The two-stage approach aligns with established best practices in the machine learning literature, combining statistical rigor and model-driven insights to optimize the predictive accuracy and generalizability of the final model. These comprehensive feature engineering and selection steps significantly enhance model interpretability and predictive performance, ensuring our analysis is both theoretically sound and practically relevant for financial institutions.
3.3.4. Data Splitting
The dataset was split into training (80%) and testing (20%) sets. Stratified splitting was used to maintain the balance of the target variable (loan status) in both subsets.
3.4. Model Selection and Training
The performance of four machine learning models was investigated for the loan default prediction task: XGBoost, Random Forest, LightGBM, and Gradient Boosting. These models were chosen due to their proven ability to handle structured data and their robustness in classification tasks. For each model, a decision function (or score function) is learned from the training data, which is then used to classify customers as either likely to default or not. The suitability and validity of these functions are rigorously tested using cross-validation and a comprehensive set of performance metrics detailed in
Section 3.4. This section outlines the implementation details and strategies used to train these models effectively.
3.4.1. XGBoost
XGBoost, or Extreme Gradient Boosting, is a scalable and efficient implementation of gradient boosting, a machine learning technique that sequentially builds ensemble models by iteratively minimizing a differentiable loss function [
40]. To mitigate overfitting, XGBoost incorporates regularization techniques such as L1 (lasso) and L2 (ridge) penalties. In this study, we employed the binary logistic loss function as the objective for classification tasks. Key hyperparameters including learning rate, maximum tree depth, subsample ratio, column sampling by tree, and the number of estimators were carefully tuned. Hyperparameter optimization was performed using GridSearchCV, systematically exploring parameter combinations to achieve optimal model performance and generalizability.
3.4.2. Random Forest
Random Forest is an ensemble learning algorithm that aggregates predictions from numerous decision trees to enhance predictive accuracy and model stability [
41]. Each tree within the ensemble is independently constructed from random subsets of both features and training samples, a process known as bootstrapping, significantly reducing variance and guarding against overfitting. We used the Gini impurity criterion to determine optimal splits during the training of individual trees. Critical hyperparameters, including the number of trees (n_estimators), maximum features considered at each split (max_features), maximum tree depth (max_depth), and the minimum number of samples required to perform a split (min_samples_split), were tuned. Random Forest’s inherent ability to handle large feature spaces and its built-in feature importance metrics made it particularly suitable for our analysis.
3.4.3. LightGBM
LightGBM is a highly efficient gradient boosting framework specifically optimized for large-scale datasets through histogram-based data binning and leaf-wise tree growth strategies, which result in faster training and prediction speeds compared to traditional methods [
42]. In this study, we employed binary cross-entropy as the loss function, suitable for binary classification tasks. Important hyperparameters, including learning rate, number of leaves, maximum depth, and minimum data required in a leaf, were optimized via GridSearchCV. A distinct advantage of LightGBM utilized here was its capability to directly handle categorical features without explicit preprocessing, thus streamlining the modeling pipeline and improving computational efficiency.
3.4.4. Gradient Boosting
Gradient Boosting is another ensemble method that constructs models iteratively by minimizing a predefined loss function. It builds a strong predictive model by sequentially combining weak learners—typically shallow decision trees—to gradually reduce prediction errors [
43]. Unlike XGBoost, traditional Gradient Boosting implementations typically do not include built-in regularization terms by default. In this study, we utilized the log-loss function, appropriate for classification tasks. Essential hyperparameters, such as learning rate, maximum depth, and the number of estimators, were systematically tuned to enhance performance. Gradient Boosting generally exhibits robust predictive capabilities, particularly effective when applied to datasets of moderate size, as in our analysis.
3.4.5. Addressing Class Imbalance
Given the inherent imbalance in loan default datasets—where defaults are typically underrepresented—it is critical to implement strategies that reduce model bias toward the majority class [
44]. We employed a combined approach to address class imbalance. First, class weighting was introduced by assigning higher penalty weights to the minority class (loan defaults) within the model’s loss function, thereby encouraging the model to prioritize correct identification of defaults. Second, the Synthetic Minority Oversampling Technique (SMOTE) was applied to the training set. SMOTE generates synthetic samples based on existing minority-class observations, effectively balancing the training dataset and enabling models to learn better representations of the minority class distribution [
45]. This dual approach helped significantly enhance recall and predictive accuracy for the defaulted loans.
3.4.6. Hyperparameter Tuning
To rigorously optimize model performance, we performed hyperparameter tuning using GridSearchCV combined with 5-fold cross-validation. This systematic approach involved an exhaustive search across specified parameter spaces, facilitating identification of optimal hyperparameters for each machine learning model. Specifically, for XGBoost, the tuning process concentrated on parameters such as learning rate, maximum tree depth, subsample ratio, and the number of estimators. For Random Forest, hyperparameters including number of estimators, maximum features per split, and maximum depth were optimized. LightGBM tuning involved careful selection of the number of leaves, maximum depth, and minimum data required in each leaf, while Gradient Boosting tuning similarly targeted learning rate, maximum depth, and number of estimators. The comprehensive hyperparameter optimization ensured robust and consistent performance across evaluation metrics.
3.4.7. Training Process
The training methodology adopted in this study involved several carefully structured steps to ensure rigorous evaluation and reliable results. Initially, the dataset was partitioned into training (80%) and testing subsets (20%) to evaluate model generalizability on unseen data. Subsequently, stratified 5-fold cross-validation was employed during training, preserving the original distribution of loan defaults within each fold and thereby providing consistent evaluation across imbalanced subsets. This cross-validation strategy effectively assessed model robustness and prevented overfitting by ensuring each model was validated on diverse subsets of the training data. Additionally, training times for each model were systematically recorded to compare computational efficiency and practical applicability in real-world financial contexts.
3.5. Evaluation
To measure the performance of the models and identify the most effective algorithm for loan default prediction, multiple evaluation metrics and visualizations were employed. These metrics account for the imbalanced nature of the dataset and emphasize both classification accuracy and robustness. The statistical validity of the model comparison is underpinned by the use of k-fold cross-validation, which provides a robust estimate of model performance on unseen data and helps in assessing the stability of the results. The chosen metrics, detailed below, are standard in classification tasks and provide a comprehensive view of model efficacy, particularly in the context of imbalanced datasets common in loan default scenarios.
3.5.1. Evaluation Metrics
Accuracy: The proportion of correctly classified samples out of the total samples. While useful, accuracy alone is insufficient for imbalanced datasets as it may favor the majority class.
F1-Score: The harmonic means of precision and recall, providing a balanced view of a model’s performance on the minority class (defaults).
ROC AUC: The area under the receiver operating characteristic curve evaluates the trade-off between true positive and false positive rates across various thresholds. A higher ROC AUC indicates better discrimination.
Precision–Recall Curve: This visualization highlights the model’s precision and recall at various thresholds, which is particularly useful for imbalanced datasets.
Confusion Matrix: Provides a detailed breakdown of the model’s performance by summarizing true positives (TPs), true negatives (TNs), false positives (FPs), and false negatives (FNs). This matrix is fundamental for understanding the types of errors a model makes, which is critical for risk assessment.
3.5.2. Evaluation Procedure
The evaluation process of our models was systematically designed to provide rigorous and reliable performance assessments. Initially, we adopted a train–test evaluation approach, where models trained on the training dataset were subsequently evaluated on a separate testing subset. Performance metrics—such as accuracy, precision, recall, and F1-score—were computed on the test set to assess each model’s generalizability to unseen data.
To further ensure stability and reliability of the results, we employed cross-validation. Specifically, we utilized stratified 5-fold cross-validation, where metrics across the folds were computed and averaged. This approach offered insights into the variance of model performance and ensured that the reported results were robust against overfitting and specific data splits.
Additionally, for the best performing model, we undertook threshold tuning to address the practical implications of classification decisions in financial contexts. By adjusting the classification threshold, we minimized the costs associated with false positives (incorrectly labeling non-defaulting customers as defaulters) and false negatives (failing to identify actual defaulters). This step was essential in aligning our model’s predictive performance with real-world financial decision-making and risk management practices.
3.5.3. Comparison Across Models
A thorough comparison across the evaluated models was conducted to determine the most effective algorithm for loan default prediction. Rather than relying solely on accuracy, which can be misleading in imbalanced scenarios, we focused particularly on the F1-score. The F1-score, representing the harmonic mean of precision and recall, provided a balanced assessment that was especially critical for accurately identifying loan defaulters, the minority class in our dataset.
Furthermore, ROC AUC (Receiver Operating Characteristic Area Under the Curve) was another primary metric used to measure and compare model performance. ROC AUC evaluates a model’s overall ability to differentiate between defaulted and non-defaulted loans across various thresholds, independent of class imbalance. Higher ROC AUC values indicate superior discriminative ability, making this metric essential for comprehensive model evaluation. By combining insights from both F1-score and ROC AUC, we identified the best performing model that optimally balanced precision, recall, and overall discriminatory power.
3.5.4. Visualization
To facilitate a deeper understanding of model performance and enhance interpretability, we employed multiple visualizations. ROC and precision–recall curves were plotted for all models, enabling visual assessment of their predictive effectiveness across a range of classification thresholds. These plots provided immediate insights into the trade-offs between precision and recall, which are particularly relevant in credit-risk scenarios.
Additionally, confusion matrices were constructed for each model to elucidate specific misclassification patterns. Examining false positives and false negatives provided clarity on model strengths and weaknesses, informing decisions about practical model deployment and risk management strategies.
Lastly, feature importance scores were extracted from the tree-based models (XGBoost, Random Forest, Gradient Boosting, and LightGBM). These importance metrics allowed us to interpret how each feature contributed to the predictive capability of the models, providing valuable insights into critical risk factors associated with loan default. Such interpretability is not only academically valuable but also practically essential, aligning our study with regulatory expectations for transparent and explainable credit-risk modeling.
3.6. Ensemble Learning
To further improve generalization and reduce variance, an ensemble model was created using a voting classifier. This ensemble combines the predictions of the best performing models (e.g., XGBoost, Gradient Boosting, and Random Forest) using majority voting. By leveraging the strengths of multiple algorithms, the ensemble model achieves higher predictive accuracy and robustness compared to individual models.
Figure 8 illustrates the ROC curve performance for the LightGBM model, demonstrating the model’s discriminatory capability.
4. Results
This section presents the comparative performance of the four machine learning models—XGBoost, Random Forest, LightGBM, and Gradient Boosting—on the loan default prediction task. The models were evaluated using both training and testing datasets, and their performance was assessed based on key metrics such as accuracy, F1-score, ROC AUC, and confusion matrix. These metrics reflect the effectiveness of the learned decision functions (or score functions) in distinguishing between healthy and defaulting customers. The robustness of these findings is supported by k-fold cross-validation, with mean scores and standard deviations reported to indicate performance stability (as shown in the ‘CV Score (F1)’ values in the text).
4.1. Model Performance Comparison
Table 2 below summarizes the performance metrics for each model on the testing dataset.
Key Observations:
Gradient Boosting consistently outperformed the other models across most metrics, achieving the highest test accuracy (0.8887), F1-score (0.8084), and recall (0.8021). This indicates its decision function was most effective at correctly classifying both classes, especially the minority default class.
XGBoost demonstrated a competitive performance, achieving the highest ROC AUC score (0.9714), indicating strong discriminatory power between default and non-default classes.
Random Forest and LightGBM showed slightly lower performance, with comparable F1-scores but marginally lower recall and precision.
The stability of these decision functions was assessed through cross-validation, where the reported F1-scores show relatively low variance (e.g., Gradient Boosting CV Score (F1): ), suggesting robust performance across different data subsets. Furthermore, ensemble methods like Gradient Boosting and XGBoost iteratively refine their decision functions; at each iteration, these models adjust by focusing on instances that were previously misclassified, thereby incrementally improving the overall predictive accuracy. The statistical significance of these differences, while not formally tested with hypothesis tests in this paper, is suggested by the consistent ranking across multiple metrics and the non-overlapping confidence intervals implied by the cross-validation standard deviations for key metrics like the F1-score.
4.2. Confusion Matrix
The confusion matrices for the models on the test dataset are presented below to provide a detailed breakdown of their classification performance. These matrices (
Table 3,
Table 4 and
Table 5 and
Figure 9,
Figure 10,
Figure 11 and
Figure 12) are crucial for a granular analysis of classification errors, specifically detailing the number of true positives, true negatives, false positives, and false negatives. This breakdown is essential for understanding how well each model identifies actual defaulters (true positives) while minimizing incorrect classifications of non-defaulters as defaulters (false positives) and vice versa, which directly impacts financial risk assessment.
4.3. Strengths and Limitations of the Best Performing Model
Gradient Boosting Strengths:
High Recall: Gradient Boosting achieved the highest recall (0.8021), making it particularly effective at identifying loan defaults, which is critical for minimizing financial risks.
Balanced Performance: F1-score (0.8084) indicated a good balance between precision and recall.
Feature Importance: Gradient Boosting provided insights into feature importance, with credit_score, debt_to_income, and loan_int_rate identified as the most influential features.
Gradient Boosting Limitations:
Training Time: Gradient Boosting required longer training times compared to Random Forest and LightGBM due to its sequential nature.
Overfitting Risk: The model showed a slight tendency toward overfitting on the training data, which was mitigated through hyperparameter tuning. The use of cross-validation during hyperparameter tuning (GridSearchCV with five-fold CV) was instrumental in selecting parameters that generalize well to unseen data, thereby mitigating this risk.
4.4. Insights from Feature Importance
Feature importance analysis revealed the most significant predictors of loan default: The feature importance plots (
Figure 13,
Figure 14,
Figure 15 and
Figure 16) for each tree-based model visually represent the relative influence of each input variable on the model’s predictions. This analysis is a step towards model interpretability, helping to understand which factors are most critical in determining loan default risk according to each algorithm. Consistency in top features across different models would further strengthen the confidence in their predictive relevance.
Credit Score: A strong indicator of a borrower’s likelihood to default.
Debt-to-Income Ratio: Captures the borrower’s financial stability.
Loan Interest Rate: Higher interest rates are associated with higher likelihood of default.
Previous Loan Defaults: Borrowers with a history of defaults are more likely to default again.
4.5. Summary of Findings
The results indicate that Gradient Boosting is the most effective model for predicting loan defaults, offering a good balance of accuracy, F1-score, and recall. XGBoost also demonstrates competitive performance, particularly in terms of ROC AUC. While Random Forest and LightGBM lag slightly behind, they remain strong contenders due to their simplicity and efficiency.
5. Discussion
The results of this study demonstrate the effectiveness of machine learning models in predicting loan defaults, with Gradient Boosting emerging as the best performing model. This section interprets the findings in the context of the research question, discusses their implications for financial institutions, and explores potential areas for improvement. The statistical evaluation, based on metrics derived from confusion matrices and cross-validation, underpins these interpretations, providing a degree of confidence in the comparative performance of the models.
5.1. Interpretation of Findings in the Context of the Research Question
The primary research question addressed in this study was the following: How effective are machine learning models, such as XGBoost, Gradient Boosting, and Random Forest, in predicting loan defaults? The results indicate that machine learning models provide a highly effective approach for loan default prediction, significantly outperforming traditional statistical models (e.g., logistic regression) in previous studies.
Gradient Boosting demonstrated the best overall classification performance, achieving the highest accuracy (0.8887) and recall (0.8021), making it particularly suitable for minimizing financial risk associated with missed defaulters. XGBoost showed superior discriminatory power, as reflected in its highest ROC AUC score (0.9714), suggesting that it is well suited for risk ranking and credit scoring applications. Random Forest and LightGBM provided competitive performance, with lower computational costs, making them viable options when efficiency is prioritized. These findings confirm that machine learning models are highly effective for loan default prediction, offering improvements over traditional risk assessment techniques in terms of accuracy, recall, and potentially, though requiring effort, interpretability through XAI methods. The systematic comparison using metrics like F1-score and ROC AUC, coupled with cross-validation (e.g., Gradient Boosting CV F1-score of ), provides a statistically grounded basis for these conclusions. The consistency in performance across different evaluation metrics further strengthens the assertion of their effectiveness.
5.2. Implications for Financial Institutions
The findings of this study carry several critical implications for financial institutions, particularly regarding risk management, loan approval processes, profitability, and regulatory compliance.
5.2.1. Risk Management and Loan Approval Processes
Accurate prediction of loan defaults significantly enhances financial institutions’ risk management capabilities. By incorporating predictive machine learning models into automated decision-making systems, banks and lending institutions can optimize their loan approval processes. Such models allow institutions to systematically differentiate between high-risk and low-risk borrowers, thereby reducing the incidence of non-performing loans (NPLs). More specifically, the integration of machine learning-based risk scoring enables more precise customer segmentation. Institutions can leverage these segments to implement tailored credit pricing strategies, thereby efficiently balancing profitability and risk exposure. This approach aligns with best practices in modern credit risk management, emphasizing proactive risk identification and mitigation.
5.2.2. Impact on Profitability
From a profitability standpoint, machine learning models offer tangible advantages by directly reducing default-related losses and optimizing loan portfolio diversification. Improved accuracy in predicting defaults allows institutions to make informed lending decisions, consequently reducing default rates and associated financial losses. Additionally, the dynamic and granular credit risk profiling enabled by advanced machine learning techniques supports institutions in strategically diversifying their loan portfolios across various borrower segments. This approach minimizes overall portfolio risk while maximizing returns, which aligns with modern portfolio theory and enhances institutions’ financial resilience.
5.2.3. Regulatory and Compliance Considerations
Despite the substantial benefits of machine learning models, their adoption in financial institutions must consider stringent regulatory and compliance requirements, especially regarding interpretability and fairness. Regulatory bodies typically mandate transparency and clear explanations for credit decisions, particularly loan denials. Traditional credit scoring methods, such as logistic regression, inherently offer transparent decision criteria, whereas more sophisticated but opaque models like XGBoost and Gradient Boosting require supplementary explainability tools to satisfy regulatory scrutiny. To address these concerns, institutions should integrate Explainable AI (XAI) methods, which provide clear, intuitive explanations of predictions, thereby meeting regulatory standards for interpretability. Moreover, given increased scrutiny regarding fairness and bias, institutions must regularly perform audits and bias assessments on deployed models to ensure equitable and legally compliant decision-making [
3].
5.2.4. Deployment Challenges in Banking Systems
Beyond regulatory aspects, deploying these sophisticated machine learning models into existing banking information systems presents several practical challenges. First, integration with legacy IT infrastructure can be complex and costly, requiring significant modifications to support real-time data ingestion, processing, and model execution. Second, establishing robust data pipelines is crucial for feeding the models with high-quality, timely data, which may involve aggregating data from disparate sources and ensuring data integrity. Third, continuous monitoring of model performance is essential to detect concept drift or degradation in accuracy over time, necessitating mechanisms for regular retraining and validation. The iterative nature of model development means that the factors leading to changes in the decision function during retraining (e.g., shifts in customer behavior, economic conditions, or data distributions) must be understood and managed. Finally, the “black-box” nature of complex models, even with XAI techniques, can lead to resistance from internal stakeholders and require substantial training and change management efforts to ensure adoption and trust in the model’s outputs within the bank’s operational workflows.
5.3. Potential Improvements and Future Research Directions
Our study highlights several promising avenues for future research, aimed at enhancing model performance, addressing methodological limitations, and expanding practical applicability.
5.3.1. Advanced Ensemble Learning
While Gradient Boosting demonstrated superior performance, further improvements could be realized through more sophisticated ensemble learning techniques. Future research should explore stacking ensemble approaches, where a meta-model—such as logistic regression or a neural network—integrates predictions from multiple base learners (XGBoost, Random Forest, LightGBM). This method leverages complementary model strengths, potentially yielding superior predictive accuracy and robustness compared to simpler voting classifiers. Additionally, hybrid approaches combining deep learning with gradient boosting methods can offer enhanced feature representation capabilities, capturing complex non-linear interactions within financial data more effectively than traditional methods alone.
5.3.2. Handling Class Imbalance with Cost-Sensitive Learning
Explainability and Interpretability
Class imbalance remains an inherent challenge in financial datasets, often inadequately addressed by standard approaches like SMOTE or class weighting alone. Future research should explore cost-sensitive learning strategies that explicitly incorporate the financial consequences of misclassification into the learning process. By assigning asymmetric penalties based on the monetary impact of false positives versus false negatives, such cost-sensitive methods can optimize predictive models in ways that reflect realistic business considerations. Further improvements might be achieved through advanced hyperparameter tuning techniques, such as Bayesian optimization, explicitly targeting the optimal balance of recall and precision, thereby enhancing model performance in real-world credit-risk scenarios.
5.3.3. Moving from Binary to Multi-Class Risk Profiling
The current study frames loan default as a binary classification problem. A significant area for future work is to extend this to a multi-class risk profiling system (e.g., low, medium, high risk). This would allow financial institutions to move beyond simple approve/deny decisions toward more nuanced, risk-based strategies, such as adjusting loan terms or interest rates. Such an approach provides a more flexible and realistic framework for credit risk management.
5.3.4. Fairness and Equity-Based Model Comparison
Future research should move beyond comparing models solely on performance metrics. A more robust evaluation would involve comparing eligible models based on their impact on equity across different demographic groups, given a predefined “model acceptability threshold” for fairness. This requires incorporating fairness metrics (e.g., demographic parity, equalized odds) into the evaluation framework to ensure that the selected models are not only accurate but also ethically sound and do not perpetuate existing societal biases.
5.3.5. Incorporating Alternative Data Sources
Finally, traditional credit-risk prediction models predominantly rely on established financial metrics, such as credit scores and income. However, integrating alternative data sources can significantly augment predictive capabilities. Behavioral data—such as spending habits, mobile phone usage patterns, and online behaviors—can reveal deeper insights into borrower reliability and risk profiles. Additionally, social network analyses may provide supplementary measures of borrower credibility and social responsibility, while macroeconomic indicators, including inflation rates and employment statistics, could contextualize borrower behavior within broader economic conditions. Future research incorporating these alternative data sources into machine learning frameworks can offer financial institutions more comprehensive, nuanced, and accurate predictive insights, ultimately enhancing loan risk assessment and decision-making processes.
5.4. Summary of Discussion
This study confirms that machine learning models, particularly Gradient Boosting, offer substantial improvements in loan default prediction. The findings highlight practical benefits for financial institutions, including better risk management, improved loan approval efficiency, and enhanced profitability. However, challenges remain, particularly regarding regulatory compliance, model interpretability, and class imbalance. Future research should focus on explainable AI techniques, alternative data sources, and advanced ensemble methods to further enhance the robustness and fairness of loan classification models.
6. Conclusions
This study aimed to evaluate the effectiveness of machine learning models, including XGBoost, Gradient Boosting, Random Forest, and LightGBM, in predicting loan defaults. The results demonstrate that machine learning algorithms can significantly improve the accuracy and reliability of loan default prediction, with Gradient Boosting emerging as the best performing model in terms of accuracy (0.8887), recall (0.8021), and F1-score (0.8084). XGBoost also showed competitive performance, achieving the highest ROC AUC (0.9714), making it a strong candidate for credit risk ranking.
6.1. Key Findings and Practical Relevance
The findings of this study confirm that machine learning models offer substantial improvements in loan default prediction compared to traditional statistical approaches. The ability of these models to capture non-linear relationships in financial data allows for more accurate risk assessment, thereby improving decision-making in credit lending. Among the models evaluated, Gradient Boosting exhibited the best overall performance, balancing high predictive accuracy with strong recall, which is particularly beneficial for identifying high-risk borrowers. The feature importance analysis revealed that credit score, debt-to-income ratio, loan interest rate, and previous loan defaults were the most influential predictors, reinforcing the validity of the model’s decision-making process from a financial risk perspective. A post-training SHAP analysis confirmed that these features had consistent marginal contributions across samples, supporting the model’s interpretability.
Class imbalance significantly affected model performance, as imbalanced datasets often lead to biased predictions favoring the majority class. By applying Synthetic Minority Oversampling (SMOTE) and class weighting techniques, the study effectively improved recall for identifying defaulters. Gradient Boosting and XGBoost benefited the most from these techniques, demonstrating improved sensitivity to loan defaults. Financial institutions can leverage these findings to enhance risk management practices, streamline loan approval processes, and reduce the proportion of non-performing loans (NPLs). The integration of machine learning-based models into lending systems has the potential to improve profitability by enabling more precise borrower risk assessments. However, the black-box nature of machine learning models poses interpretability challenges, which may create regulatory concerns. While these models outperform traditional scoring methods in accuracy, their lack of transparency can limit their adoption in highly regulated financial environments.
6.2. Future Research Directions
While this study has demonstrated the effectiveness of machine learning models in loan default prediction, several areas warrant further investigation. One crucial area is the incorporation of Explainable AI (XAI) techniques, such as LIME (Local Interpretable Model-Agnostic Explanations), to enhance model interpretability. Financial institutions require transparent decision-making processes to comply with regulations and maintain customer trust, making explainability an essential consideration for future implementations. Another promising direction is the exploration of advanced ensemble learning techniques to further improve model performance. Stacking ensemble models, where multiple base learners are combined using a meta-learner, could provide additional predictive power by leveraging the strengths of different algorithms. Additionally, hybrid models integrating deep learning architectures with tree-based classifiers could enhance feature extraction and representation, potentially leading to even better classification accuracy.
Future studies should also focus on handling class imbalance using cost-sensitive learning methods rather than relying solely on SMOTE and class weighting. Cost-sensitive learning techniques assign misclassification penalties based on the financial impact of false positives and false negatives, ensuring that models optimize for real-world lending risks rather than statistical accuracy alone. Adaptive thresholding strategies can also be explored to fine-tune models for different lending scenarios.
Another valuable avenue for future research is the utilization of alternative data sources for credit scoring. Traditional credit risk assessments rely on structured financial data such as income and credit scores. However, alternative data, including behavioral patterns, transaction history, mobile phone usage, and macroeconomic indicators, could provide deeper insights into borrower risk, especially for individuals with limited credit history. Integrating these alternative data sources with machine learning models could lead to more inclusive and accurate lending decisions.
Finally, deploying machine learning models in real-world lending environments and conducting A/B testing with live borrower data would provide valuable insights into their operational performance. Implementing real-time monitoring systems could further refine the models by continuously updating them with new financial behaviors and risk trends. By testing these models in practical lending scenarios, researchers and financial institutions can assess their long-term impact on loan default rates and overall financial stability.
6.3. Final Remarks
This study confirms that machine learning models provide a powerful and effective solution for loan default prediction, significantly enhancing accuracy, recall, and overall risk assessment. However, practical deployment in financial institutions requires addressing challenges related to class imbalance, interpretability, and regulatory compliance. Future research should focus on integrating explainable AI techniques, advanced ensemble methods, and alternative data sources to further refine and enhance predictive capabilities. By leveraging machine learning-based credit risk models, financial institutions can make more informed lending decisions, minimize risk, and improve overall financial stability. Continued advancements in this field will pave the way for more intelligent, transparent, and fair lending systems.
Author Contributions
Conceptualization, X.Z., Y.T. and Y.L.; Methodology, X.Z. and L.H.; Investigation, X.Z. and T.Z.; Data curation, X.Z. and Z.G.; Formal analysis, T.Z., L.H., X.L. and Z.G.; Visualization, X.L.; Writing—original draft preparation, X.Z.; Writing—review and editing, T.Z., L.H., X.L., Z.G., Y.T. and Y.L.; Supervision, Y.L.; Project administration, Y.T. and Y.L. All authors have read and agreed to the published version of the manuscript.
Funding
This research received no external funding.
Data Availability Statement
The raw data supporting the conclusions of this article will be made available by the authors on request.
Conflicts of Interest
The authors declare no conflicts of interest.
References
- Kisutsa, G. Loan Default Prediction Using Machine Learning; University of Nairobi: Nairobi, Kenya, 2020. [Google Scholar]
- Srinivasulu, M. Loan Default Prediction Using Machine Learning Techniques. IOSR J. Comput. Eng. 2023, 25, 15–18. [Google Scholar]
- Lai, L. Loan Default Prediction with Machine Learning Techniques. In Proceedings of the 2020 International Conference on Computer Communication and Network Security (CCNS), Xi’an, China, 21–23 August 2020; pp. 5–9. [Google Scholar]
- Rahmani, R.; Parola, M.; Cimino, M.G.C.A. A Machine Learning Workflow to Address Credit Default Prediction. arXiv 2024, arXiv:2403.03785. [Google Scholar]
- Koc, O.; Ugur, O.; Kestel, A.S. The Impact of Feature Selection and Transformation on Machine Learning Methods in Determining the Credit Scoring. arXiv 2023, arXiv:2303.05427. [Google Scholar]
- Naik, K.S. Predicting Credit Risk for Unsecured Lending: A Machine Learning Approach. arXiv 2021, arXiv:2110.02206. [Google Scholar]
- Zhu, X.; Chu, Q.; Song, X.; Hu, P.; Peng, I.L. Explainable prediction of loan default based on machine learning models. Data Sci. Manag. 2023, 6, 123–133. [Google Scholar] [CrossRef]
- Abhi0323. Machine Learning-Based Loan Default Early Warning System. GitHub Repository, 2024. Available online: https://github.com/Abhi0323/Machine-Learning-Based-Loan-Default-Early-Warning-System (accessed on 12 July 2025).
- Majumder, P. Predicting Possible Loan Default Using Machine Learning; Analytics Vidhya: Indore, India, 2024. [Google Scholar]
- Jackson, R.H.G.; Wood, A. The Performance of Insolvency Prediction and Credit Risk Models in the UK: A Comparative Study. Br. Account. Rev. 2013, 45, 183–197. [Google Scholar] [CrossRef]
- Jakubik, P.; Teleu, S. Improving Credit Risk Assessment in Uncertain Times: Insights from IFRS 9. Risks 2025, 13, 38. [Google Scholar] [CrossRef]
- Robinson, N.; Sindhwani, N. Loan Default Prediction Using Machine Learning. In Proceedings of the 2024 11th International Conference on Reliability, Infocom Technologies and Optimization (Trends and Future Directions) (ICRITO), Noida, India, 14–15 March 2024; pp. 1–5. [Google Scholar]
- Hu, J.; Huang, L.; Li, W.; Xu, H. Financing Mechanisms and Preferences of Technology-Driven Small- and Medium-Sized Enterprises in the Digitalization Context. Systems 2025, 13, 68. [Google Scholar] [CrossRef]
- Wang, Y.; Qiang, S.; Yue, X.; Li, T.; Zhang, K. A Two-Layer Causal Knowledge Network Construction Method Based on Quality Problem-Solving Data. Systems 2025, 13, 142. [Google Scholar] [CrossRef]
- Dogan, A.; Birant, D. Machine Learning and Data Mining in Manufacturing. Expert Syst. Appl. 2021, 166, 1140. [Google Scholar] [CrossRef]
- Reynolds, M.; Spencer, S.; Dunaway, A.; Buckingham, D.; Bartman, T. Scientific Approach to Assess If Change Led to Improvement—Methods for Statistical Process Control Analysis in Quality Improvement. J. Emerg. Nurs. 2021, 47, 198–205. [Google Scholar] [CrossRef] [PubMed]
- Xu, Z.; Dang, Y. Data-Driven Causal Knowledge Graph Construction for Root Cause Analysis in Quality Problem Solving. Int. J. Prod. Res. 2023, 61, 3227–3245. [Google Scholar] [CrossRef]
- Li, F.; Xu, J.M.; Dou, Z.; Huang, Y.L. Data mining-based credit evaluation for users of credit card. In Proceedings of the 2004 International Conference on Machine Learning and Cybernetics (IEEE Cat. No. 04EX826), Shanghai, China, 26–29 August 2004; pp. 2586–2591. [Google Scholar]
- Kou, G.; Chao, X.; Peng, Y.; Alsaadi, F.E.; Herrera-Viedma, E. Machine learning methods for systemic risk analysis in financial sectors. Technol. Econ. Dev. Econ. 2019, 25, 716–742. [Google Scholar] [CrossRef]
- Xing, Z.; Zhao, W. Block-Diagonal Guided DBSCAN Clustering. IEEE Trans. Knowl. Data Eng. 2024, 36, 5709–5722. [Google Scholar] [CrossRef]
- Souadda, L.I.; Halitim, A.R.; Benilles, B.; Oliveira, J.M.; Ramos, P. Optimizing Credit Risk Prediction for Peer-to-Peer Lending Using Machine Learning. Forecasting 2025, 7, 35. [Google Scholar] [CrossRef]
- Khudoyorova, F.; Khusainov, F. Big Data Analytics in Financial Services: Opportunities and Challenges. EIMJE 2024, 2, 475–479. [Google Scholar]
- Xu, K.; Chen, L.; Wang, S. Drift2Matrix: Kernel-Induced Self Representation for Concept Drift Adaptation in Co-evolving Time Series. arXiv 2025, arXiv:2501.01480. [Google Scholar]
- Shi, S.; Tse, R.; Luo, W.; D’Addona, S.; Pau, G. Machine learning-driven credit risk: A systemic review. Neural Comput. Appl. 2022, 34, 14327–14339. [Google Scholar] [CrossRef]
- Zonnenshain, A.; Kenett, R.S. Quality 4.0—The Challenging Future of Quality Engineering. Qual. Eng. 2020, 32, 614–626. [Google Scholar] [CrossRef]
- Černevičienė, J.; Kabašinskas, A. Explainable artificial intelligence (XAI) in finance: A systematic literature review. Artif. Intell. Rev. 2024, 57, 216. [Google Scholar] [CrossRef]
- Heng, Y.S.; Subramanian, P. A Systematic Review of Machine Learning and Explainable Artificial Intelligence (XAI) in Credit Risk Modelling. In Proceedings of the Future Technologies Conference (FTC) 2022, Virtual Event, 20–21 October 2022; Springer: Cham, Switzerland, 2023; Volume 1, pp. 596–614. [Google Scholar]
- Teles, G.; Rodrigues, J.J.P.C.; Rabê, R.A.L.; Kozlov, S.A. Artificial neural network and Bayesian network models for credit risk prediction. J. Artif. Intell. Syst. 2020, 2, 118–132. [Google Scholar] [CrossRef]
- Yazdi, M.S.; Kabir, S. Fuzzy Evidence Theory and Bayesian Networks for Process Systems Risk Analysis. Hum. Ecol. Risk Assess. Int. J. 2020, 26, 57–86. [Google Scholar] [CrossRef]
- Kumar, S.; Vivek, Y.; Ravi, V.; Bose, I. Causal Inference for Banking Finance and Insurance. arXiv 2023, arXiv:2307.16427. [Google Scholar]
- Geiger, A.; Wu, Z.; Potts, C.; Icard, T.; Goodman, N.D. Finding Alignments Between Interpretable Causal Variables and Distributed Neural Representations. arXiv 2024, arXiv:2303.02536. [Google Scholar]
- Kruthika, M.S.; Rajadevi, R.; Senthilvadivu, K.; Lavanya, J.; Deepak, D.; Lavanya, G. Comparative study of Machine Learning Approaches for Loan Approval Prediction in financial sector. In Proceedings of the 2024 15th International Conference on Computing Communication and Networking Technologies (ICCCNT), Kamand, India, 24–28 June 2024; pp. 1–6. [Google Scholar]
- Pearl, J. The Seven Tools of Causal Inference, with Reflections on Machine Learning. Commun. ACM 2019, 62, 54–60. [Google Scholar] [CrossRef]
- Chang, Y.C.; Chang, K.H.; Wu, G.J. Application of eXtreme gradient boosting trees in the construction of credit risk assessment models for financial institutions. Appl. Soft Comput. 2018, 73, 914–920. [Google Scholar] [CrossRef]
- Dhokane, R.M.; Sharma, O.P. A Comprehensive Review of Machine Learning for Financial Market Prediction Methods. In Proceedings of the 2023 International Conference on Emerging Smart Computing and Informatics (ESCI), Pune, India, 1–3 March 2023; pp. 1–8. [Google Scholar]
- Li, X.; Yang, Z.; Quan, R.; Yang, Y. DRIP: Unleashing Diffusion Priors for Joint Foreground and Alpha Prediction in Image Matting. In Proceedings of the 38th Annual Conference Neural Information Process Systems, Vancouver, BC, Canada, 10–15 December 2024. [Google Scholar]
- Zhong, J.; Wang, Y. Enhancing Thyroid Disease Prediction Using Machine Learning: A Comparative Study of Ensemble Models and Class Balancing Techniques. Res. Sq. 2025. [Google Scholar] [CrossRef]
- Oualid, A.; Hansali, A.; Balouki, Y.; Moumoun, L. Application of machine learning techniques for credit risk management: A survey. In Advances in Information, Communication and Cybersecurity: Proceedings of ICI2C’21; Springer: Cham, Switzerland, 2022; pp. 180–191. [Google Scholar]
- Hünermund, P.; Kaminski, J.; Schmitt, C. Causal machine learning and business decision making. SSRN 2022, 3867326. [Google Scholar] [CrossRef]
- Chen, T.; Guestrin, C. XGBoost: A Scalable Tree Boosting System. In Proceedings of the 22nd ACM SIGKDD International Conference on Knowledge Discovery and Data Mining, San Francisco, CA, USA, 13–17 August 2016; pp. 785–794. [Google Scholar]
- Breiman, L. Random Forests. Mach. Learn. 2001, 45, 5–32. [Google Scholar] [CrossRef]
- Ke, G.; Meng, Q.; Finley, T.; Wang, T.; Chen, W.; Ma, W.; Ye, Q.; Liu, T. LightGBM: A Highly Efficient Gradient Boosting Decision Tree. In Proceedings of the Advances in Neural Information Processing Systems (NeurIPS), Long Beach, CA, USA, 4–9 December 2017; Volume 30, pp. 3146–3154. [Google Scholar]
- Friedman, J.H. Greedy Function Approximation: A Gradient Boosting Machine. Ann. Stat. 2001, 29, 1189–1232. [Google Scholar] [CrossRef]
- Chawla, N.V.; Bowyer, K.W.; Hall, L.O.; Kegelmeyer, W.P. SMOTE: Synthetic Minority Over-sampling Technique. J. Artif. Intell. Res. 2002, 16, 321–357. [Google Scholar] [CrossRef]
- He, H.; Garcia, E.A. Learning from Imbalanced Data. IEEE Trans. Knowl. Data Eng. 2009, 21, 1263–1284. [Google Scholar]
Figure 1.
Distribution of borrower ages.
Figure 1.
Distribution of borrower ages.
Figure 2.
Distribution of credit scores. The blue line represents the kernel density estimate showing the probability density of the distribution.
Figure 2.
Distribution of credit scores. The blue line represents the kernel density estimate showing the probability density of the distribution.
Figure 3.
Distribution of applicant income.
Figure 3.
Distribution of applicant income.
Figure 4.
Relationship between applicant income and requested loan amount.
Figure 4.
Relationship between applicant income and requested loan amount.
Figure 5.
Distribution of loan interest rates.
Figure 5.
Distribution of loan interest rates.
Figure 6.
Distribution of requested loan amounts. The blue line represents the kernel density estimate of the distribution.
Figure 6.
Distribution of requested loan amounts. The blue line represents the kernel density estimate of the distribution.
Figure 7.
Loan default rates by gender.
Figure 7.
Loan default rates by gender.
Figure 8.
ROC curve for the LightGBM model. The area under the curve (AUC) is 0.97, indicating strong discriminatory performance between positive and negative classes. The blue dashed line represents the random classifier baseline (AUC = 0.5), providing a reference point for model performance evaluation. This plot visually represents the trade-off between the true positive rate and false positive rate, and a higher AUC signifies a better model at distinguishing defaulters from non-defaulters.
Figure 9.
Gradient Boosting Confusion Matrix. This visualization provides a clear representation of the classification results for the Gradient Boosting model, aiding in the quick assessment of its performance in distinguishing between default and non-default cases.
Figure 9.
Gradient Boosting Confusion Matrix. This visualization provides a clear representation of the classification results for the Gradient Boosting model, aiding in the quick assessment of its performance in distinguishing between default and non-default cases.
Figure 10.
XGBoost Confusion Matrix. Similarly, this plot illustrates the XGBoost model’s classification accuracy, allowing for a direct comparison of its error types with other models.
Figure 10.
XGBoost Confusion Matrix. Similarly, this plot illustrates the XGBoost model’s classification accuracy, allowing for a direct comparison of its error types with other models.
Figure 11.
LightGBM Confusion Matrix. This figure presents the confusion matrix for LightGBM, highlighting its specific strengths and weaknesses in classifying loan applicants.
Figure 11.
LightGBM Confusion Matrix. This figure presents the confusion matrix for LightGBM, highlighting its specific strengths and weaknesses in classifying loan applicants.
Figure 12.
Random Forest Confusion Matrix. This visualization shows the Random Forest model’s performance, completing the comparative set of confusion matrices for detailed error analysis.
Figure 12.
Random Forest Confusion Matrix. This visualization shows the Random Forest model’s performance, completing the comparative set of confusion matrices for detailed error analysis.
Figure 13.
Gradient Boosting Feature Importance. This plot highlights the features that most significantly influence the Gradient Boosting model’s decisions, offering insights into the drivers of its predictions.
Figure 13.
Gradient Boosting Feature Importance. This plot highlights the features that most significantly influence the Gradient Boosting model’s decisions, offering insights into the drivers of its predictions.
Figure 14.
XGBoost Feature Importance. This visualization displays the feature importance scores for the XGBoost model, allowing comparison with other models regarding influential predictors.
Figure 14.
XGBoost Feature Importance. This visualization displays the feature importance scores for the XGBoost model, allowing comparison with other models regarding influential predictors.
Figure 15.
LightGBM Feature Importance. This plot shows which features are deemed most important by the LightGBM algorithm, contributing to an understanding of its decision-making process.
Figure 15.
LightGBM Feature Importance. This plot shows which features are deemed most important by the LightGBM algorithm, contributing to an understanding of its decision-making process.
Figure 16.
Random Forest Feature Importance. This figure illustrates the feature importance according to the Random Forest model, providing another perspective on the key drivers of loan default.
Figure 16.
Random Forest Feature Importance. This figure illustrates the feature importance according to the Random Forest model, providing another perspective on the key drivers of loan default.
Table 1.
Comparative Summary of Key Literature Findings on Loan Default Prediction.
Table 1.
Comparative Summary of Key Literature Findings on Loan Default Prediction.
| Study | Focus Area | Methods/Models | Key Findings |
|---|
| [1] | Mobile-based lending | Decision Trees, SVM, Logistic Regression | Decision trees performed well in handling categorical variables and non-linear relationships. |
| [3] | Model comparison | Gradient Boosting, Random Forest, Logistic Regression | Gradient Boosting and Random Forest achieved significantly higher accuracy and F1-scores. |
| [8] | Ensemble learning | Voting classifier (Gradient Boosting, Random Forest, XGBoost) | Ensemble methods yielded superior results compared to individual models, enhancing robustness. |
| [7] | Class imbalance and interpretability | SMOTE, Ensemble Learning, XAI | SMOTE combined with ensemble learning improved recall for the minority class (defaulters). Post hoc XAI methods are needed for transparency. |
| [10] | Interpretability vs. Performance | Insolvency prediction models | Highlighted the trade-off between model performance and interpretability, which is crucial for regulatory compliance. |
Table 2.
Performance metrics for each model on the testing dataset.
Table 2.
Performance metrics for each model on the testing dataset.
| Model | Accuracy | F1-Score | ROC AUC | Precision | Recall |
|---|
| XGBoost | 0.8230 | 0.7868 | 0.9714 | 0.8014 | 0.7743 |
| Random Forest | 0.7986 | 0.7843 | 0.9696 | 0.7970 | 0.7719 |
| LightGBM | 0.7961 | 0.7767 | 0.9683 | 0.7896 | 0.7624 |
| Gradient Boosting | 0.8887 | 0.8084 | 0.9709 | 0.8152 | 0.8021 |
Table 3.
Gradient Boosting Confusion Matrix.
Table 3.
Gradient Boosting Confusion Matrix.
| Actual\Predicted | Default | Non-Default |
|---|
| Default | 320 | 40 |
| Non-Default | 60 | 1580 |
Table 4.
XGBoost Confusion Matrix.
Table 4.
XGBoost Confusion Matrix.
| Actual\Predicted | Default | Non-Default |
|---|
| Default | 312 | 48 |
| Non-Default | 72 | 1568 |
Table 5.
Random Forest Confusion Matrix.
Table 5.
Random Forest Confusion Matrix.
| Actual\Predicted | Default | Non-Default |
|---|
| Default | 310 | 50 |
| Non-Default | 74 | 1566 |
| Disclaimer/Publisher’s Note: The statements, opinions and data contained in all publications are solely those of the individual author(s) and contributor(s) and not of MDPI and/or the editor(s). MDPI and/or the editor(s) disclaim responsibility for any injury to people or property resulting from any ideas, methods, instructions or products referred to in the content. |
© 2025 by the authors. Licensee MDPI, Basel, Switzerland. This article is an open access article distributed under the terms and conditions of the Creative Commons Attribution (CC BY) license (https://creativecommons.org/licenses/by/4.0/).


 ,
, 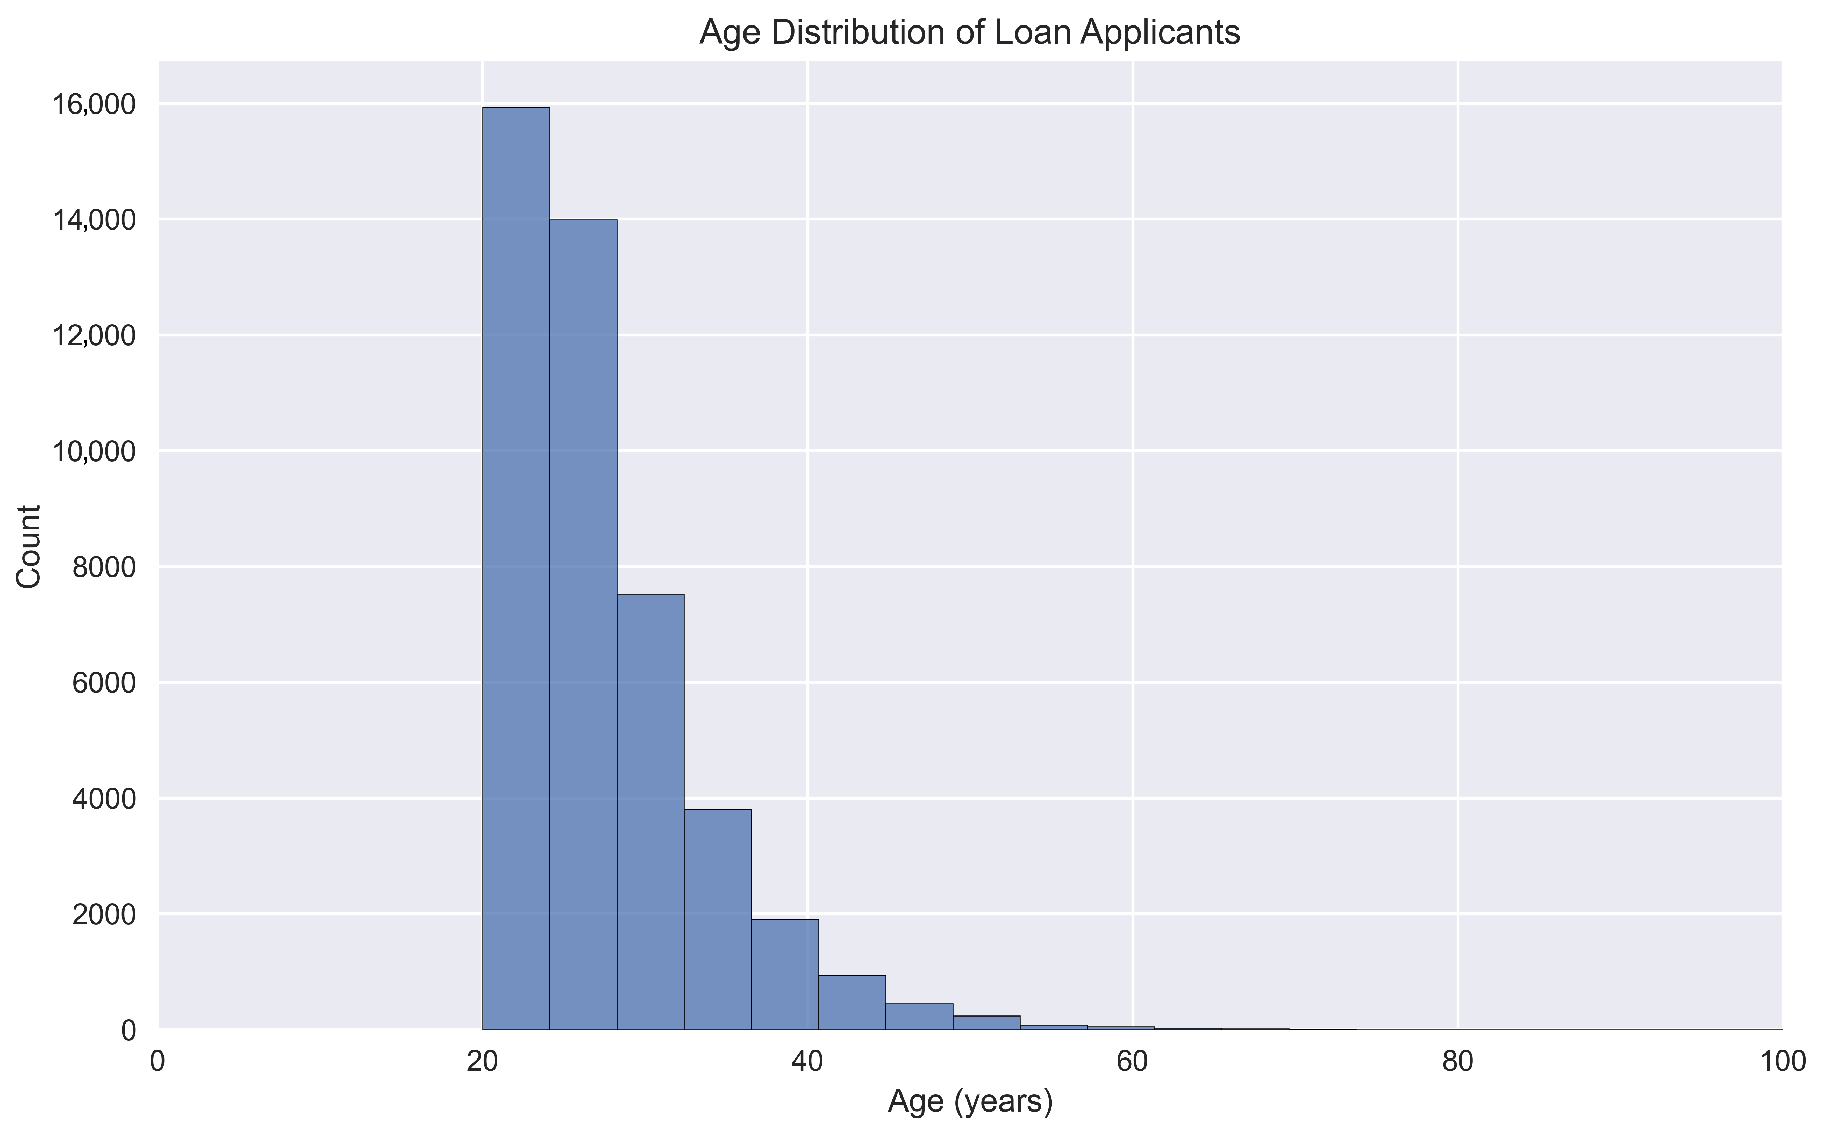
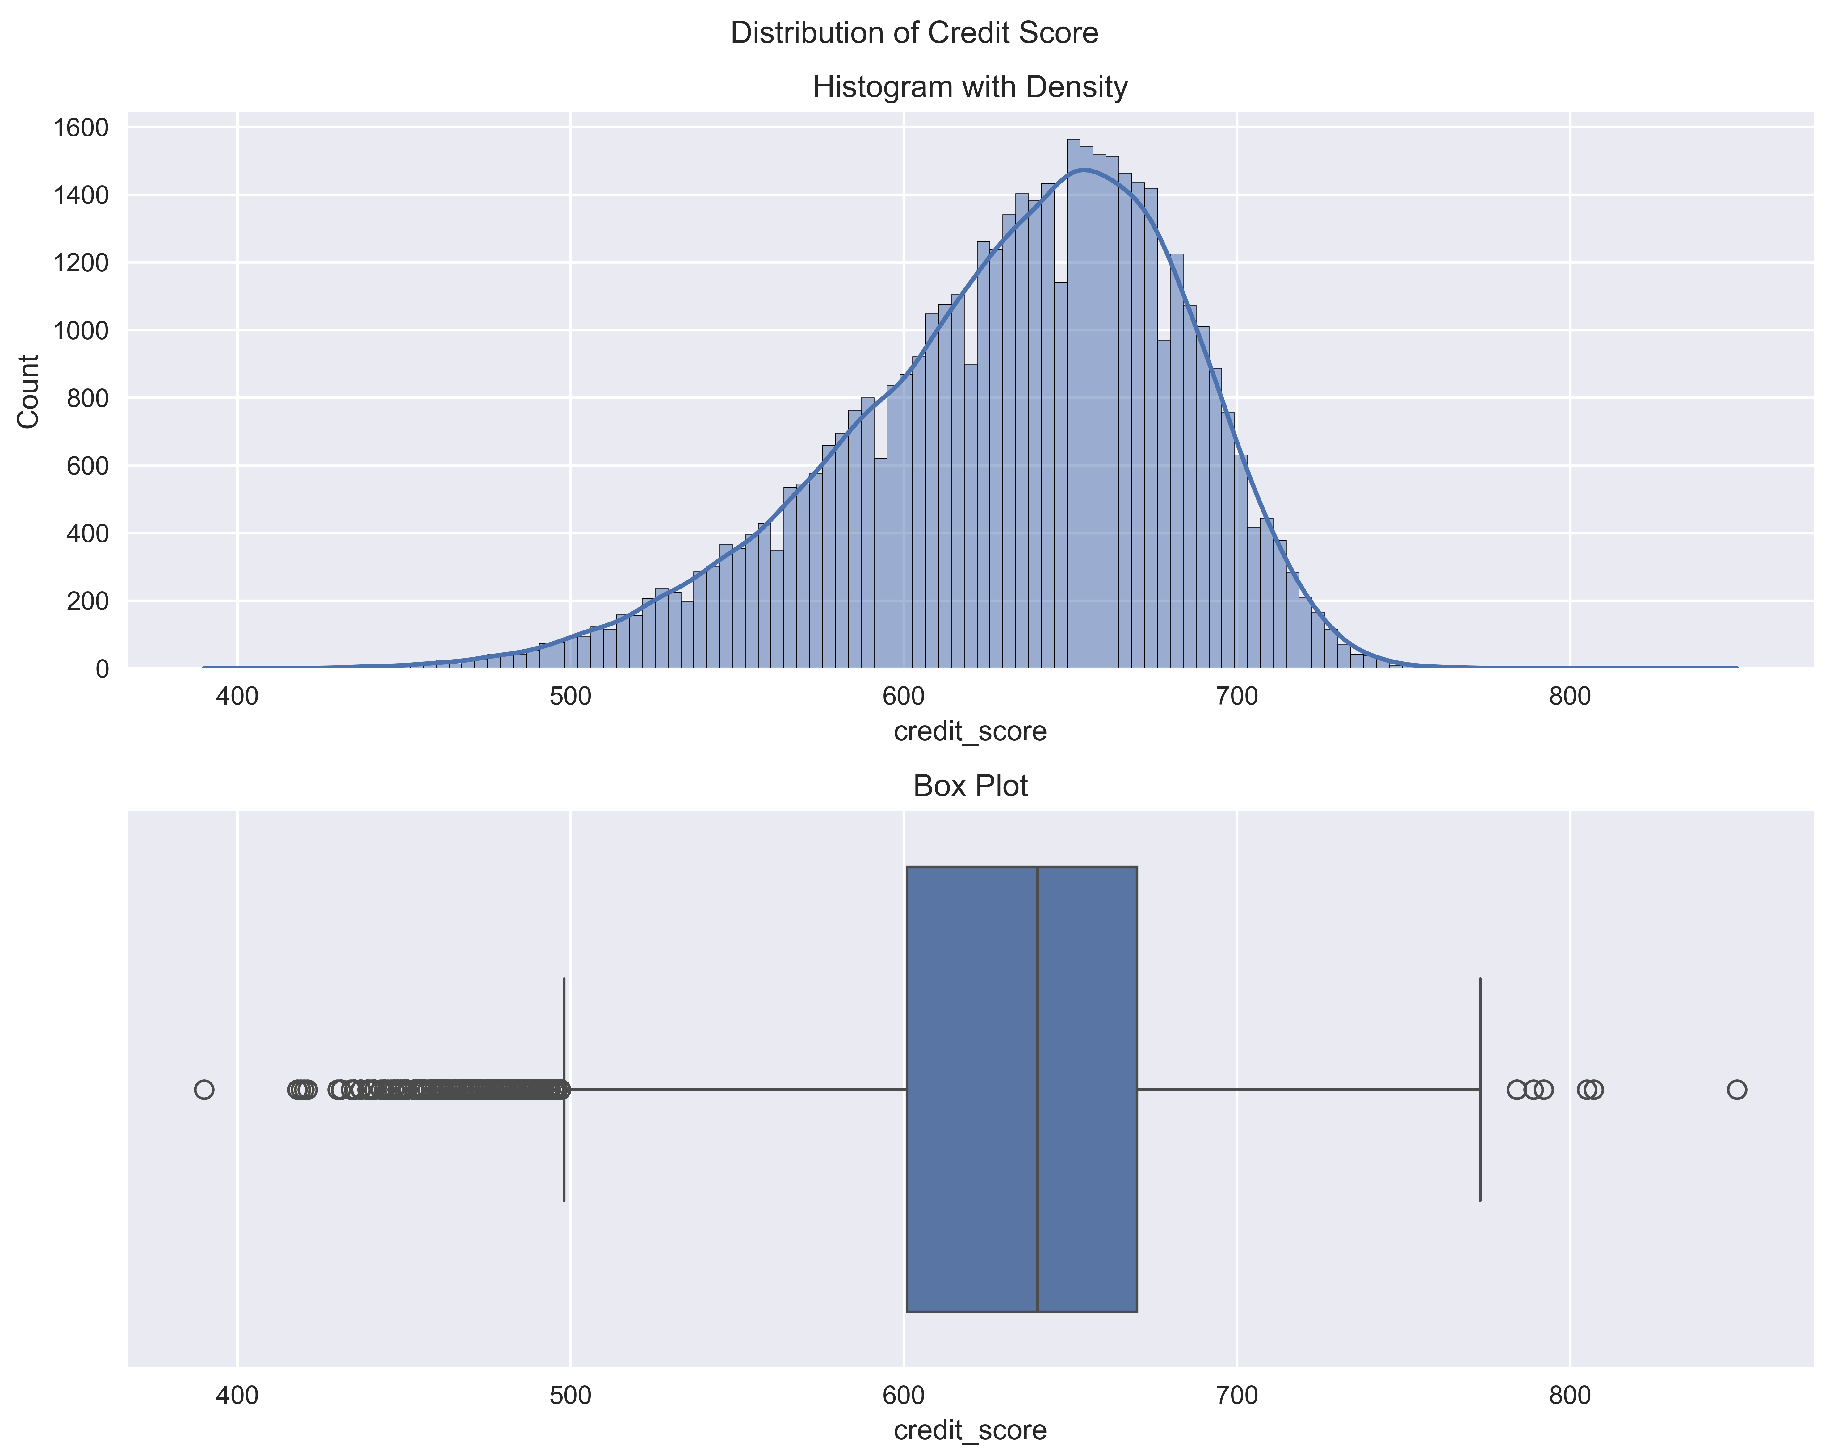
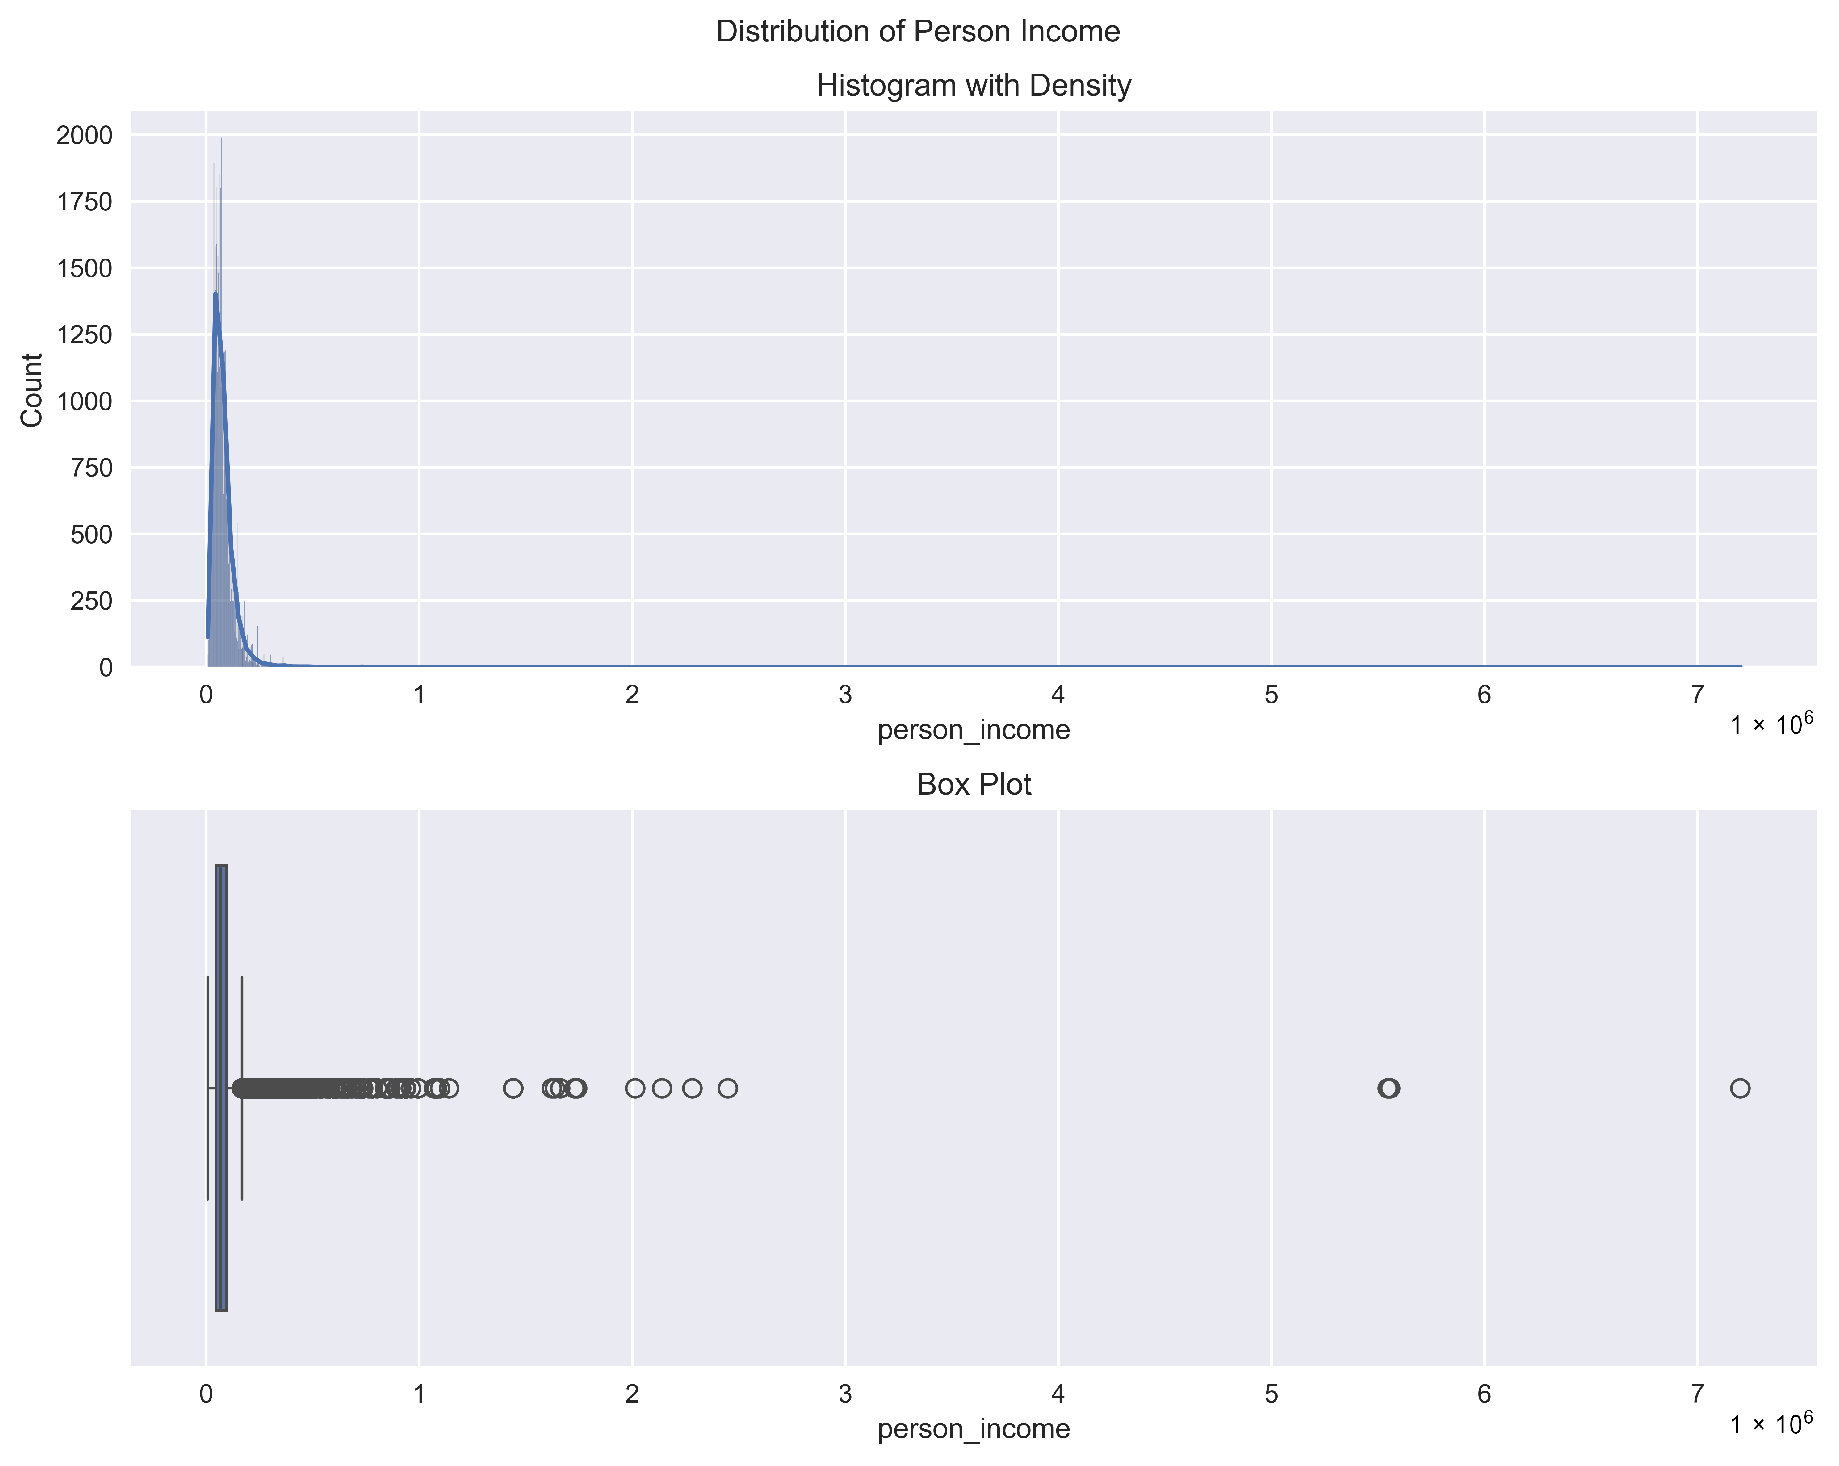
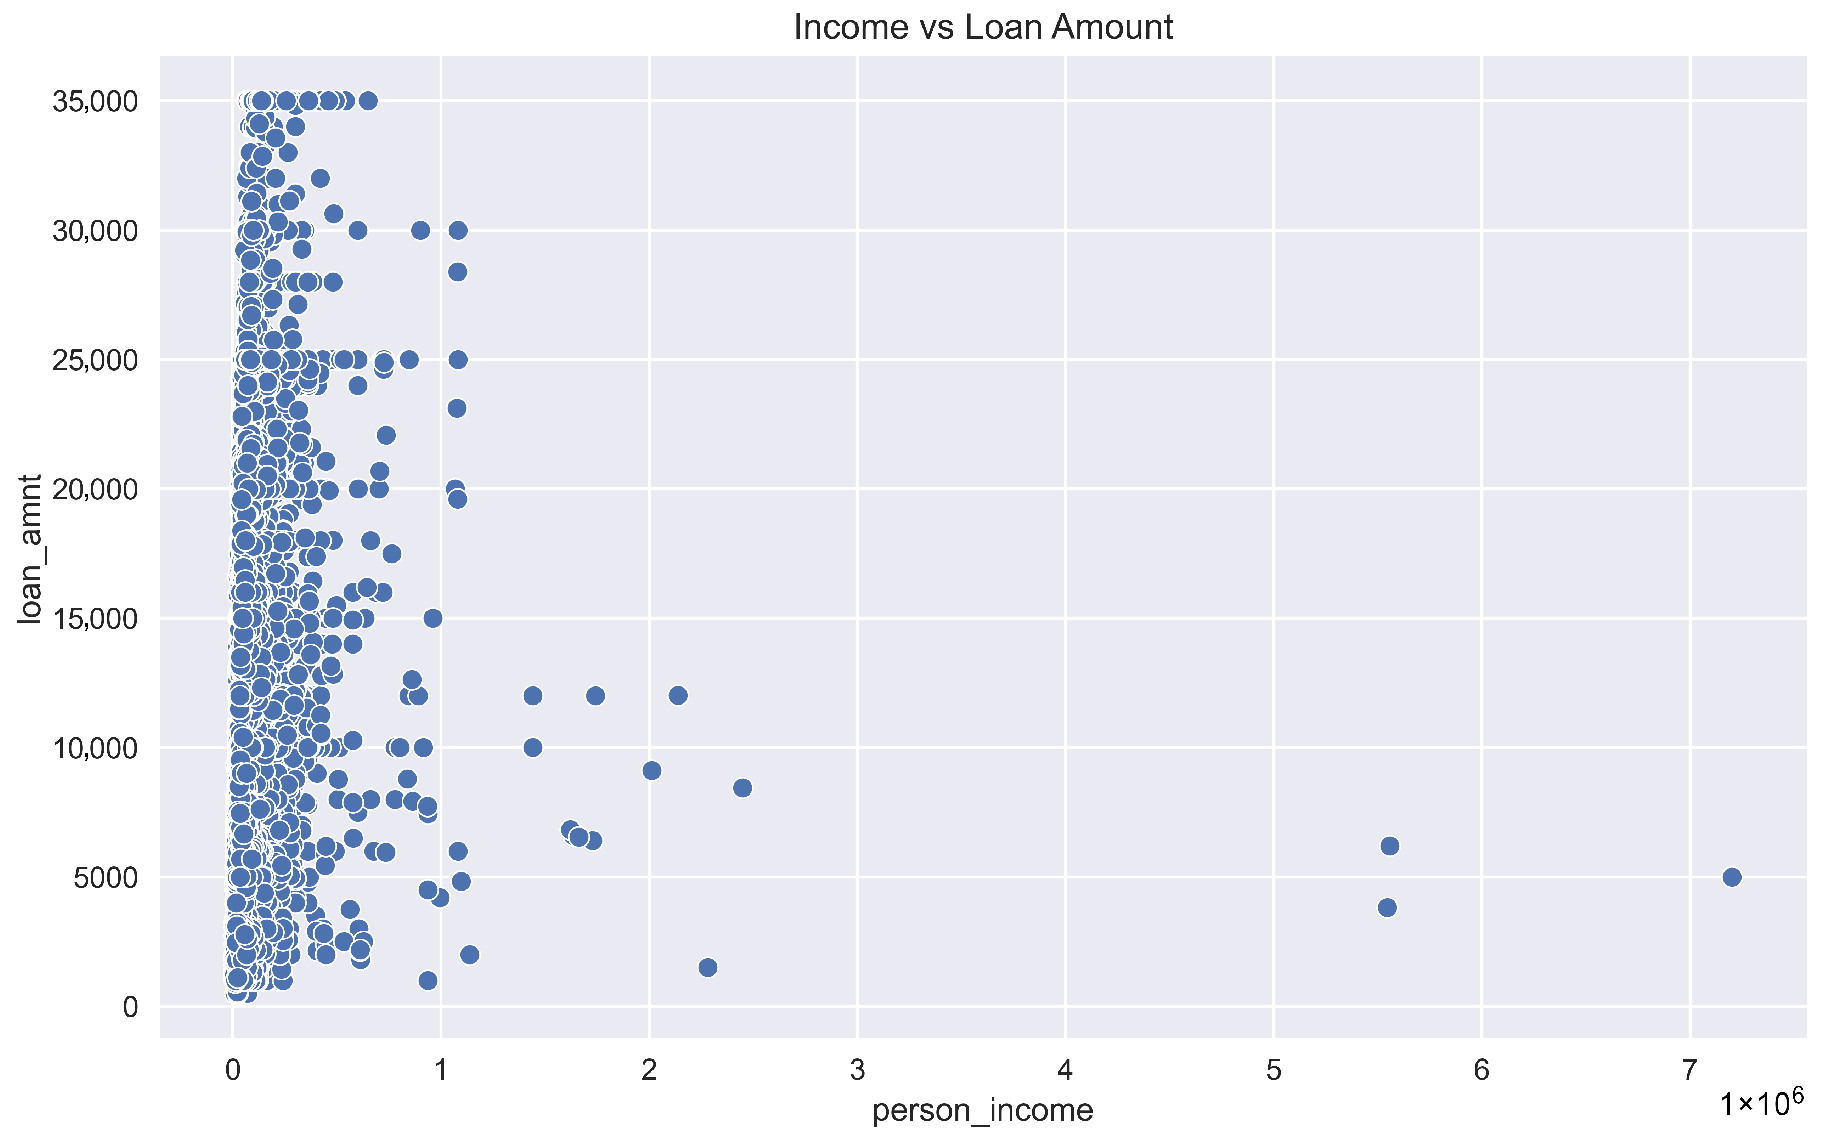
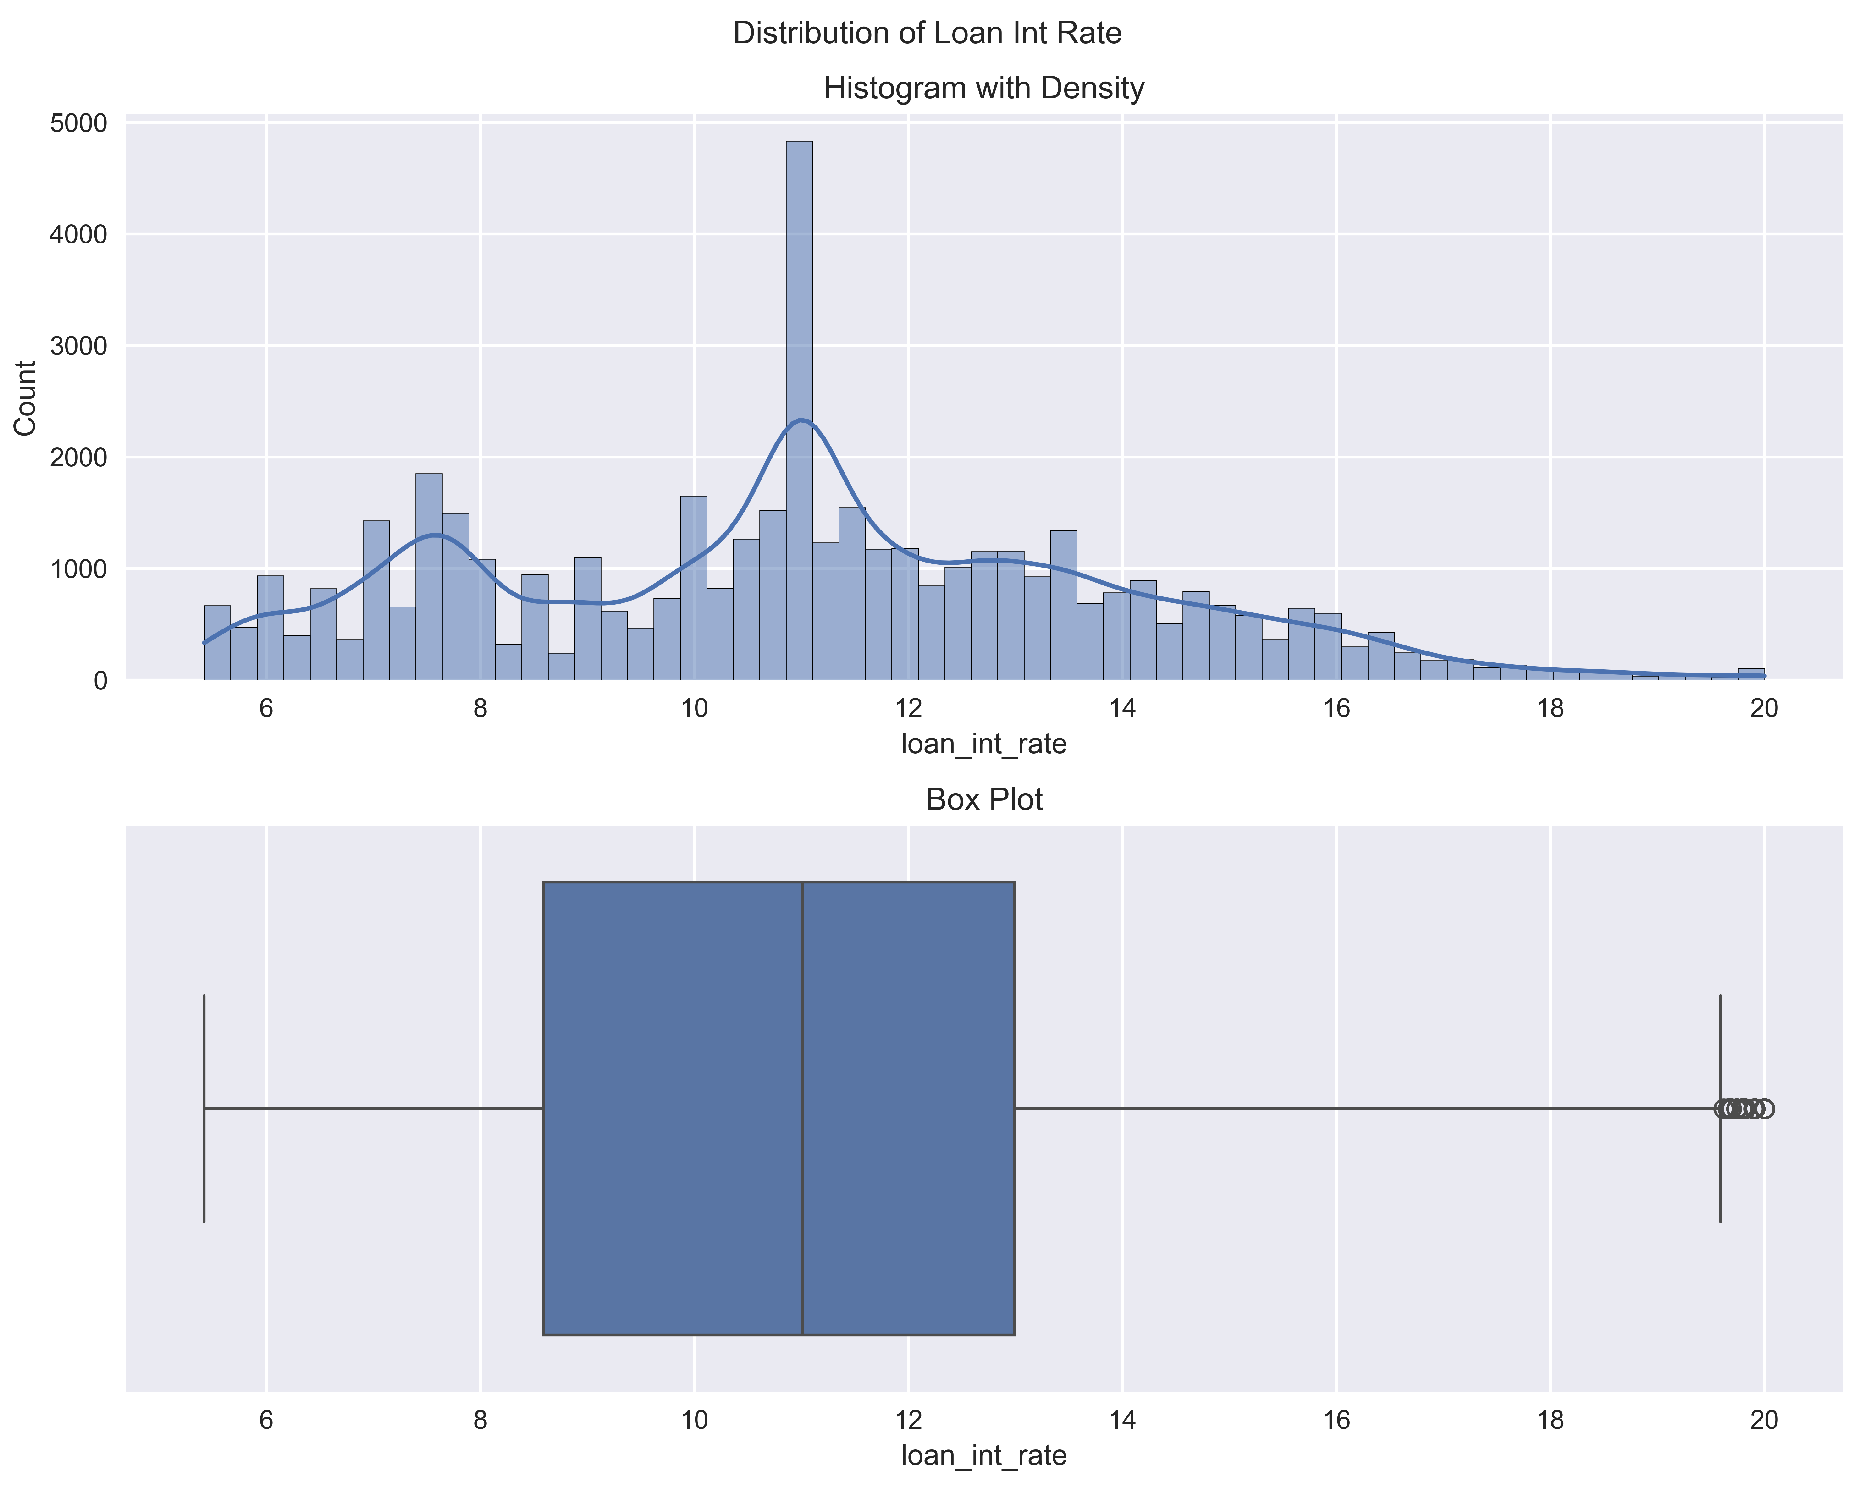
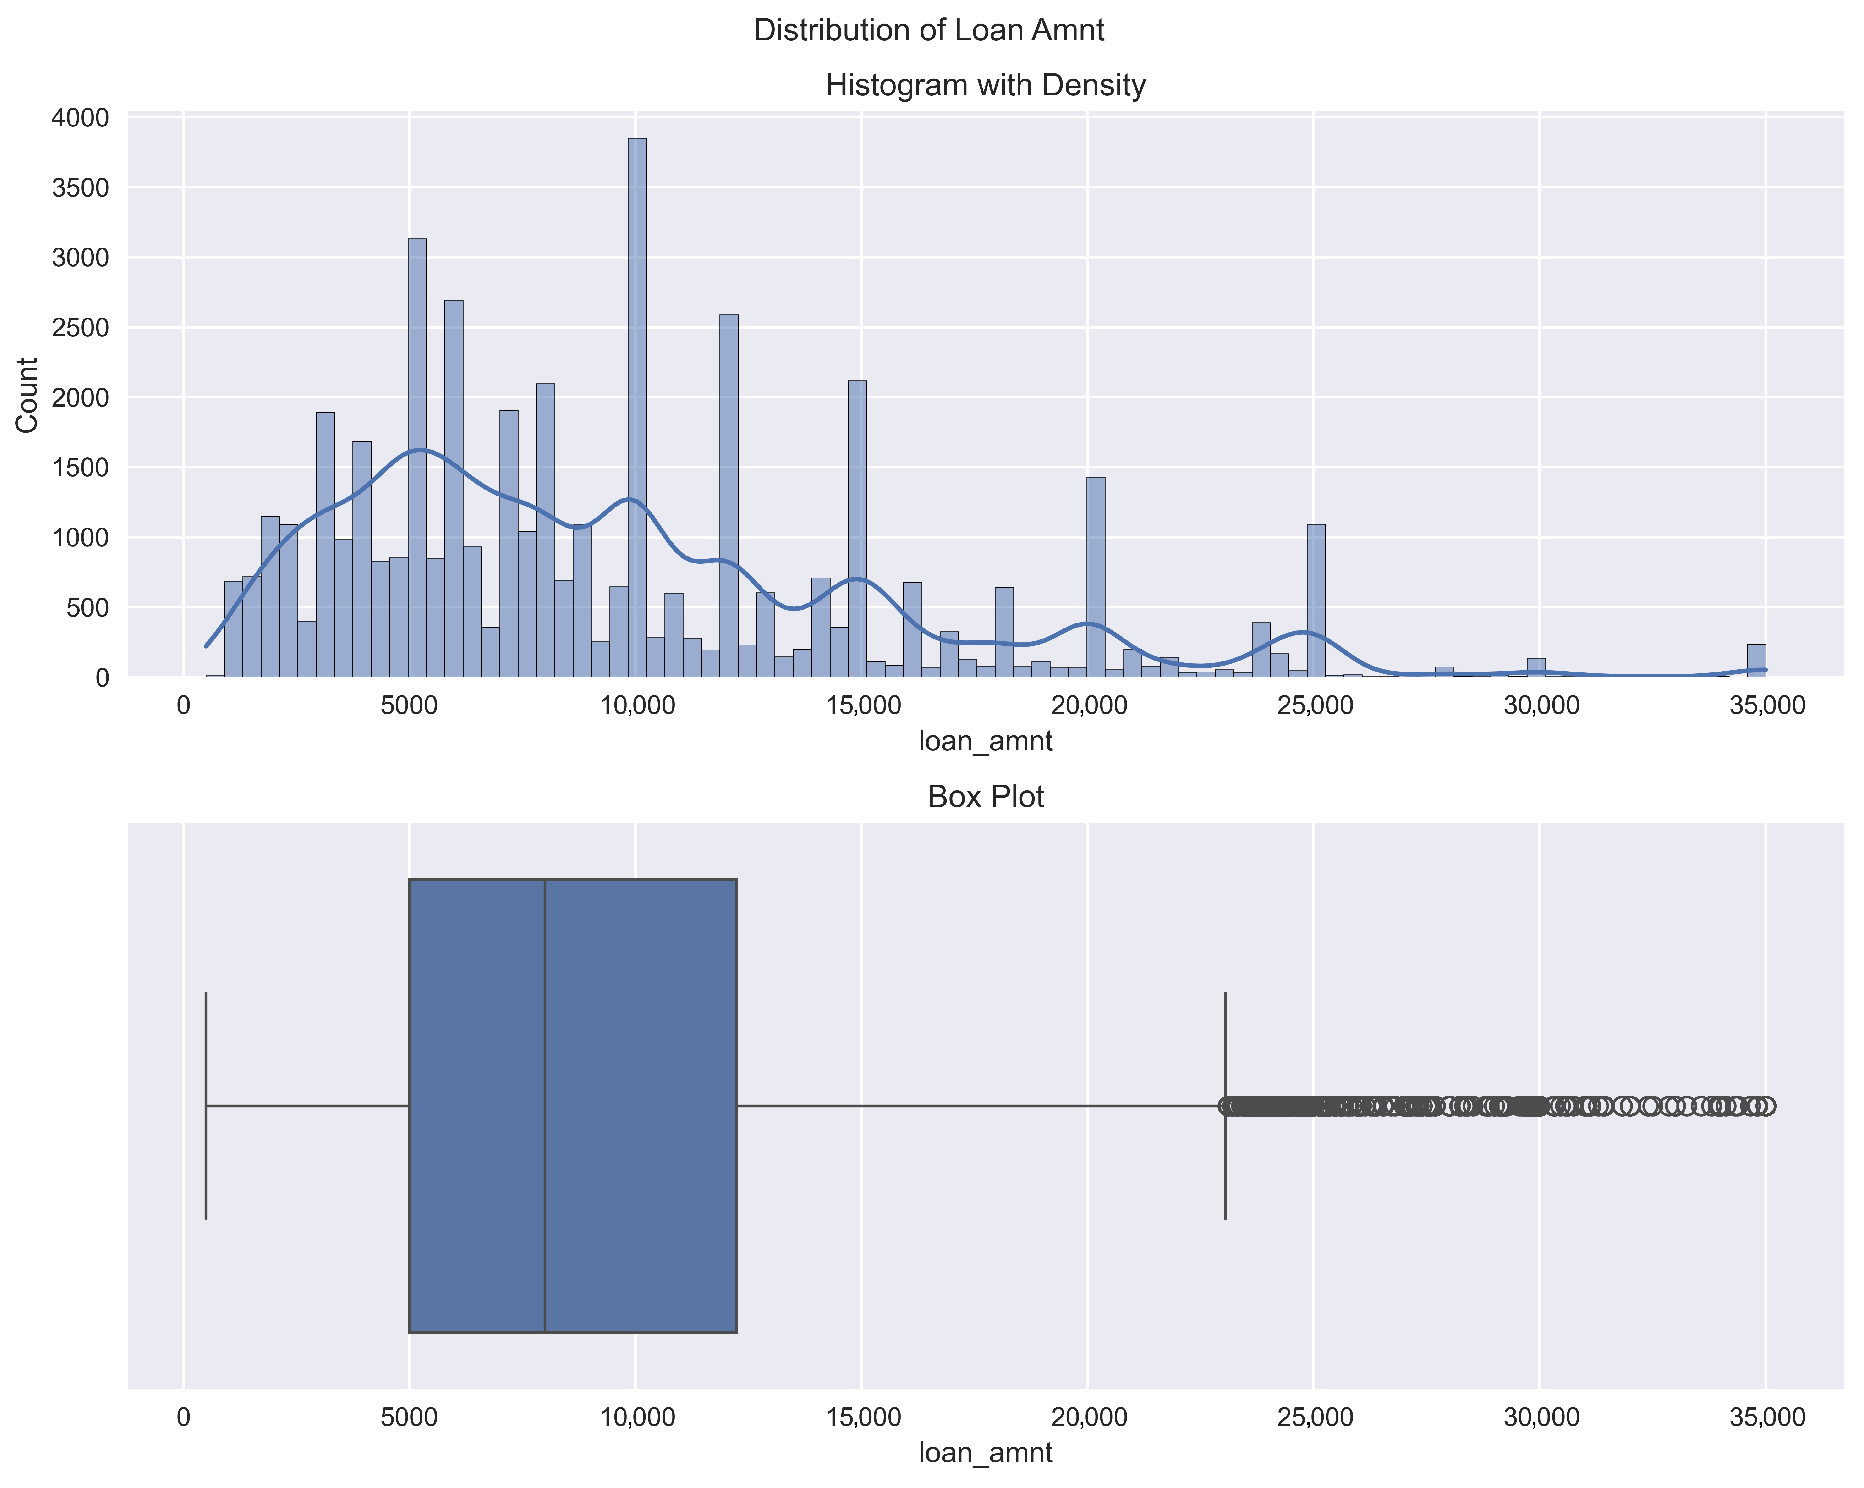
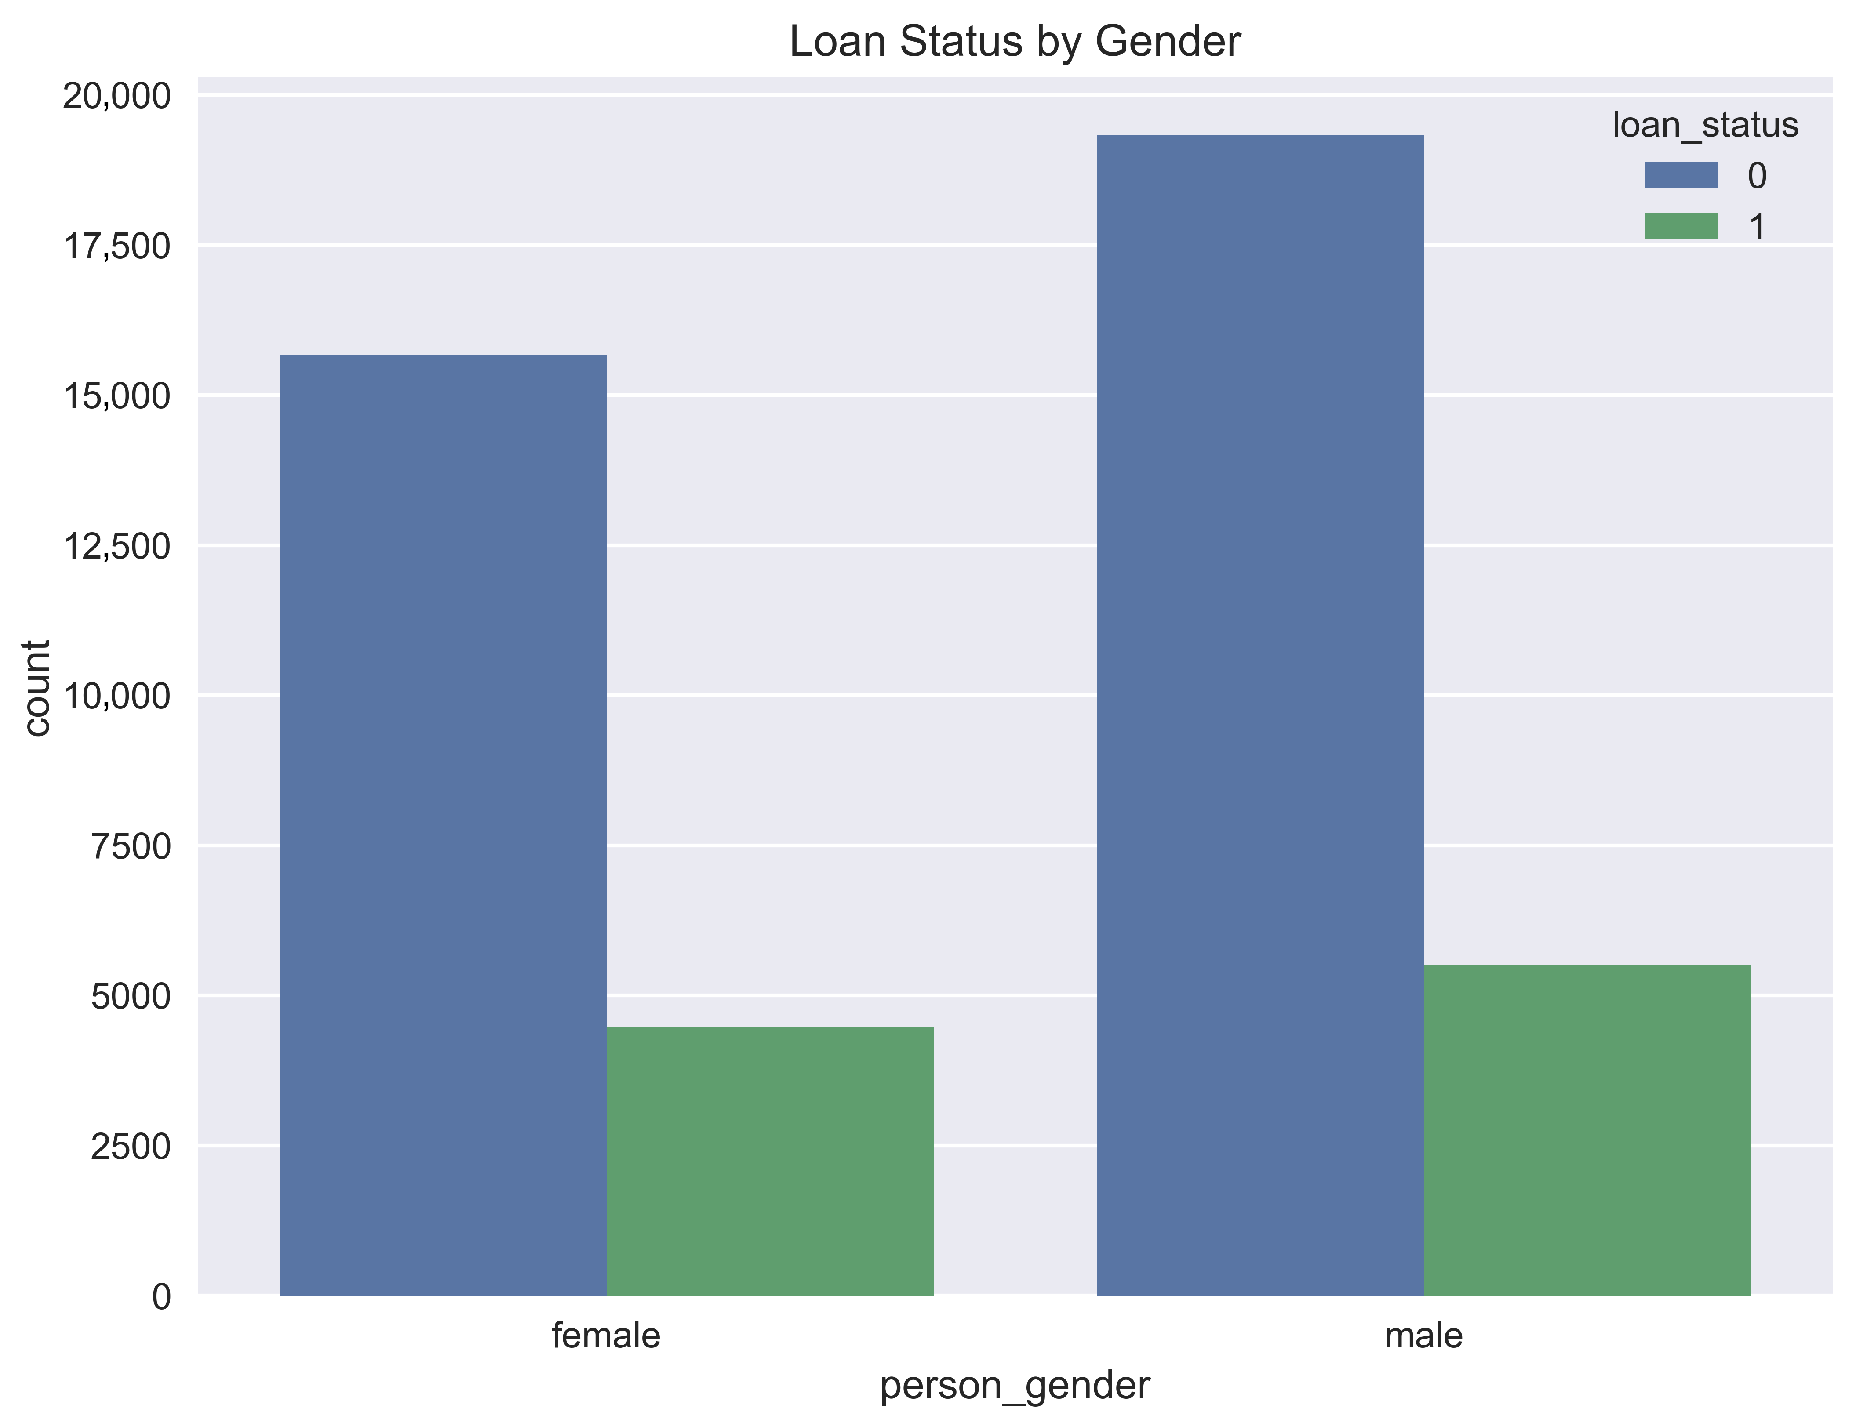
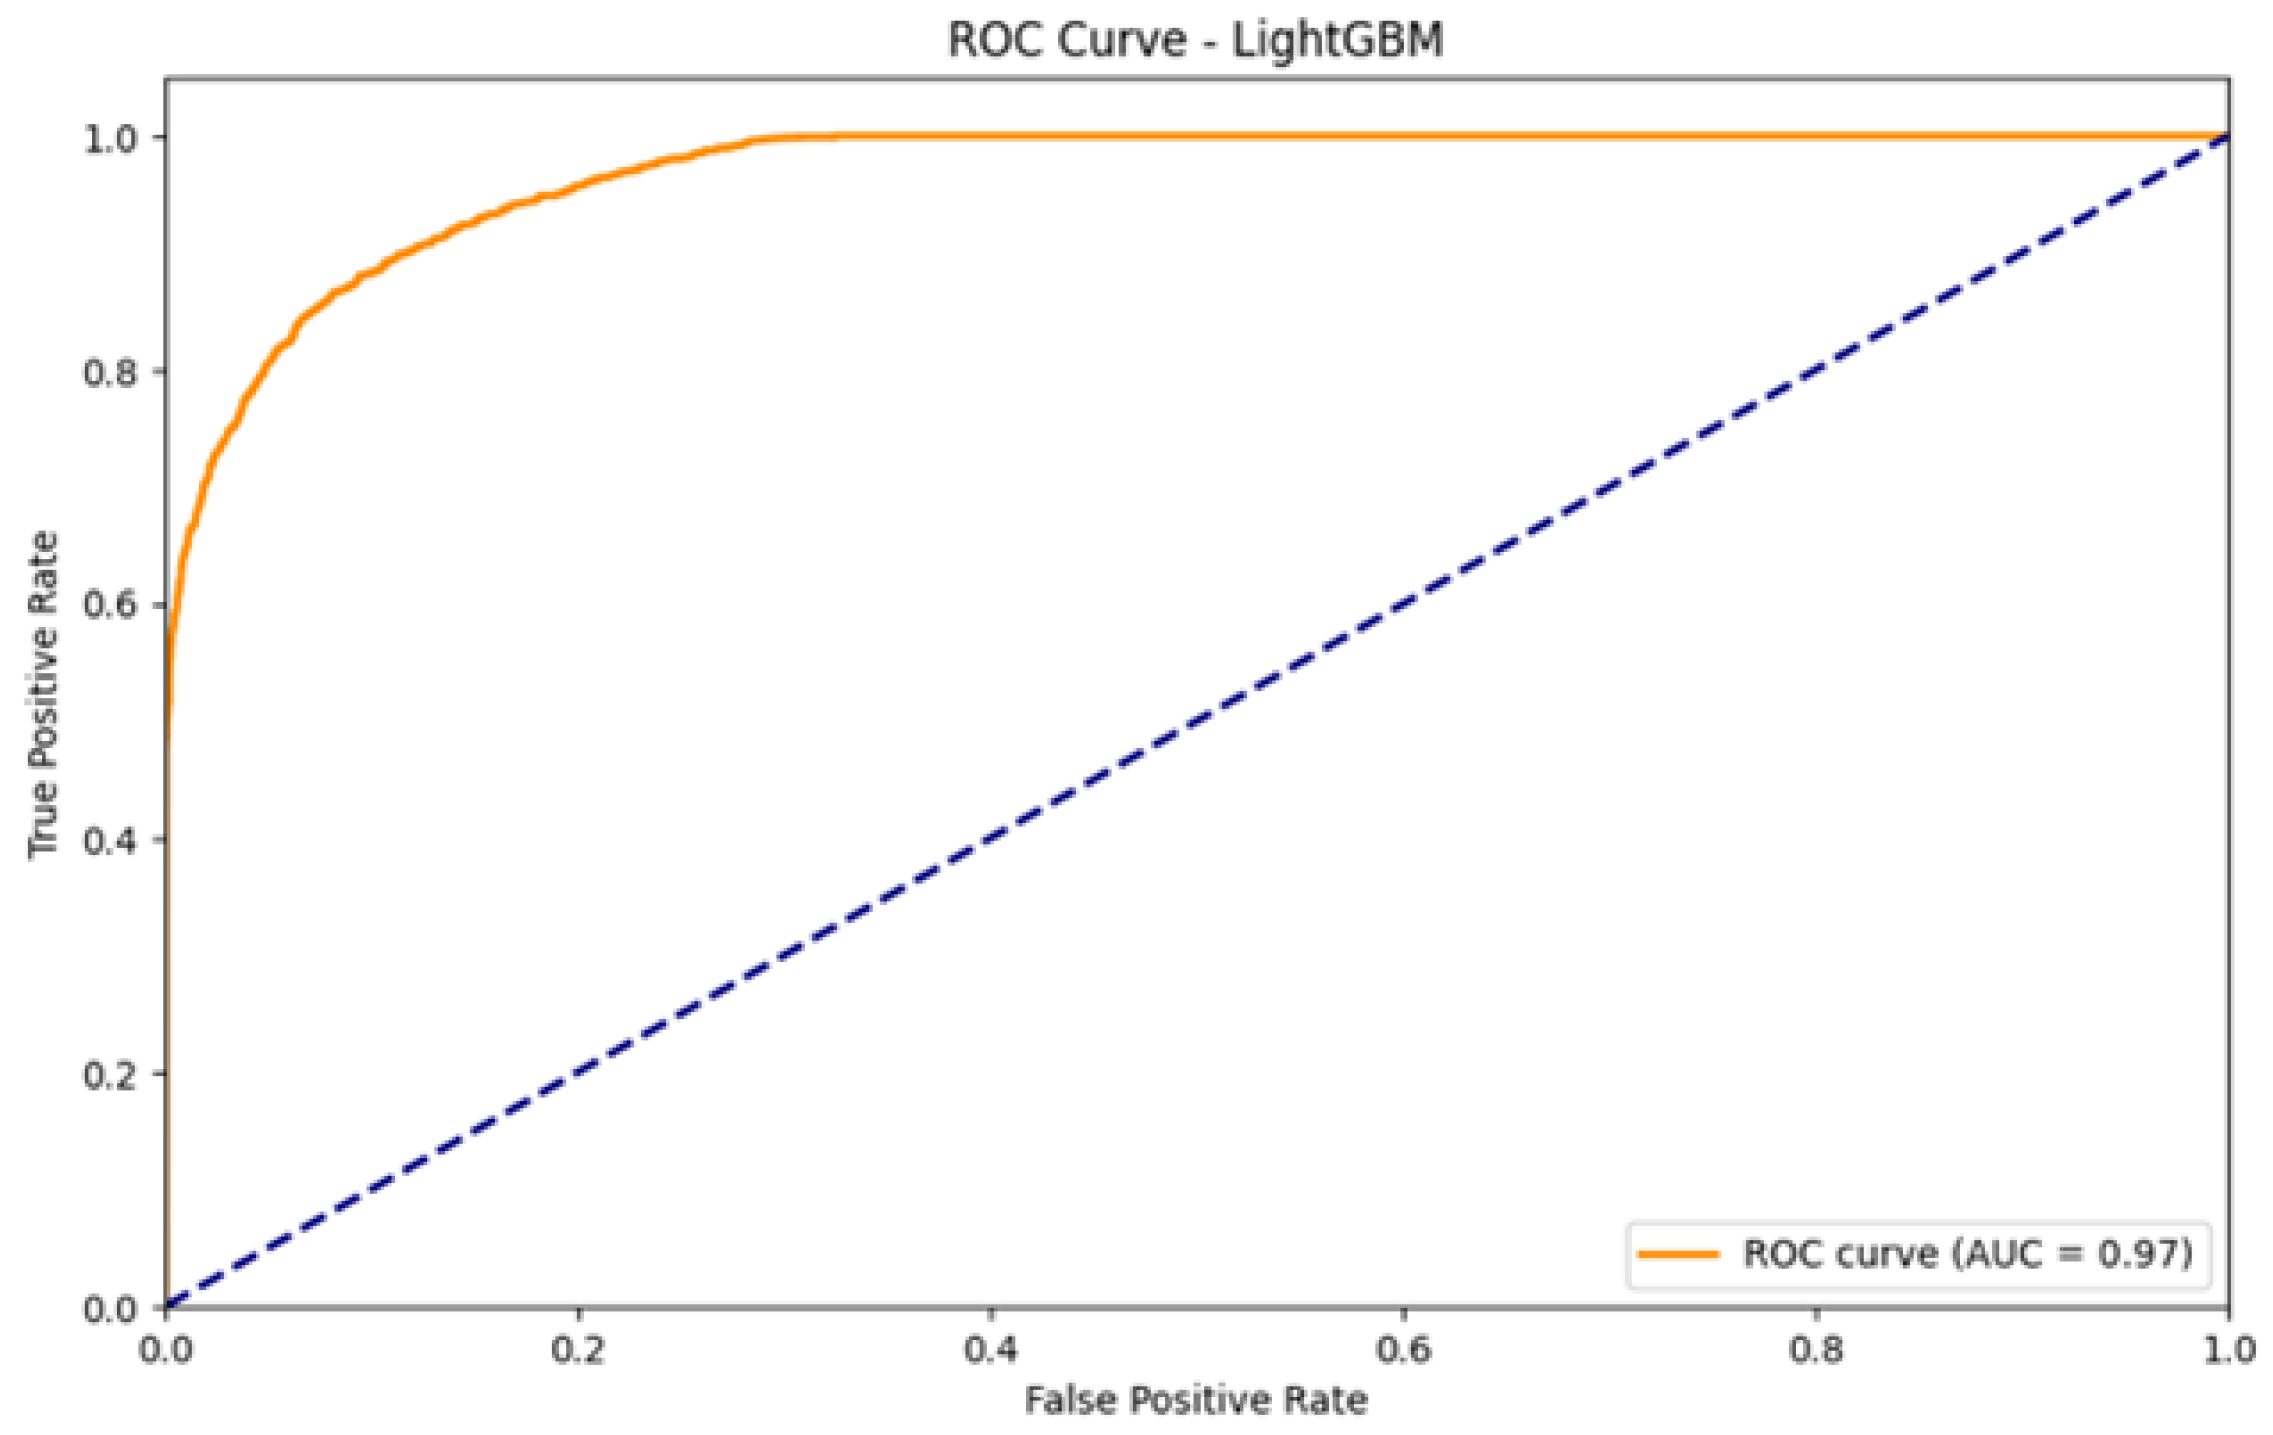
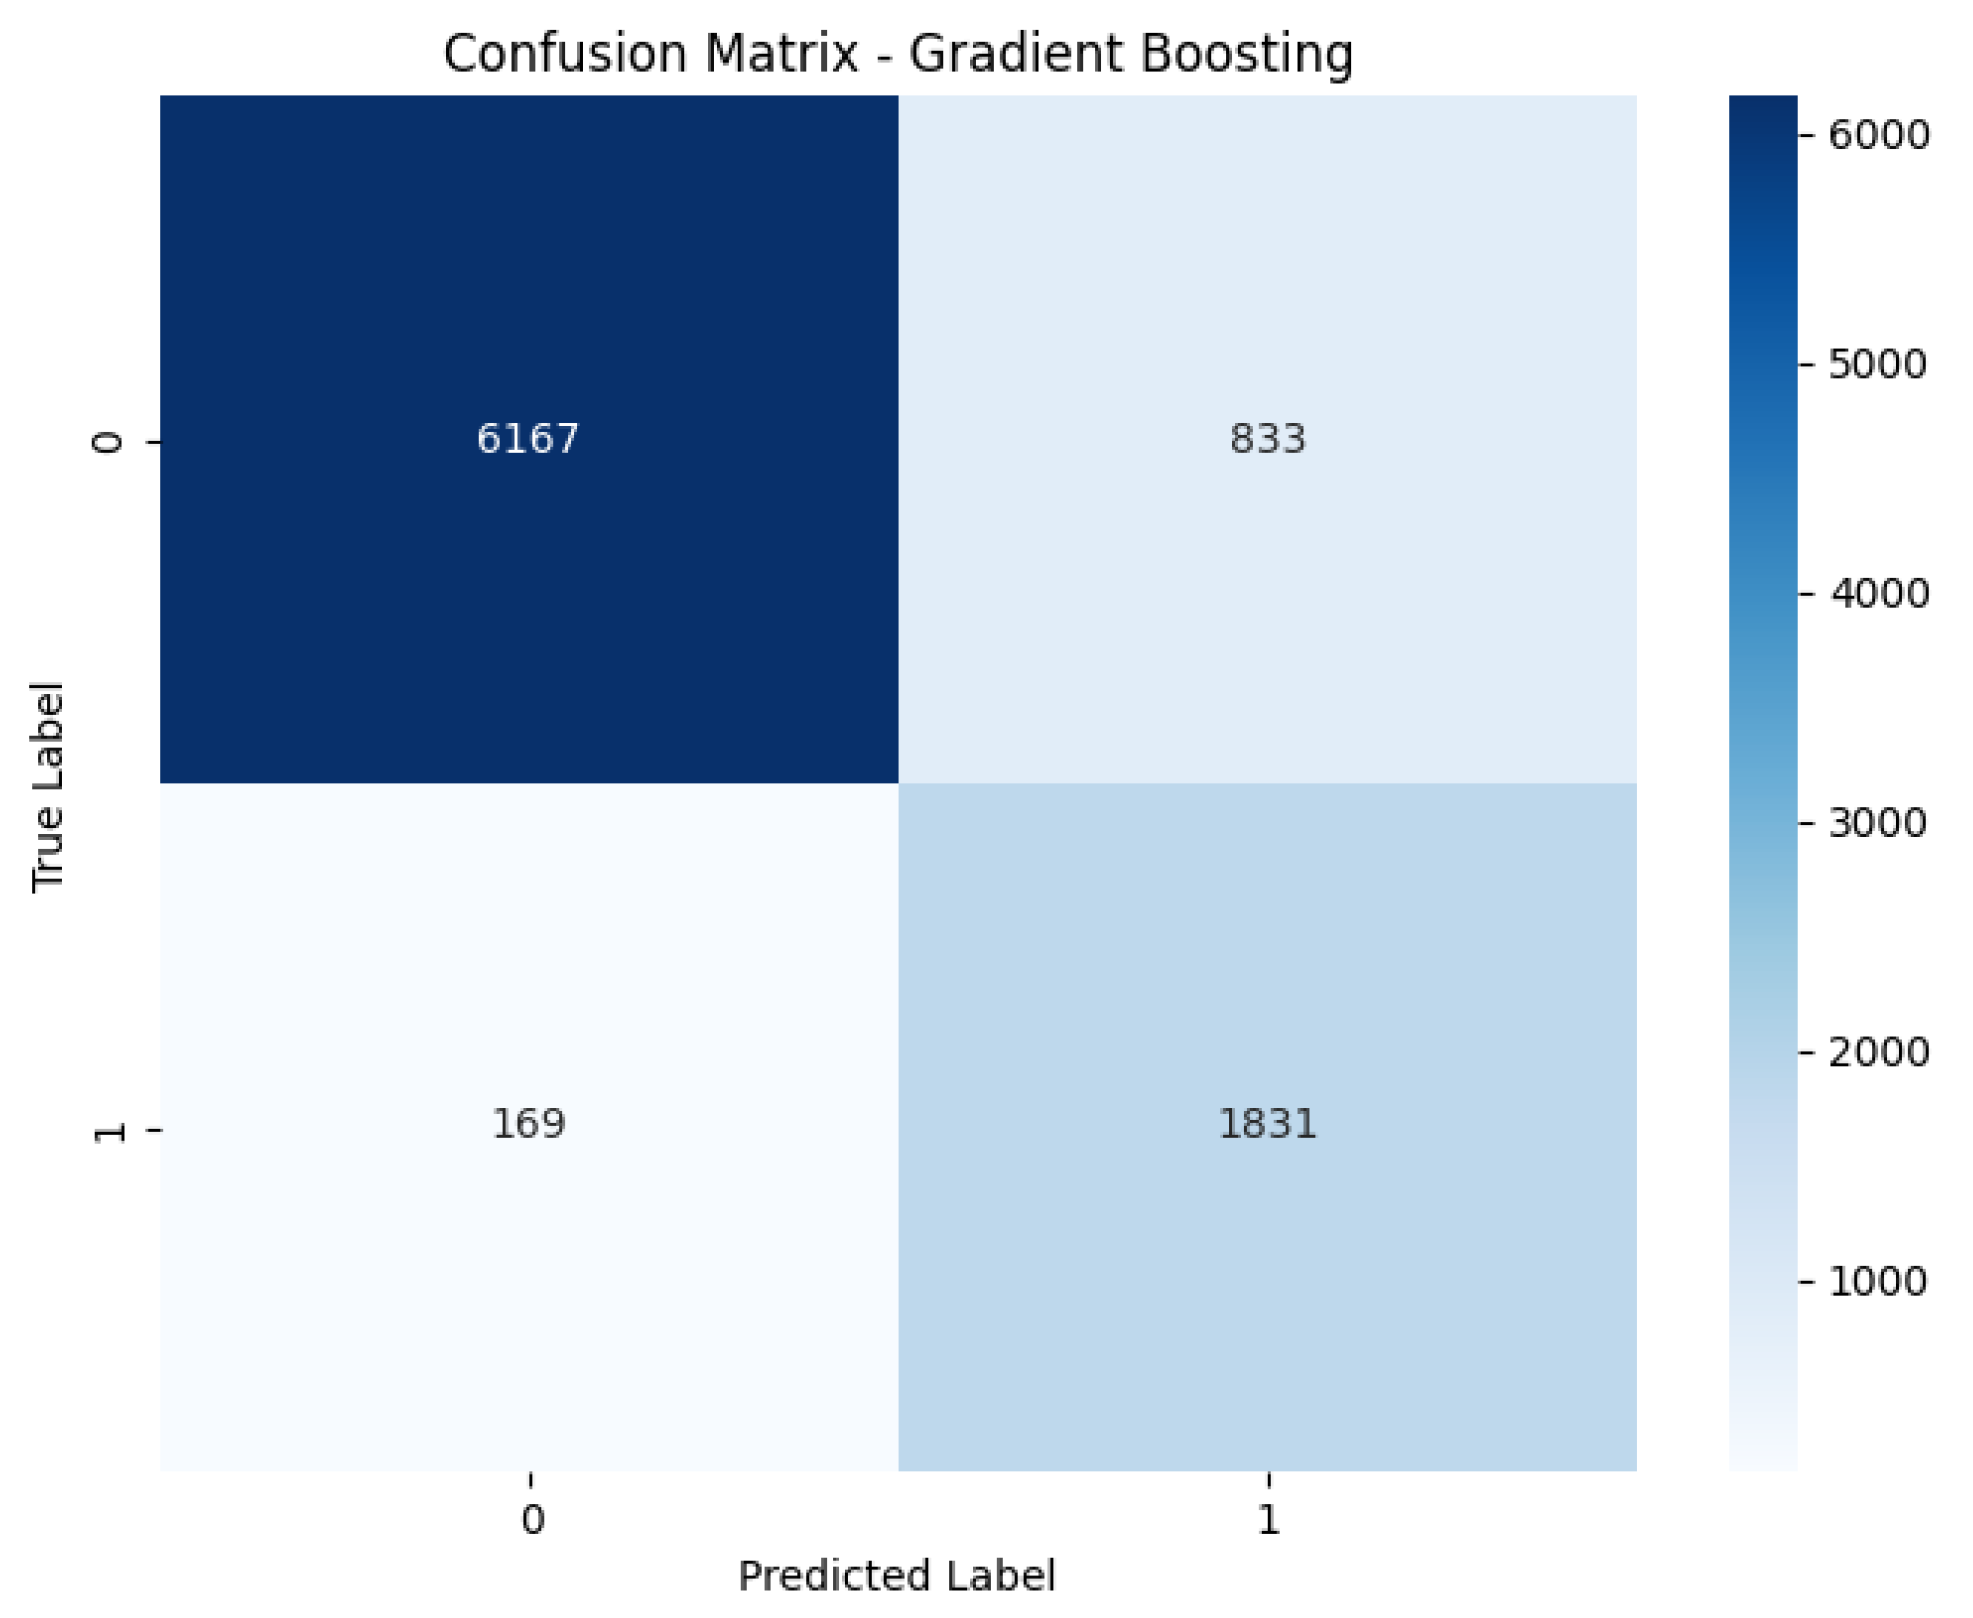
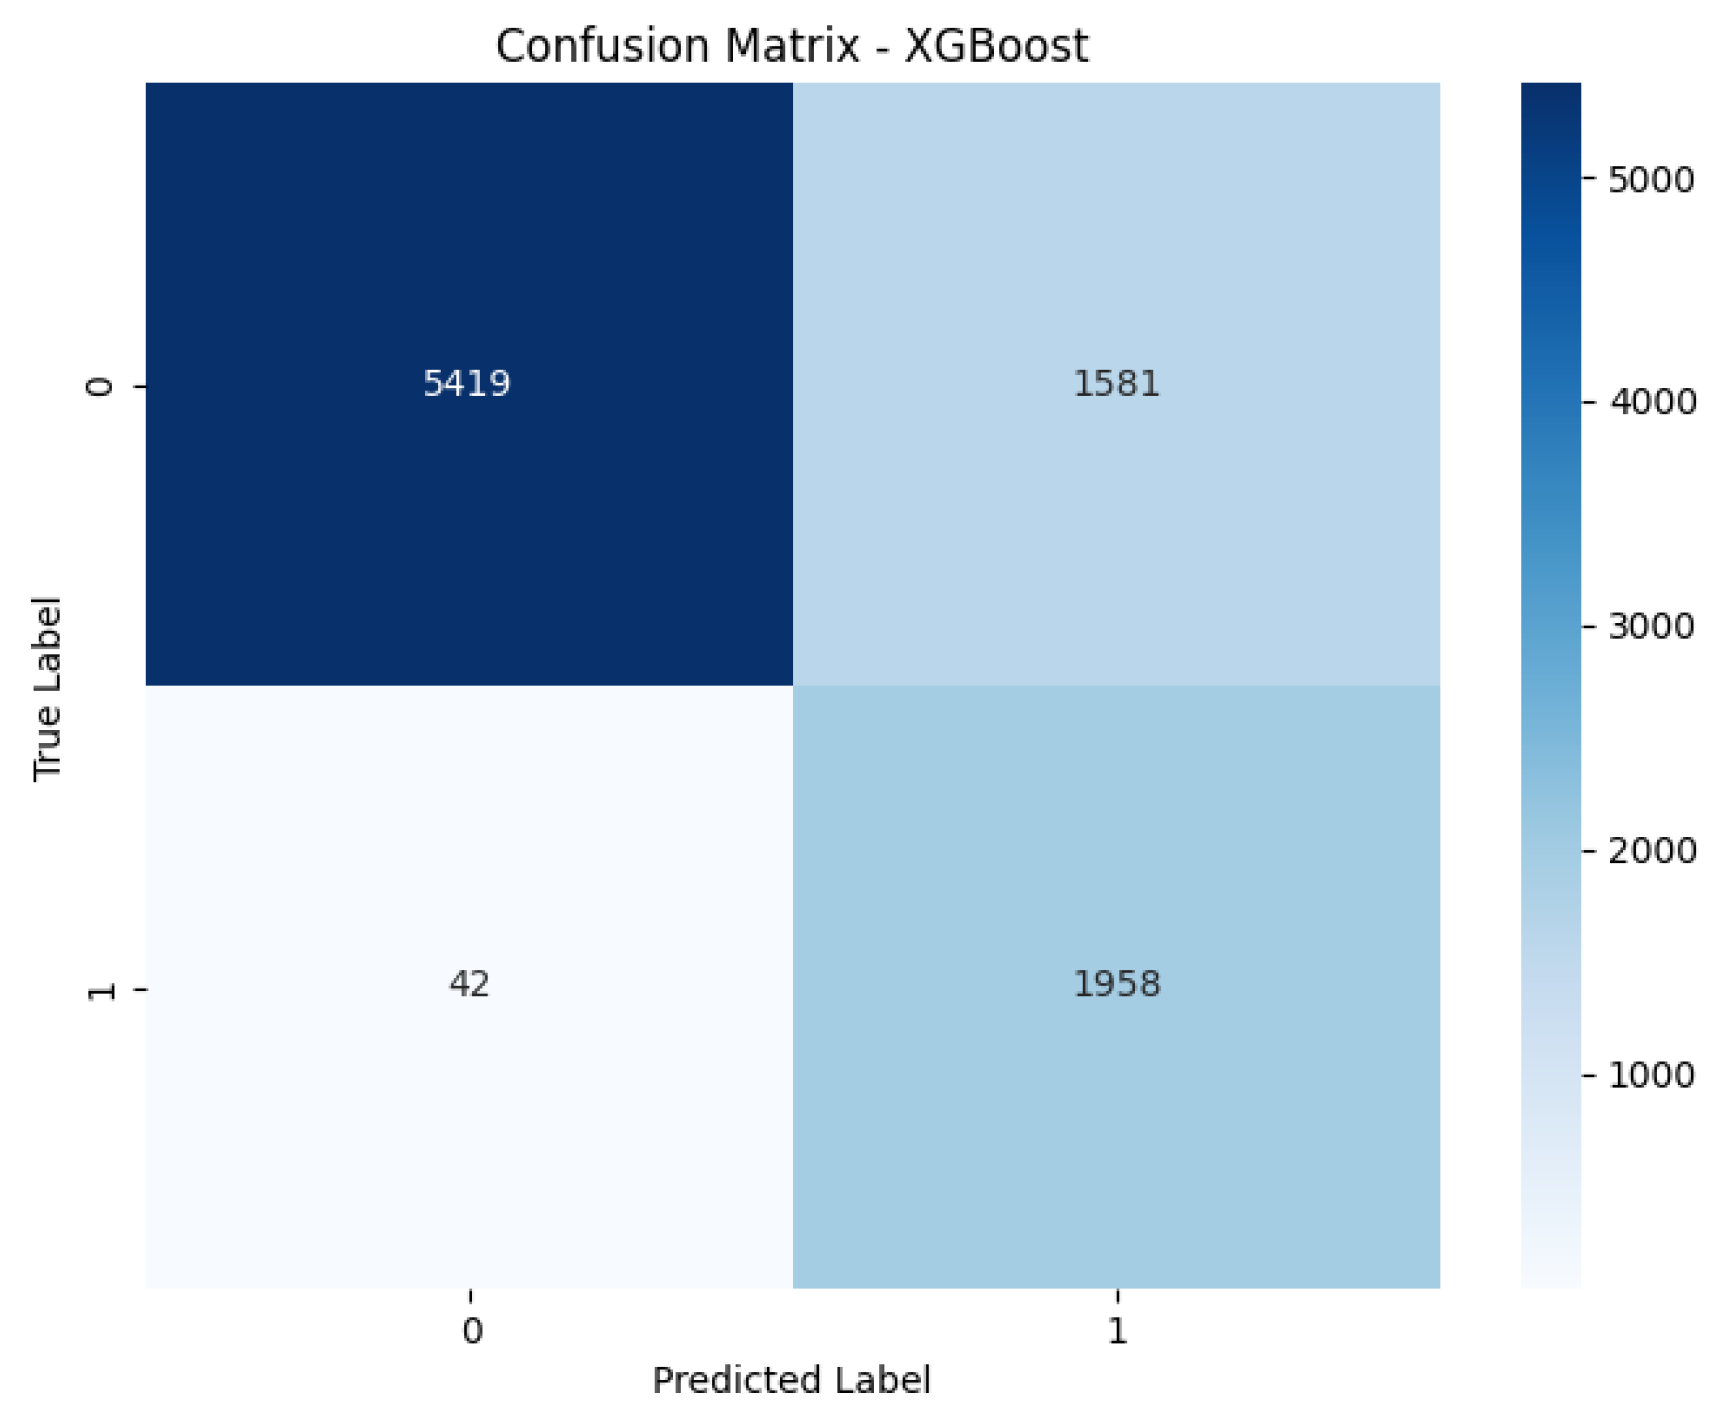
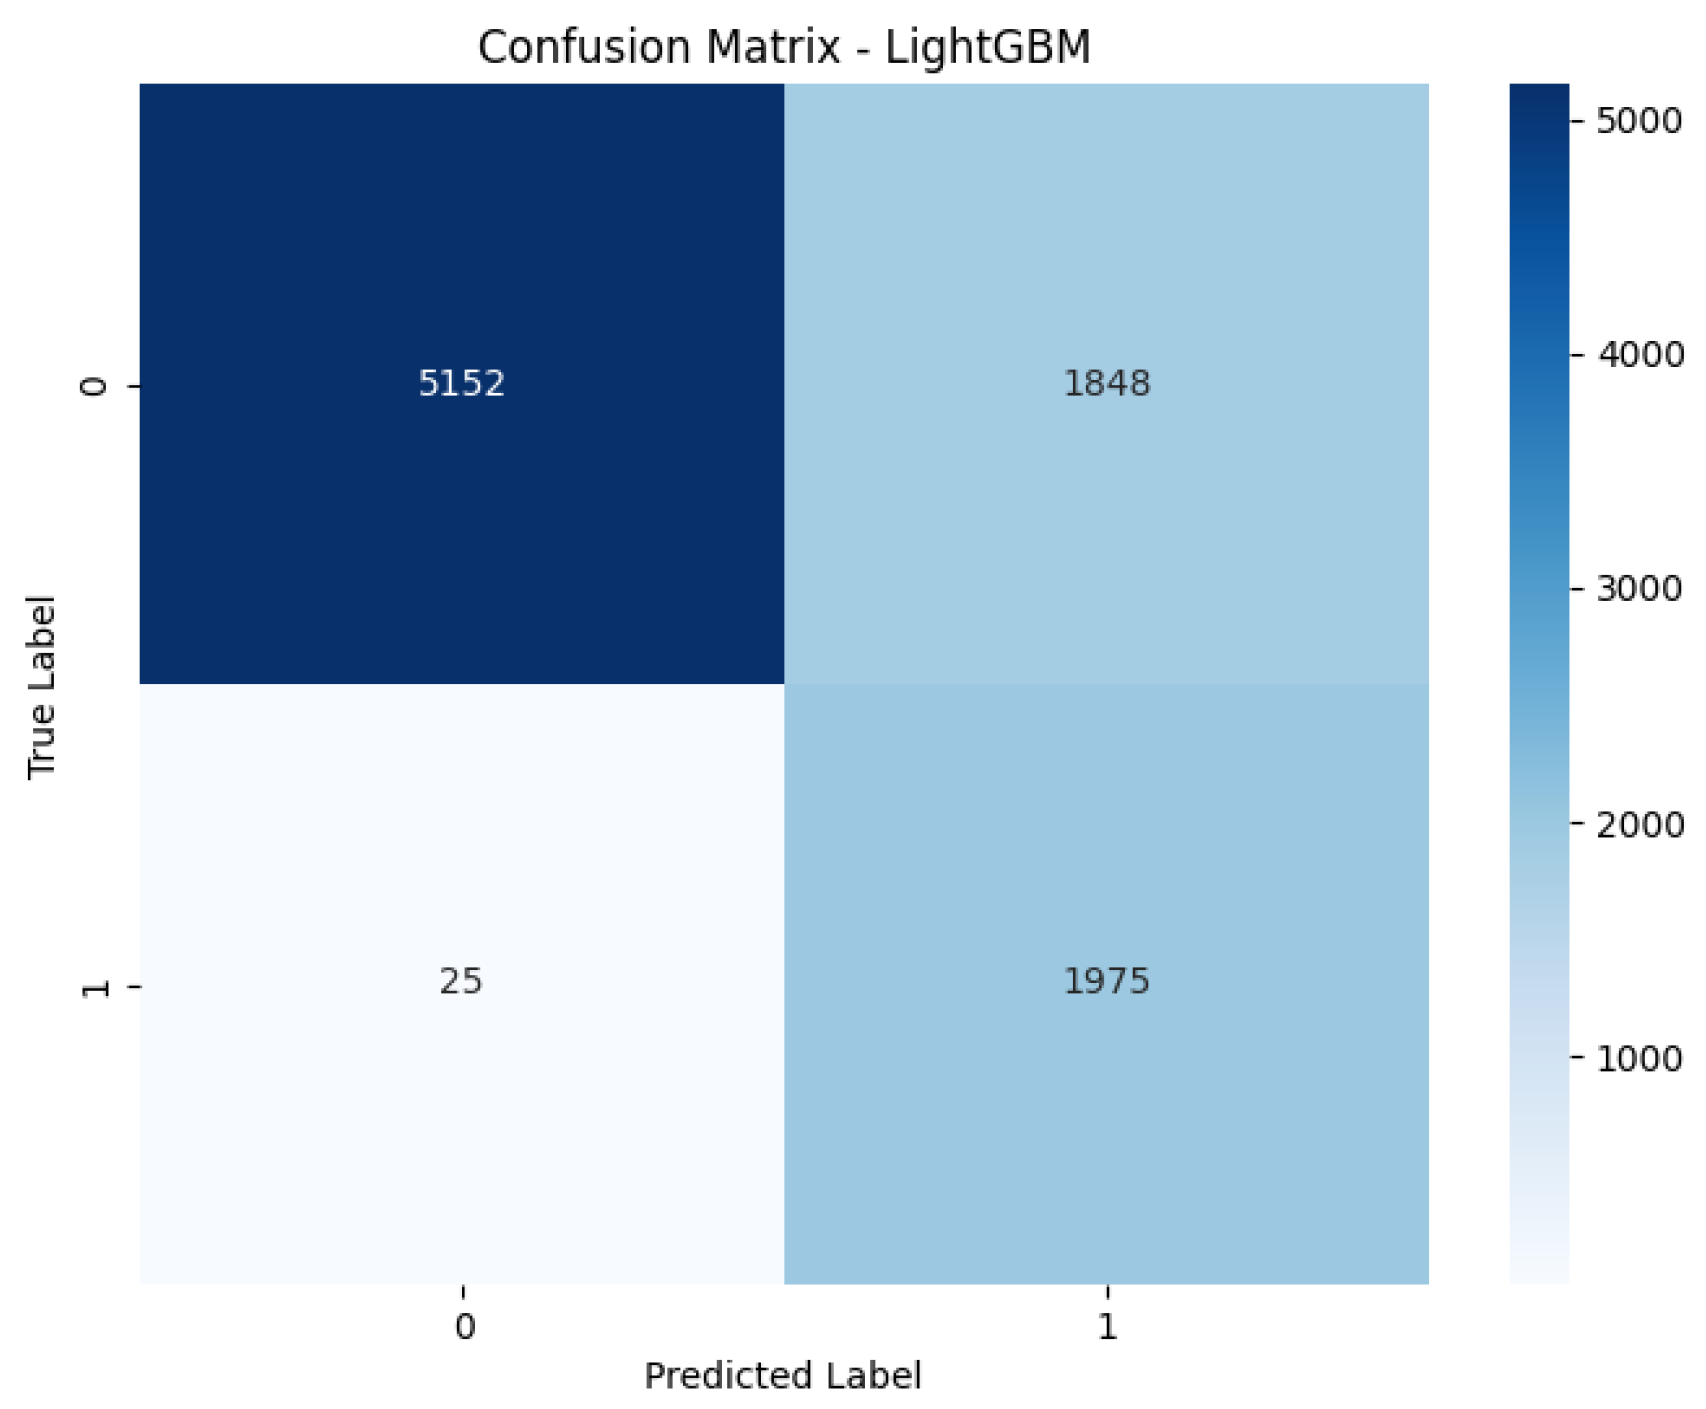
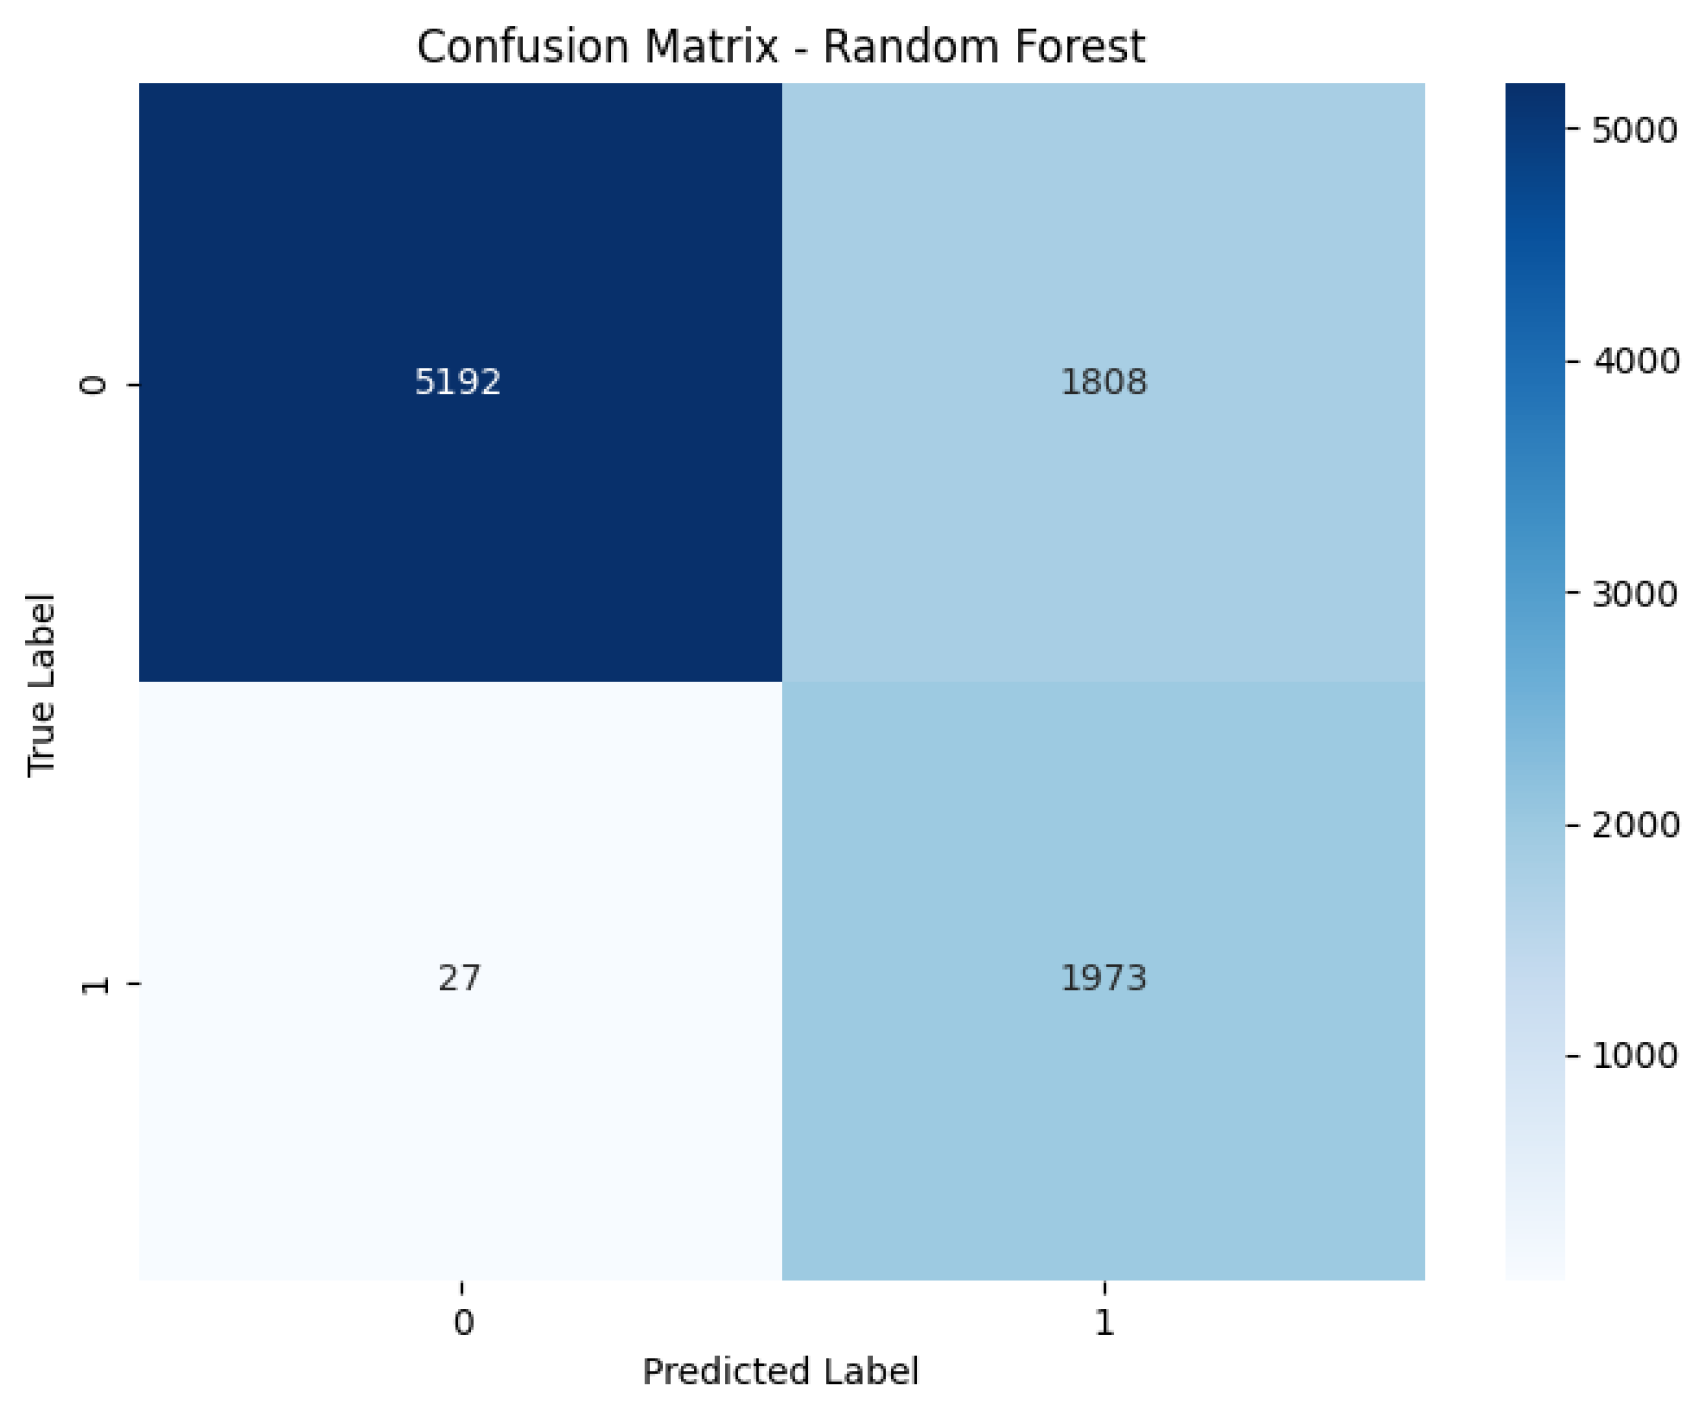
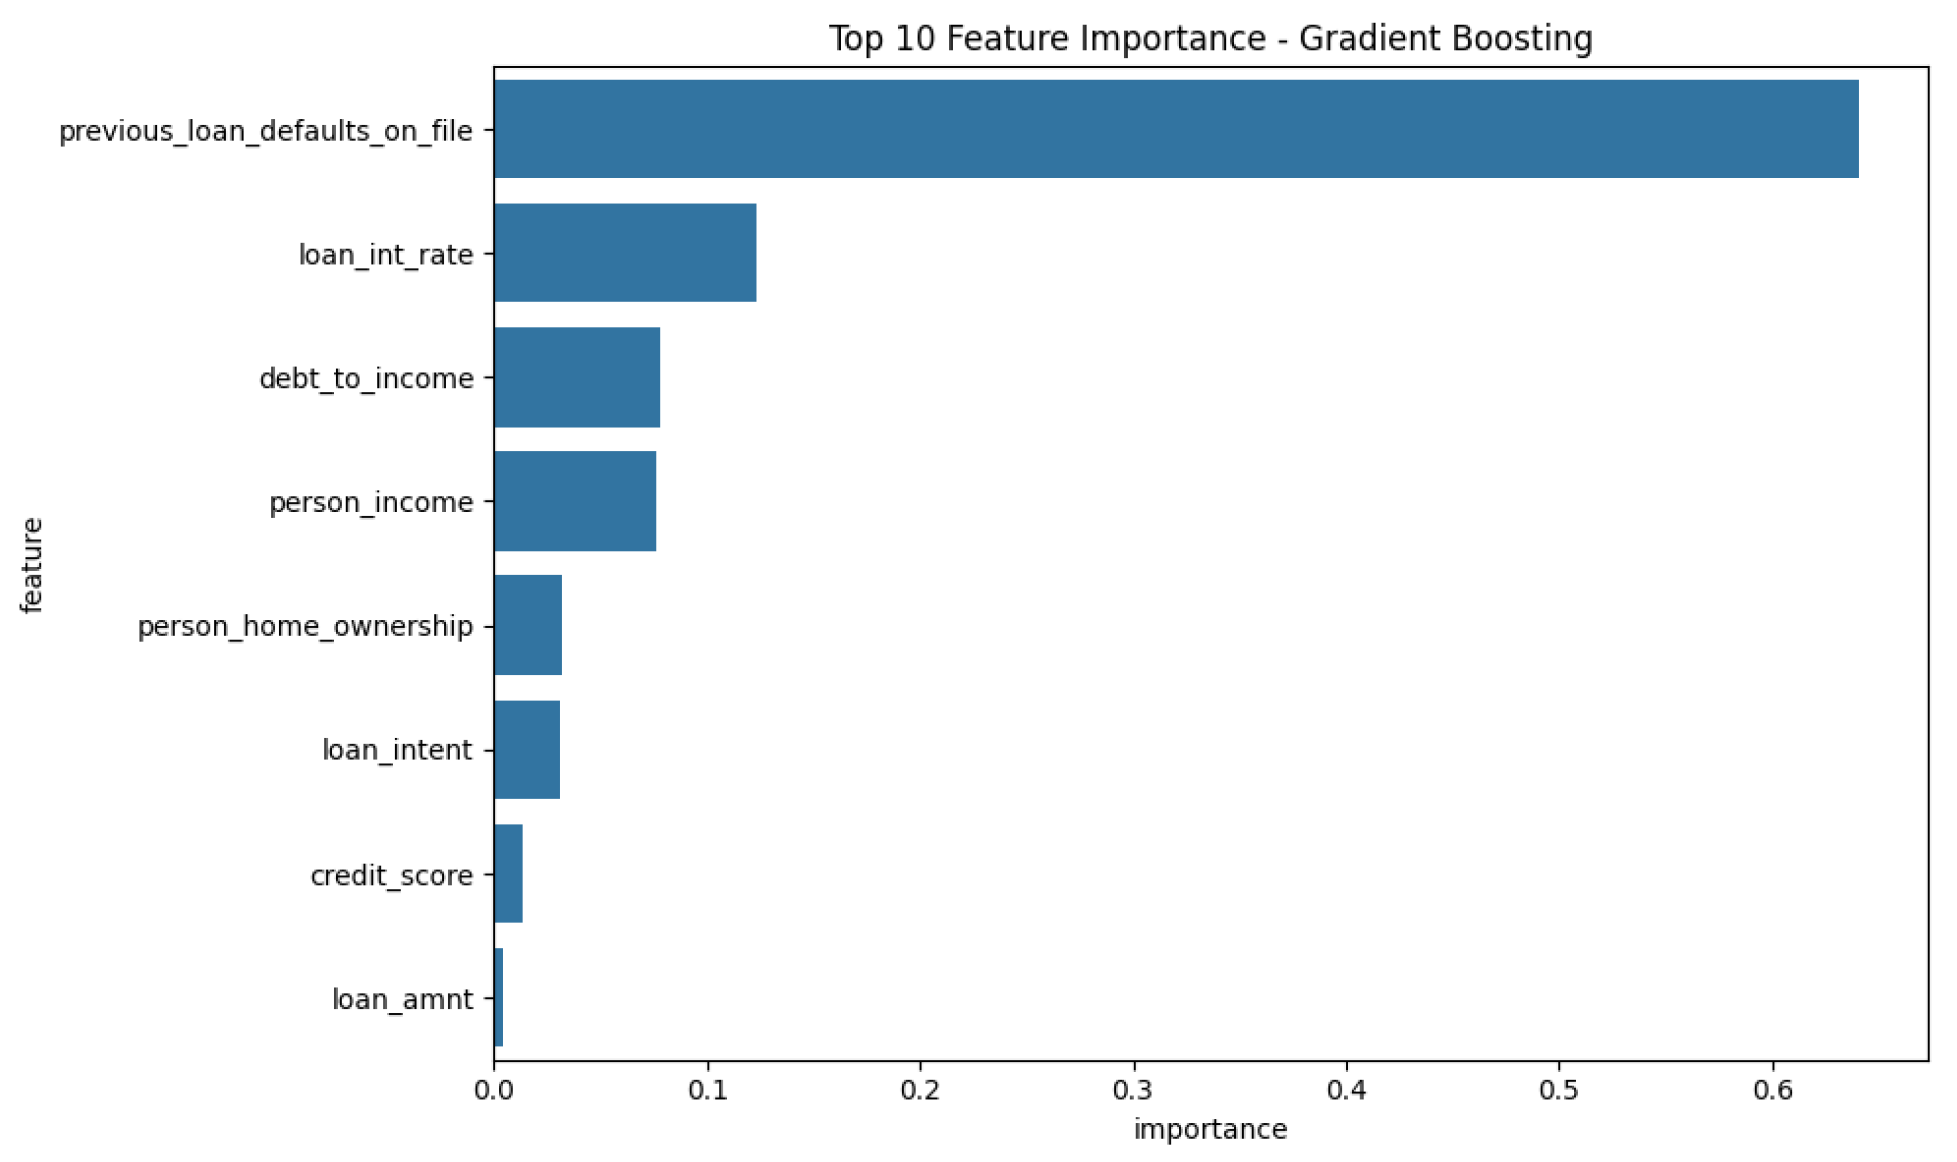
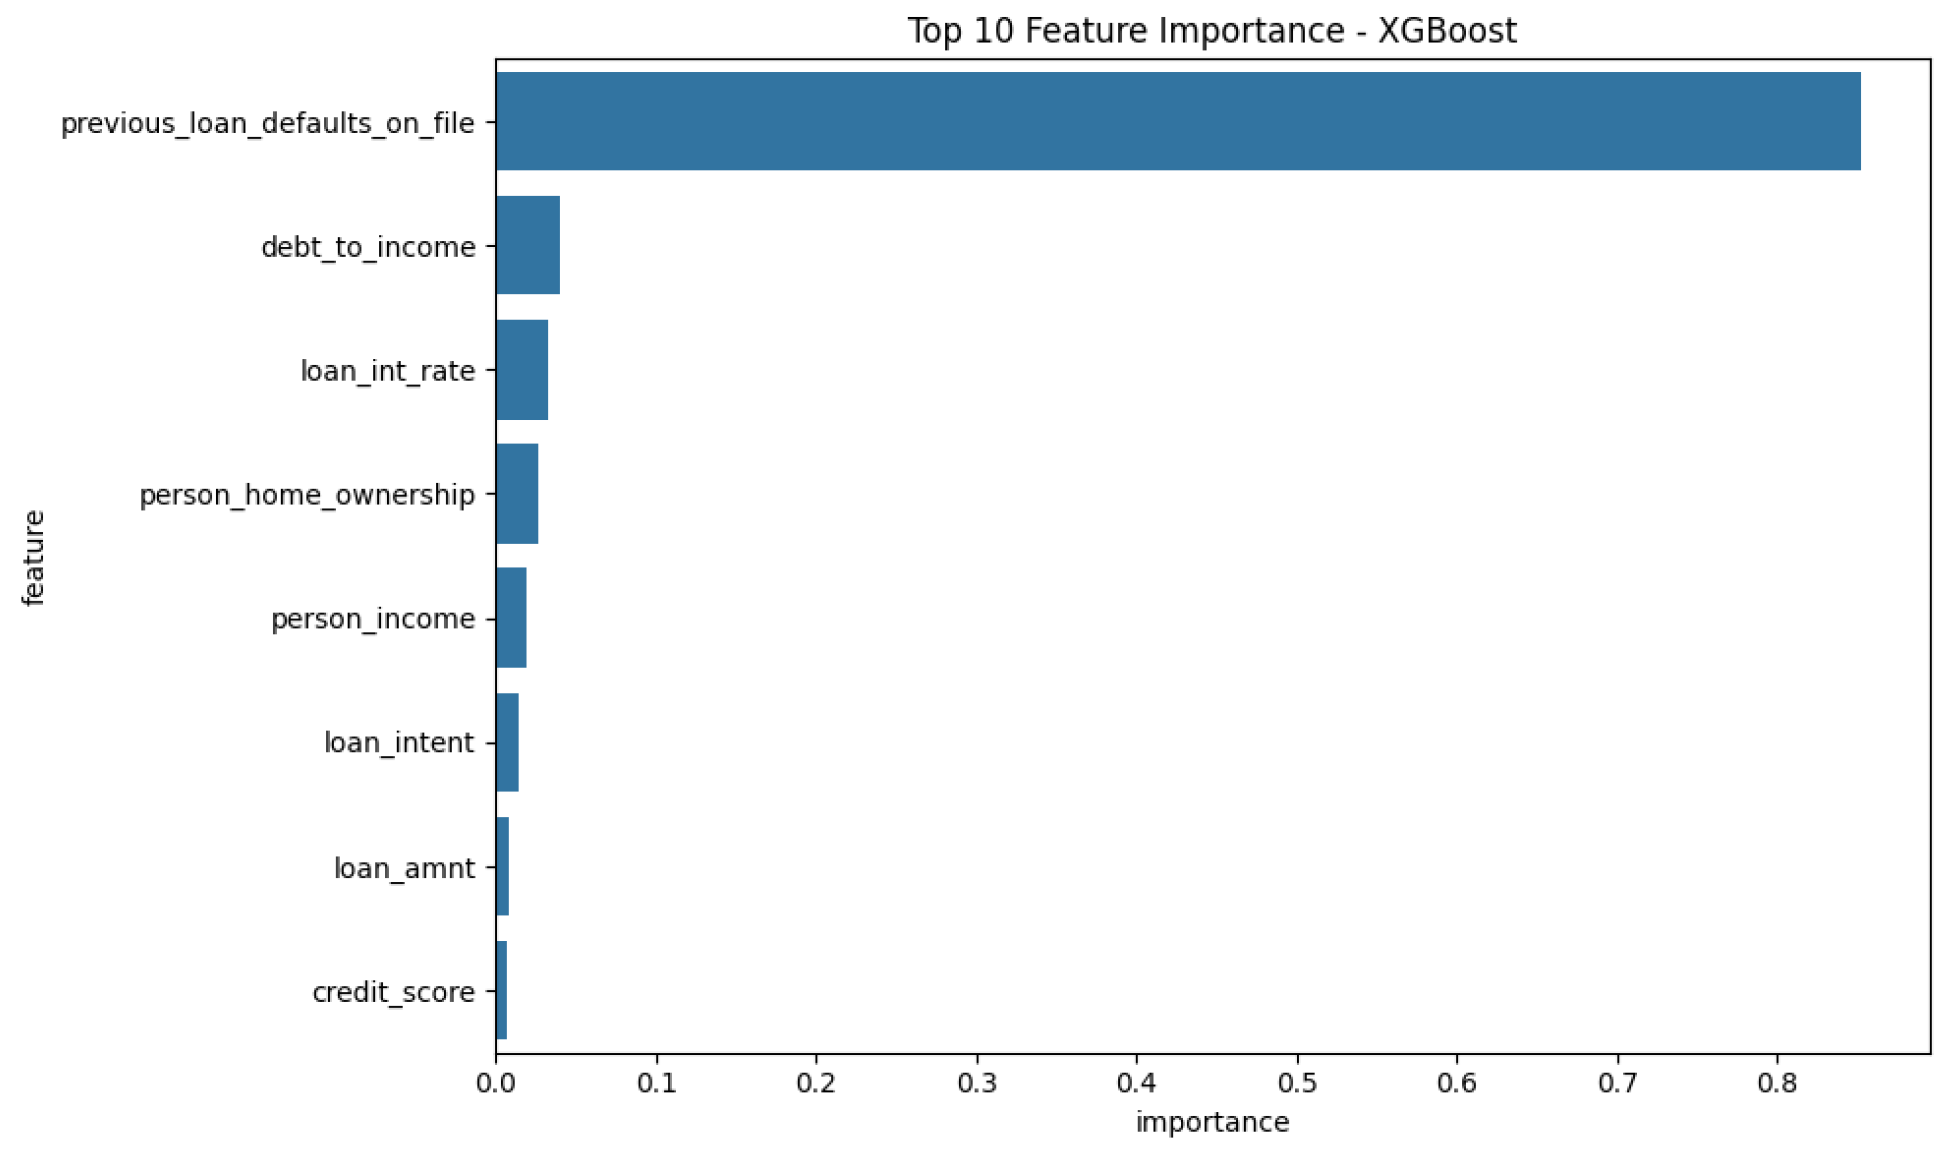
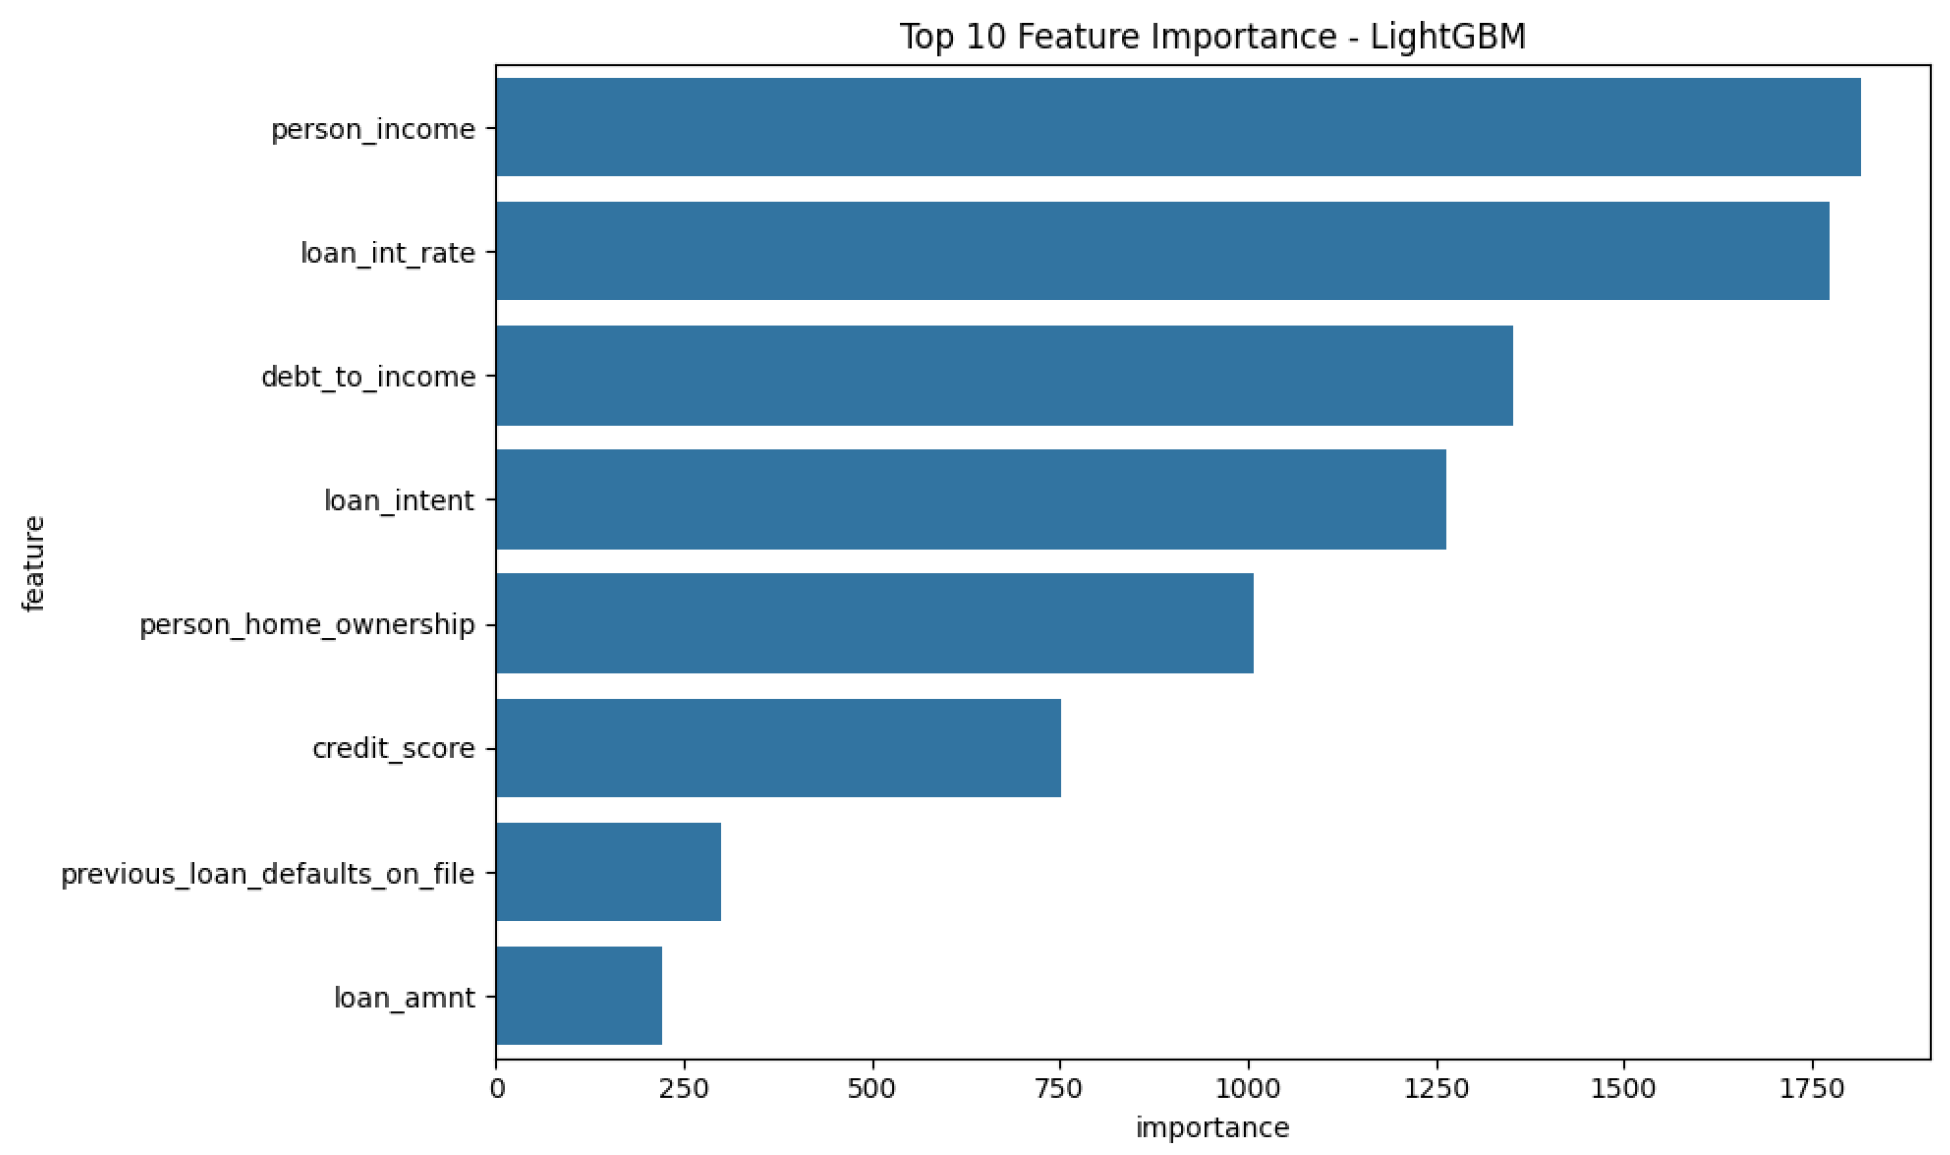
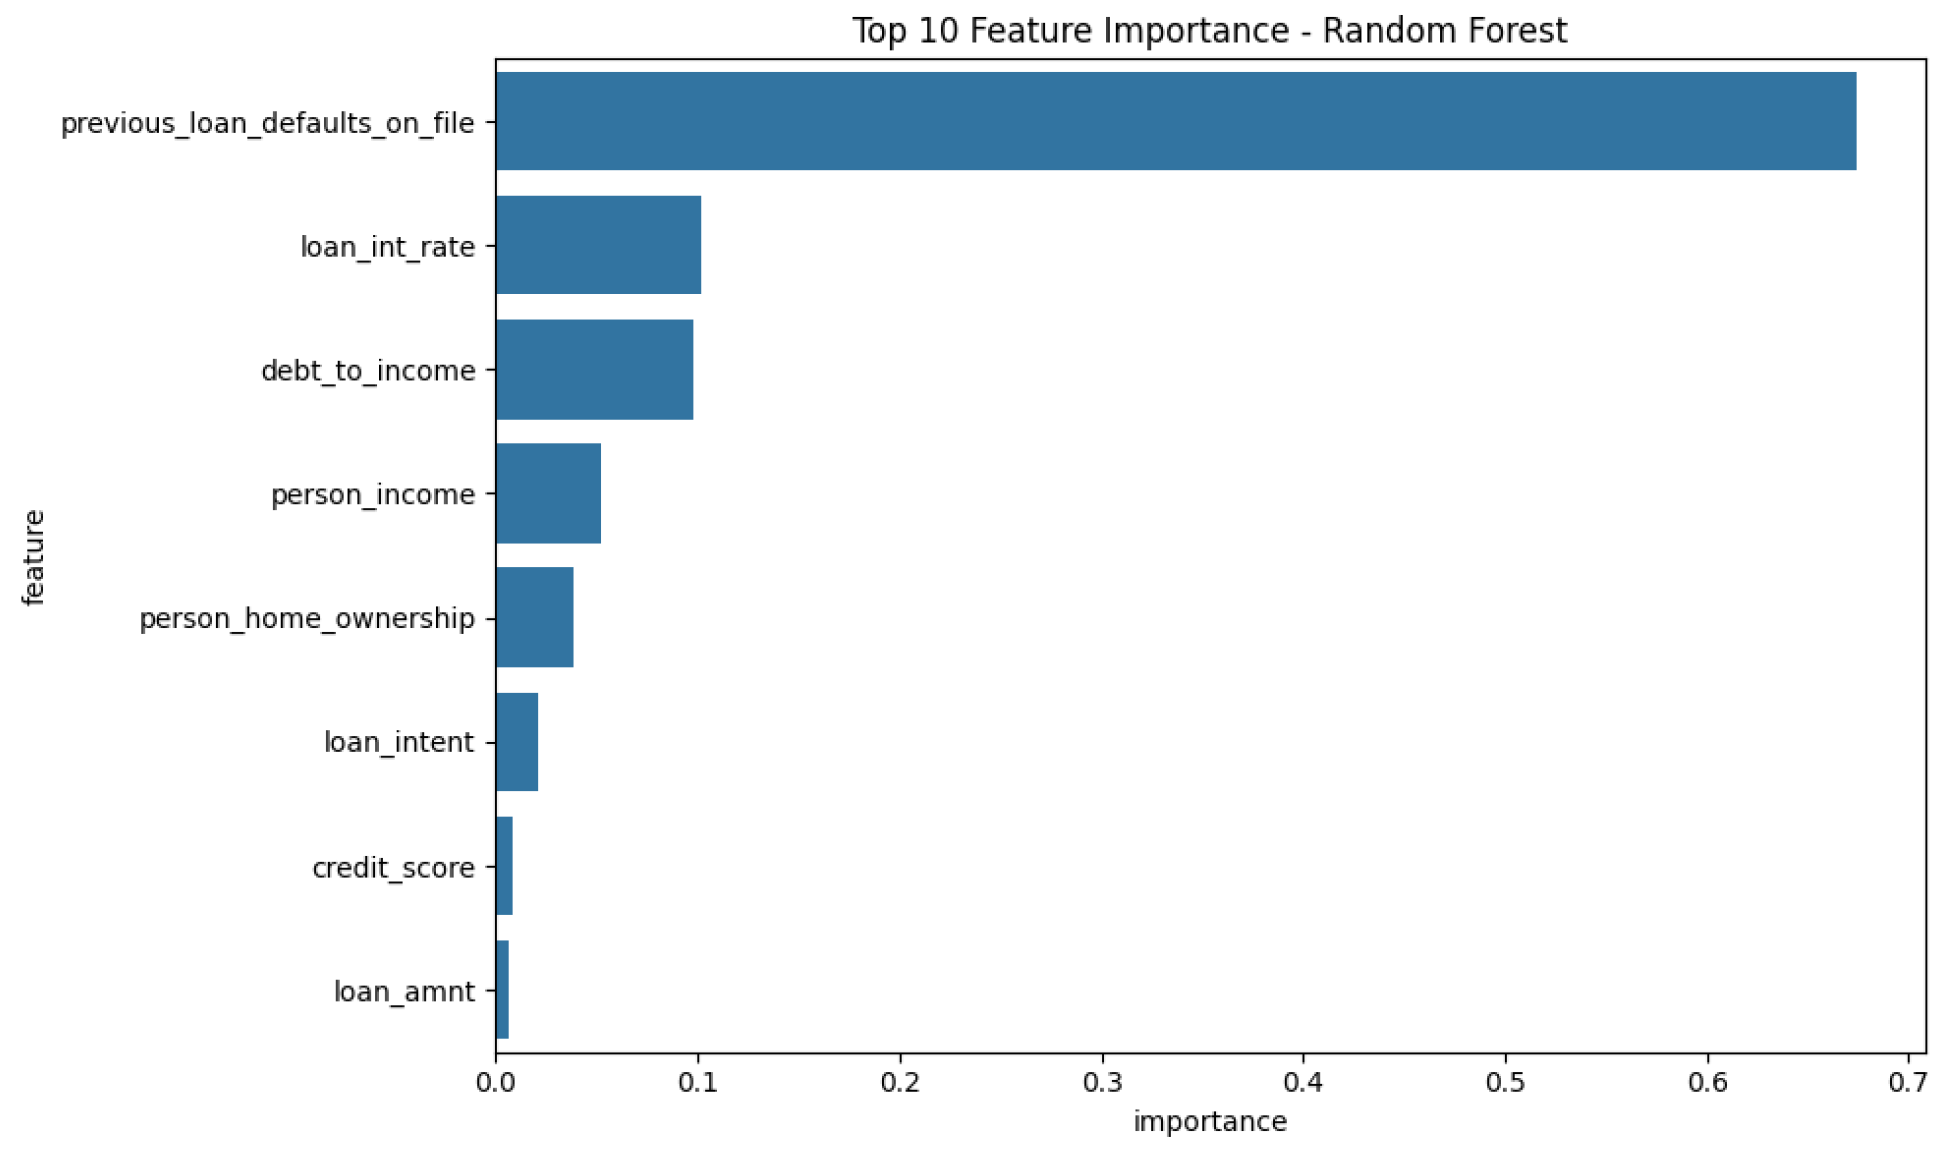
