Article

Evaluation and Prediction of Comprehensive Efficiency of Wind Power System in China Based on Two-Stage EBM Model and FNN Model

1
College of Economics and Management, Nanjing Forestry University, Nanjing 210037, China
2
Business School, Hohai University, Nanjing 211100, China
*
Authors to whom correspondence should be addressed.
Systems 2025, 13(7), 579; https://doi.org/10.3390/systems13070579
Submission received: 29 May 2025 / Revised: 4 July 2025 / Accepted: 7 July 2025 / Published: 14 July 2025

Abstract

Wind power is a core component of a clean energy system. The efficiency of a wind power system evolves through coordinated interactions. These interactions occur among three regional subsystems: resource subsystem, technology subsystem, and economy subsystem. To reveal the operational mechanisms of its internal subsystems, this study analyzes the comprehensive efficiency of the wind power system in China from 2010 to 2022. The two-stage EBM model, the Tobit regression model and the feedforward neural network model are employed in combination. The results show that: (1) The comprehensive efficiency of the wind power system has gradually improved, but shows spatiotemporal variations due to uneven subsystem coordination. (2) The improvement of efficiency is characterized by stages. The optimization of technology subsystems drives the development stage, while economic scaling dominates the operation stage (though operation and maintenance technologies remain deficient). (3) The correlation between development and operation stages is suboptimal, and the coordination of subsystems remains weak. (4) Technology innovation and electricity demand boost comprehensive efficiency, while human resources hinder it. Extreme weather exerts either a contributing or an interfering effect on the system. (5) Future projections show continued efficiency growth. The study concludes with cross-system coordination strategies to enhance the contribution of wind power in clean energy.

1. Introduction

Electricity demand continues to rise (Figure 1), reaching a record 29,925 TWh globally in 2023, with fossil fuels supplying 60% of the total [1]. This growth strains energy security and worsens climate impacts, as fossil-based power emits significant greenhouse gases. The World Energy Outlook 2024 urges a cleaner power system [2]. Wind energy stands out among renewable energy sources for its wide applicability, low environmental impact, and cost efficiency [3]. Global wind capacity exceeded 1 TW for the first time in 2023, representing a 13% increase compared to 2022 [4]. However, wind power efficiency is highly dependent on specific geographical conditions. Its stability is affected by the intermittency and volatility of wind energy. The issue regarding the maturity of industrial technology also merits consideration. Therefore, it is crucial to analyze the comprehensive efficiency of the wind power system and explore approaches for its stability and enhancement.
Extant research extensively explores drivers, evaluation methods, and forecasting of wind power efficiency. However, dominant paradigms reveal limitations.
The first limitation is economic reductionism. Studies disproportionately emphasize financial metrics (cash flow [5], capital expenditures and operational costs [6], installed wind power capacity [7,8]), overlooking systemic interdependencies. While Sun et al. (2021) emphasized the importance of structural and technological factors [9], and Wu et al. (2016) identified operational constraints (wind farm lifespan and curtailment rates) [10], these studies adopted isolated analytical frameworks that fail to capture system-wide interactions. The second limitation is natural determinism. Meteorological factors (wind speed [11,12,13], wind direction [14], temperature [15], and atmospheric pressure [16]) are overrepresented. Wind speed constituted about 60% (143) of input/output variables in particular [17]. In predictive modelling, wind speed is also usually combined with wind direction and applied to wind energy forecasting [18]. This biases analysis toward geographical luck rather than human-engineered solutions, though Hua et al. (2024) partially counter this by incorporating land availability [19]. The third limitation is methodological fragmentation. With its non-parametric flexibility, the data envelopment analysis (DEA) model has dominated efficiency assessments in the wind power sector [20,21,22,23,24]. While recent advancements have addressed undesirable outputs or employed super-efficiency models [25,26], few studies have comprehensively captured multi-stage interactions between subsystems using DEA approaches. Similarly, machine learning predictions (ANN and LSTM [27,28,29,30]) narrowly focus on meteorological and generation variables [31,32,33,34,35], neglecting the crucial techno-economic linkages within the wind power system.
Critically, there remains a lack of a comprehensive framework for analyzing resource-technology-economy linkages within the system. Given China’s dominance in global wind power (Figure 2) and its distinctive industrial landscape, this context provides a compelling case for further research, particularly for addressing the efficiency challenges of the wind power system.
These challenges stem from spatiotemporal variations in wind speed, heterogeneous geography, and disparities in technological and economic inputs. To assess these constraints, this study proposes a resource-technology-economy ternary subsystem framework, analyzing the comprehensive efficiency of the wind power system through a two-stage (development-operation) paradigm. The model integrates resource conditions, technological conversion, and economic realization across both stages. Methodologically, we employ the two-stage EBM (Epsilon-Based Measure) model to assess efficiency dynamics, identify key determinants via Tobit regression, and forecast system efficiency to 2030 using a feedforward neural network (FNN).
This paper makes five main contributions: (1) A novel tripartite framework integrating resource, technology, and economy subsystems for China’s wind power system, advancing beyond single-farm analyses by adopting a regional synergy perspective. (2) A two-stage (development-operation) analytical framework to quantify subsystem coordination dynamics in the wind power system, integrating resource, technological, and economic dimensions. (3) A multi-index system combining natural resources, technological conversion, and economic factors, addressing the univariate bias of traditional methods. (4) Systematic efficiency analysis using extreme climate index, technological innovation, electricity demand and human resources to assess subsystem role and identify key determinants. (5) An FNN-based forecast of China’s system efficiency through 2030, offering actionable insights for future development.

2. Methods

This study adopts a combined analytical framework encompassing a Two-stage EBM model, a Tobit regression model and a feedforward neural network model. The two-stage EBM model is employed to evaluate the comprehensive efficiency value of the wind power system. The Tobit regression model is utilized to identify key factors influencing the comprehensive efficiency, which also serve as the leading factors for efficiency prediction. Based on the leading factors, the FNN model is applied to predict the future efficiency.

2.1. Two-Stage EBM Model Setting

The Epsilon-Based Measure (EBM) model is an advanced extension of Data Envelopment Analysis (DEA). Unlike radial DEA models (e.g., CCR/BCC), which may overestimate efficiency by disregarding slack variables [36], or non-radial models (e.g., SBM), which may underestimate efficiency due to neglect of proportionality [37], the EBM model integrates both radial and non-radial approaches, thereby enhancing measurement accuracy and flexibility in assessing efficiency of decision-making units (DMUs) [38].
Traditional DEA models often treat the production process as a “black box”, focusing solely on aggregate inputs and outputs while neglecting internal structural complexities. In contrast, the network DEA framework conceptualizes production as a multi-stage system, incorporating intermediate outputs to establish inter-stage linkages, thereby enabling a more nuanced evaluation of efficiency at each phase [39,40,41].
Addressing the limitation of traditional EBM in handling multi-stage processes, this study employs a two-stage EBM model, which retains the advantage of the EBM method in balancing proportion and slack optimization, while also capturing the dynamic evolution of system efficiency through stage decomposition.
According to Shi et al. (2022) [42], the two-stage EBM is as follows:
Each decision-making unit (DMU) refers to an entity that converts multiple inputs into multiple outputs and is subject to efficiency evaluation under a common framework [43]. In this study, DMU refers to the wind power system in various provinces and municipalities of China.
Suppose there are n DMUs and K divisions, namely D M U j = ( D M U 1 , D M U 2 , , D M U k , , D M U n ), using M inputs X j = ( X 1 j , X 2 j , , X m j ), producing S outputs Y j = Y 1 j , Y 2 j , , , Y s j .
The efficiency of the DMU is calculated using the following equations.
θ g * = min 0 η , λ , s , s + g , k = 1 K W k θ k ε x k i = 1 m k w i k s i k x i 0 k = 1 K W k η k + ε y k i = 1 S k w i + s k s j + g k y i 0
Subject to:
X i 0 = j = 1 n X i j θ j S i i = 1 m ; j 1 n
Y i 0 = j = 1 n Y i j η j + S i + g i = 1 s ; j = 1 n
Z k , h = Z k , h λ h k , ~ h
j = 1 n λ j = 1
λ 0 , S 0 , S + g 0 , θ 1 , η 1
  • Y : the output of the DMU,
  • X : the input of the DMU,
  • S : Slack variable,
  • S + g : Surplus variable,
  • W : Weight of the input i, W i = 1 i W i 0
  • W + : Weight of output S, W i + S 1 + W i S 2 = 1 i W i + 0
  • E x : the key parameter that combines the input radial θ and the non-radial slack terms.
  • E y : the key parameter that combines the output radial θ and the non-radial slack terms.
  • (k, h): the link from Division k to Division h.
The efficiency score for Division k is calculated as follows:
ρ k = θ k ε x k i = 1 m k w i k s i k x i 0 η k + ε y k i = 1 S k w i + S k s i + g k y i 0
If E x = E y = 0, then the EBM model is equivalent to the CCR model (radial), if E x = E y = 1, then the EBM model is equivalent to the SBM model (non-radial), E x > 0.5 and E y > 0.5 then the EBM model approaches the non-radial model, and E x < 0.5 and E y < 0.5, then the EBM model approaches the Radial model.
The total factor energy efficiency index is used to overcome any biases that may exist in traditional energy efficiency indicators [44]. Efficiency models are defined as follows:
Input   efficiency   =   Target   input     Actual   input  
Output   efficiency   =   Actual   Desirable   output     Target   Desirable   output  
If the target inputs match the actual inputs, the efficiency score is 1, indicating overall efficiency. However, if the target inputs are less than the actual inputs, the efficiency score will be less than 1, indicating inefficiency.
Similarly, if the target desirable outputs match the actual outputs, the efficiency score is 1, indicating overall efficiency. If the target outputs exceed the actual outputs, the efficiency score will be less than 1, indicating inefficiency.

2.2. Tobit Regression Model Setting

This study uses the extreme low-temperature index, extreme rainfall index, extreme drought index, wind power technology innovation level, human resources, and electricity demand as explanatory variables. The comprehensive efficiency of the wind power system in each province and municipality is taken as the dependent variable. The comprehensive efficiency values calculated by the EBM model range from 0 to 1, exhibiting a distinct truncation feature. Therefore, to examine the factors influencing the comprehensive efficiency of wind power systems, this paper employs the Tobit regression model proposed by Tobin (1958) [45]. The Tobit model utilizes maximum likelihood estimation to perform regression analysis on truncated data, thus addressing the parameter estimation bias that can arise from traditional OLS regression.
According to Song et al. (2022), the Tobit regression model is formulated as follows [46]:
y i = β 0 + k = 1 6 β k X k , i t + e i t
where y i is the comprehensive efficiency of the wind power system of province i in year t , X k represents the explanatory variables, β 0 and β k are the constant term and regression coefficient corresponding to the variables, respectively, e i t is the random disturbance term.

2.3. Prediction Model

To create a highly intelligent predictor for wind power, the model must be capable of feature extraction and nonlinear mapping, while also offering enough flexibility to handle various wind power prediction scenarios [47]. Being inherently nonlinear, the feedforward neural network exhibits strong performance in handling complex nonlinear mappings. Compared to other neural network models, its architecture is relatively simple and easy to implement [48]. Research has shown that, over the long term, nonlinear models offer superior accuracy in wind power generation forecasting [49]. Consequently, nonlinear models, including feedforward neural networks, are widely used in the wind power sector [50].
This study uses the feedforward neural network (FNN) model for prediction. The feedforward neural network (FNN) model is a type of artificial neural network where information flows in one direction from input nodes through hidden layers to output nodes, without any cycles or feedback connections. The construction of FNN in this article refers to Zhang et al. (2009) [51]. The key structure of the FNN model is illustrated in Figure 3. An FNN consists of an input layer, one or more hidden layers, and an output layer. Each node in a layer is connected to every node in the adjacent layer. The neural network is structured with R input units, S hidden units, and T output units. The transfer functions of both the hidden and output layers are sigmoid functions. The output calculation of the ath node in the output layer is defined as follows:
y a = f b = 1 S w a b f i = 1 R v b i x i + θ v b + θ w a , a = 1 , , T
where y a is the output of the ath node in the output layer; x i is the input of the ith node in the input layer; w a b is the weight connecting the hidden and output layers; v b i is the weight connecting the input and hidden layers; and θ v b (or θ w a ) are bias terms representing the thresholds of the transfer function f .
The learning error E is calculated using the following formula:
E = i = 1 p E i p T   where   E i = a = 1 T y a i C a i 2
where p is the total number of training samples, y a i C a i represents the error between the actual output and the desired output of the ath output unit for the ith training sample. The fitness function of the ath training sample is defined as follows:
fitness   x a = E X a
When the AFSA-PSO-parallel-hybrid evolutionary (APPHE) algorithm is used to evolve the weights of a feedforward neural network, each particle represents a set of weights and biases.

3. Data

3.1. Data Overview

This study collects data from 31 provinces and municipalities in China spanning 2010 to 2022. Due to variations in wind energy resource endowments, policy priorities, and regional roles, these areas are grouped into four regions based on their natural and economic conditions: eastern, central, western, and northeast China. For detailed classification, see Figure A1 and Table A1 in Appendix A. Missing values are supplemented by linear interpolation to ensure the integrity of the data.

3.1.1. Two-Stage EBM Model

The main design of the two-stage EBM model is illustrated in Figure 4. The assessment of the comprehensive efficiency of wind power systems in different regions of China is divided into two stages: the development stage (S1) and the operation stage (S2).
The development and operation stages of the wind power system represent two intrinsically connected yet functionally distinct phases. During the development stage, critical activities including wind resource assessment, site selection, and infrastructure construction establish the physical and technical foundation for the operation stage. The subsequent operation stage focuses on maximizing long-term profits through systematic maintenance, operational optimization, and energy market participation. The division of these two stages not only reflects the natural process from system construction to production but also highlights the technical priorities and management requirements of different phases. Importantly, development-stage engineering decisions exert lasting impacts on operational efficiency and maintenance requirements, while operational data provides valuable empirical evidence for future development projects. This sequential relationship enables the wind power system to continuously optimize through practical feedback and enhance overall benefits.
The first stage focuses on the selection and construction of wind power systems across various regions of China based on natural conditions, laying the groundwork for future wind power generation. The primary input indicators for this stage are average wind speed, population density, and unutilized land area, while the output indicator is wind power installed capacity, which represents the core equipment for wind power generation. The development stage connects the resource subsystem and technology subsystem. Average wind speed, population density, and unutilized land area are the key elements of the resource subsystem, which provide basic inputs for the development of the wind power system and form development constraint boundaries. The process of development requires technical decisions such as site selection and planning, unit selection, etc., which reflect the role of technology subsystems. Wind power installed capacity is the result of technological transformation.
The second stage is the operation stage. The input indicator is the operation and maintenance cost, while the output indicators include wind power generation and the energy substitution income from wind power. Wind power generation depends not only on the primary equipment—installed capacity—but also on supporting infrastructure such as power grids. Therefore, the operation and maintenance of a wind power system involve significant costs. Wind power generation not only generates economic value but also replaces coal-fired power, producing clean electricity and reducing the cost associated with greenhouse gas emissions. The operational stage is the connection of the economic subsystem and the technology subsystem. Operation and maintenance costs and Energy substitution income are representations of costs and revenues in the economy subsystem. The power generation process requires the support of power generation technology, grid technology, etc., which reflects the role of the technology subsystem. Wind power generation is the direct result of technological transformation in the technology subsystem.
Detailed explanations of each indicator can be found in Table 1.

3.1.2. Tobit Regression Model

In the Tobit regression model, variables are classified into two types:
  • Dependent variable: The dependent variable is the comprehensive efficiency of wind power systems in various regions of China, measured using the two-stage EBM model.
  • Independent variables: This study examines the factors influencing the comprehensive efficiency of wind power systems, comprehensively considering natural resource factors, technical factors, and economic factors. Uncertainty factors, such as weather, temperature, and humidity, can impact the actual data of wind power generation [53,54]. Few studies have thoroughly explored the impact of extreme natural conditions. Therefore, this paper selects the extreme low-temperature index, extreme rainfall index, and extreme drought index to investigate the influence of extreme weather on wind power system efficiency. Technical and economic factors, such as green finance, technological progress, and price policies, have also been shown to impact the development of wind power [55,56,57]. Unlike previous studies, this paper selects the level of wind power technological innovation, human resources in the power industry, and electricity demand to explore the impact of technical and economic factors on wind power system efficiency. The independent variables are described in detail as follows:
    • LTD, ERD, and EDD: Extreme low-temperature index, extreme rainfall index, and extreme drought index. Extreme weather events threaten economic development and energy supply, potentially affecting wind power systems, which are highly reliant on wind resources. The occurrence of extreme weather events also represents disturbances in the resource subsystem. The extreme low-temperature index, extreme rainfall index, and extreme drought index used in this study are sourced from the extreme climate index data constructed by Guo, Ji, and Zhang (2024) [58]. The higher the index, the more frequent the corresponding extreme weather events in the region during that year, and the more unstable the resource subsystem becomes.
    • Technology: The level of technological innovation in wind power. The level of wind power technology innovation is the key element of the technology subsystem. The improvement of technological innovation in wind power demonstrates the transformation of the technology subsystem. Wind turbines are the key equipment for wind power generation. The IPC classification number F03D [59] specifically identifies wind turbine technology, covering patents related to wind power generation equipment and associated technologies. Due to the lag in patent authorization, the number of patent applications better reflects the technological innovation vitality of wind power in each province compared to the number of granted patents. In this study, the total number of invention and utility model patent applications for wind power technology in each province during the current year, with the restriction of “IPC = F03D”, was manually collected. The logarithm of the total number of wind power technology patent applications + 1 was used to measure the innovation level of wind power technology. Patent data is sourced from the China National Intellectual Property Administration.
    • HR: Human resources. Professional technical personnel are essential for the efficient operation of wind power equipment and the proper maintenance of the power transmission network. Human resources are part of the operation and maintenance capabilities of the technology subsystem, while reflecting the cost burden of the economy subsystem. A shortage of human resources can limit the construction and operational efficiency of wind power systems, while an overinvestment in human resources may lead to resource waste and increased costs, resulting in lower efficiency. Given the available data, this study collects employment figures for the electricity, gas, and water production and supply industry. These values are then transformed using logarithms to measure the human resource situation. Data on the number of employees in this industry is sourced from the CSMAR database.
    • Electricity: Electricity demand. Insufficient electricity demand may result in inadequate accommodation capacity of regional power grids, leading to the abandonment of wind power and a loss of comprehensive efficiency. Electricity demand reflects the market demand in the economic subsystem and is the main driving force for the change of the economic subsystem. This study collects data on electricity consumption and logarithmically measures the electricity demand of each province for the current year. The electricity consumption data is sourced from the China Statistical Yearbook.

3.2. Descriptive Statistics

Input and Output Variables

As shown in Figure 5 and Figure 6, this study calculates the maximum, minimum, mean, and standard deviation of the input-output indicators for both the development and operation stages, rounding the results to two decimal places without altering the original intent. During the development stage (S1), the average and minimum values of the average wind speed increased slightly, indicating a small improvement in the overall wind energy resource. Meanwhile, enhanced wind energy capture at low speeds has promoted low-wind-speed turbine applications, leading to higher power generation efficiency. A slight decrease in the standard deviation indicates an improvement in the stability of China’s wind energy resources. The minimum value of installed wind power capacity has not changed significantly, primarily due to insufficient development efforts and low installed capacity in the Tibet region. The growth of the maximum value and average value suggests an expansion in the overall size of China’s installed wind power capacity, largely driven by the country’s strong emphasis on renewable energy.
During the operation stage (S2), the minimum values of the three indicators—operation and maintenance costs of the wind power system, wind power generation, and energy substitution income—do not change significantly. This is primarily due to the very limited construction of the wind power system in the Tibet region. Individually, the maximum value of operation and maintenance costs fluctuates significantly, which may be related to occasional events, such as batch failures of wind turbines or high operation and maintenance costs resulting from technological iteration and upgrades. The trend in power generation closely mirrors that of wind power installed capacity (Figure 5d). On one hand, wind power installed capacity directly determines the potential for wind power generation. On the other hand, China’s policy support for clean wind power has reduced the wind power abandonment rate, allowing wind power installed capacity to be converted into actual power generation. The energy substitution income from wind power shows an overall upward trend, which positively contributes to reducing China’s overall emission reduction costs and promoting the green transformation of the energy structure.

4. Results

4.1. Overall Efficiency Analysis

From 2010 to 2022, China’s regional wind power system efficiency exhibited marked temporal and spatial variation (Figure 7). The period from 2010 to 2017 represents an early development stage characterized by fragmented planning, limited technical expertise, and weak system integration. Efficiency remained constrained during this time not only by infrastructural deficiencies but also by the limited functionality of operation and maintenance subsystems. Since setting the dual carbon target in 2020, China has intensified the development and utilization of renewable energy, driving improvements in the comprehensive efficiency of the wind power system. In addition to accelerating the construction of wind power systems and fostering innovation in wind power technology, China has also incorporated digital technology into wind power equipment, enhancing its ability to monitor wind power data, optimize the power generation process, and capture wind energy. Benefiting from the enhanced utilization of the resource subsystem, the advancement of the technology subsystem, and the investment in the economy subsystem, the three subsystems jointly contribute to the improvement of the comprehensive efficiency of the wind power system. Spatially, the higher efficiency levels observed in the Northeast and Western regions are not only due to superior wind and land resources but also reflect deeper systemic alignment between resource endowments, supportive policy environments, and region-specific technological adaptation. In contrast, the Eastern and Central regions face inherent geographic and spatial constraints, such as limited land availability and fragmented wind corridors. These regions also reveal lagging subsystem coordination, where resource scarcity has not yet been effectively offset by technological or institutional adaptation. This suggests that regional efficiency gaps are less about absolute resource differences and more about the capacity of each region to optimize the interaction between natural endowments, technological deployment, and economic mechanisms.
Considering the clarity of provincial divisions, we present a map (Figure A1) depicting the division of the study area in the Appendix A. Figure A1 and Figure 8 can be examined in conjunction for a more comprehensive understanding. Figure 8 shows the comprehensive efficiency of the wind power system in four regions of China from 2010 to 2022. Across the Eastern and Central regions, the comprehensive efficiency of the wind power system remains generally low in most provinces and municipalities, with the notable exceptions of Hebei, Shandong, and Shanxi. Conversely, the comprehensive efficiency of the wind power system in the Northeast and Northwest regions is relatively high.
The Northeast region demonstrates the highest comprehensive efficiency of wind power systems, driven by abundant and stable wind resources, favorable terrain, low population density, and strong industrial demand. These conditions reflect minimal constraints from the resource subsystem and robust support from the economic subsystem. In contrast, the Western region exhibits marked internal variation. Northwestern provinces such as Xinjiang, Inner Mongolia, Gansu, and Ningxia benefit from large-scale wind development facilitated by supportive national transmission projects and technological upgrading. However, areas like Tibet and Chongqing face significant resource limitations due to complex terrain, high altitude, and weak wind regimes, which impede both construction feasibility and turbine performance. Overall, regional efficiency differences in the West are primarily shaped by the heterogeneity of the resource subsystem, with high-efficiency areas also receiving strong support from the technology subsystem.
This analysis highlights that regional disparities in wind power system efficiency are not solely determined by static natural endowments, but by the dynamic capacity of each region to foster coordination among key subsystems. In regions where resource advantages are weaker, targeted technological upgrading and institutional innovation are essential to unlock latent potential and close the efficiency gap.

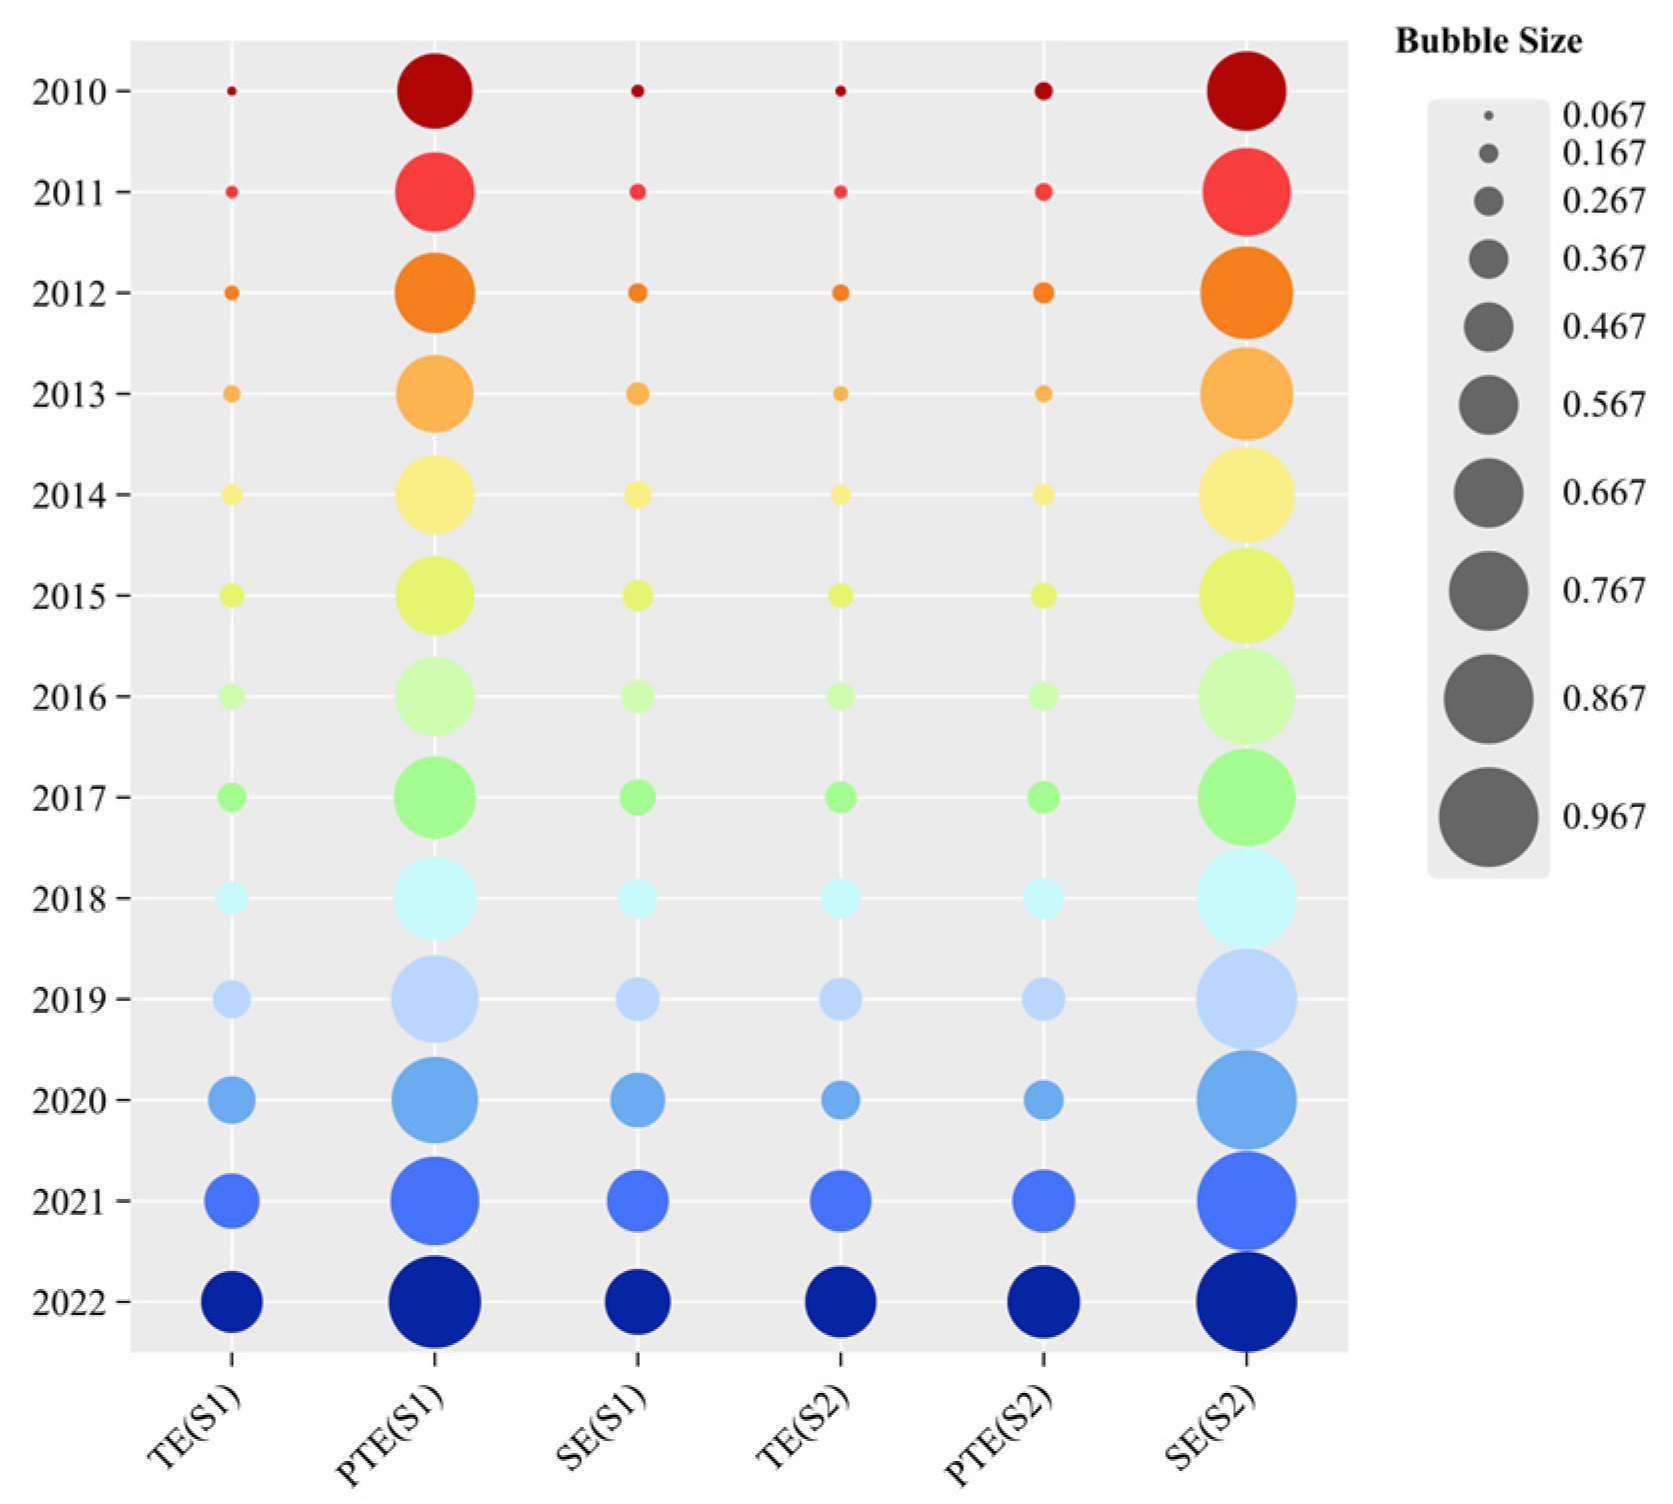
4.2. Stage Efficiency Analysis

This paper employs a two-stage EBM model to systematically assess the comprehensive efficiency of the wind power system in China. The comprehensive technical efficiency (TE) of both stages is decomposed into pure technical efficiency (PTE) and scale efficiency (SE) to identify the factors driving efficiency changes. Figure 9 presents the national-level average results across China.
During the development stage (S1), both PTE and SE exhibited an overall upward trend, contributing to the improvement of TE (Figure 9 and Figure 10). Notably, the contribution of PTE is generally higher than that of SE, suggesting that efficiency gains at this stage are more dependent on technological optimization and the rational allocation of resources. Northeast and Northwest have benefited from a rational match between wind resource endowments and siting strategies, enabling higher energy yields with relatively lower land and capital costs. This reflects a successful alignment between the resource and technology subsystems, where advancements in site selection, turbine suitability, and spatial planning enhance resource conversion efficiency. In the early stages of development, the overall scale efficiency of the wind power system is relatively low due to limited market demand and the issue of wind power curtailment. The economic subsystem thus acted as a bottleneck, restricting the expansion of wind energy utilization despite favorable natural conditions. These trends underscore that the optimization of wind power efficiency during the development stage is not solely a function of natural potential, but of how effectively the three subsystems—resources, technology, and economy—are coordinated. Technological innovation not only enhances energy conversion but also acts as a critical lever to compensate for resource or market limitations, thereby reshaping the developmental trajectory of wind power systems across regions.
During the operation stage (S2), while the pure technical efficiency (PTE) experienced slight fluctuations, it generally exhibited an upward trend. The contribution rate of scale efficiency (SE) to total efficiency is significantly higher than that of PTE (Figure 9 and Figure 10), indicating that improvements in efficiency at this stage were more influenced by scale expansion than by the optimization of operation, maintenance technology, and management practices. As the scale expands, the operation and maintenance cost per unit of power generation decreases. Consequently, wind power system can effectively spread their operational and maintenance costs, resulting in improved efficiency. Particularly when the energy substitution income per unit of electricity generation remains stable, the reduction in unit costs due to scale expansion directly translates into better efficiency. The economic subsystem—via market incentives, policy-driven expansion, and large-scale investment—has therefore played a more prominent role than the technology subsystem during this stage. However, this reliance on scale effects comes with trade-offs as high-quality wind resources become saturated, and further expansion into low-wind-speed regions risks diminishing returns. The sustainability of efficiency gains driven primarily by capacity growth, rather than technical optimization, merits consideration. The relatively low PTE across most regions points to underdeveloped operation and maintenance strategies, insufficient digital integration, and a lack of refined management systems. It is noteworthy that the Northeast region demonstrates a relatively high level of pure technical efficiency compared to the other three regions (Figure 10h), largely due to the ongoing refinement of wind power technology. Specifically, the adoption of technologies such as blade anti-icing and de-icing has effectively countered the negative impact of low winter temperatures on wind turbine operations, leading to a significant improvement in the overall operational efficiency of wind power systems. This indicates that when the technology subsystem is strategically mobilized to address region-specific operational challenges, it can significantly enhance system performance, even under adverse environmental conditions. This underscores the importance of rebalancing subsystem contributions: long-term efficiency improvements must shift from scale-driven expansion toward innovation-driven optimization, with a stronger emphasis on technological upgrading and management refinement.

4.3. Sub-Index Efficiency Analysis

As shown in Figure 11 and Figure 12, from 2010 to 2022, the efficiency of input-output indicators across both stages revealed significant regional disparities and temporal variations. The Northeast region consistently leads in key indicators such as average wind speed, population density efficiency, and unutilized land area efficiency, underscoring its advantageous natural conditions and favorable development environment. The persistently low efficiency in the Central region’s unutilized land area within the resource subsystem also reflects structural geographic and development constraints that hinder wind power expansion. The above content indicates that the resource subsystem plays a critical role in shaping wind power system performance.
The Northeast’s stable, high wind speeds—driven by unique climatic patterns—and abundant land support large-scale wind farms, enabling more efficient resource utilization. Meanwhile, the Eastern region’s higher population density and limited land constrain wind power development, despite its advanced technological and economic capacities. This mismatch illustrates that even strong technology and economy subsystems cannot fully compensate for inadequate natural resource support.
In terms of installed capacity efficiency, the Northeast’s combined advantages in resource availability and technological progress have fostered superior performance, while the Eastern region’s resource limitations result in rising development costs and comparatively lower efficiency. Operational and maintenance cost efficiencies have improved substantially across all regions, driven by capacity scale effects and better management practices, demonstrating effective synergy between the technology and economy subsystems. However, regional disparities persist in power generation efficiency and income from energy substitution, with the Northeast showing recent declines possibly due to capacity saturation and resource subsystem instability (e.g., typhoon impacts in the East). This reveals the ongoing vulnerability of wind power systems to environmental factors and resource fluctuations.
Overall, these patterns affirm that enhancing wind power efficiency depends on the coordinated optimization of resource endowments, technological capabilities, and economic mechanisms. Regional gaps arise less from isolated factors and more from varying capacities to integrate these subsystems effectively. Future strategies should emphasize adaptive resource management and targeted technological innovation to address specific regional constraints and improve systemic synergy.
Figure 13 presents the clustering heatmap of sub-index efficiency. Between 2018 and 2022, about one-third of the provinces and municipalities had wind power installed capacity efficiency and wind power generation efficiency within the optimal range, indicating a clear clustering pattern. The efficiency distribution during the development stage shows a polarized trend, with high-efficiency provinces and municipalities coexisting alongside low-efficiency ones. From a clustering perspective, there is a notable correlation between OAMC and ESI. Enhancing operation and maintenance technologies and management practices can contribute to an increase in the energy substitution income of wind power. There is also a strong correlation between WPIC and WPG. Wind power generation capacity is directly related to the installed capacity of wind power, meaning that increasing installed capacity enhances the potential for wind power generation. In contrast, weaker correlations across development-stage and operation-stage indicators—such as between AWS and WPG—are evident. This highlights the technological bottlenecks that limit the full translation of natural resource endowments into usable output. These mismatches point to an underperformance of the technology subsystem, which has not yet delivered the necessary transformative capacity to ensure the coordinated evolution of the wind power system across regions. The lack of synchronization between development and operation further reflects the incomplete integration of the resource, technology, and economy subsystems. Moving forward, it is crucial to closely monitor the interrelated effects between the development and operation of the wind power system. While fully leveraging the support of the resource subsystem and the driving force of the economy subsystem, efforts should be made to coordinate the impetus of the technology subsystem, promoting advancements in wind power generation technology and improvements in management practices. This will not only enhance the operation and maintenance levels of the wind power system but also increase the comprehensive efficiency.

4.4. Tobit Regression Analysis

The comprehensive efficiency of wind power systems in different regions is significantly influenced by the stability of the local resource subsystem, as well as the development levels of the technology subsystem and economy subsystem. This study employs the Tobit model to examine the factors affecting the comprehensive efficiency of the wind power system and their respective impacts. The analysis encompasses six key factors in the three subsystems: LTD, ERD, EDD, Technology, HR, and Electricity. The Tobit regression analysis was conducted on the results from the two-stage EBM model using Stata 18 software, and the detailed findings are summarized in Table 2.
The regression results reveal not only the statistical significance of key driving variables but also the deeper mechanisms through which resource, technology, and economic subsystems interact to shape the comprehensive efficiency of the wind power system.
Among resource-related variables, the positive influence of extreme rainfall (ERD) and drought (EDD) reflects a nuanced relationship between climatic volatility and wind energy potential. These extreme events, rather than being seen solely as risks, can enhance wind availability through increased atmospheric instability and stronger wind currents under certain conditions. However, the negative effect of extremely low temperatures (LTD) underscores the operational vulnerability of turbines in cold regions, where ice formation and mechanical stress can significantly impair performance. This contrast highlights the dual nature of natural variability—at times expanding the resource base, while at others posing serious threats. This points to the critical role of adaptive technologies. Targeted investments in cold-resistant turbine design and site-specific engineering solutions can therefore mitigate environmental constraints and stabilize efficiency outcomes.
The technology subsystem emerges as a primary driver of system efficiency. Beyond improving technical efficiency, technological innovation may also enhance the system’s capacity to respond to external disturbances. At the same time, the negative impact of human resources (HR) reveals a structural mismatch. The dominance of thermal power expertise and the shortage of wind-specific technical personnel contribute to inefficiencies in labor allocation and operational management. Excessive reliance on non-specialized labor increases costs and undermines the return on investment in human capital. Addressing this challenge requires not only retraining programs for existing thermal power professionals but also the strategic cultivation of wind-specific technical talent.
The positive effect of electricity demand points to the enabling role of the economic subsystem. Stronger demand not only improves the economic return on wind energy by increasing utilization rates but also incentivizes grid infrastructure upgrades and policy support for renewable integration. This demand-side pull reinforces the supply-side technological push, suggesting a synergistic interaction between the technology and economy subsystems. Regions with high demand are thus more likely to accelerate wind power development through both market incentives and system-level improvements.
Taken together, these findings demonstrate that improving wind power efficiency is not solely a function of enhancing individual factors but rather a matter of optimizing subsystem coordination.

4.5. Statistical Testing of Metrics

Identifying the influencing factors is an important prerequisite before prediction. This article has utilized the Tobit regression model to identify the six influencing factors of the comprehensive efficiency of the wind power system. However, whether these six influencing factors can be used as predictive precursor factors still needs further verification.
Factor analysis can test the correlation between system efficiency and its six influencing factors by various indicators. It is conducted on the system efficiency and its six influencing factors using SPSS 17.0 software. The KMO value of the system efficiency and its six influencing factors is 0.602 (Table 3), where 0.6 < KMO < 0.7. Bartlett’s sphericity test yields a large approximate chi-square value with a significance level of <0.01, rejecting the null hypothesis. This result indicates a significant correlation between the system efficiency and its six influencing factors, making it suitable for factor analysis. Therefore, the six influencing factors determined based on the Tobit regression model can be regarded as statistically significant predictors for the statistical prediction of wind power efficiency.

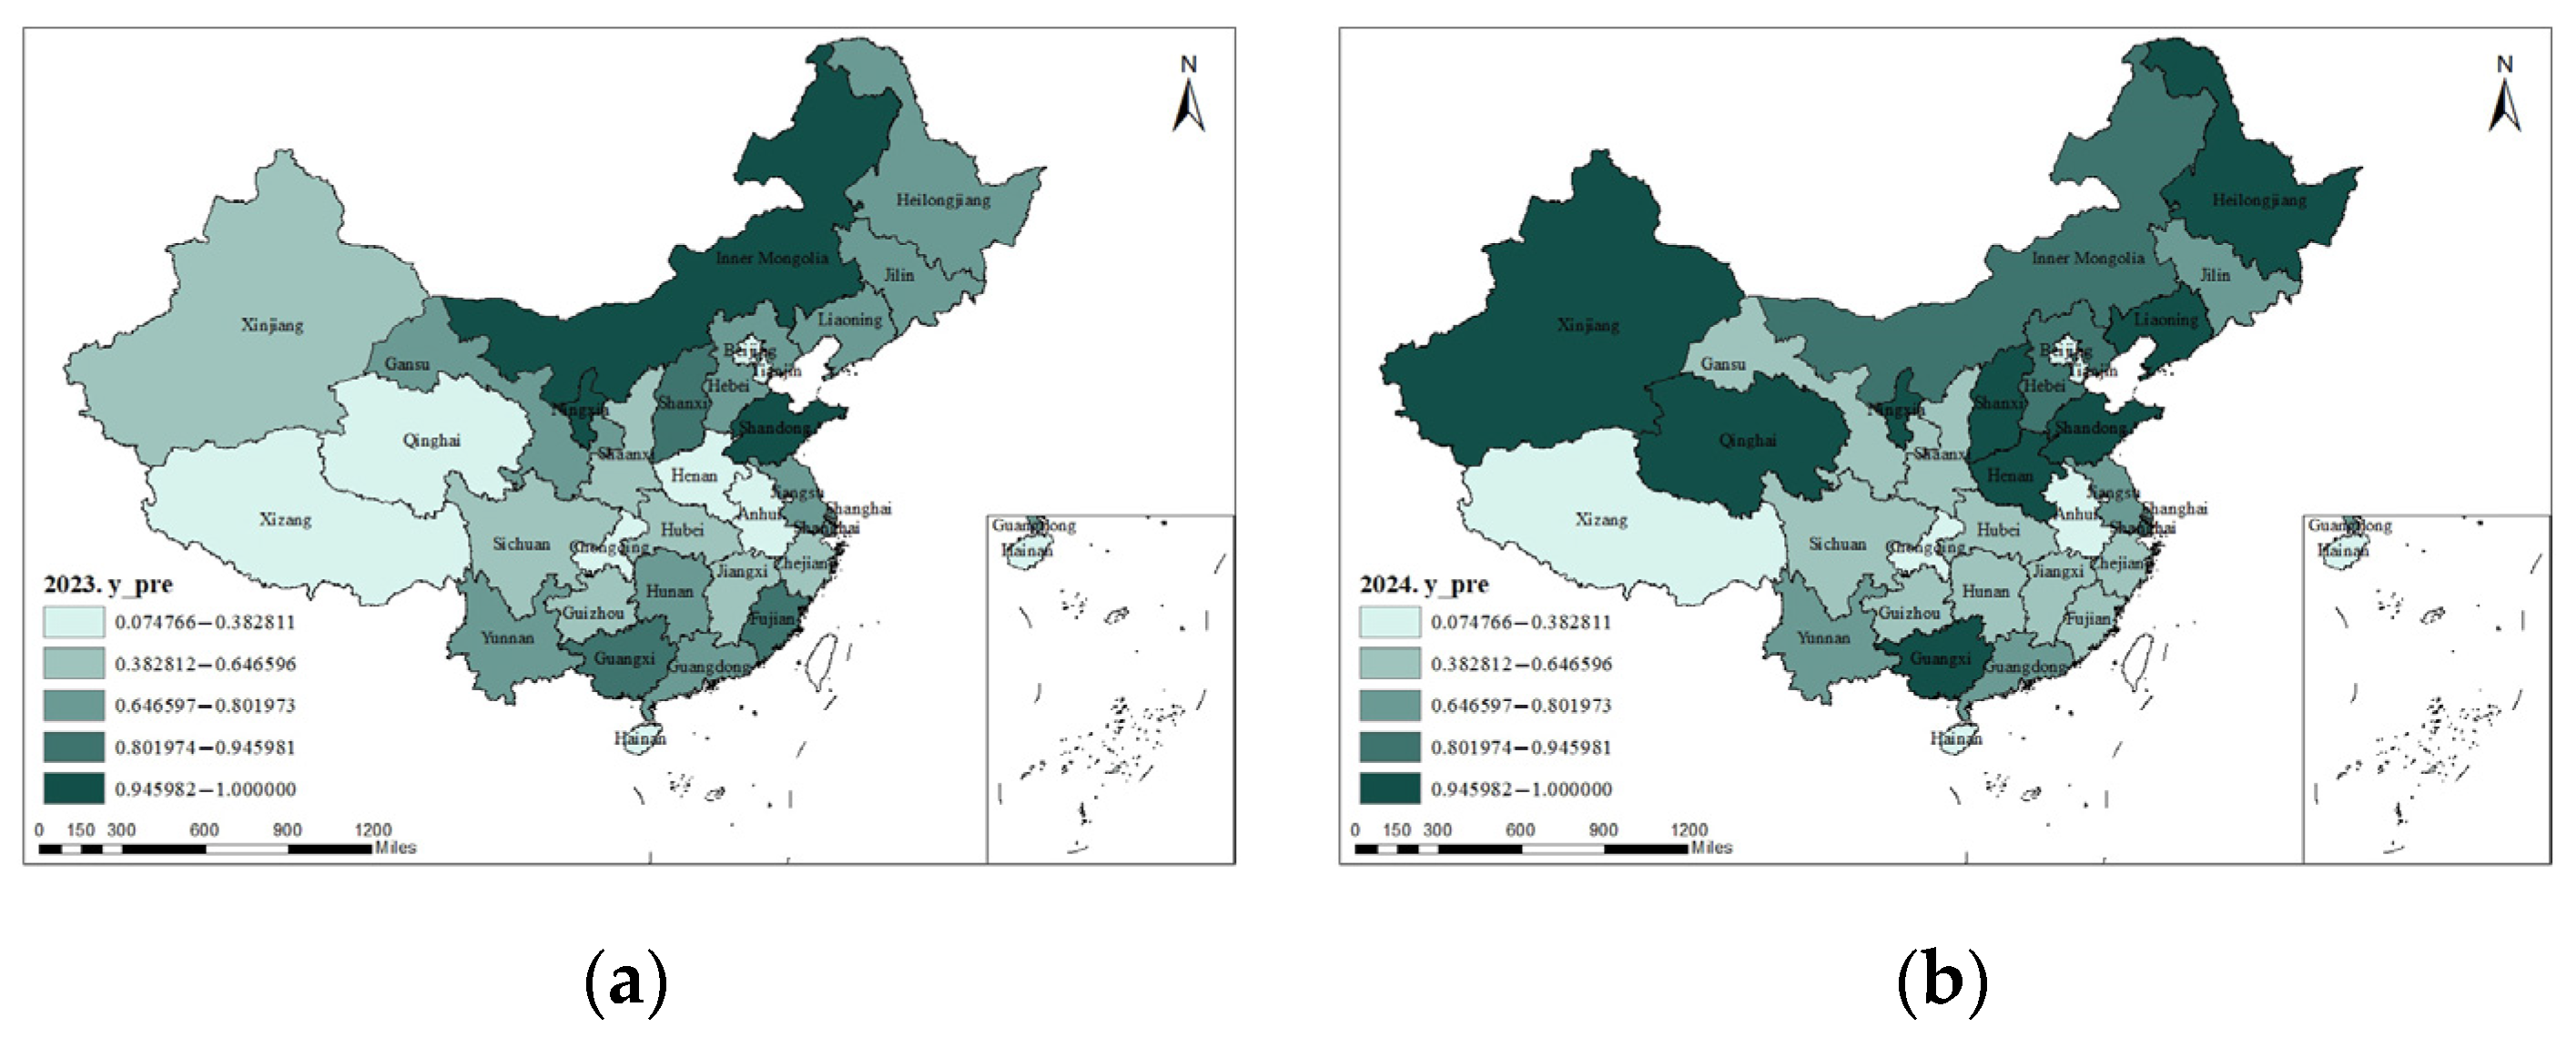
4.6. Prediction Analysis

This study employs the FNN model to predict the six major driving factors influencing the comprehensive efficiency of wind power systems, and successively estimates efficiency values for 31 provinces and municipalities in China from 2023 to 2030. Prior to model training, all input variables are normalized using min-max scaling to ensure numerical stability. Specifically, 80% of the dataset constitutes the training set, while 20% serves as the test set. Hyperparameter tuning, including the number of hidden layers, neurons, and learning rate, is conducted using grid search and cross-validation. The model’s predictive performance is evaluated using the coefficient of determination (R2) and mean squared error (MSE). The fitting results are presented in Table 4.
Figure 14 presents the projected regional trends in the comprehensive efficiency of China’s wind power system from 2023 to 2030 (Figure A1 and Figure 14 can be examined in conjunction for a more comprehensive understanding). Perhaps due to the continued influence of technological progress and sustained policy support, the overall upward trend is evident. However, regional differentiation remains prominent. Areas with strong resource and technological foundations are expected to retain their efficiency advantages, while resource-constrained regions—despite showing steady improvement—are unlikely to close the gap entirely. This persistent imbalance underscores the importance of region-specific interventions and differentiated development strategies. The projection also highlights the increasing divergence between regions with mature wind power infrastructure and those still facing institutional, technological, or environmental constraints. These dynamics illustrate that while efficiency growth is broadly shared, systemic coordination across regions remains an unresolved challenge.

5. Discussion

The conclusions of this study exhibit both similarities and differences with those found in the existing literature. First, this study reveals that while the comprehensive efficiency of wind power systems across regions has fluctuated somewhat, it generally shows a steady upward trajectory. From the perspective of phased efficiency values, both the development stage efficiency and the operation stage efficiency have demonstrated continuous growth. This finding is largely consistent with the conclusion of Sun et al. (2021) [9], who observed similar trends in wind power efficiency. However, their research indicates that the average efficiency of wind power in China remained above 0.7 from 2012 to 2017, which is significantly higher than the efficiency level below 0.5 calculated in this study. This discrepancy primarily stems from differences in both the research timeframes and the methodologies used for efficiency assessment. In this study, we applied a two-stage EBM model to evaluate both the development and operation phases of the wind power system, based on panel data from each province and city between 2010 and 2022. In contrast, Sun et al. (2021) focused solely on the power generation phase and employed the traditional DEA model [9]. Their input and output indicators were limited to the installed capacity of wind power and power generation volume, overlooking other crucial factors. Additionally, while we both agree on the higher efficiency in the Western region and the lower efficiency in the Central region, we diverge in our assessments of the Eastern region’s position in the national efficiency ranking due to differences in regional classification standards, particularly concerning the categorization of the Northeast region.
Consistent with this study, Tian, Xiao, and Ren (2021) also employed the EBM model to evaluate and compare the efficiency of the wind power industry in four regions of China from 2013 to 2017 [8]. However, their study focused solely on the efficiency of the power generation stage and yielded a decomposition result of technical efficiency that contrasts with the findings of this paper. In our study, the contribution rate of scale efficiency (SE) in the operation stage is generally higher than that of pure technical efficiency (PTE), whereas the decomposition results from Tian, Xiao, and Ren (2021) show that PTE is higher than SE [8]. These differences in decomposition results could be attributed to variations in the selection of indicators. Our study focuses on wind power systems as the primary research subject, selecting operation and maintenance costs as inputs, and wind power generation and energy substitution benefits as outputs of the operation stage. On the other hand, Tian, Xiao, and Ren (2021) also considered carbon emission reduction efficiency and thus included wind power installed capacity and the number of industry employees as inputs, with electricity generation and CO2 emissions as outputs, while omitting cost and revenue indicators [8].
Many studies have confirmed the influence of natural resources and economic factors on wind power generation. Duan et al. (2021) pointed out that uncertain factors such as weather and temperature can affect the actual data of wind power generation [53]. Xu and Lin (2024) utilized provincial panel data from 2010 to 2021 and found that green finance and the price of wind power had a positive and negative effect on wind power generation, respectively [55]. The findings of this study align with those of Dong and Shi (2019), who concluded that electricity demand positively influences the efficiency of wind power generation [7]. On this basis, this study also reveals the pulling effect of the economic subsystem where the electricity demand lies on the wind power system. However, their study also incorporated additional factors, such as economic development, competition levels, and wind curtailment rates, which were not considered in this research. The conclusion by Sun et al. (2021) that technological innovation in wind power can enhance efficiency has also been supported by the results of this study [9]. This study further elevates the impact of technological innovation to the driving role of the technology subsystem in the wind power system. Additionally, this study emphasizes the varying impacts of human resources and extreme weather conditions on wind power efficiency. It explains the disturbance characteristics of the resource subsystem and the coordination mechanism among the three subsystems.
This study provides a systematic analysis of the comprehensive efficiency of wind power systems and their driving factors using provincial panel data from China covering 2010 to 2022, establishing the longest time span research sample in the existing literature. However, due to data availability constraints, the study does not include data from the most recent two years, which somewhat impacts the timeliness of the conclusions. A comparison of findings reveals that the construction of the index system plays a decisive role in the research results. The discrepancies in index selection may be a key reason for the differences between the conclusions of this study and those of other papers. Therefore, future research could aim to develop a more comprehensive index system for assessing the comprehensive efficiency of wind power systems and increase the sample size by incorporating indicators related to grid construction levels and policy factors. The design of subsystems associated with wind power systems should be more comprehensive. In future research, the impact of the policy subsystem, which has not been considered in this study, can be incorporated. Further investigation into other factors affecting the comprehensive efficiency of wind power systems would provide more comprehensive evidence to support the clean transformation of the power sector. Furthermore, while the FNN model demonstrates strong nonlinear fitting and predictive capabilities, it operates as a black-box model, lacking transparency in how input features influence the output. The absence of explicit physical meaning in network weights and activation functions restricts interpretability, making it difficult to trace causal relationships or explain model behavior in physical or engineering terms. This opacity also hinders robust uncertainty quantification, which is essential for decision-making in energy planning. Moreover, FNNs are sensitive to data quality and hyperparameter settings, which can lead to overfitting, especially in datasets with high noise or limited size. Future studies may address these issues by integrating FNNs with interpretable models, such as decision trees or physics-informed neural networks, to build hybrid frameworks that balance predictive accuracy with physical transparency and provide more reliable uncertainty estimates.

6. Conclusions and Suggestions

6.1. Conclusions

This study constructs a two-stage EBM-based framework to evaluate the comprehensive efficiency of China’s wind power system from 2010 to 2022, incorporating the resource, technology, and economy subsystems into the development and operation stages. The findings reveal five key insights:
  • The national average efficiency of wind power systems remains low (0.284), but exhibits a steady upward trend over time, particularly after 2020. Spatial disparities are pronounced: Northeast and Western regions show higher efficiency, reflecting more effective subsystem coordination, while resource-limited Eastern and Central regions lag behind.
  • The efficiency of both development and operation stages has improved over time, though the drivers differ. In the development stage, PTE dominates, underscoring the role of technological optimization in siting and construction. In contrast, SE is more influential in the operation stage, indicating shortcomings in maintenance and management practices that limit technological effectiveness.
  • Subsystem coordination remains insufficient. While strong resource conditions enhance development efficiency in certain regions, there is limited synergy between the development and operation stages. This suggests that the resource–technology–economy triadic framework has not yet achieved integrated optimization.
  • Influencing factors vary across subsystems. Within the resource subsystem, extreme rainfall and drought positively affect efficiency, whereas extreme cold conditions reduce it, exposing its volatility and vulnerability. Technological innovation promotes efficiency, while inefficient human resources constrain it. Electricity demand positively drives efficiency, revealing the economy subsystem’s market-pull effect.
  • Projections indicate that overall efficiency will continue to rise under technological support, though regional imbalances are expected to persist. This underscores the need for targeted interventions in low-efficiency regions and a shift from scale expansion to quality-focused, technology-led development.

6.2. Suggestions

The eastern and central regions, constrained by limited resource endowments, exhibit relatively low comprehensive efficiency of the wind power system, highlighting the significant limiting effect of the resource subsystem on overall development potential. To address this, a coordinated deployment of offshore and onshore wind projects should be promoted in a region-specific manner to alleviate land scarcity issues. In contrast, resource-rich areas should capitalize on their comparative advantages by strengthening cross-regional power transmission infrastructure and enhancing local wind energy consumption capacity to improve overall system efficiency.
The technology subsystem serves as the core driving force behind efficiency improvements in the wind power system. Currently, there remains substantial room for improvement in operation, maintenance, and management practices. Efforts should focus on accelerating digital transformation and the development of intelligent operation and maintenance systems, thereby advancing toward more refined and intelligent system operation. At the same time, it is essential to strengthen talent support, optimize the structure of managerial and technical personnel, and facilitate the transition of traditional thermal power professionals into the wind power sector to improve human resource allocation efficiency. For regions with extremely cold climates, the development of low-temperature-resistant technologies and equipment adaptation should be prioritized.
Low-efficiency regions may prioritize the development of distributed wind power and low-wind-speed turbine technologies to better suit local wind resource conditions, while also accelerating technological innovation in key areas such as site selection, turbine design, operation, and transmission. Government support in the form of policies and funding is crucial during this process. Cross-regional sharing of resources and technologies should be promoted, and low-efficiency regions should be encouraged to purchase electricity from high-efficiency areas to achieve mutual benefits. Furthermore, integrating wind power development with carbon sink trading mechanisms can enhance project economic viability and strengthen the synergetic and virtuous interaction among the resource, technology, and economy subsystems.

Author Contributions

Conceptualization, F.-R.R., H.-L.L. and X.-Y.L.; methodology, F.-R.R., H.-L.L. and X.-Y.L.; validation, H.-L.L. and X.-Y.L.; investigation, H.-L.L. and X.-Y.L.; resources, F.-R.R.; data curation, H.-L.L. and X.-Y.L.; writing—original draft preparation, F.-R.R.; writing—review and editing, H.-L.L. and X.-Y.L.; visualization, H.-L.L. and X.-Y.L.; supervision, F.-R.R.; project administration, F.-R.R.; funding acquisition, F.-R.R. All authors have read and agreed to the published version of the manuscript.

Funding

This research was funded by the National Social Science Fund of China (Grant No. 24BJY142), the Jiangsu Province Social Science Foundation Project (22GLD019), and Major Project of Philosophy and Social Science Research in Universities of Jiangsu Province (2022SJZD053).

Data Availability Statement

The original contributions presented in this study are included in the article. Further inquiries can be directed to the corresponding author.

Acknowledgments

We gratefully acknowledge the Editor and reviewers for their insightful comments on earlier drafts of this paper. This study was supported by the National Social Science Fund of China (Grant No. 24BJY142), the Jiangsu Province Social Science Foundation Project (22GLD019), and Major Project of Philosophy and Social Science Research in Universities of Jiangsu Province (2022SJZD053).

Conflicts of Interest

The authors declare no conflicts of interest.

Abbreviations

The following abbreviations are used in this manuscript:
EBMEpsilon-Based Measure
DEAData Envelopment Analysis
ANNArtificial Neural Network
LSTMLong Short-Term Memory network
CCRCharnes-Cooper-Rhodes model
BCCBanker-Charnes-Cooper Model
SBMSlacks-Based Measure Model
APPHEAFSA-PSO-parallel-hybrid evolutionary
IPCInternational Patent Classification
CSMARChina Stock Market and Accounting Research Database
FNNFeedforward neural network
DMUDecision-making unit
S1Development stage
S2Operation stage
TETechnical efficiency
PTEPure technical efficiency
SEScale efficiency
AWSAverage wind speed
PDPopulation density
ULAUnutilized land area
WPICWind power installed capacity
OAMCOperation and maintenance cost
WPGWind power generation
ESIEnergy substitution income
LTDExtreme low-temperature index
ERDExtreme rainfall index
EDDExtreme drought index
HRHuman resources
KMOKaiser-Meyer-Olkin Measure of Sampling Adequacy

Appendix A

Figure A1. Research areas.
Systems 13 00579 g0a1
Table A1. The regional divisions of the 31 provinces and municipalities in China.
RegionProvince
Eastern regionBeijing, Tianjin, Hebei, Shanghai, Jiangsu, Zhejiang, Fujian, Shandong, Guangdong, Hainan
Central regionShanxi, Anhui, Jiangxi, Henan, Hubei, Hunan
Western regionGansu, Guangxi, Guizhou, Inner Mongolia, Ningxia, Qinghai, Shaanxi, Sichuan, Xinjiang, Xizang, Yunnan, Chongqing
Northeast regionHeilongjiang, Jilin, Liaoning

References

  1. Energy Institute. Statistical Review of World Energy; Energy Institute: London, UK, 2024; Available online: https://www.energyinst.org/statistical-review/home (accessed on 13 March 2025).
  2. International Energy Agency. World Energy Outlook; International Energy Agency: Paris, France, 2024; Available online: https://www.iea.org/reports/world-energy-outlook-2024 (accessed on 13 March 2025).
  3. Wang, Y.; Wang, R.; Tanaka, K.; Ciais, P.; Penuelas, J.; Balkanski, Y.; Sardans, J.; Hauglustaine, D.; Liu, W.; Xing, X.; et al. Accelerating the Energy Transition towards Photovoltaic and Wind in China. Nature 2023, 619, 761–767. [Google Scholar] [CrossRef]
  4. Global Wind Energy Council. Global Wind Report. 2024. Available online: https://www.gwec.net/reports/globalwindreport (accessed on 13 March 2025).
  5. Maradin, D.; Cerović, L.; Šegota, A. The Efficiency of Wind Power Companies in Electricity Generation. Energy Strategy Rev. 2021, 37, 100708. [Google Scholar] [CrossRef]
  6. Akbari, N.; Jones, D.; Treloar, R. A Cross-European Efficiency Assessment of Offshore Wind Farms: A DEA Approach. Renew. Energy 2020, 151, 1186–1195. [Google Scholar] [CrossRef]
  7. Dong, F.; Shi, L. Regional Differences Study of Renewable Energy Performance: A Case of Wind Power in China. J. Clean. Prod. 2019, 233, 490–500. [Google Scholar] [CrossRef]
  8. Tian, Z.; Xiao, Q.-W.; Ren, F.-R. Assessing the Efficiency and CO2 Reduction Performance of China’s Regional Wind Power Industry Using an Epsilon-Based Measure Model. Front. Energy Res. 2021, 9, 672183. [Google Scholar] [CrossRef]
  9. Sun, X.; Lian, W.; Duan, H.; Wang, A. Factors Affecting Wind Power Efficiency: Evidence from Provincial-Level Data in China. Sustainability 2021, 13, 12759. [Google Scholar] [CrossRef]
  10. Wu, Y.; Hu, Y.; Xiao, X.; Mao, C. Efficiency Assessment of Wind Farms in China Using Two-Stage Data Envelopment Analysis. Energy Convers. Manag. 2016, 123, 46–55. [Google Scholar] [CrossRef]
  11. Altan, A.; Karasu, S.; Zio, E. A New Hybrid Model for Wind Speed Forecasting Combining Long Short-Term Memory Neural Network, Decomposition Methods and Grey Wolf Optimizer. Appl. Soft. Comput. 2021, 100, 106996. [Google Scholar] [CrossRef]
  12. Zhang, W.; Lin, Z.; Liu, X. Short-Term Offshore Wind Power Forecasting—A Hybrid Model Based on Discrete Wavelet Transform (DWT), Seasonal Autoregressive Integrated Moving Average (SARIMA), and Deep-Learning-Based Long Short-Term Memory (LSTM). Renew. Energy 2022, 185, 611–628. [Google Scholar] [CrossRef]
  13. Moreno, S.R.; Seman, L.O.; Stefenon, S.F.; Coelho, L.D.S.; Mariani, V.C. Enhancing Wind Speed Forecasting through Synergy of Machine Learning, Singular Spectral Analysis, and Variational Mode Decomposition. Energy 2024, 292, 130493. [Google Scholar] [CrossRef]
  14. Harbola, S.; Coors, V. Deep Learning Model for Wind Forecasting: Classification Analyses for Temporal Meteorological Data. PFG-J. Photogramm. Remote Sens. Geoinf. Sci. 2022, 90, 211–225. [Google Scholar] [CrossRef]
  15. Ko, M.-S.; Lee, K.; Kim, J.-K.; Hong, C.W.; Dong, Z.Y.; Hur, K. Deep Concatenated Residual Network with Bidirectional LSTM for One-Hour-Ahead Wind Power Forecasting. IEEE Trans. Sustain. Energy 2021, 12, 1321–1335. [Google Scholar] [CrossRef]
  16. Zhang, J.; Wang, Y.; Gao, L. Empirical Research on Technical Efficiency of Wind Power Industry in China Based on SFA Method. Environ. Dev. Sustain. 2024, 26, 8443–8465. [Google Scholar] [CrossRef]
  17. Vargas, S.A.; Esteves, G.R.T.; Maçaira, P.M.; Bastos, B.Q.; Cyrino Oliveira, F.L.; Souza, R.C. Wind Power Generation: A Review and a Research Agenda. J. Clean. Prod. 2019, 218, 850–870. [Google Scholar] [CrossRef]
  18. Yatiyana, E.; Rajakaruna, S.; Ghosh, A. Wind Speed and Direction Forecasting for Wind Power Generation Using ARIMA Model. In Proceedings of the 2017 Australasian Universities Power Engineering Conference (AUPEC), Melbourne, Australia, 19–22 November 2017; IEEE: Melbourne, Australia, 2017; pp. 1–6. [Google Scholar]
  19. Hua, E.; Sun, R.; Feng, P.; Song, L.; Han, M. Optimizing Onshore Wind Power Installation within China via Geographical Multi-Objective Decision-Making. Energy 2024, 307, 132431. [Google Scholar] [CrossRef]
  20. Iglesias, G.; Castellanos, P.; Seijas, A. Measurement of Productive Efficiency with Frontier Methods: A Case Study for Wind Farms. Energy Econ. 2010, 32, 1199–1208. [Google Scholar] [CrossRef]
  21. Zhou, P.; Ang, B.W.; Poh, K.L. A Survey of Data Envelopment Analysis in Energy and Environmental Studies. Eur. J. Oper. Res. 2008, 189, 1–18. [Google Scholar] [CrossRef]
  22. Sağlam, Ü. Assessment of the Productive Efficiency of Large Wind Farms in the United States: An Application of Two-Stage Data Envelopment Analysis. Energy Convers. Manag. 2017, 153, 188–214. [Google Scholar] [CrossRef]
  23. Sağlam, Ü. A Two-Stage Performance Assessment of Utility-Scale Wind Farms in Texas Using Data Envelopment Analysis and Tobit Models. J. Clean. Prod. 2018, 201, 580–598. [Google Scholar] [CrossRef]
  24. Wang, C.-N.; Nguyen, H.-P.; Wang, J.-W. A Two-Stage Approach of DEA and AHP in Selecting Optimal Wind Power Plants. IEEE Trans. Eng. Manag. 2023, 70, 4299–4309. [Google Scholar] [CrossRef]
  25. Liu, J.; Zheng, Y.; Hu, X.; Yu, S. Assessing Renewable Energy Efficiency to Identify Improvement Strategies: A Network Data Envelopment Analysis Approach. Energy Sustain. Dev. 2023, 76, 101308. [Google Scholar] [CrossRef]
  26. Li, W.; Ji, Z.; Dong, F. Global Renewable Energy Power Generation Efficiency Evaluation and Influencing Factors Analysis. Sustain. Prod. Consum. 2022, 33, 438–453. [Google Scholar] [CrossRef]
  27. Woldegiyorgis, T.A.; Benti, N.E.; Habtemicheal, B.A.; Jembrie, A.A. Unleashing the Power of Artificial Neural Networks: Accurate Estimation of Monthly Averaged Daily Wind Power at Adama Wind Farm I, Ethiopia. Environ. Res. Commun. 2024, 6, 75010. [Google Scholar] [CrossRef]
  28. Zhou, M.; Wang, B.; Guo, S.; Watada, J. Multi-Objective Prediction Intervals for Wind Power Forecast Based on Deep Neural Networks. Inf. Sci. 2021, 550, 207–220. [Google Scholar] [CrossRef]
  29. Kim, J.; Shin, H.-J.; Lee, K.; Hong, J. Enhancement of ANN-Based Wind Power Forecasting by Modification of Surface Roughness Parameterization over Complex Terrain. J. Environ. Manag. 2024, 362, 121246. [Google Scholar] [CrossRef]
  30. Wang, S.; Li, B.; Li, G.; Yao, B.; Wu, J. Short-Term Wind Power Prediction Based on Multidimensional Data Cleaning and Feature Reconfiguration. Appl. Energy 2021, 292, 116851. [Google Scholar] [CrossRef]
  31. Aasim; Singh, S.N.; Mohapatra, A. Repeated Wavelet Transform Based ARIMA Model for Very Short-Term Wind Speed Forecasting. Renew. Energy 2019, 136, 758–768. [Google Scholar] [CrossRef]
  32. Chitsazan, M.A.; Sami Fadali, M.; Trzynadlowski, A.M. Wind Speed and Wind Direction Forecasting Using Echo State Network with Nonlinear Functions. Renew. Energy 2019, 131, 879–889. [Google Scholar] [CrossRef]
  33. Joseph, L.P.; Deo, R.C.; Prasad, R.; Salcedo-Sanz, S.; Raj, N.; Soar, J. Near Real-Time Wind Speed Forecast Model with Bidirectional LSTM Networks. Renew. Energy 2023, 204, 39–58. [Google Scholar] [CrossRef]
  34. Hao, Y.; Dong, L.; Liao, X.; Liang, J.; Wang, L.; Wang, B. A Novel Clustering Algorithm Based on Mathematical Morphology for Wind Power Generation Prediction. Renew. Energy 2019, 136, 572–585. [Google Scholar] [CrossRef]
  35. Li, L.-L.; Zhao, X.; Tseng, M.-L.; Tan, R.R. Short-Term Wind Power Forecasting Based on Support Vector Machine with Improved Dragonfly Algorithm. J. Clean Prod. 2020, 242, 118447. [Google Scholar] [CrossRef]
  36. Some Models for Estimating Technical and Scale Inefficiencies in Data Envelopment Analysis|Management Science. Available online: https://pubsonline.informs.org/doi/epdf/10.1287/mnsc.30.9.1078 (accessed on 26 June 2025).
  37. Tone, K. A Slacks-Based Measure of Efficiency in Data Envelopment Analysis. Eur. J. Oper. Res. 2001, 130, 498–509. [Google Scholar] [CrossRef]
  38. Tone, K.; Tsutsui, M. An Epsilon-Based Measure of Efficiency in DEA—A Third Pole of Technical Efficiency. Eur. J. Oper. Res. 2010, 207, 1554–1563. [Google Scholar] [CrossRef]
  39. Färe, R.; Grosskopf, S. Intertemporal Production Frontiers: With Dynamic DEA. J. Oper. Res. Soc. 1997, 48, 656. [Google Scholar] [CrossRef]
  40. Kao, C.; Hwang, S.-N. Efficiency Decomposition in Two-Stage Data Envelopment Analysis: An Application to Non-Life Insurance Companies in Taiwan. Eur. J. Oper. Res. 2008, 185, 418–429. [Google Scholar] [CrossRef]
  41. Tone, K.; Tsutsui, M. Network DEA: A Slacks-Based Measure Approach. Eur. J. Oper. Res. 2009, 197, 243–252. [Google Scholar] [CrossRef]
  42. Shi, Z.; Wu, Y.; Chiu, Y.; Chang, T.-H. Research on the Influence of Technological Innovation and Technological Application: Evidence from China. J. Eng. Technol. Manag. 2022, 63, 101670. [Google Scholar] [CrossRef]
  43. Charnes, A.; Cooper, W.W.; Rhodes, E. Measuring the Efficiency of Decision Making Units. Eur. J. Oper. Res. 1978, 2, 429–444. [Google Scholar] [CrossRef]
  44. Hu, J.-L.; Wang, S.-C. Total-Factor Energy Efficiency of Regions in China. Energy Policy 2006, 34, 3206–3217. [Google Scholar] [CrossRef]
  45. Tobin, J. Estimation of Relationships for Limited Dependent Variables. Econometrica 1958, 26, 24–36. [Google Scholar] [CrossRef]
  46. Song, Y.; Yeung, G.; Zhu, D.; Xu, Y.; Zhang, L. Efficiency of Urban Land Use in China’s Resource-Based Cities, 2000–2018. Land Use Policy 2022, 115, 106009. [Google Scholar] [CrossRef]
  47. Dhaka, P.; Sreejeth, M.; Tripathi, M.M. A Survey of Artificial Intelligence Applications in Wind Energy Forecasting. Arch. Comput. Methods Eng. 2024, 31, 4853–4878. [Google Scholar] [CrossRef]
  48. Wang, Y.; Zou, R.; Liu, F.; Zhang, L.; Liu, Q. A Review of Wind Speed and Wind Power Forecasting with Deep Neural Networks. Appl. Energy 2021, 304, 117766. [Google Scholar] [CrossRef]
  49. De Giorgi, M.; Campilongo, S.; Ficarella, A.; Congedo, P. Comparison Between Wind Power Prediction Models Based on Wavelet Decomposition with Least-Squares Support Vector Machine (LS-SVM) and Artificial Neural Network (ANN). Energies 2014, 7, 5251–5272. [Google Scholar] [CrossRef]
  50. Ellahi, M.; Usman, M.R.; Arif, W.; Usman, H.F.; Khan, W.A.; Satrya, G.B.; Daniel, K.; Shabbir, N. Forecasting of Wind Speed and Power through FFNN and CFNN Using HPSOBA and MHPSO-BAACs Techniques. Electronics 2022, 11, 4193. [Google Scholar] [CrossRef]
  51. Zhang, W.; Wang, Y.; Wang, J.; Liang, J. Electricity Demand Forecasting Based on Feedforward Neural Network Training by a Novel Hybrid Evolutionary Algorithm. In Proceedings of the 2009 International Conference on Computer Engineering and Technology, Singapore, 22–24 January 2009; IEEE: Singapore, 2009; pp. 98–102. [Google Scholar]
  52. Latinopoulos, D.; Kechagia, K. A GIS-Based Multi-Criteria Evaluation for Wind Farm Site Selection. A Regional Scale Application in Greece. Renew. Energy 2015, 78, 550–560. [Google Scholar] [CrossRef]
  53. Duan, J.; Wang, P.; Ma, W.; Tian, X.; Fang, S.; Cheng, Y.; Chang, Y.; Liu, H. Short-Term Wind Power Forecasting Using the Hybrid Model of Improved Variational Mode Decomposition and Correntropy Long Short -Term Memory Neural Network. Energy 2021, 214, 118980. [Google Scholar] [CrossRef]
  54. Cakiroglu, C.; Demir, S.; Hakan Ozdemir, M.; Latif Aylak, B.; Sariisik, G.; Abualigah, L. Data-Driven Interpretable Ensemble Learning Methods for the Prediction of Wind Turbine Power Incorporating SHAP Analysis. Expert Syst. Appl. 2024, 237, 121464. [Google Scholar] [CrossRef]
  55. Xu, B.; Lin, B. Green Finance, Green Technology Innovation, and Wind Power Development in China: Evidence from Spatial Quantile Model. Energy Econ. 2024, 132, 107463. [Google Scholar] [CrossRef]
  56. Xu, X.; Niu, D.; Xiao, B.; Guo, X.; Zhang, L.; Wang, K. Policy Analysis for Grid Parity of Wind Power Generation in China. Energy Policy 2020, 138, 111225. [Google Scholar] [CrossRef]
  57. Jiang, Z.; Liu, Z. Policies and Exploitative and Exploratory Innovations of the Wind Power Industry in China: The Role of Technological Path Dependence. Technol. Forecast. Soc. Change 2022, 177, 121519. [Google Scholar] [CrossRef]
  58. Guo, K.; Ji, Q.; Zhang, D. A Dataset to Measure Global Climate Physical Risk. Data Brief 2024, 54, 110502. [Google Scholar] [CrossRef]
  59. IPC F03D.; Wind Motors. World Intellectual Property Organization (WIPO): Geneva, Switzerland, 2010.
Figure 1. The trends of electricity demand from 2013 to 2023 (Data from The Statistical Review of World Energy 2024 [1]).
Systems 13 00579 g001
Figure 2. Wind power installation capacity in 2023. (Data from The Global Wind Report 2024 [4]). (a) New installed wind power capacity in 2023; (b) Total installed wind power capacity in 2023.
Systems 13 00579 g002
Figure 3. Flowchart of FNN model operation.
Systems 13 00579 g003
Figure 4. Research framework and related variables based on a two-stage EBM model.
Systems 13 00579 g004
Figure 5. Data descriptive statistics of Stage 1 (value/year). (a) Average wind speed (m/s); (b) Population density (person/km2); (c) Unutilized land area (km2); (d) Wind power installed capacity (10 MW).
Systems 13 00579 g005
Figure 6. Data descriptive statistics of Stage 2 (value/year). (a) Operation and maintenance cost (104 yuan); (b) Wind power generation (105 MWh); (c) Energy substitution income (104 yuan).
Systems 13 00579 g006
Figure 7. Total comprehensive efficiency of the wind power system.
Systems 13 00579 g007
Figure 8. Average comprehensive efficiency of the wind power system from 2010 to 2022. (a) The Eastern region; (b) The Central region; (c) The Western region; (d) The Northeast region.
Systems 13 00579 g008
Figure 9. China’s staged comprehensive efficiency of the wind power system.
Systems 13 00579 g009
Figure 10. Staged comprehensive efficiency of wind power system (value/year). (a) The first stage of the Eastern region; (b) The second stage of the Eastern region; (c) The first stage of the Central region; (d) The second stage of the Central region; (e) The first stage of the Western region; (f) The second stage of the Western region; (g) The first stage of the Northeast region; (h) The second stage of the Northeast region.
Systems 13 00579 g010aSystems 13 00579 g010b
Figure 11. Sub-index efficiency of Stage 1 (value/year). (a) Average wind speed; (b) Population density; (c) Unutilized land area; (d) Wind power installed capacity.
Systems 13 00579 g011
Figure 12. Sub-index efficiency of Stage 2 (value/year). (a) Operation and maintenance cost; (b) Wind power generation; (c) Energy substitution income.
Systems 13 00579 g012
Figure 13. Heat map of sub-index efficiency clustering.
Systems 13 00579 g013
Figure 14. Forecasted comprehensive efficiency of the wind power system. (a) Predictions for 2023; (b) Predictions for 2024; (c) Predictions for 2025; (d) Predictions for 2026; (e) Predictions for 2027; (f) Predictions for 2028; (g) Predictions for 2029; (h) Predictions for 2030.
Systems 13 00579 g014aSystems 13 00579 g014b
Table 1. Meanings of input and output variables.
StageIndicator AttributeVariableMeaningUnitLiterature Support
Development stage (S1)InputAverage wind speedThe main indicators for evaluating wind energy resourcesm/sLatinopoulos and Kechagia (2015) [52]; Hua et al. (2024) [19]
Population densityPopulation/land areaperson/km2Hua et al. (2024) [19]
Unutilized land areaThe area of grassland and bare land suitable for a wind power systemkm2Hua et al. (2024) [19]
OutputWind power installed capacityThe main indicators for evaluating the construction achievements and power generation capacity of the wind power system10 MWDong and Shi (2019) [7]
Operation stage (S2)InputOperation and maintenance costThe annual cost for the operation and maintenance of the wind power system104 yuanDong and Shi (2019) [7]
OutputWind power generationThe annual electricity generated by the regional wind power system105 MWhDong and Shi (2019) [7]
Energy substitution incomeThe cost of carbon emissions is saved by wind power generation, replacing coal-fired power generation to produce clean electricity104 yuanDong and Shi (2019) [7]
Table 2. Tobit regression results.
VariableSubsystemUnit (of Measure)Coefficientzp > |z|
LTDResource subsystem/−0.0008681 **−2.360.018
ERDResource subsystem/0.0009972 ***3.120.002
EDDResource subsystem/0.0012309 **2.410.016
TechnologyTechnology subsystempieces0.0973076 ***7.050.000
HRTechnology-economy subsystem104 persons−0.1738902 ***−3.960.000
ElectricityEconomy subsystem108 kWh0.3447305 ***8.820.000
Note: *** represents a significance level of 1%, while ** represents a significance level of 5%.
Table 3. KMO and Bartlett’s test.
KMO Value 0.602
Bartlett’s Test of SphericityApproximate
chi-square
1452.807
df36
p value0.000
Table 4. The fitting results of 31 provinces and municipalities in China.
ProvinceR2MSEValue2012201520182021Trend
Anhui0.97360.0189pre0.0570.0930.1350.335Systems 13 00579 i001
true0.060.1040.1890.377Systems 13 00579 i002
Beijing0.97550.0057pre0.0440.0540.0850.129Systems 13 00579 i003
true0.0440.0540.0850.129Systems 13 00579 i004
Fujian0.99580.0117pre0.2920.4010.5510.694Systems 13 00579 i005
true0.1190.2010.2690.532Systems 13 00579 i006
Gansu0.94990.0336pre0.10.160.2280.451Systems 13 00579 i007
true0.250.4010.5510.694Systems 13 00579 i008
Guangdong0.99520.0105pre0.1170.1610.2050.471Systems 13 00579 i009
true0.1140.1610.2040.438Systems 13 00579 i010
Guangxi0.92470.0718pre0.0230.0250.0940.749Systems 13 00579 i011
true0.0480.0710.2390.679Systems 13 00579 i012
Guizhou0.97100.0292pre0.0980.2560.3510.442Systems 13 00579 i013
true0.0980.2560.3480.544Systems 13 00579 i014
Hainan0.90320.0107pre0.0950.0920.1180.173Systems 13 00579 i015
true0.0950.1290.1180.172Systems 13 00579 i016
Hebei0.99890.0073pre0.2620.520.5110.823Systems 13 00579 i017
true0.2590.520.5110.823Systems 13 00579 i018
Henan0.96010.0489pre0.0580.080.1990.69Systems 13 00579 i019
true0.0540.0690.1980.691Systems 13 00579 i020
Heilongjiang0.99290.0178pre0.2910.4950.6270.822Systems 13 00579 i021
true0.3550.4950.6270.822Systems 13 00579 i022
Hubei0.98530.0201pre0.0440.10.2420.495Systems 13 00579 i023
true0.0430.1140.2420.496Systems 13 00579 i024
Hunan0.95430.0375pre0.0460.1330.2380.52Systems 13 00579 i025
true0.0460.1330.2380.52Systems 13 00579 i026
Jilin0.97350.0294pre0.2780.3680.4840.678Systems 13 00579 i027
true0.2780.3680.4840.656Systems 13 00579 i028
Jiangsu0.99830.0107pre0.120.1970.4050.814Systems 13 00579 i029
true0.120.1970.3710.814Systems 13 00579 i030
Jiangxi0.95370.0342pre0.0750.0810.1880.404Systems 13 00579 i031
true0.0530.0850.2130.46Systems 13 00579 i032
Liaoning0.98150.0259pre0.2830.4140.5130.73Systems 13 00579 i033
true0.2830.4080.5660.744Systems 13 00579 i034
Inner
Mongolia
0.92780.061pre0.4820.7310.7140.936Systems 13 00579 i035
true0.3640.5450.7140.936Systems 13 00579 i036
Ningxia0.98720.0317pre0.2720.4730.7191Systems 13 00579 i037
true0.2720.4740.7170.997Systems 13 00579 i038
Qinghai0.93410.0442pre0.1680.1040.2620.509Systems 13 00579 i039
true0.080.1040.2620.509Systems 13 00579 i040
Shandong0.99270.0175pre0.2160.3150.4230.727Systems 13 00579 i041
true0.2160.3210.4230.727Systems 13 00579 i042
Shanxi0.94460.0636pre0.1680.330.5480.728Systems 13 00579 i043
true0.1680.330.5480.902Systems 13 00579 i044
Shaanxi0.96740.0306pre0.080.1380.3620.535Systems 13 00579 i045
true0.0820.1460.2530.536Systems 13 00579 i046
Shanghai0.95650.0337pre0.0930.1090.3710.502Systems 13 00579 i047
true0.0920.1760.3710.502Systems 13 00579 i048
Sichuan0.98560.0155pre0.0360.0580.2430.362Systems 13 00579 i049
true0.0380.0580.1940.362Systems 13 00579 i050
Tianjin0.99330.0049pre0.0540.0850.0910.18Systems 13 00579 i051
true0.0550.090.0890.176Systems 13 00579 i052
Xizang0.99820.0024pre0.0360.0050.0610.036Systems 13 00579 i053
true0.0360.0050.0610.036Systems 13 00579 i054
Xinjiang0.93780.0600pre0.160.3710.7320.782Systems 13 00579 i055
true0.160.3710.5680.782Systems 13 00579 i056
Yunnan0.95750.0519pre0.2260.420.6360.764Systems 13 00579 i057
true0.1670.4110.640.772Systems 13 00579 i058
Zhejiang0.99620.0052pre0.0550.0780.1340.224Systems 13 00579 i059
true0.0550.0780.1340.224Systems 13 00579 i060
Chongqing0.98070.0089pre0.0450.0460.0810.179Systems 13 00579 i061
true0.0410.0430.090.177Systems 13 00579 i062
Disclaimer/Publisher’s Note: The statements, opinions and data contained in all publications are solely those of the individual author(s) and contributor(s) and not of MDPI and/or the editor(s). MDPI and/or the editor(s) disclaim responsibility for any injury to people or property resulting from any ideas, methods, instructions or products referred to in the content.

