1. Introduction
In the European Union, Dangerous Goods Transport (DGT) represented approximately 4% of all freight transport in 2019 and 2020. In Italy, this proportion was notably higher, reaching 6.7% in 2019 and 6.9% in 2020 [
1]. Road transport remains the predominant modality, accounting for 60% of total goods transport in Italy. Alarmingly, over 70% of DG transit occurs by road, often through densely populated areas such as bypasses, junctions, and freeways [
2]. This scenario creates significant risks, as the transported goods frequently have toxic or flammable characteristics. Heavy traffic conditions exacerbate these risks, increasing the frequency of potentially hazardous situations and exposing a substantial number of people to danger. For instance, the Bologna accident, in which two trucks carrying flammable materials collided, caused 70 injuries and one fatality, underscoring the critical need for improved safety protocols [
3]. To address these challenges, the primary objective is to establish a more effective and integrated safety system. Such a system prioritizes the well-being of employees, citizens, and the environment while ensuring the safe transportation of hazardous and polluting materials. By leveraging advancements in risk assessment methodologies and technologies, this study seeks to mitigate risks and prevent accidents, ensuring a safer and more resilient road transport network.
In this framework, assessing risk depends on three main areas of concern: identification, analysis, and evaluation not only in technological plants and facilities, according to well-known methodological approaches [
4], road transportation requires a combination of methods and tools to address its unique complexities. Emerging approaches, such as the use of AI and machine learning, support the development of holistic strategies that integrate safety and resilience [
5]. In this article, a deterministic approach is employed to standardize and automate risk assessments in well-known, low-variability contexts where substantial observed data is available. This approach provides a reliable foundation for risk quantification and enables the systematization of processes. Complementing this, a holistic approach is used to manage complexity, anticipate unforeseen events, and develop prevention and resilience strategies [
6]. Together, these methodologies form the basis of a decision support system designed to enhance safety in road transport. The proposed system uses observed data to assess reliable consequences based on accident frequency, either as documented in existing literature [
7] or calculated using empirical observations [
8]. In this geopolitical framework, the variables in risk assessment are increasing, due to the increasing complexity in transport conditions, it is challenging for people to quickly find an efficient assessment method that can fit the actual needs and outcomes, outside the classical risk assessment methods [
9,
10,
11]. In the transportation sector, the presence of Dangerous Goods (DG) poses significant risks that impact on the environment, as well as the safety of individuals and property [
12]. These risks, ranging from chronic elements such as emissions to LPHC (low probability high consequence) events like accidents, require in-depth risk analysis for effective transport planning and management [
13]. This involves considering various transport characteristics, including its modalities of transport, substances or material take into account, container specifications, road conditions, and traffic and meteorological factors in the geographical regions concerned [
14]. In addition to this complexity, there are also driver-related variables such as age, physical condition, and experience, as well as operational dynamics during transport [
15,
16]. Given the dynamic nature of this variable risk factor, the adoption of strategic measures becomes pivotal, route selection appears to be an essential approach to reducing probability of accidents, opting for routes through less populated areas to minimize potential impact [
17,
18]. Vehicle design aimed at minimizing spillage in the event of accidents serves as a preventive measure [
19]. In addition, prioritizing improved driver training, by cultivating a deeper understanding of risks, appears essential to reducing the probability of accidents [
20].
The complex nature of DGT necessitates scalable and sophisticated models capable of comprehensive analysis and predicting the potential risks associated with the entire supply chain. Researchers in the field have explored various methodologies and approaches to improve the understanding of the risk scenario, some of which include the application of Quantitative Risk Analysis (QRA) methodology, which requires the development of a large amount of data to estimate the frequency and consequences of the risk in question [
14]. An additional study aims to use Association Rule Mining (ARM) to identify risk factors contributing to accidents involving HAZMAT (HAZardous MATerials) vehicles on highways [
21]. These efforts support the development of robust risk assessment frameworks, providing valuable information to decision-makers, regulators, and stakeholders involved in the safe DGT [
22].
The paper highlights the centrality of reliable and available knowledge and explores the Data Flow (DF) required to represent the safety assessment of a specific segment of a road network studied and monitored in the Italian project area over 3 years. It aims to provide a systematic approach to delineating the relationship between observed data—both static and dynamic—and the technologies, encodings, and processes used. The observed data represents crucial information that increases the resilience of the case study safety transport system, as part of the industrial organization and surrounding territory in the management of technological risk of DGT, and the knowledge represented by observed data permits anticipating the accident weak signal of the road system using a GIS-data model.
Its purpose is to consolidate this knowledge into a tool that assists decision-makers in their governance decisions. This tool is designed to prevent accidents and mitigate their impact on people, property, and environmental objectives. It plays a crucial role in emergency response and land-use planning, all unified by a common objective to present and share data to minimize DGT risks and support safety initiatives in this field.
The document is structured as follows: in
Section 2, the paper delves into existing research and literature that provide contextual and general information on the models existing for risk assessment related to the transport of DG. Moving on to
Section 3, the document describes in detail the methodology, the specific geographical area of the Italian project where the DGT is being surveyed and monitored for three years; then, it explains the information sources used in this study, detailing the static and dynamic data relevant to assessing the risks associated with DGT, describing the relationships between observed data, technology, coding, and processes. Furthermore,
Section 4 outlines the results and conceptual framework used for monitoring DGT, detailing the technological infrastructure used to consolidate and share this information, focusing on the development of a Web-GIS tool. Next,
Section 5 highlights and discusses the strengthening and weak points of the paper in order to improve this research in the next future. Finally,
Section 6 synthesizes the conclusions and engages in full discourse, assessing the implications of the observed data for DGT optimization system of systems.
2. Literature Review
2.1. Risk Assessment Models for Dangerous Goods Transportation
In a study by [
23], the authors conducted a statistical analysis of Hazardous Materials Accidents (HMAs) in China from 2013 to 2018, focusing on characteristics and consequences. The analysis reveals variable temporal volatility, spatial distribution, and accident outcomes. Factors influencing HMA trends, such as government safety rectification efforts, public holidays, five-day workweek systems, and daily traffic peaks, are discussed at annual, monthly, weekly, and hourly levels. Spatial distribution patterns indicate mainly short haul DG road transport, with 82.76% of accidents occurring on normal road sections. Leakage accidents account for 79.35% of all HMAs during transport. The study recommends countermeasures to improve the safety of DG of road transport. The findings highlight the need for more effective preventive methods, increased safety measures during high-risk periods, targeted treatments for regions with a high frequency of HMAs, and government preparedness for HMA-related emergencies with serious consequences. In addition, the study highlights the significant impact of HMAs on China’s international image and business traffic and recommends proactive measures to prevent and control these incidents.
In the paper developed by [
24], both prescriptive and risk-based methodologies are critically examined for assessing the safety of road tunnels, employing qualitative, semi-quantitative, and quantitative approaches. Using representative traffic and accident data from Greek motorways in alignment with European Directive 2004/54/EC, the study compares the resulting risk outcomes from these methods. Conclusions highlight the need for additional safety measures, especially in addressing fire hazards. The semi-quantitative risk matrix aligns with the more detailed quantitative QRAM (Quantitative Risk Assessment Model) approach, indicating the necessity for further analysis. The study underscores the limitations of QRAM, emphasizing the need for specialized software and hazard investigations. In addition, the importance of addressing uncertainties in influencing parameters is emphasized, with a focus on modifying driver’s behavior to reduce risks. Furthermore, the authors advocate for periodic reviews of risk acceptance criteria and suggest an integrated risk-cost–benefit optimization framework to guide safety measures based on socio-economic considerations.
In another study proposed by [
25], the authors present a model 24 for Risk Analysis in The Dangerous Goods Rail Transport System (RDNGTS), emphasizing a human- and organization-oriented approach to risk analysis. The model evaluates factors such as unsafe material conditions, unsafe human actions, individual factors, safety culture, safety management system and external factors, analyzing their mutual channels of influence and establishing relevance through four steps. A case study of a dangerous goods rail transport accident in China in 2001 illustrates that dynamic, non-linear interactions between these factors contribute to the overall increase in risk in the RDNGTS. According to the paper, controlling dangerous human actions and physical conditions at the personal level alone is insufficient; senior managers should cultivate a safety culture and establish a comprehensive safety system, middle managers should improve emergency training, and rank-and-file managers should focus on supervising front-line employees. A comparison with the Functional Resonance Analysis Method (FRAM) highlights differences, noting that Model 24 considers internal causes affecting safety management and culture more holistically. While FRAM is effective for rapid risk reduction, Model 24 is deemed more applicable for the complete elimination of accidents. The document stresses the need for a comprehensive approach, considering system structure and normal operating processes, to effectively improve safety management and culture.
2.2. Technological and Analytical Approaches for Enhancing DGT Safety
In [
26], a new model for real-time risk assessment in DG road transport by integrating a Gated Recurrent Until-Deep Neural Network (GRU-DNN) with Multimodal Feature Embedding (MFE) has been presented. The MFE is seamlessly integrated into the deep learning framework, enabling the uniform integration of discrete variables, continuous variables, and images. The exploitation of a pre-trained GRU sub-model improves classification and recognition results, overcoming limitations resulting from insufficient sample size. The model is trained and validated on a DG road transport database comprising 2100 samples, considering 20 real-time contributing factors and four risk levels in China. In addition, performance measures including accuracy (ACC), precision (PR), recall (RE), F1 score (F1), and areas under receiver operating characteristic (AUC) curves are compared with other established models. To enhance robustness against noise and error in small sample sizes, the study introduces the Carlini and Wagner attack and three defenses: adversarial training, dimensionality reduction, and prediction similarity. The results show an average ACC of 93.51% on the training set and 87.6% on the validation set, with the model excelling in predicting injury accidents, followed by fatal accidents. The model’s real-time risk assessment performance, with an ER of 89.0%, surpassed that of other commonly used models. In particular, the integration of prediction similarity proves effective in detecting adversarial attacks with a high success rate. Future research directions include considering additional variables, exploring continuous model updates during deployment based on differences in predicted and actual data, and developing more robust prediction models for scenarios with limited DG road transport data.
In a work by [
27], the authors propose a systematic, semi-quantitative decision-support framework for managing risks associated with the road transport of Hazardous Materials (HazMat). Integrating Quality Function Deployment (QFD), Fuzzy Analytic Hierarchy Process (F-AHP), Fuzzy Failure Mode and Effects Analysis (F-FMEA), and non-linear goal programming, the framework addresses risk identification, assessment, and control. The framework is built around QFD, F-AHP, a hierarchical risk assessment system, and F-FMEA, which assesses the potential risks of control measures. The introduction of fuzzy set theory addresses the vagueness and uncertainty inherent in the risk management process. Illustrated by an empirical case on the DGT, the proposed methodology proves effective and feasible, offering managerial implications for risk management in the road DGT based on the results obtained.
The paper presented by [
28] addresses the challenge of route optimization for vehicles transporting DG, focusing on minimizing the probability of serious road accidents. The study, based on research carried out in the Mazowiecki province in east-central Poland, uses theoretical distributions derived from data measured on specific sections of the road network to determine accident probabilities. The fit of the empirical distribution to the theoretical distributions was performed using the STATISTICA program from Stat-Soft PL (version 13.3). DG transport routes were determined using ant and genetic algorithms, and their effectiveness in minimizing accident probabilities was compared with Dijkstra’s algorithm. Their results offer valuable insights into the applicability of these heuristic algorithms for solving complex DG transportation problems.
This study [
29] proposes a comprehensive approach combining fault tree analysis and fuzzy D-S evidential reasoning for the analysis and control of past accidents, to effectively manage the Railway Dangerous Goods Transportation System (RDNGTS). It provides a six-step methodology to meet the challenges of uncertainty modeling and information fusion in RDNGTS accident analysis. The approach involves identifying and weighting accident causes through fault tree analysis, establishing a fuzzy belief structure model, processing qualitative and quantitative data, fusing pre-processed data using the Fuzzy D-S evidential reasoning algorithm, assigning confidence levels, and ranking the final fuzzy belief structure of which each component is based on trapezoidal and triangular fuzzy numbers. To illustrate the approach, a historical accident involving the transport of lithium batteries by rail occurred in China in 2016. The results highlight the professional skills and attitudes of transport personnel as the weakest element, underlining the need for increased attention from RDNGTS managers in China. Recommendations include measures to improve safety awareness, training, and assessment of transport personnel’s professional skills to combat negligent working attitudes. The study highlights the effectiveness of D-S probabilistic reasoning in providing a unified modeling framework for uncertain, incomplete, inaccurate, and even ignorant information, offering an effective solution to the limitations of probabilistic reasoning processes.
The model proposed by [
30] evaluates various risk factors, including route length, total population surrounding the route, and accident probability. What sets this study apart is its use of GIS technology to optimize the problem, enabling simultaneous consideration of risk in several dimensions. Through empirical data and a case study in California, the authors demonstrate the effectiveness of their multi-objective approach in presenting decision-makers with a portfolio of solutions that excel in each factor assessed. This work provides valuable insights into the complex task of minimizing the risks associated with the DGT, offering a practical and innovative solution that considers multiple facets of the problem.
3. Methodology
3.1. Study Area
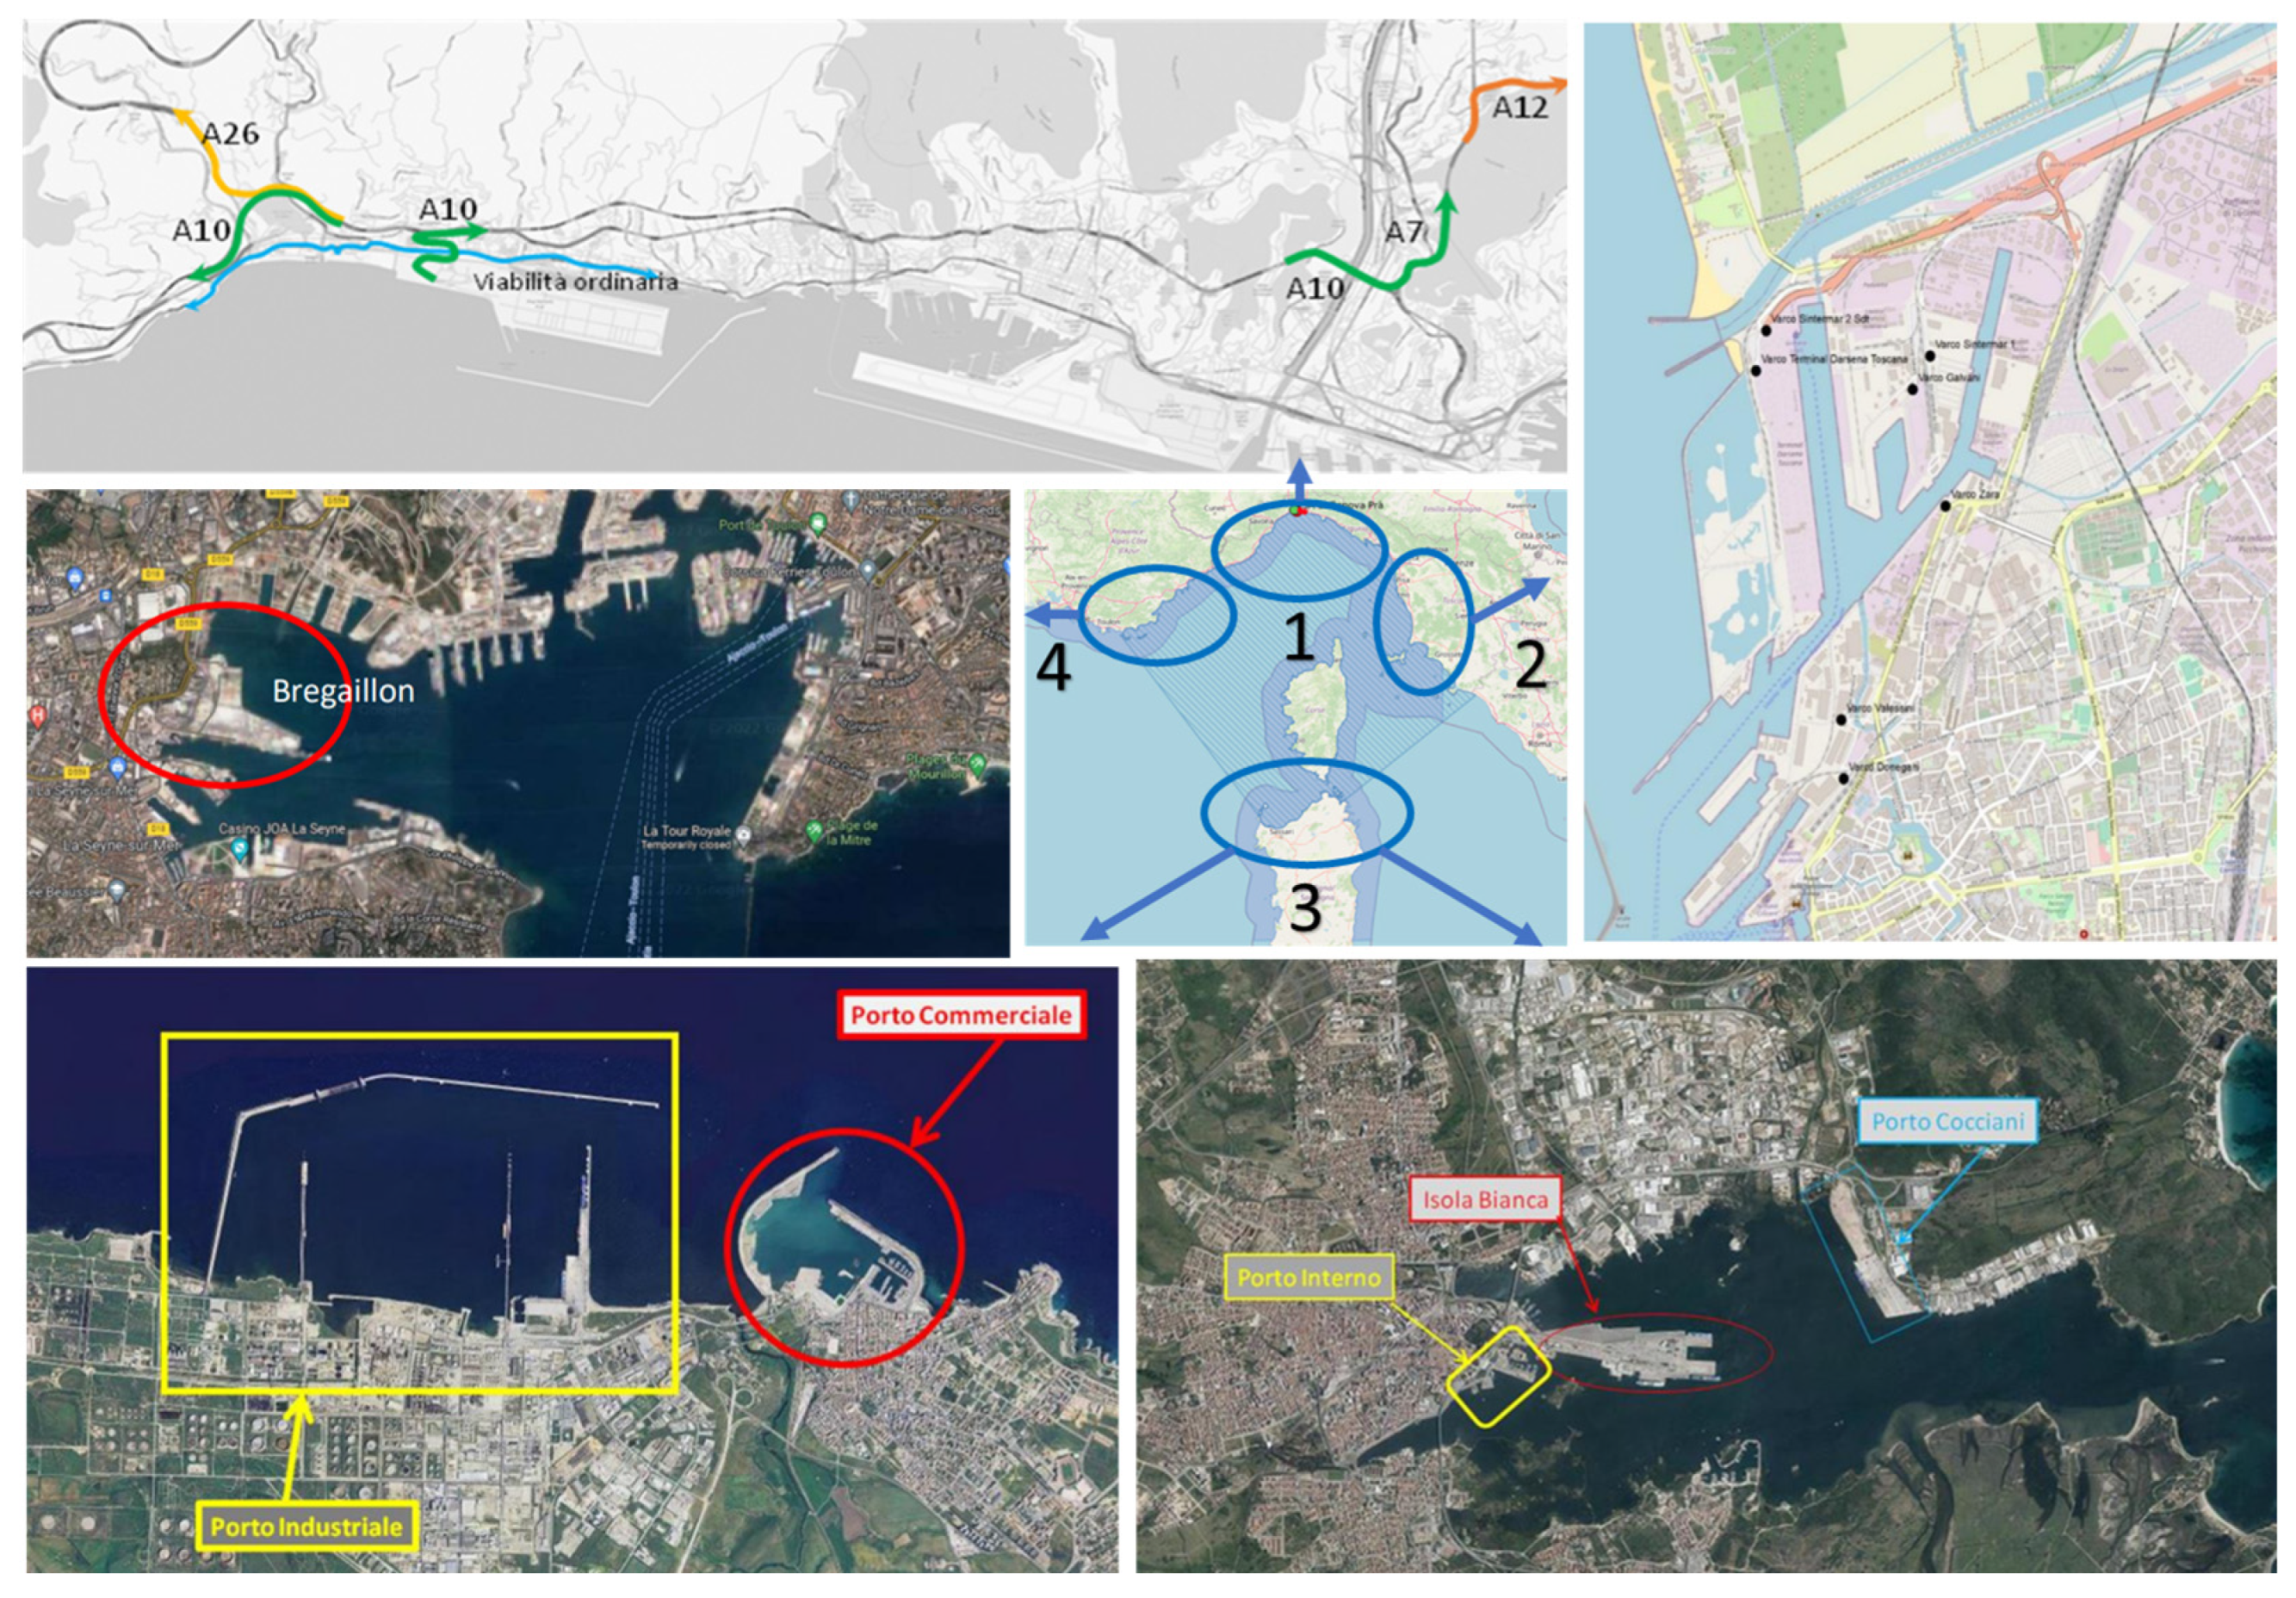
The risk assessment in this document begins with the identification of the area of interest enclosed by the ICT system implemented. The geographical scope extends over the Mediterranean Sea, involving two European member states—Italy and France—in four European regions—Liguria, Sardinia, Tuscany, and Var. This framework encompasses the critical road infrastructure linking Mediterranean ports to roads and highways designated for the DGT, illustrated in
Figure 1. More specifically, local zone 1 located in the municipality of Genoa, encompassing its urban roads where several cameras and tele-lasers have been strategically deployed to observe the flow of DG traffic in real-time. Similarly, in Tuscany (local zone 2), eighteen cameras are used to detect, control, and monitor the flow of DG in the Livorno area, providing access to the islands of Capraia and Elba. In addition, four urban and extra-urban areas (double local zone 3) adjacent to the port areas of Porto Torres and Olbia are under surveillance in the Sassari district. Finally, cameras regulate access to the port monitor DG traffic passing through the gates of the ports of Toulon and Brégaillon (Local Zone 4). Each local area (from n.1 to n.4) is equipped with a functional monitoring system to detect the flow of DG, and this information can be integrated with other data as specified in
Table 1. At the Mediterranean Sea level, territorial policies are implemented. The large-scale system serves as a collective safety mechanism, observing data and flows to assess and monitor risk precursors, thus improving the safety of the road network analyzed within this macro-area. Due to geopolitical considerations and data security measures on French territory, the architecture does not have any data sets.
3.2. Data Source
This research integrated various data sets, including territorial data (e.g., infrastructure, population, and environment), flow data, specifically related to the DGT, historical accident records, and meteorological data (
Table 1). These data form the basis of risk assessment knowledge, which is crucial to safety prevention. They represent not only elements exposed to risk but also factors or elements that can amplify or mitigate the risk in the event of a road accident. In some cases, these variables change dynamically in time and space, acting as safety factors. Understanding the position, characteristics, and chemical, thermodynamic, and physical behavior of data, not only statically but also dynamically, enables researchers to understand and manage risk based on data observed in a study area meticulously assessed in space and time.
The implementation of Big Data Analytics (BDA) in this study aligns with a taxonomy designed for data-driven industries, as described by [
31]. This taxonomy emphasizes structured planning and the consideration of predefined criteria to effectively exploit big data. The methods and challenges associated with big data analysis, as presented by [
32], classify analytical problems and techniques into predictive and prescriptive approaches. In this research, the decision support system integrates these approaches, focusing on predictive analysis to anticipate risks and prescriptive analysis to provide actionable recommendations for decision-makers.
Table 2 covers not only predictive but also prescriptive analysis for each class of data type. Research relies on past data to shed light on potential future outcomes through forecasting. In the case of prescriptive analysis, the elaboration stems from potential future outcomes, offering usable and reliable recommendations or information to help decision-makers. The depth and accuracy of research interest are directly proportional to the extent of data collection. In this context, prescriptive analytics is seen as a measure of data analytics maturity [
33], contributing to optimized decision-making in advance, not only to improve business performance, as [
34] point out, but also to accurately assess road-related public and personal safety in surrounding areas.
This research has involved various types of data owners and users directly associated with the data acquisition, storage, and collection processes, as shown in
Table 1 and
Table 2. Data security monitoring and cybersecurity measures are an integral part of this DF management. The effectiveness of a decision support system, as it exists, and its long-term sustainability depends on the agreement between the parties involved, its usefulness, its user-friendly interface, the quality of the data and images displayed, and the exportability of the data produced in terms of aggregation, reliability of communication aspects and content, and provision of essential support tools for legal and management system compliance.
3.3. Model Description
In this context, this study aims to enhance the safety and efficiency of the transport of these goods in the targeted region. Its main objectives are to monitor freight flows to identify critical points, optimize emergency services thanks to a shared model, and provide training targeted for transport players [
35]. To respond effectively to the risks associated with DGT, the study uses ICT to systematically collect material-specific data. It interprets and evaluates these results using GIS, meteorological, and DGT data for risk modeling, as shown in
Figure 2. Finally, these efforts lead to the creation of risk scenario maps, facilitating the identification of vulnerable points and contributing to the overall improvement of DGT safety in the research area. This innovative risk model explores various facets, including the identification of potential hazards, accident prediction and prevention, and the evaluation of risk management strategy effectiveness.
The proposed methodology combines real-time data acquisition, advanced risk modeling, and actionable information to enable stakeholders to manage the risks associated with DGT.
Using ICT tools such as cameras and lasers installed in Genoa Municipality, in Italy, the study collects critical data points, including traffic flows, DG classifications, and infrastructure details (schools, hospitals, roads). These tools comply with ministerial standards, ensuring accuracy and reliability.
The collected data undergoes rigorous observation, interpretation, and evaluation to derive meaningful insights for subsequent modeling. Collected data undergo multiple validation steps:
- ▪
Cross-referencing with historical datasets and GIS layers to ensure consistency;
- ▪
Calibration protocols and cybersecurity measures (e.g., VPN access) ensure robust data handling.
The risk modeling phase integrates GIS data on infrastructure, population, and environment, meteorological data (temperature, humidity, wind speed, and direction), DGT data covering classes, quantities, physical and chemical properties, and transportation mode data (e.g., trucks, pipelines). This phase identifies critical zones (e.g., urban areas, environmental sensitivities) and visualizes potential accident scenarios.
This stage involves assessing risk characteristics such as location, intensity, frequency, and probability. The model generates risk scenario maps, identifying vulnerable points such as schools and hospitals. Risk scenario maps, supported by the Short-Cut method, provide stakeholders with the following:
- ▪
Impact zones based on meteorological conditions (D5, F2);
- ▪
Simulation outputs for varying risk probabilities (e.g., flash fires, toxic clouds).
This study represents a holistic approach to mitigating risks associated with DGT. By combining real-time data collection, advanced risk modeling, and strategic training initiatives, it aims to enhance safety, optimize emergency responses, and contribute to the overall security of DGT in the study area.
3.4. Estimating Dangerous Goods Risks with the Short-Cut Method
The shortcut method is a rapid approach to estimating the impact of incidents involving the release of DG and materials. It is applicable to various types of containers, including confined containers and transport by ship, tanker, or tank train. This method excludes certain modes of transport, such as pipelines, from its scope, as defined by legislative decree 334/99.
To assess potential consequences, the shortcut method classifies flammable and toxic substances according to their significant hazardous characteristics. For each risk category, it identifies accident scenarios with high and medium probabilities of occurrence. Accidents involving DG are classified according to their thermodynamic, chemical, and physical phenomena, such as pool fires, flash fires, vapor cloud explosions (VCE), or toxic clouds.
This method provides damaged distance estimates in tabular form, taking into account factors such as DG classes, product quantities, lethality thresholds, and meteorological conditions, classified according to Pasquill’s classification (D5 and F2). These distances represent the radius of a circular impact zone, approximating the area potentially affected by an accidental event.
This simplified but systematic approach enables rapid assessment of the potential consequences of incidents involving DG, making it a valuable tool for emergency response and risk management planning. For a more detailed description of the methodology, including specific applications and case studies, readers are encouraged to consult our previous publication on the Short-Cut method [
36].
3.5. Territorial Web-GIS and System Development: Design and Implementation for the Safety Assessment System
This system enables the detection and recognition of data derived from sensors and equipment, encompassing not only geographical positioning in terrestrial and port areas but also time information to pinpoint specific time windows for management. Additionally, it captures data about the type of DGT, including tankers, containers, or packages, as well as different stages, whether by road or by ship. Furthermore, it incorporates data inputs essential for assessing risk characteristics such as location, quantity, intensity, frequency, and probability (
Figure 3).
These diverse sets of information are collected through GIS, with digital dividers and radio relays serving as crucial components for data communication and sharing. This facilitates the feeding of a static and expeditious model capable of generating risk scenario maps. These maps identify vulnerable points such as schools and hospitals, drawing from dynamic data that also represent elements exposed to risk. This near-real-time safety assessment provides a multitude of potential scenarios captured at various points along a monitored road network, contingent upon the types and quantities of DG involved.
A comprehensive single-integrated traffic flow detection system was carefully planned and executed, incorporating license plate readings for vehicles crossing the designated territory. On-site procurement included the installation of a hardware and software infrastructure, which is now fully operational. This system efficiently detects the transit of vehicles carrying DG and classifies them by type. Following activation of the necessary licenses for all central Decision Support System devices, arrangements for ongoing maintenance and software/hardware support were drawn up and implemented.
Furthermore, IMDG Code and ADR data reporting protocols have been defined and regularly updated, in parallel with the provision of the application and system services required for the use of ADR-IMDG data collected at new sites. ICT components deployed in the field, including assigned IP addresses, standard model references, standard numbers, and user access IDs, have been carefully documented in a comprehensive manual procedure. This document serves as a standardized reference shared between the Italian and French partners.
The equipment installed complies with uniform specifications, employing identical sensors and technological configurations, all with the requisite certifications. Ministerial approval for laser devices and certification for license plate readers have been obtained to guarantee compliance with data standards and regulations governing roadside surveillance.
To manage traffic data, both on land and at sea, two separate entities are involved. On land, local law enforcement authorities at the municipal and district levels manage a real-time traffic system. Using Big Data (BD) analysis techniques, data is systematically aggregated and refined as input for subsequent processes at the territorial level. Conversely, maritime traffic is monitored thanks to the implementation of the Automatic Identification System (AIS) on board each vessel, governed by agreements with the coastguard to regulate data collection. Although not explicitly addressed in this case study, local AIS prototypes facilitate data exchange for regional traffic management purposes.
Activation licenses for the equipment supplied were properly initiated to ensure seamless integration with the standard VAAM (Vehicle and Asset Management) application system. In addition, comprehensive technical and system configuration activities were meticulously carried out, ensuring seamless operation of the installations in the designated area. The central VAAM application platform gives users, especially those with administrator privileges, access to reporting and statistical functions, as well as to the automated notification procedures essential to safety assessment protocols.
The functional diagram illustrates the system architecture and data exchange (
Figure 4). It shows the connections between the various components, including the database, GIS network, AIS (Automatic Identification System) for maritime traffic, ICT (Information and Communication Technologies), and IoT (Internet of Things) tools. These elements are linked together to facilitate the exchange of information, particularly concerning DG transport flows and maritime traffic. The database serves as a central platform, linked to the cartographic interface, which in turn connects to the GIS network for spatial data analysis. Similarly, the AIS for DG transport flows connect to the AIS network for traffic monitoring. In addition, ICT and IoT tools are integrated into the system to provide real-time data collection and analysis capabilities, enhancing overall system functionality and efficiency.
4. Results
Monitoring the transport of DG in the project area was carried out using a series of ICT tools (cameras and lasers) installed at strategic points throughout the project area (
Figure 5).
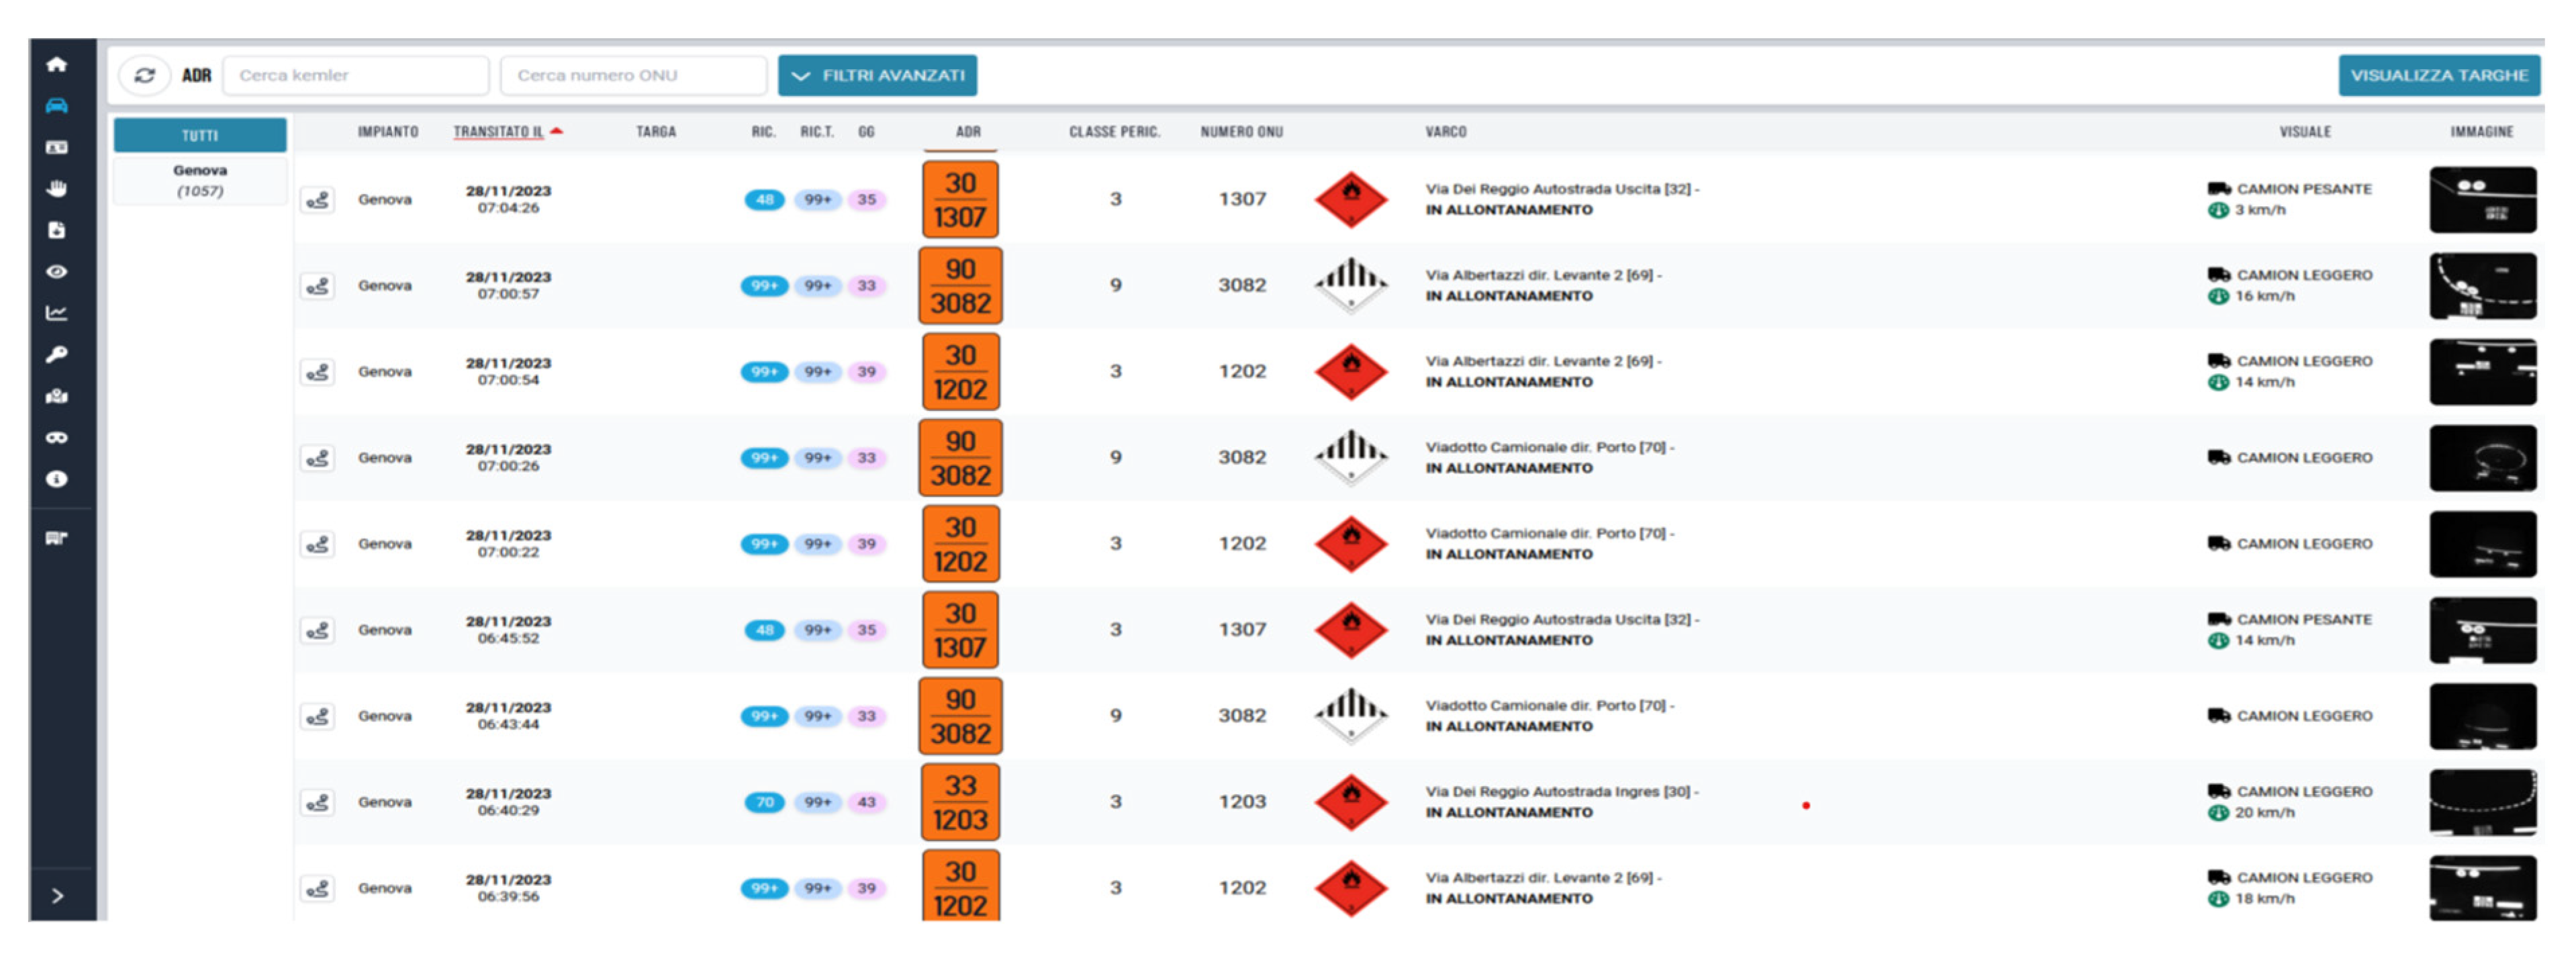
The cameras installed capture data such as the ID of the surveillance point, the ID of the event monitored, the date and time of the passage detected, the description of the vehicle, the Kemler code identified, the UN number, and the official transport designation of the vehicle carrying the DG. This data is instantly accessible in the central platform of the VAAM application, feeding the functionalities of the reporting and statistics applications, as well as the processes generating automatic notifications.
All the data collected is transmitted via a server to databases for processing within the specially developed platform. The Intelligent System provides specific data on DGT by trucks, covering all the road sections monitored, as shown in
Figure 6.
In addition, the platform offers users the option of downloading the information or associated statistics in a variety of formats. It can generate maps, statistics, and graphs useful for a risk-based decision support system for public authorities in the area.
Figure 7 shows an example of the data provided by the system concerning the flow of DG, including various information and statistics such as:
- ▪
the list of materials detected, and the breakdown of DG by ADR class and their UN code.
- ▪
statistics on the distribution of transits by time slot for the different classes.
- ▪
statistics on the distribution of transit for the different sections according to the class of materials.
- ▪
statistics on the distribution of DG entering or leaving the port according to their class.
- ▪
It can also provide statistics on the breakdown of tonnages of these DG entering or leaving the port by hazard class.
The platform developed offers a variety of data on the flow of DG throughout the project area.
It allows real-time tracking of vehicles carrying DG (
Figure 8A) and can generate detailed maps for major provincial DG road networks, highlighting areas of potential impact in the case of accidental events (
Figure 8B). In addition, the platform can create maps to visualize potential accident scenarios involving DG for all traffic routes (
Figure 8C).
These features enable decision-makers to interpret the output of the platform effectively:
- ▪
Real-time tracking (
Figure 8A): This functionality enables continuous monitoring of DGT, providing essential information for identifying high-risk transit routes and enabling rapid response to potential incidents.
- ▪
Provincial road networks and areas of potential impact (
Figure 8B): Detailed maps highlight vulnerable areas, helping stakeholders to prioritize safety measures for densely populated or environmentally sensitive regions.
- ▪
Accident scenario visualization (
Figure 8C): Simulated scenarios provide actionable information for emergency preparedness, enabling decision-makers to allocate resources effectively and develop comprehensive emergency plans.
This enables an in-depth analysis of the risks associated with the DGT in the project area. The output of the analysis is available directly in a customized part of the platform and can also be exported as files in a different format. The files can be used directly or are ready to be used for future new elaboration in aggregated format and structured information, starting from query that can re-arrange data according to different objectives, sets, time periods or time windows, dangerous classes top levels, type of vehicles, areas, or sub-areas across land or from port to land.
The data analysis and its content can be shared not only between the data owners, but also with Police forces, National Fire Brigade, Civil Protection operators, and others Institutional subject involved in the territorial governance, and emergency management or territorial and traffic flow planning. The system and its platform can produce data customized by the users, according to the user finalities, scope and level of details in a time and space framework that can be cross-examined by the users in every circumstance, from different kind of technological interface, by different kind of personnel profile: smart phones, tablet, personal computers, fixed pc installation are permitted, and operative used in this monitoring process. All these devices have in common a safe and stable signal, a protected Internet network (also with VPN access), and an active cyber security system.
Analysis of the data collected for the total number of transits of a specific class of DG within the survey area reveals, for example, a total of 18,759 containers up to October 2023, comprising 9559 containers of DG destined for export and 9200 containers of DG imported into the survey area of the city of Genoa (
Table 3).
Furthermore, class 3 flammable liquids and class 9 represent, respectively, the most exported substances, at 51% and 16%. As for the most imported substances, class 9 is in first place with 43%, followed by class 8 (for corrosive substances) with 21% (
Figure 9). These types of data provide important information on the scenarios and potential risks that could occur in the region in the event of an incident and can be useful for the preparation of action and response plans in the event of an accident involving DG.
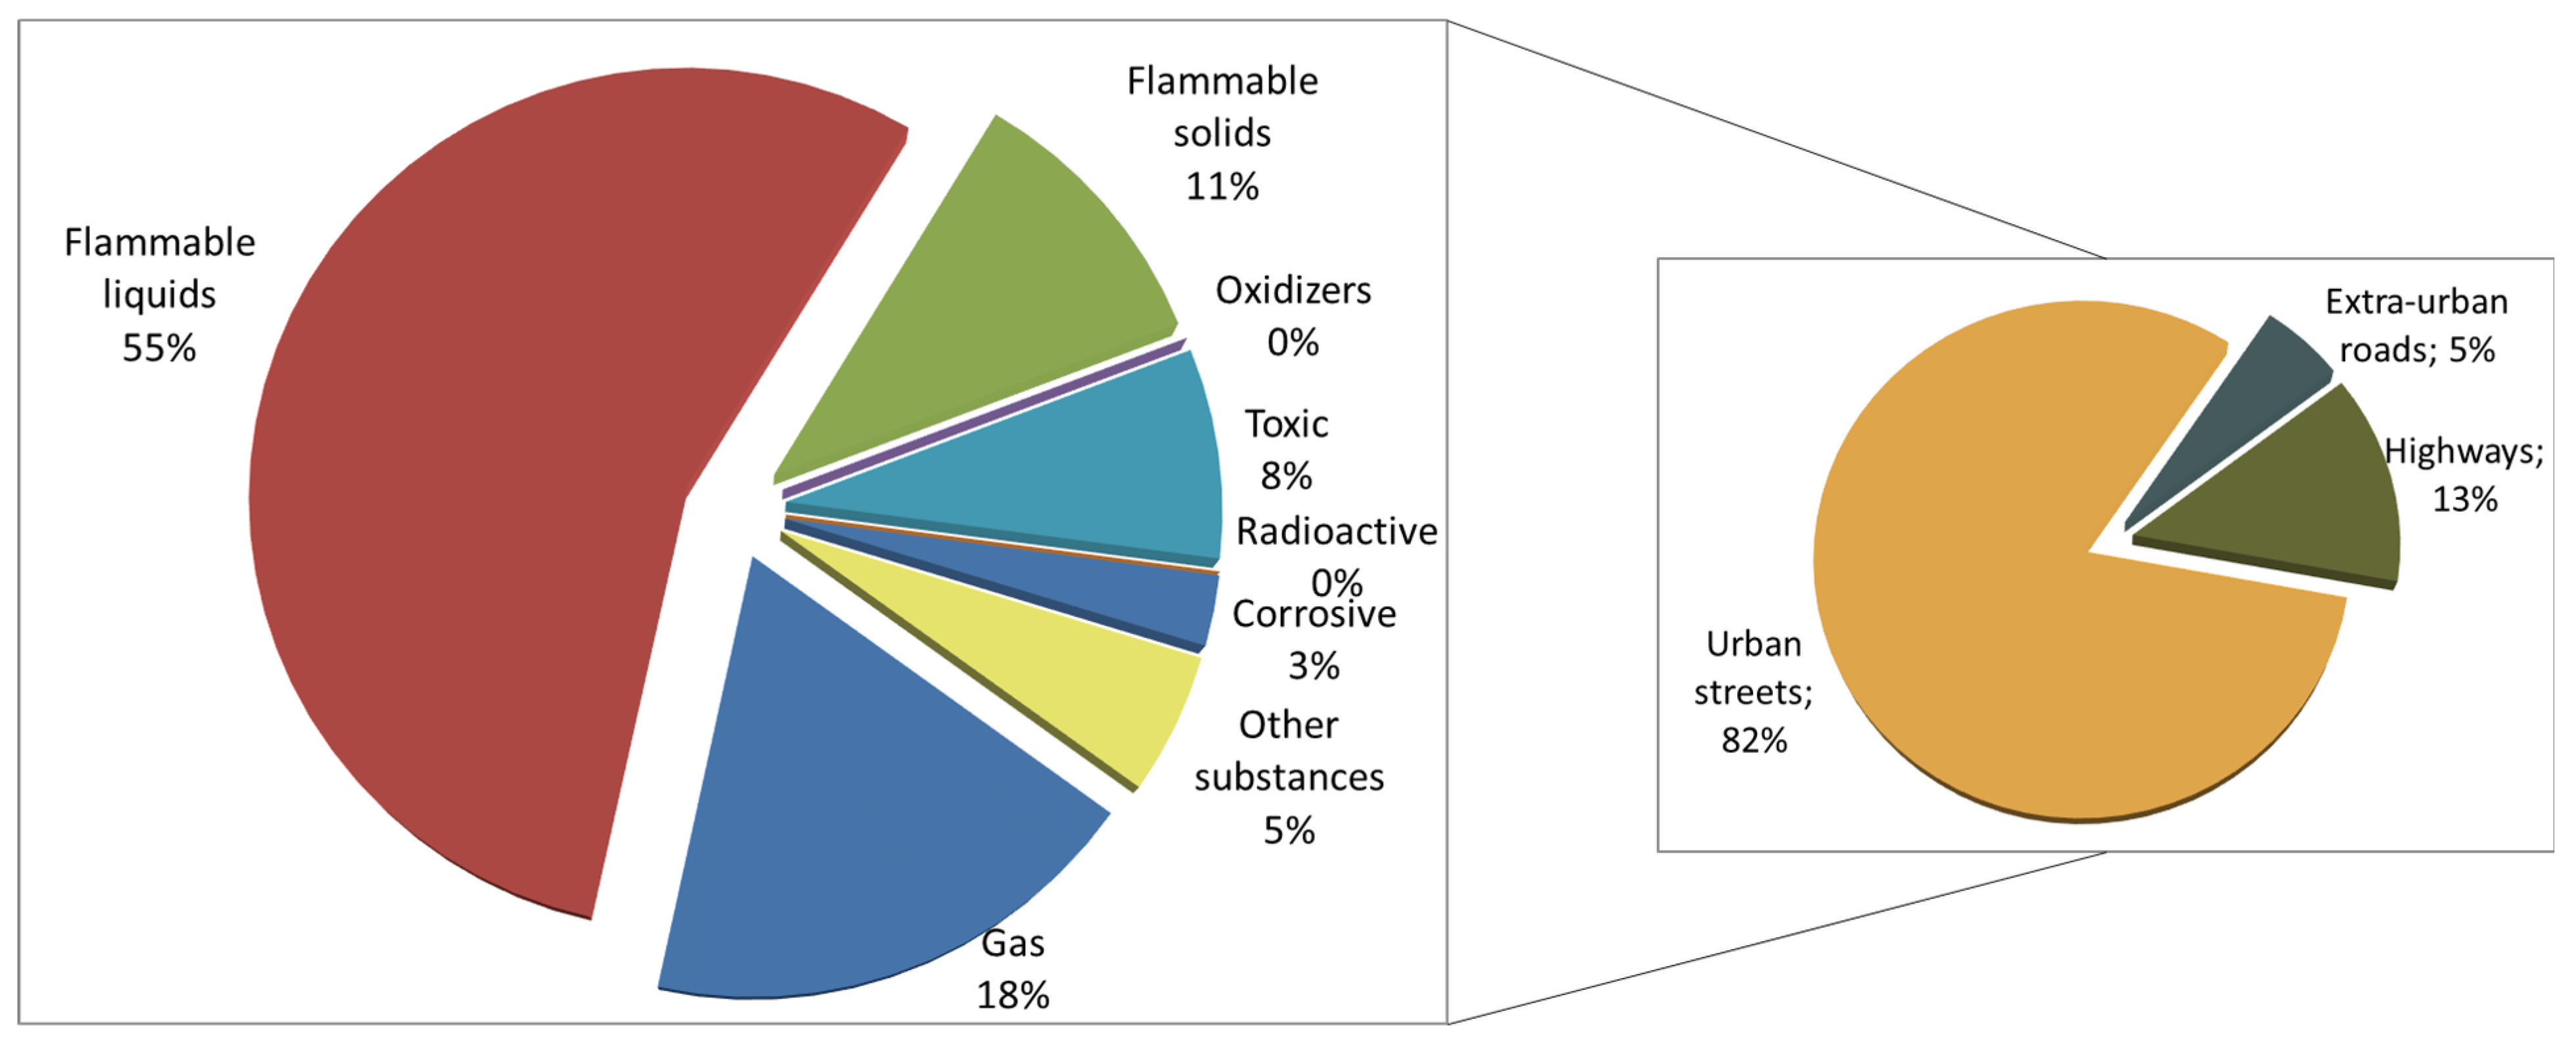
In the same context, according to the corresponding authorities, between 2021 and 2023 firefighters carried out around 236 road haulage-related incidents in the Municipality of Genoa, 40% of which were road accidents and 29% fires and explosions, with 71% occurring in urban areas (
Figure 10). More specifically, 16% of the incidents involved DG (82% in urban areas), 55% of which involved class 3 for flammable liquids, 18% class 2 gases, and 11% flammable solids (
Figure 11).
The platform features a module strategically designed to analyses the various consequences of potential accident scenarios involving the DGT along the routes monitored.
This innovative module aims to provide users with an intelligent tool capable of rapidly calculating and assessing the extent of impacted areas, defined by significant risks of lethality and irreversible human injury in the event of an accident.
This tool is based on the methodology known as “Short-Cut”, implemented by the Environmental Protection Agency of the region of Tuscany (Italy) [
37]. This sophisticated approach makes it possible to estimate the damaged distances resulting from accidents involving the release of DG.
To understand the consequences, the Short-Cut method classifies toxic and flammable substances according to their significant risk characteristics, identifying the accident scenarios with the highest and average probabilities for each risk category, such as fire, Vapor Cloud Explosion (VCE), or toxic cloud [
36].
In addition, this innovative module offers users simplified access to informative data and layers, providing information on population density or other potentially exposed and vulnerable reception points in the area, such as hospitals, schools, and public gathering places [
37].
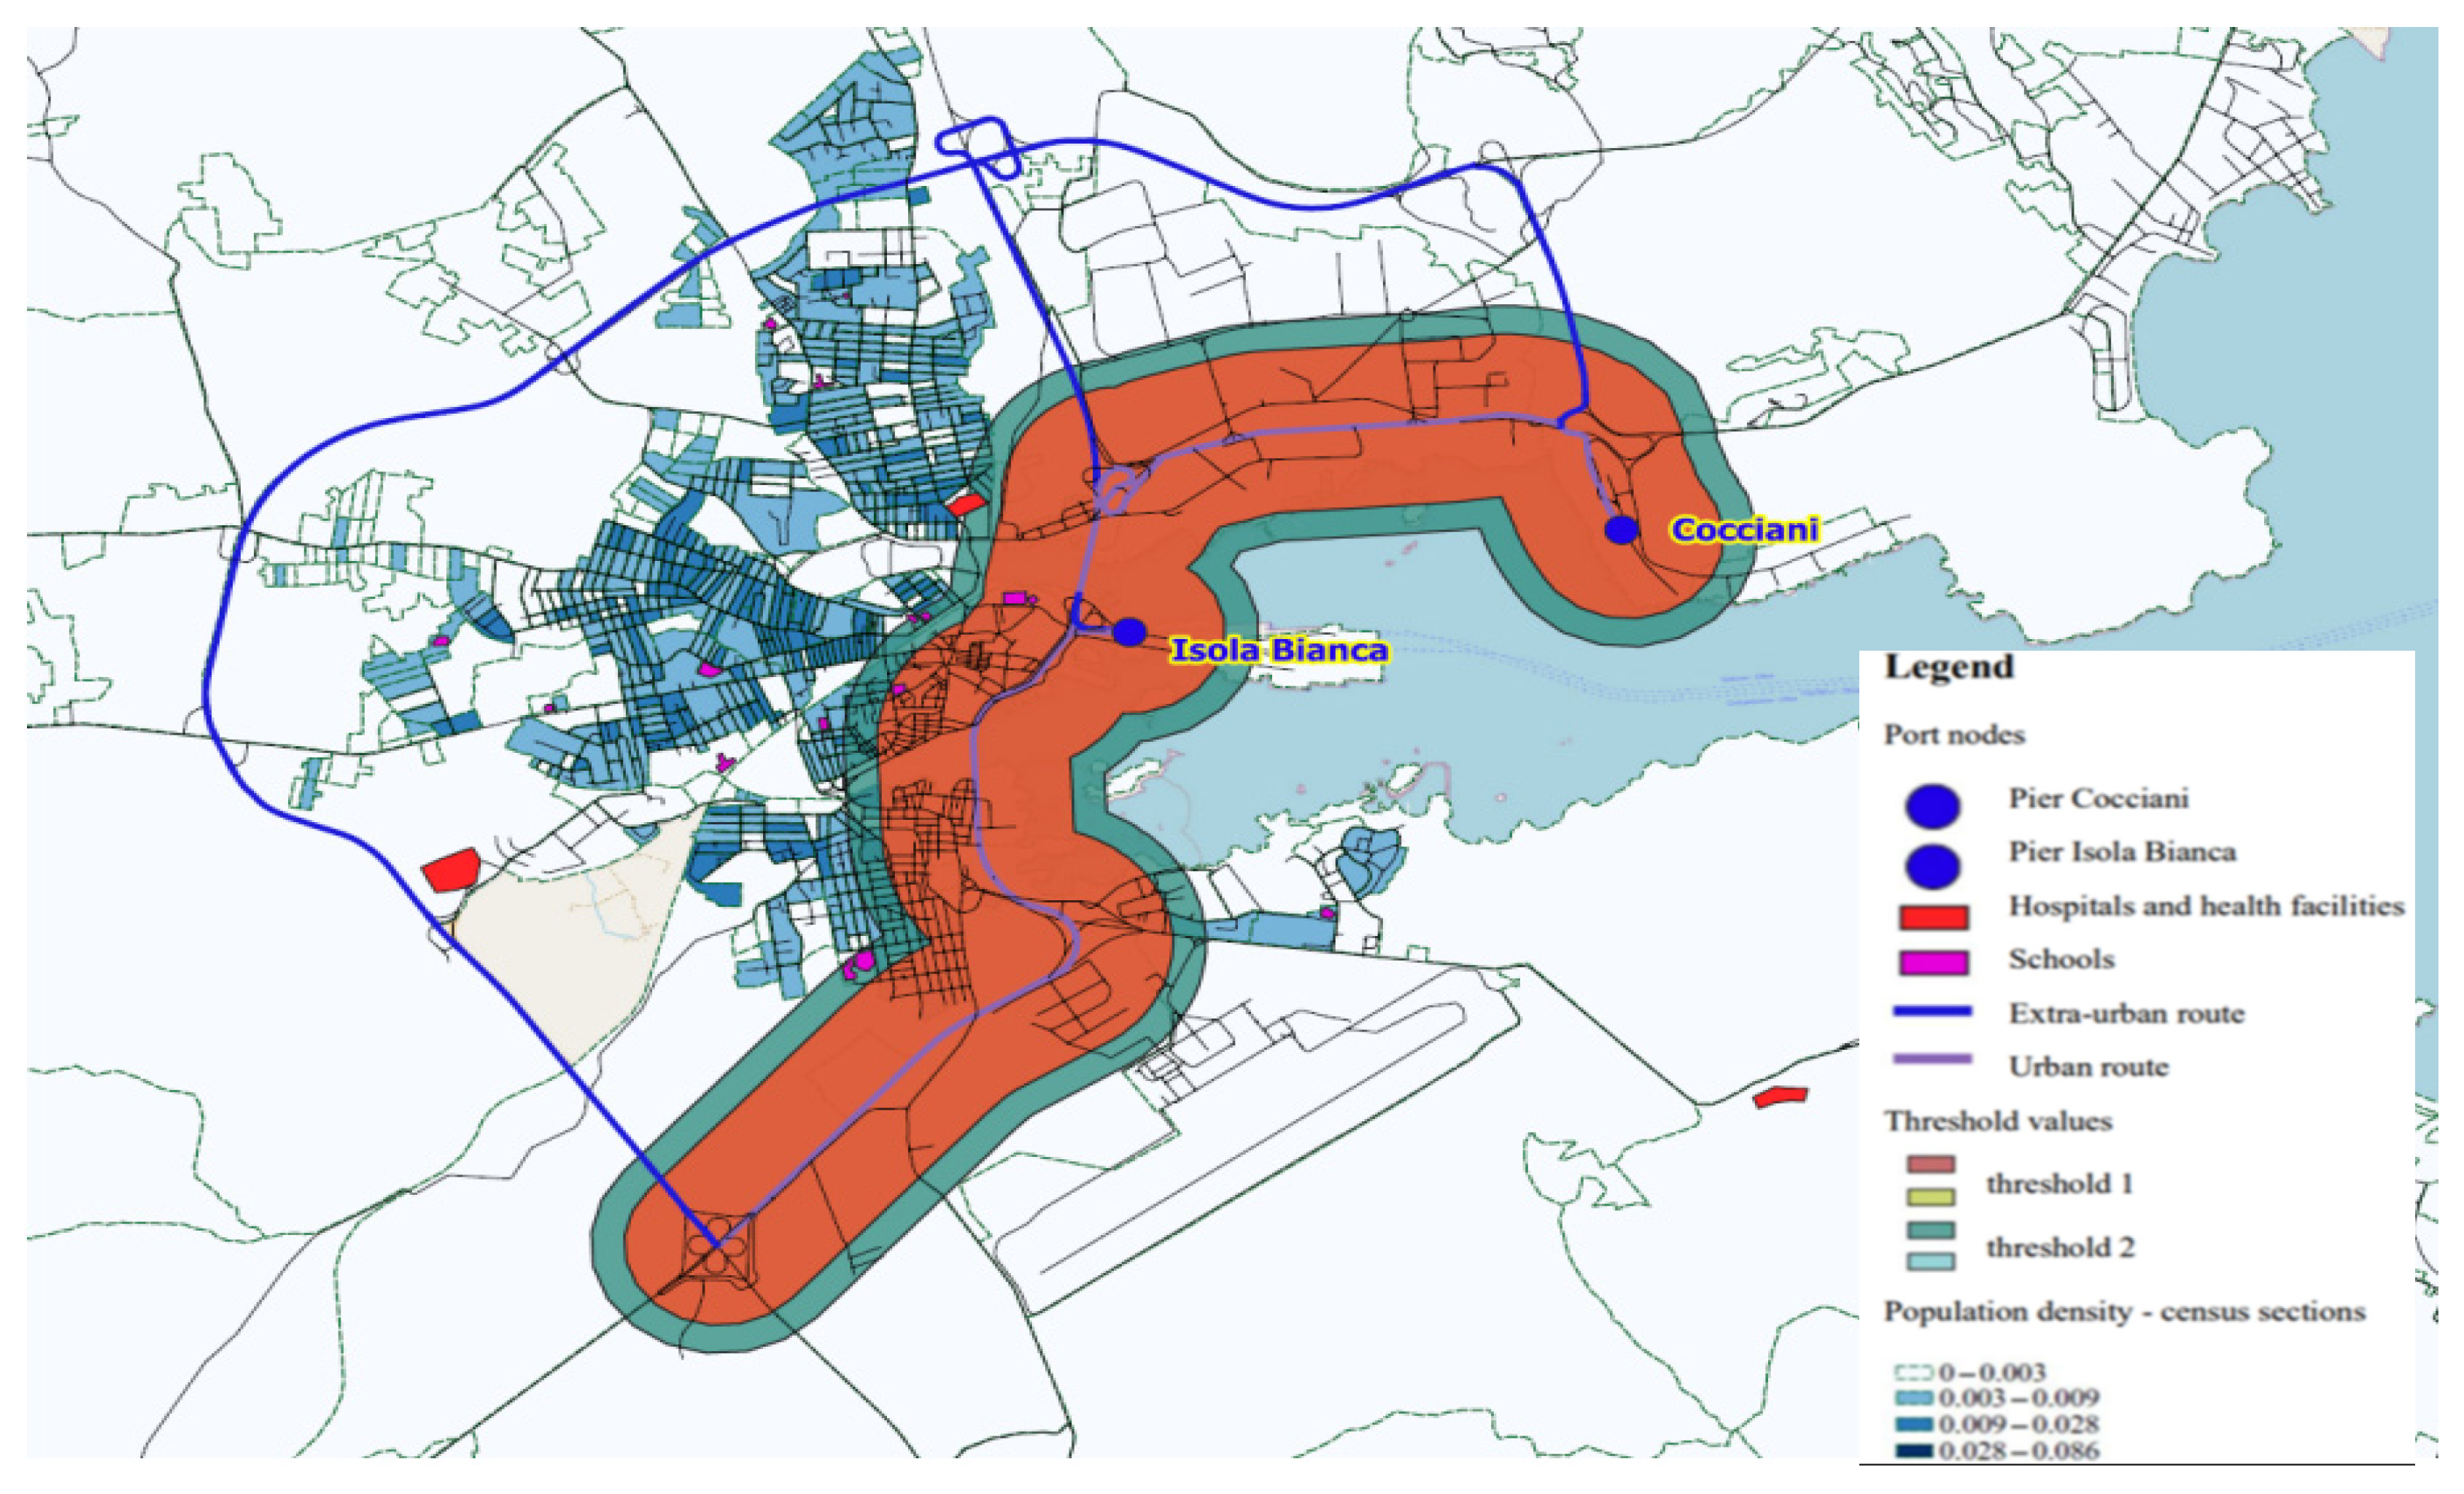
Figure 12 provides an overview of a simulation illustrating an accident scenario involving hydrochloric acid, depicting the impact zone as a moving circle along the road. The simulation represents two critical zones:
- ▪
Red zone (fatal impact): This central zone indicates areas with a high probability of death in the event of an accident. In this zone, decision-makers must prioritize evacuation and emergency measures.
- ▪
Green zone (irreversible injury): Surrounding the red zone, this zone identifies areas where injuries may occur, but where the risk of death is lower. Emergency resources, such as medical aid and temporary shelters, should be directed here.
This visual representation highlights the critical areas to be considered during an accident, offering a clear perspective on the potential safety implications. By integrating these maps with additional layers of data, such as population density and critical infrastructure, decision-makers can assess the number of potential victims and optimize resource allocation to minimize risk and improve emergency response strategies.
5. Discussion and Future Work
The deterministic methodology used in this article represents a strategic advance on the conventional probabilistic approach to risk assessment in the DGT. By initiating the risk assessment process with the quantification of damage and consequences resulting from potential accidents, based on observed hazards, the study offers a comprehensive and proactive perspective on risk management. The inclusion of real-time or near-real-time quantitative data, such as the type of DG being transported, transport conditions, and traffic data, enhances the accuracy and immediacy of the risk assessment.
The qualitative data generated by this methodology provides valuable recommendations for various stakeholders, including public authorities, firefighters, police, and civil protection personnel operating in designated local areas (zones 1 to 4). The observed data, accumulated over three years of systematic monitoring, not only facilitates the implementation of quantitative data such as risk indices but also contributes to a qualified understanding of risk levels in carefully assessed areas, roads, and port networks.
The emphasis on deterministic risk analysis methodology in this research sets it apart in the field, presenting results that encompass both qualitative and quantitative dimensions. This two-faceted approach enriches safety assessment and risk management efforts, enabling the identification and prioritization of hazards, causes/consequences, critical activities, accident initiators, and vulnerable locations.
In addition to traditional risk assessment parameters, this study extends its impact assessment to include human and environmental elements. They serve as both input data and results of the risk assessment. In the field of safety assessment, the particular focus on human impact is delineated not only by injury statistics but also by the definition of areas of impact, potential damage, and heightened attention to risk. This comprehensive approach positions the study as a pioneering effort in the integration of various elements into the risk assessment framework, contributing significantly to the advancement of safety protocols in the DGT.
Based on current results, future research will focus on integrating adaptive mechanisms into the risk model for continuous updates based on real-time data and evolving technologies. Extending the model to include additional variables, such as environmental impacts, traffic density, and weather variability, will improve its predictive and analytical capabilities. Moreover, testing the methodology in various geographical contexts, notably on cross-border transport routes, will provide valuable insights into its scalability and adaptability.
Additionally, advanced risk tools utilizing AI and machine learning will be developed to refine predictions and enhance decision-making. The practical application of the system will be enhanced by collaborative efforts to design specialized training modules for emergency responders, public authorities, and policymakers. Finally, to contribute to the development of a comprehensive risk management framework for the DGT, the system’s ongoing impact on reducing incidents and improving emergency response will be assessed through continued studies.
6. Conclusions
This paper serves as an exemplary model of a decision support system designed to collect big data over an extended period. Taking advantage of ICT tools strategically positioned in specific geographical areas, the system provides a dynamic, reliable, and accountable representation of the territorial factors influencing the DGT’s road safety assessments. The system is designed as an alternative and innovative tool, complementing traditional institutional tools for collecting data on local traffic flows.
To enhance safety measures and dynamically assess risk factors on the road network, particularly concerning the transport of DG, various static and dynamic data sets have been observed and collected. This helps assess data aggregation and advance knowledge to mitigate factors contributing to incidents and accidents. The strategic placement of technological devices, combined with organizational improvements in data evaluation using analytical techniques, has facilitated the training of public authorities, police officers, firefighters, and territorial institutional subjects.
In this context, secure data collection has achieved several important objectives at both local and European levels. Primarily, it facilitates the planning of safe DG traffic flows through common device architectures and coordinated data protocols and communication platforms. Secondly, it provides the basis for the development of emergency plans to ensure safe operations and rescue procedures for people and the environment on a transnational scale. Finally, it contributes to improving rules and procedures for greater awareness in the field of road safety and public health, by promoting knowledge sharing and cultural awareness on an inter-regional scale.
However, despite its innovative features, the system has certain limitations. The reliance on predefined criteria for the “Short-Cut” methodology can oversimplify complex accident scenarios. In addition, the model assumes uniformity of data quality and coverage, which may not take account of regional variations or data gaps. Furthermore, the deterministic approach used in this study, while advantageous in its proactive nature, may not fully capture the probabilistic uncertainties inherent in DGT risks.
Future research will focus on the continuous improvement of the system’s temporal and geographical dimensions in order to optimize its scalability and adaptability. Efforts will be made to extend the system to other regions, including cross-border transportation networks. The integration of advanced risk metrics through AI and machine learning will refine forecasting and decision-making. Collaborative development of stakeholder training programs and comparative studies to assess the sustainable impact of the system will also be promoted.
Although this prototype system, developed in collaboration with the university and institutional partners, has demonstrated its effectiveness, continuous improvement in the temporal and space dimensions is crucial. This ongoing development is aimed at enhancing the resilience of critical infrastructures, particularly in Liguria, where tunnels, roads, and highways require reconfiguration. Making decisions to improve driving safety, traffic planning and the organization of the logistics sector for the transport of DG involves strategic, operational, and real-time considerations.
Author Contributions
Conceptualization, A.M.T., A.S., E.Z. and R.S.; methodology, A.M.T., A.S., E.Z. and R.S.; software, A.M.T., A.S., E.Z. and R.S.; validation, A.M.T., A.S., E.Z. and R.S.; formal analysis, A.M.T., A.S., E.Z. and R.S.; investigation, A.M.T., A.S., E.Z. and R.S.; resources, A.M.T., A.S., E.Z. and R.S.; data curation, A.M.T., A.S., E.Z. and R.S.; writing—original draft preparation, A.M.T., A.S., E.Z. and R.S.; writing—review and editing, A.M.T., A.S., E.Z. and R.S.; visualization, A.M.T., A.S., E.Z. and R.S.; supervision, A.M.T., A.S., E.Z. and R.S.; project administration, A.M.T., A.S., E.Z. and R.S.; funding acquisition, A.M.T., A.S., E.Z. and R.S. All authors have read and agreed to the published version of the manuscript.
Funding
This research has been founded by the European Union—NextGenerationEU and by the Ministry of University and Research (MUR), National Recovery and Resilience Plan (NRRP), Mission 4, Component 2, Investment 1.5, project “RAISE-Robotics and AI for Socio-economic Empowerment” (ECS00000035) and previously by Project N° 276 LOSE+, by Interreg Italy-France Maritime Program 2014–2020 that is a cross-border program co-financed by the European Regional Development Fund (ERDF) within the framework of European Territorial Cooperation (ETC).
Data Availability Statement
The original contributions presented in this study are included in the article. Further inquiries can be directed to the corresponding author.
Conflicts of Interest
The authors declare no conflicts of interest.
References
- Insic L’ADR e Il Trasporto di Merci Pericolose via Strada. Available online: https://www.aci.it/fileadmin/documenti/studi_e_ricerche/dati_statistiche/trasportomercisustrada.pdf (accessed on 1 July 2025).
- Conca, A.; Ridella, C.; Sapori, E. A Risk Assessment for Road Transportation of Dangerous Goods: A Routing Solution. Transp. Res. Procedia 2016, 14, 2890–2899. [Google Scholar] [CrossRef]
- La Gazetta Bologna, Esplode Un Tir, Inferno in Autostrada: Un Morto e 70 Feriti. 2018. Available online: https://www.gazzetta.it/Altri-Mondi/06-08-2018/bologna-esplode-tir-inferno-autostrada-2-morti-oltre-60-feriti-2801214763192.shtml (accessed on 1 July 2025).
- Ab Rahim, M.S.; Reniers, G.; Yang, M.; Bajpai, S. Risk Assessment Methods for Process Safety, Process Security and Resilience in the Chemical Process Industry: A Thorough Literature Review. J. Loss Prev. Process Ind. 2024, 88, 105274. [Google Scholar] [CrossRef]
- Vairo, T.; Pettinato, M.; Reverberi, A.P.; Milazzo, M.F.; Fabiano, B. An Approach towards the Implementation of a Reliable Resilience Model Based on Machine Learning. Process Saf. Environ. Prot. 2023, 172, 632–641. [Google Scholar] [CrossRef]
- Masoud, S.; Kim, S.; Son, Y.-J. Mitigating the Risk of Hazardous Materials Transportation: A Hierarchical Approach. Comput. Ind. Eng. 2020, 148, 106735. [Google Scholar] [CrossRef]
- Huang, X.; Wen, Y.; Zhang, F.; Han, H.; Huang, Y.; Sui, Z. A Review on Risk Assessment Methods for Maritime Transport. Ocean Eng. 2023, 279, 114577. [Google Scholar] [CrossRef]
- Tomasoni, A.M.; Filippone, F.; Sacile, R.; Soussi, A. Assessing Accident Rates and Frequency of Incidents Involving Dangerous Goods in the Genoa District at Sub-Regional Scale—A Data-Driven Approach. Chem. Eng. Trans. 2024, 111, 97–102. [Google Scholar] [CrossRef]
- Guo, J.; Luo, C. Risk Assessment of Hazardous Materials Transportation: A Review of Research Progress in the Last Thirty Years. J. Traffic Transp. Eng. 2022, 9, 571–590. [Google Scholar] [CrossRef]
- Kalogeraki, M.; Antoniou, F. Improving Risk Assessment for Transporting Dangerous Goods through European Road Tunnels: A Delphi Study. Systems 2021, 9, 80. [Google Scholar] [CrossRef]
- Liu, J.; Zhou, H.; Sun, H. A Three-Dimensional Risk Management Model of Port Logistics for Hazardous Goods. Marit. Policy Manag. 2019, 46, 715–734. [Google Scholar] [CrossRef]
- Holeczek, N. Hazardous Materials Truck Transportation Problems: A Classification and State of the Art Literature Review. Transp. Res. Part D Transp. Environ. 2019, 69, 305–328. [Google Scholar] [CrossRef]
- Torretta, V.; Rada, E.C.; Schiavon, M.; Viotti, P. Decision Support Systems for Assessing Risks Involved in Transporting Hazardous Materials: A Review. Saf. Sci. 2017, 92, 1–9. [Google Scholar] [CrossRef]
- Soussi, A.; Bouchta, D.; El Amarti, A.; Seghiouer, H.; Bersani, C.; Drinca, M.; Sacile, R.; Trotta, A.; Zero, E. Risk Analysis for Hazardous Material Transport by Road: Case Study on Tangier-Tetouan Region, Morocco. In Proceedings of the 2018 13th System of Systems Engineering Conference, SoSE 2018, Paris, France, 19–22 June 2018; pp. 464–470. [Google Scholar] [CrossRef]
- Xing, Y.; Chen, S.; Zhu, S.; Zhang, Y.; Lu, J. Exploring Risk Factors Contributing to the Severity of Hazardous Material Transportation Accidents in China. Int. J. Environ. Res. Public Health 2020, 17, 1344. [Google Scholar] [CrossRef] [PubMed]
- De Nadai, S.; D’Inca, M.; Parodi, F.; Benza, M.; Trotta, A.; Zero, E.; Zero, L.; Sacile, R. Enhancing Safety of Transport by Road by On-Line Monitoring of Driver Emotions. In Proceedings of the 2016 11th System of Systems Engineering Conference (SoSE), Kongsberg, Norway, 12–16 June 2016; pp. 1–4. [Google Scholar]
- Holeczek, N. Analysis of Different Risk Models for the Hazardous Materials Vehicle Routing Problem in Urban Areas. Clean. Environ. Syst. 2021, 2, 100022. [Google Scholar] [CrossRef]
- Dong, S.; Zhou, J.; Ma, C. Design of a Network Optimization Platform for the Multivehicle Transportation of Hazardous Materials. Int. J. Environ. Res. Public. Health 2020, 17, 1104. [Google Scholar] [CrossRef]
- Yang, X.; Ma, C.; Zhu, C.; Qi, B.; Pan, F.; Zhu, C. Design of Hazardous Materials Transportation Safety Management System under the Vehicle-Infrastructure Connected Environment. J. Intell. Connect. Veh. 2019, 2, 14–24. [Google Scholar] [CrossRef]
- Zografos, K.G.; Androutsopoulos, K.N.; Vasilakis, G.M. A Real-Time Decision Support System for Roadway Network Incident Response Logistics. Transp. Res. Part. C Emerg. Technol. 2002, 10, 1–18. [Google Scholar] [CrossRef]
- Hong, J.; Tamakloe, R.; Park, D. Application of Association Rules Mining Algorithm for Hazardous Materials Transportation Crashes on Expressway. Accid. Anal. Prev. 2020, 142, 105497. [Google Scholar] [CrossRef]
- Patil, A.; Srivastava, S.; Paul, S.K.; Dwivedi, A. Digital Twins’ Readiness and Its Impacts on Supply Chain Transparency and Sustainable Performance. Ind. Manag. Data Syst. 2024, 124, 2532–2566. [Google Scholar] [CrossRef]
- Liu, Y.; Fan, L.; Li, X.; Shi, S.; Lu, Y. Trends of Hazardous Material Accidents (HMAs) during Highway Transportation from 2013 to 2018 in China. J. Loss Prev. Process Ind. 2020, 66, 104150. [Google Scholar] [CrossRef]
- Benekos, I.; Diamantidis, D. On Risk Assessment and Risk Acceptance of Dangerous Goods Transportation through Road Tunnels in Greece. Saf. Sci. 2017, 91, 1–10. [Google Scholar] [CrossRef]
- Huang, W.; Shuai, B.; Zuo, B.; Xu, Y.; Antwi, E. A Systematic Railway Dangerous Goods Transportation System Risk Analysis Approach: The 24 Model. J. Loss Prev. Process Ind. 2019, 61, 94–103. [Google Scholar] [CrossRef]
- Yu, S.; Li, Y.; Xuan, Z.; Li, Y.; Li, G. Real-Time Risk Assessment for Road Transportation of Hazardous Materials Based on GRU-DNN with Multimodal Feature Embedding. Appl. Sci. 2022, 12, 11130. [Google Scholar] [CrossRef]
- Li, Y.-L.; Yang, Q.; Chin, K.-S. A Decision Support Model for Risk Management of Hazardous Materials Road Transportation Based on Quality Function Deployment. Transp. Res. Part D Transp. Environ. 2019, 74, 154–173. [Google Scholar] [CrossRef]
- Izdebski, M.; Jacyna-Gołda, I.; Gołda, P. Minimisation of the Probability of Serious Road Accidents in the Transport of Dangerous Goods. Reliab. Eng. Syst. Saf. 2022, 217, 108093. [Google Scholar] [CrossRef]
- Huang, W.; Liu, Y.; Zhang, Y.; Zhang, R.; Xu, M.; De Dieu, G.J.; Antwi, E.; Shuai, B. Fault Tree and Fuzzy D-S Evidential Reasoning Combined Approach: An Application in Railway Dangerous Goods Transportation System Accident Analysis. Inf. Sci. 2020, 520, 117–129. [Google Scholar] [CrossRef]
- Goldberg, D.M.; Hong, S. Minimizing the Risks of Highway Transport of Hazardous Materials. Sustainability 2019, 11, 6300. [Google Scholar] [CrossRef]
- Ikegwu, A.C.; Nweke, H.F.; Anikwe, C.V.; Alo, U.R.; Okonkwo, O.R. Big Data Analytics for Data-Driven Industry: A Review of Data Sources, Tools, Challenges, Solutions, and Research Directions. Clust. Comput. 2022, 25, 3343–3387. [Google Scholar] [CrossRef]
- Belhadi, A.; Zkik, K.; Cherrafi, A.; Yusof, S.M.; El Fezazi, S. Understanding Big Data Analytics for Manufacturing Processes: Insights from Literature Review and Multiple Case Studies. Comput. Ind. Eng. 2019, 137, 106099. [Google Scholar] [CrossRef]
- Abdalla, H.B. A Brief Survey on Big Data: Technologies, Terminologies and Data-Intensive Applications. J. Big Data 2022, 9, 107. [Google Scholar] [CrossRef]
- Lepenioti, K.; Bousdekis, A.; Apostolou, D.; Mentzas, G. Prescriptive Analytics: Literature Review and Research Challenges. Int. J. Inf. Manag. 2020, 50, 57–70. [Google Scholar] [CrossRef]
- Bersani, C.; Sacile, R.; Tomasoni, A.M.; Zero, E. Emergency Resource Allocation Problem: Hazardous Material Accident Scenarios in the Ports of Northern Italy. In Proceedings of the 2020 28th Mediterranean Conference on Control and Automation (MED), Saint-Raphaël, France, 15–18 September 2020; pp. 1093–1098. [Google Scholar]
- Tomasoni, A.M.; Soussi, A.; Sacile, R. Toxic Release Damage Distance Assessment Based on the Short-Cut Method: A Case Study for the Transport of Chlorine and Hydrochloric Acid in Densely Urbanized Areas in the Mediterranean Region. ACS Chem. Health Saf. 2023, 30, 165–172. [Google Scholar] [CrossRef] [PubMed]
- Soussi, A.; Tomasoni, A.M.; Zero, E.; Sacile, R. An ICT-Based Decision Support System (DSS) for the Safety Transport of Dangerous Goods along the Liguria and Tuscany Mediterranean Coast. In Intelligent Sustainable Systems; Springer: Singapore, 2023; pp. 629–638. [Google Scholar]
Figure 1.
Territorial framework is interested in the risk model for monitoring road safety assessment in four Areas of Genoa (1)—A10, A26, A10, A7 and A12 are the principal Highways in Liguria Region and in blue and light-grey-lines the local and municipality road network, Leghorn Port in Tuscany Region and seven main DG port access points: gate Sintermar 1 and Sintermar 2, gate Terminal Darsena Toscana, gate Galvani, gate Zara, gate Valessini, gate Donegani (2), Porto Torres (Industrial and Commercial ports) and Olbia ports (Cocciani’s port, Isola Bianca and Interno’s ports, two Sardinia Region port areas (3), and Bregallion port in Toulon Region (4).
Figure 2.
A global approach to mitigating road risks to improve safety assessment.
Figure 2.
A global approach to mitigating road risks to improve safety assessment.
Figure 3.
Data exchange elaboration Decision Support System architecture.
Figure 3.
Data exchange elaboration Decision Support System architecture.
Figure 4.
System functional diagram and data exchange architecture.
Figure 4.
System functional diagram and data exchange architecture.
Figure 5.
Example of detection station and sensors installed in Leghorn, Tuscany Region, Italy.
Figure 5.
Example of detection station and sensors installed in Leghorn, Tuscany Region, Italy.
Figure 6.
One real system-vehicle-transit-window: The DSS system utility starts from a single system window, where heavy vehicle information is automatically registered into the system. This corresponds to a real vehicle detected by the Kemler code captured by the camera and tele laser installed, and is managed according to the monitoring system’s development.
Figure 7.
Visualization of Cumulative Transit Information System Query in Genoa—Data Interface Displaying Transit Information by Gate (ADR Info, Class Info, UN Number, Placard and Gate Information, Camera Used, Type of Vehicle, and Its Image).
Figure 7.
Visualization of Cumulative Transit Information System Query in Genoa—Data Interface Displaying Transit Information by Gate (ADR Info, Class Info, UN Number, Placard and Gate Information, Camera Used, Type of Vehicle, and Its Image).
Figure 8.
Exploring Outputs from the Decision Support System Enhanced by the LOSE+ Project: Real-time Tracking of DGT (A), Detailed Maps for Provincial DG Road Networks (B), and Visualization of Potential Accident Scenarios (C).
Figure 8.
Exploring Outputs from the Decision Support System Enhanced by the LOSE+ Project: Real-time Tracking of DGT (A), Detailed Maps for Provincial DG Road Networks (B), and Visualization of Potential Accident Scenarios (C).
Figure 9.
Distribution of Imported and Exported DG Based on Their IMDG Class in the City of Genoa.
Figure 9.
Distribution of Imported and Exported DG Based on Their IMDG Class in the City of Genoa.
Figure 10.
Rescue Interventions for Road Transport of Goods by the National Fire Brigade in the Municipality of Genoa, Categorized by Cause.
Figure 10.
Rescue Interventions for Road Transport of Goods by the National Fire Brigade in the Municipality of Genoa, Categorized by Cause.
Figure 11.
Rescue Interventions for Road Transport of DG by the National Fire Brigade in the Municipality of Genoa, Classified by DG Class.
Figure 11.
Rescue Interventions for Road Transport of DG by the National Fire Brigade in the Municipality of Genoa, Classified by DG Class.
Figure 12.
Distances for the most probable hypothesis and weather class F2 according to the “Short cut method”—urban case (hypothetical accident along the road network investigated to the DG vehicle tracking: orange area of accident impact -threshold 1, and green area of possible damages—threshold 2).
Table 1.
Data type, identification, source, and purpose architecture.
Table 1.
Data type, identification, source, and purpose architecture.
| Data Type | Data Source | Purpose |
|---|
Territorial
data | Liguria Region Institutional Territorial Information System portal:
“https://geoportal.regione.liguria.it/ (accessed on 10 July 2025)” | Collecting data on:
- Population density (area)
- Topology and urban cells (area)
- Regional, district and municipality borders (line)
- Highway road infrastructure (line)
- Extra urban road infrastructures (line)
- Urban road infrastructures (line)
- Railway infrastructures (line)
- Airport infrastructures (area)
- Ports areas (area)
- Port gates (point)
- Buildings (point)
- Schools (point)
- Hospital (point), etc. |
Municipality of Genova Territorial Information System portal:
“https://smart.comune.genova.it/geoportale (accessed on 10 July 2025)” |
Tuscany Region Institutional Territorial Information System portal:
“https://www.regione.toscana.it/-/geoscopio (accessed on 10 July 2025)” |
Sardinia Region Institutional Territorial Information System portal:
“https://www.sardegnageoportale.it/ (accessed on 10 July 2025)” |
Flow data
(this data is only available for the users of the platform) | University of Genoa decision support system:
“https://webgisloseplus.dibris.unige.it/ (accessed on 10 July 2024)” | Gathering information on:
- traffic of hazmat by road
- number of tracks/vehicles transporting hazmat
- transit of hazmat per gate
- number of containers stoked in port areas
- type of goods (class of danger) |
| Historical Accident Records | Highway accidents:
“https://www.aiscat.it/category/aiscat-informazioni-edizione-semestrale/ (accessed on 10 July 2025)”
The National Fire Brigade and Rescue Service in Italy public each year “the Statistical Yearbook of the CNVVF”
“https://www.esteri.it/en/sala_stampa/pubblicazioni-e-book/archivio_annuario/ (accessed on 10 July 2024)”
The statistical activity was reorganized, also for the central and peripheral structures of the CNVVF, with legislative Decree No. 322 of 6 September 1989 and circular No. 1 of 2 January 2003 with which the Statistical Service of the CNVVF was reorganized. | Compiling and gathering data on accidents related to:
- classes
- quantities
- physical characteristics
- chemical characteristics |
| Meteorological data | On a global scale:
Data for modeling accident scenario
“NOAA (National Oceanic and Atmospheric Administration (https://www.noaa.gov/)) (accessed on 10 July 2025)”
At local level (accessed on 10 July 2025):
Liguria https://www.arpal.liguria.it/tematiche/meteo.html
Tuscany https://www.lamma.toscana.it/ (accessed on 10 July 2025)
Sardinia: https://www.sar.sardegna.it/servizi/meteo/bollsardegna_new_it.asp (accessed on 10 July 2025)
Toulon: https://meteofrance.com/previsions-meteo-france/toulon/83000 (accessed on 10 July 2025) | Collecting data on meteorological conditions, in particular, information regarding:
- temperature
- relative humidity
- timestamp
- geographic position of the cell (Lat, Lon)
- wind (speed and direction) |
Table 2.
Vast data implementation approach.
Table 2.
Vast data implementation approach.
| Data Owner | Data Users | Predictive Analytics | Prescriptive Analytics |
|---|
| State Ministries, Regional SIT (or GIS) structures are Territorial Data owners (TD) | All the citizenship of the European Union. In this study Universities, Regional Institutions, Districts and Municipalities decision-makers | - Element exposed to risk
- Environmental matrixes
- km of infrastructures
- areas with a specific urban destination
- neighborhoods
- lines of electrical and energetic facilities
- areas of habitat types and species protected | Parameters useful to determine vulnerable points in case of an accident. |
| The DF owner is the private or public subject that installs the ICT or IoT device or equipment. State Ministries supervised and regulated these DF. | All the Police Stations and headquarters. In this study Municipal police, Districts Units, Universities, Regional Institutions, Districts and Municipalities decision-makers | - Dynamic Traffic flow per category of vehicles
- Dynamic Traffic flow of DG.
- Position
- Timing | Parameters and variables useful for
- text and historical knowledge,
- policy and management planning at local and trans-regional scale
- identify critical points or bottlenecks
- optimize emergency services |
| The Historical Accident Records owner is the private or public subject that detect institutionally these data for reasons of business or for reasons of Institutional rules and function (Police, Fireman, DGT owners). State Ministries supervised and regulated these Historical Accident Records thanks to ISTAT in Italy and BARPI in France (HAR) | Firemen, Polices, Ministries, Environmental Agencies, Health and Safety Authorities, Companies involved in the accidents. In this study Firemen, and Universities | - Type of accident: release and or fire and or explosion
- DG involved
- Quantity
- Type of transport
- Type of vehicle-carrier
- Geometrical parameters and variables
- Chemical parameters and variables
- Thermodynamic parameters and variables | Parameters are useful for determining and identifying the most probable scenarios. |
| The Meteorological Data owner is the State Ministries competent in this field in Italy and in France and the Regional Environmental Authorities (MD) | Public Authorities, Global Scale Institutional Authority in this field, Regional Environmental Agencies, Health, and Safety Authorities. In this study Universities, Districts and Municipality Authorities. | - Wind parameters and variables
- Water parameters and variables
- Air parameters and variables
- Soli parameters and variables | Parameters and variables are useful for determining and identifying the most probable scenarios. |
Table 3.
Example of Data Collected for DG Imported and Exported in the City of Genoa Based on Their Classes.
Table 3.
Example of Data Collected for DG Imported and Exported in the City of Genoa Based on Their Classes.
| DG Classes | N° of Containers Imported by Road (Until October 2023) | N° of Export Containers by Road (Until October 2023) | Total |
|---|
| Classe 3 (Flammable liquids) | 1.941 | 4.867 | 6.808 |
| Classe 8 (Corrosive substances) | 1.915 | 1.217 | 3.132 |
| Classe 9 (Miscellaneous dangerous substances) | 3.936 | 1.552 | 5.488 |
| Other classes | 1.408 | 1.923 | 3.331 |
| Total | 9.200 | 9.559 | 18.759 |
| Disclaimer/Publisher’s Note: The statements, opinions and data contained in all publications are solely those of the individual author(s) and contributor(s) and not of MDPI and/or the editor(s). MDPI and/or the editor(s) disclaim responsibility for any injury to people or property resulting from any ideas, methods, instructions or products referred to in the content. |
© 2025 by the authors. Licensee MDPI, Basel, Switzerland. This article is an open access article distributed under the terms and conditions of the Creative Commons Attribution (CC BY) license (https://creativecommons.org/licenses/by/4.0/).


