Article

Unraveling the Drivers of ESG Performance in Chinese Firms: An Explainable Machine-Learning Approach

by
Hyojin Kim
and
Myounggu Lee
*
School of Business, Konkuk University, Seoul 05029, Republic of Korea
*
Author to whom correspondence should be addressed.
Systems 2025, 13(7), 578; https://doi.org/10.3390/systems13070578
Submission received: 6 June 2025 / Revised: 5 July 2025 / Accepted: 9 July 2025 / Published: 14 July 2025

Abstract

As Chinese firms play pivotal roles in global supply chains, multinational corporations face increasing pressure to ensure ESG accountability across their sourcing networks. Current ESG rating systems lack transparency in incorporating China’s unique industrial, economic, and cultural factors, creating reliability concerns for stakeholders managing supply chain sustainability risks. This study develops an explainable artificial intelligence framework using SHAP and permutation feature importance (PFI) methods to predict the ESG performance of Chinese firms. We analyze comprehensive ESG data of 1608 Chinese listed companies over 13 years (2009–2021), integrating financial and non-financial determinants traditionally examined in isolation. Empirical findings demonstrate that random forest algorithms significantly outperform multivariate linear regression in capturing nonlinear ESG relationships. Key non-financial determinants include patent portfolios, CSR training initiatives, pollutant emissions, and charitable donations, while financial factors such as current assets and gearing ratios prove influential. Sectoral analysis reveals that manufacturing firms are evaluated through pollutant emissions and technical capabilities, whereas non-manufacturing firms are assessed on business taxes and intangible assets. These insights provide essential tools for multinational corporations to anticipate supply chain sustainability conditions.

1. Introduction

Environmental, Social, and Governance (ESG) scores or rankings are the ways to assess a firm’s sustainability and ethical performance by integrating hundreds of indicators such as carbon emissions, labor practices, and board structure [1]. Since robust ESG performance is linked to enhanced financial outcomes and stronger brand reputation [2], investors use ESG metrics to manage risks and secure long-term returns. In turn, firms can identify the key drivers of their ESG performance and invest strategically in areas that bolster sustainability and competitive advantage [3]. Moreover, regulators are increasingly mandating transparent ESG reporting to protect market integrity and financial stability [4].
Understanding the ESG environment in China is thus not only a matter of domestic policy or corporate responsibility but a global strategic imperative. Given China’s centrality in the global economy, the sustainability performance of Chinese firms has direct implications for the ESG risk exposure, investment decisions, and regulatory compliance of international firms and investors. Furthermore, as global ESG frameworks evolve, their effectiveness and legitimacy depend on how well they reflect and integrate the realities of major economic actors like China. In the same context, international stakeholders demand increased transparency in global supply chains. ESG issues within suppliers, such as environmental incidents, ethical breaches, or weak corporate governance, can quickly escalate into reputational crises or operational disruptions for buyers [5,6]. Consequently, ESG performance has become a critical consideration in global supply chain management.
In particular, Chinese companies, as critical participants in global supply chains due to China’s status as the world’s largest manufacturing nation and exporter [7], significantly influence these dynamics. Multinational corporations sourcing from Chinese firms face growing pressure to ensure accountability and resilience within their supply chains. Therefore, accurate prediction of ESG performance is increasingly vital.
Compared to other countries, China’s rapid economic growth and unique social, cultural, and regulatory environments create distinct conditions for the application of ESG principles to corporate management [7,8,9,10,11]. Nevertheless, global ESG rating agencies often fail to disclose clearly how they incorporate China’s unique industrial, economic, and cultural elements into their assessment frameworks, raising concerns about the transparency and reliability of ESG assessments for Chinese companies [10,12].
Moreover, previous analyses often evaluate financial and non-financial determinants of ESG performance in isolation. For example, Khalil et al. [13] narrowly focus on the impact of environmental innovation on market value, while Crespi and Migliavacca [14] prioritize financial metrics such as firm size and profitability without considering their interactions with non-financial factors. This segmented approach limits our comprehensive understanding of how each financial and non-financial feature comprehensively shapes ESG performance [15]. This limitation underscores the necessity of integrated systems-based models combining financial and non-financial determinants, addressing methodological fragmentation through a machine learning approach.
Explainable artificial intelligence (XAI)-based prediction models enhance transparency by clearly illustrating evaluation processes and critical factors. Despite Chinese companies’ critical role as suppliers in global supply chains, a sophisticated understanding of ESG performance and CSR dynamics within the Chinese context remains limited, representing a significant research gap. Accurately predicting Chinese companies’ ESG performance (i.e., scores and rankings) based on the financial and non-financial determinants would allow global corporations to anticipate and manage sustainability conditions across their supply chains more effectively.
To fully understand ESG performance determinants, this study adopts a systems perspective, recognizing ESG performance as an outcome of complex, interacting financial and non-financial factors within distinct industrial and regulatory contexts. Under this overarching systems approach, our research pursues two core objectives. First, we examine the distinctive trends and determinants of ESG performance across various industries in China, encompassing both financial and non-financial factors. Second, we construct a novel multidimensional ESG assessment model that reflects China’s industrial and regulatory specificities using machine learning techniques, thereby supporting informed decision-making by stakeholders.
Specifically, this study employs advanced machine learning techniques to analyze extensive data from 1608 Chinese listed companies over 13 years (2009–2021) provided by CNRDS (Chinese Research Data Services Platform) and CSMAR (China Stock Market & Accounting Research) databases. Utilizing sophisticated analytical techniques and machine learning, particularly XAI methods, we identify key determinants (i.e., financial and non-financial factors) that influence ESG performance among Chinese companies.
Through this integrated systems approach, the study aims to contribute significantly in academic and practical domains. First, by thoroughly examining ESG performance and CSR implications within Chinese enterprises, we offer insights relevant to the global discourse on sustainable business practices and provide practical guidance for sustainable supply chain management involving Chinese suppliers. Second, we develop a comprehensive understanding of ESG determinants by incorporating both financial and non-financial indicators, thus illuminating the interactions between financial soundness and sustainability initiatives. Third, employing advanced machine learning coupled with XAI addresses critical gaps in transparency and interpretability, moving beyond opaque ‘black box’ models to deliver accurate and explainable ESG performance predictions.
The remainder of this paper is organized as follows. First, we review existing literature that supports our modeling approach. Second, we introduce the methodology of the ESG performance prediction model and XAI approach. Next, we conduct a predictive study to identify key determinants of ESG performance, tracing industry-specific differences to derive deeper insights. Finally, we conclude by discussing our findings, contributions, and implications for future research.

2. Literature Review

2.1. Key Determinants of ESG Performance: Financial and Non-Financial Features

A substantial body of research on ESG indicates that firms with higher ESG ratings tend to exhibit superior financial performance. For example, a comprehensive review by Friede et al. [16] of over 2000 empirical studies reported that about 90% found a non-negative association between ESG measures and corporate financial performance. Such findings reinforce earlier evidence of a small but positive effect of ESG on profitability and firm value [17]. A synthesis of empirical literature elucidates several mechanisms through which robust ESG practices correlate positively with firm performance. Firstly, effective ESG implementation mitigates firm-specific risks and optimizes operational efficiency, resulting in cost reductions through the avoidance of regulatory sanctions and reputational liabilities [18,19,20,21]. Secondly, superior ESG performance enhances access to financial resources by lowering the cost of capital and expanding the pool of sustainability-conscious investors [22,23]. Thirdly, a strong ESG profile bolsters corporate reputation and stakeholder trust, thereby fostering customer loyalty and facilitating the attraction of high-caliber human capital [24,25,26]. Fourthly, proactive ESG initiatives stimulate innovation and foster long-term strategic growth by driving the development of products and processes that align with evolving environmental and social imperatives [26,27,28]. Consequently, these cumulative benefits translate into enhanced accounting performance and elevated market valuations for firms with strong ESG credentials. Although the magnitude of these effects may exhibit heterogeneity across diverse industries and geographic regions [16], the preponderance of empirical evidence suggests that ESG should be conceptualized not merely as an ethical mandate but as a strategic asset integral to firm value creation.
Meanwhile, researchers in management and finance have explored numerous firm-specific factors—both non-financial and financial—that influence a firm’s ESG performance. On the non-financial side, the pivotal roles of effective corporate governance and strategic leadership are consistently highlighted. For instance, firms with independent, diverse boards and strong leadership commitment often achieve higher sustainability ratings [29,30,31,32]. Moreover, the adoption of transparent disclosure mechanisms, such as integrated reporting, facilitates the cultivation of stakeholder trust and positively influences ESG performances [33,34,35]. Additionally, organizational responsiveness to external stakeholder pressures, including rigorous regulatory frameworks, activist investor engagement, and evolving societal expectations, can serve as a catalyst for the implementation of enhanced environmental and social policies [36,37]. On the financial side, since a firm’s resources and performance shape its capacity to invest in sustainability initiatives, larger and more profitable firms demonstrate a propensity to allocate increased resources towards environmental innovation and social initiatives, thereby enhancing their ESG scores [13,14,38]. The slack resources theory further posits that firms possessing surplus resources are better positioned to engage in Corporate Social Responsibility (CSR) initiatives, although an excessive accumulation of slack resources may potentially lead to operational inefficiencies [39,40,41]. Furthermore, financial stability and robustness, as evidenced by low bankruptcy risk and favorable credit ratings, correlate positively with superior ESG performance, as financially sound organizations are better equipped to implement and sustain long-term ESG strategies [21,30].
While prior studies offer valuable insights into ESG performance determinants, several limitations exist. Empirical findings are often mixed or context-dependent, indicating that no single universal determinant consistently guarantees superior ESG performance. This is because methodological variations in ESG measurement, along with industry- and region-specific nuances, contribute to these inconsistent results [16,17,42]. For example, governance factors demonstrate particularly stark contradictions. Based on agency theory, Beji and Loukil [31] found that increased board independence was associated with higher ESG performance among French listed companies, while Govindan et al. [32] reported similar positive effects in the logistics industry. However, Walls et al. [43] found the opposite among 294 US-listed companies, and Haniffa and Cooke [44] observed negative associations with CSR performance among Malaysian companies.
Institutional context similarly produces divergent outcomes. While Mooneeapen et al. [45] found that higher democratic governance levels correlated with lower ESG performance, Cai et al. [38] reported the opposite relationship. Similarly, mandatory ESG disclosure improved performance and firm value in Ioannou and Serafeim’s multi-country study [35], but Chen et al. [46] found a performance trade-off specifically within China’s institutional context.
Even the fundamental financial strength—ESG performance relationship varies significantly. Khaled et al. [39] found strong positive associations among 1105 firms across 25 emerging markets, supporting the ‘slack resources’ perspective, while Garcia-Blandon et al. (2019) identified trade-off relationships among top-performing CEO companies, and Garcia et al. [47] found no clear relationship at all. These divergent results suggest that ESG determinants are fundamentally context-dependent, with factor effects varying significantly across institutional environments, industry characteristics, and methodological approaches. It also indicates that universal ESG strategies may be inherently limited, necessitating context-specific analytical frameworks.
Critically, many studies adopt segmented approaches, examining financial or non-financial determinants separately, rather than assessing their comprehensive effect [48,49]. This isolation impedes the determination of relative factor importance and their combined influence (or interactions) on ESG performances. Consequently, the existing literature often lacks a holistic integration of determinants. Addressing these limitations requires adopting comprehensive analytical frameworks that simultaneously consider financial and non-financial factors, thereby improving the explanatory power and predictive accuracy regarding ESG outcomes.

2.2. ESG Performance in China

According to the existing studies, the mixed findings in ESG determinant research are attributed to overlooking differences in ESG measurement frameworks and national contexts [17,50]. The unique institutional, cultural, and market conditions in each region or country mean that factors driving ESG success in one environment may not apply in another. For example, Ortas et al. [51] found that a firm’s institutional and social environment significantly shapes its ESG outcomes, even among firms that have all committed to voluntary CSR initiatives. Methodological differences among ESG rating providers also play a crucial role [52]. Studies have uncovered substantial divergence in how major rating providers score the same firm, due to inconsistencies in indicators and weighting systems [12]. This means that a firm rated as an “ESG leader” in one system may receive an average rating in another. Therefore, analyzing ESG determinants requires consideration of industrial and regional contexts, as ignoring these factors can lead to misleading or contradictory results [42].
This gap is particularly pronounced in the Chinese context. Due to rapid economic growth and distinctive social, cultural, and regulatory environments, China faces differentiated challenges and opportunities when integrating ESG principles into corporate management compared to other countries [53]. Specifically, China has a unique ownership structure dominated by state-owned enterprises (SOEs) and mixed ownership arrangements [7], collectivist values based on Confucian culture [8,9], government-led, top-down ESG policy implementation [10], and ESG disclosure and evaluation systems that differ from Western approaches [10,11].
These institutional and cultural specificities pose significant challenges when attempting to directly apply empirical findings on ESG performance determinants from Western contexts to China. Most existing studies have predominantly focused on Western firms and therefore fail to adequately capture China’s unique contextual characteristics [10]. For instance, SOEs must balance economic performance objectives with political responsibilities, leading them to increase investments in environmental, social, and governance areas based on long-term strategic goals, even when economically suboptimal in the short term [54]. Moreover, the privileged financial access and close government relationships of SOEs can also positively correlate with improved ESG performance in private firms where they hold equity stakes [55]. Chinese ESG rating providers partially reflect the implicit social responsibilities of SOEs in their evaluations, whereas international ESG rating providers prioritize compliance with globally accepted ESG information disclosure standards. Consequently, international agencies tend to give lower ESG ratings to Chinese SOEs that do not fully meet international transparency and disclosure expectations [56,57].
Understanding how ESG determinants are applied and developed in China is essential for comprehending global sustainable management trends [53]. However, current research lacks sufficient analysis in two critical areas: how Chinese firms address ESG challenges and opportunities in response to diverse domestic and international expectations, and what factors determine ESG performance across China’s various industrial sectors.
This research gap is further complicated by fundamental transparency issues within current ESG evaluation systems. Since global ESG data providers operate proprietary evaluation systems with different scopes, measurements, and weightings, even identical firms receive entirely different scores. Berg et al. [12] identify that scope, measurement, and weight differences among five major rating providers are the primary causes of ESG rating discrepancies, with measurement differences being particularly critical. While accurately evaluating Chinese firms requires reflecting China’s unique industrial, economic, and cultural factors, it is difficult to verify how these elements are actually applied since rating providers do not disclose their specific algorithms [52]. Consequently, ESG scores remain opaque and proprietary, carrying the risk of not fully reflecting companies’ substantive sustainability.
Therefore, this study seeks to address these limitations by utilizing the most comprehensive ESG data available in China to construct machine learning models that integrate financial and non-financial factors and transparently interpret model internals using XAI techniques such as SHAP and PFI. Through this approach, we aim to identify key determinants of Chinese firms’ ESG scores and rankings, mitigate opacity in evaluation processes, and provide empirical evidence for establishing customized ESG strategies by industry and company. Ultimately, this study seeks to contribute to enhancing both the generalizability that reflects industrial and regional contexts and transparent evaluation frameworks for ESG research and practice at both the Chinese and global levels. This will provide practical strategic insights not only for Chinese companies but also for foreign companies and investors seeking to enter the Chinese market.

2.3. Machine Learning for ESG Performance Prediction
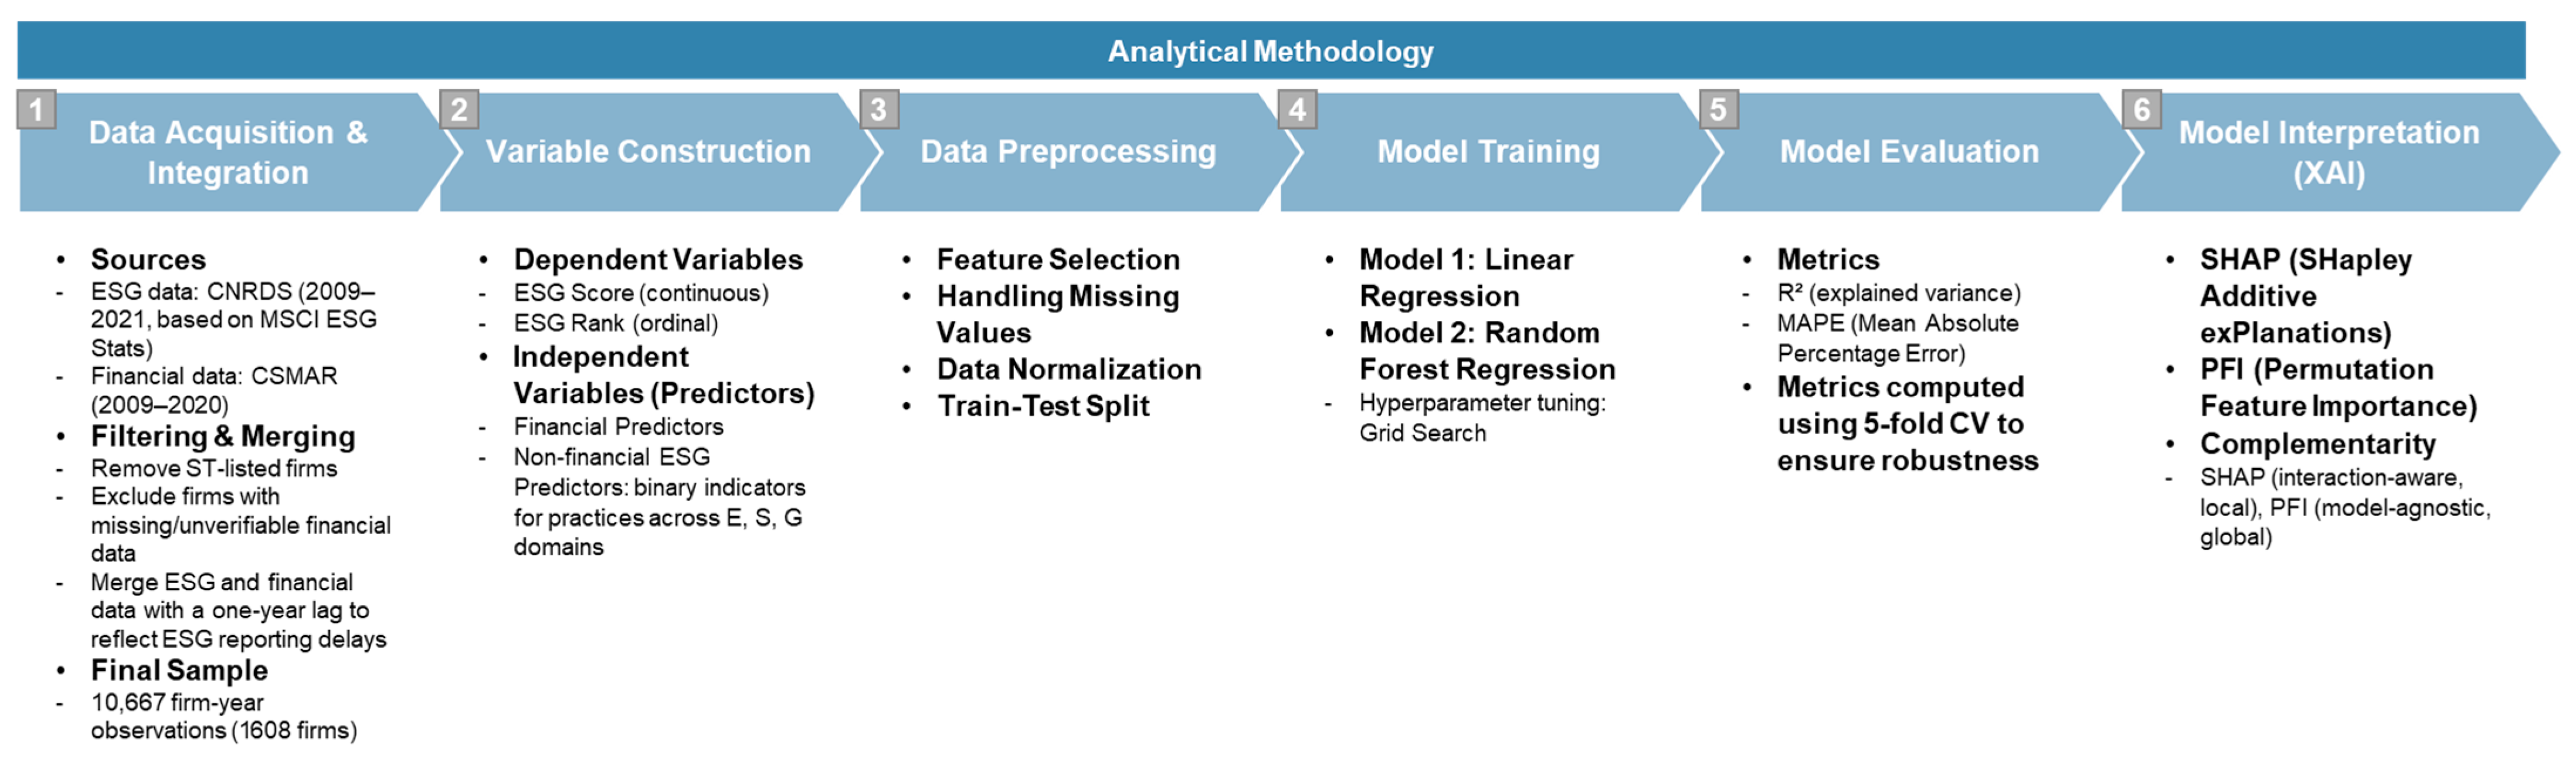
With the increasing availability of massive ESG data, researchers have started applying machine learning (ML) techniques to predict ESG performance because ML models can handle large, complex datasets and potentially uncover nonlinear relationships that traditional statistical methods might miss. However, current ML-based ESG research exhibits notable limitations.
Predominantly, studies prioritize predictive accuracy over model explainability, often employing opaque algorithms. For instance, Lin and Hsu [58] prioritized predictive accuracy over explicability, offering little insight into feature importance. Rahman et al. [59] applied AutoML with genetic programming but failed to elucidate how financial and non-financial variables collectively shape ESG performances.
Second, there is often an over-reliance on either financial or non-financial data, leading to the marginalization of crucial factors. For instance, Raza et al. [48] demonstrated the effectiveness of artificial neural networks (ANNs) using financial statements, but their emphasis on financial metrics overlooked key non-financial drivers such as CSR initiatives. D’Amato et al. [49] applied the random forest algorithm to predict corporate ESG scores from financial data and attempted to analyze variable importance but failed to reflect important factors such as corporate social contribution activities and environmental innovation. Sharma et al. [60] confirmed the positive correlation between ESG and financial performance using random forest regressions but acknowledged difficulties in capturing nuanced sustainability metrics due to data quality. The omission of important non-financial variables, like patents related to green technologies or supply chain ethics, limits the comprehensiveness of these models. Conversely, textual analysis of sustainability reports, as seen in Lee et al. [61], may overlook structured financial information and quantitative ESG KPIs.
Additionally, temporal and contextual rigidity restricts the generalizability of findings, as exemplified by Lee et al. [61], which failed to account for dynamic changes in ESG determinants. While Lee et al. [61] extracted governance and social insights from textual disclosures, they encountered limitations in adapting to temporal shifts and conducting structured ESG assessments. Furthermore, existing ML studies prioritize algorithmic complexity over actionable insights, leaving stakeholders unable to discern why specific factors drive ESG performance.
Finally, the utilization of XAI methods for result interpretation remains sparse. Rahman et al. [59], despite employing AutoML for ESG ranking classification, omitted the reporting of influential input features, thereby limiting model applicability. In essence, existing ML applications in ESG frequently lack comprehensive integration of financial and non-financial features and fail to provide transparent prediction explanations. This deficiency in interpretability and data scope necessitates a more encompassing and explainable modeling paradigm.
Addressing the aforementioned limitations, this study aims to predict ESG performances using a comprehensive set of firm characteristics and to explain the relative influence of those characteristics by incorporating XAI techniques into machine learning models. Specifically, we leverage machine learning models to forecast a firm’s ESG performance and then apply XAI methods such as SHapley Additive exPlanations (SHAP) and permutation feature importance (PFI) to identify the key financial and non-financial features. Our objectives are twofold: (1) to achieve robust ESG performance predictions through the integration of diverse prior-year predictors, and (2) to provide transparent insights into the individual predictor effects on ESG performances. This approach responds to the imperative for predictive and interpretable models within the ESG domain.

3. Methodology

This investigation integrates XAI approaches, specifically SHAP and PFI, with conventional machine learning regression frameworks to examine the determinants of corporate ESG performances. The study employs next-year ESG scores and ranks as dependent variables, reflecting the temporal structure of ESG reporting in the Chinese market, where annual ESG performance metrics are derived from the previous year’s ESG activities. To ensure temporal consistency in the analysis, financial metrics were synchronized with non-financial ESG activity indicators from the corresponding temporal period.
The methodological framework incorporates two distinct predictive modeling approaches: classical multiple linear regression and the more sophisticated random forest algorithm, representing linear and nonlinear modeling paradigms, respectively. The selection of these methodological approaches was predicated on their widespread application in predictive analytics and their capacity to achieve an optimal equilibrium between predictive efficacy and model interpretability. This methodological section elucidates the fundamental algorithms and analytical frameworks employed in the research design. Emphasis is placed on the implementation of XAI methodologies, specifically SHAP and PFI, and their application in deriving interpretable insights from the predictive models. A schematic overview of the methodological procedure is presented in Figure 1.

3.1. Predictive Models

This study investigates the determinants of ESG performance by modeling ESG scores and ESG ranks as the dependent variables. The analysis utilizes a set of financial and non-financial predictors denoted as X = ( X 1 , X 2 , , X p ) , with each observation represented as { y i , x i } , where y i corresponds to the ESG outcome (i.e., ESG score and ESG rank) of firm i:
Y = f X 1 , X 2 , , X p + ε
To estimate the relationship between predictors and ESG outcomes, two modeling approaches are employed: ordinary least squares (OLS) regression and the random forest (RF) algorithm. The OLS model serves as a baseline due to its interpretability and its established role in empirical ESG research. Despite its assumption of linearity, OLS offers insights into the direction and magnitude of the association between individual predictors and ESG metrics. To capture nonlinearities and potential interactions among variables, a random forest regression model is applied. RF is an ensemble method that constructs multiple decision trees, each trained on a bootstrap sample of the data, with a random subset of predictors considered at each split. This approach improves generalization performance by reducing overfitting and enhancing model stability. Hyperparameter tuning is conducted using a grid search strategy, with the number of trees set to {5, 10, 15, 20} and the maximum tree depth set to {5, 10, 15, 20}. Five-fold cross-validation is used to identify the optimal configuration, which is determined to be 10 trees with a maximum depth of 5.
Model performance is evaluated using two complementary metrics: the coefficient of determination (R2) and the mean absolute percentage error (MAPE). R2 quantifies the proportion of variance in ESG outcomes explained by the model, while MAPE measures the average prediction error as a percentage of actual values. Both metrics are computed under a five-fold cross-validation procedure to ensure robustness and reduce potential biases arising from data partitioning. This dual-model approach, combining the interpretability of linear regression with the flexibility of ensemble learning, allows for a comprehensive analysis of ESG determinants and provides a reliable foundation for understanding and forecasting ESG performance.

3.2. Explainable Artificial Intelligence (XAI)

To improve the interpretability of the model used in this study, we incorporate two explainable artificial intelligence (XAI) techniques: SHapley Additive exPlanations (SHAP) and permutation feature importance (PFI). These methods are applied to quantify the contribution of individual predictors to ESG performance predictions, thereby enhancing the transparency and accountability of the model.
SHAP, introduced by Lundberg and Lee [62], is based on Shapley values from cooperative game theory [63] and provides instance-level explanations by computing the marginal contribution of each feature to a model’s prediction. In this study, we implement the TreeSHAP algorithm [64], which is specifically designed to efficiently compute SHAP values for tree-based models such as random forests. For each observation, SHAP values are calculated to represent the impact of each feature on the predicted ESG score or rank. To assess global importance, we compute the mean absolute SHAP value of each feature across all instances. Features with higher mean SHAP values are interpreted as having greater influence on model outputs across the dataset. Complementing SHAP, we also employ permutation feature importance (PFI), a technique introduced by Breiman [65] in the context of random forests. PFI evaluates the global importance of a feature by measuring the change in model performance when the feature’s values are randomly permuted. This procedure disrupts the relationship between the permuted feature and the target variable, enabling an estimation of the model’s reliance on that feature. In this study, performance is evaluated using mean absolute percentage error (MAPE), and the permutation process is repeated many times per feature to ensure stability. The importance score is computed as the average increase in MAPE after permutation relative to the model’s baseline performance.
While SHAP enables a localized, observation-specific breakdown of model predictions, PFI provides a more general view of feature importance across the entire dataset. Importantly, the two methods offer complementary perspectives: SHAP accounts for feature interactions and provides consistency with theoretical attribution properties, while PFI offers an intuitive and model-agnostic measure of dependence. However, it should be noted that PFI can be biased in the presence of correlated features, which is particularly relevant in ESG-related datasets. By integrating SHAP and PFI, this study adopts a hybrid interpretability framework that captures both local and global perspectives on feature influence. This dual approach enhances understanding of the model’s decision-making process and facilitates more informed interpretation of the key drivers behind ESG performance. The technical explanations, including mathematical formulations, are presented in Appendix A.2.

3.3. Data and Variables

This study utilizes a sample of all Chinese listed companies, sourced from the Chinese Research Data Services (CNRDS) database, which references the Morgan Stanley Capital International (MSCI) ESG Stats Database for the period 2009 to 2021. The year 2009 was chosen because Chinese listed companies started disclosing ESG-related information officially from that year. Our dataset was constructed by merging ESG data from CNRDS with financial data from the China Stock Market and Accounting Research (CSMAR) database (cf. We collected and used the financial data from 2009 to 2020).
CNRDS evaluates the ESG performance of all Chinese listed companies using a rating system that assigns scores from 0 to 100 and corresponding ranks from first to last place, based on combined E, S, and G dimensions. Compared to alternative ESG ratings (e.g., Shangdao Green Finance, Huazheng, Bloomberg, WIND), CNRDS provides a more extensive sample and employs a more robust, scientific measurement methodology [66]. The CNRDS-ESG indicators are constructed using information disclosed in company annual reports, sustainability reports, regulatory documents, and data provided by external sources. This study employs annual ESG ratings from the CNRDS database, where higher values signify higher corporate ESG performance. Both the overall ESG score and the corresponding company ranking are utilized as measures of ESG performance. The ESG score is treated as a continuous variable, while the ESG rank is derived hierarchically from the score. In Figure 2, we report the ESG score histograms by industry sector of our dataset.
The sample was constructed as follows: First, Special Treatment (ST)-listed companies, which exhibit significant deviations in financial indicators and information disclosure, were removed from the CNRDS-listed Chinese companies for the period 2009–2021. Second, firms with unverifiable financial data from the CSMAR database were excluded. A one-year lag was introduced such that financial and non-financial predictors preceded ESG performance, which was measured by ESG score and rank, by one year. Applying these selection criteria resulted in a final sample of 10,667 firm-year observations, representing 1608 unique Chinese listed companies. CSMAR’s industry classification follows the Shenwan standard, where each alphabetical code from A to P represents a major industry group. Using the CSMAR industry classification code, companies with codes beginning with “C” were classified as manufacturing, while those with codes starting with any other letter were classified as non-manufacturing. Drawing on existing ESG literature that explores the linkage between corporate financial characteristics and ESG performance, we finally selected six features related to assets and cash flow (i.e., cash, inventory, total assets, total revenue, operating net cash flow, return on total assets).
In addition, to account for broader social, governance, and environmental dimensions of corporate behavior, we incorporated non-financial predictors covering multiple ESG sub-domains presented in the dataset from CNRDS. Environmental variables included binary indicators capturing proactive environmental practices, such as environmentally beneficial products, measures to reduce the three wastes, circular economy, energy saving, green office, environmental certification, and environmental recognition. In addition, environmental risks were captured through environmental penalties and pollutant emissions, both coded as binary negative event indicators. Social variables covered a wide range of corporate activities related to diversity and inclusion, employee relations, and product responsibility. Diversity-related variables included member of the Communist Party of China, female board seats, innovative human resources projects, and no female executives. Employee-related factors included employee participation (stock ownership), employee benefits, safety management system, safety training, occupational safety certification, professional training, and employee communication channels. Negative labor-related events were reflected in employee safety disputes and layoffs. With regard to product and customer practices, we included quality system, after-sales service, customer satisfaction survey, quality awards, anti-corruption measures, strategy shared, integrity in business philosophy, and product dispute, which indicate either strengths or risks in product quality and ethical business conduct. Governance variables reflected the existence of CSR-related structures and broader corporate responsibility. This included CSR column, CSR leader agency, CSR vision, CSR training, and reliability guarantee. Broader governance-related social initiatives were also classified under governance by CNRDS and included supporting education, supporting charity, volunteer activities, international assistance, employment generation, and boost the local economy. Lastly, governance risks were represented by accounting irregularities and financing disputes, which were treated as binary indicators of negative events. The summary of non-financial features we used is presented in Figure 3 (see Table A1 for a detailed list). As shown in Figure 4, after the extraction of samples as above, the dataset we used was highly populated.

3.4. Preprocessing

In the domain of machine learning applications for ESG analytics, the sheer dimensionality of granular ESG variables poses a significant challenge to direct implementation. Feature selection methodologies are consequently employed to diminish the input variable space through the elimination of redundant or irrelevant predictors. This dimensionality reduction yields three primary advantages: (i) mitigation of overfitting risk, as diminished redundancy reduces the likelihood of noise-based decision making, (ii) enhancement of predictive accuracy through the reduction of potentially misleading data points, and (iii) optimization of computational efficiency during the training phase. Furthermore, the presence of missing values within the dataset necessitates comprehensive preprocessing procedures prior to analytical implementation.
In our specific implementation, the dataset comprises three categories of features: ESG performance indicators (target variables), financial features (predictors), and non-financial ESG features (predictors). Both the ESG performance variables and financial features are continuous numerical variables, while all non-financial ESG predictors are binary, reflecting the presence or absence of specific corporate practices or governance structures. The binary nature of these non-financial variables introduces two important considerations in the modeling process. First, due to their limited range, binary features contribute less variance, which can affect how feature importance is interpreted, especially in tree-based models such as random forest. Second, binary variables may lead to high sparsity, especially when representing rare corporate behaviors, thereby increasing the risk of model sensitivity to class imbalance or feature sparsity during training. These issues are mitigated through the feature selection process described in Section 3.4.1.
Our preprocessing protocol proceeds sequentially: initially, we implement a robust feature selection methodology to establish a refined variable set (detailed in Section 3.4.1); subsequently, we address missing values within the retained variables through appropriate imputation techniques (elaborated in Section 3.4.2); following this, we partition the dataset into training and test subsets as documented in Table 1; finally, we employ MinMaxScaling to normalize all predictors and the target score to the [0, 1] interval—specifically, for any given firm-level feature value x (i.e., for both of financial and non-financial features), with m and M representing the minimum and maximum values, respectively, across all firms within the sector, we rescale x as:
x m M m
This preprocessing is executed independently for each distinct industry area under analysis, as the relevance of variables may exhibit sectoral heterogeneity—variables that are omitted from CNRDS for one particular industry area may retain significant analytical importance in another industry area. However, there were no differences in the variables used across the industry area.

3.4.1. Feature Selection

Our feature selection methodology comprises three sequential phases: initially, we eliminate highly unpopulated features, subsequently remove low-variance predictors, and finally exclude attributes with ambiguous or overly broad definitions. Regarding the thresholding methodology—we classify a feature as populated if the number of non-empty samples exceeds a predetermined threshold; otherwise, it is eliminated. The issue of unpopulated variables is particularly acute. Four variables exhibit substantial missing data across all industry classifications and are consequently removed (e.g., social contribution per share: 86.4% void, R&D expenditure: 39.3% void, R&D staff ratio: 40.5% void, technical staff ratio: 17.0% void). In addition to identifying unpopulated features, we conducted a comprehensive variance analysis on all predictors for removing features with extremely low variance—such as variables overwhelmingly composed of 0 s or 1 s. Our analysis revealed that no variables exhibited exceptionally low variance that would warrant elimination from the feature set. Next, several predictors with ambiguous or overly broad definitions were identified. For instance, six variables, including “Other strengths—governance,” “Other strengths—employee,” “Other strengths—division,” and “Other strengths—community”, represent miscellaneous activities not encompassed within specific ESG initiatives and were excluded from the feature set due to their imprecise variable definitions. Ultimately, a total of 48 out of 58 non-financial variables were selected. Table 1 summarizes the number of predictors retained after the stage of the feature selection process. Comprehensive information regarding the selected variables for the models can be found in Table A1 of Appendix A.1., where we provide exhaustive lists of the considered variables.

3.4.2. Missing Values

Despite the prior removal of highly unpopulated features, the selected variables still contain missing values. We operate under the assumption that all incomplete data results from non-disclosure by the company rather than collection failures by the rating agency. Following this hypothesis, missing values cannot be treated neutrally, as is common in many other applications. The absence of data must be weighted by our algorithm to account for and mitigate transparency biases, consistent with methodologies employed by global ESG assessment companies (e.g., Refinitiv). Consequently, we complete the dataset as follows: for each feature with missing values, we calculate its correlation with the target score. If the correlation is positive (negative), a high (low) feature value will likely correspond to a high score. Therefore, to systematically penalize missing values, we replace them with the minimum value of the feature across the entire dataset in cases of positive correlation, whereas for negative correlations, we substitute the maximum recorded value. Through this approach, we ensure that missing values are appropriately penalized rather than treated impartially (as would occur if replaced with mean or median values).

4. Result

We first evaluated the predictive performance of the multiple linear regression model and the random forest model in forecasting ESG performance indicators. In predicting ESG scores, the multiple linear regression model achieved an R2 of 0.174 and a mean average percentage error (MAPE) of 0.517, whereas the random forest model demonstrated significantly superior performance with an R2 of 0.826 and a MAPE of 0.257. In contrast, in predicting ESG ranks, the multiple linear regression model produced an R2 of 0.157 and a MAPE of 5.773, while the random forest model achieved an R2 of 0.825 and a MAPE of 2.143. These results indicate that the random forest model consistently outperforms the multiple linear regression model. Accordingly, our subsequent discussion will be based on the results obtained using the random forest model for both ESG score and ESG ranks prediction task.
To enhance the interpretability of the random forest model, SHAP (SHapley Additive exPlanations) and permutation feature importance (PFI) were applied. Mean absolute SHAP values and PFI scores were computed for both ESG scores and ESG ranks. The results are summarized in Table 2 and Table 3, respectively. The analysis was conducted using Python (v3.11.9) libraries, such as SHAP (v0.48.0) and scikit-learn (v1.6.1), ensuring the transparency and reproducibility of the findings.
In the context of ESG score prediction (Table 2), several non-financial variables ranked consistently high across both interpretability methods. These include number of patents (SHAP: 1st; PFI: 1st), pollutant emissions (3rd; 3rd), CSR training (4th; 2nd), and measures to reduce the three wastes (7th; 8th), reflecting the importance of innovation and sustainability practices. Notably, financial indicators such as total assets (2nd; 4th), cash (10th; 7th), and return on total asset (13th; 13th) also contribute meaningfully, albeit to a lesser degree. Governance and community-related features, such as member of the Communist Party of China (6th; 9th) and supporting charity (9th; 14th), are also prominent. For ESG rank prediction (Table 3), governance-oriented variables took precedence. Member of the Communist Party of China (SHAP: 1st; PFI: 1st), CSR training (2nd; 7th), and quality system certification (3rd; 2nd) topped both rankings. Additionally, indicators of operational capacity (number of patents, inventory, total revenue) and employee welfare (employee participation (stock ownership), employee benefits) appeared across the top 25 features.
Figure 5 visualizes two sample-level explanations using SHAP summary plots. Red and blue arrows indicate the positive and negative contributions of each feature to the ESG score or rank. The baseline (gray marker) reflects the dataset-wide average, while the cumulative effect of each feature defines the final prediction.
A sectoral comparison between manufacturing and non-manufacturing firms was also conducted. As shown in Table 4 and Table 5, number of patents remained the top feature in both sectors. However, environmental indicators such as pollutant emissions and measures to reduce the three wastes were among the top predictors only in the manufacturing sector, while governance and CSR activities (e.g., CSR report pages, CSR training) were more prominent in the non-manufacturing sector. Financial indicators such as operating net cash flow, total revenue, and return on total asset showed relevance in both cases, with slight differences in ranking across sectors.

5. Discussion

The results demonstrate the superior predictive accuracy of the random forest model over traditional linear regression, supporting findings from prior literature that emphasize the suitability of non-linear, ensemble-based methods for ESG modeling [54]. The high R2 values achieved by the random forest model (0.826 for ESG score and 0.825 for ESG rank) confirm that complex, potentially nonlinear relationships among ESG indicators and firm characteristics are better captured by flexible machine learning techniques.
Building on this methodological validation, the specific feature importance rankings reveal several strategic insights. From a business strategy perspective, the prominence of features such as number of patents, Pollutant emissions, and CSR training suggests that firms investing in innovation and sustainability infrastructure tend to receive higher ESG evaluations. This underscores the alignment between ESG performance and long-term corporate value creation, particularly in industries with strong regulatory or reputational exposure. The high importance of CSR training and CSR report pages highlights the role of internal capacity building and external transparency in shaping ESG outcomes.
Beyond these conventional ESG drivers, our analysis reveals distinctively context-specific patterns that differentiate Chinese firms from Western counterparts. Most notably, social-related indicators such as the member of the Communist Party of China and quality system certifications played a significant role in predicting ESG rankings. These results align with existing research emphasizing institutional legitimacy and compliance (e.g., [68]), providing empirical support for the notion that political and institutional embeddedness serve as a key element of ESG performance in economies with strong government intervention.
The institutional distinctiveness of these findings becomes even more pronounced when compared with existing research. While David et al. [53] emphasized environmental stewardship, social inclusivity, and ethical governance as priorities for Chinese firms using Bloomberg ESG indicators, our China-specific data reveals substantially different patterns that better reflect local institutional characteristics.
Most striking is the prominence of Communist Party membership as a diversity indicator, suggesting that Party members’ presence on boards translates into superior ESG performance. This contrasts fundamentally with Western-oriented studies emphasizing female executive representation [69,70,71], reflecting the unique role of the Communist Party in China’s socialist market economy and ESG governance systems. These discoveries, which align well with the Chinese context discussed in Section 2.2 of this paper, constitute important empirical evidence demonstrating how ESG performance determinants can vary according to country-specific and institution-specific contexts.
These institutional differences are further nuanced by sectoral variations. The distinction between manufacturing and non-manufacturing sectors provides additional insight into the heterogeneity of ESG determinants. In manufacturing, environmental indicators carry greater weight—likely due to higher carbon footprints and industry-specific regulations—while non-manufacturing firms are assessed more heavily on governance transparency, disclosure practices, and employee engagement. This sectoral divergence confirms the importance of industry-aware ESG modeling. Furthermore, the presence of variables related to employee participation, gender representation, and voluntary social contributions suggests that broader stakeholder-oriented practices are increasingly incorporated into ESG assessments.
From both regulatory and methodological perspectives, these findings offer important implications. The results suggest that policy instruments encouraging CSR activities, environmental certifications, and innovation disclosures may positively affect ESG evaluations, while the interpretability achieved through SHAP and PFI facilitates greater transparency for investors and regulators alike. These patterns align with prior machine learning research in ESG contexts while extending the literature through our systems-oriented approach that integrates financial, social, and environmental variables into a unified, interpretable framework. Practically, the proposed modeling framework can serve as a transferable structure for ESG analysis beyond the Chinese context, enabling its use by firms, analysts, or policymakers.
Importantly, the study provides empirical validation for multiple findings from the literature review. First, the relevance of financial strength indicators such as total assets and operating net cash flow aligns with the resource-based view and slack resource theory [14,40], indicating that resource-abundant firms are better positioned to invest in ESG. Second, the strong influence of non-financial features such as CSR training, quality system, and pollutant emissions supports claims that corporate governance and environmental responsibility are critical to ESG outcomes [29,33]. Third, the application of SHAP and PFI directly addresses recent criticisms in the literature regarding the lack of interpretability and variable integration in ML-based ESG models [49,59], thereby responding to the need for explainable models raised in Section 2.3. Moreover, this study offers a focused contribution to ESG research in the Chinese context, where ESG evaluation opacity has been widely criticized [12,52]. By utilizing the most comprehensive ESG dataset for Chinese firms and applying interpretable modeling techniques, this study contributes to increasing transparency and contextual relevance. The sector-specific analysis of ESG determinants further addresses the call for more nuanced, industry-aware frameworks [58,72].
Collectively, this study advances ESG research by demonstrating how context-specific institutional factors fundamentally shape performance determinants while providing methodological innovations through interpretable machine learning frameworks. While prior research has often focused on prediction accuracy alone, the dual application of SHAP and PFI in this study enables both high-performing predictions and clear explanatory insight—features that are increasingly critical for ESG-related decision-making in business, regulation, and investment. However, several limitations must be acknowledged that point toward important avenues for future research. The study is limited to Chinese listed firms, which may restrict the generalizability of the findings due to cultural, institutional, and regulatory specificities. Additionally, correlations among ESG features may influence interpretability scores, particularly in the presence of multicollinearity. The static nature of annual data also constrains the dynamic analysis of ESG trajectories over time. Future research could address these issues by incorporating longitudinal data and testing the framework in other country contexts.

6. Conclusions

Adopting a systems-oriented perspective, we integrate SHAP and PFI explainable artificial intelligence methods into a machine learning framework to identify the determinants of ESG performance in China. Unlike most existing research that relies on opaque “black box” models, this study presents complex interactions among various variables, including CSR-related activity indicators and financial metrics, in a transparent and interpretable manner. This systemic approach particularly addresses the lack of transparency in global ESG evaluation methods for Chinese firms while clearly demonstrating how China’s unique industrial, economic, and cultural contexts influence ESG performance.
Through a comprehensive, systemic integration of financial and non-financial determinants, we reveal the interactive relationships between corporate resources and CSR activities in determining ESG performance within China’s distinct social, cultural, and regulatory environment. This contrasts sharply with traditional fragmented analyses and substantially advances theoretical understanding by elucidating how corporate resources and CSR activities collectively influence ESG outcomes.
Analysis of data from 1608 Chinese listed companies extracted from CNRDS and CSMAR databases spanning 2009–2021 demonstrates that random forest models exhibit superior predictive accuracy compared to traditional linear models. Employing XAI techniques further clarified the influence of key ESG determinants such as innovation capability, governance structures, and environmental initiatives. Industry-specific comparative analysis revealed that ESG evaluation is inherently context-dependent, emphasizing the need for industry-tailored ESG strategies to align effectively with differing regulatory and stakeholder expectations.
This study offers three academic contributions from a systems perspective. First, it develops a comprehensive ESG determinants model that considers interactive effects among diverse financial and non-financial factors. Second, it significantly advances methodological rigor by employing XAI techniques that improve interpretability and transparency beyond prediction accuracy, directly addressing limitations identified in recent research. Third, it provides important insights for global supply chain sustainability discourse by systematically analyzing the contextual nuances of ESG evaluations within distinctive institutional environments.
Practically, this study offers tangible benefits to stakeholders through its systems-oriented approach and transparent evaluation framework. Multinational corporations sourcing from China can proactively manage supply chain sustainability risks and bolster resilience by closely monitoring the key ESG determinants identified in our model. For example, firms might implement annual performance metrics based on patent counts, pollutant emissions, and CSR training hours, or incorporate contractual provisions requiring Chinese partners to meet specified targets (e.g., minimum CSR training hours and percentage reductions in greenhouse-gas emissions). Investors can enhance the accuracy of strategic decision making and risk management based on key factors driving Chinese firms’ ESG performance. For instance, to improve ESG scores of Chinese companies within investment portfolios, investors can construct ESG performance dashboards utilizing financial and non-financial data (CSR investment ratios relative to operating cash flow, quality system certification status) for periodic monitoring, thereby increasing investment decision accuracy while simultaneously reducing risk. Regulators and policymakers can draw on our findings to refine ESG disclosure standards and assessment methodologies that account for industry and regional specificities. Examples may include mandating the inclusion factors identified in this study—such as Communist Party membership, quality system certifications, and CSR training completion hours—in annual sustainability reports and requiring the use of standardized reporting templates to ensure consistency and comparability. Meanwhile, Chinese firms can leverage the key ESG performance determinants to set targeted objectives and allocate resources more strategically. For instance, manufacturers could prioritize emission-reduction initiatives, while non-manufacturers focus on enhancing governance transparency. By aligning corporate ESG strategies with industry-specific priorities, companies can simultaneously strengthen their sustainability performance and competitive position.
Nevertheless, several critical limitations are acknowledged. First, this research focuses on analyzing associations rather than establishing clear causal relationships, necessitating future research employing more rigorous causal analytical methodologies. Additionally, since this study was conducted within China’s specific geographical and cultural context for analyzing Chinese firms’ ESG performance determinants, applying this systemic approach to other institutional contexts or economies with varying regulatory environments could enhance the model’s robustness and practical utility. Third, the study period from 2009 to 2021 was determined primarily due to data availability constraints. Future research should update the dataset to include more recent years, thereby extending the timeframe and enhancing the robustness of our findings. Finally, while we partially addressed static analysis limitations by using annual data to capture multi-year dynamic aspects of ESG performance determinants, future research should utilize real-time ESG event data and macroeconomic variables to enable more dynamic analysis of temporal changes in ESG determinants.

Author Contributions

Conceptualization, H.K. and M.L.; methodology, M.L.; software, M.L.; validation, H.K. and M.L.; formal analysis, M.L.; investigation, H.K. and M.L.; resources, H.K. and M.L.; data curation, H.K.; writing—original draft preparation, H.K. and M.L.; writing—review and editing, H.K. and M.L.; visualization, M.L.; supervision, H.K.; project administration, H.K. and M.L. All authors have read and agreed to the published version of the manuscript.

Funding

This research received no external funding.

Data Availability Statement

The authors do not have permission to share data.

Conflicts of Interest

The authors declare no conflicts of interest.

Appendix A

Appendix A.1. Variables Used in the Study

Table A1. Variables used in the study.
VariableCategoryVariableDescriptionTypeTimeSource
ESG Performance ESG ScoreAnnual firm-level ESG scores as reported in CNRDS NumericaltChinese Research Data Services (CNRDS)
ESG RankAnnual firm-level ESG ranks as reported in CNRDS Numerical
Financial FeaturesCashCash account values as recorded in the China Stock Market and Accounting Research (CSMAR) databaseNumericalt − 1China Stock Market and Accounting Research (CSMAR)
database
InventoryInventory account values as recorded in the CSMAR databaseNumerical
Total AssetsTotal assets as reported in the CSMAR databaseNumerical
Total RevenueTotal revenue as reported in the CSMAR databaseNumerical
Operating Net Cash FlowOperating net cash flow values as recorded in the CSMAR databaseNumerical
Return on Total AssetsReturn on total assets (ROA) as reported in the CSMAR databaseNumerical
Non-financial FeaturesSocietyDiversityMember of the Communist Party of ChinaWhether there are party members among the directors, supervisors and senior management. 1 if yes, 0 if no.Binaryt − 1Chinese Research Data Services (CNRDS)
Female board seatsWomen hold four or more board seats. 1 if yes, 0 if no.Binary
Female senior managementThe company’s senior management team includes at least one woman. 1 if yes, 0 if noBinary
Innovative human resources projectsWhether the company has innovative human resources programs for people with disabilities/released prisoners, or has a good reputation in hiring people with disabilities and released prisoners. 1 if yes, 0 if no.Binary
No female executives *1 if there are no women among the directors, supervisors, or executives, otherwise 0Binary
Employee relationsEmployee participation (stock ownership)Whether the company strongly encourages employees to participate in or own company ownership through stock options; share in the profits, own shares, share financial information, or participate in making management decisions; or the company has established a compensation incentive mechanism. A value of 1 indicates that the company does so, while a value of 0 indicates that it does not.Binary
Employee benefitsWhether the company has very good retirement and other benefit programs. 1 if yes, 0 if noBinary
Safety management systemWhether the company has adopted a safety production management system. 1 if yes, 0 if noBinary
Safety trainingWhether the company has conducted safety production training. 1 if yes, 0 if no.Binary
Occupational safety certificationWhether the company has conducted occupational safety certification. 1 if yes, 0 if noBinary
Professional trainingWhether the company provides professional training for employees, 1 if yes, 0 if no.Binary
Employee communication channelsWhether the company has good communication channels for employees to convey their opinions or suggestions to senior management, 1 if yes, 0 if no.Binary
Employee safety disputes *1 if the company has recently paid large fines or civil damages for violating employee health and safety guidelines, or if the company has been involved in major health and safety disputes, otherwise 0Binary
Layoffs *1 if the company has carried out a large number of redundancies in recent years, 0 otherwise.Binary
Product qualityQuality systemWhether the company has a product quality management system; if so, 1; if not, 0Binary
After-sales serviceWhether the company is constantly improving its aftersales service; if so, 1; if not, 0Binary
Customer satisfaction surveyWhether the company has conducted a customer satisfaction survey, so 1, no 0Binary
Quality awardsWhether the company has obtained certifications and honors in terms of product quality, so 1, no 0Binary
Anti-corruption measuresWhether the company has anticommercial bribery measures or anticorruption measures. 1 if yes, 0 if noBinary
Strategy sharedWhether the company has established a strategy sharing mechanism and platform with its business partners, including long-term strategic cooperation agreements, shared experimental bases, shared databases, and stable communication and exchange platforms.Binary
Integrity in business philosophyWhether the company has the concept and system guarantee of integrity management and fair competition.Binary
Number of patentsThe total number of patents independently and jointly obtained by the company in the current yearNumerical
Product dispute *Whether the company has recently been involved in major disputes or regulatory actions due to product or service safety issues, and has paid substantial fines or civil damages. 1 if yes, 0 if noBinary
GovernanceCharity, volunteer activities and social controversiesSupporting educationWhether the company has supported education, such as starting a school, donating to Project Hope, sponsoring poor students, etc. 1 if yes, 0 if noBinary
Supporting charityWhether the company has projects that support charitable giving. For example, the company establishes its own charitable foundation, or cooperates with other organizations to promote charitable causes. A value of 1 indicates that the company has such projects, while a value of 0 indicates that it does not.Binary
Volunteer activities Whether the company has outstanding volunteer activities. A value of 1 indicates that the company has such activities, while a value of 0 indicates that it does not.Binary
International assistanceWhether the company has provided aid to foreign countries. A value of 1 indicates that the company has such activities, while a value of 0 indicates that it does not.Binary
Employment generationWhether the company has policies or measures to promote employment and has implemented them accordingly. A value of 1 indicates that the company has implemented such policies or measures, while a value of 0 indicates that the company has not.Binary
Boost the local economyWhether the company’s operations contribute to the economic development of the local community, as well as policies and measures that drive local economic development, such as localized procurement policies and localized employment policies.Binary
Total amount of donationsThe total amount of charitable donations (unit: 10,000 RMB)Numerical
Financing disputes *Whether the company has disputes and controversies over loans or investments, 1 if yes, 0 if noBinary
GovernanceCSR columnWhether the company homepage has a CSR column, 1 for yes, 0 for noBinary
CSR report pagesThe total number of CSR report pages (unit: pages)Numerical
CSR leader agencyWhether the company has established a CSR leadership organization or a clear CSR department in charge, 1 for yes, 0 for noBinary
CSR visionWhether the company has a concept, vision or values of being responsible for the economy, society and the environment. 1 if yes, 0 if noBinary
CSR trainingCSR training has been carried out. 1 if yes, 0 if noBinary
Reliability guaranteeReliability assurance of CSR report. 1 if yes, 0 if noBinary
Accounting irregularities *If there are accounting violations, 1 if present, 0 if notBinary
EnvironmentEnvironmental performanceEnvironmentally beneficial productsWhether the company has developed or used innovative environmentally beneficial products, equipment or technologies. A value of 1 indicates that the company has done so; a value of 0 indicates that it has notBinary
Measures to reduce the three wastesWhether the company’s policies, measures or technologies to reduce emissions of waste gas, waste water, waste residue and greenhouse gases. 1 if yes, 0 if noBinary
Circular economyWhether the company’s policies and measures to use renewable energy or adopt a circular economy. 1 if yes, 0 if noBinary
Energy savingWhether the company has policies, measures or technologies to conserve energy. 1 if yes, 0 if noBinary
Green officeWhether the company has green office policies or measures, 1 if yes, 0 if noBinary
Environmental certificationWhether the company’s environmental management system is ISO 14001 [73] certified, 1 if yes, 0 if noBinary
Environmental recognitionWhether the company has received environmental recognition or other positive evaluations, 1 if yes, 0 if noBinary
Environmental penalties *if the company has been penalized for environmental violations, 1 is given; if not, 0Binary
Pollutant emissions *if the company has pollutant emissions, 1 is given; if not, 0Binary
* Indicates a negative event.

Appendix A.2. Explainable Artificial Intelligence (XAI) Techniques Applied

To interpret the predictions generated by the model for ESG performance estimation, two explainability techniques were applied: SHapley Additive exPlanations (SHAP) and permutation feature importance (PFI). This appendix provides a detailed account of the mathematical foundations and computational procedures of each technique.
SHAP values, proposed by Lundberg and Lee [62], are grounded in cooperative game theory through the concept of Shapley values [63]. For a given instance, SHAP assigns each feature i N a value ϕ i , which reflects its marginal contribution to the model prediction f x . The Shapley value is computed according to the following equation:
ϕ i = S N \ { i } S ! N S 1 ! N ! f x S i f x S ,
In this expression, N denotes the complete set of features, S is any subset of N excluding feature i, f x S represents the model’s prediction using only the features in subset S, and f x ( S i ) represents the prediction when feature i is added to the subset. This formulation captures the average marginal effect of a feature across all possible coalitions, ensuring consistency and fairness in attribution.
To reduce the computational burden of calculating SHAP values in ensemble models such as random forests, this study employs the TreeSHAP algorithm introduced by Lundberg et al. [64]. TreeSHAP leverages the internal structure of decision trees to compute exact Shapley values in polynomial time, thereby retaining theoretical guarantees while improving efficiency. For global feature importance, the mean absolute SHAP value is calculated for each feature across all observations. Specifically, the global importance score I j of feature j is given by:
I j = 1 n i = 1 n ϕ j i ,
where ϕ j i is the SHAP value of feature j for the i-th instance, and n denotes the total number of observations. This aggregation captures the overall contribution of a feature by summarizing its effect across the dataset.
In addition to SHAP, permutation feature importance (PFI), introduced by Breiman [65], was applied to assess the sensitivity of the model’s performance to each input feature. PFI quantifies the importance of a feature by measuring the change in prediction accuracy when its values are randomly permuted, thereby disrupting its relationship with the target variable. The importance score I j P F I for feature j is computed as:
I j P F I = 1 M i = 1 M Metric baseline M e t r i c p e r m u t e d j ( m ) ,
Here, MMM is the number of random permutations, set to 30 in this study to ensure result stability. Metric baseline represents the model’s performance on the original dataset, while M e t r i c p e r m u t e d j ( m ) is the performance after the m-th permutation of feature j. For the performance metric, the mean absolute percentage error (MAPE) was used, defined as:
M A P E = 1 n i = 1 n y i y ^ i y i × 100 .
A large increase in MAPE following permutation indicates that the feature plays a critical role in model accuracy, whereas a negligible change suggests weak or redundant predictive power.
While SHAP provides local, instance-specific explanations that decompose individual predictions into feature contributions, PFI offers a global view by directly assessing the model’s dependency on each feature. Although PFI can be biased in the presence of correlated variables—since permutation of one feature can indirectly affect others—it remains a practical tool for gauging overall feature relevance. In this study, SHAP values were computed using the TreeExplainer module from the SHAP Python package, and PFI was implemented through repeated shuffling of feature columns followed by performance evaluation. The combined application of SHAP and PFI allows for a robust and comprehensive analysis of feature importance, capturing both the local dynamics and global structure of the model’s behavior.

References

  1. Heinzer, I.; Mezzanzanica, A. Does a Company’s ESG Score Have a Measurable Impact on Its Market Value? Deloitte 2023. Available online: https://www.deloitte.com/ch/en/services/financial-advisory/research/does-a-company-esg-score-have-a-measurable-impact-on-its-market-value.html (accessed on 16 March 2025).
  2. Lloyd, S. Adoption of Global Sustainability Disclosure Standards Gains Steam Around the World. Thomson Reuters. 2024. Available online: https://www.thomsonreuters.com/en-us/posts/esg/forum-global-sustainability-disclosure-standards/ (accessed on 5 July 2025).
  3. Chen, S.; Fan, M. ESG ratings and corporate success: Analyzing the environmental governance impact on Chinese companies’ performance. Front. Energy Res. 2024, 12, 1371616. [Google Scholar] [CrossRef]
  4. Cicchiello, A.F.; Marrazza, F.; Perdichizzi, S. Non-financial disclosure regulation and environmental, social, and governance (ESG) performance: The case of EU and US firms. Corp. Soc. Responsib. Environ. Manag. 2023, 30, 1121–1128. [Google Scholar] [CrossRef]
  5. Porteous, A.H.; Rammohan, S.V.; Lee, H. Carrots or Sticks? Improving Social and Environmental Compliance at Suppliers Through Incentives and Penalties. Prod. Oper. Manag. 2015, 24, 1402–1413. [Google Scholar] [CrossRef]
  6. Villena, V.H. The Missing Link? The Strategic Role of Procurement in Building Sustainable Supply Networks. Prod. Oper. Manag. 2019, 28, 1149–1172. [Google Scholar] [CrossRef]
  7. van Kemenade, A.; Shukla, A.; Jin, Y.; McCafferty, G.; Lim, H.; Simms, A. ESG Priorities in China: How Companies in China Are Approaching ESG. Economist Impact. 2023. Available online: https://www.fidelity.com.cn/media/PDF/esg/esg-priorities-in-china-en.pdf (accessed on 3 July 2025).
  8. Tian, Y. Will Informal Institutions Affect ESG Rating Divergence? Evidence from Chinese Confucian Culture. Sustainability 2024, 16, 9951. [Google Scholar] [CrossRef]
  9. Tang, T.; Yang, L. Shaping Corporate ESG Performance: Role of Social Trust in China’s Capital Market. China Financ. Rev. Int. 2024, 14, 34–75. [Google Scholar] [CrossRef]
  10. Shen, H.; Lin, H.; Han, W.; Wu, H. ESG in China: A Review of Practice and Research, and Future Research Avenues. China J. Account. Res. 2023, 16, 100325. [Google Scholar] [CrossRef]
  11. Zhu, Y.; Yang, H.; Zhong, M. Do ESG Ratings of Chinese Firms Converge or Diverge? A Comparative Analysis Based on Multiple Domestic and International Ratings. Sustainability 2023, 15, 12573. [Google Scholar] [CrossRef]
  12. Berg, F.; Kölbel, J.; Rigobon, R. Aggregate confusion: The divergence of ESG ratings. Rev. Financ. 2022, 26, 1315–1344. [Google Scholar] [CrossRef]
  13. Khalil, M.A.; Khalil, R.; Khalil, M.K. Environmental, social and governance (ESG)-augmented investments in innovation and firms’ value: A fixed effects panel regression of Asian economies. China Financ. Rev. Int. 2024, 14, 76–102. [Google Scholar] [CrossRef]
  14. Crespi, F.; Migliavacca, M. The determinants of ESG rating in the financial industry: The same old story or a different tale? Sustainability 2020, 12, 6398. [Google Scholar] [CrossRef]
  15. Santamaria, R.; Paolone, F.; Cucari, N.; Dezi, L. Non-financial strategy disclosure and environmental, social and governance score: Insight from a configurational approach. Bus. Strategy Environ. 2021, 30, 1993–2007. [Google Scholar] [CrossRef]
  16. Friede, G.; Busch, T.; Bassen, A. ESG and financial performance: Aggregated evidence from more than 2000 empirical studies. J. Sustain. Financ. Invest. 2015, 5, 210–233. [Google Scholar] [CrossRef]
  17. Orlitzky, M.; Schmidt, F.; Rynes, S. Corporate Social and Financial Performance: A Meta-analysis. Organ. Stud. 2003, 24, 403–441. [Google Scholar] [CrossRef]
  18. Zhao, Y.H.; Elahi, E.; Khalid, Z.; Sun, X.; Sun, F. Environmental, Social and Governance Performance: Analysis of CEO Power and Corporate Risk. Sustainability 2023, 15, 1471. [Google Scholar] [CrossRef]
  19. Baratta, A.; Cimino, A.; Longo, F.; Solina, V.; Verteramo, S. The Impact of ESG Practices in Industry with a Focus on Carbon Emissions: Insights and Future Perspectives. Sustainability 2023, 15, 6685. [Google Scholar] [CrossRef]
  20. Chasiotis, I.; Gouopoulos, D.; Konstantios, D.; Ratsika, V. ESG Reputational Risk, Corporate Payouts and Firm Value. Br. J. Manag. 2024, 35, 871–892. [Google Scholar] [CrossRef]
  21. Brogi, M.; Lagasio, V.; Porretta, P. Be good to be wise: Environmental, Social, and Governance awareness as a potential credit risk mitigation factor. J. Int. Financ. Manag. Account. 2022, 33, 522–547. [Google Scholar] [CrossRef]
  22. Fandella, P.; Sergi, B.S.; Sironi, E. Corporate social responsibility performance and the cost of capital in BRICS countries. The problem of selectivity using environmental, social and governance scores. Corp. Soc. Responsib. Environ. Manag. 2023, 30, 1712–1722. [Google Scholar] [CrossRef]
  23. Ferri, S.; Tron, A.; Colantoni, F.; Savio, R. Sustainability Disclosure and IPO Performance: Exploring the Impact of ESG Reporting. Sustainability 2023, 15, 5144. [Google Scholar] [CrossRef]
  24. Quintana-García, C.; Marchante-Lara, M.; Benavides-Chicón, C.G. Towards sustainable development: Environmental innovation, cleaner production performance, and reputation. Corp. Soc. Responsib. Environ. Manag. 2022, 29, 1330–1340. [Google Scholar] [CrossRef]
  25. Zheng, Y.; Wang, B.; Sun, X.; Li, X. ESG performance and corporate value: Analysis from the stakeholders’ perspective. Front. Environ. Sci. 2022, 10, 1084632. [Google Scholar] [CrossRef]
  26. Lian, Y.; Li, Y.; Cao, H. How does corporate ESG performance affect sustainable development: A green innovation perspective. Front. Environ. Sci. 2023, 11, 1170582. [Google Scholar] [CrossRef]
  27. Zhang, Q.; Loh, L.; Wu, W. How do Environmental, Social and Governance Initiatives Affect Innovative Performance for Corporate Sustainability? Sustainability 2020, 12, 3380. [Google Scholar] [CrossRef]
  28. Zhou, S.; Rashid, M.H.U.; Mohd. Zobair, S.A.; Sobhani, F.A.; Siddik, A.B. Does ESG Impact Firms’ Sustainability Performance? The Mediating Effect of Innovation Performance. Sustainability 2023, 15, 5586. [Google Scholar] [CrossRef]
  29. Lewellyn, K.B.; Muller-Kahle, M. ESG leaders or laggards? A configurational analysis of ESG performance. Bus. Soc. 2023, 63, 1149–1202. [Google Scholar] [CrossRef]
  30. Lisin, A.; Kushnir, A.; Koryakov, A.G.; Fomenko, N.L.; Shchukina, T.V. Financial stability in companies with high ESG scores: Evidence from North America using the Ohlson O-score. Sustainability 2022, 14, 479. [Google Scholar] [CrossRef]
  31. Beji, R.; Yousfi, O.; Lukil, N.; Omri, A. Board Diversity and Corporate Social Responsibility: Empirical Evidence from France. J. Bus. Ethics 2021, 173, 133–155. [Google Scholar] [CrossRef]
  32. Govindan, K.; Kilic, M.; Uyar, A.; Karaman, A. Drivers and Value-Relevance of CSR Performance in the Logistics Sector: A Cross-Country Firm-Level Investigation. Int. J. Prod. Econ. 2021, 231, 107835. [Google Scholar] [CrossRef]
  33. Sierra-García, L.; Zorio-Grima, A.; García-Benau, M.A. Stakeholder Engagement, Corporate Social Responsibility and Integrated Reporting: An Exploratory Study. Corp. Soc. Responsib. Environ. Manag. 2013, 22, 286–304. [Google Scholar] [CrossRef]
  34. Alsayegh, M.F.; Abdul Rahman, R.; Homayoun, S. Corporate Economic, Environmental, and Social Sustainability Performance Transformation through ESG Disclosure. Sustainability 2020, 12, 3910. [Google Scholar] [CrossRef]
  35. Ioannou, I.; Serafeim, G. The Consequences of Mandatory Corporate Sustainability Reporting. In The Oxford Handbook of Corporate Social Responsibility: Psychological and Organizational Perspectives; McWilliams, A., Siegel, D., Wright, C., Eds.; Oxford University Press: Oxford, UK, 2019; Chapter 20. [Google Scholar] [CrossRef]
  36. Lokuwaduge, C.S.D.S.; Heenetigala, K. Integrating Environmental, Social and Governance (ESG) Disclosure for a Sustainable Development: An Australian Study. Bus. Strategy Environ. 2017, 26, 438–450. [Google Scholar] [CrossRef]
  37. Barko, T.; Cremers, M.; Renneboog, L. Shareholder Engagement on Environmental, Social, and Governance Performance. J. Bus. Ethics 2022, 180, 777–812. [Google Scholar] [CrossRef]
  38. Cai, Y.; Pan, C.-H.; Statman, M. Why Do Countries Matter So Much in Corporate Social Performance? J. Corp. Financ. 2016, 41, 591–609. [Google Scholar] [CrossRef]
  39. Khaled, R.; Ali, H.; Mohamed, E. The Sustainable Development Goals and Corporate Sustainability Performance: Mapping, Extent and Determinants. J. Clean. Prod. 2021, 311, 127599. [Google Scholar] [CrossRef]
  40. Ma, Y.; Wang, J.; Lv, X. Institutional pressures and firms’ environmental management behavior: The moderating role of slack resources. J. Environ. Plan. Manag. 2023, 66, 2513–2535. [Google Scholar] [CrossRef]
  41. Qi, B.; Yang, Z. Board Group Faultlines, Slack Resource, and Corporate Carbon Performance. Sustainability 2022, 14, 13053. [Google Scholar] [CrossRef]
  42. Hmouda, A.M.O.; Orzes, G.; Sauer, P.C.; Molinaro, M. Determinants of Environmental, Social and Governance Scores: Evidence from the Electric Power Supply Chains. J. Clean. Prod. 2024, 471, 143372. [Google Scholar] [CrossRef]
  43. Walls, J.L.; Hoffman, A.J. Exceptional Boards: Environmental Experience and Positive Deviance from Institutional Norms. J. Organ. Behav. 2013, 34, 253–271. [Google Scholar] [CrossRef]
  44. Haniffa, R.M.; Cooke, T.E. The Impact of Culture and Governance on Corporate Social Reporting. J. Account. Public Policy 2005, 24, 391–430. [Google Scholar] [CrossRef]
  45. Mooneeapen, O.; Abhayawansa, S.; Mamode Khan, N. The Influence of the Country Governance Environment on Corporate Environmental, Social and Governance (ESG) Performance. Sustain. Account. Manag. Policy J. 2022, 13, 953–985. [Google Scholar] [CrossRef]
  46. Chen, Y.-C.; Hung, M.; Wang, Y. The Effect of Mandatory CSR Disclosure on Firm Profitability and Social Externalities: Evidence from China. J. Account. Econ. 2018, 65, 169–190. [Google Scholar] [CrossRef]
  47. Garcia, A.; Mendes-Da-Silva, W.; Orsato, R.J. Sensitive Industries Produce Better ESG Performance: Evidence from Emerging Markets. J. Clean. Prod. 2017, 150, 135–147. [Google Scholar] [CrossRef]
  48. Raza, H.; Khan, M.A.; Mazliham, M.S.; Alam, M.M.; Aman, N.; Abbas, K. Applying artificial intelligence techniques for predicting the environment, social, and governance (ESG) pillar score based on balance sheet and income statement data: A case of non-financial companies of USA, UK, and Germany. Front. Environ. Sci. 2022, 10, 975487. [Google Scholar] [CrossRef]
  49. D’Amato, V.; D’Ecclesia, R.; Levantesi, S. Fundamental ratios as predictors of ESG scores: A machine learning approach. Decis. Econ. Financ. 2021, 44, 1087–1110. [Google Scholar] [CrossRef]
  50. Martiny, A.; Taglialatela, J.; Testa, F.; Iraldo, F. Determinants of Environmental Social and Governance (ESG) Performance: A Systematic Literature Review. J. Clean. Prod. 2024, 456, 142213. [Google Scholar] [CrossRef]
  51. Ortas, E.; Álvarez, I.; Zubeltzu, E. Firms’ Board Independence and Corporate Social Performance: A Meta-Analysis. Sustainability 2017, 9, 1006. [Google Scholar] [CrossRef]
  52. Del Vitto, A.; Marazzina, D.; Stocco, D. ESG ratings explainability through machine learning techniques. Ann. Oper. Res. 2023, 1–30. [Google Scholar] [CrossRef]
  53. David, L.K.; Wang, J.; Angel, V.; Luo, M. China’s ESG Scorecard: A Predictive Machine Learning Model. Corp. Soc. Responsib. Environ. Manag. 2024, 31, 3468–3486. [Google Scholar] [CrossRef]
  54. Chen, Z.; Lu, Z.; Liao, K. Rowing or Crowding? The Nonlinear Effects of State-Owned Capital Participation on ESG Performance in Private Enterprises. Econ. Anal. Policy 2025, 87, 790–810. [Google Scholar] [CrossRef]
  55. Fang, X.; Zhang, X.; Hou, D. Is the ESG Performance of State-Owned Enterprises Becoming a Pivotal Role?—Based on the Empirical Evidence from Chinese Listed Firms. Sustainability 2025, 17, 5072. [Google Scholar] [CrossRef]
  56. Wang, J.; Wang, S.; Dong, M.; Wang, H. ESG Rating Disagreement and Stock Returns: Evidence from China. Int. Rev. Financ. Anal. 2024, 91, 103043. [Google Scholar] [CrossRef]
  57. Bao, X.; Sadiq, M.; Tye, W.B.; Zhang, J. The Impact of Environmental, Social, and Governance (ESG) Rating Disparities on Corporate Risk: The Mediating Role of Financing Constraints. J. Environ. Manag. 2024, 371, 123113. [Google Scholar] [CrossRef]
  58. Lin, H.-Y.; Hsu, B.-W. Empirical study of ESG score prediction through machine learning—A case of non-financial companies in Taiwan. Sustainability 2023, 15, 14106. [Google Scholar] [CrossRef]
  59. Rahman, A.S.A.; Masrom, S.; Rahman, R.A.; Ibrahim, R.; Gilal, A.R. Genetic programming based automated machine learning in classifying ESG performances. IEEE Access 2024, 12, 59612–59629. [Google Scholar] [CrossRef]
  60. Sharma, U.; Gupta, A.; Gupta, S.K. The pertinence of incorporating ESG ratings to make investment decisions: A quantitative analysis using machine learning. J. Sustain. Financ. Invest. 2024, 14, 184–198. [Google Scholar] [CrossRef]
  61. Lee, O.; Joo, H.; Choi, H.; Cheon, M. Proposing an Integrated Approach to Analyzing ESG Data via Machine Learning and Deep Learning Algorithms. Sustainability 2022, 14, 8745. [Google Scholar] [CrossRef]
  62. Lundberg, S.; Lee, S.I. A unified approach to interpreting model predictions. arXiv 2017, arXiv:1705.07874. [Google Scholar]
  63. Shapley, L.S. Stochastic Games. Proc. Natl. Acad. Sci. USA 1953, 39, 1095–1100. [Google Scholar] [CrossRef]
  64. Lundberg, S.M.; Erion, G.G.; Lee, S.I. Consistent Individualized Feature Attribution for Tree Ensembles. arXiv 2018, arXiv:1802.03888. [Google Scholar] [CrossRef]
  65. Breiman, L. Random forests. Mach. Learn. 2001, 45, 5–32. [Google Scholar] [CrossRef]
  66. Lin, N.; Lin, S.; Zhang, P.; Zhang, Q. Provincial industrial policy and corporate emissions: Evidence from China. J. Int. Financ. Manag. Account. 2025; forthcoming. Available online: https://onlinelibrary.wiley.com/doi/abs/10.1111/jifm.12229 (accessed on 29 June 2025). [CrossRef]
  67. He, C.; Jia, F.; Wang, L.; Chen, L.; Fernandes, K. The impact of corporate social responsibility decoupling on financial performance: The role of customer structure and operational slack. Int. J. Oper. Prod. Manag. 2023, 43, 1859–1890. [Google Scholar] [CrossRef]
  68. Li, T.T.; Wang, K.; Sueyoshi, T.; Wang, D.D. ESG: Research progress and future prospects. Sustainability 2021, 13, 11663. [Google Scholar] [CrossRef]
  69. Hafsi, T.; Turgut, G. Boardroom Diversity and Its Effect on Social Performance: Conceptualization and Empirical Evidence. J. Bus. Ethics 2013, 112, 463–479. [Google Scholar] [CrossRef]
  70. Arayssi, M.; Dah, M.; Jizi, M. Women on Boards, Sustainability Reporting and Firm Performance. Sustain. Account. Manag. Policy J. 2016, 7, 376–401. [Google Scholar] [CrossRef]
  71. Słomka-Gołębiowska, A.; De Masi, S.; Zambelli, S.; Paci, A. Towards Higher Sustainability: If You Want Something Done, Ask a Chairwoman. Financ. Res. Lett. 2023, 58, 104308. [Google Scholar] [CrossRef]
  72. Tarmuji, I.; Maelah, R.; Tarmuji, N.H. The impact of environmental, social and governance practices (ESG) on economic performance: Evidence from ESG score. Int. J. Trade Econ. Financ. 2016, 7, 67–74. [Google Scholar] [CrossRef]
  73. ISO 14001; Environmental Management Systems—Requirements with Guidance for Use. International Organization for Standardization: Geneva, Switzerland, 2015.
Figure 1. Overview of the analytical methodology.
Systems 13 00578 g001
Figure 2. CNRDS 2009–2021 ESG Scores: ESG score histograms by industry sector.
Systems 13 00578 g002
Figure 3. Summary of CNRDS dataset used in the study (based on [67]).
Systems 13 00578 g003
Figure 4. Missing data: distribution of the feature population (1.0 = 100% refers to the features without missing values, while 0 refers to the empty ones).
Systems 13 00578 g004
Figure 5. Two RF’s predictions interpretations (Left: ESG score, Right: ESG rank).
Systems 13 00578 g005
Table 1. Number of features and samples, and how the samples are split in each training and test set.
Features (Financial)Features (Non-Financial)Samples-TotalSamples-Train (80%)Samples-Test (20%)
Total648644751581289
Manufacturing64833332666667
Non-manufacturing64831142491623
Table 2. Exploratory indicators for ESG score in the random forest model (top 25 features).
ESG Score
RankMean Absolute SHAPPermutation Feature Importance
1Number of patentsS1.74266Number of patentsS0.422643
2Total AssetsF0.855732CSR trainingF0.167886
3Pollutant emissionsE0.832052Pollutant emissionsE0.163459
4CSR trainingG0.779826Total AssetsG0.160654
5Total amount of donationsS0.674143InventoryS0.149073
6Member of the Communist Party of ChinaS0.661451Total amount of donationsS0.143337
7Measures to reduce the three wastesE0.646329CashE0.126472
8InventoryF0.599417Measures to reduce the three wastesF0.125692
9Supporting charityG0.588065Member of the Communist Party of ChinaG0.124322
10CashF0.583546Total RevenueF0.119035
11Operating Net Cash FlowF0.523641Operating Net Cash FlowF0.1154
12CSR report pagesG0.489355CSR report pagesG0.115086
13Return on Total AssetF0.477658Return on Total AssetF0.112074
14Total RevenueF0.444592Supporting charityF0.0984276
15Employment generationG0.331092CSR columnG0.0415728
16CSR columnG0.276555Employment generationG0.0395218
17Environmental certificationE0.274086Safety management systemE0.0341658
18Environmental recognitionE0.200331Quality systemE0.0300699
19Quality systemS0.184208Environmental recognitionS0.0233895
20Safety management systemS0.181707Environmental certificationS0.0199159
21Safety trainingS0.178463Financing disputesS0.0184858
22Quality awardsS0.160327Female senior managementS0.0183731
23Number of patentsS1.74266Safety trainingS0.0172071
24Total AssetsF0.855732Supporting educationF0.0161966
25Pollutant emissionsE0.832052Employee communication channelsE0.0161184
Note: F = financial feature, E = environmental feature, S = social feature, G = governance feature.
Table 3. Exploratory indicators for ESG rank in the random forest model (top 25 features).
ESG Rank
RankMean Absolute SHAPPermutation Feature Importance
1Member of the Communist Party of ChinaS111.517Member of the Communist Party of ChinaS0.305326
2CSR trainingG69.6411Quality systemG0.228257
3Quality systemS68.4796Number of patentsS0.19466
4Number of patentsS65.9659InventoryS0.15933
5Total amount of donationsG58.131Total RevenueG0.156924
6InventoryF 56.6408Total AssetsF 0.155962
7Measures to reduce the three wastesE55.2762CSR trainingE0.154597
8CashF 55.2046Return on Total AssetF 0.154056
9Total RevenueF55.2001Total amount of donationsF0.146728
10Total AssetsF54.7308CashF0.143121
11Return on Total AssetF52.5459Measures to reduce the three wastesF0.133377
12Pollutant emissionsE51.2728Operating Net Cash FlowE0.130985
13Employee participation (stock ownership)S44.0143Pollutant emissionsS0.106161
14Operating Net Cash FlowF42.9649CSR report pagesF0.067136
15Employee benefitsS32.78Employee participation (stock ownership)S0.064002
16Supporting charityG28.2561Supporting charityG0.054323
17CSR report pagesG24.1889Employee benefitsG0.053619
18Volunteer activitiesG19.7836Strategy sharedG0.030886
19Energy savingE16.1273Energy savingE0.025813
20Circular economyE14.5797Green officeE0.022999
21Green officeE12.7173Circular economyE0.02092
22CSR leader agencyG12.2752Volunteer activitiesG0.020497
23Strategy sharedS12.1109Environmentally beneficial productsS0.016302
24Integrity in business philosophyS10.464CSR leader agencyS0.015167
25After-sales serviceS10.3301Female senior managementS0.014861
Note: F = financial feature, E = environmental feature, S = social feature, G = governance feature.
Table 4. Exploratory indicators for ESG score by industry type (top 25 features).
ESG Score
RankManufacturing FirmsNon-Manufacturing Firms
1Number of patentsS2.11471Number of patentsS1.63427
2Supporting charityG1.20173CSR report pagesG0.87808
3Operating Net Cash FlowF1.0444Total amount of donationsF0.620057
4Member of the Communist Party of ChinaS0.896692Total RevenueS0.61991
5Total amount of donationsG0.829836InventoryG0.53834
6CashF 0.804307Return on Total AssetF 0.518472
7CSR report pagesG0.713684CSR trainingG0.467066
8CSR trainingG0.699526CashG0.41838
9InventoryF 0.579346Total AssetsF 0.371522
10Pollutant emissionsE0.457653Operating Net Cash FlowE0.353452
11Total AssetsF0.450299Member of the Communist Party of ChinaF0.265095
12Return on Total AssetF0.442602Measures to reduce the three wastesF0.251654
13Total RevenueF0.361372Financing disputesF0.236631
14Female senior managementS0.322558Occupational safety certificationS0.217014
15CSR columnG0.302507CSR columnG0.18826
16CSR visionG0.297468Environmentally beneficial productsG0.182068
17Measures to reduce the three wastesE0.297438Safety management systemE0.170876
18Environmental recognitionE0.24509CSR visionE0.169513
19Employment generationG0.223482Environmental certificationG0.164461
20Environmentally beneficial productsE0.209439No female executivesE0.158087
21Employee benefitsS0.198984Supporting educationS0.154673
22Supporting educationG0.158466Strategy sharedG0.148178
23Boost the local economyG0.153876Safety trainingG0.14809
24Safety trainingS0.135864Supporting charityS0.130331
25Strategy sharedS0.122036Employee participation (stock ownership)S0.127808
Note: F = financial feature, E = environmental feature, S = social feature, G = governance feature.
Table 5. Exploratory indicators for ESG rank by industry type (top 25 features).
ESG Rank
RankManufacturing FirmsNon-Manufacturing Firms
1Number of patentsS2.11471Number of patentsS1.63427
2Supporting charityG1.20173CSR report pagesG0.87808
3Operating Net Cash FlowF1.0444Total amount of donationsF0.620057
4Member of the Communist Party of ChinaS0.896692Total RevenueS0.61991
5Total amount of donationsG0.829836InventoryG0.53834
6CashF 0.804307Return on Total AssetF 0.518472
7CSR report pagesG0.713684CSR trainingG0.467066
8CSR trainingG0.699526CashG0.41838
9InventoryF 0.579346Total AssetsF 0.371522
10Pollutant emissionsE0.457653Operating Net Cash FlowE0.353452
11Total AssetsF0.450299Member of the Communist Party of ChinaF0.265095
12Return on Total AssetF0.442602Measures to reduce the three wastesF0.251654
13Total RevenueF0.361372Financing disputesF0.236631
14Female senior managementS0.322558Occupational safety certificationS0.217014
15CSR columnG0.302507CSR columnG0.18826
16CSR visionG0.297468Environmentally beneficial productsG0.182068
17Measures to reduce the three wastesE0.297438Safety management systemE0.170876
18Environmental recognitionE0.24509CSR visionE0.169513
19Employment generationG0.223482Environmental certificationG0.164461
20Environmentally beneficial productsE0.209439No female executivesE0.158087
21Employee benefitsS0.198984Supporting educationS0.154673
22Supporting educationG0.158466Strategy sharedG0.148178
23Boost the local economyG0.153876Safety trainingG0.14809
24Safety trainingS0.135864Supporting charityS0.130331
25Strategy sharedS0.122036Employee participation (stock ownership)S0.127808
Note: F = financial feature, E = environmental feature, S = social feature, G = governance feature.
Disclaimer/Publisher’s Note: The statements, opinions and data contained in all publications are solely those of the individual author(s) and contributor(s) and not of MDPI and/or the editor(s). MDPI and/or the editor(s) disclaim responsibility for any injury to people or property resulting from any ideas, methods, instructions or products referred to in the content.

