Abstract
In order to promote the green and low-carbon transformation of the economy and society, as the economic center of the western region of China, Chengdu actively promotes the national green and low-carbon policies. Some specific measures are proposed to develop Chengdu’s low-carbon economy, such as increasing the ownership of new energy vehicles, promoting the development of park cities and increasing the proportion of clean energy and non-fossil energy, etc. So, in order to accurately evaluate Chengdu’s low-carbon economy-development achievements, firstly, this paper uses literature research to construct an evaluation indicator system for the low-carbon economy development of Chengdu city from five dimensions: economy, energy, technology, environment, and transportation. Then, an improved Analytic Hierarchy Process (AHP) method based on judgment matrices is proposed to determine subjective weights of indicators, while Entropy Weight Method (EWM) and Variation Coefficient (VC) method are used to determine objective weights of the evaluation indicators. Finally, the Technique for Order Preference by Similarity to an Ideal Solution (TOPSIS) is used for the multi-indicator comprehensive evaluation of Chengdu’s low-carbon economy development. The evaluation results show that the comprehensive performance of Chengdu’s low-carbon economy has continued to improve from 2018 to 2023, simultaneously, the main influencing factors and weak links are analyzed, and targeted suggestions and strategies for improvement are put forward to promote the low-carbon economy development of Chengdu city.
1. Introduction
1.1. Research Background
The acceleration of global industrialization has intensified human use of traditional fossil fuels, leading to rapid economic development in various countries and the generation of a large amount of greenhouse gas carbon dioxide, resulting in the greenhouse effect [1]. The resulting global climate change has become one of the most serious challenges for human survival and development [2].
In response to the challenge of global climate change, the development of a low-carbon economy has gained recognition worldwide [3]. In 2003, the United Kingdom (UK) government first proposed the concept of a “low-carbon economy” in the energy white paper “Our Energy Future: Creating a Low-Carbon Economy”. The concept of low-carbon economy refers to minimizing natural resource consumption and greenhouse gas emissions as much as possible, achieving “low energy consumption, low pollution, and low emissions” through technological and institutional innovation, guided by the concept of sustainable development [4]. Subsequently, with the release of the synthesis report of the Sixth Assessment Report of the Intergovernmental Panel on Climate Change (IPCC AR6) on August 9, 2021, the world has fully entered the era of “carbon neutrality”, and all countries will strive to achieve carbon neutrality by the middle of this century. This ambitious goal will bring about the transformation of the entire socio-economic system and the arrival of a new round of competition [5]. Meanwhile, the European Union (EU), the UK, and Japan have all launched plans and implementation programs for green and low-carbon industrial development. The EU has proposed the “Green Deal”, setting a strategic target of reducing emissions by 55% by 2030 and becoming the first “carbon-neutral” continent [6]; the UK has put forward the “Green Industrial Revolution” ten-point plan and net-zero emission strategy [7]; Japan has set the goal of “zero carbon” and a green development strategy [8]. Global competition in the low-carbon economy has further intensified, making green and low-carbon development a key driver of global economic prosperity.
As a big manufacturing country, China has experienced rapid growth in its gross domestic product and per capita income [9]. However, as a developing country and the world’s largest carbon dioxide emitter (it accounted for 28.82% of the world’s emissions in 2019) [5], China’s carbon dioxide emissions increased by 750 Mt between 2019 and 2021 [10], so there is enormous pressure on reducing carbon emissions, and China will strive to achieve the “dual carbon” goals of carbon peaking before 2030 and carbon neutrality before 2060 proposed at the 75th General Assembly of the United Nations [11]. In 2022, the Ministry of Ecology and Environment submitted a progress report on targets to the “United Nations Framework Convention on Climate Change”, which shows that China’s carbon emission intensity in 2021 decreased by 3.8% compared to 2020 and a cumulative decrease of 50.8% compared to 2005, obtaining new achievements in controlling carbon emissions [12]. In addition, with the policies and systems related to carbon peaking and carbon neutrality having been improved one after another, the basic ability of China’s “carbon peak and carbon neutrality” work has been significantly enhanced [13,14,15,16].
In short, many countries, such as the EU, the UK, Japan, and China, are trying their best to reduce carbon emissions, and actively promoting the green and low-carbon transformation of the economy and society, to achieve a low-carbon economy characterized by low energy consumption and low emissions [6,7,8,11].
However, the development of a low-carbon economy is a complex system project that involves various fields [17]. Zhuang [18] believed that the essence of a low-carbon economy lies in the efficient utilization of energy resources and the construction of a clean energy resource structure. The main way to achieve a low-carbon economy are energy resource innovation and regulatory innovation. Yan et al. [19] argued that a low-carbon economy is a new economic, technological, and social system. Only by changing the traditional development model, within a framework of sustainable development, resource conservation, improving energy efficiency, optimizing economic structure, adjusting industrial and energy structures, and building a green, low-carbon, and circular development economic system, can we continuously improve people’s livelihoods, enhance their health levels, and ultimately achieve coordinated development of climate action, environmental protection, economy, and society [20]. Mohsin et al. [21] suggested that the development of a low-carbon economy is guided by the concept of sustainable development, with the primary goal of reducing greenhouse gas emissions and carbon emissions, and the low energy consumption and low carbon emissions are the main point of “low-carbon development”.
Therefore, how to effectively develop a low-carbon economy and evaluate its effectiveness is a question worth exploring, and different scholars have conducted in-depth research on this issue from different research perspectives and priorities.
From a literature review, on the one hand, some studies focus on describing the transformation of low-carbon economy strategies, which focus on the macro-level planning and direction setting. For example, Irfan [22] comprehensively studied the possible connections between low-carbon energy strategies and economic growth for developed and developing economies, suggesting that there is an immediate need to mitigate the adverse effect of economic growth on energy efficiency by focusing more on energy savings behavior and practices for developed economies. Hou et al. [23] constructed an overall indicator from four areas: financial and economic viability, political and regulatory position, industrial experience, and resource availability and prospects to define hydrogen export competitiveness globally from 1991 to 2024. The purpose of their study is to provide specific guidance for the effective stimulation of the hydrogen market in the context of global changes in the renewable energy area and sustainable development, and their study also provides practical recommendations for creating a low-carbon economy. Behera et al. [24] used the dynamic fixed effect and cross-sectional autoregressive distributed lag (CS-ARDL) estimation techniques to analyze the impact of the environmental tax, green technology innovation, and biofuel use on emissions in 11 emerging economies from 2004 to 2022. The suggestions of their study include policy mandates for generating second-generation biofuels, modernization of transportation infrastructure through green innovations, and strengthening institutional settings through a decentralized governance system to realize higher benefits and environmental goals. Georgescu et al. [25] investigated the determinants of total carbon dioxide emissions in Latin American countries (LAC), focusing on the roles of renewable energy consumption, per capita regional Gross Domestic Product (GDP), foreign direct investment, urbanization rate, and access to electricity, providing policy recommendations for Latin American governments. Abbass et al. [26] made use of an annual panel dataset that spans N-11 emerging economies, which include countries like Bangladesh, Egypt, Mexico, Pakistan, Nigeria, the Philippines, Indonesia, Turkey, Iran, Vietnam, and the Republic of Korea, from 1990 to 2022, to provide a comprehensive evaluation of foreign direct investment and its correlation with factors like the technological innovation index, energy consumption, economic expansion, and trade transparency in relation to environmental quality. Višković et al. [27] outlined a step-by-step method to build a city-level decarbonization pathway with a focus on renewable energy source deployment. In their study, a method is introduced to quantify the key features of a successful energy system, and an evaluation method is presented that is able to consider both the economic aspects and how certain decarbonization pathways affect energy sustainability and reliability. Zhang et al. [28] delved into the intricate relationship between economic growth and its ecological repercussions by a comprehensive assessment of ecological footprints across 131 nations, while considering factors such as financial growth, urbanization, energy consumption, and foreign direct investment. Their research findings provide essential information for academics and policymakers to help in figuring out how to promote economic development while protecting the environment.
These studies [22,23,24,25,26,27,28] focus on how to achieve low-carbon transformation through policy guidance, industrial adjustment, and other means in the international environment, so as to enhance the country’s competitiveness and position in the global low-carbon economy field.
On the other hand, more studies tend to construct indicator systems and adopt corresponding methods for quantitative evaluation and scientific analysis of low-carbon economy development. By establishing a comprehensive indicator system, the degree and effectiveness of low-carbon economy development can be accurately measured, problems can be identified in a timely manner, and targeted measures can be taken. This will help government and policymakers achieve refined management and precise policy implementation in promoting the low-carbon economy, ensuring that various policies and measures can effectively promote the achievement of low-carbon goals.
However, the key to establishing an effective indicator system for measuring the level and effectiveness of low-carbon economy development lies in accurately identifying various factors that affect low-carbon economy development.
1.2. Evaluation Indicator Systems of Low-Carbon Economy Development
Currently, some literature has studied the low-carbon economy-development indicator system from different levels and perspectives, such as the economic, social, energy, technology, and environmental aspects, to construct a comprehensive indicator system to analyze the low-carbon economy development of countries, regions, and cities [29].
For example, Zhang and Zhang [5] established 40 indicators, including per capita regional GDP, total fixed assets investment, total carbon dioxide emissions, and unemployment rate, from the perspectives of energy, society, technology, economy, and environment to evaluate the low-carbon economy development of 20 countries, reflecting the current status and potential of low-carbon economy development in the future. Linderhof et al. [30] developed a system-dynamic model that included the demographic-economic, energy, and environmental sub-systems of the Netherlands, including indicators such as primary energy demand, GDP, energy intensity per unit of GDP, total carbon dioxide emissions, and the aim of the model is to address how investment subsidies combined with carbon levies could be deployed to support technological mitigation options to achieve a low-carbon economy in the Netherlands in 2050. Mohsin et al. [21] focused on 19 countries with the highest carbon emissions, including the United States, China, Canada, Russia, etc., and from energy security and environmental sustainability, they established a comprehensive set of evaluation indicators including GDP productivity, total carbon dioxide emissions, carbon emission index per unit of energy consumption, etc., to provide a roadmap and guidelines for future policymakers. Zhang et al. [31] constructed a comprehensive evaluation system for the development level of low-carbon economy in cities in the United States, China, Japan, Germany, and Britain from four dimensions: economic development level, environmental quality, energy-consumption emission intensity, and social development speed, with 15 secondary indicators, including per capita regional GDP, per capita public green area, green coverage rate, etc., to provide valuable insights for the development of low-carbon economies in various countries. Kadioglu et al. [32] analyzed the development of the green economy in Turkey between 1990 and 2022 within the framework of certain green economic indicators, including per capita regional GDP, domestic loans granted by banks to the private sector (as a percentage of GDP), total carbon dioxide emissions, electricity production, etc.
In China, Niu et al. [1] studied the socio-economic development of various provinces in China; an evaluation of the carbon neutrality capacity was conducted from six dimensions, such as carbon emission efficiency, energy consumption, socio-economic development, etc., and 20 indicators were constructed, including carbon emission intensity, energy-consumption intensity, per capita regional GDP, etc. The reasons for the differences in carbon neutrality capacity among provinces are analyzed, and corresponding suggestions are proposed for the future implementation path of carbon neutrality. Ye et al. [33] evaluated the development level of the low-carbon circular economy in Sichuan Province of China from six perspectives—economic development, social progress, energy consumption, environmental carrying capacity, etc.—with 30 indicators including per capita regional GDP, research and development (R&D) investment as a percentage of regional GDP, total energy consumption, etc. Based on the evaluation results, policy recommendations are proposed to improve climate change. Lyu et al. [34] constructed an evaluation system for low-carbon ecological cities from three factors that are conducive to low-carbon development: economic and social factors, environment, and resource utilization. And 13 specific indicators were comprehensively analyzed to address the impact on the construction of low-carbon ecological cities in Guangdong province of China, such as proportion of tertiary industry output value accounts for GDP, green coverage rate in built-up areas, harmless treatment rate of household waste, electricity consumption, etc. Based on the current situation, the development strategies were proposed to provide guidance and reference for Guangdong Province to further promote low-carbon ecological economy. Du et al. [35] constructed a multidimensional indicator system from four aspects: society, economy, energy, and environment, and conducted low-carbon development evaluations of 30 provinces in China based on 24 indicators, including energy consumption of unit GDP, per capita electricity consumption, per capita disposable income of urban residents, forest coverage rate, etc. Duan et al. [36] constructed a low-carbon economy-development level-evaluation system for Dalian of China from five aspects including resource, technology, life, economy, and energy consumption and carbon emission, involving 22 specific low-carbon economy-development-evaluation indicators, including green coverage rate, comprehensive utilization rate of industrial solid waste, per capita disposable income of urban residents, etc. According to the comprehensive evaluation results of the low-carbon economy-development level in Dalian, and combined with the actual situation of Dalian, the development level and future development trend of the low-carbon economy were analyzed. Zhang et al. [37] aimed to promote the development of low-carbon industries in Pingtan City, Fujian Province of China. A low-carbon development and energy-saving evaluation system was constructed from three aspects, with energy consumption, emission reduction, and technology, including 12 specific indicators such as sewage-treatment rate, electricity consumption of unit GDP, emissions of sulfur dioxide, etc. Wang et al. [38] discussed the development level of the logistics industry in Hainan province from five aspects, including energy consumption, carbon emission, carbon productivity, economic benefit index, and carbon emission efficiency, and the emphasis was placed on analyzing the relationship between carbon emission intensity and the low-carbon economy. Meng et al. [39] evaluated the provincial comprehensive efficiencies and explored the factors causing poor performance in China during 2001–2014. The research conclusions show that for east provinces, labor input, energy input, GDP output, and carbon dioxide emissions are all important in improving the comprehensive efficiency, while for west and central provinces, labor input and GDP output are the main contributors to inefficiency. Li and Zhang [40] believed that various fields such as environment, resources, population, society, and economy were closely related to the development of a low-carbon economy, and a low-carbon economy-evaluation indicator system was constructed from five aspects, with growth force, transformation force, competitiveness force, coordination force, and sustainability force, consisting of 18 specific indicators including per capita regional GDP, energy consumption of unit GDP, per capita park green area, and per capita comprehensive water consumption, to evaluate the low-carbon development level of Jiangsu province. Pan et al. [41] constructed a comprehensive low-carbon economy system related to resources, environment, economy, and society from 8 aspects, including human needs, social progress, economic development, etc., with a total of 24 indicators, including per capita regional GDP, per capita electricity consumption, per capita carbon emissions, etc., to comprehensively evaluate the challenges of low-carbon economy in 30 regions of China. Shi et al. [42] constructed an indicator system for city green economy development from the perspectives of economy, society, environment and resources, involving three criterion layers and 23 indicators. Using the green economy-development data on 15 sub-provincial cities in China, their study presented the corresponding advantageous and disadvantageous factors for each sub-provincial city, to help the authorities to make or adjust corresponding green economy policies.
From the references above, it can be found that the commonly used evaluation perspectives to construct the low-carbon economy-evaluation indicator systems mainly involve the aspects of energy [1,5,21,30,31,33,35,36,37,41,42], economy [1,5,30,31,33,34,35,36,41,42], environment [5,21,30,31,33,34,35,41,42], society [5,31,33,34,35,41,42], technology [1,5,36,37,41], transportation [1], etc. Based on the main aspects, when constructing the specific evaluation indicators for a country or region, it is necessary to establish the specific evaluation indicators based on the characteristics of that country or region, and the corresponding specific indicators are usually the per capita regional GDP [1,5,25,26,31,32,33,36,38,40,41], total carbon dioxide emissions [5,21,25,26,27,28,30,32,33,39], per capita disposable income of urban residents [34,35,36,40,41], urbanization rate [1,25,33,36,41], forest coverage rate [1,5,33,35,41], harmless treatment rate of household waste [31,33,34,36,37], comprehensive utilization rate of industrial solid waste [31,33,35,36], per capita disposable income of rural residents [36,40,41], green coverage rate in built-up areas [33,34,35], sewage-treatment rate [33,35,37], energy-consumption intensity [1,33,36], etc.
After identifying the factors that affect the development of the low-carbon economy in the region, or the country, it is crucial to use the effective evaluation methods to evaluate and guide the sustainable development of a low-carbon economy in different regions and countries. This is also a key issue that needs to be considered in the development of a low-carbon economy.
1.3. Evaluation Methods of Low-Carbon Economy Development
According to the evaluation methods in the existing references, the evaluation for the development of a low-carbon economy mainly utilizes subjective evaluation methods, objective evaluation methods, and comprehensive evaluation methods. Subjective evaluation methods include Analytic Hierarchy Process (AHP) [36,40,41], expert rating [1,41], etc. Subjective methods are simple but easily influenced by human factors. So, there are many objective evaluation methods used, mainly including Cloud Model [1], Entropy Weight Method (EWM) [1,31,33,34,36,40,42], Grey Relational Analysis (GRA) [31,33], Principal Component Analysis (PCA) [5,34,37], Data Envelopment Analysis (DEA) method [21,38,39], Auto-regressive Distributed Lag (ARDL) model [25,26,28,32], Full Modified Ordinary Least Squares (FMOLS) method [26,32], Dynamic Ordinary Least Squares (DOLS) technique [26,32], multi-criteria decision support [27], Generalized Method of Moments (GMM) [28], Seemingly Unrelated Regressions (SUR) test [28], System Dynamics Model (SDM) [30,40], Toda Yamamoto (TY)-Granger tests [32], Maximum Flux Principle (MFP) [35], Global Spatial Auto-correlation model [35], Range-Adjusted Measure [39], Driver-Pressure-State-Impact-Response (DPSIR) model [41], Coupling Coordination model [41], R Cluster Analysis [42], Variation Coefficient (VC) method [42], etc. Objective evaluation methods have higher credibility but require data. Therefore, considering that some characteristics of the indicators cannot be quantified, some comprehensive evaluation methods that combine the two kinds of evaluation methods have been widely used to overcome the limitations of a single method, such as AHP-Entropy method [36], Technique for Order Preference by Similarity to an Ideal Solution (TOPSIS) evaluation method with EWM [31], entropy weight-grey correlation evaluation model (EWM-GRA) [33], Range-Adjusted Measure and Data Envelopment Analysis (RAM-DEA) model [39], etc.
The main evaluation models and methods in the references in recent years are shown in Table 1.

Table 1.
The main evaluation models and methods in the references.
In a word, when studying the development of low-carbon economies in different countries, provinces, and cities, firstly it is necessary to construct different evaluation indicator systems based on the key factors influencing the region, and then to use appropriate evaluation methods for calculation and analysis, so as to provide the practical basis for the low-carbon economy development of the countries, regions, and cities.
1.4. Analyses for the Existing Evaluation Indicators and Methods
Based on the research above, for the evaluation of a low-carbon economy, firstly, it is necessary to choose the appropriate and characteristic low-carbon economy indicators with regards to low energy consumption, low pollution, low emission, environmental friendliness, etc. Secondly, in terms of different research objectives, different evaluation and analysis methods are selected or designed based on establishing the evaluation indicator system of a low-carbon economy.
For the selection and determination of evaluation indicators, based on the evaluation indicators used in different references in Table 1, the frequency of occurrence of each indicator is calculated as shown in Table 2. In Table 2, this paper gives the top 50 indicators, and it can be seen that there are 46 indicators used at least 2 times to evaluate the development of a low-carbon economy. The most widely used indicators include per capita regional GDP, total carbon dioxide emissions, number of public transportation vehicles per ten thousand people, etc. In this paper, the rationale and impact of selecting the indicators was exclusively based on the frequency they have been used at in the past, but without any analysis on their combinations. These individual high-frequency indicators can be regarded as common indicators for evaluating the development of a low-carbon economy, which provides a basis for the selection of indicators in this paper to evaluate the low-carbon economy development.
Table 2.
Indicator-use frequency.
For the selection and design of evaluation method, Table 3 lists 6 commonly used methods for evaluating the low-carbon development, including AHP, EWM, PCA, TOPSIS, DEA, and GRA models [43,44,45,46,47,48,49,50,51,52,53,54,55,56,57,58], and the advantages and limitations of these methods are compared as shown in Table 3. In application, the appropriate evaluation method needs to be selected according to the actual situation and characteristics of the object of study [29]. Among these evaluation methods, AHP as the main subjective evaluation method has wide applicability for its simplicity and flexibility. However, AHP also has its drawbacks, such as strong subjectivity and uncertainty, so AHP is always combined with other objective evaluation methods, such as EWM, and TOPSIS, to improve the reliability. So, in order to assign appropriate weights to different indicators of the low-carbon economy development to reflect their importance, an improved AHP method combined with other objective evaluation methods are used in this paper.
Table 3.
The advantages and limitations of different evaluation methods.
1.5. Research Content
The objective of the paper is to study the development level of the low-carbon economy in Chengdu, Sichuan Province, China. Some scholars [33] have evaluated the development of the low-carbon circular economy in Sichuan Province, but in the green and low-carbon transformation, cities are the main battlefield for reducing carbon intensity and will play an increasingly important role in achieving China’s overall carbon peak and carbon neutrality goals [59].
What is more, Chengdu is the capital of Sichuan Province and an important central city in western China, so conducting centralized research on Chengdu city is more focused and has more guiding significance for the development of a low-carbon economy than other cities in the province.
However, there are some problems in the development of a low-carbon economy in Chengdu [60]. For example, currently, the energy structure in Chengdu is dominated by coal, leading to increased air pollution in the city; the traditional industrial structure of Chengdu focuses on heavy industry, processing and manufacturing, and the chemical industry, and the production mode and technology of such industries lack environmental friendliness; the number of private cars in Chengdu ranks among the top in the country, and the amount of exhaust emissions and pollutants will continue to increase, etc.
In short, the development of Chengdu’s low-carbon economy faces various bottlenecks and constraints, and requires collaboration and joint efforts from all parties to achieve the goal of low-carbon economic transformation.
Therefore, in order to promote the green and high-quality development of Chengdu’s low-carbon economy, create a high-quality life, and promote efficient governance, it is necessary to effectively evaluate the low-carbon economy development in Chengdu in recent years, to identify the important influencing factors of low-carbon economy development, and find specific weaknesses in low-carbon economy development through evaluation, which has important reference value and guiding significance for further improving the level of Chengdu’s economy development.
However, currently, there is no reference on this aspect of constructing an evaluation indicator system for low-carbon economy development from the perspective of Chengdu city. Therefore, this paper will research the evaluation system of low-carbon economy development in Chengdu, analyzing and evaluating its level of low-carbon economy development, so as to identify the factors that play an important role in the development of low-carbon economy in Chengdu, as well as the weak aspects that exist in the development process. The main contributions of this paper are as follows:
- (1)
- The related measures and influencing factors of low-carbon economy development in Chengdu are analyzed.
- (2)
- Considering the commonly used evaluation indicators of low-carbon economy development in the references, as well as the characteristics of low-carbon economy development in Chengdu, a more targeted indicator system is constructed for the evaluation of Chengdu’s low-carbon economy development.
- (3)
- Based on the evaluation indicator system, an improved evaluation method is studied by combining subjective and objective evaluation methods.
- (4)
- A comprehensive evaluation is conducted on Chengdu’s low-carbon economy development, the important influencing factors are identified, and the weak points are pointed out in the development process, which has great significance to guide the development of low-carbon economy in Chengdu.
So, the research content of the paper is shown in Figure 1, based on the literature review in Section 1, Section 2 analyzes the factors affecting the development level of the low-carbon economy in Chengdu, and proposes an evaluation indicator system for Chengdu’s low-carbon economy development based on the relevant references, as well as the characteristics of Chengdu. Then, based on the constructed evaluation system, Section 3 uses subjective and objective evaluation methods to determine the indicator weights and describe the evaluation process. Later, in Section 4, based on the evaluation indicator system and evaluation method, an empirical analysis is carried out for Chengdu’s low-carbon economy development, and the evaluation results are analyzed. Finally, conclusions are summarized in Section 5.
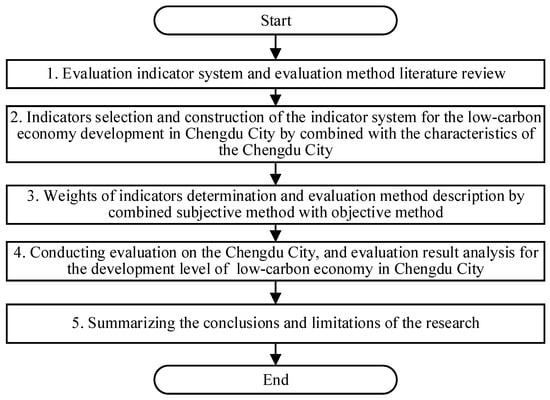
Figure 1.
The research content.
2. Evaluation Indicator System Construction for Chengdu’s Low-Carbon Economy Development
2.1. The Development Path of Chengdu’s Low-Carbon Economy
As the economic center of the western region, Chengdu vigorously promotes the national green and low-carbon policies, with the construction of a park city demonstration zone as the guide, striving to create a new practice of comprehensive green transformation of the economic and social development of mega-cities [61]. So, since 2021, Chengdu has outlined a new path to promote the comprehensive green transformation of economic and social development from four major structures, including space, industry, transportation, and energy [61].
Firstly, the requirements for optimizing space structure are related to all aspects of production and life, such as resources, environment, transportation, economy, industry, technology, etc. [62]. Specific measures include promoting the development of park cities and improving the level of land conservation and intensive use; promoting the integration of industry and city layout; promoting organic urban renewal and implementing intensive and efficient Transit-Oriented Development (TOD) integrated development (a public transportation oriented urban development model), etc.
Optimizing the industrial structure, Chengdu particularly emphasizes increasing the proportion and level of industry. Some measures are proposed, such as strengthening the cultivation of environmental protection and high-tech industries, and promoting the upgrading of traditional industries through information technology transformation [60].
Transportation is one of the key optimization areas. Chengdu proposes to increase the proportion of railway freight volume, and the share of urban public transportation in motorized travel and the proportion of green travel. An especially important point is to increase the ownership of new energy vehicles, and strive to achieve a total of 800,000 new energy vehicles in Chengdu by 2025 [63].
The energy structure forms the foundation of low-carbon economy development. The optimization of Chengdu’s energy structure will further promote the transformation of development momentum and governance methods. Related measures include accelerating the construction of natural gas peak shaving power stations, pumped storage power stations, virtual power plants, increasing the proportion of clean energy and non-fossil energy respectively, etc. According to the goals set by Chengdu, the proportion of non-fossil energy consumption will be significantly increased to over 50% by 2025 on the basis of 2020 [64].
Therefore, Chengdu has closely followed the optimization and adjustment of the “four major structures” and worked together to promote the development of a low-carbon economy, which has also achieved certain results.
For example, as a western city, relying on the low emissions and relatively clean energy structure brought by hydropower, as well as its natural low-carbon endowment, Chengdu has achieved a 62.6% share of clean energy in the city’s energy consumption in 2020 [64]. It has made certain progress in promoting the optimization of energy consumption structure and reducing dependence on fossil fuels.
The policy document “Action plan for building a park city demonstration zone in Chengdu to practice the new development concept (2021–2025)” released in 2022 has clearly proposed that Chengdu is committed to building a “park city” as the urban development strategy, emphasizing ecological priority and green development [61].
As of the end of 2023, the number of new energy vehicles in Chengdu has reached 633,000 units, ranking first among the non-restricted cities, and the operating mileage of the rail transit network has exceeded 600 km [65], making it the fourth largest city in China’s rail transit system. All these reflect the rapid development of Chengdu in the fields of new energy vehicles and rail transit, especially the significant achievements in the promotion and application of new energy vehicles.
The TOD project in Chengdu is also an important factor driving the city’s green and low-carbon transformation. The TOD project introduces the concept of urban planning based on rail transit and building hub level commercial and business centers. Promoting TOD renovation in multiple locations, such as train stations, is of great significance in promoting the sustainable development of the city and improving the quality of life of residents [62].
Thus, it can be seen that Chengdu’s next step in reducing carbon emissions is aimed at all aspects of production and life. Therefore, it is crucial to identify the important influencing factors and evaluate the effectiveness of Chengdu’s low-carbon economy development since the implementation of the new measures, so as to guide the development path of Chengdu’s low-carbon economy.
2.2. Evaluation Indicator System Construction
In order to evaluate the effectiveness of Chengdu’s low-carbon economy development, establishing an evaluation indicator system is the first step. Due to Chengdu’s low-carbon economy-development strategy being related to the four major structures of space, industry, transportation, and energy, among which space structure is related to all aspects of production and life, such as resources, environment, transportation, economy, industry, technology, etc., and industrial structure also generally considers the factors of economic growth, R&D technology investment, energy consumption, environment pollution control, etc., the evaluation indicator system for Chengdu’s low-carbon economy development is designed from five dimensions, including economy, energy, technology, environment, and transportation.
Further, in order to construct the specific bottom indicators of low-carbon economy development in Chengdu, this paper refers to relevant references [1,5,21,25,26,27,28,30,31,32,33,34,35,36,37,38,39,40,41,42] to analyze the common indicators as shown in Table 1, and 20 high-frequency indicators are selected as common indicators, including per capita regional GDP, number of employed people, urbanization rate, etc. The selection criteria for the 20 high-frequency indicators are as follows:
- (1)
- Comparing and analyzing the usage frequency of each indicator through relevant research literature, and the high usage frequency can indicate that the indicator is more common and commonly used in the study of low-carbon economy;
- (2)
- According to the five dimensions of second-level indicators, the top third-level indicators of each dimension are selected;
- (3)
- Giving preference to the quantitative indicators that can be queried directly from official documents in recent years.
Therefore, according to the five dimensions of the second-level indicators of economy, energy, technology, environment and transportation, the top third-level indicators in each category are selected, and a total of 20 high-frequency third-level indicators are selected. There are 6 third-level indicators in the economic category, including per capita regional GDP, urbanization rate, per capita disposable income of urban residents, number of employed people, per capita disposable income of rural residents, and total fixed asset investment, with frequencies of usage 11 times, 5 times, 5 times, 3 times, 3 times, and 2 times, respectively. There are 3 third-level indicators in the energy category, including comprehensive utilization rate of industrial solid waste, total energy consumption, and electricity consumption, with frequencies of usage 4 times, 3 times, and 2 times, respectively. There are 3 third-level indicators in the technology category, including R&D expenditure, number of patent authorizations, and published scientific papers, all of which appear once. There are 7 third-level indicators in the environment category, including total carbon dioxide emissions, forest coverage rate, harmless treatment rate of household waste, per capita park green area, green coverage rate in built-up areas, sewage-treatment rate, and emissions of sulfur dioxide, with frequencies of usage 10 times, 5 times, 5 times, 3 times, 3 times, 3 times, and 1 time, respectively. There is one third-level indicator in the transportation category, and this indicator is the number of public operating vehicles, which appears 6 times.
Meanwhile, considering the characteristics of low-carbon economy development in Chengdu described above, 5 characteristic indicators have been determined based on Chengdu’s low-carbon development strategy and city characteristics as shown in Table 4, including C9: Proportion of clean energy consumption, C19: Number of urban parks, C22: Number of new energy vehicles, C23: Number of TOD projects, C24: Operating mileage of rail transit, to construct an evaluation indicator system for low-carbon economy development in Chengdu.
Table 4.
Construction of evaluation indicator system.
Finally, based on the relevant references, and geographical features and city characteristics of Chengdu, 25 evaluation indicators for Chengdu’s low-carbon economy development are specifically designed, including 20 high-frequency indicators and 5 of Chengdu’s characteristic indicators. The specific contents and types of indicators are shown in Table 4.
In Table 4, the evaluation indicator system for low-carbon economy development in Chengdu mainly includes five dimensions as follows, and the description of the indicators is given in Appendix A.
- (1)
- Economy-related indicators
Economy-related indicators are used to reflect the socio-economic phenomena and reflect the level of economic development. There are six indicators in the economy category, including C1: Per capita regional GDP, C2: Number of employed people, C3: Urbanization rate, C4: Total fixed assets investment, C5: Per capita disposable income of urban residents, and C6: Per capita disposable income of rural residents.
- (2)
- Energy-related indicators
The development of low-carbon economy relies on the transformation of energy structure which is shifting from relying on fossil fuels to using more renewable and clean energy, to help reduce the greenhouse gas emissions and decrease the dependence on limited resources. There are four energy-related indicators, including C7: Total energy consumption, C8: Comprehensive utilization rate of industrial solid waste, C9: Proportion of clean energy consumption, C10: Electricity consumption.
- (3)
- Technology-related indicators
Technology reflects the progress in energy transformation, industrial upgrading, changes in lifestyle, environmental monitoring and assessment, policy formulation and implementation, and other aspects in the development of low-carbon economy. Technology-related indicators include three indicators, C11: R&D expenditure, C12: Number of patent authorizations, and C13: Published scientific papers.
- (4)
- Environment-related indicators
Environment-related indicators reflect the situation of air quality, water resource quality, climate change, soil quality, and urban greening in the development of a low-carbon economy. There are eight environment indicators, including C14: Per capita park green area, C15: Forest coverage rate, C16: Green coverage rate in built-up areas, C17: Harmless treatment rate of household waste, C18: Sewage-treatment rate, C19: Number of urban parks, C20: Emissions of sulfur dioxide, and C21: Total carbon dioxide emissions. These indicators reflect the achievements made in the ecological environment quality, resource-utilization efficiency, and pollution reduction. By analyzing the changes in these environment indicators, it can help managers understand the current situation and trends of low-carbon economy development, and thus formulate more effective policies to promote the development of low-carbon economies.
- (5)
- Transportation-related indicators
Transportation is an important source of energy consumption and carbon emissions. Transportation indicators include C22: Number of new energy vehicles, C23: Number of TOD projects, C24: Operating mileage of rail transit, and C25: Number of public operating vehicles. These indicators reflect energy consumption, carbon emissions, transportation mode selection, and infrastructure planning in the development of a low-carbon economy, and can to some extent encourage people to reduce carbon emissions in the transportation filed through green public transportation.
3. Evaluation Method Design for Chengdu’s Low-Carbon Economy Development
When evaluating the factors that affect the development of Chengdu’s low-carbon economy, because each indicator has a different impact on the evaluation result, it is necessary to assign appropriate weights to different indicators to reflect their importance.
In order to make the evaluation more comprehensive, on the one hand, consulting personal thoughts and opinions on the importance of the indicators is meaningful, so the subjective evaluation method can be used. On the other hand, due to the strong human factors and the uncertainty of the subjective analysis, the objective evaluation method can be combined to reduce the influence of subjective judgments. Therefore, this paper adopts a comprehensive evaluation method that combines subjective and objective analyses to determine the weights of low-carbon economy-development indicators in Chengdu, and thus carries out the evaluation.
Since AHP is one of the subjective weighting methods and has wide applicability in multiple criteria decision-making problems because of its simplicity, ease of use, and great flexibility [66], AHP is used to determine the subjective weights of the indicators in this paper. And in order to reduce the influence of subjective judgments, combining with historical statistical data of the indicators, the EWM and VC method are used to determine the objective weights of the indicators, to achieve more accurate and scientific evaluation, and provide more reliable decision-making bases for stable and long-term economy development.
3.1. The Subjective Weights of Indicators by Improved AHP Method
The basis of AHP is the expert judgment matrix, but due to the existence of certain errors in human judgment, especially in complex situations, the judgment matrix given by experts is often inconsistent, and requires adjustment to meet consistency requirements for use in decision-making. There are various methods for adjusting the consistency of expert judgment matrices, such as manual adjustment, sensitivity analysis, the iterative method, the logarithmic least square method, the optimal transfer matrix method, etc., but these methods all have the same problem that they cannot effectively extract accurate judgment information from the original expert judgment matrix and measure whether the adjusted matrix can represent expert opinions, resulting in insufficient practicality of these matrix consistency-adjustment methods [67].
Therefore, Wang et al. [67] argued that the adjustment of the expert judgment matrix should preserve the original correct information of the expert to the greatest extent, and proposed the information-extraction and consistency-adjustment method for expert judgment matrices. The adjustment method makes the consistency adjustment based on the logical relationships and judgment information in the judgment matrix provided by the expert, and this adjustment not only can make the expert judgment matrix meet the consistency requirements, but also ensure that the adjusted expert judgment matrix contains the main judgment information of the expert. So, this kind of adjustment has stronger persuasiveness.
In addition, due to the subjectivity of expert judgment and the complexity of the judgment object, experts often find it difficult to accurately judge the relative importance of multiple indicators under the same criterion. Therefore, even if the judgments given by each expert can meet the consistency condition, it does not mean that their judgments have the same credibility. In the decision-making process, the judgment credibility of each expert directly affects the determination of expert weights in the decision [68]. The credibility of experts can be divided into two parts: subjective credibility and objective credibility. Subjective credibility is related to the reputation, status, profession, and familiarity with decision-making issues of the expert, while objective credibility depends on the credibility of the expert’s specific judgment results [68]. So, in order to make the determination of expert weight in the AHP more reasonable, this paper will calculate the credibility of the expert participating in the survey. The subjective credibility of the expert is determined by professional title, work years, and project experience, while the objective credibility is obtained by analyzing the judgment matrix information of the expert.
Therefore, considering that the consistency adjustment of the AHP judgment matrix and the determination of expert weight both involve the judgment matrix, this paper proposes an improved AHP method based on the judgment matrix to determine the subjective weights of the indicators. Firstly, the consistency checking for the judgment matrix is carried out. For the judgment matrix that cannot pass the check, the logical relationship and judgment information of the matrix are used to eliminate erroneous information from expert judgments, and consistency adjustments are made to meet the requirements. Then, by establishing the mutual relationship between the direct and indirect judgment information contained in the expert judgment matrix, the consistency of expert opinions is determined, and the relative objective credibility of the expert judgment is obtained. Later, the expert weights are determined by combining the subjective credibility and the objective credibility of experts. Finally, with expert weights, the subjective weights of the indicators for the low-carbon economy development in Chengdu can be determined. The specific steps for determination of the subjective weights of the indicators by the improved AHP method are described below.
3.1.1. Construction of Judgment Matrix and Consistency Checking
- (1)
- Construct a judgment matrix
When applying AHP, it is necessary to construct an expert judgment matrix. For indicators at the same level, the relative importance between each indicator is determined through pairwise comparison, and a judgment matrix is constructed. In this paper, the 1–9 ratio scale proposed by Saaty [69] is chosen for pairwise comparison, and this scale establishes one-to-one correspondence comparison by using the discrete set {9, 8, 7, 6, 5, 4, 3, 2, 1, 1/2, 1/3, 1/4, 1/5, 1/6, 1/7, 1/8, 1/9}. Then, pairwise comparison is conducted for each indicator in each level to obtain a quantified judgment matrix A as follows:
where represents the relative importance of indicator i to indicator j, and n is the number of indicators and is also the order of the judgment matrix. If aij = 1, then indicator i is as important as indicator j; if aij = 3, then indicator i is slightly more important than indicator j; if aij = 5, then indicator i is significantly more important than indicator j; if aij = 7, then indicator i is much more important than indicator j; if aij = 9, then indicator i is extremely important in comparison with indicator j; if aij = 2, 4, 6, 8, then it is the median of the adjacent judgments mentioned above; and if aji = 1/aij, then it is the ratio of the importance of indicator j to indicator i.
- (2)
- Consistency check of judgment matrix
To verify the rationality of expert judgment, it is necessary to check the consistency of the judgment matrix. The consistency ratio (CR) proposed by Saaty [69] is always used to check the consistency of the judgment matrix.
When CR < 0.1, the consistency of the judgment matrix is acceptable, indicating that the expert judgment is reasonable and the result is acceptable. Otherwise, the judgment matrix needs to be adjusted to meet the consistency ratio requirement. The CR calculation formula is as follows:
where CI is the consistency index, and RI is the average random consistency index used to correct the value of CI and is related to the order n of the judgment matrix [70].
In addition, the consistency index CI in the formula is calculated as follows [71]:
where is the maximum eigenvalue of the judgment matrix. If the judgment matrix A is consistent, there is the maximum eigenvalue of the matrix , and the value of CI is 0. Otherwise, [72].
The maximum eigenvalue of matrix A is calculated by the below formula.
where is the eigenvector, and this paper uses the eigenvector method to calculate the eigenvectors and maximum eigenvalue of the judgment matrix. The eigenvectors represent the relative importance weights of each element. By applying the root mean square method [73], the eigenvectors of the judgment matrix can be obtained as follows:
Therefore, by calculating the maximum eigenvalue of the judgment matrix, the value of the consistency index CI can be obtained, and by combining the values of CI and RI, the value of the consistency ratio CR can be obtained. If the value of CR is less than 0.1, the consistency check of the judgment matrix is passed. Otherwise, the judgment matrix needs to be modified until it meets the requirements.
- (3)
- Adjustment method for judgment matrix
To ensure that the adjustment to the judgment matrix preserves the original correct information of the expert to the greatest extent, the adjustment of the judgment matrix can be based on the degree of deviation between the direct and indirect judgment information of the matrix [67]. The specific method is that the element with the greatest difference between the direct and indirect judgment information in the judgment matrix is identified and corrected, until the consistency condition is met. The steps in detail are as follows.
Step 1: If the judgment matrix does not meet the consistency requirement, then define the indirect information in matrix A regarding the importance judgment of any two indicators i and j relative to other indicator as follows:
where the element in matrix A represents the direct judgment information given by an expert on the relative importance between indicators i and j, and there are a total of elements. is the indirect judgment information of the relative importance between indicators i and j, which is based on the expert’s judgment results of the relative importance between indicators i and j to the other indicator . For each element in the judgment matrix A, there are n − 2 indirect judgment information values .
Step 2: Calculate the deviation degree index for each element in the judgment matrix A by the following formula:
Step 3: Find the corresponding to the maximum , where is the element in the judgment matrix and shows that the direct judgment result given by the expert is the most contradictory to the indirect judgment result derived through indirect information.
Step 4: Adjust the expert judgment result; that is, replace the most contradictory element by the below formula, and check the consistency again until the condition is met.
By following the above steps, the judgment matrix that does not meet the consistency requirement can be adjusted.
3.1.2. Expert Credibility Calculation
Because AHP is a subjective weighting method, it is necessary to consider the expert credibility in the judgment. The credibility of the expert is crucial for determining the weight of the expert. The credibility of the expert is divided into subjective credibility and objective credibility, where subjective credibility is related to expert experience, social status, etc., and objective credibility is related to the analysis results of the judgment matrix.
In order to determine the weights of indicators, this paper consulted the opinions of several experts working in the field of economics. Each expert has different work background and practical experience. So, according to reference [74], the subjective credibility of experts is determined based on their professional titles (technician, engineer, and senior engineer), work years (less than 3 years, 3–5 years, and more than 5 years), and project experience (small project, medium-sized project, and large project), and different levels correspond to different scores (2 points, 5 points, and 8 points), then according to the actual situation of experts, the subjective credibility of each expert can be obtained.
For the determination of the objective credibility of experts, it is obtained by calculating the deviation degree between the direct and indirect information of element in judgment matrix A.
Firstly, if the judgment matrix is completely consistent, then the direct judgment information of the expert on the relative importance of indicators i and j can be obtained through indirect information by using of the following formula:
where is used to describe the relationship between direct and indirect information of the expert on the relative importance of indicators i and j to the other indicator , and . For element in the judgment matrix, there are n − 2 elements to form a weight vector .
Then, if the judgment matrix is not completely consistent but only satisfies the consistency condition, then conversion can be carried out between direct and indirect judgment information of the judgment matrix for indicators i and j by using of the following formula:
where is used to describe the relationship between direct and indirect information of the expert on the relative importance of indicators i and j to the other indicator . For element in judgment matrix, there are n − 2 elements to form a weight vector , and .
So, if the expert judgment matrix is completely consistent [68], then . If the judgment matrix is not completely consistent but only satisfies the consistency condition, then it is necessary to select different elements to establish the conversion between direct and indirect judgment information of the judgment matrix.
In this paper, the value of is determined by the index of deviation degree calculated by Equation (7) for each element in the judgment matrix. The closer and are, the more the expert agrees on the judgment of indicators i and j. Conversely, the greater the deviation between the two vectors, the higher the inconsistency and confusion of the expert’s judgment on indicators i and j. So, in order to determine the consistency degree of the expert’s judgment on indicators i and j, this paper uses the vector angle cosine method to calculate the proximity between the two vectors and .
The vector angle cosine method is directly based on the similarity between two vectors, using the cosine value of the two vectors in the vector space to measure the difference between objects, indicating the degree of proximity between vectors, and quickly providing accurate judgment for multi-objective decision-making. If the consistency of expert judgment on indicators i and j is , then the proximity between the vectors and is calculated as follows:
Then, according to Equation (11), the consistency degree of the expert for the elements in the judgment matrix is calculated, and the consistency degree reflected in the judgment information provided by an expert is obtained through Equation (12) as follows:
The value of reflects the consistency degree of the expert’s own judgment, and the higher the value, the better the consistency and credibility of the expert’s judgment. Therefore, according to the consistency degree of all the experts’ own judgments in the group decision-making, after normalization, the individual relative objective credibility of each expert can be obtained.
Then, based on the subjective credibility and objective credibility of the expert, the credibility of expert k is calculated using the following formula, and the credibility of the expert is used as the weight of the expert.
where represents the objective credibility of the expert for indicator i obtained by the normalized value of consistency degree .
3.1.3. Subjective Weights of Indicators Calculation
By using the method of finding eigenvectors in the consistency check of the judgment matrix, the relative importance weight of each indicator can be obtained. Then, combined with expert credibility, the subjective weight of each indicator can be obtained. The calculation formula is as follows:
In the formula, represents the credibility of expert calculated by Equation (13), represents the importance of expert k for indicator i obtained by the eigenvector method with Equation (5). Then based on matrix , the values obtained by column summation are the local subjective weights of the indicators. Because the local subjective weights of the second-level indicators are also the global weights, according to the hierarchical structure of the evaluation system, the global weights of the third-level indicators are calculated from top to bottom by combining with the local subjective weights of the third-level indicators and the global weights of the second-level indicators. Finally, the global weights of all the indicators can be obtained as .
3.2. The Objective Weights of Indicators by EWM and VC Method
AHP as a subjective weighting method is simple and low-cost; however, it cannot avoid deviations caused by human factors. So the EWM and VC method are used to reduce the influence of subjective factors.
The EWM as an objective weighting method can obtain more objective results. According to the properties of entropy, entropy can be used to judge the statistical dispersion of an indicator. The greater the dispersion of the indicator, the more important the indicator is, and the larger the entropy weight is [75,76].
The VC method is also an objective weighting method, and uses the variation degree of the individual characteristic parameter to obtain the weight of each indicator [77]. The greater the variation coefficient of the indicator, the larger the weight of the indicator.
According to the principles of EWM and VC method, the collected indicator values will be used by the two methods.
3.2.1. Calculation Steps of EWM
- (1)
- Establish the evaluation matrix: Based on the values of indicator in years , the evaluation matrix is as follows:where is the specific numerical value of indicator j in the year i.
- (2)
- Data-standardization processing: Due to the indicator having a different nature that can affect the results, it is necessary to remove the influence of dimensionality for data normalization. The processing method is as follows:Then the normalized matrix is obtained.
- (3)
- Calculate entropy value , where , and if , then .
- (4)
- Calculate the variation degree of indicator .
- (5)
- Calculate the weight of indicator .
3.2.2. Calculation Steps of VC Method
- (1)
- Calculate the mean value and mean square deviation for the indicator j, where and .
- (2)
- Calculate the variation coefficient .
- (3)
- Calculate the weight of indicator .
- (4)
- Calculate the combination objective weight of the indicator (j = 1, 2, …, n), where is obtained by EWM and is calculated by the VC method.
3.3. Comprehensive Weights of Indicators Calculation
By combining the subjective weight obtained from the AHP with the objective weight obtained from the EWM and VC method, the comprehensive weights of the indicators can be obtained as follows:
where is the comprehensive weight of indicator j. Finally, the comprehensive weights of the third-level indicators can be obtained by combining the subjective weights and objective weights, and the weights of indicators at other levels are calculated from bottom to top according to the hierarchical structure of the evaluation system.
3.4. Evaluation of Chengdu’s Low-Carbon Economy Development by TOPSIS
After obtaining the weights of low-carbon economy indicators, appropriate methods can be used to evaluate the development trend of a low-carbon economy based on the specific values of the indicators.
In this paper, TOPSIS is adopted to evaluate the development level of Chengdu’s low-carbon economy. TOPSIS is based on the proximity between the evaluation objects and the ideal target to sort the evaluated objects. The evaluation process is as follows:
- (1)
- Construct the evaluation matrix: With the different values of indicator in several years , by using of the method mentioned in the EWM, the normalized matrix is obtained, then combined with the comprehensive weights of indicators , the evaluation matrix can be obtained as follows:
- (2)
- Determine the best ideal solution and the worst ideal solution: The best ideal solution is composed of the maximum values in each column in the matrix Z, that is . The worst ideal solution is composed of the minimum values in each column in the matrix Z, that is .
- (3)
- Calculate the distance and of each indicator j in year i with the best solution and the worst solution as follows:
- (4)
- Calculate the evaluation result of each year by the below formula:where , and the closer the value of is to 1, the better the evaluation object. Then, according to the values of , the evaluation results can be ranked from high to low.
Therefore, according to the description above, the evaluation process of Chengdu’s low-carbon economy-development level is shown in Figure 2 and the description is below.
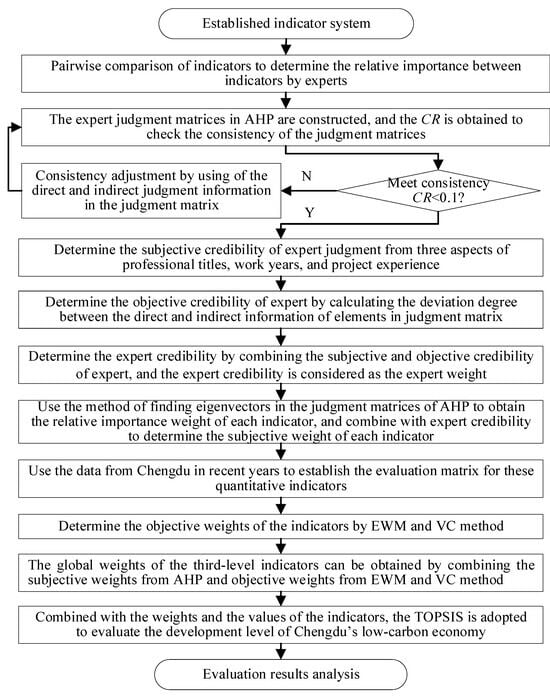
Figure 2.
Evaluation process of Chengdu’s low-carbon economy-development level.
Firstly, based on the established indicator system, the expert judgment matrices are constructed by pairwise comparison, and the CR is obtained to check the consistency of each judgment matrix. If the value of CR is greater than 0.1, then the judgment matrix is adjusted by using the direct and indirect judgment information in the judgment matrix until the consistency meets the requirement. Secondly, the subjective credibility of expert judgment is determined from three aspects of professional titles, work years, and project experience, and the objective credibility of the expert is determined from calculating the deviation degree between the direct and indirect information of elements in the judgment matrix, then the expert credibility is determined by combining the subjective and objective credibility of each expert. Next, the method of finding eigenvectors in the judgment matrices of AHP is used to obtain the relative importance weight of each indicator, which is combined with expert credibility to determine the subjective weights of the indicators. Then, data from Chengdu in recent years are used to establish the evaluation matrix for these 25 quantitative indicators, and the objective weights of the indicators for the low-carbon economy development in Chengdu are determined by the EWM and VC method. Later, the global weights of the third-level indicators can be obtained by combining the subjective weights from AHP and objective weights from the EWM and VC method, and the global weights of other indicators in the second level can be obtained from bottom to top according to the system hierarchical structure. Finally, TOPSIS is adopted to evaluate the development level of Chengdu’s low-carbon economy by combining with the weights and the values of these indicators, and the evaluation results can be obtained.
4. Results Analysis
4.1. Data Collection
In order to analyze the low-carbon economy development in Chengdu, firstly, the values of the indicators from 2018 to 2023 are collected as shown in Table 5. Most of the data used in this study come from official information released by the Chengdu Municipal Statistics Bureau, Chengdu Survey Team of the National Bureau of Statistics, the People’s Government of Chengdu Municipality, the Chengdu Municipal Bureau of Ecological Environment, and the Carbon Emission Accounts and Datasets, including the Chengdu Statistical Yearbook (2024) [78], the Statistical Communique on the National Economic and Social Development of Chengdu in 2023 [65], the Statistical Bulletin on Science and Technology Funding in Chengdu in 2023 [79], the Statistical Bulletin of the Ecological Environment of Chengdu [80], and the Emission Inventories for 290 Chinese Cities from 1997 to 2019 [81]. In addition, some of the data come from the websites of other relevant departments.
Table 5.
Indicator values from 2018 to 2023.
4.2. Weights of Indicators Calculation Results
In order to determine the importance of these different indicators, firstly this paper invited six experts in economics to rate the importance of the impact of low-carbon economy-development indicators in Chengdu. These six experts are members of the Sichuan Industrial Economics Society, and come from universities and research institutes. They all possess professional knowledge, research results, and practical experience in the field of economics, and have participated in projects related to economic development, policy-making, and other aspects. Firstly, the questionnaire table for the pairwise comparison of indicators to determine the relative importance between indicators is sent to different experts. According to the evaluation indicator system of the low-carbon economy, there are 6 judgment matrices in the questionnaire table that need to be judged by each expert. The 1–9 ratio scale described in the AHP is used to show the relative importance between indicators, and the experts give their own judgment results.
These six experts have different professional titles, work years, and project experience, and different judgment matrices are obtained in the AHP method. Then, consistency checking is conducted on the judgment matrices, and for the judgment matrices that do not meet the consistency conditions, the deviation degree between expert direct judgment information and indirect judgment information is used to adjust these judgment matrices. Next, based on the expert’s professional title, work years, and project experience, the subjective credibility of the expert is calculated. At the same time, based on these judgment matrices, the vector angle cosine method is used to calculate the objective credibility of each expert for each indicator. Finally, combining the subjective and objective credibility of the expert, the expert credibility is calculated with the “Excel” tool of the 2021 version and obtained as shown in Table 6, and the credibility of the expert is the weight of the expert.
Table 6.
The credibility of the expert.
In Table 6, expert 3, with senior title, long work years, and complex project experience, has the highest score 24 points and the highest subjective credibility 0.2857. When considering the objective credibility of the expert, because each expert has different objective credibility for different indicator categories, the weights of experts are different for different indicators, reflecting the varying levels of familiarity of experts with decision-making issues. For example, although the subjective credibility of expert 2 is less than expert 3, who has a score of 21 points and subjective credibility of 0.2500, when combining with the objective credibility, the weight of expert 2 for the transportation indicator is the highest value 0.2886, which is more than the weight of expert 3 with 0.2654. So, considering the subjective and objective credibility of experts in the evaluation is more suitable for the actual situation.
Later, the subjective weights of the indicators are obtained by combining expert credibility and AHP. Further, the objective weights of the indicators are calculated by the EWM and VC method, with the values of indicators from 2018 to 2023. Finally, the comprehensive weights of the indicators are obtained by combining the subjective weights and the objective weights . The weights of indicators are shown in Table 7.
Table 7.
The weights of indicators.
In accordance with Table 7, the distribution of indicator weights is shown in Figure 3; it can be observed that the three indicators that have the greatest impact on Chengdu’s low-carbon economy development are C22: Number of new energy vehicles (0.2620), C23: Number of TOD projects (0.1484), and C11: R&D expenditure (0.1093).
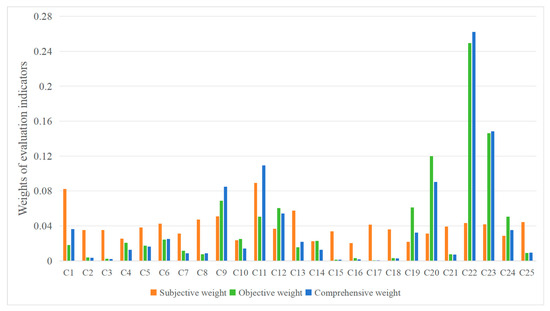
Figure 3.
The distribution of indicator weights.
Analyzing the reason, firstly, in the wave of accelerated industrial transformation brought by new energy vehicles, the number of new energy vehicles in Chengdu exceeded 750,000 by 2024, ranking among the top in the country. The rapid growth of the number of new energy vehicles in Chengdu reflects the city’s efforts in promoting green travel and building a low-carbon city, which helps reduce urban traffic pollution, improve air quality, and is crucial for achieving sustainable development and responding to the global challenges of climate change.
Secondly, the green and low-carbon transformation of Chengdu TOD projects is an important factor driving the city’s progress. By optimizing the spatial layout, the rail transit network centered around hundreds of subway stations has changed the way citizens travel, improved public transportation efficiency, and reduced carbon emissions in the transportation field. On the one hand, the TOD projects have promoted the construction of park cities and ecological civilization, and on the other hand, they have also accumulated transportation and environmental protection strategies with high reference value.
In addition, the R&D expenditure in Chengdu has maintained double-digit growth for seven consecutive years, reaching CNY 82.412 billion in 2023, accounting for 60.7% of the R&D expenditure in Sichuan Province. These funds are mainly invested in green and low-carbon fields such as clean energy, energy conservation, and environmental protection, and new materials, supporting technological breakthroughs and achievement transformation in these segmented industries such as photovoltaics, power batteries, new energy vehicles, and hydrogen energy. The continuous investment of R&D funds in Chengdu can effectively promote the innovation, promotion, and application of low-carbon technologies, providing technological support and talent guarantee for achieving sustainable economic development.
Relatively speaking, the comprehensive weights of C18: Sewage-treatment rate (0.0028), C3: Urbanization rate (0.0020), C16: Green coverage rate in built-up areas (0.0016), C15: Forest coverage rate (0.0011), and C17: Harmless treatment rate of household waste (0.0004) are relatively low. These indicators may not directly reflect the core of low-carbon economy development. However, although these factors may not be as critical as other indicators, they also have a significant impact on the long-term development of a low-carbon economy.
For example, the urbanization and low-carbon economy complement each other and can promote and support each other. In the process of urbanization, promoting new industries can drive economic recovery and development, while a low-carbon economy can reduce the negative impact of urbanization and achieve coordination between environmental protection and economic development.
Meanwhile, a low-carbon economy can promote the healthy and sustainable development of urbanization through optimizing urban planning and construction, improving the ecological environment, optimizing energy-consumption structure and energy conservation, promoting the development and utilization of renewable energy, improving urban management level, and improving urban transportation.
In addition, environmental indicators, such as C15: Forest coverage rate, C16: Green coverage rate in built-up areas, C17: Harmless treatment rate of household waste, and C18: Sewage-treatment rate, can reflect the level of greening and ecological environment quality of a region, which is of great significance for improving residents’ quality of life and urban sustainability, and this can also promote the growth of a low-carbon economy.
4.3. Evaluation Results of Low-Carbon Economy Development in Chengdu
Combining with the weights of indicators and the values of indicators from 2018 to 2023, the TOPSIS method is used to calculate the results of comprehensive evaluation and each dimension evaluation as shown in Table 8.
Table 8.
TOPSIS evaluation results.
Table 8 contains a comprehensive evaluation Ci of Chengdu’s low-carbon economy development and separate results of the five dimensions of economy Ci, energy Ci, technology Ci, environment Ci, and transportation Ci. According to the results, the comprehensive and in-depth analyses of each dimension of Chengdu’s low-carbon economy development are as follows:
First of all, from the comprehensive evaluation Ci, it can be seen that the comprehensive score of Chengdu’s low-carbon economy has a significant improvement trend. The comprehensive performance in 2018 is 0.0451, and the overall low-carbon economy system of Chengdu is in its infancy, and all dimensions have not yet been coordinated. From 2019 to 2021, the comprehensive score increases from 0.1126 to 0.4050, and Chengdu’s comprehensive evaluation score of low-carbon economy performance increases rapidly during this period, which may be related to Chengdu’s increased investment in R&D of low-carbon technologies, optimization of energy structure, and strengthening of environmental management. The effective implementation of these measures has greatly enhanced Chengdu’s comprehensive ability in terms of low-carbon economy. During 2022 and 2023, the comprehensive performance still maintained an upward trend, and the comprehensive score in 2023 reached 0.9564, and continued to approach the theoretical optimal value. This fully demonstrates Chengdu’s firm confidence and determination in promoting green and low-carbon transformation.
Since Chengdu released the country’s first city-level green and low-carbon development report in 2017, a comprehensive ecological carbon sink system was initially formed in 2018, and by 2019, the city was guided by the construction of a park city demonstration area that implemented the new development concept and promoted the city’s all-round transformation to green and low-carbon, until 2020, when the epidemic prevention and control and economic and social development were coordinated, and new results were achieved in green and low-carbon development, and in 2021, with the stabilization of the epidemic and the global economic recovery, Chengdu’s low-carbon economy accelerated its development. In 2022, Chengdu adhered to the progress of ecological priority and green development, and promoted the city’s low-carbon development to a new level, and by 2023, the output value of Chengdu’s green and low-carbon industries increased significantly. In short, gradually, the green and low-carbon factors are becoming Chengdu’s thickest background, the most distinctive characteristics, and the most lasting advantages.
Further, an in-depth analysis is carried out based on the evaluation results of each dimension as follows:
- (1)
- Economy-evaluation results
As can be seen from the data in Table 8, Chengdu has significantly improved its economy performance in the past six years. In 2018, the economy evaluation index of Chengdu was relatively close to 0, which indicates that the economic benefit of Chengdu in terms of the low-carbon economy had not yet been fully manifested and was in its infancy. Later, with the implementation of a series of low-carbon policies in Chengdu, Chengdu’s economic performance began to gradually improve. From 2019 to 2020, the Ci value increased steadily to 0.3251, although the value was still low, which also shows that Chengdu had made initial achievements in the field of low-carbon economy. Until 2021, Chengdu’s economic performance index achieved a significant improvement, reaching 0.6424, which may be closely related to the coordinated development of green industries in the Chengdu–Chongqing Economic Circle and the deepening of the pilot carbon-trading market, indicating that Chengdu achieved steady growth in economic benefit while promoting green and low-carbon development. In 2022, Chengdu’s economic performance index continued to grow to 0.7844, and by 2023, the relative proximity Ci reached the theoretical optimal value of 1, indicating that Chengdu made remarkable achievements in the field of low-carbon economy.
This trend fully shows that in the process of implementing a low-carbon economy, Chengdu not only paid attention to environmental protection and sustainable development, but also successfully integrated green and low-carbon concepts into economic development, achieving a win–win situation of economic and ecological benefits. With green and low-carbon concepts deeply rooted in the hearts of the people, Chengdu has continuously optimized its industrial structure and vigorously developed the green economy, and traditional industries have also transformed in the direction of low-carbon and intelligence. At the same time, Chengdu is also actively introducing and promoting low-carbon technologies to reduce carbon emissions, providing strong support for the improvement of economic performance.
- (2)
- Energy-evaluation results
Through an analysis of data from 2018 to 2021, it was found that the energy performance index showed a fluctuating upward trend, from 0.1390 in 2018 to 0.1803 in 2021, but it fell slightly in 2019. On the whole, the proportion of clean energy and energy efficiency in Chengdu was still at a low level during this period, and the dependence on traditional fossil energy was high, but some progress was made in energy-utilization measures and management, although the improvement was not significant.
After entering 2022, the growth rate of the energy-performance index accelerated significantly, and the energy performance index jumped to 0.7044, which marked a major breakthrough in energy management and low-carbon transformation in Chengdu. It may be that the release and implementation of a series of new energy policies in Chengdu comprehensively promoted a clean and efficient low-carbon energy system, which promoted the rapid growth of energy performance. By 2023, the energy-performance index further rose to 0.8610; although the growth rate slowed down, it still maintained the middle and upper level, showing that Chengdu continued to optimize and improve energy performance, but there was still a certain distance from the ideal value, indicating that Chengdu’s low-carbon economy can further pay attention to energy investment and improvement.
The significant growth in the performance index from 2021 to 2022 not only reflected the significant improvement in Chengdu’s energy efficiency, but also reflected the remarkable results of energy transition in promoting a low-carbon economy and achieving sustainable development. In the future, Chengdu can continue to deepen the reform of the energy structure, strengthen the innovation and application of energy technology, and promote the continuous improvement of energy efficiency, so as to achieve greener, low-carbon, and sustainable development, and further improve energy performance.
- (3)
- Technology-evaluation results
In the evaluation system of Chengdu’s low-carbon economy performance, the technological dimension is a crucial aspect, which includes three key indicators: C11: R&D expenditure, C12: Number of patent authorizations, and C13: Published scientific papers. From the data trend in Table 8, from 2018 to 2019, the relative proximity of Chengdu’s technology dimension shows an initial upward trend, jumping from 0 to 0.1628.
In 2020, the Ci value increased to 0.3575, a significant increase from the previous period. It reflects Chengdu’s continuous efforts and investment in low-carbon economy science and technology, and its scientific and technological innovation capabilities have been further improved.
In 2021, the relative proximity of the technology dimension increased further, from 0.3575 to 0.5651. This shows that Chengdu’s scientific and technological innovation capabilities in the field of low-carbon economy formed certain advantages, and the transformation and application of scientific and technological achievements also achieved remarkable results. In 2022, the Ci value continued to maintain relative growth, reaching 0.7823, reflecting the important role played by scientific and technological innovation in promoting the development of a low-carbon economy.
In 2023, the relative proximity of the technology dimension reached 1, which indicates that Chengdu’s scientific and technological innovation capability in the field of low-carbon economy reached a new height.
From the above analysis, it can be seen that the dimension of technology has made a positive contribution to the development of Chengdu’s low-carbon economy, indicating that Chengdu has achieved good results in scientific and technological investment and innovation optimization in the field of low-carbon economy. In order to continue to maintain and improve the performance level of science and technology, Chengdu should continue to increase investment in science and technology, and pay close attention to the scientific and technological development trend of low-carbon economies around the world, leading the sustainable development of Chengdu’s low-carbon economy.
- (4)
- Environment-evaluation results
As can be seen from the data in Table 8 above, Chengdu has shown a significant growth trend in the environment performance of low-carbon economy development in the past six years, but there is a certain degree of volatility. In 2018, the relative proximity Ci value of the environment dimension was relatively low, and it may be that the environmental governance measures in the early stage of the low-carbon transition had not yet formed a scale effect. However, since 2019, there has been a significant improvement in environment performance, which is attributed to Chengdu’s continuous efforts to strengthen environmental protection, optimize the industrial structure, and promote the research and application of green technologies. In 2020, Chengdu’s environment performance increased by leaps and bounds to 0.5817, which may be the clear promotion of the carbon peak target in the 14th Five-Year Plan, as well as the full implementation of ultra-low emission-transformation projects in key industries, so that Chengdu made substantial progress in low-carbon environmental protection. In 2021, the Ci value further increased to 0.7464, indicating that Chengdu continued to maintain environmental stability and optimization in the process of low-carbon economy development. By 2022, Chengdu’s environmental performance had grown steadily to 0.7897, but the growth rate had slowed down significantly. Up to 2023, the Ci value reached the highest point in the past six years to 0.9030, which fully demonstrated Chengdu’s outstanding achievements in the development of a low-carbon economy. Through several years of efforts, Chengdu continuously deepened its low-carbon development strategy, and achieved remarkable results in environmental protection, resource conservation, and recycling, laying a solid foundation for the sustainable development of the city.
In summary, Chengdu has shown a certain growth momentum and good stability in the environmental performance of low-carbon economy development in the past six years. Despite facing the challenges and difficulties in some years, Chengdu has successfully coped with these challenges and maintains a high level of environmental performance by strengthening policy guidance, technological innovation, and industrial upgrading.
- (5)
- Transportation-evaluation results
From the evaluation results of the transportation dimension, it can be seen that Chengdu has shown a significant growth trend in transportation performance under the low-carbon economy, and its relative closeness Ci value has shown a steady upward trend from 2018 to 2023, with the Ci value jumping from 0.0154 in 2018 to 0.9955 in 2023, an increase of nearly 65 times, which fully demonstrates Chengdu’s determination and effectiveness in promoting the development of low-carbon transportation. The Ci value in 2018 was 0.0154, and the low-carbon transportation performance was relatively low, which may be due to the fact that the promotion of new energy vehicles in Chengdu was in its infancy, and the construction of rail transit had not yet taken shape.
As Chengdu gradually increased its investment and efforts in low-carbon transportation, the Ci value began to increase from 0.0951 in 2019 to 0.1567 in 2020. This was mainly related to the rapid popularization of new energy vehicles and the continuous improvement of the rail transit network. Between 2021 and 2023, Chengdu’s low-carbon transportation performance grew rapidly, from 0.3685 in 2021 to 0.9955 in 2023. The continuous growth of Chengdu’s transportation performance may be related to a series of low-carbon transportation policies such as Chengdu’s vigorous promotion of the use of new energy vehicles, accelerating the construction of rail transit, optimizing the operation of public vehicles and increasing investment in new energy transportation facilities, which effectively reduce carbon emissions in the transportation field and promote the significant improvement of low-carbon transportation performance. Overall, Chengdu has shown significant progress in its transport performance in the low-carbon economy. However, in order to maintain and further improve the performance level of low-carbon transportation, Chengdu also needs to continue to improve its low-carbon transportation infrastructure and make greater contributions to building a green and low-carbon urban transportation system.
To sum up, Chengdu’s low-carbon economy-development performance has achieved remarkable results in the five aspects of economy, energy, technology, environment, and transportation, and the comprehensive performance-evaluation score has also increased year by year, proving Chengdu’s strength and potential in promoting low-carbon economy development. But the low-carbon economy is a long-term and complex process that requires continuous effort and innovation. Chengdu can continue to increase investment in low-carbon technology research and development, energy structure optimization, environmental management, and other aspects. At the same time, it should also actively promote the concept of low-carbon, improve the public’s awareness of low-carbon, and form a good atmosphere for the whole society to participate in low-carbon construction. In addition, Chengdu can also strengthen communication and cooperation with other cities and enterprises, and jointly explore and learn from each other new paths and models of low-carbon economy development. Through experience sharing and communication, Chengdu can further promote the innovation and application of low-carbon technologies, and make greater contributions to the realization of a higher level of low-carbon economy development.
5. Conclusions
This paper focuses on the development of the low-carbon economy in Chengdu, from a literature review, indicator system construction, subjective and objective empowerment method innovation to multi-dimensional evaluation and empirical evidence. The paper introduces the background of “carbon peak and carbon neutrality”, summarizes the core initiatives of Chengdu’s green and low-carbon transformation in recent years, and refines a total of 25 specific indicators in five dimensions of economy, energy, technology, environment and transportation, combining improved AHP, entropy weighting and coefficient of variation methods, and TOPSIS multi-indicator comprehensive evaluation, to realize the quantitative tracking of the development level of Chengdu’s low-carbon economy from 2018 to 2023, and analyze the development level of the low-carbon economy in the future. The quantitative tracking of the development level of Chengdu’s low-carbon economy in 2018–2023 is realized, the main influencing factors and weak links are analyzed, and targeted suggestions for improvement are put forward. The main work and contributions of the paper are summarized as follows.
From the perspective of theoretical significance, most of the studies focus on the evaluation of a low-carbon economy at the national or societal level, with a few delving into the low-carbon economy development of specific cities. However, there is currently no reference for constructing an evaluation indicator system for low-carbon economy development from the perspective of Chengdu city. This paper proposes a low-carbon economy-development evaluation model for Chengdu, injecting new content and perspectives into the existing urban low-carbon economy-development model theory.
From the perspective of practical significance, the low-carbon economy evaluation model constructed in this study provides a scientific tool for Chengdu to measure its own low-carbon development effectiveness. With the help of the evaluation system, specific weaknesses and potential difficulties in developing a low-carbon economy can be identified, improvement directions can be clarified, and more accurate and effective strategic plans can be formulated.
Furthermore, through the evaluation indicator system of Chengdu’s low-carbon economy development, we have clearly identified the strengths and weaknesses of Chengdu in developing a low-carbon economy, and targeted improvement suggestions are proposed to enhance the development of Chengdu’s low-carbon economy. In addition, the research ideas and methods proposed in this paper have important reference significance for the analysis of similar problems, which is conducive to other cities in China and throughout the world to help them define their own evaluation systems, discover their own problems, identify the right development direction, learn useful experience, draw lessons from the experience, and avoid repeating the same mistakes.
5.1. Conclusions and Suggestions
Establishing and improving a green, low-carbon, and circular economy system and promoting the comprehensive green transformation of the economy and society are the key strategies for China to deal with resources, environment, and ecological problems. Taking the low-carbon economy development of Chengdu as the research object, this paper constructs an evaluation model covering 5 second-level indicators and 25 third-level indicators from economy, energy, technology, environment, and transportation. In the evaluation process, the combination of subjective and objective methods is used to analyze and calculate the weights of Chengdu’s low-carbon economy-development indicators, and the TOPSIS method is used to conduct the evaluation. From the comprehensive evaluation results, it can be seen that the comprehensive score of Chengdu’s low-carbon economy has a significant improvement trend, from 0.0451 in 2018 to 0.9564 in 2023, which is due to a series of policies formulated and implemented of Chengdu in promoting green and low-carbon transformation, which not only help to achieve the twin goals of carbon peak and carbon neutrality, but also promote green and sustainable development, to achieve a win–win situation of economic development and environmental protection.
What is more, through an analysis of the evaluation results, some strategies and suggestions for the development of a low-carbon economy in Chengdu have been provided from various evaluation dimensions as follows:
- (1)
- Economy dimension
Strengthen the overall planning and strategic layout of low-carbon economy development, and continue to optimize the industrial structure; with advanced manufacturing and modern service industries as the core, and the new economy as the guide, improve the planning of industrial functional zones and guide the development of industrial agglomeration; strengthen policy guidance, encourage enterprises to carry out green technology innovation and low-carbon production mode transformation, cultivate green and low-carbon industrial clusters, and promote high-quality economic development and low-carbon transformation together.
- (2)
- Energy dimension
Adhere to the priority of conservation and deepen the transformation of the energy structure; continue to promote the strategy of clean energy substitution, and increase the development of clean energy such as natural gas and the application of renewable energy such as solar and wind energy; improve the clean energy supply infrastructure, strengthen the management of energy consumption, improve energy efficiency, consolidate the pattern of clean energy-based energy consumption, and reduce carbon emissions in the energy field.
- (3)
- Technology dimension
Build a support system for low-carbon technology innovation, and encourage scientific research institutions, universities, and enterprises to cooperate in low-carbon technology research and development; focus on key areas such as automation, new energy, and carbon capture and utilization, and accelerate the transformation and application of scientific and technological achievements; strengthen the empowerment of digital technology, promote the deep integration of low-carbon technologies with urban governance and industrial development, and provide technical support for the development of low-carbon economies.
- (4)
- Environment dimension
Continue to deepen the battle against pollution and improve the ecological environment governance system; strengthen the coordinated management of air, water, and soil pollution, and intensify the protection and restoration of ecosystems; implement the concept of “zero-waste city”, improve the disposal capacity of solid and hazardous waste, and enhance the ecological carbon sink capacity; improve the ecological environment-supervision system, strengthen the prevention and control of environmental risks, and promote the continuous improvement of the quality of the urban ecological environment.
- (5)
- Transportation dimension
Comprehensively promote the construction of a green transportation system and implement a low-carbon transportation-development strategy; optimize the layout of the public transportation network, promote the integrated development of rail transit and conventional public transportation, and improve the travel rate of public transportation; accelerate the promotion and application of new energy vehicles, improve the construction of charging infrastructure, and build a green travel mode of “urban rail transit, bus transit and non-motorized traffic”; explore intelligent traffic management, improve traffic-operation efficiency, and reduce carbon emissions in the transportation field.
In the light of the actual situation in Chengdu, some operational measures are recommended. For example, Chengdu can set the annual targets for the promotion of new energy vehicles, such as it is expected that by 2025, the overall scale of the automotive industry will reach CNY 300 billion, the number of new energy vehicles will reach 800,000, and the output will reach 250,000 [63]; promote the green and low-carbon upgrading of industries, guide financial resources to gather and support the construction of green manufacturing systems, actively support financing needs in industries such as clean energy, clean production, energy conservation and environmental protection, and digital economy, and increase financial support for traditional industries in equipment updates, technological upgrades, green transformation, and development; accelerate the implementation of the TOD project in Chengdu to significantly improve the quality of life for citizens by organically combining elements such as transportation, commerce, residential areas, and green spaces. Through these improvements, the relevance and applicability of the policy can be enhanced.
5.2. Limitations and Future Research
Although some results have been achieved through the quantitative analysis of Chengdu’s low-carbon economy development, there are also some challenges and limitations that need future research.
Firstly, in terms of time, this study focuses on the data research in the past 6 years, and the follow-up research can focus on the dynamic evolution of low-carbon economy models at different stages of development in Chengdu.
Secondly, combined with the strategic positioning of Chengdu as a transportation hub in the southwest of China, it makes sense to dig deep into the potential problems in the field of transportation-based carbon emissions. So, in the field of low-carbon transportation, future research can focus on the key role of electric vehicles and alternative fuel cell vehicles in Chengdu’s low-carbon economy from a more macro and systematic perspective. This research direction is highly consistent with Chengdu’s goal of building a green and low-carbon transportation system, which can provide a theoretical basis and technical support for the realization of the growth target of new energy vehicle ownership and the reduction of carbon emission intensity of operating vehicles, and promote the decarbonization process of Chengdu’s transportation field.
In addition, the indicator system can be appropriately expanded to include social governance dimensions. The existing system focuses on economy, energy, technology, environment, and transportation. It will consider adding indicators related to social governance (e.g., green participation rate of citizens, coverage of environmental protection publicity, number of people participating in carbon benefits, etc.) to reflect the multi-dimensional co-governance synergy between the people of Chengdu City, the community, and the government, which will better support the concept of green and low-carbon social synergy.
Finally, future research can focus on the innovative practices, deeply analyze the paths of low-carbon economy development in different regions and cities, and provide more targeted strategic suggestions for achieving urban environmental goals and promoting comprehensive green transformation of the economy and society, so as to help China continue to take solid steps on the path of low-carbon development.
Author Contributions
Conceptualization, Y.J., Y.H., J.Z. and J.S.; methodology, Y.J., Y.H., J.Z. and J.S.; software, Y.H., J.Z. and J.S.; validation, Y.J., Y.H., J.Z. and J.S.; formal analysis, Y.J., Y.H., J.Z. and J.S.; investigation, Y.J., Y.H., J.Z. and J.S.; resources, Y.J.; data curation, Y.H., J.Z. and J.S.; writing—original draft preparation, Y.J., Y.H., J.Z. and J.S.; writing—review and editing, Y.J., Y.H., J.Z. and J.S.; visualization, Y.J., J.Z. and J.S.; supervision, Y.J.; project administration, Y.J. All authors have read and agreed to the published version of the manuscript.
Funding
This research was funded by the Chengdu Science and Technology Bureau (grant number: 2021-YF08-00019-GX).
Data Availability Statement
The original contributions proposed in the study are included in this paper, and further inquiries can be directly addressed to the corresponding author.
Conflicts of Interest
The authors declare no conflicts of interest.
Appendix A. The Description of Evaluation Indicators
| Indicator | Description |
| C1: Per capita regional GDP | This is the Gross Domestic Product (GDP) of a region calculated as the average of the total resident population over a certain period of time (usually one year). |
| C2: Number of employed people | This refers to those who engage in certain social labor and obtain labor remuneration or business income. |
| C3: Urbanization rate | This is the proportion of urban population to total population including agricultural and non-agricultural, and it reflects the process of population migration from rural areas to cities. |
| C4: Total fixed assets investment | This is the sum of work and related expenses incurred in constructing and purchasing fixed assets in monetary form over a certain period of time. |
| C5: Per capita disposable income of urban residents | These two indicators reflect the average living standard and purchasing power of urban and rural residents. Per capita disposable income means, after deducting non-income factors such as personal income tax and property income transfer payments, the actual income level of urban and rural households that can be used for final consumption expenses and other non-mandatory expenses. |
| C6: Per capita disposable income of rural residents | |
| C7: Total energy consumption | This is the proportion of energy consumption to output, which refers to the amount of energy consumed per unit of GDP, and it is an important indicator for measuring the relationship between energy efficiency and economic development. |
| C8: Comprehensive utilization rate of industrial solid waste | This means, during a certain period of time, the ratio of solid waste generated in the industrial production process that is recycled, reused, treated, and disposed of for resource utilization, reduction, and harmless treatment. |
| C9: Proportion of clean energy consumption | This is the percentage of clean energy consumption to total energy consumption, and it reflects the shift in energy structure from traditional fossil fuels to cleaner and low-carbon energy. |
| C10: Electricity consumption | This is the quantity of active energy consumed by the electricity-consuming object, and the increase in electricity consumption also brings energy consumption and environmental pressure. |
| C11: R&D expenditure | This refers to all actual expenses incurred during the reporting period for the implementation of R&D activities, reflecting the government’s investment and emphasis on technological innovation. |
| C12: Number of patent authorizations | This includes the number of invention patents, utility model patents, and design patents. The increase in patents means the emergence of new technologies and innovative methods that may help promote the development and application of low-carbon technologies. |
| C13: Published scientific papers | This means the number of scientific and technological papers, i.e., the number of academic papers generated by scientific and technological projects approved by enterprises and institutions, and published in journals with official publication numbers. |
| C14: Per capita park green area | This is the per capita occupancy of urban park green space area. |
| C15: Forest coverage rate | This is the percentage of forest area to land area in a country or region. |
| C16: Green coverage rate in built-up areas | This is the ratio of green coverage area in urban built-up areas to built-up area. |
| C17: Harmless treatment rate of household waste | This is the percentage of harmless treatment of urban household waste to the total amount of urban household waste generated. |
| C18: Sewage-treatment rate | This is the proportion of treated domestic and industrial wastewater to the total sewage discharge. |
| C19: Number of urban parks | This is the number of parks in the city. |
| C20: Emissions of sulfur dioxide | This is the sum of industrial sulfur dioxide emissions and domestic sulfur dioxide emissions during the reporting period. |
| C21: Total carbon dioxide emissions | This refers to the sum total of carbon dioxide emissions generated directly or indirectly by human activities. These emissions mainly come from processes such as energy consumption, industrial production, transport, etc. |
| C22: Number of new energy vehicles | This is the current number of new energy vehicles preserved. The use of new energy vehicles can reduce carbon emissions in the transportation field. |
| C23: Number of TOD projects | This is the number of comprehensive land use and development projects centered around public transportation stations in a specific area. |
| C24: Operating mileage of rail transit | This refers to the length of rail lines and is an important indicator for measuring the scale of the rail system. |
| C25: Number of public operating vehicles | This refers to the total number of public buses and trams used for public passenger-transportation operations in a city. |
References
- Niu, D.X.; Wu, G.Q.; Ji, Z.S.; Wang, D.Y.; Li, Y.Y.; Gao, T. Evaluation of provincial carbon neutrality capacity of China based on combined weight and improved TOPSIS model. Sustainability 2021, 13, 2777. [Google Scholar] [CrossRef]
- Niu, H.Y.; Zhang, Z.H.; Luo, M. Evaluation and prediction of low-carbon economic efficiency in China, Japan and South Korea: Based on DEA and machine learning. Int. J. Environ. Res. Public Health 2022, 19, 12709. [Google Scholar] [CrossRef] [PubMed]
- Chen, Y.; Liu, S.B.; Wu, H.Q.; Zhang, X.L.; Zhou, Q. How can Belt and Road countries contribute to glocal low-carbon development? J. Clean. Prod. 2020, 256, 120717. [Google Scholar] [CrossRef]
- Lan, Z.Y.; Chen, X.H.; Liu, Y.; Chen, D.Q.; Li, W.Q. Complex network construction and pattern recognition of China’s provincial low-carbon economic development with long time series: Based on the detailed spatial relationship. Pol. J. Environ. Stud. 2022, 31, 2131–2148. [Google Scholar] [CrossRef]
- Zhang, Z.Y.; Zhang, Z.X. The construction and empirical study on evaluation index system of international low-carbon economy development. Front. Energy Res. 2021, 9, 761567. [Google Scholar] [CrossRef]
- European Commission. Delivering the European Green Deal. Available online: https://commission.europa.eu/strategy-and-policy/priorities-2019-2024/european-green-deal/delivering-european-green-deal_en (accessed on 10 April 2024).
- Bortone, I.; Sakar, H.; Soares, A. Gaps in regulation and policies on the application of green technologies at household level in the United Kingdom. Sustainability 2022, 14, 4030. [Google Scholar] [CrossRef]
- Ministry of Economy, Trade and Industry (METI). Green Growth Strategy Through Achieving Carbon Neutrality in 2050. Available online: https://www.meti.go.jp/english/policy/energy_environment/global_warming/ggs2050/index.html (accessed on 10 April 2024).
- Guo, J.-H.; Lai, X.-Y.; Lu, C.-X.; Cao, S.-X. What has caused China’s economic growth? Econ. Syst. 2022, 46, 100982. [Google Scholar] [CrossRef]
- International Energy Agency (IEA). Global Energy Review: CO2 Emissions in 2021. Available online: https://www.iea.org/reports/global-energy-review-co2-emissions-in-2021-2 (accessed on 10 April 2024).
- Xiang, K.-L.; Zheng, N.; Chen, J.-C.; Gao, W. Evaluation and obstacle degree analysis of low-carbon development level in Fujian province–based on entropy weight TOPSIS method. Front. Energy Res. 2022, 10, 948893. [Google Scholar] [CrossRef]
- Government of China. China Submits Progress on the Implementation of China’s Nationally Determined Contributions. 2022. Available online: https://www.gov.cn/xinwen/2022-11/12/5726372/files/b01ead68146e4dc293b1b4463be2eb20.pdf (accessed on 10 April 2024).
- State Council Information Office. China’s Green Development in the New Era. Available online: http://www.scio.gov.cn/zfbps/zfbps_2279/202303/t20230320_707666.html (accessed on 3 April 2025).
- Government of China. Guidelines for the Construction of Carbon Peak and Carbon Neutrality Standard System. Available online: https://view.officeapps.live.com/op/view.aspx?src=https%3A%2F%2Fwww.gov.cn%2Fzhengce%2Fzhengceku%2F2023-04%2F22%2F5752658%2Ffiles%2Fca1e5bc66ab74234849669d4c94267ea.doc&wdOrigin=BROWSELINK (accessed on 1 July 2025).
- Center for Environmental and Economic Policy Research, Ministry of Ecology and Environment. China’s Policies and Actions on Carbon Peaking and Carbon Neutrality. 2023. Available online: http://www.prcee.org/zyhd/202402/W020240221571739442016.pdf (accessed on 3 April 2025).
- Ministry of Ecology and Environment of the People’s Republic of China. China’s Policies and Actions Addressing Climate Change 2024 Annual Report. Available online: https://english.mee.gov.cn/News_service/news_release/202501/P020250122370358250549.pdf (accessed on 1 July 2025).
- Yang, W.X.; Hu, Y.; Ding, Q.Y.; Gao, H.; Li, L.G. Comprehensive evaluation and comparative analysis of the green development level of provinces in Eastern and Western China. Sustainability 2023, 15, 3965. [Google Scholar] [CrossRef]
- Zhuang, G.Y. An analysis of “low carbon path” potentials in China’s economic growth. Pac. J. 2005, 13, 79–87. [Google Scholar]
- Yan, K.; Zhang, W.; Shen, D.H. Stylized facts of the carbon emission market in China. Phys. A 2020, 555, 124739. [Google Scholar] [CrossRef]
- Xing, Z.Y.; Huang, J.; Wang, J. Unleashing the potential: Exploring the nexus between low-carbon digital economy and regional economic-social development in China. J. Clean. Prod. 2023, 413, 137552. [Google Scholar] [CrossRef]
- Mohsin, M.; Rasheed, A.K.; Sun, H.P.; Zhang, J.J.; Iram, R.; Iqbal, N.; Abbas, Q. Developing low carbon economies: An aggregated composite index based on carbon emissions. Sustain. Energy Technol. Assess. 2019, 35, 365–374. [Google Scholar] [CrossRef]
- Irfan, M. Low-carbon energy strategies and economic growth in developed and developing economies: The case of energy efficiency and energy diversity. Environ. Sci. Pollut. Res. 2021, 28, 54608–54620. [Google Scholar] [CrossRef]
- Hou, W.J.; Pan, X.C.; Pu, Y.; Ma, R.; Saleem, A. Harnessing artificial intelligence for energy strategies: Advancing global economic policies and hydrogen production in the transition to a low-carbon economy. Energy Strateg. Rev. 2024, 56, 101568. [Google Scholar] [CrossRef]
- Behera, B.; Sahoo, M.; Sethi, L.; Das, A.; Sethi, N.; Ahmad, M. Fuelling the low-carbon transportation sector in emerging economies: Role of institutional quality, environmental tax, green technology innovation and biofuel. Transp. Policy 2025, 166, 124–134. [Google Scholar] [CrossRef]
- Georgescu, I.A.; Bâra, A.; Oprea, S.V. Challenges for low-carbon economies in Latin America. Testing pollution haven hypothesis in developing countries. Energy Rep. 2024, 12, 5280–5299. [Google Scholar] [CrossRef]
- Abbass, K.; Zafar, M.W.; Khan, F.; Begum, H.; Song, H.M. COP 28 policy perspectives: Achieving environmental sustainability through FDI, technological innovation index, trade openness, energy consumption, and economic development in N-11 emerging economies. J. Environ. Manag. 2024, 369, 122271. [Google Scholar] [CrossRef]
- Višković, A.; Franki, V.; Bašić-Šiško, A. City-level transition to low-carbon economy. Energies 2022, 15, 1737. [Google Scholar] [CrossRef]
- Zhang, S.F.; Xu, G.H.; Shu, Y.; Zhu, J.; Cheng, W. Comparing developed and emerging nations’ Economic development with environmental footprint for low-carbon competitiveness. Heliyon 2024, 10, e34039. [Google Scholar] [CrossRef]
- Shi, L.Y.; Xiang, X.Q.; Zhu, W.; Gao, L.J. Standardization of the evaluation index system for low-carbon cities in China: A case study of Xiamen. Sustainability 2018, 10, 3751. [Google Scholar] [CrossRef]
- Linderhof, V.; Dekkers, K.; Polman, N. The role of mitigation options for achieving a low-carbon economy in the Netherlands in 2050 using a system dynamics modelling approach. Climate 2020, 8, 132. [Google Scholar] [CrossRef]
- Zhang, P.; Gao, H.X.; Zhang, D.Y.; Zhou, E.Y.; Khan, F. Charting a sustainable tomorrow: Advancing urban low-carbon economies through comprehensive evaluation and promotion. PLoS ONE 2024, 19, e0299688. [Google Scholar] [CrossRef]
- Kadioglu, I.; Turan, O.; Gurbuz, I.B. ARDL bound testing approach for a green low-carbon circular economy in Turkey. Sustainability 2025, 17, 2714. [Google Scholar] [CrossRef]
- Ye, M.; Deng, F.; Yang, L.; Liang, X.D. Evaluation of regional low-carbon circular economy development: A case study in Sichuan Province, China. Int. J. Clim. Change Strateg. Manag. 2022, 14, 54–77. [Google Scholar] [CrossRef]
- Lyu, S.; Zhang, J.T.; Xu, Z.H. Research on the current situation and countermeasures of low-carbon ecological urban development: A case study of Guangdong province. Int. J. Low-Carbon Technol 2024, 19, 619–627. [Google Scholar] [CrossRef]
- Du, H.B.; Chen, Z.N.; Mao, G.Z.; Li, R.Y.M.; Chai, L.H. A spatio-temporal analysis of low carbon development in China’s 30 Provinces: A perspective on the maximum flux principle. Ecol. Indic 2018, 90, 54–64. [Google Scholar] [CrossRef]
- Duan, Y.; Mu, H.L.; Li, N.; Li, L.L.; Xue, Z.Q. Research on comprehensive evaluation of low carbon economy development level based on AHP-entropy method: A case study of Dalian. Energy Procedia 2016, 104, 468–474. [Google Scholar] [CrossRef]
- Zhang, Y.Y.; Cheng, J.H.; Shen, Z.J.; Liu, S.H.; Xiao, T.; Mitsuhiko, K. Study on the construction of energy-saving evaluation index system for the development of low-carbon industrial—A case study in Pingtan of Fujian Province, China. Energy Rep. 2021, 7, 86–92. [Google Scholar] [CrossRef]
- Wang, J.L.; Li, H.W.; Guo, H.F. Coordinated development of logistics development and low-carbon environmental economy base on AHP-DEA model. Sci. Program 2022, 2022, 5891909. [Google Scholar] [CrossRef]
- Meng, M.; Fu, Y.A.; Wang, L.X. Low-carbon economy efficiency analysis of China’s provinces based on a range-adjusted measure and data envelopment analysis model. J. Clean. Prod 2018, 199, 643–650. [Google Scholar] [CrossRef]
- Li, F.L.; Zhang, Y.J. Simulation of development strategies and evaluation of low-carbon development level in Jiangsu Province under carbon peaking and carbon neutrality goals. Sustainability 2024, 16, 1597. [Google Scholar] [CrossRef]
- Pan, W.Y.; Gulzar, M.A.; Hassan, W. Synthetic evaluation of China’s regional low-carbon economy challenges by driver-pressure-state-impact-response model. IJERPH 2020, 17, 5463. [Google Scholar] [CrossRef] [PubMed]
- Shi, B.F.; Yang, H.F.; Wang, J.; Zhao, J.X. City green economy evaluation: Empirical evidence from 15 sub-provincial cities in China. Sustainability 2016, 8, 551. [Google Scholar] [CrossRef]
- Wang, Y.J.; Li, H.G. Complex chemical process operation evaluations using a novel analytic hierarchy process model integrating deep residual network with principal component analysis. Chemom. Intell. Lab. 2019, 191, 118–128. [Google Scholar] [CrossRef]
- Zhong, C.H.; Yang, Q.C.; Liang, J.; Ma, H.Y. Fuzzy comprehensive evaluation with AHP and entropy methods and health risk assessment of groundwater in Yinchuan Basin, northwest China. Environ. Res. 2022, 204, 111956. [Google Scholar] [CrossRef]
- Han, G.; Feng, G.-Z.; Tang, C.-L.; Pan, C.-Y.; Zhou, W.-M.; Zhu, J.-T. Evaluation of the ventilation mode in an ISO class 6 electronic cleanroom by the AHP-entropy weight method. Energy 2023, 284, 128586. [Google Scholar] [CrossRef]
- Bi, Y.F.; Mao, J.Y. Preliminary study on the combination of the analytical hierarchy process and Delphi methods in Chinese medicine clinical research. Chin. J. Integr. Tradit. West. Med. 2012, 32, 689–692. [Google Scholar]
- Yin, L.J.; Yi, J.Z.; Lin, Y.B.; Lin, D.C.; Wei, B.J.; Zheng, Y.Y.; Peng, H. Evaluation of green mine construction level in Tibet based on entropy method and TOPSIS. Resour. Policy 2024, 88, 104491. [Google Scholar] [CrossRef]
- Zhang, Y.; Zhang, Y.J.; Zhang, H.; Zhang, Y.X. Evaluation on new first-tier smart cities in China based on entropy method and TOPSIS. Ecol. Indic. 2022, 145, 109616. [Google Scholar] [CrossRef]
- Yan, A.; Tan, X.C.; Gu, B.H.; Zhu, K.W.; Shi, L.J.; Ding, Z.Y. An assessment of renewable energy development in Belt and Road Initiative countries: An entropy and TOPSIS approach. Energy Rep. 2023, 10, 3545–3560. [Google Scholar]
- Dwivedi, P.P.; Sharma, D.K. Evaluation and ranking of battery electric vehicles by Shannon’s entropy and TOPSIS methods. Math. Comput. Simul. 2023, 212, 457–474. [Google Scholar] [CrossRef]
- Zhao, H.; Hao, X. Location decision of electric vehicle charging station based on a novel grey correlation comprehensive evaluation multi-criteria decision method. Energy 2024, 299, 131356. [Google Scholar] [CrossRef]
- Arena, E.; Corsini, A.; Ferulano, R.; Iuvara, D.A.; Miele, E.S.; Ricciardi Celsi, L.; Sulieman, N.A.; Villari, M. Anomaly detection in photovoltaic production factories via Monte Carlo pre-processed principal component analysis. Energies 2021, 14, 3951. [Google Scholar] [CrossRef]
- Ma, X.-F.; Zhang, R.; Ruan, Y.-F. How to evaluate the level of green development based on entropy weight TOPSIS: Evidence from China. Int. J. Environ. Res. Public Health 2023, 20, 1707. [Google Scholar] [CrossRef]
- Zhang, K.; Liang, X.; Wei, H.; Liu, S.; Su, K. An improved TOPSIS-ANP composite shielding material performance evaluation method based on gray relational projection algorithm. Front. Energy Res. 2023, 10, 1102997. [Google Scholar] [CrossRef]
- Tang, Z.; Huang, T.Y.; Si, X.P.; Wang, W.L. Spatial and temporal evolution of total factor productivity of low-carbon tourism industry based on DEA–Malmquist Index model. IJLCT 2022, 17, 1254–1260. [Google Scholar] [CrossRef]
- Yu, X.H.; Lou, W.G. An exploration of prediction performance based on projection pursuit regression in conjunction with data envelopment analysis: A comparison with artificial neural networks and support vector regression. Mathematics 2023, 11, 4775. [Google Scholar] [CrossRef]
- Yang, W.G.; Wu, Y.J. A novel TOPSIS method based on improved grey relational analysis for multiattribute decision-making problem. Math. Probl. Eng. 2019, 2019, 8761681. [Google Scholar] [CrossRef]
- Wu, L.F.; Liu, S.F.; Yao, L.G.; Yan, S.L. Grey convex relational degree and its application to evaluate regional economic sustainability. Sci. Iran. 2013, 20, 44–49. [Google Scholar] [CrossRef]
- China Association of Mayors. Li Xun: How to Achieve Urban Renewal Action Under the “Dual Carbon” Goal. Available online: https://www.citieschina.org.cn/show/id/a1692772921571.html (accessed on 28 June 2025).
- Wang, X. A preliminary analysis of the current status of low carbon economy development in Chengdu. J. TaiYuan Urban Vocat. Coll. 2012, 8, 7–8. [Google Scholar]
- The People’s Government of Sichuan Province. Action Plan for Building a Park City Demonstration Zone in Chengdu to Practice the New Development Concept (2021–2025). Available online: https://cds.sczwfw.gov.cn/art/2022/5/25/art_15395_181227.html?areaCode=510100000000 (accessed on 27 June 2025).
- The People’s Government of Chengdu Municipality. Notice from the General Office of the People’s Government of Chengdu Municipality on Issuing the Action Plan for Optimizing Spatial Structure and Promoting Green and Low Carbon Development in Chengdu City, as well as the Policy Measures for Optimizing Spatial Structure and Promoting Green and Low Carbon Development in Chengdu City. Available online: https://www.chengdu.gov.cn/gkml/cdsrmzfbgt/xzgfxwj/1635125971893886976.shtml (accessed on 10 April 2025).
- The People’s Government of Chengdu Municipality. Implementation Opinions of the General Office of Chengdu Municipal People’s Government on Promoting the Development of New Energy Vehicle Industry in Chengdu. Available online: https://www.chengdu.gov.cn/gkml/cdsrmzfbgt/qtwj/1646400540776624128.shtml (accessed on 10 April 2025).
- The People’s Government of Chengdu Municipality. Chengdu’s 14th Five Year Plan for Energy Development. Available online: https://www.chengdu.gov.cn/cdsrmzf/c147315/2023-12/14/content_290b10d9d4ae43fba0969d5d9d9e958e.shtml (accessed on 10 April 2025).
- Chengdu Municipal Bureau of Statistics. Statistical Communique on the National Economic and Social Development of Chengdu in 2023. Available online: https://cdstats.chengdu.gov.cn/cdstjj/c154795/2024-03/30/68e47282894d4e47a77e59f5592808ab/files/a5a8441f314b4f3ba70f2dc98c9b7398.pdf (accessed on 10 April 2025).
- William, H.; Xin, M. The state-of-the-art integrations and applications of the analytic hierarchy process. Eur. J. Oper. Res. 2018, 267, 399–414. [Google Scholar]
- Wang, G.H.; Xiong, L.; Dong, Y.; Wang, Z.Q. Deriving Information from Judgment Matrix and Regulating It According as Consistent Rule in AHP. ORMS 2004, 6, 41–44. [Google Scholar]
- Xiong, L.; Liang, L.; Wang, G.H. A new method of determining the reliability of decision-makers in group decision. Syst. Eng. 2004, 3, 84–87. [Google Scholar]
- Saaty, T.L. A scaling method for priorities in hierarchical structures. J. Math. Psychol. 1977, 15, 234–281. [Google Scholar] [CrossRef]
- Saaty, T.L.; Tran, L.T. On the invalidity of fuzzifying numerical judgments in the Analytic Hierarchy Process. Math. Comput. Modell. 2007, 46, 962–975. [Google Scholar] [CrossRef]
- Wongvilaisakul, W.; Netinant, P.; Rukhiran, M. Dynamic multi-criteria decision making of graduate admission recommender system: AHP and fuzzy AHP approaches. Sustainability 2023, 15, 9758. [Google Scholar] [CrossRef]
- Hu, C.-K.; Liu, F.-B.; Hu, C.-F. A hybrid fuzzy DEA/AHP methodology for ranking units in a fuzzy environment. Symmetry 2017, 9, 273. [Google Scholar] [CrossRef]
- Li, P.L.; Lu, H.J. The comprehensive evaluation and empirical study of low carbon economy in coal enterprises based on AHP & Entropy. China Coal 2015, 5, 16–23. [Google Scholar]
- Jia, Y.; Wang, Z.Q.; Li, Q.Y. Evaluation and analysis of industrial Internet maturity for power enterprises in the digital trans-formation. Systems 2025, 13, 104. [Google Scholar] [CrossRef]
- Mohammad, R.Z.B. Selection of strategies to improve energy efficiency in industry: A hybrid approach using entropy weight method and fuzzy TOPSIS. Energy 2023, 279, 128070. [Google Scholar]
- Yang, B.; Wu, X.-F.; Hao, J.-X.; Xu, D.-P.; Liu, T.Y.; Xie, Q.-Y. Estimation of wood failure percentage under shear stress in bamboo-wood composite bonded by adhesive using a deep learning and entropy weight method. Ind. Crops Prod. 2023, 197, 116617. [Google Scholar] [CrossRef]
- Wang, L.; Li, Y.H.; Wang, Y.Q.; Gao, J.L.; Xia, Q.Q.; Tu, Y.Y.; Nie, P.P. Compensation benefits allocation and stability evaluation of cascade hydropower stations based on Variation Coefficient-Shapley Value Method. J. Hydrol. 2021, 599, 126277. [Google Scholar] [CrossRef]
- Chengdu Municipal Statistics Bureau. Chengdu Statistical Yearbook (2024). Available online: https://cdstats.chengdu.gov.cn/cdstjj/c178732/2024-12/31/025ae6eb8f4f4a27b6245a53b5f98b53/files/ec301260371a4499a4204a738851a54f.pdf (accessed on 15 April 2025).
- Chengdu Municipal Statistics Bureau. Statistical Bulletin on Science and Technology Funding in Chengdu in 2023. Available online: https://cdstats.chengdu.gov.cn/cdstjj/c154795/2024-10/22/content_e0ade58cb5b3494d9f2dafb720851701.shtml (accessed on 15 April 2025).
- Chengdu Municipal Bureau of Ecological Environment. Statistical Bulletin of the Ecological Environment of Chengdu 2016-2019. Available online: https://sthj.chengdu.gov.cn/cdhbj/c166175/2022-01/24/b90c74fb2a8c4a02abbbd112834d5a19/files/5fd3b5fbdf8b4eb696d9dac4abd969d2.pdf (accessed on 15 April 2025).
- Carbon Emission Accounts and Datasets (CEADs). The Emission Inventories for 290 Chinese Cities from 1997 to 2019. Available online: https://www.ceads.net/user/index.php?id=1280&lang=en (accessed on 15 April 2025).
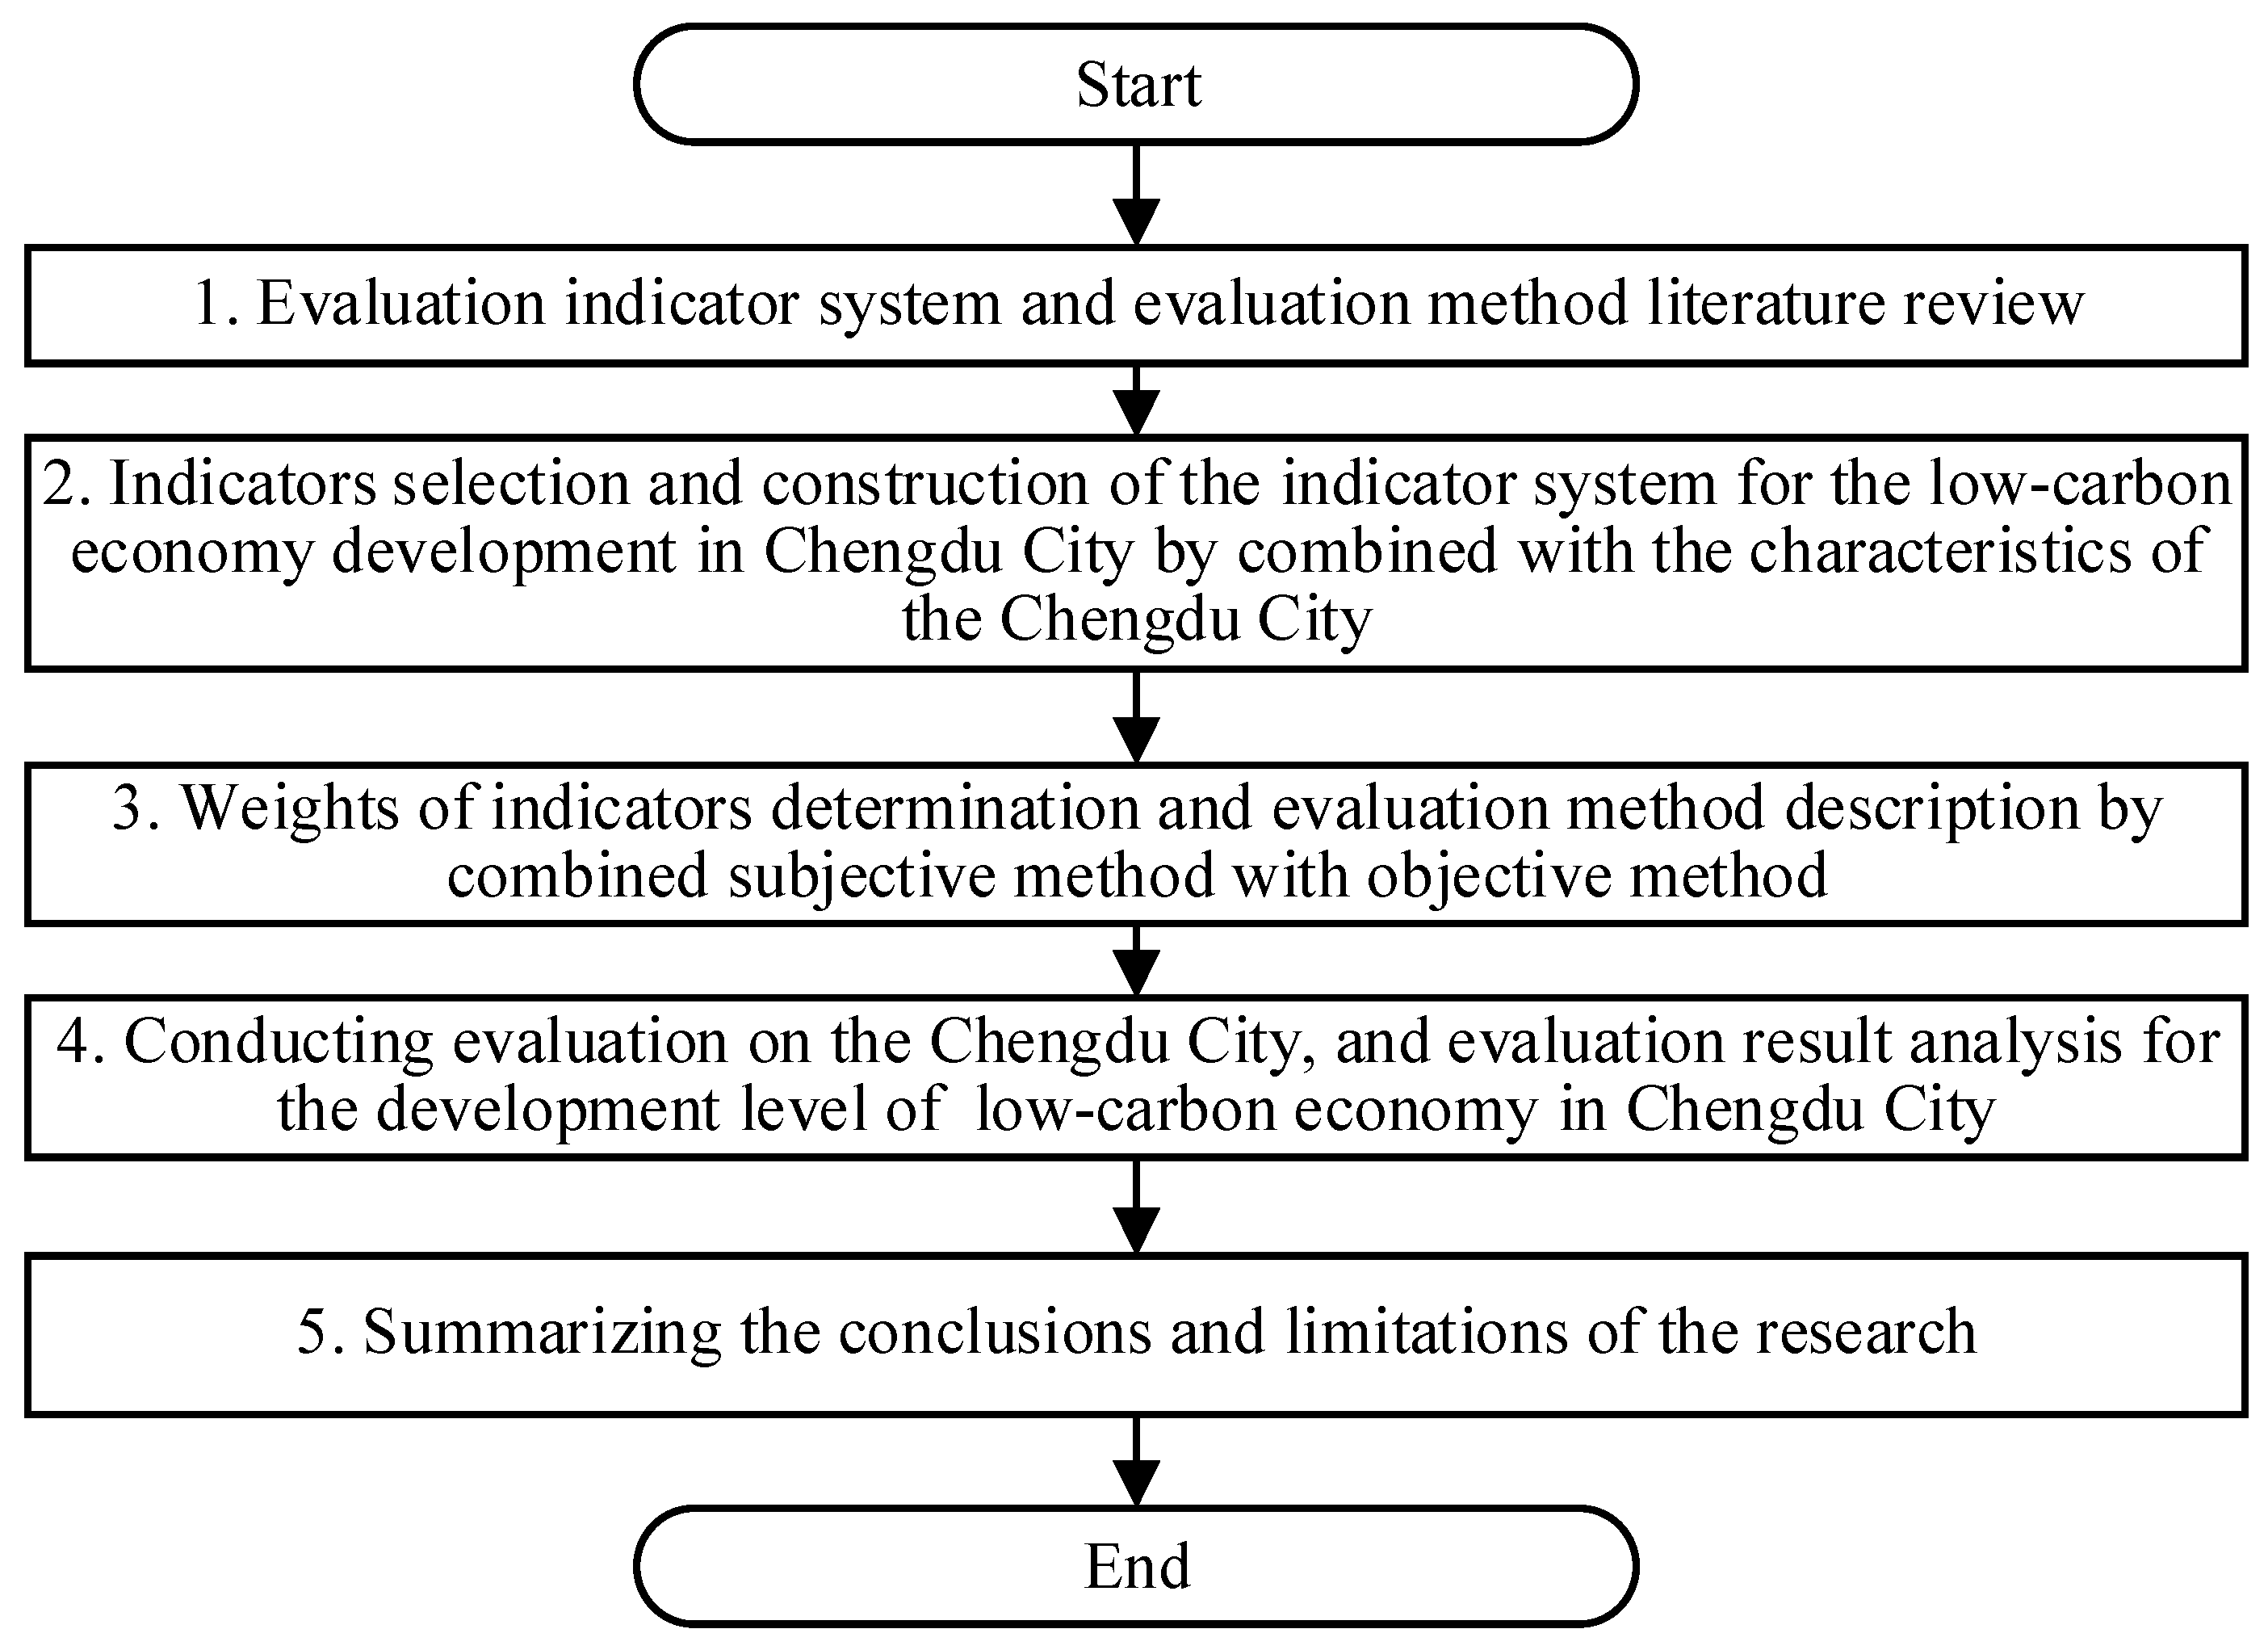

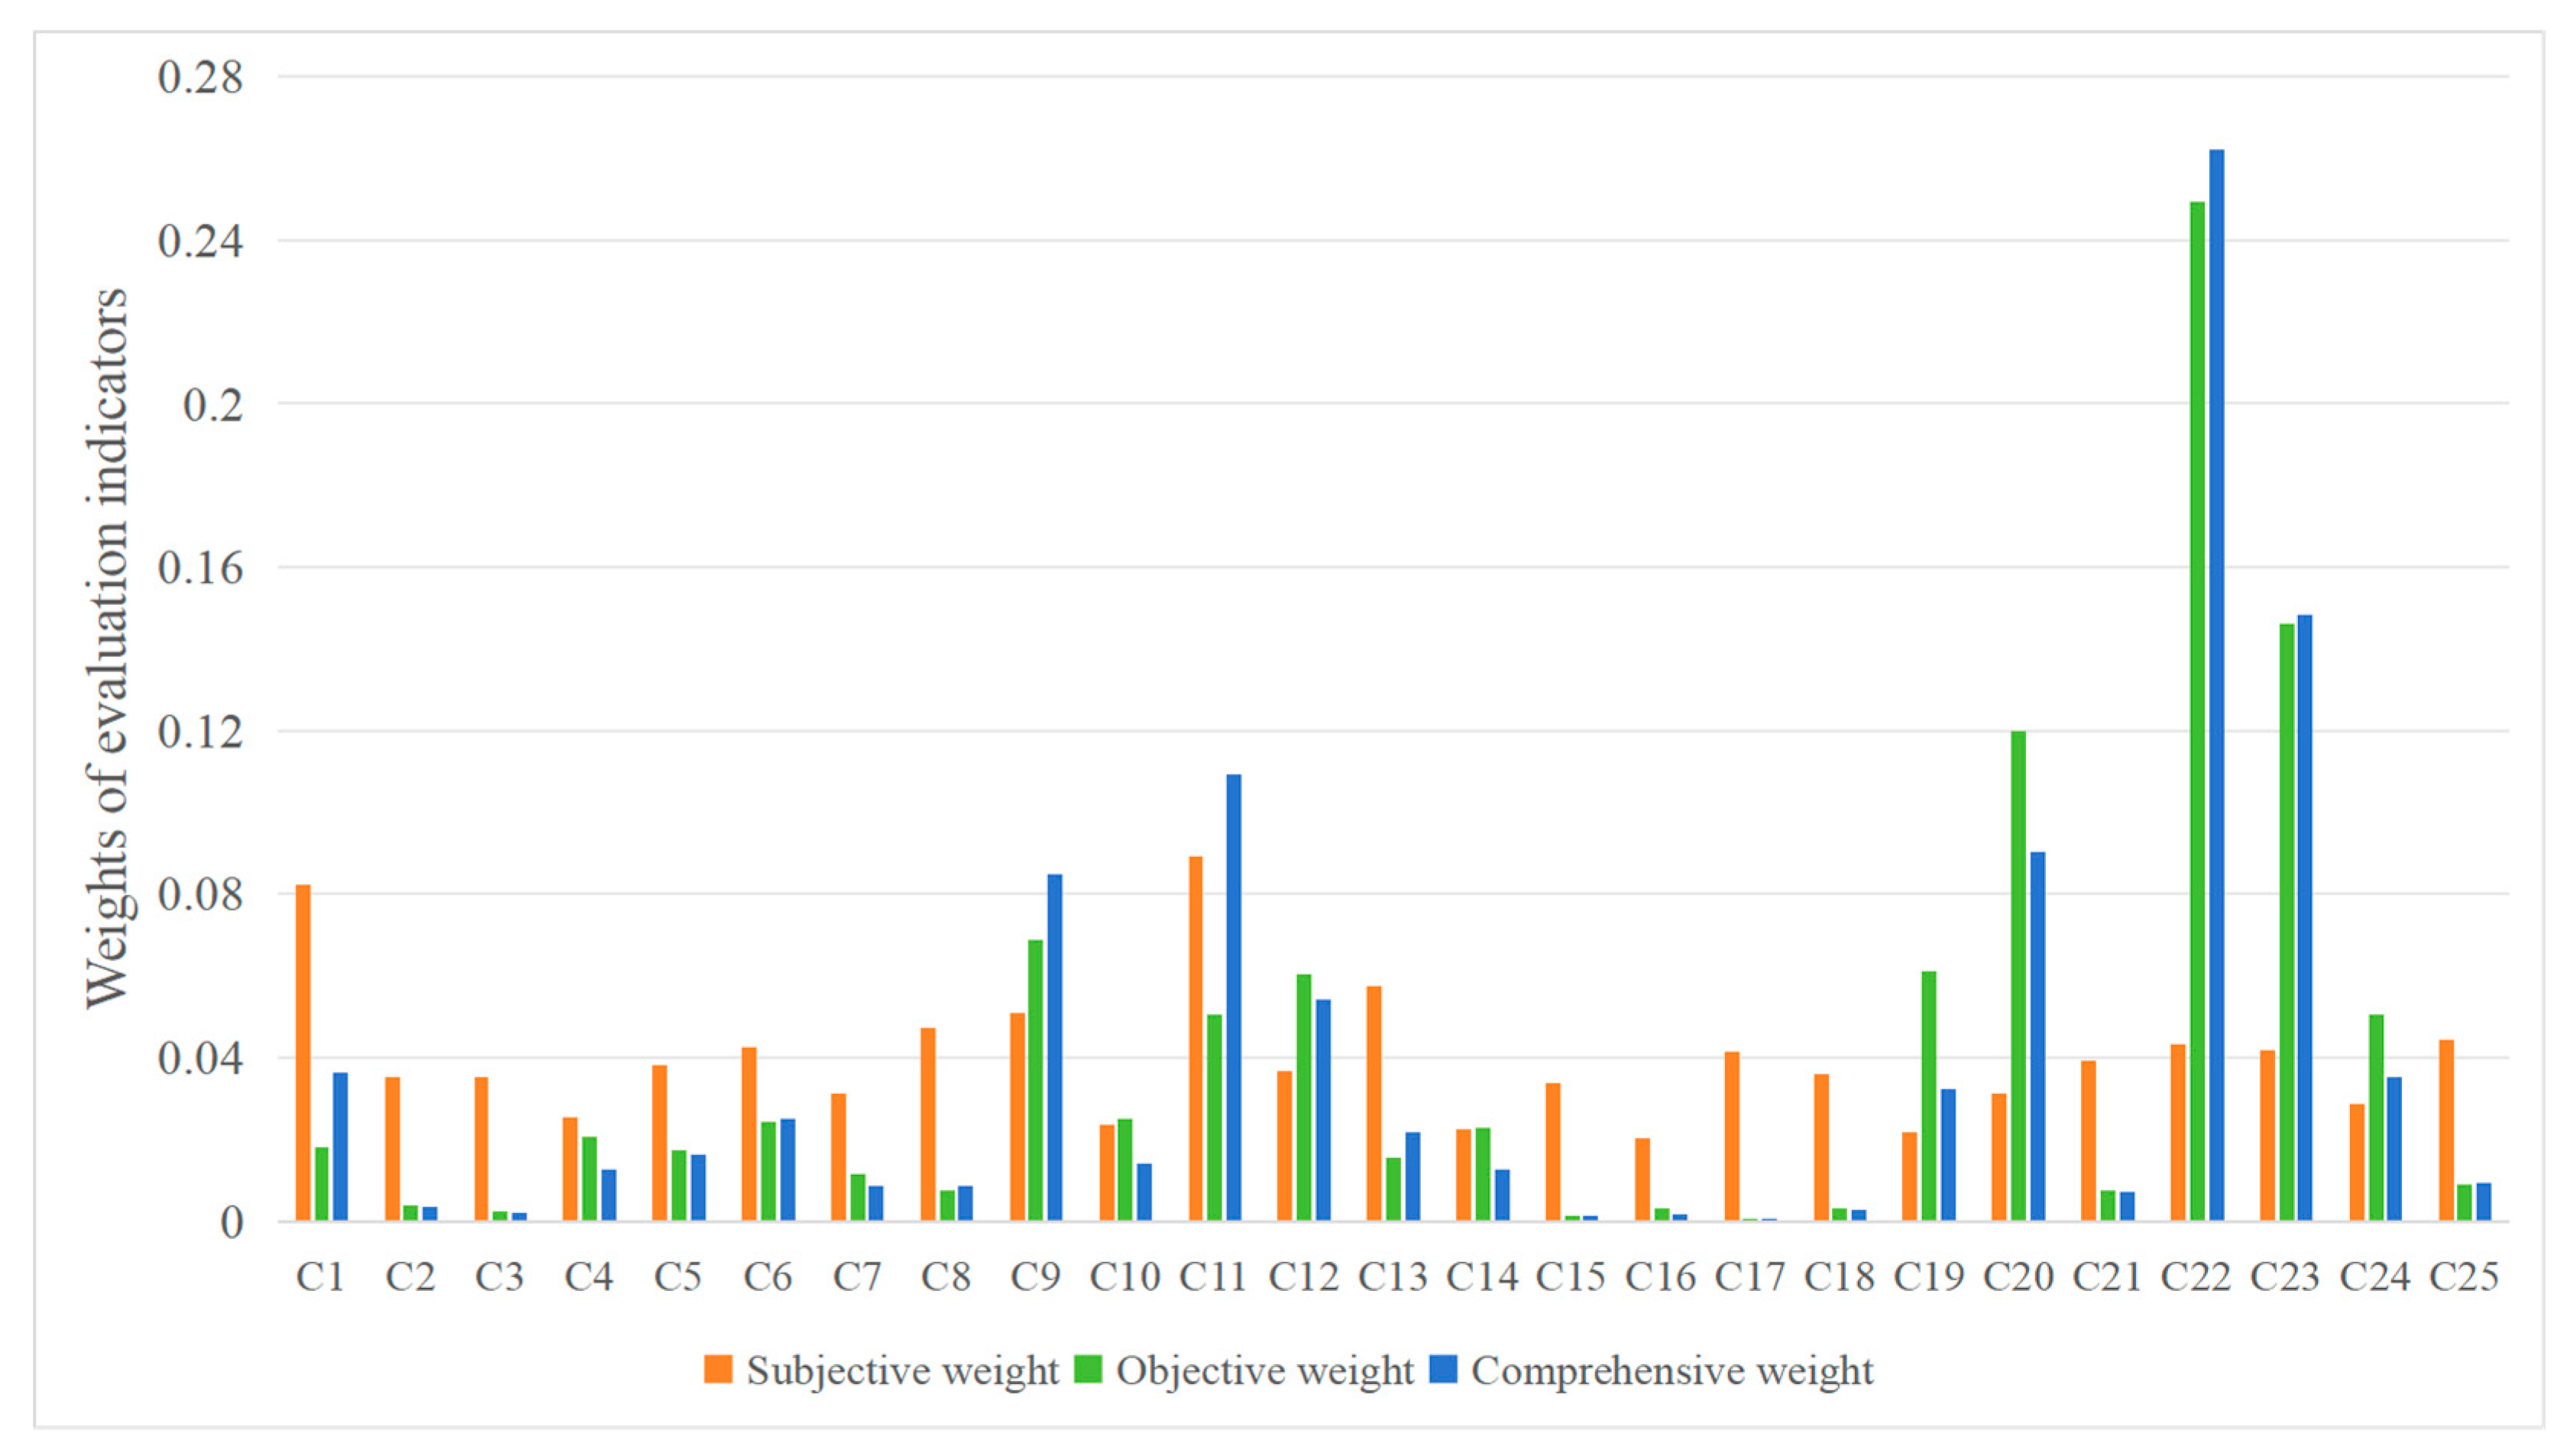
Disclaimer/Publisher’s Note: The statements, opinions and data contained in all publications are solely those of the individual author(s) and contributor(s) and not of MDPI and/or the editor(s). MDPI and/or the editor(s) disclaim responsibility for any injury to people or property resulting from any ideas, methods, instructions or products referred to in the content. |
© 2025 by the authors. Licensee MDPI, Basel, Switzerland. This article is an open access article distributed under the terms and conditions of the Creative Commons Attribution (CC BY) license (https://creativecommons.org/licenses/by/4.0/).