Article

Research on the Spatial Correlation Pattern of Sustainable Development of Cities in the Yangtze River Delta Region of China, Based on the Dynamic Coupling Perspective of “Ecology-Economy”

1
School of International and Public Affairs, Shanghai Jiao Tong University, 1954 Huashan Road, Xuhui District, Shanghai 200230, China
2
Institute of Healthy Yangtze River Delta, Shanghai Jiao Tong University, 1954 Huashan Road, Xuhui District, Shanghai 200230, China
*
Author to whom correspondence should be addressed.
Systems 2025, 13(7), 533; https://doi.org/10.3390/systems13070533
Submission received: 12 April 2025 / Revised: 19 May 2025 / Accepted: 16 June 2025 / Published: 1 July 2025
(This article belongs to the Section Systems Practice in Social Science)

Abstract

Focusing on the dynamic change process of urban ecology and economy, this paper explores the spatial correlation pattern of cities in the Yangtze River Delta (YRD) region for sustainable development from 2012 to 2023 based on the coupled coordination model, gravitational model, and social network analysis (SNA). First, the sustainable development level of the city shows a certain upward trend in the time dimension. In the spatial dimension, there is significant regional differentiation, which roughly shows the development characteristics of gradual increase from the interior to the coast. Second, cities with lower-level sustainable development and higher-level sustainable development always maintain their own stability, but being adjacent to a city with lower-level sustainable development increases the probability of an improvement. Third, cities that play an important role in driving the level of spatial correlation for sustainable development are mainly concentrated in the central and eastern parts of the YRD, with Shanghai, Suzhou, Nanjing, and Hangzhou being the most important radiation centers in the pattern of spatial correlation. Fourth, the affiliation system of sustainable development gradually changes from the double core system of Shanghai–Suzhou to the triple core system of Shanghai–Suzhou–Hangzhou to drive and lead the development of the subordinate cities. Fifth, the spatial network can be categorized into four plates: benefit, overflow, bilateral spillover, and broker, with obvious linkage effects between plates.

1. Introduction and Literature Review

In recent years, global black swan events have occurred frequently, and the world economy has not yet emerged from the quagmire of the 2008 financial crisis and is facing the most serious systemic crisis since the end of the Second World War [1,2]. At the same time, with the acceleration of China’s urbanization, many cities have, to varying degrees, experienced problems such as overpopulation, extreme environmental degradation, and serious ecological damage [3]. The city is a complex system composed of social, economic, ecological, and other elements interacting with, interdependent on, and constrained by each other [4,5]. In the process of urban development, it is necessary to adopt the values of sustainable development if the living environment is to be improved and the coordinated development of the economy and the environment is to be ensured [6].
In 1987, the World Commission on Environment and Development issued the report Our Common Future, which for the first time systematically elaborated the concept of sustainable development, defining it as “development that meets the needs of the present without jeopardizing the ability of future generations to meet their own needs”. Since then, the concept of sustainable development has been continuously deepened and enriched, and it mainly refers to finding a way of development that is coexisting and harmonious at the intersection of economic, social, and ecological conditions [7]. In recent years, scholars’ research on quantitative measurement of urban sustainable development generally integrates economic, social, ecological, environmental, livelihood and other related indicators [8]; however, due to the complexity of the internal structure of the city, which makes the selection of indicators of urban sustainable development broad and the measurement process difficult, urban sustainable development measured under different perspectives often presents different results.
In fact, whether the coordination between economy and ecology has always been the focus of attention of sustainable urban development, and the contradiction between the two is the most prominent in the system of internal contradictions of sustainable urban development, and also the most urgent to be solved [9]. The research on the relationship between the two by scholars at home and abroad has increased rapidly [10,11], and the research method has gradually changed from qualitative analysis to quantitative evaluation, and the evaluation model has also transitioned from a single perspective and a single conceptual model to different perspectives and different conceptual models [12]. For example, the fixed-effects regression model is used to measure the coupling and coordination between the socio-economic and ecological environments of the Chengdu-Chongqing urban agglomeration and its spatial and temporal characteristics [13]; the Kuznets econometrics model is used to simulate the existence of an “inverted U-shape” relationship between the economy and the environment [14].
For the selection of indicators for measuring the coordinated development of socio-economic development and ecological environmental protection, many current studies are able to take into account both the characteristics of the selected indicators, the size of the data volume and other factors, as well as the actual situation of the selected region [15,16]. And the attention to ecological-economic coupling at the city level has gradually increased, especially in provincial capital cities [17], resource-based cities [18], and urban agglomerations [13,19]. However, the above studies have neglected to measure economy and ecology from a dynamic perspective. Against the background of ecological pressure or economic risk in cities nowadays, it is a new challenge for sustainable urban development to enhance the dynamic adaptive capacity of cities by resisting pressure, adjusting structure, adapting to changes, and even seeking new development paths [20]. Based on this, this paper utilizes the PSR (Pressure-State-Response) model to construct an immediate and dynamic urban ecological health indicator that can reflect the dynamic interaction process between people and ecology [21,22]. The PSR model, or Pressure-State-Response model, was proposed by Canadian statisticians David J. Rapport and Tony Friend in 1979, and later jointly developed by the Organization for Economic Co-operation and Development (OECD) and the United Nations Environment Program (UNEP) in the 1980s and 1990s for studying environmental problems. It is a framework for the study of environmental issues developed jointly by the Organization for Economic Cooperation and Development (OECD) and the United Nations Environment Program (UNEP) in the 1980s and 1990s. At the same time, referring to the Ecosystem Health Assessment (EHA), the widely accepted “vigor-organization-resilience” system of indicators is used to characterize the “State” of urban ecology [23,24]. In addition, ecosystem services, as an integrator of macro-ecological functions, are a more effective indicator of ecosystem background status than ecosystem vitality expressed through metabolic capacity or primary productivity, and are also more spatially appropriate at the level of urban studies [25]. Therefore, in this paper, we replace the term ‘vitality vigor’ with ‘ecosystem services’. In the economic aspect, Martin et al. gave the dynamic adaptation and real-time adjustment capacity of urban economy when facing shocks or changes, i.e., the ability to resist and absorb shocks, the speed and degree of recovery after shocks, and the ability to reintegrate internal resources and adjust its own structure after shocks to adapt to the new external environment [26,27,28]. Based on Martin et al.’s study on economic resilience, this paper measures the process of economic dynamics of cities in terms of three processes: resistance, adaptation, and transformation.
In summary, in order to reflect the dynamic characteristics of urban ecology and economy in the indicators of sustainable development, this study adopts the resilience of the urban economy in the face of external pressures as an evaluation indicator, which is also known as the economic resilience indicator. And the ecological health evaluation of the city, on the other hand, takes the PSR model as a framework, and at the same time refers to the ecosystem health assessment (EHA) method to construct the ecological health indicator. Thus, it is possible to obtain the sustainable development indicators of the city from the perspective of “ecological-economic” coupling. The spatial linkage of sustainable urban development in the Yangtze River Delta (YRD) is the existence of geospatially based interactions and linkages among cities in the YRD region in terms of economic, social, and ecological aspects. This linkage reflects the interaction and synergistic development relationship between cities in the regional development process. The study is of strong practical significance for promoting coordinated regional development, improving resource utilization efficiency, upgrading regional innovation capacity, and promoting the development of smart cities. Considering that there are not many studies on city clusters for sustainable development in the existing literature, and few studies related to their spatial correlation patterns. In this paper, 26 cities in the Yangtze River Delta (YRD) region are selected as research objects, and social network analysis is utilized to further reveal their spatial correlation patterns on the basis of exploring the level of sustainable development of each city. Compared with the traditional spatial measurement model, social network analysis reveals the spatial correlation and spatial structure more thoroughly, and can reveal the influence of spatial correlation “relationship”, which has been widely used in many fields such as economics, management, and computer science [29,30,31]. The main contributions of this paper are as follows:
(1)
At a time when multiple systemic crises continue to impact the sustainable development of cities, it is of great practical significance to explore, for the first time, urban sustainable development and its spatial correlation for sustainable development from the perspective of the dynamic coupling of ecology and economy.
(2)
This paper evaluates the sustainable development level of cities in the Yangtze River Delta city cluster from the aspects of spatial differentiation and evolution, focusing on the stability of sustainable development and the influence of neighboring regions on the region.
(3)
Based on unique relational data and novel network perspectives, this paper adopts a modified gravity model to construct a spatial correlation network for sustainable development of cities in the Yangtze River Delta region, by depicting the structural characteristics of the network as a whole, portraying the status and roles of the cities in the network, and revealing the way of spatial clustering in the network and the roles played by various segments.
(4)
This paper innovates the concept of subordination to measure the characteristics of node connections and derives the subordination network on the basis of the spatial association network, which is an effective supplement to the existing social network analysis methods.

2. Materials and Methods
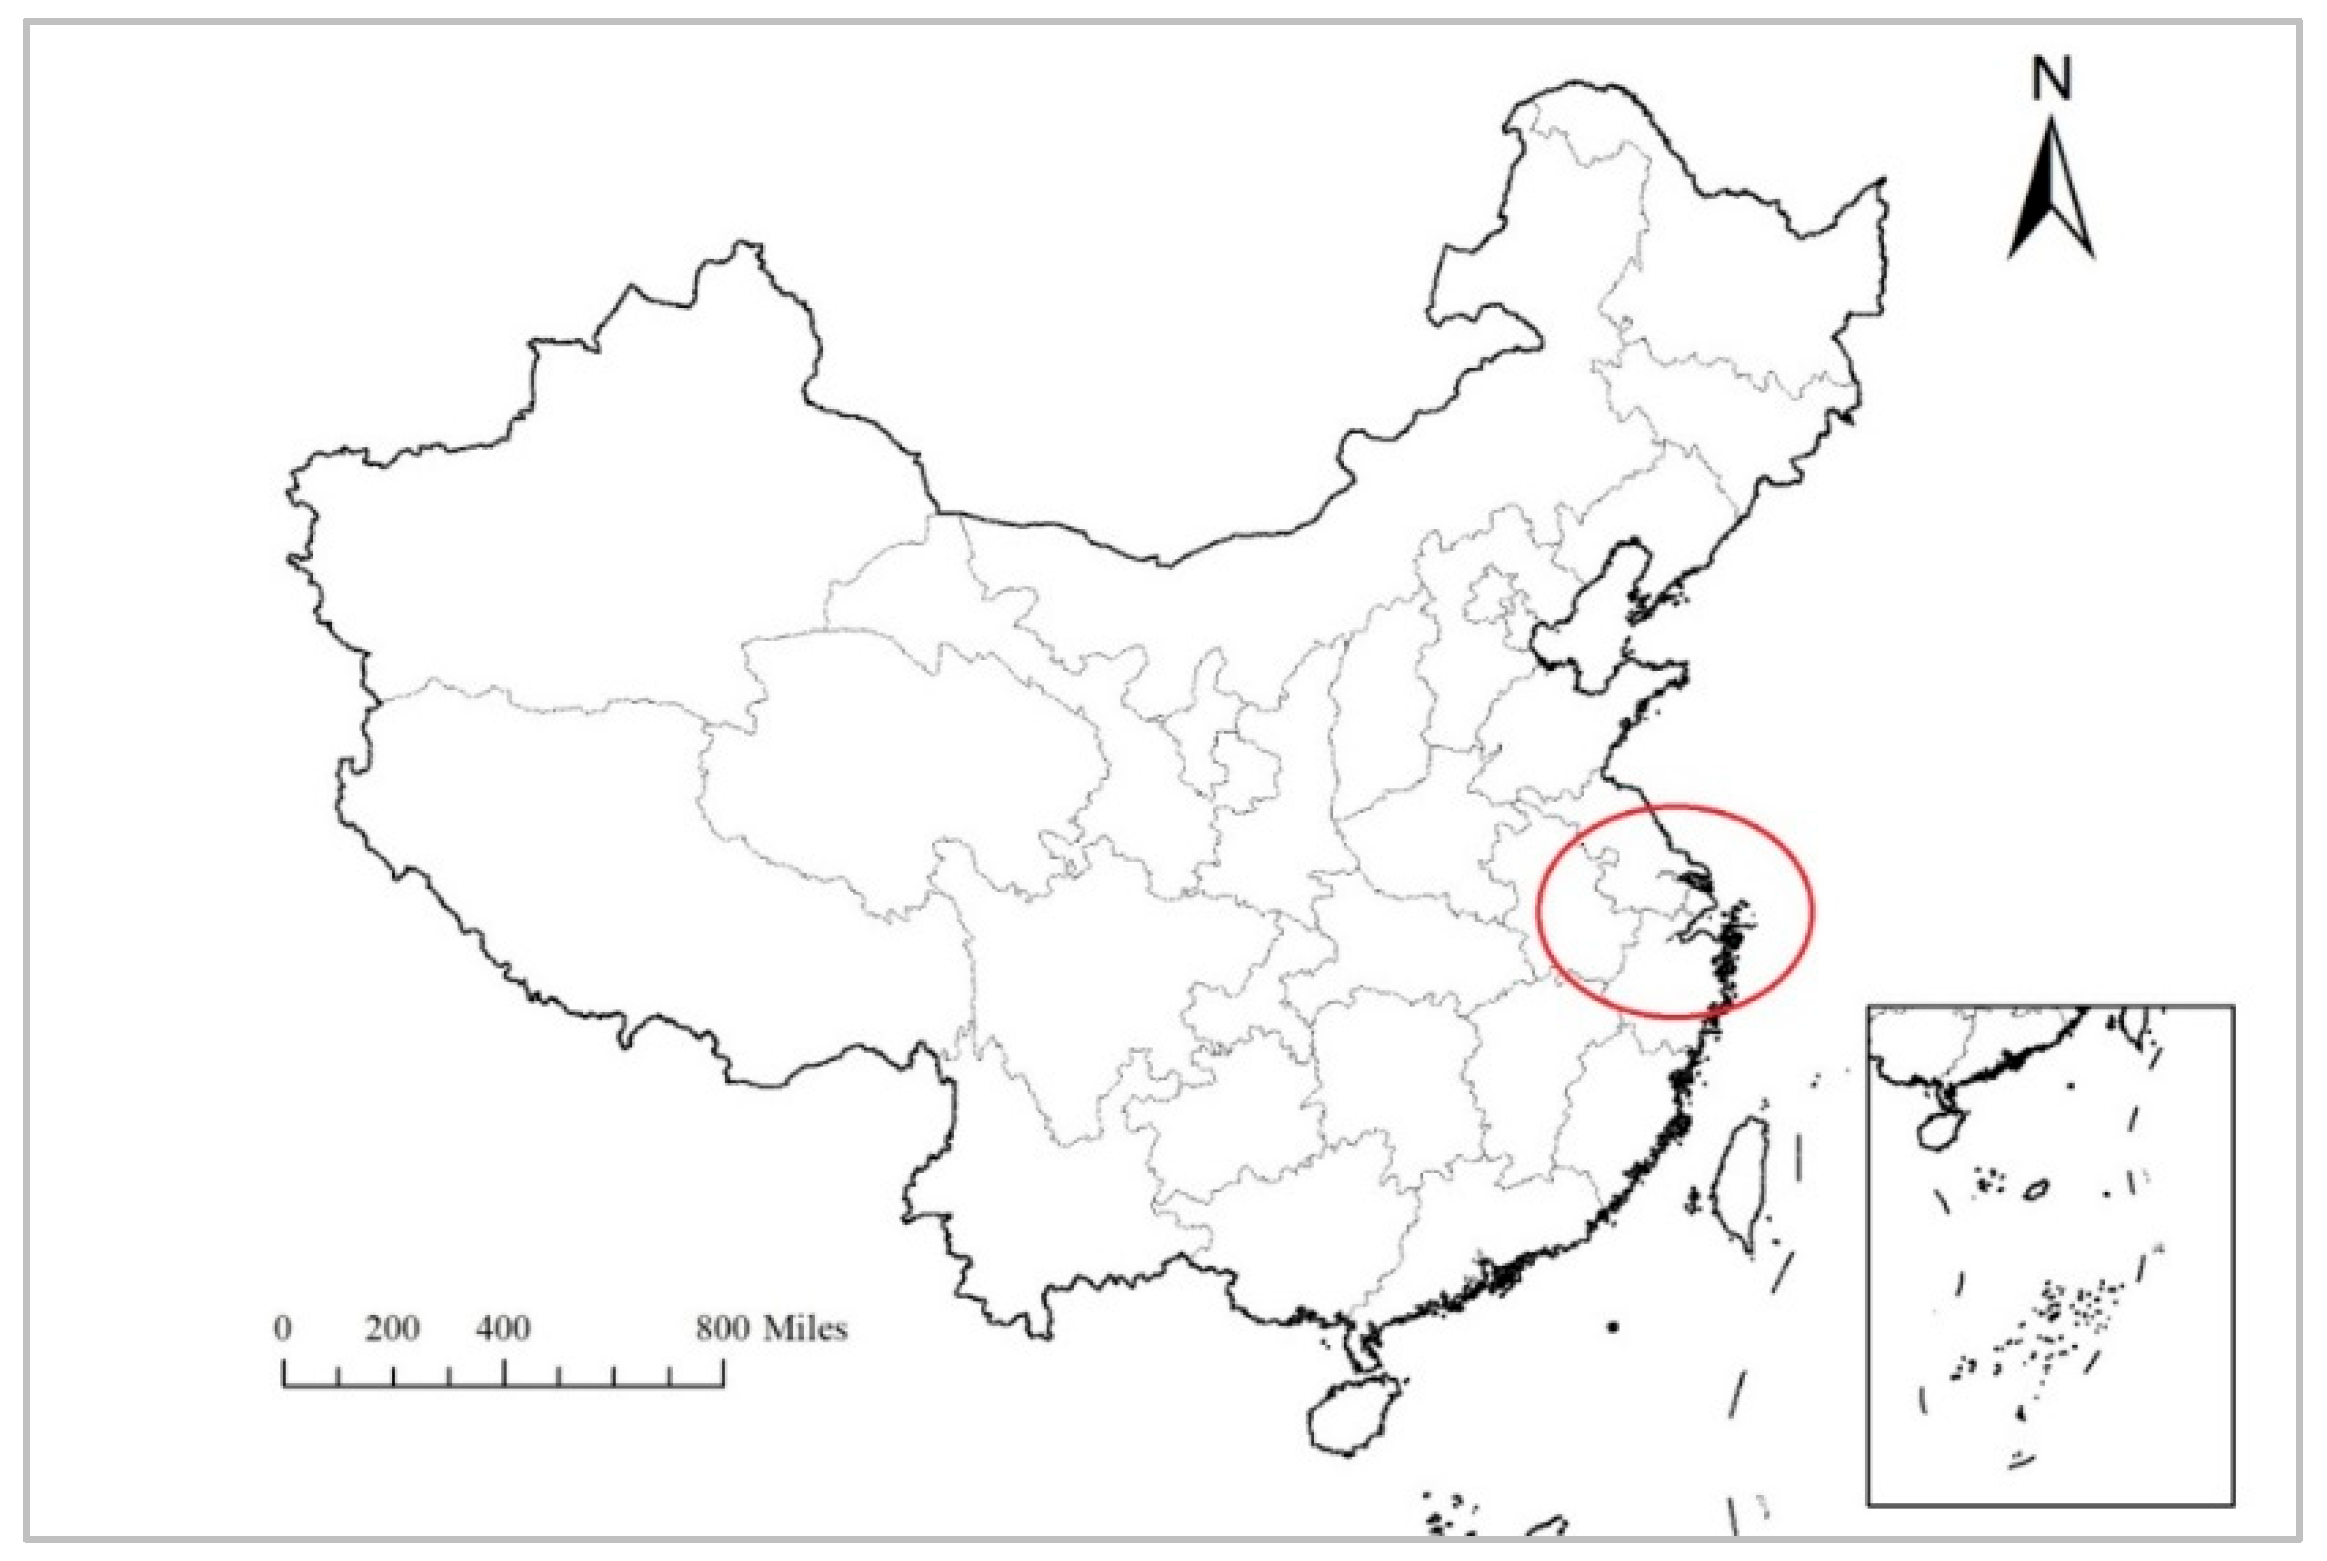
2.1. Study Area

According to the “Yangtze River Delta City Cluster Development Plan” approved by the State Council of China, the YRD includes 26 cities. The YRD serves as a crucial junction for both the “Belt and Road” initiative and the Yangtze River Economic Belt, occupying a key strategic role in the advancement of China’s sustainable development process. The geographical location and shape of the YRD are shown in Figure 1 and Figure 2, respectively.

2.2. Evaluation Indicators

In order to reflect the dynamic characteristics of urban ecology and economy in the indicators, this research adopts the resilience that the urban economy shows when facing external pressure as the evaluation indicator, i.e., the economic resilience indicator. Three of these dimensions together describe the ability of the economic system to react and recover in the face of shocks. Of these, stress is the starting point. It is an external or internal shock to the economic system that is the trigger for economic resilience. Without stress, there is no test of economic resilience. Adaptation is the medium-term response. It is the immediate response of the economic system to stress in the short term, aimed at mitigating the impact of shocks and maintaining the basic functioning of the economy. Adaptation measures are usually adjustments within the existing economic structure and framework. Conversion is long-term change. It is a profound change in the economic system in response to a prolonged or severe stress, aimed at fundamentally enhancing the resilience and sustainability of the economy. Conversions usually take longer and require more resource inputs, but provide more lasting benefits. The ecological health evaluation of the city, on the other hand, takes the PSR model as a framework, and at the same time refers to the ecosystem health assessment (EHA) method to construct the ecological health indicator. Combining the previous discussion on ecological health and economic resilience, the availability of relevant data, and referring to the research results of relevant scholars at home and abroad, the following indicators are selected to construct a comprehensive indicator system. The description of indicators is shown in Table 1.

2.3. Entropy Method

The weights of indicators are determined using the entropy method. Utilizing the volume of data provided by each indicator, the entropy method can eliminate bias caused by subjective factors. Before using the entropy method, the data need to be standardized, and then the calculation of indicator weights needs to be carried out. Finally, the ecological health index and economic resilience index are derived.

2.4. Coupling Coordination Model

The coupling is often applied to describe the extent of correlation between two systems. The greater the coupling degree is, the stronger the interaction and synergistic relationship between the systems, and the expression is shown in Equation (1). However, the coupling degree cannot be used to determine whether this coupling is benign or not, nor can it reflect the development level of the system itself. Therefore, the calculation of the coupling degree should also be combined with that of the coordination degree to objectively reflect the level of coordination between systems, and the expression of the coupling coordination degree is shown in Equation (2).
C i = [ ( E H i × E R i ) ( E H i + E R i 2 ) 2 ] 2
where C i denotes the coupling degree of the city i ; E H i denotes the ecological health index of the city i ; and E R i denotes the economic resilience index of the city i .
D i = C i × T i , T i = ( α E H i + β E R i )
where D i denotes the coupling coordination degree of the city i , which is also the sustainable development index of the city, and the value ranges from 0 to 1. T i denotes the coordination degree of the city i ; α and β are the weight indicators, and α = β = 0.5 is set in this paper, indicating that each is equally important.

2.5. Spatial Markov Chain

The Markov chain is adept at illustrating the developmental trajectory of events, allowing for the discretization of the coupling coordination into various state levels and the computation of transition probabilities, which is applicable to the transfer state between the coupling coordination of cities in different years. When considering the characteristics of spatial data, the spatial Markov chain ascertains the neighboring state by leveraging the spatial weight matrix, and converts the original k k conditional transfer matrix into a k   k k conditional transfer matrix, and uncovers whether the neighborhood has an impact on sustainable development by comparing the values of the elements corresponding to the two matrices.

2.6. Indicators of the Spatial Correlation Network

2.6.1. Modified Gravity Model

We use the gravity model to construct the spatial correlation of sustainability development level among cities and modify the gravity model to enhance its applicability. The modified gravitational model is shown in Equation (3).
y i j = k i j G i P i D i 3 G j P j D j 3 d i j , k i j = D i D i + D j
where y i j characterizes the gravitational force; P i and P j denote the total year-end population; D i and D j denote the sustainable development index; G i and G j denote the gross regional product; d i j denotes the geographical distance. By Equation (3), the gravitational matrix of the sustainable development index is calculated. A critical value is calculated by averaging each row of the gravitational matrix, and gravitational forces exceeding the critical threshold for a given row are marked as 1, meaning that the cities in the row are related to those in the column; in contrast, If the gravitational force falls below the critical value for a specific row, it is denoted as 0, meaning that the cities in the row are not related to those in the column.

2.6.2. Spatial Affiliation Degree

In the literature using SNA, scholars mainly focus on the totality of the network, the centrality of nodes, the cohesiveness of subgroups, and the characteristics of partial blocks within the group [32,33], but they rarely study the characteristics of connections between nodes. At the same time, given the vast and intricate web of relationships within social networks, characterized by numerous subordinate connections, a critical challenge lies in devising methods to “simplify” these complex interrelations. We introduce the notion of subordination to quantify the predominant directionality of node connections and apply this method to reveal the characteristics of inter-city sustainability correlations to determine the degree of subordination and independence of the city’s correlations with other cities. The spatial affiliation network based on the subordination degree between nodes is a derivative of the original network. The definition formula of the subordination degree is shown in Equation (4).
S i j = y j i j = 1 n y j i
where j = 1 n y j i refers to the total sum of the gravitational force components that result from the interactions between the city i and all the other cities. y j i is the fraction of the gravitational force that the city j contributes. S i j indicates the attraction extent of the city i to the city j . We use the affiliation values of the city i to all other cities to construct the affiliation matrix. Each row’s threshold value in the matrix is established at 0.2, and a value exceeding 0.2 denotes the presence of a subordination relationship, which is marked as 1. On the contrary, when the subordination degree does not surpass the threshold of 0.2, it is designated as 0. Ultimately, a subordination network is constructed in which an arrow indicates “subordination”, and a node to which the arrow points represents a city on the receiving end of the subordination relationship.

2.6.3. Indicators of Overall Network Characteristics

Based on the SNA method, the correlation characteristics of sustainable development among cities are quantified by using relevant network analysis indicators. Therefore, this paper uses two dimensions, network density and network efficiency, to characterize the overall attributes of the network. Network density is quantified by the ratio of the actual association relationships to the potential maximum number of such relationships, serving as a metric for the tightness of interconnections among nodes. A higher network density indicates a more closely coupled and coordinated association between cities in a coupled spatially linked network. Network efficiency is assessed based on the number of redundant connections it encompasses relative to its constituent count. The more connections, the more stable the network, and the higher the network efficiency.

2.6.4. Indicators of Individual Network Characteristics

Degree centrality (DC) reflects the extent of direct correlation that a city has with other cities. DC is further divided into point-out and point-in, where point-out denotes the quantity of associations that a city actively extends to other cities, whereas point-in represents the quantity of associations that a city receives from other cities in a more passive capacity. Calculating degree centrality is performed by using Equation (5).
D C = ( I n d i + O u t i ) 2 ( n 1 )
where n is the number of nodes, and the same applies below.
Betweenness centrality (BC) measures the extent of a city’s control over the interconnections between other cities and the degree to which it is “centrally located” among other cities. The formula is shown in Equation (6).
B C = 2 j n k n g j k ( i ) / g j k n 2 3 n + 2
where g j k ( i ) denotes the count of the shortest association paths between nodes k and j through node i , and g j k denotes the count of the shortest association paths between nodes k and j , where k j i , and j < k .
Closeness centrality (CC) measures the extent to which a city is autonomous from the influence and control of other cities. The higher the closeness centrality, the more direct connections a city has with other cities, positioning it as a central actor. The formula is presented in Equation (7).
C C = j = 1 n d i j n 1
where d i j signifies the direct distance between two nodes.
Eigenvector centrality (EC) refers to the overall importance size of the other cities that are directly related to a city and reflects the importance of that city to some extent. If the centrality of other cities connected to this city is high, then this city is also in a critical position in the network.

2.7. Data Source

The timeframe for this study spans from 2012 to 2023, with a focus on 26 cities within the YRD. The data are sourced from the China City Statistical Yearbook and the EPS Database. Among indicators, diversification of industrial structure (DIS) is quantified by Equation (8), which is fundamentally a negative sum of the employment components in each industry and the natural logarithmic product of these proportions, where e i s is the number of people employed in city i by industry s ; e i is the total number of people employed in city i . The rationalization of industrial structure (RIS) is measured by the deviation degree of the industrial structure; the formula is presented in Equation (9), where Y i n and Y i are the output value of industry n and total output value, respectively, and L i n and L i are the employment of industry n and total employment, respectively. The smaller the RIS is, the more the industrial structure deviates from equilibrium. The calculation method for advanced industrial structure (AIS) is shown in Equation (10), where I S G 1 i , I S G 2 i , and I S G 3 i represent the respective ratios of the primary, secondary, and tertiary sectors to the GDP. The calculation of ecological services, landscape fragmentation index, and ecosystem recovery force was based on land use remote sensing monitoring data. The accuracy of interpretation generally reached more than 85%. The first-level land use types are divided into arable land, forestland, grassland, water, construction land, and unused land. The socioeconomic, ecological construction, environmental protection, and government investment data required for the calculation of other ecological health indicators are obtained from the China Statistical Yearbook of Urban Construction, China Statistical Yearbook of Environment, China Statistical Yearbook of Agriculture, China Statistical Yearbook of Industry, and the statistical yearbooks and bulletins of the relevant provinces and cities.
D I S i = s = 1 s ( e i s e i ) ln ( e i s e i )
R I S i = 1 / n = 1 3 ( Y i n Y i ) ln Y i n / L i n Y i / L i 1
A I S i = ( I S G 1 i × 1 + I S G 2 i × 2 + I S G 3 i × 3 ) / 3

3. Results and Discussion

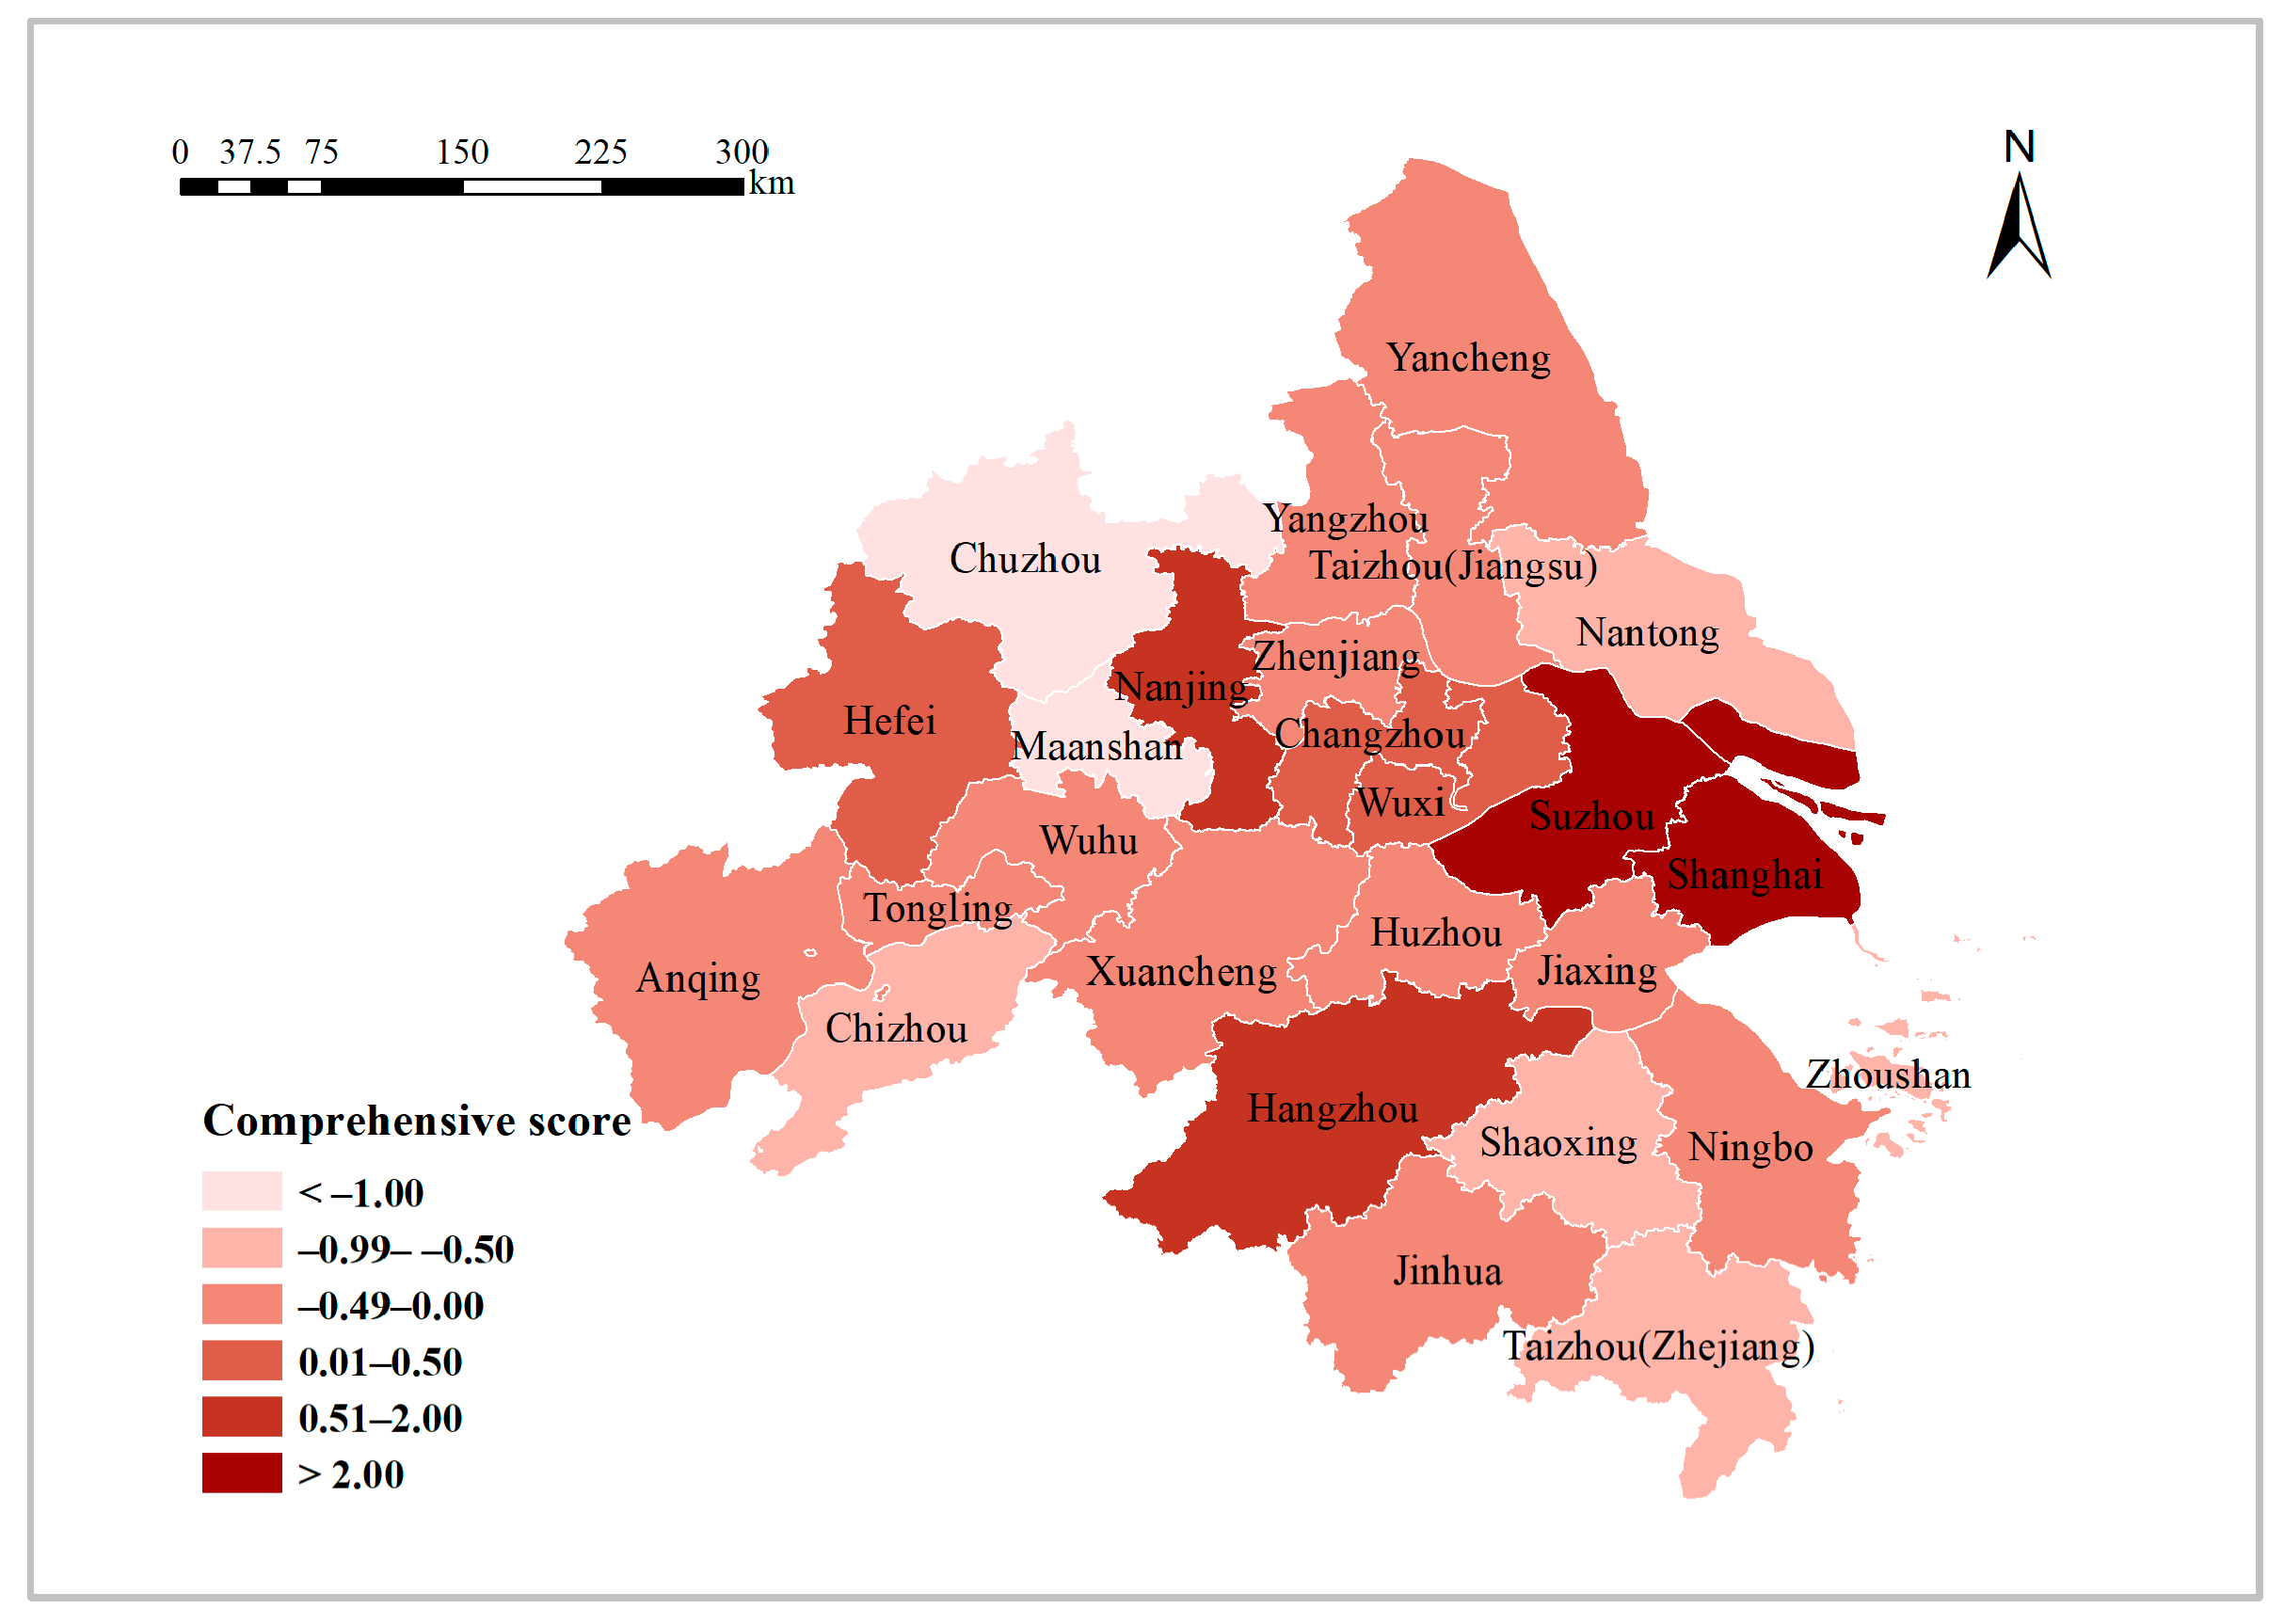
3.1. Analysis of Spatial Discrepancy and Evolution of Sustainable Development

3.1.1. Spatial Discrepancy of the Sustainable Development

Based on the characteristics of the data, the degree of coupled coordination that can indicate the level of sustainable development of the city was classified into six types: extreme incoordination, lower coordination, low coordination, high coordination, higher coordination, and extreme coordination, as shown in Table 2. Furthermore, the measured level of sustainable development in 2012 and 2023 is spatially visualized to better dissect the spatial and temporal divergence characteristics, as shown in Figure 2 and Figure 3, respectively.
In the temporal dimension, the interactive coupling state between the ecological health and economic resilience is undergoing ongoing development, and the level of sustainable development as a whole has somewhat improved, with its mean value rising from 0.257 in 2012 to 0.276 in 2023, and the number of cities with a high coordination level or above has increased from five to seven. Specifically, nine cities, including Shanghai, Nanjing, Suzhou, Hangzhou, and Hefei, have achieved a cross-level increase in coupling coordination; however, 11 cities have also experienced various degrees of decline, and the declining cities are all small and medium-sized cities with less developed economies.
In the spatial dimension, there is significant regional variation in the level of sustainable development, showing a gradual increase from the interior to the coast. The seven cities with higher than average values of sustainable development in 2023, from high to low, are Shanghai, Hangzhou, Nanjing, Suzhou, Hefei, Wuxi, and Ningbo. The sustainable development of these cities has been ranked in the top seven and separated from other cities, and the development levels of both ecological health and economic resilience lead the country.

3.1.2. Spatial Evolution of Sustainable Development

In this section, the spatial transition matrix of the sustainable urban development from 2012 to 2023 is obtained, as shown in Table 3. To make the analysis results more scientific, this section combines the levels of extreme coordination and higher coordination mentioned above into the higher-level sustainable development type and the levels of extreme incoordination and lower coordination into the lower-level sustainable development type, so the sustainable development is ultimately categorized into four types.
In general, the types in the matrix can only shift to their proximate types without leapfrogging. By observing the highest values in the matrix, it can be seen that the maximums of the transition probability of lower-level sustainable development, low-level sustainable development and higher-level sustainable development are on the diagonal, showing that the three types of development possess a significant degree of stability and that their original types are 86.0% likely to survive. While the high-level sustainable development type is extremely unstable, the probability of shifting to low-level sustainable development is 41.7%, and the probability of shifting to higher-level sustainable development is 25.0%. These cities are generally at a critical stage of coordinated development of their ecological and economic systems, and changes such as government policy shifts exert a great impact on coupling coordination.
The spatial Markov chain is able to detect the effect of the level of the neighboring region on changes to the region. Considering that the shift in city sustainable development is influenced by the state of neighboring regions, a spatial shift matrix of sustainable development between 2012 and 2023 is constructed to explore the probability of a shift in sustainable development under the influence of a neighboring region, as shown in Table 3. Combined with Table 4, it can be found that with a spatial lag of 1, which means that the surrounding areas have a low degree of sustainable development, the probability of transitioning from low sustainable development to high sustainable development is 21.4%, which is higher than the original 9.3%. The probability of transfer from high to low sustainable development is 33.3%, which is lower than the original 41.7%. This suggests that a city’s proximity to an area with a low level of sustainable development increases the probability of an upward shift in the level of sustainable development. Cities with comparative advantages in ecological and economic synergistic development will attract talents and increase output through unique factor advantages such as ecological resources and green space planning, thus creating a ‘siphon effect’ to promote their own sustainable development. With a spatial lag of 2, the probability of low-level sustainable development, lower-level sustainable development, and higher-level sustainable development maintaining their own stability is at least 89.5% when the surrounding area has low-level sustainable development, but the probability of shifting from high to low sustainable development is 66.7%. From the above analysis, it is clear that the lower-level sustainable development type and the higher-level sustainable development type always maintain their own stability and have a low probability of transfer.

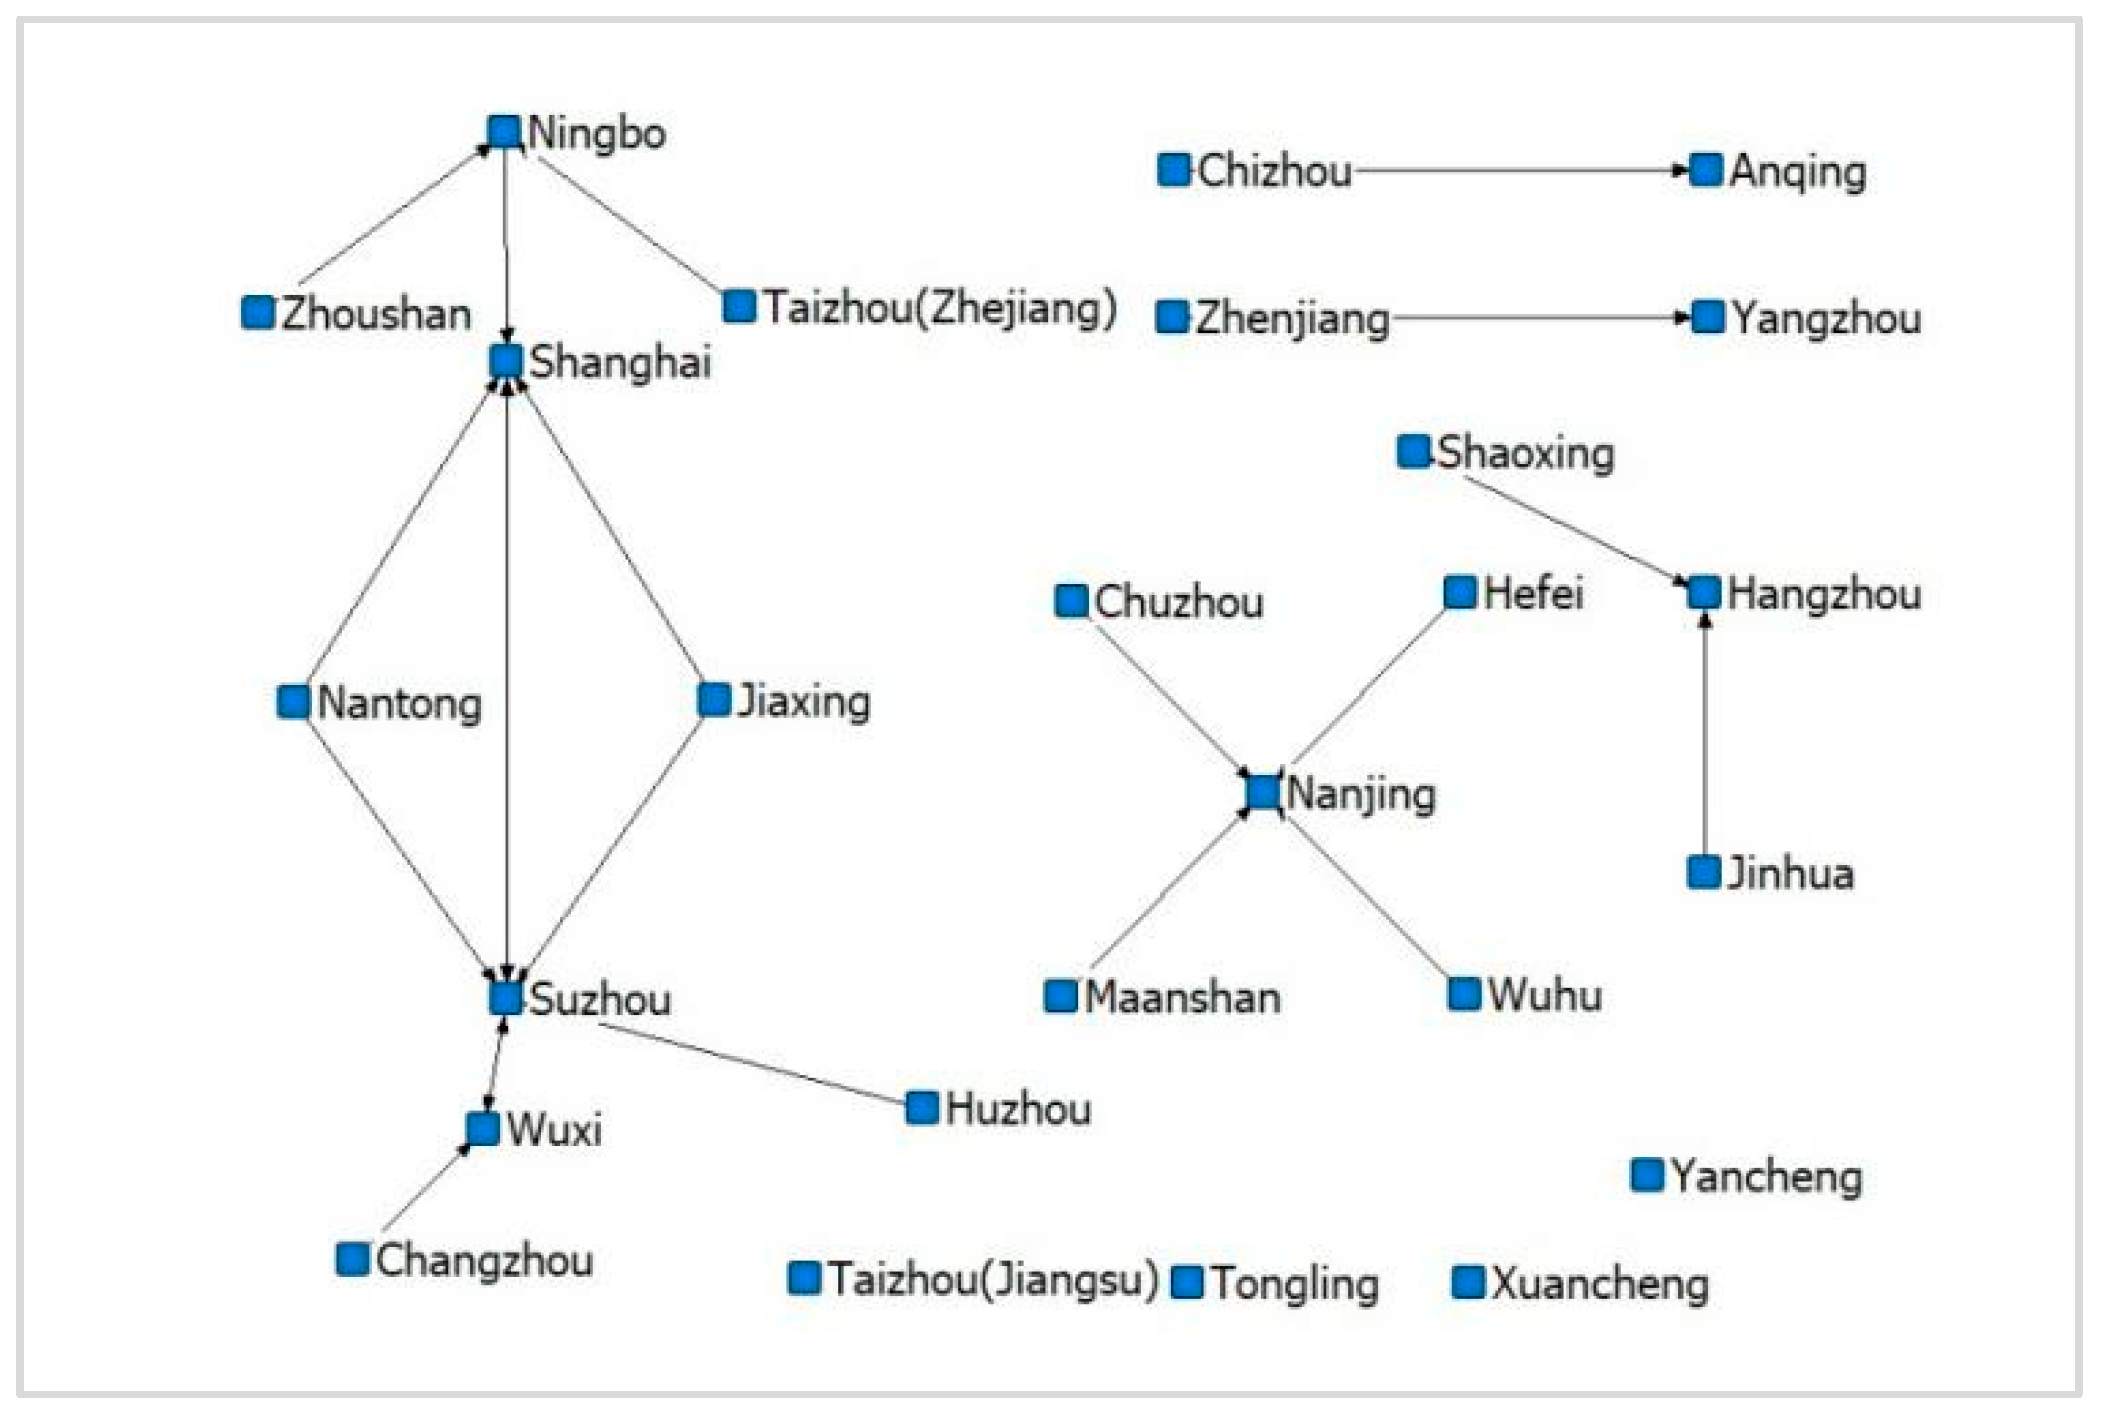
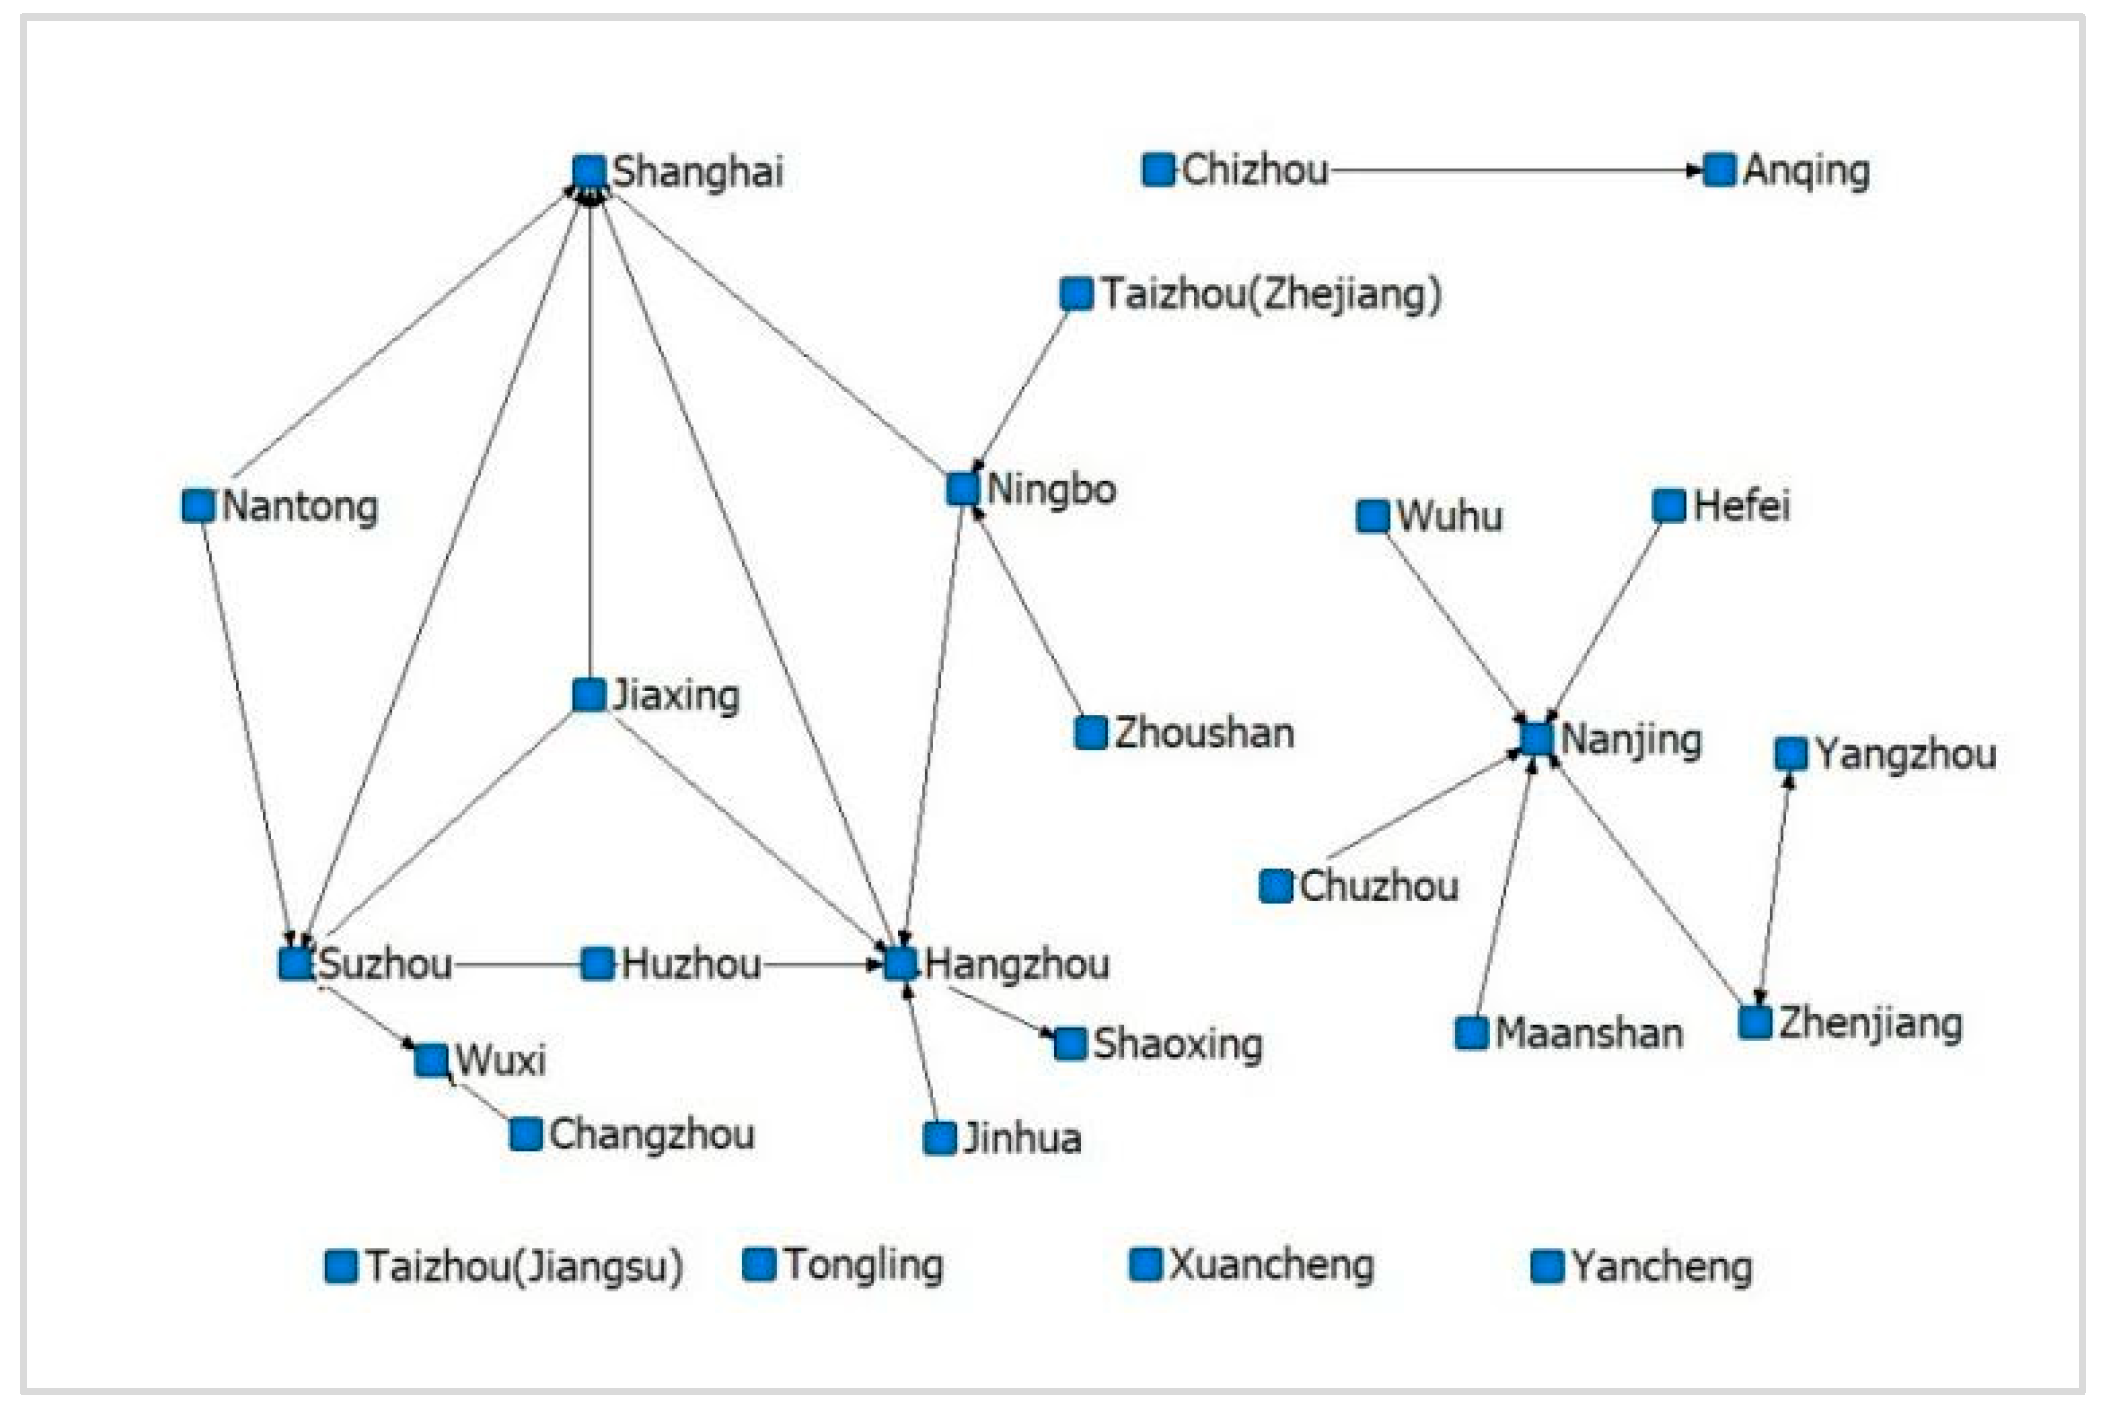
3.2. Analysis of the Spatial Correlation Network

In order to explore the spatial correlation pattern of cities for sustainable development in the Yangtze River Delta region, this paper constructs a spatial correlation network and interprets it in detail, which not only reveals the structural characteristics of the spatial correlation pattern in a multidimensional and systematic way, but also demonstrates the change of the pattern over time by means of comparison. In terms of the structural characteristics of the spatial correlation pattern, we first need to clarify what kind of overall structure the space has, such as whether the links between cities are inextricably linked or loosely connected. Then, we need to focus on which cities are at the center of the sustainable development of urban agglomerations and how the importance of each city varies. Finally, we go a step further by identifying the dependencies and clustering of cities in terms of sustainable development under relevant criteria for better regional management. Specifically, the analysis of the overall dimension concentrates on the overall properties of the network and analyzes the structural characteristics through network density and network efficiency. The analysis of the individual dimension concentrates on each city and evaluates the rights and status of each node in the network through centrality. The structural characteristics of the network are evaluated by analyzing the spatial subordination degree to assess the correlation characteristics among cities. Spatial clustering analysis is carried out by dividing the 26 cities in the YRD into four plates using the block model.

3.2.1. Overall Network Structure Characteristics

The spatial correlation of sustainable development is determined according to the modified gravity model, and a relationship matrix is established. Netdraw, a UCINET 6.0 visualization tool, is used to draw a network diagram of sustainable development in 2023, as shown in Figure 4, and it is found that its spatial association shows a typical network structure pattern.
Figure 5 depicts the evolution of network density and network efficiency during the sample examination period, and since network correlation shows the same trend of change as network density, network correlation is not separately listed in the figure. The measurement results of network efficiency indicate that network efficiency displays a significant upward trend from 2012 to 2016, implying that network stability decreases annually and then stabilizes after an improvement in 2016. Network density declines from 2012 to 2015 and fluctuates slightly between 0.262 and 0.266 from 2016 to 2023, but this fluctuation of network density is nonsignificant in general. Before 2016, China’s ecological and economic development lagged behind, while the rough, uncoordinated, and unbalanced development caused multi-stage, multi-field, and multi-type urban ecological and environmental problems. After 2016, China entered the ‘13th Five-Year Plan’ (2016–2020) construction period, during which the State Council issued the ‘13th Five-Year Plan for Ecological and Environmental Protection’, while the supply-side reform policy has helped China’s industrial structure change. This has effectively reduced the number of heavily polluting industries and enhanced the ability to withstand systemic risks. After 2021, provinces issued ecological economic development plans, deepening the integration of urban ecological health and economic resilience.
Numerically, network efficiency ranges from 0.643 to 0.660, signifying that roughly 35% of the network’s connections are superfluous; that is, there are multiple superposition phenomena in the dynamic correlations of intercity sustainable development. The network density varies from 0.263 to 0.274, showing that the spatial correlation of sustainable development is high, and a spatial correlation and spillover are evident. This suggests that a good interaction between the ecological status and economic development of a city in a region will have an impact on the sustainable development of neighbouring cities. In the context of the increasing integration of the ‘smart’ label with the eco-economy and the acceleration of its transformation and upgrading, the redundant links in the network may gradually be reduced, and the degree of interactions between the ecological and economic coherence of cities will gradually deepen.

3.2.2. Right Characteristics of Nodes

In order to analyse the position of the cities in the network, i.e., to identify which cities play a crucial leading role in the ecological and economic development of the region, this paper uses 2023 as an example to measure degree centrality, betweenness centrality, closeness centrality, and eigenvector centrality, and the results are presented in Table 5. To further depict the right characteristics of nodes comprehensively, each city’s comprehensive score is calculated using principal component analysis, as shown in Figure 6.
From the measurement results in Table 5, in 2023, the average of degree centrality stands at 39.69. Descending from the highest to the lowest, the ten cities with a degree centrality above the average value of 39.69 are Shanghai, Suzhou, Nanjing, Hangzhou, Wuxi, Hefei, Changzhou, Xuancheng, Wuhu, and Yancheng, and these cities have a higher number of relationships with other cities. Closeness centrality and degree centrality have similar trends, and the cities with values above the mean of closeness centrality are Shanghai, Suzhou, Nanjing, Hangzhou, Wuxi, Hefei, and Changzhou. These cities are linked to other nodes through more direct paths in the network, enabling them to intrinsically connect to other cities with greater swiftness. The mean values of degree centrality and closeness centrality remain relatively stable over the study period, showing that there is no major change in the agglomeration of sustainable development in each city. Chuzhou, Ma’anshan, Taizhou, and Zhoushan are in the bottom four in terms of degree centrality and closeness centrality and have a large gap with other cities. These cities are not in the middle of the cities with high centrality but rather in the periphery of the YRD, with a single economic structure and unable to enjoy the spatial spillover dividends from the central cities.
As depicted in Table 5, the average of betweenness centrality in 2023 is 2.66. The only cities above this average value are Shanghai, Suzhou, Nanjing, and Hangzhou. The total betweenness centrality of the top four cities increased from 73% of the total in 2012 to 78% in 2023, while the betweenness centrality of the bottom ten cities was less than 15%. This shows that the distribution of betweenness centrality among cities is very uneven, the trend of this unevenness is increasing, and most of the spatial links are actualized through the “bridge” role that is played by central cities such as Shanghai. These cities have an excellent industrial structure and strong economic development momentum, and at the same time have the policy conditions, financial support, and talent reserves for the development of urban ecology, which is conducive to better playing the role of ‘intermediaries’. In the process of tilting policies and allocating resources for ecological resources, attention should be focused on these ‘hubs’ with a high degree of intermediation.
As presented in Figure 6, the centrality hierarchy of the network in 2023 is described using principal component analysis with four centrality degrees as the criteria for classification. The cities with high centrality status are mostly located in the central and eastern regions of the YRD, but there is no obvious large area of low gravity or high gravity, and there are central cities with high degrees of sustainable development in the eastern, western and central parts of the YRD that produce spatial spillover relationships with neighboring cities. Shanghai, Suzhou, Nanjing, and Hangzhou are ranked in the top four in terms of centrality degree, signifying their status as the most crucial hubs and radiating epicenters, exerting a robust spillover and penetration effect on neighboring cities in terms of capital flow and green innovation. The spatial effect of spillover direction will be revealed in the analysis of the spatial subordination degree network described below.

3.2.3. Spatial Subordination Degree

In accordance with the previous measurement method, this paper uses UCINET 6.0 to visualize the measurement results of the subordination degree in 2012 and 2023, as shown in Figure 7 and Figure 8, respectively. The subordination network is outlined below.
The spatial subordination correlation network has the following overall structural characteristics. First, the dependency relationships of sustainable development in the YRD have significantly increased, and the degree of interaction has significantly strengthened. Although the number of intercity affiliations was the highest it had been in nine years in 2012, the number was still only 23. In 2023, the number of affiliations increased by 22% to 28, and intercity dependencies became more prominent. Second, the spatial subordination network of sustainable development in the YRD has a hierarchical form. The spatial subordination network had a rank of 0.911, which is slightly higher than that of 0.857 in 2012, indicating that the subordination relationships among cities are relatively stable and extremely hierarchical. Third, the subordination system with Shanghai-Suzhou-Hangzhou as the core is in the leading position in the spatial pattern of sustainable development and shows the characteristics of central convergence. Specifically, in 2012, there were two poles in the spatial subordination association network, with Shanghai-Suzhou as the leading pole and Nanjing as the other pole. However, with the expansion of Shanghai’s influence on Hangzhou and the increase in Jiaxing, Huzhou, and Ningbo’s subordination to Hangzhou, the double-core system composed of Shanghai-Suzhou gradually shifts to a triple-core system with Shanghai-Suzhou-Hangzhou driving and leading the development of subordinate cities. The total number of relationships in this triple core system increased to 20, representing 71.4% of all relationships.
The spatial subordination correlation network has the following local structural characteristics. First, Shanghai, Suzhou, and Hangzhou have absolute control over the sustainable development of neighboring cities. As of 2023, except for Xuancheng, the neighboring cities adjacent to Shanghai, Suzhou, and Hangzhou are either directly subordinated to these three cities or show obvious geographical proximity pointers by establishing a subordination relationship with one of the cities that are subordinate to these three cities. Shanghai, Suzhou, and Hangzhou also form more solid “triangular subordination relationships” with other cities, and it is foreseeable that the structure of this system can not be easily dismantled in the near future. Second, the subordinate correlation system using Nanjing as the core has a small radiation range and a limited role in driving sustainable development. The four cities that were subordinate to Nanjing in 2012 are all located in the less developed areas to the west of Nanjing. Zhenjiang and Yangzhou established a subordinate relationship with Nanjing in 2023, indicating a tendency for Nanjing to radiate its influence toward the eastern part of the YRD. Third, Shanghai and Suzhou, Suzhou and Wuxi, Zhenjiang and Yangzhou, and Hangzhou and Shaoxing are subordinate to each other and have a degree of subordination that is greater than 0.3, indicating that their internal interactions develop closely and form an inseparable whole. In contrast, Taizhou, Tongling, Xuancheng, and Yancheng are more independent during the sample period and have not established subordinate ties with any city.

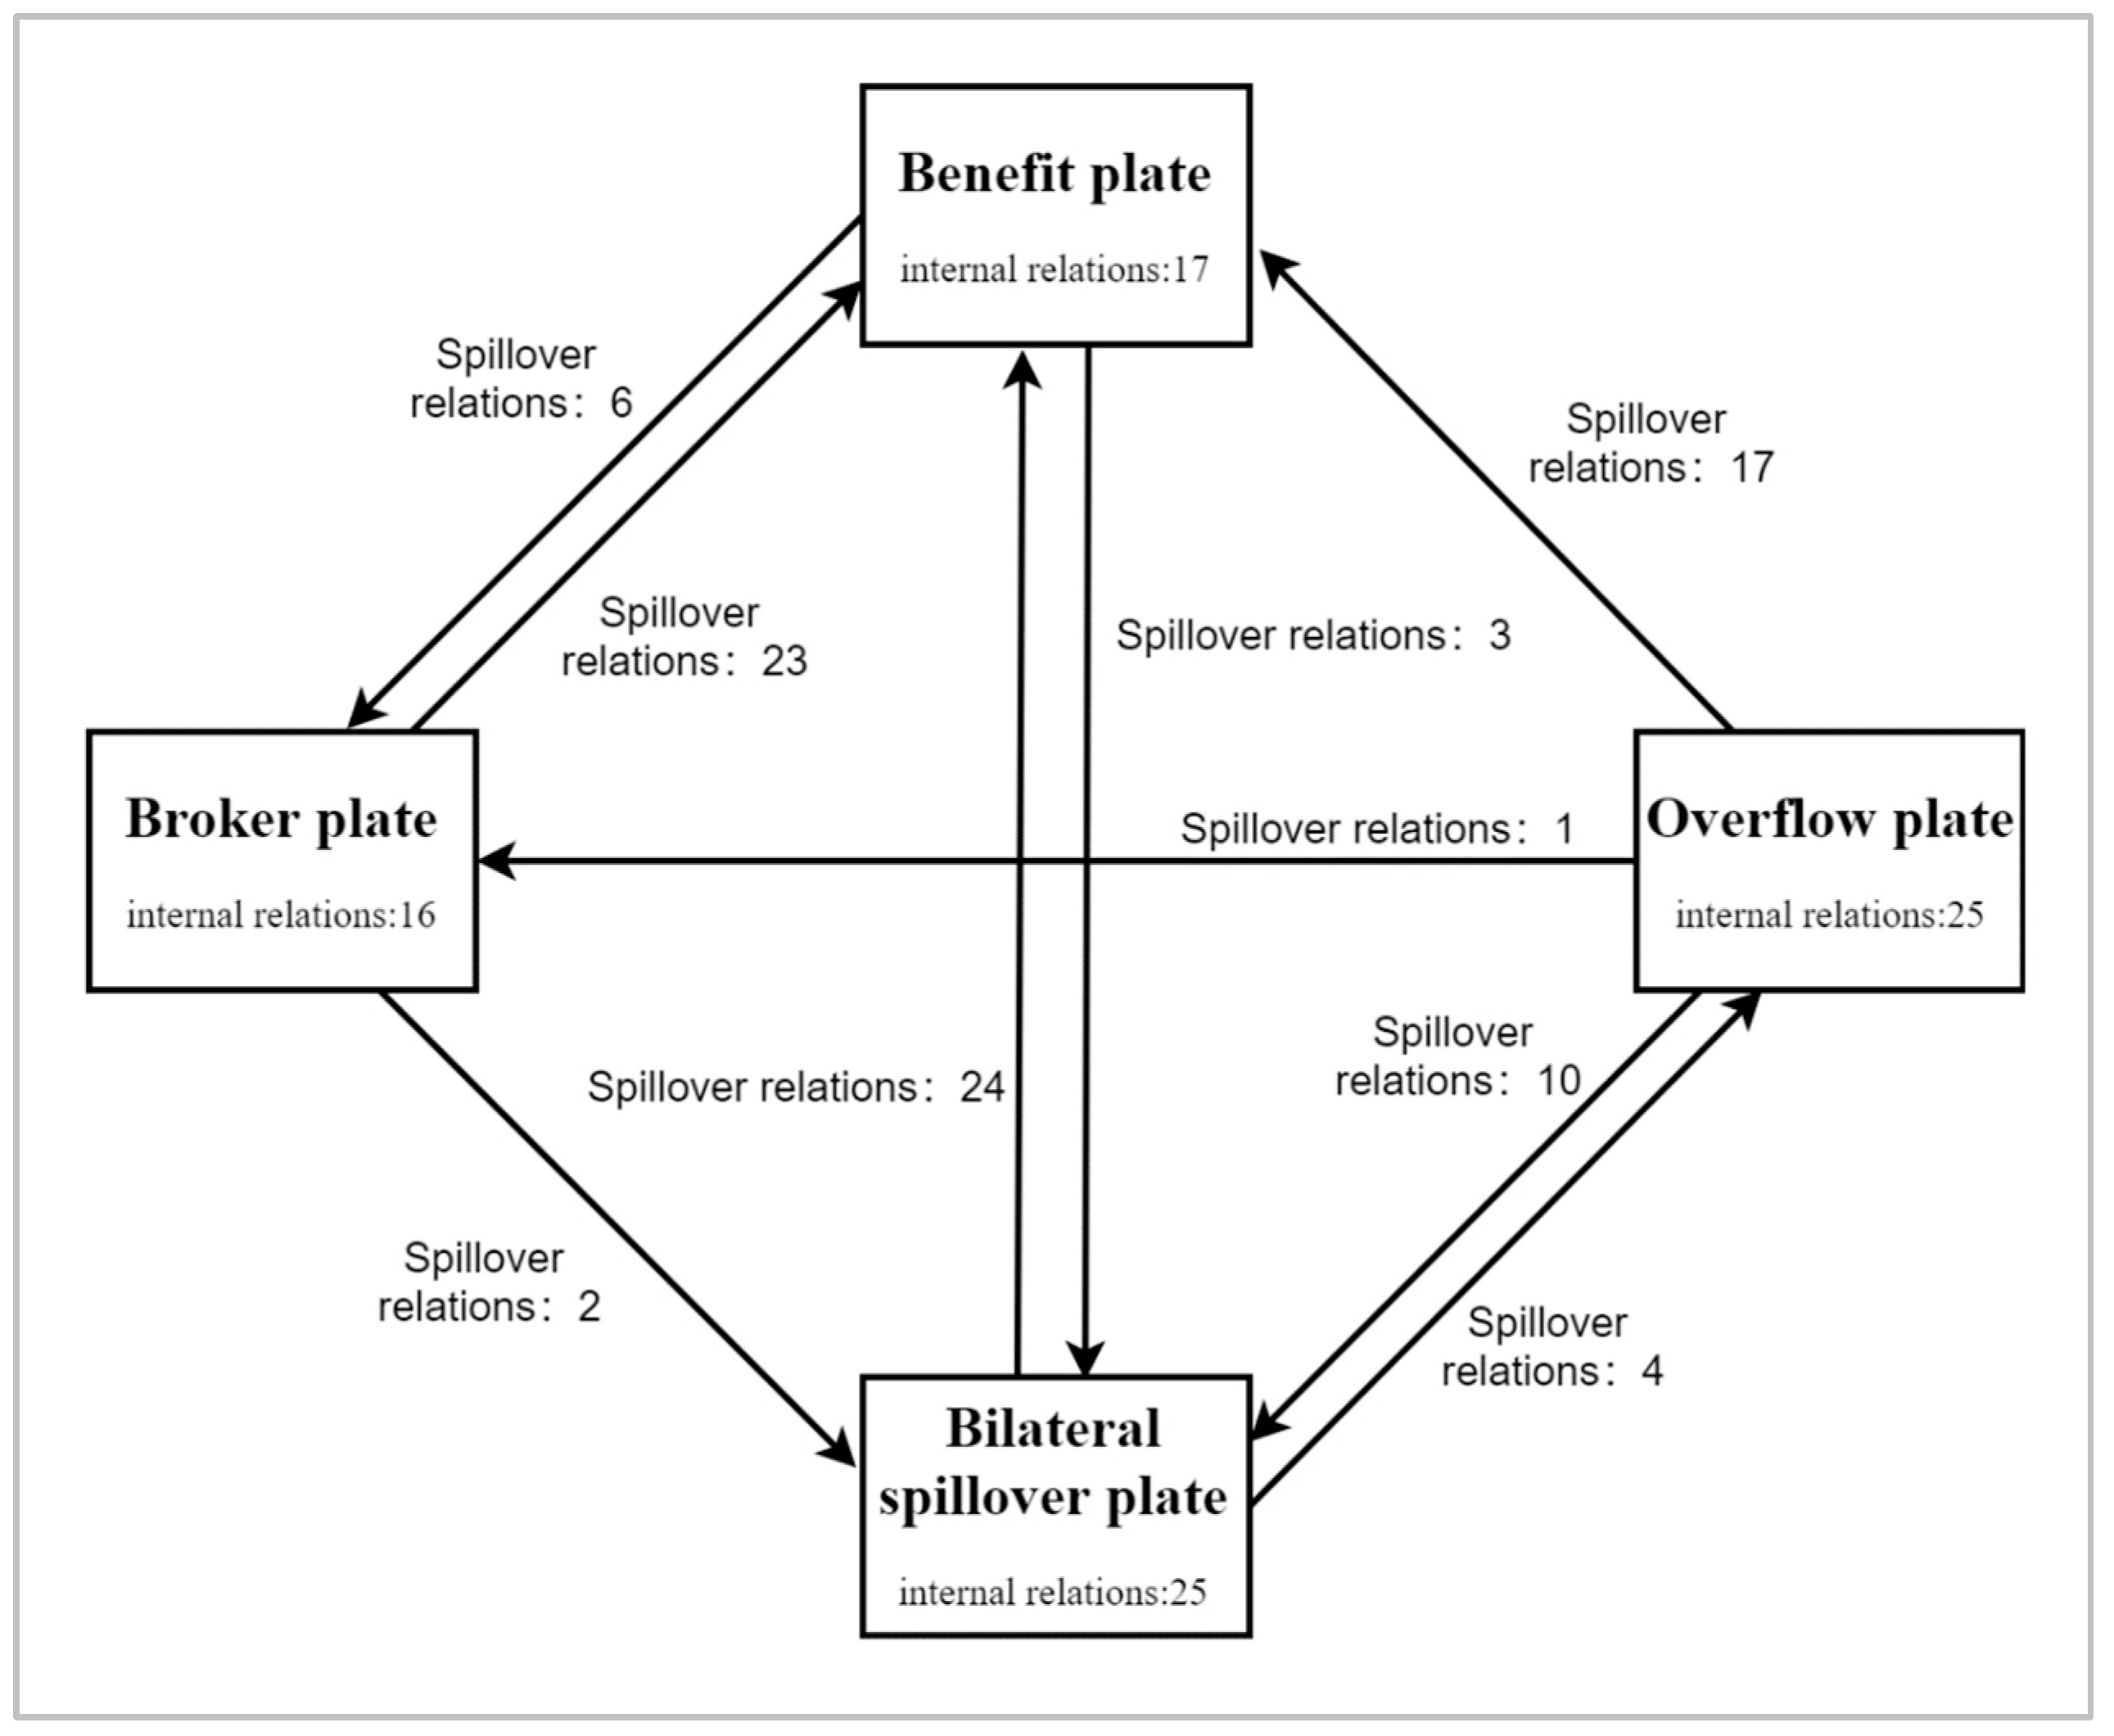
3.2.4. Spatial Clustering Analysis

By dividing the twenty-six cities into four plates, we analyse the spatial clustering characteristics of the network in 2023 via a block model. There are five members located in plate I: Shanghai, Suzhou, Wuxi, Nantong, and Hangzhou. There are seven members in plate II: Zhoushan, Jiaxing, Shaoxing, Ningbo, Jinhua, Huzhou, and Taizhou. There are six members in plate III, including Yancheng, Yangzhou, Zhenjiang, Taizhou, Changzhou, and Nanjing. There are eight members in plate IV, including Hefei, Wuhu, Maanshan, Tongling, Anqing, Chuzhou, Chizhou, and Xuancheng.
In accordance with the ratio of internal linkage, external linkage, internal-external interaction, and actual-desired relationships between plates, the network is segmented into four plates: the benefit plate, overflow plate, bilateral spillover plate, and broker plate, and the positioning of the four plates is set as presented in Table 6. The overall correlation network contains 173 correlations, while there are 83 correlations in plates and 90 correlations between plates, suggesting that spatial correlations and spillover effects are more evident in the sustainable development between plates. Specifically, plate I has 81 receiving relations and 26 sending relations, while there are 64 receiving relations outside the plate. This plate not only has a much larger number of receiving relations than those outside the plate or in other plates, but also has a much higher actual proportion of internal relations than theoretical internal relations. Consequently, plate I is a benefit plate. Plate II has a total of 23 incoming relationships and 41 outgoing relationships. Sixteen relationships are internal to the panel, and there are thirty-two links between the plate and other plates. The expected internal percentage of this board is 24%, and the actual internal percentage is 39%. Following the previous definition, Plate II is characterized as a broker Plate. Plate III has 40 incoming relationships and 53 outgoing relationships, and a relatively high number of relationships within the plate of 25. The expected internal ratio of this plate is 20%, and the actual internal ratio is 47%. Following the previous definition, plate III is a bilateral spillover plate. Panel IV has 29 incoming relationships and 53 outgoing relationships, and most of them are out-of-bound, so Panel IV is an overflow plate.
Furthermore, this section reveals the interrelationship between the sustainable development within and between panels, and the density matrix of each panel is provided in Table 7. Meanwhile, following the previous measurement, the overall density in 2023 is 0.2662, and the network density of the plate is assigned as 1 when it exceeds the overall density and 0 when it is below it, so the overall density serves as a threshold to convert the multivalued density matrix into a binary similarity matrix., as shown in Table 8. It can be found that plate I has more correlations with the other three plates, and the direction of these correlations is mostly toward the interior of the plates. Figure 9 visually depicts the correlations among the four plates.

4. Conclusions and Discussion

This paper examines the spatial correlation pattern of urban areas for sustainable development from the coupled perspective of ecology and economy based on the data related to the Yangtze River Delta urban agglomeration from 2012 to 2023. The following are the key findings of the study:
First, the coupling state of the ecological health and economic resilience in the YRD is in a continuous process of development. In general, sustainable development has increased over time. Nine cities have achieved a cross-level increase in sustainable development, while eleven cities have experienced various degrees of decline. The cities with decreasing sustainable development are all small and medium-sized cities with less developed economies, and the uncoordinated development speed and levels of their ecological technology and resilience.
Second, sustainable development varies significantly between regions, showing the development characteristics of gradual improvement from the mainland to the coast. Out of 26 cities, only Shanghai has reached the stage of extreme coordination, while some cities located in the western YRD have a lower degree of sustainable development, and their ecological construction is relatively backward, and the economic resilience needs to be enhanced.
Third, the lower-level sustainable development type and the higher-level sustainable development type can always maintain their own stability, and they have a low probability of shifting. High-level sustainable development types are extremely unstable, however, and they have a great tendency to shift to low-level sustainable development types. In addition, being adjacent to areas with lower-level sustainable development increases the probability of an upward shift in coordination.
Fourth, the spatial correlation of sustainable development is high, and spatial correlations and spillover effects are evident, showing a more typical network structure pattern. The centrality analysis shows that Shanghai, Suzhou, Nanjing, and Hangzhou are the most significant “hubs” and “radiation centers” in the network, and their centrality is significantly higher than that of other cities. The cities with high centrality are mostly located in the central and eastern parts of the YRD, but there are no obvious areas of low or high gravitational potential. The eastern, western, and central areas of the YRD all have central cities with high sustainable development that produce spatial spillover effects on neighboring cities.
Fifth, the sustainable development between cities has significantly increased, the degree of interaction has significantly strengthened, and it exhibits the characteristic of central aggregation. The affiliation system gradually changes from the double core system of Shanghai-Suzhou to the triple core system of Shanghai-Suzhou-Hangzhou to drive and lead the development of the subordinate cities. At the same time, Shanghai, Suzhou, and Hangzhou have a higher control over the sustainable development of their neighboring cities than Nanjing, showing an obvious geographical proximity orientation.
Sixth, the block of five cities, including Shanghai, Suzhou, Wuxi, Nantong, and Hangzhou, which is mostly located in the eastern part of the YRD, plays a “benefit” role in the network. Zhoushan, Jiaxing, Shaoxing, Ningbo, Jinhua, Huzhou, and Taizhou, which are concentrated in the southern region, play the role of “broker” in the network. Yancheng, Yangzhou, Zhenjiang, Taizhou, Changzhou, and Nanjing, which are concentrated in the north, play a “bilateral spillover” role. The final plate in the east plays an “overflow” role. The first plate has the most frequent connections with other plates.
Based on the above analysis of the spatial correlation network for the sustainable development of the Yangtze River Delta city cluster, this study puts forward some policy recommendations:
(1)
Optimize regional spatial layout
On the one hand, expand the radiation scope of core cities with high centrality to drive the development of fringe cities. Build central sustainable development cities within the fringe city clusters to serve as bridges and intermediaries for communication with the outside world. On the other hand, relying on the spatial development pattern of ‘one axis, two wings, three poles and multiple points’ of the Yangtze River Economic Belt, we will accelerate the construction of a new pattern of interconnected, interactive, coordinated and efficient multi-center digital economy development, and consolidate and improve the network linkage development pattern of urban agglomerations with the central city as the core node.
(2)
Strengthen regional cooperation and collaborative governance
First, in terms of ecological construction, with the national strategic impetus of the Yangtze River Delta regional integration, the Yangtze River Delta region’s eco-innovation will be promoted towards integration by increasing government investment, building an eco-technology co-operation platform, and accelerating the diffusion and application of eco-technology innovation. Secondly, in terms of economic construction, establish a sound regional cooperation mechanism, encourage inter-regional cooperation between enterprises upstream and downstream of the industrial chain, promote the optimization of factor flows and resource allocation, and form a good situation of complementary advantages and staggered development, so as to promote the rationalization and development of the industrial structure. Thirdly, strengthen inter-city synergistic governance in ecological protection and economic development, jointly formulate and implement regional ecological environmental protection policies, and coordinate regional economic development planning, so as to avoid fragmentation and vicious competition.
(3)
Constructing a Smart City Cluster and Innovation Ecology
Take the lead in promoting the construction of smart city clusters with distinctive characteristics in the Yangtze River Delta region to achieve data connectivity and business synergy in neighbouring regions, promote equal and inclusive public services for urban and rural data, extend the advanced governance capabilities of a number of central cities to the entire region, and enhance comprehensive governance and emergency response capabilities on a large regional scale. As for fringe cities, digital economy development capacity is the prerequisite foundation and weak link for their participation in the digital economy cooperation of the Yangtze River Delta city cluster, and they should focus on strengthening the foundation, focusing on doing a good job in digitizing their traditional industries, and consolidating the conditions for participating in the integrated development of the digital economy. At the same time, the government guides enterprises to increase the proportion of R&D investment to lay a solid foundation for eco-technology innovation. Regional governments can set up specialized websites oriented to the needs of environmental governance technologies, and actively establish university-enterprise cooperation platforms to provide R&D guarantees for the sustainable development of enterprises.

Author Contributions

Q.G. (Corresponding Author): Conceptualization, Resources, Supervision, Validation, Writing—Review and Editing; Z.C. (First Author): Conceptualization, Investigation, Visualization, Supervision, Methodology; L.Z.: Supervision, Visualization. All authors have read and agreed to the published version of the manuscript.

Funding

This research did not receive any specific grant from funding agencies in the public, commercial, or not-for-profit sectors.

Institutional Review Board Statement

This article does not contain any studies with human participants performed by any of the authors.

Informed Consent Statement

Not applicable.

Data Availability Statement

The data presented in this study are available on request from the corresponding author. We are unable to provide the raw data because our raw data, as well as the results of our processing, need to be kept confidential. We have fully described how the data were obtained, the methodological steps, and the results of the analysis.

Conflicts of Interest

No potential conflicts of interest were reported by the authors.

References

  1. Thanigaivel, S.; Vickram, S.; Dey, N.; Jeyanthi, P.; Subbaiya, R.; Kim, W.; Govarthanan, M.; Karmegam, N. Ecological disturbances and abundance of anthropogenic pollutants in the aquatic ecosystem: Critical review of impact assessment on the aquatic animals. Chemosphere 2023, 313, 137475. [Google Scholar] [CrossRef]
  2. Liu, S.; Junaid, M.; Sadaf, M.; Ai, W.; Lan, X.; Wang, J. A novel framework-based meta-analysis for in-depth characterization of microplastic pollution and associated ecological risks in Chinese Bays. J. Hazard. Mater. 2023, 444, 130423. [Google Scholar] [CrossRef]
  3. Zhang, T.; Sun, Y.; Zhang, X.; Yin, L.; Zhang, B. Potential heterogeneity of urban ecological resilience and urbanization in multiple urban agglomerations from a landscape perspective. J. Environ. Manag. 2023, 342, 118129. [Google Scholar] [CrossRef] [PubMed]
  4. Pile, S. What is a city. In City Worlds; Routledge: London, UK, 1999; pp. 3–52. [Google Scholar]
  5. Abu-Rayash, A.; Dincer, I. Development of an integrated sustainability model for resilient cities featuring energy, environmental, social, governance and pandemic domains. Sustain. Cities Soc. 2023, 92, 104439. [Google Scholar] [CrossRef]
  6. Liu, X.; Wang, H.; You, C.; Yang, Z.; Yao, J. The impact of sustainable development policy for resource-based cities on green technology innovation: Firm-level evidence from China. J. Clean. Prod. 2024, 469, 143246. [Google Scholar] [CrossRef]
  7. Fu, B.; Liu, Y.; Meadows, M.E. Ecological restoration for sustainable development in China. Natl. Sci. Rev. 2023, 10, nwad033. [Google Scholar] [CrossRef]
  8. Fan, S.; Huang, H.; Mbanyele, W.; Guo, Z.; Zhang, C. Inclusive green growth for sustainable development of cities in China: Spatiotemporal differences and influencing factors. Environ. Sci. Pollut. Res. 2023, 30, 11025–11045. [Google Scholar] [CrossRef]
  9. Hariram, N.P.; Mekha, K.B.; Suganthan, V.; Sudhakar, K. Sustainalism: An integrated socio-economic-environmental model to address sustainable development and sustainability. Sustainability 2023, 15, 10682. [Google Scholar] [CrossRef]
  10. Liu, J.; Tian, Y.; Huang, K.; Yi, T. Spatial-temporal differentiation of the coupling coordinated development of regional energy-economy-ecology system: A case study of the Yangtze River Economic Belt. Ecol. Indic. 2021, 124, 107394. [Google Scholar] [CrossRef]
  11. Saqib, N.; Ozturk, I.; Usman, M. Investigating the implications of technological innovations, financial inclusion, and renewable energy in diminishing ecological footprints levels in emerging economies. Geosci. Front. 2023, 14, 101667. [Google Scholar] [CrossRef]
  12. Liu, R.; Dong, X.; Wang, X.; Zhang, P.; Liu, M.; Zhang, Y. Relationship and driving factors between urbanization and natural ecosystem health in China. Ecol. Indic. 2023, 147, 109972. [Google Scholar] [CrossRef]
  13. Wan, J.; Li, Y.; Ma, C.; Jiang, T.; Su, Y.; Zhang, L.; Song, X.; Sun, H.; Wang, Z.; Zhao, Y.; et al. Measurement of coupling coordination degree and spatio-temporal characteristics of the social economy and ecological environment in the Chengdu–Chongqing urban agglomeration under high-quality development. Int. J. Environ. Res. Public Health 2021, 18, 11629. [Google Scholar] [CrossRef]
  14. Caviglia-Harris, J.L.; Chambers, D.; Kahn, J.R. Taking the “U” out of Kuznets: A comprehensive analysis of the EKC and environmental degradation. Ecol. Econ. 2009, 68, 1149–1159. [Google Scholar] [CrossRef]
  15. Zhou, R.; Jin, J.; Wu, C.; Zhou, L.; Zhang, L.; Cui, Y.; Zhang, Y.; Zhou, Y. Connection number based model for coordination development evaluation of regional water resources, social economy and ecological environment complex system. J. Environ. Manag. 2023, 339, 117913. [Google Scholar] [CrossRef]
  16. Zhu, C.; Fang, C.; Zhang, L. Analysis of the coupling coordinated development of the Population–Water–Ecology–Economy system in urban agglomerations and obstacle factors discrimination: A case study of the Tianshan North Slope Urban Agglomeration, China. Sustain. Cities Soc. 2023, 90, 104359. [Google Scholar] [CrossRef]
  17. Fan, Y.; Fang, C.; Zhang, Q. Coupling coordinated development between social economy and ecological environment in Chinese provincial capital cities-assessment and policy implications. J. Clean. Prod. 2019, 229, 289–298. [Google Scholar] [CrossRef]
  18. Li, W.; Yi, P.; Zhang, D.; Zhou, Y. Assessment of coordinated development between social economy and ecological environment: Case study of resource-based cities in Northeastern China. Sustain. Cities Soc. 2020, 59, 102208. [Google Scholar] [CrossRef]
  19. Ji, J.; Wang, L.; Xie, M.; Lv, W.; Yu, C.; Liu, W.; Shifaw, E. Evaluation of Coupling Coordination Degree between Economy and Eco-Environment Systems in the Yangtze River Delta from 2000 to 2020. Systems 2023, 11, 500. [Google Scholar] [CrossRef]
  20. Reyers, B.; Moore, M.L.; Haider, L.J.; Schlüter, M. The contributions of resilience to reshaping sustainable development. Nat. Sustain. 2022, 5, 657–664. [Google Scholar] [CrossRef]
  21. Das, S.; Pradhan, B.; Shit, P.K.; Alamri, A.M. Assessment of wetland ecosystem health using the pressure–state–response (PSR) model: A case study of mursidabad district of West Bengal (India). Sustainability 2020, 12, 5932. [Google Scholar] [CrossRef]
  22. Yu, Y.; Bao, Y.; Zhang, Q.; Shen, P.; Yang, H.; Xu, Z. Evaluation of marine resources environmental responsibility audit based on PSR framework. Ocean Coast. Manag. 2023, 245, 106742. [Google Scholar] [CrossRef]
  23. Costanza, R. Toward an operational definition of ecosystem health. In Ecosystem Health: New Goals for Environmental Management; Island Press: Washington, DC, USA, 1992. [Google Scholar]
  24. Costanza, R. Ecosystem health and ecological engineering. Ecol. Eng. 2012, 45, 24–29. [Google Scholar] [CrossRef]
  25. Holt, A.R.; Mears, M.; Maltby, L.; Warren, P. Understanding spatial patterns in the production of multiple urban ecosystem services. Ecosyst. Serv. 2015, 16, 33–46. [Google Scholar] [CrossRef]
  26. Martin, R. Regional economic resilience, hysteresis and recessionary shocks. J. Econ. Geogr. 2012, 12, 1–32. [Google Scholar] [CrossRef]
  27. Boschma, R. Towards an evolutionary perspective on regional resilience. Reg. Stud. 2015, 49, 733–751. [Google Scholar] [CrossRef]
  28. Martin, R.; Sunley, P. On the notion of regional economic resilience: Conceptualization and explanation. J. Econ. Geogr. 2015, 15, 1–42. [Google Scholar] [CrossRef]
  29. Zhang, P.; Zhao, Y.; Zhu, X.; Cai, Z.; Xu, J.; Shi, S. Spatial structure of urban agglomeration under the impact of high-speed railway construction: Based on the social network analysis. Sustain. Cities Soc. 2020, 62, 10240. [Google Scholar] [CrossRef]
  30. Ouyang, F. Using three social network analysis approaches to understand computer-supported collaborative learning. J. Educ. Comput. Res. 2021, 59, 1401–1424. [Google Scholar] [CrossRef]
  31. Wang, H.; Ge, Q. Spatial association network of PM2. 5 and its influencing factors in the Beijing–Tianjin–Hebei urban agglomeration. Environ. Sci. Pollut. Res. 2023, 30, 70541–70557. [Google Scholar] [CrossRef]
  32. Su, Y.; Yu, Y. Spatial association effect of regional pollution control. J. Clean. Prod. 2019, 213, 540–552. [Google Scholar] [CrossRef]
  33. Shen, W.; Liang, H.; Dong, L.; Ren, J.; Wang, G. Synergistic CO2 reduction effects in Chinese urban agglomerations: Perspectives from social network analysis. Sci. Total Environ. 2021, 798, 149352. [Google Scholar] [CrossRef] [PubMed]
Figure 1. Geographical location of the YRD. (Its location on the map has been circled.).
Systems 13 00533 g001
Figure 2. Spatial distribution of the sustainable urban development in 2012.
Systems 13 00533 g002
Figure 3. Spatial distribution of the sustainable urban development in 2023.
Systems 13 00533 g003
Figure 4. Spatial correlation network of sustainable urban development in 2023. (In this figure, we have eliminated the weakly connected relationships based on the thresholds, as explained in the research methodology, and the remaining correlations between cities are represented by connecting lines and arrows).
Systems 13 00533 g004
Figure 5. Trends in network density and network efficiency, 2012–2023. (Network efficiency measures the effective degree of information transfer between nodes in a network, which reflects the smoothness and rapidity of information flow. Network density reflects the ratio of the number of connections that actually exist in the network to the maximum number of connections that may exist in the network).
Systems 13 00533 g005
Figure 6. Centrality hierarchy of the network in 2023. (The centrality hierarchy of all cities is delineated according to the three degrees of centrality in Table 5.).
Systems 13 00533 g006
Figure 7. Spatial subordination correlation network of sustainable development in 2012. (This diagram streamlines an otherwise complex spatial correlation relationship.).
Systems 13 00533 g007
Figure 8. Spatial subordination correlation network of sustainable development in 2023.
Systems 13 00533 g008
Figure 9. Correlation between the four plates in 2023. (The block model reveals the overall structure of the network by dividing the nodes in the network into groups (blocks) and analyzing the relationships between these groups.).
Systems 13 00533 g009
Table 1. Description of indicators.
DimensionsIndicatorsHow Indicators Are MeasuredEfficacy
Ecological healthPressurePopulation density+
Ecological carrying capacity per capita+
StateEcological services+
Landscape fragmentation index+
Ecosystem recovery force+
ResponseCentralized treatment rate of sewage treatment plant+
Harmless treatment rate of domestic waste+
Comprehensive utilization rate of general industrial solid waste+
Proportion of environmental protection expenditure to financial expenditure+
Percentage of green invention patent applications+
Economic resilienceResistanceGDP growth rate+
GDP per capita+
Diversification of industrial structure +
FDI
Urbanization rate+
AdaptationRationalization of industrial structure+
Total retail sales of consumer goods+
Investment rate+
Deposit-to-loan ratio+
Proportion of fiscal expenditure to GDP+
TransformationAdvancement of industrial structure+
R&D expenditure+
Technology transaction turnover+
Per capita patent authorizations+
Table 2. Classification criteria of the coupling coordination.
Types of Coupling CoordinationExtreme UncoordinationLower CoordinationLow CoordinationHigh CoordinationHigher CoordinationExtreme Coordination
interval[0, 0.15](0.15, 0.25](0.25, 0.35](0.35, 0.45](0.45, 0.75](0.75, 1]
Table 3. Markov transition matrix (k = 4).
ti/ti + 1nLower-Level Sustainable DevelopmentLow-Level Sustainable DevelopmentHigh-Level Sustainable DevelopmentHigher-Level Sustainable Development
lower-level sustainable development1261.0000.0000.0000.000
low-level sustainable development430.0470.8600.0930.000
high-level sustainable development120.0000.4170.3330.250
higher-level sustainable development270.0000.0000.0370.963
Table 4. Spatial Markov transition matrix (k = 4).
Spatial Lagti/ti + 1n1234
11561.0000.0000.0000.000
2140.0000.7860.2140.000
390.0000.3330.4440.222
4120.0000.0000.0830.917
21591.0000.0000.0000.000
2190.0530.8950.0530.000
330.0000.6670.0000.333
4150.0000.0000.0001.000
31111.0000.0000.0000.000
2100.1000.9000.0000.000
300.0000.0000.0000.000
400.0000.0000.0000.000
4100.0000.0000.0000.000
200.0000.0000.0000.000
300.0000.0000.0000.000
400.0000.0000.0000.000
Table 5. Centrality of the network in 2023. (Centrality is a metric used to measure the importance or centrality of nodes in a network.).
CityDegreeBetweennessClosenessEigenvector
Shanghai9218.29192.5350.609
Nanjing7612.86580.64543.435
Wuxi522.62267.56833.472
Changzhou441.23664.10330.284
Suzhou8413.40686.20747.416
Nantong280.08955.55621.654
Yancheng400.43962.50028.803
Yangzhou361.50960.97624.592
Zhenjiang320.00059.52423.952
Taizhou (Jiangsu)360.21660.97625.635
Hangzhou729.45178.12540.761
Ningbo320.32856.81819.318
Jiaxing320.62856.81821.216
Huzhou280.21858.14022.285
Shaoxing280.18955.55617.751
Jinhua280.44758.14020.162
Zhoushan200.00053,19114.818
Taizhou (Zhejiang)240.05654.34816.517
Hefei483.90465.78929.779
Wuhu401.25262.50026.538
Maanshan160.00048.07710.728
Tongling320.16259.52422.019
Anqing320.15159.52423.562
Chuzhou120.06747.1708.242
Chizhou280.27258.14019.063
Xuancheng401.53562.50027.558
Table 6. Interplate correlations in the network.
BlockReceive RelationshipOverflow RelationshipExpected Internal Relationship
Ratio
Actual Internal Relationship
Ratio
InsideOutsideInsideOutside
I17641791665
II16716252439
III251525282047
IV25425282847
Table 7. Density matrix.
BlockIIIIIIIV
I0.8500.1710.1000.000
II0.6570.3810.0480.000
III0.8000.0000.8330.083
IV0.4250.0180.2080.446
Table 8. Similarity matrix.
BlockIIIIIIIV
I1000
II1100
III1010
IV1001
Disclaimer/Publisher’s Note: The statements, opinions and data contained in all publications are solely those of the individual author(s) and contributor(s) and not of MDPI and/or the editor(s). MDPI and/or the editor(s) disclaim responsibility for any injury to people or property resulting from any ideas, methods, instructions or products referred to in the content.

