Abstract
This study compares the views of mathematics teachers in private and public schools on mathematics education during the COVID-19 pandemic from their perspectives after the pandemic, focusing on factors influencing secondary and high school mathematics education. In this study, the survey method was used to collect data. The survey method was employed to obtain information for this investigation. During the 2023–2024 school year, 644 math teachers took part in the study. Of these, 260 were from private schools, and 384 were from public schools. There are 10,323 teachers in public schools and 694 in private schools, and this sample size is more than the 371 participants that are needed for statistical purposes (based on Cochran’s formula at a 95% confidence level and a 5% margin of error). A scale consisting of thirteen 5-point Likert-type questions was developed by researchers for data collection, and mathematical modeling techniques were employed. Factor analysis using SPSS 24.00 revealed four key factors influencing teachers’ responses: teachers’ professional development and support, job satisfaction, students’ engagement, and teaching experience. The results highlight significant disparities between public and private schools in mathematics education, attributed to various factors to be elucidated further in the subsequent discussion.
1. Introduction
The emergence of COVID-19 in December 2019 rapidly escalated into a global pandemic, prompting widespread measures to mitigate its spread, including remote work arrangements, the enforcement of rules to prevent crowding, and the global closure of educational institutions. The shift to remote learning, facilitated by various online platforms and learning management systems, became imperative to sustain educational continuity amid the crisis. Around the middle of the 2020 spring semester, schools across nearly every nation were abruptly and mostly permanently closed. Without enough preparation or infrastructure, the quick fix was to adopt remote instruction by moving or modifying the curriculum to fit the readily accessible online technologies. In terms of online teaching techniques, educators were unprepared for such widespread and protracted school closures [1,2,3,4].
The transition to online education exposed significant disparities between state and private schools, exacerbating existing inequalities [5]. In her study, Yelina highlights the crucial role of a stable internet connection in providing access to essential learning materials, including visual media, for children. Additionally, she stresses that a dependable internet connection allows teachers to effectively monitor the learning process. Yelina cautions that the failure to establish such communication poses a significant threat to learning outcomes, often resulting in children falling behind their peers. In this situation, math education became very important because it is seen as a key part of learning about science and making technology better. According to (Harlen & Qualter, Citation 2004 [6]), science and math are “the driving force of economic development and scientific literacy in most countries.” The push to include technology in math classes shows how important it is for preparing students for the challenges of modern life [6].
The transition to online mathematics education amid the pandemic has revealed substantial obstacles for both students and educators, affecting numerous facets of the educational experience [7]. Our study delves into four pivotal factors shaping the landscape of online mathematics education: teachers’ professional development and support, job satisfaction, students’ engagement, and teaching experience.
Erbil, Duhok, and Sulaymaniyah are home to both public and private educational institutions. During the COVID-19 pandemic, public schools primarily employed recorded lessons and television programs due to a lack of digital infrastructure and internet connectivity, especially in rural areas. But private schools were more adept at employing live online teaching through tools such as ClassDojo, Zoom, and Google Meet because of their improved internet connections and increased resources. These disparities were obvious during the pandemic, showing that there was a disparity in the involvement of students and how lessons were given, particularly in subjects such as mathematics that required active participation. The learning outcomes of the two categories of schools were markedly different. This was exacerbated by socioeconomic issues, teacher preparation, and disparities in technology access.
Competent educators enhance student academic performance, reduce disparities between privileged and disadvantaged students, and enhance students’ future earnings [8,9,10], emphasizing the critical role of ongoing training and support. Additionally, numerous teaching methods in K-12 education unintentionally perpetuate social advantages. To reshape their teaching methods and offer fairer learning chances for students from marginalized backgrounds, educators require collaborative professional learning opportunities that closely align with classroom practice [11].
Moreover, job satisfaction plays a crucial role in post-pandemic teaching scenarios as educators navigate new challenges and changes in work dynamics. Ensuring that teachers feel fulfilled and valued in their roles is vital for maintaining motivation and resilience. Throughout the COVID-19 pandemic, educators expressed diminished levels of overall wellness. Decreased well-being can adversely affect professional efficacy and the quality of teaching [12].
Furthermore, students’ engagement has become even more critical in the aftermath of the pandemic as educators strive to re-engage students and foster a positive learning environment. Learning motivation pertains to the inclination or impetus to acquire new knowledge, skills, or behaviors. It significantly impacts a student’s participation, perseverance, and success within educational environments [13]. Addressing barriers to engagement and implementing strategies to enhance student involvement are key priorities for post-pandemic teaching approaches.
In addition to that, teaching experience has emerged as a significant factor influencing educators’ ability to adapt to the evolving teaching landscape. Experience is a crucial factor in determining the efficacy of educators. Experienced teachers possess a rich reservoir of knowledge, perspectives, and techniques developed over years of practice, greatly augmenting their capacity to address the varied requirements of students and tackle intricate teaching dilemmas [14]. Leveraging the expertise of experienced teachers and providing mentorship opportunities for newer educators can contribute to more effective post-pandemic teaching practices.
Furthermore, as educators navigate the complexities of online mathematics education, mathematical modeling techniques offer valuable insights into understanding and addressing the challenges faced in educational settings. Compartmental models, a type of mathematical modeling often used in epidemiology [15,16], can be adapted to analyze various aspects of education, including student performance [17], teacher effectiveness, and the impact of interventions. By quantitatively representing the interactions between different components of the educational system, compartmental models enable researchers to simulate different scenarios, identify potential bottlenecks, and optimize resource-allocation strategies. Lately, there has been a rising enthusiasm for applying mathematical modeling techniques to inform evidence-based decision-making in education. Educators can develop a deeper insight into the key forces influencing the education system by integrating mathematical modeling tools with qualitative analysis and empirical research [18]. This, in turn, facilitates the development of more effective pedagogical practices and policy formulations.
In this paper, we present a comprehensive model elucidating the aforementioned factors and examine the perspectives of mathematics educators from private and public schools. This study seeks to explore both the challenges and opportunities within the subject of inquiry by examining the impact of COVID-19 on the educational landscape, paving the way for informed pedagogical practices and policy interventions in online mathematics education. This study compares the views of mathematics teachers in private and public schools on mathematics education during the COVID-19 pandemic from their perspectives after the pandemic.
In order to structure this research, a conceptual framework was developed to illustrate the interplay between four critical factors (teachers’ professional development and support, job satisfaction, student engagement, and teaching experience) and their impact on the outcomes of mathematics education during the pandemic. This method incorporates a compartmental mathematical model that illustrates the impact of these factors on the success or failure of a student in school.
2. Research Questions and Hypotheses
This study looks at how the COVID-19 pandemic affected math education, with a focus on the differences between public and private schools. The main issues for this study are as follows:
- (1)
- What were the differences between public and private schools in terms of resources and quality of instruction when they switched to online learning?
- (2)
- What problems did students and teachers have, and how were these problems different in different types of schools?
- (3)
- What good things happened because of online math classes during the pandemic?
- (4)
- How can mathematical modeling be used to improve online math teaching for a lot of people?
- (5)
- How much worse did the differences in education between public and private schools become, and what can be done to fix them?
Some of the hypotheses that go along with this are as follows:
- Public school kids had a harder time learning math online since they did not have as many tools.
- The change helped private schools more, giving them more freedom and access to technology.
- Mathematical modeling can assist in making online education better and more effective.
- The epidemic made the gap between public and private schooling bigger, and this tendency is likely to continue without specific actions.
3. Materials and Methods
3.1. Research Method
In this study, the survey method was used to collect data. According to Büyüköztürk, Çakmak, Akgün, Karadeniz, and Demirel (2018) [19], studies designed to collect information for analyzing group characteristics fall under survey research.
The compartmental model is employed in this study to analyze the transitions of teachers in mathematics education during the shift to online learning due to the COVID-19 pandemic. It is well-suited for studying how teachers move between different states, such as successfully adapting to online teaching or encountering difficulties. The model enables the incorporation of key factors that affect teachers’ ability to adapt to online education. By quantifying these transitions, the model helps identify strategies to improve the resilience and effectiveness of mathematics education during the pandemic.
This approach is based on the work of Kermack and McKendrick (1927) [20], who originally applied the model to epidemiology, demonstrating its versatility in studying systems with distinct states. The mathematical structure of the model provides a robust framework for analyzing complex dynamics, making it a valuable tool for understanding the challenges teachers face in the new educational landscape. Ultimately, the model provides useful insights into supporting teachers in their transition to effective online teaching.
3.2. Population and Sample
The study population comprises a total of 10,323 teachers serving in secondary schools affiliated with the Ministry of Education in Erbil, Duhok, and Sulaymaniyah. In this study, the convenience sampling method was used. The selection of an appropriate sampling method is aimed at ensuring easy access to the chosen participants, that is, the sample, and to make the application easier [21]. The schools and teachers in this study were selected due to easy accessibility. From the 10,323 teachers in the universe, 371 people should be included in the study with a 5 percent margin of error and a 95 percent confidence interval. For this study, we decided to have a sample of 600 of the target population from the cities of Erbil, Duhok, and Sulaymaniyah for scale development. After the development of the scale, data were obtained by reaching another 644 teachers to determine the teachers’ opinions. According to Cochran’s formula, at least 371 participants would be statistically sufficient with a 95% confidence level and a 5% margin of error. However, a total of 644 mathematics teachers were included in the study to increase the statistical power, allow for more detailed subgroup comparisons (for example, public vs. private schools), and make sure that the results were stronger and generalizable.
There is also more trust in the data because the sample size is bigger. This is because it lowers the effect of non-response bias.
Before the data collection tools were applied to the teachers, the authors obtained the necessary permissions from the Near East University Institute and the Ministry of National Education.
The instrument consisted of a 13-item Likert scale measuring four dimensions: student engagement, teachers’ job satisfaction, professional development access, and teaching experience. Sample items include “Your students’ level of engagement and performance during the pandemic was high.” (engagement) and “I have had sufficient support and resources to teach effectively during the pandemic.” (teachers’ professional development and support).
The model factors were chosen based on both theory and empirical research that was useful to teaching math during and after the COVID-19 pandemic. β2 (student engagement) was added because it has been linked to academic success over and over again, especially in online learning settings where drive and participation are very important [22]. δ2 (teachers’ job satisfaction) shows how important teachers’ health and happiness are, since they have a big impact on how well they teach and how well their students perform in school [23]. α2 (loss of professional development) was chosen because many studies showed that teachers had trouble with online lessons when they did not receive ongoing professional development, especially in digital settings that changed quickly [24]. Lastly, γ2 (lack of teaching experience) describes the problems that new teachers have when they try to run online classes and change their teaching methods to work well [25]. A study of the literature, comments from experts, and pilot tests were used to make sure that these parameters were useful and would have an effect on how well students learned during the pandemic.
Cronbach’s alpha coefficients for the subscales in the study are as follows:
“Teaching Experience and Lack of Teaching Experience”—0.78, “Teachers’ Professional Development and Support, and Lack of Teacher’s Professional Development and Support”—0.73, “Students’ Engagement and Students’ Disengagement”—0.74, and “Teachers’ Job Satisfaction and Job Dissatisfaction”—0.80.
3.3. Data Collection Tools
In this study, the “Teachers’ Views on Mathematics Education During the COVID-19 Pandemic and Their Online Learning Experiences” scale developed by the researchers was used as a data collection tool. Before designing the scale form, a thorough literature review was carried out, leading to the development of a pool of items relevant to the subject. These items were then carefully reviewed by the researchers, who also sought insights from doctors, associate professors, and field experts to ensure content validity. Following this, the data was collected from 600 teachers as part of a preliminary application, after which the questionnaire’s construct validity was assessed using the gathered information. To further verify construct validity, exploratory factor analysis was conducted on the data.
Compared to reliability, establishing the validity of scales presents a greater challenge [26]. Many researchers see exploratory factor analysis as the most powerful method [27]. To evaluate the adequacy of the dataset and sample for factor analysis, KMO and Bartlett’s sphericity tests were applied. For the suitability of the data for factor analysis, KMO must be higher than 0.60, and Bartlett’s test must be significant [28]. In this study, the KMO sample suitability coefficient was calculated as 0.825. A KMO value exceeding 0.80 is generally interpreted as an indication that the dataset is appropriate for factor analysis [29]. The study incorporated Bartlett’s test of sphericity (BTS), which evaluates the hypothesis that the correlation matrix is equivalent to a unit matrix. Rejecting this hypothesis indicates that the correlations among variables differ from 1, making factor analysis suitable for the dataset [29]. The X2 value for BTS was found to be 1162.013 (p < 0.001) for this research (Table 1).

Table 1.
KMO and Bartlett’s sphericity tests.
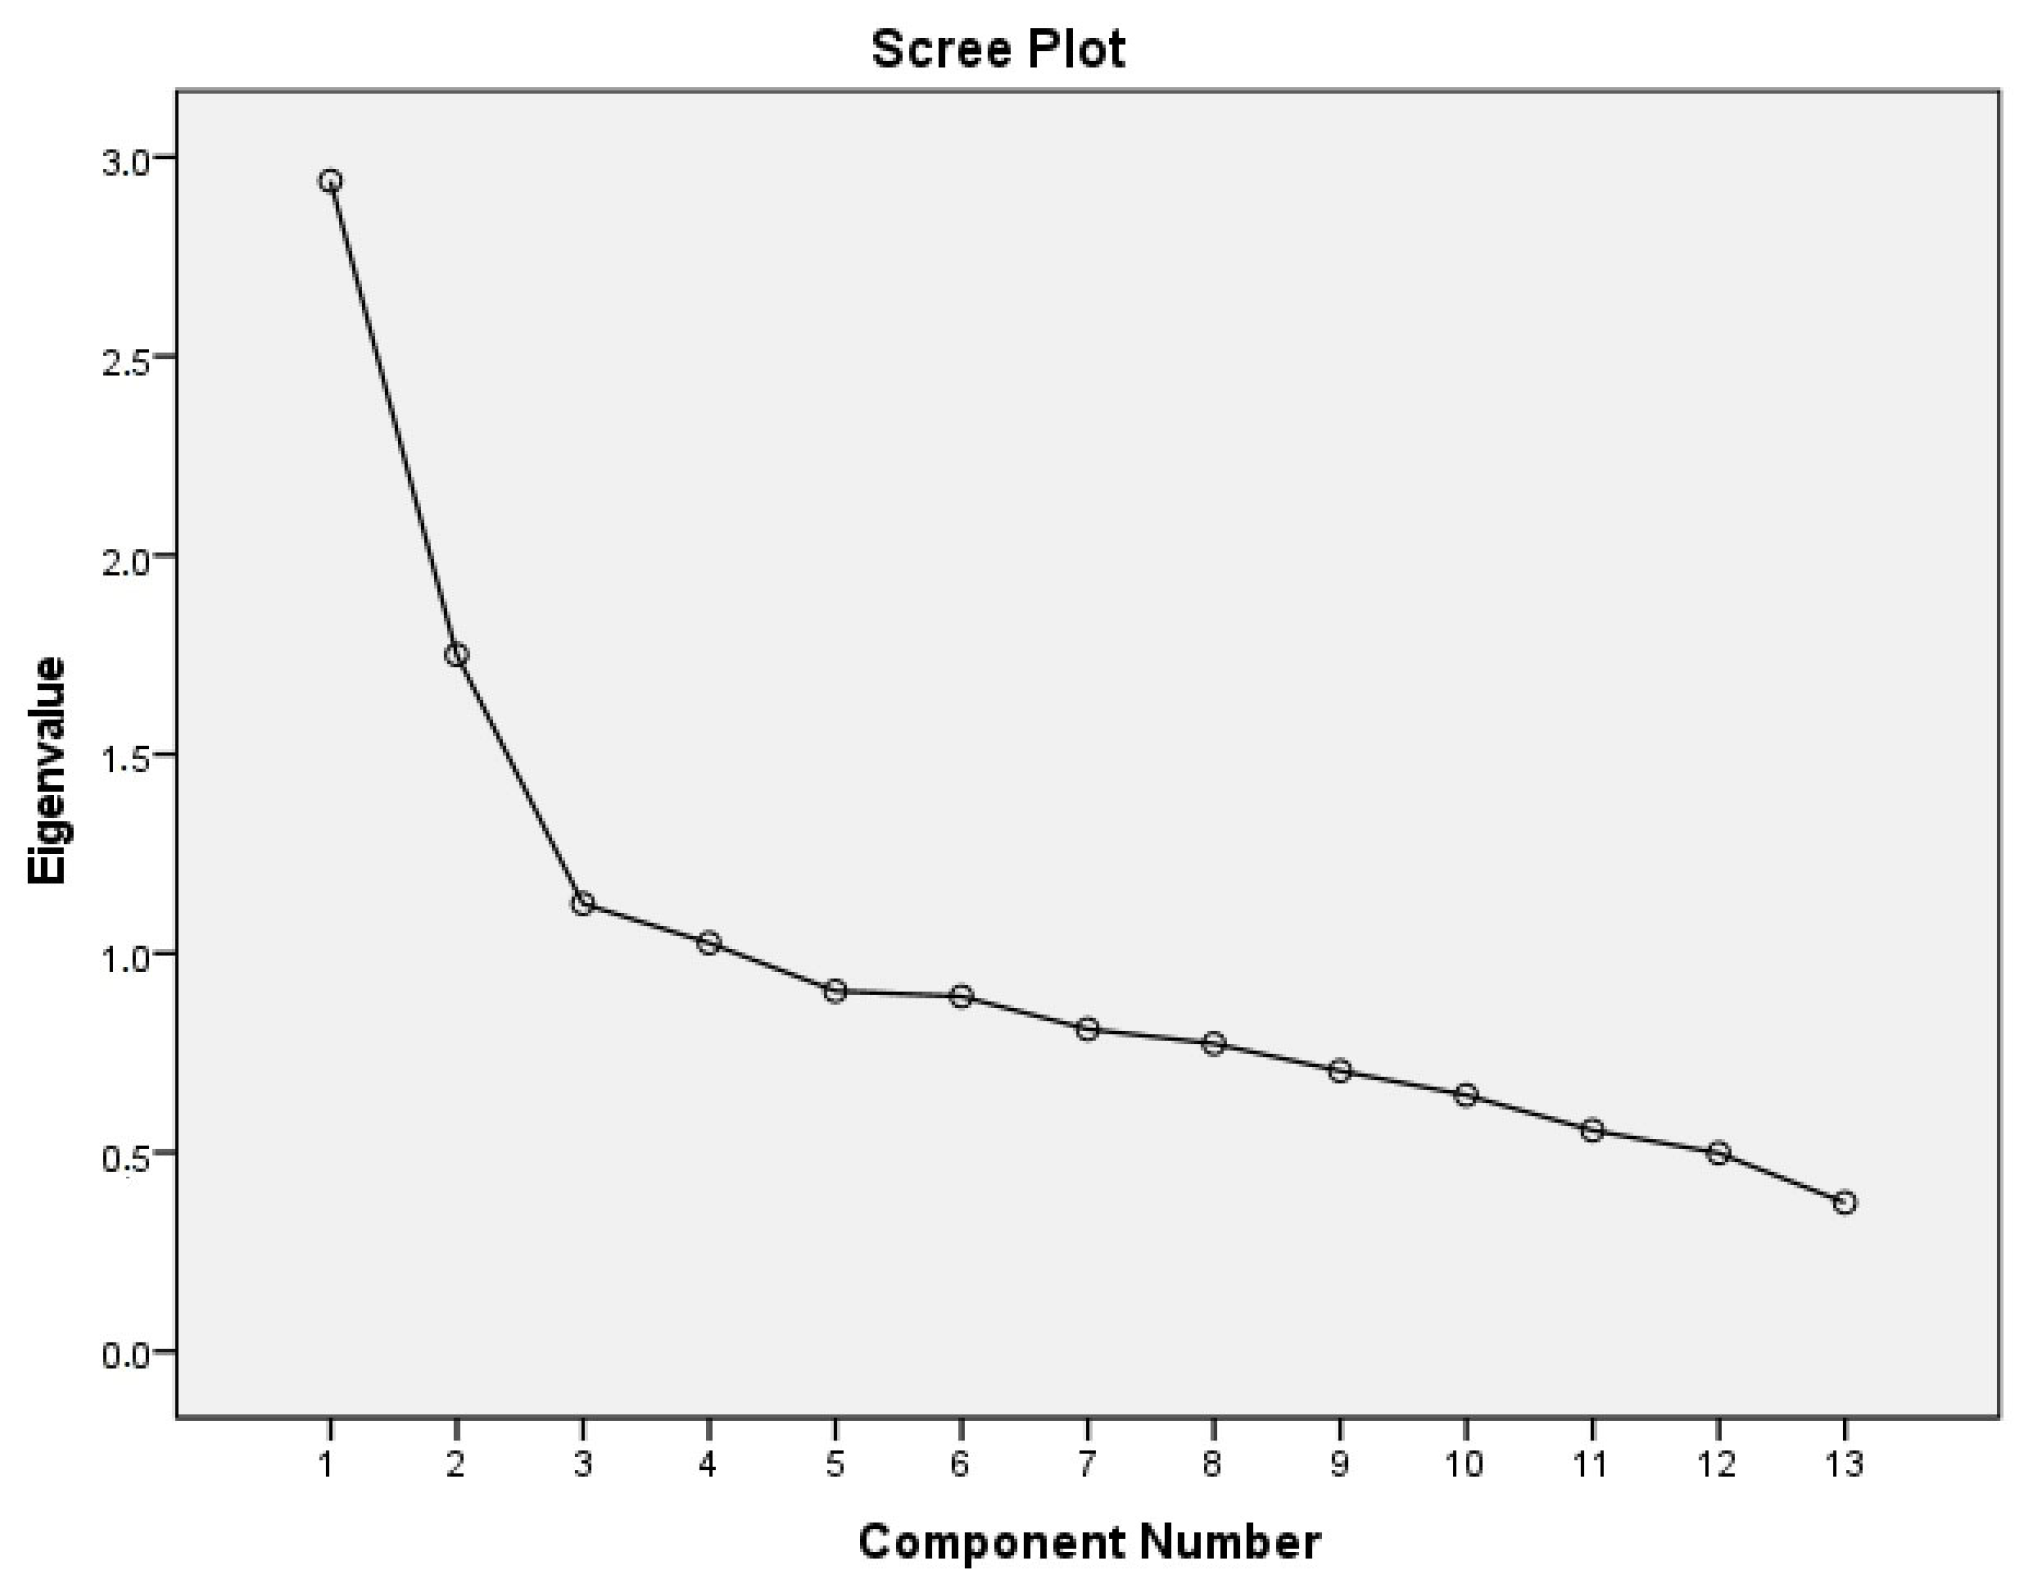
Principal Component Factor analysis, coupled with Varimax rotation, was performed to determine the core components (sub-dimensions) of the scale. In component analysis, the Kaiser criterion—retaining factors with eigenvalues greater than one—is widely acknowledged as the most appropriate method [30,31]. To determine the items composing the scale, factor loadings from the Varimax rotation analysis served as the primary reference. If an item exhibited high factor loadings under two separate factors, the difference had to be at least 0.10. This threshold varies across literature, with 30 and 40 commonly recognized as standard limit values [32].
There were 4 factors in the scale “Teachers’ Views on Mathematics Education and Online Learning Experiences During the COVID-19 Pandemic”. The total variance explained by four factors is 52.635%. A higher degree of variation resulting from factor analysis is associated with a stronger factor structure, as noted in the literature [33]. Since it is difficult to reach very high values in social sciences, it is mentioned in various sources that between 40 and 60% is acceptable [34]. Therefore, in this study, the variance was found to be over 40%, and it is within acceptable limits. The first factor explained 22.622% (eigenvalue: 2.941), the second factor 13.465% (eigenvalue: 1.750), the third factor 8.654% (eigenvalue: 1.125), and the fourth factor 7.893% (eigenvalue: 1.026) of the variance. Following the Varimax rotation, the variance percentages for the four identified factors were 15.33% for the first factor, 13.64% for the second, 12.15% for the third, and 11.52% for the fourth. The factor loadings ranged between 0.435 and 0.814.
Table 2 displays the items assigned to factors following the Varimax rotation. Based on the analysis results, the questionnaire can be categorized into four components. In defining these four sub-dimensions (comprising 13 items), consideration was given to the content of the grouped items and their alignment with the theoretical framework. Accordingly, the sub-dimensions were named “Teaching Experience and Lack of Teaching Experience” (1+, 3−, and 5−; 3 items), “Teachers’ Professional Development and Support, and Lack of Teacher’s Professional Development and Support” (2+, 4−, 6+, and 9−; 4 items), “Students’ Engagement and Students’ Disengagement” (7+ and 8−; 2 items) and “Teachers’ Job Satisfaction and Job Dissatisfaction” (10+, 11−, 12+, and 13−; 4 items). Each factor of the scale contains both positive (+) and negative (−) items. Therefore, the factor names of the scale also consist of similar positive and negative expressions.
Table 2.
Results of factor analysis total variance explained.
The “Scree Plot” graph in the scale “Teachers’ Views on Mathematics Education and Online Learning Experiences During the COVID-19 Pandemic” is shown in Figure 1.
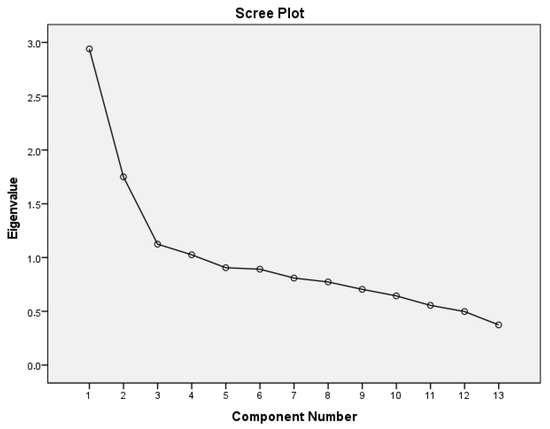
Figure 1.
Scree plot graph for the scale.
An analysis of the Scree plot in Figure 1 indicates that the scale aligns well with a four-factor structure. As a result of the Cronbach’s alpha reliability analysis applied to the scale form, the reliability coefficient was found to be 0.82, and it was concluded that the scale was reliable. As a result of these tests, it can be said that the prepared scale form is reliable and valid and has a structure.
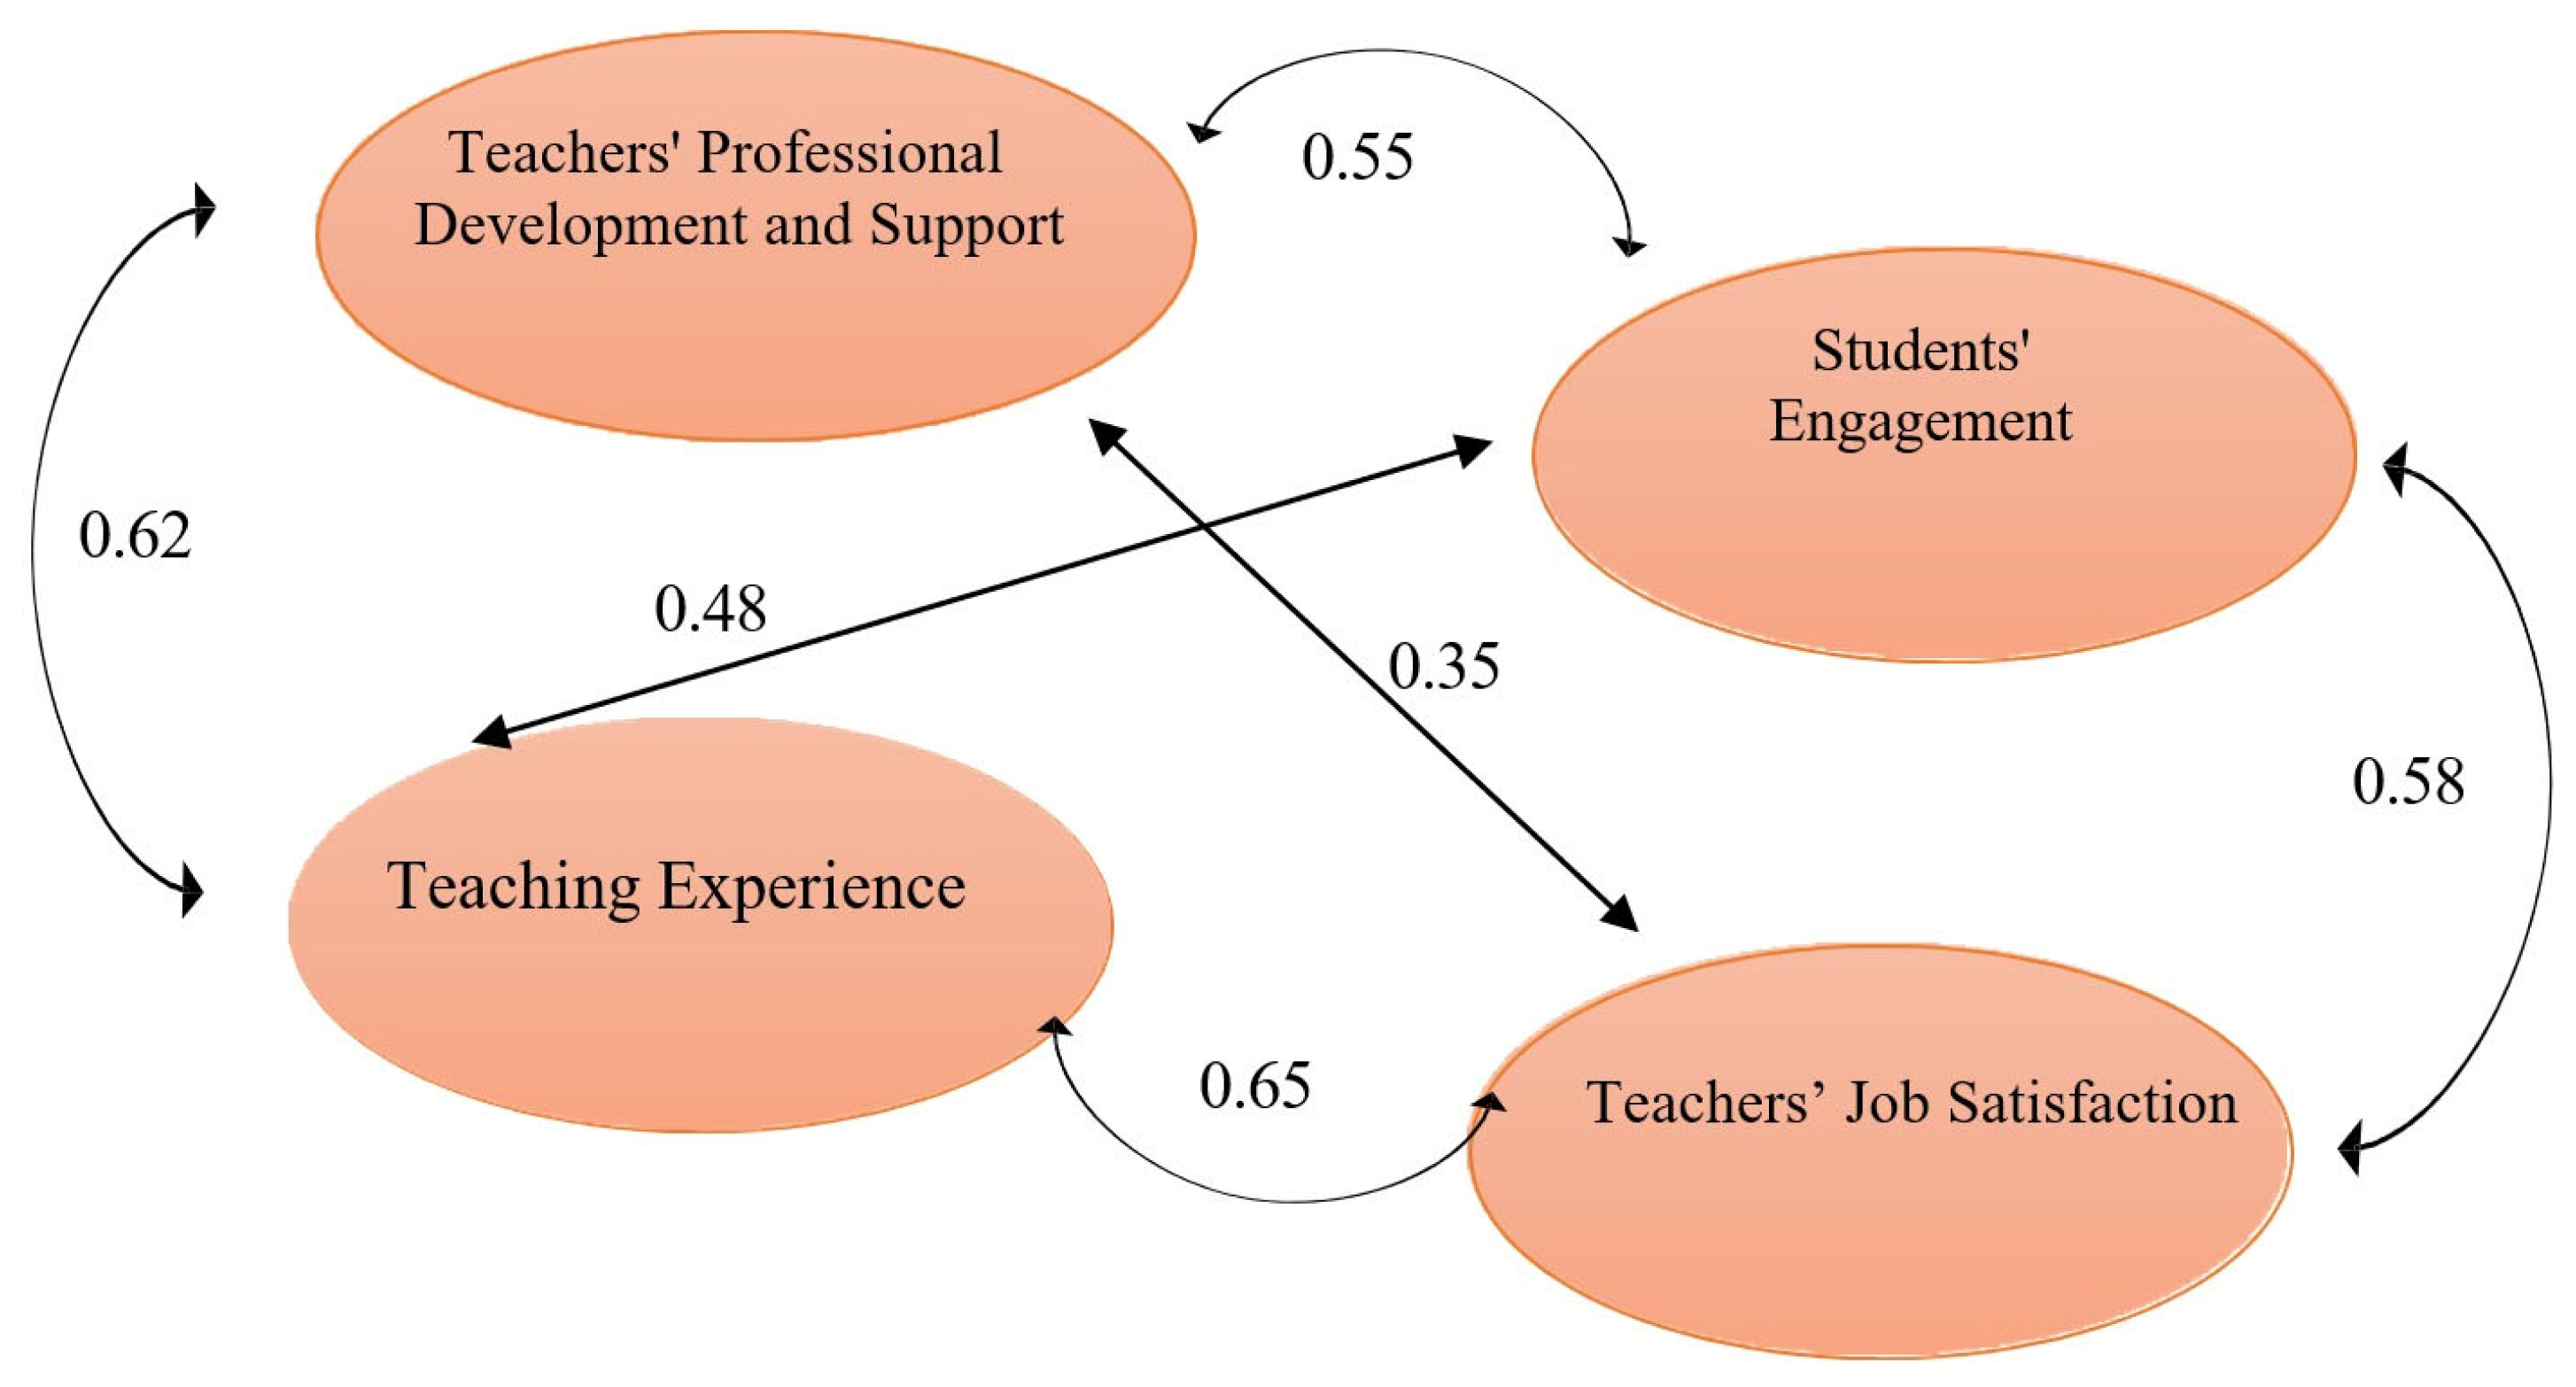
In this study, to obtain the subscale scores of the teachers, the negative items were reversed and added to the subscale scores as positive. As a result of the Pearson correlation tests conducted between the subscales, positive relationships were found. According to the values found, a path diagram was drawn, and a conceptual framework was presented. The findings obtained from the analysis are detailed in Figure 2.
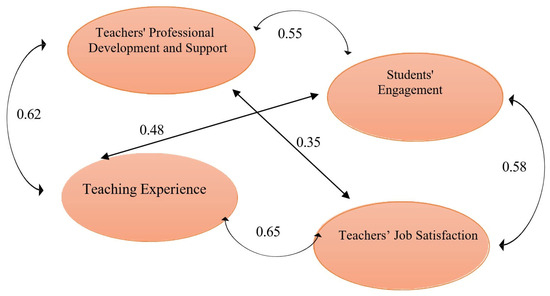
Figure 2.
Path diagram for the subscales.
3.4. Construction of the Model
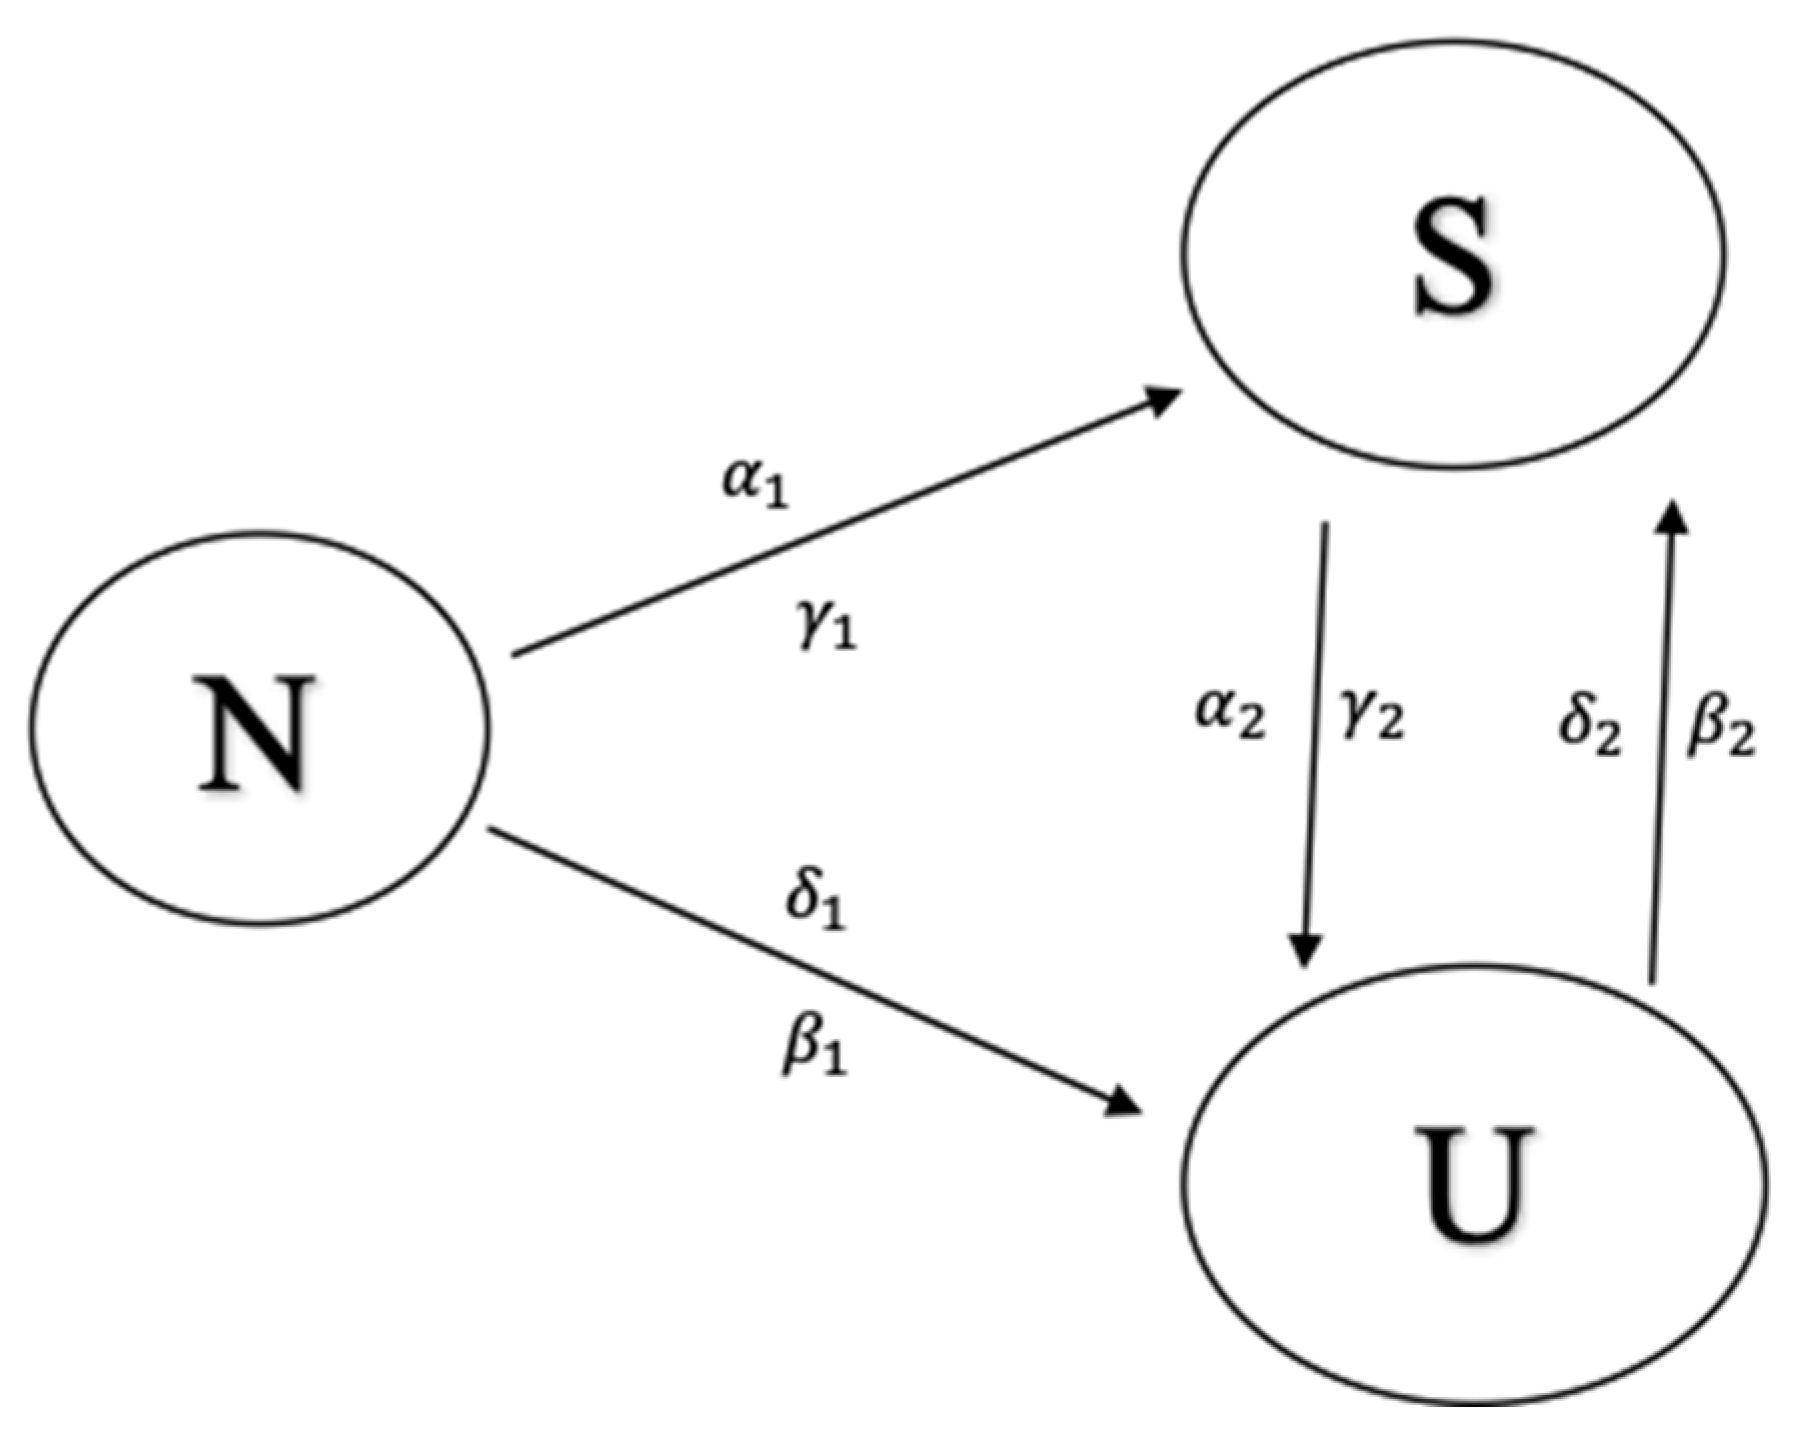
The transmission before and after online education is considered. The compartments are , , and , which denote the initial situation, successful education, and unsuccessful education, respectively. The system is defined by a system of linear ordinary differential equations:
Table 3, which describes the related parameters and their conceptual meanings in relation to teacher development, student engagement, Teaching experience and job satisfaction, offers an interpretation of the state variables employed in the model.
Table 3.
Interpretation of the state variables used in the model.
Figure 3 provides a visual representation of the interactions between the main state variables and their functions in the system dynamics, as well as the general structure and procedure of the suggested model.
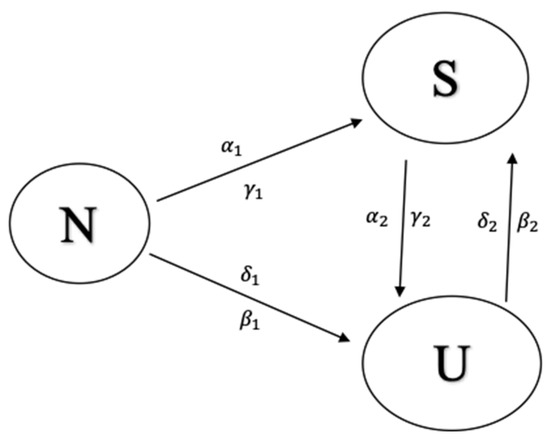
Figure 3.
A diagram detailing the model’s process.
An explanation and demonstration of the following theorem is provided in order to provide evidence that the suggested model does, in fact, include solutions.
3.5. Mathematical Adaptation of the Collected Data to a Model
3.5.1. Free Equilibrium Points and Threshold Parameters
By equating each equation in the system (1), we get the free equilibrium (2):
To calculate the threshold parameter (R0), which represents the persistence or elimination of unsuccessful mathematics education outcomes, we applied the next-generation matrix method. This approach models how factors such as lack of teacher support, job dissatisfaction, disengaged students, and inexperience may contribute to the spread of educational failure within the school system.
We constructed a next-generation matrix , where denotes the rate at which new cases of educational failure (e.g., ineffective teaching, disengagement) arise, and represents the rate at which such cases are resolved, either through support, engagement, or exit from the system.
We obtain the threshold parameter:
The first term reflects the balance between supportive teaching conditions (CPD and experience) and the loss of effective teaching due to burnout, inexperience, or teacher turnover.
The second term captures how dissatisfaction, disengagement, and lack of support interact with satisfaction, student engagement, and systemic recovery.
Theorem 1.
For the model (1), the free equilibrium (2) is locally asymptotically stable.
Proof of Theorem 1.
Then,
Therefore,
And,
Then we obtain
After some algebraic work,
Since and are always negative, the free equilibrium is asymptotically stable locally. □
3.5.2. Numerical Simulation
In this section, numerical outcomes are derived through model simulations employing data collected from mathematics teachers instructing during the 2023–2024 academic year. Numerical outcomes are derived by using MATLAB R2022a computer program. The simulation employs specific model parameters: N, S, U, , δ1, δ2, γ1, γ2, α1, α2, β1, and β2.
3.5.3. Sensitivity Analysis
Sensitivity analysis was utilized to grasp how sensitive the threshold parameter is to the key parameters utilized across the model [35]. The calculation of the threshold parameter expression was conducted in the preceding Section 3.5.1 and is represented as
The calculation of the normalized local sensitivity indices of R0 with respect to the parameters was conducted. This involved identifying the set of input parameters that are pertinent to R0.
We denoted R0 as the normalized local sensitivity index concerning a parameter contained within , where is defined as
Utilizing the definition provided above in Equation (4), we calculated the subsequent indices (5)–(8) for the output R0 in relation to each parameter as outlined below.
4. Results
4.1. Numerical Simulation and Threshold Parameter
Through simulation of the model, Table 4 presents the calculated values of the parameters derived from the collected data.
Table 4.
Model parameters derived from data collected during the 2023–2024 academic year for each private and public school.
The threshold parameter (R0) was determined utilizing the next-generation matrix method. R0 serves as a metric for assessing the potential for successful education enhancement. Broadly speaking, when R0 ≥ 1, it indicates a likelihood of success in education outcomes. Conversely, if R0 < 1, it suggests a propensity towards unsuccessful educational outcomes. This analysis provides crucial insights into the factors influencing the trajectory of educational success during crises, offering valuable implications for educational policy and intervention strategies.
The threshold parameters (R0) were calculated by entering the values found in Table 4 into the formula given in (3).
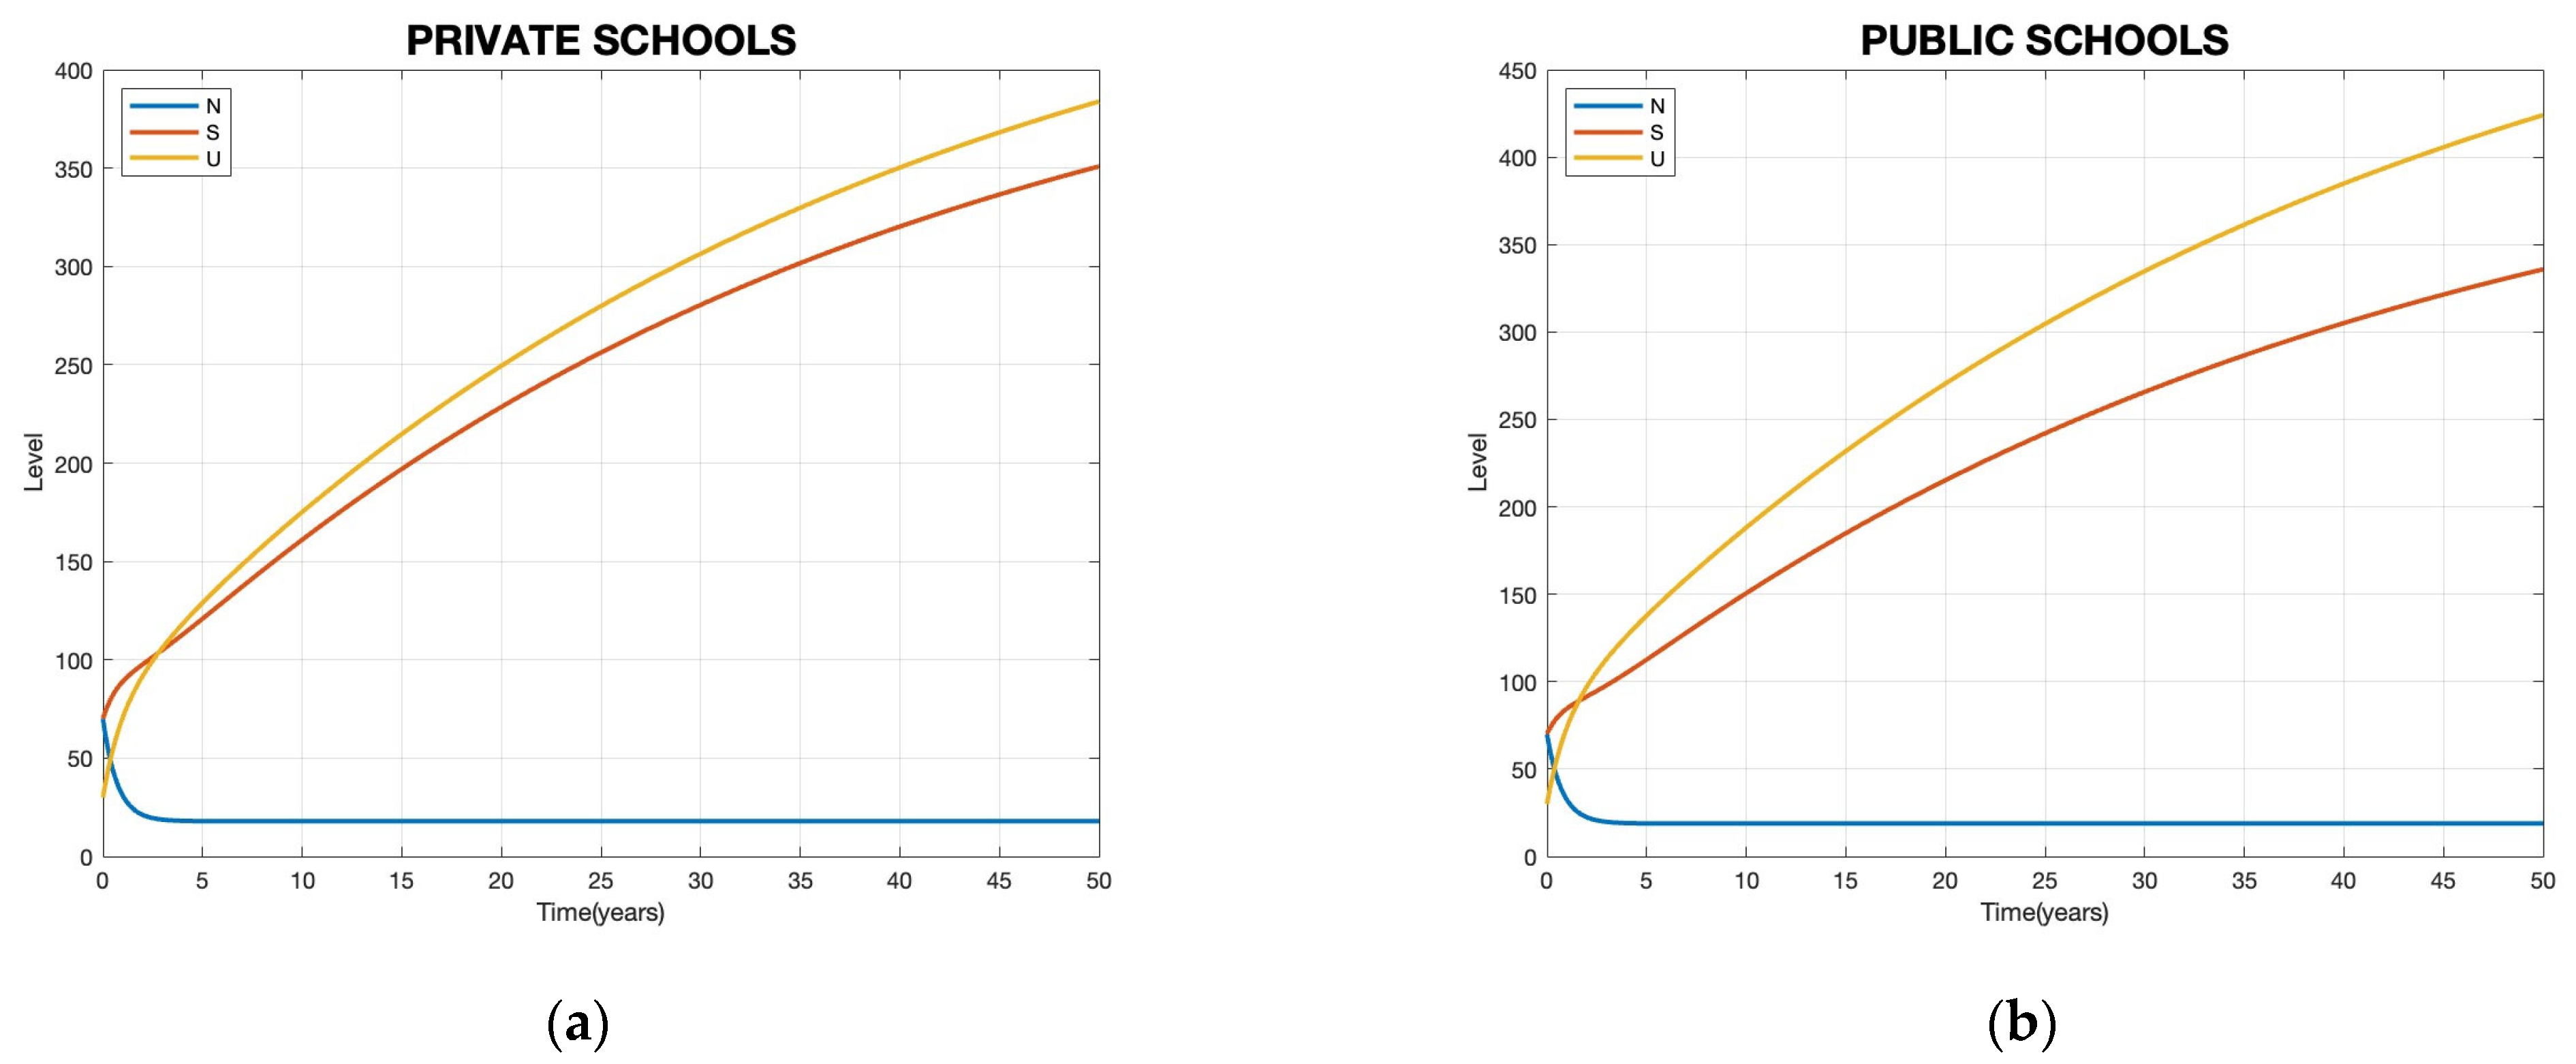
Since both R0, private and R0, public < 1, it indicates that at the onset of the pandemic, mathematics education was perceived as unsuccessful from the perspective of mathematics teachers. This observation is depicted in the accompanying Figure 4.
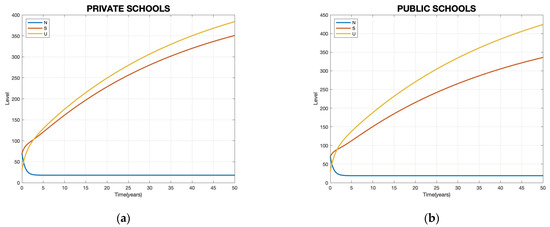
Figure 4.
Mathematics education at the onset of the pandemic: (a) Description of private schools; (b) description of public schools. “Level” on the vertical axis represents a dimensionless indicator of relative success in mathematics education based on model outputs. Time is measured in years.
4.2. Sensitivity Analysis of R0
A local sensitivity analysis was performed to show how each model parameter affected R0. Sensitivity values for each parameter were calculated by entering the values from Table 4 into the equations from (5) to (8). The results are shown in Table 5.
Table 5.
Sensitivity values.
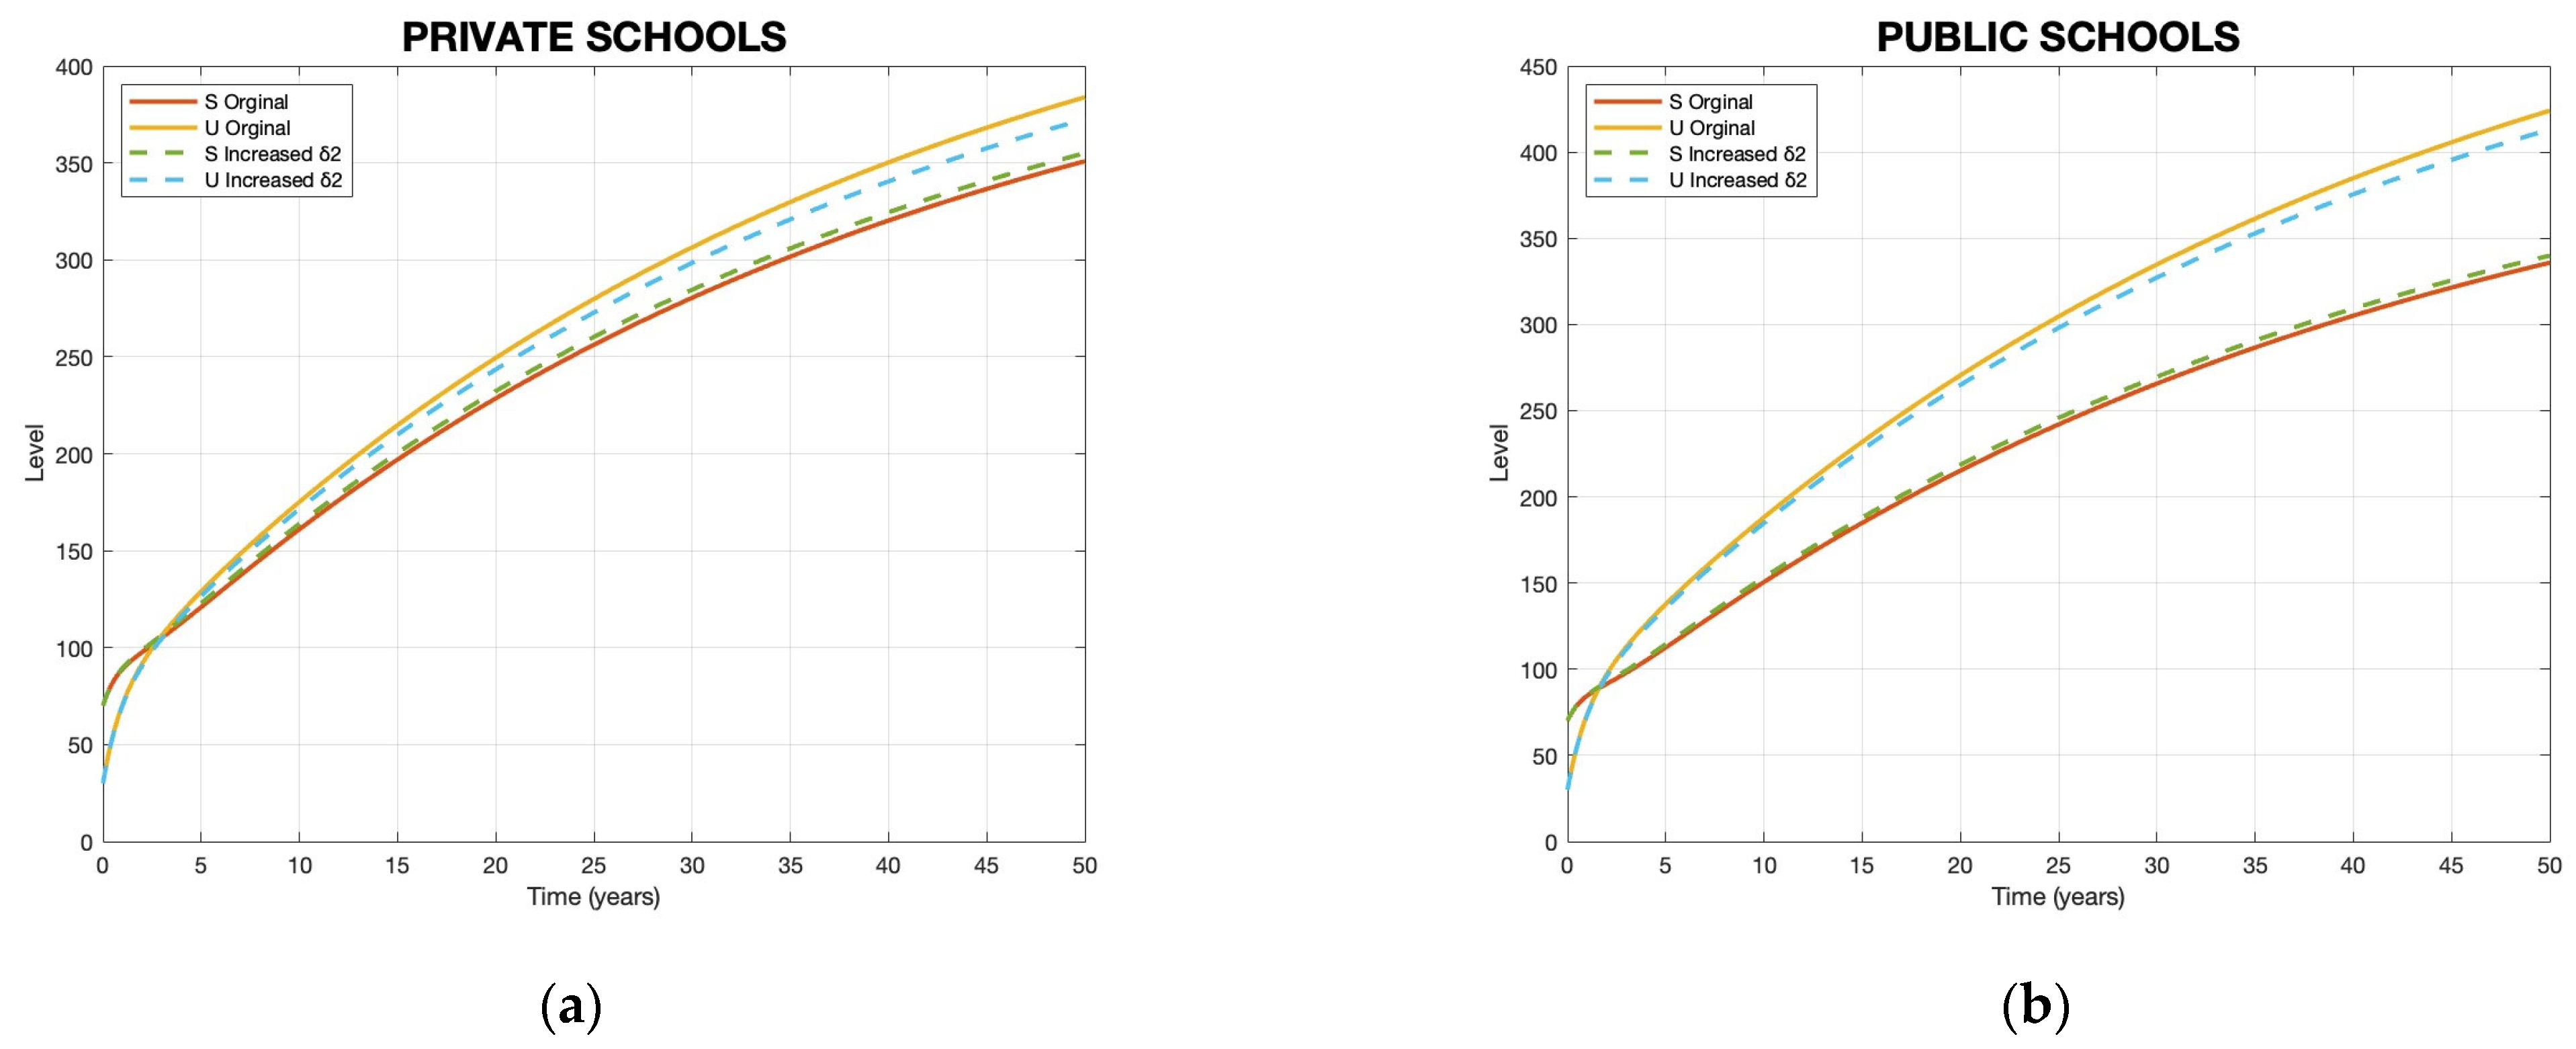
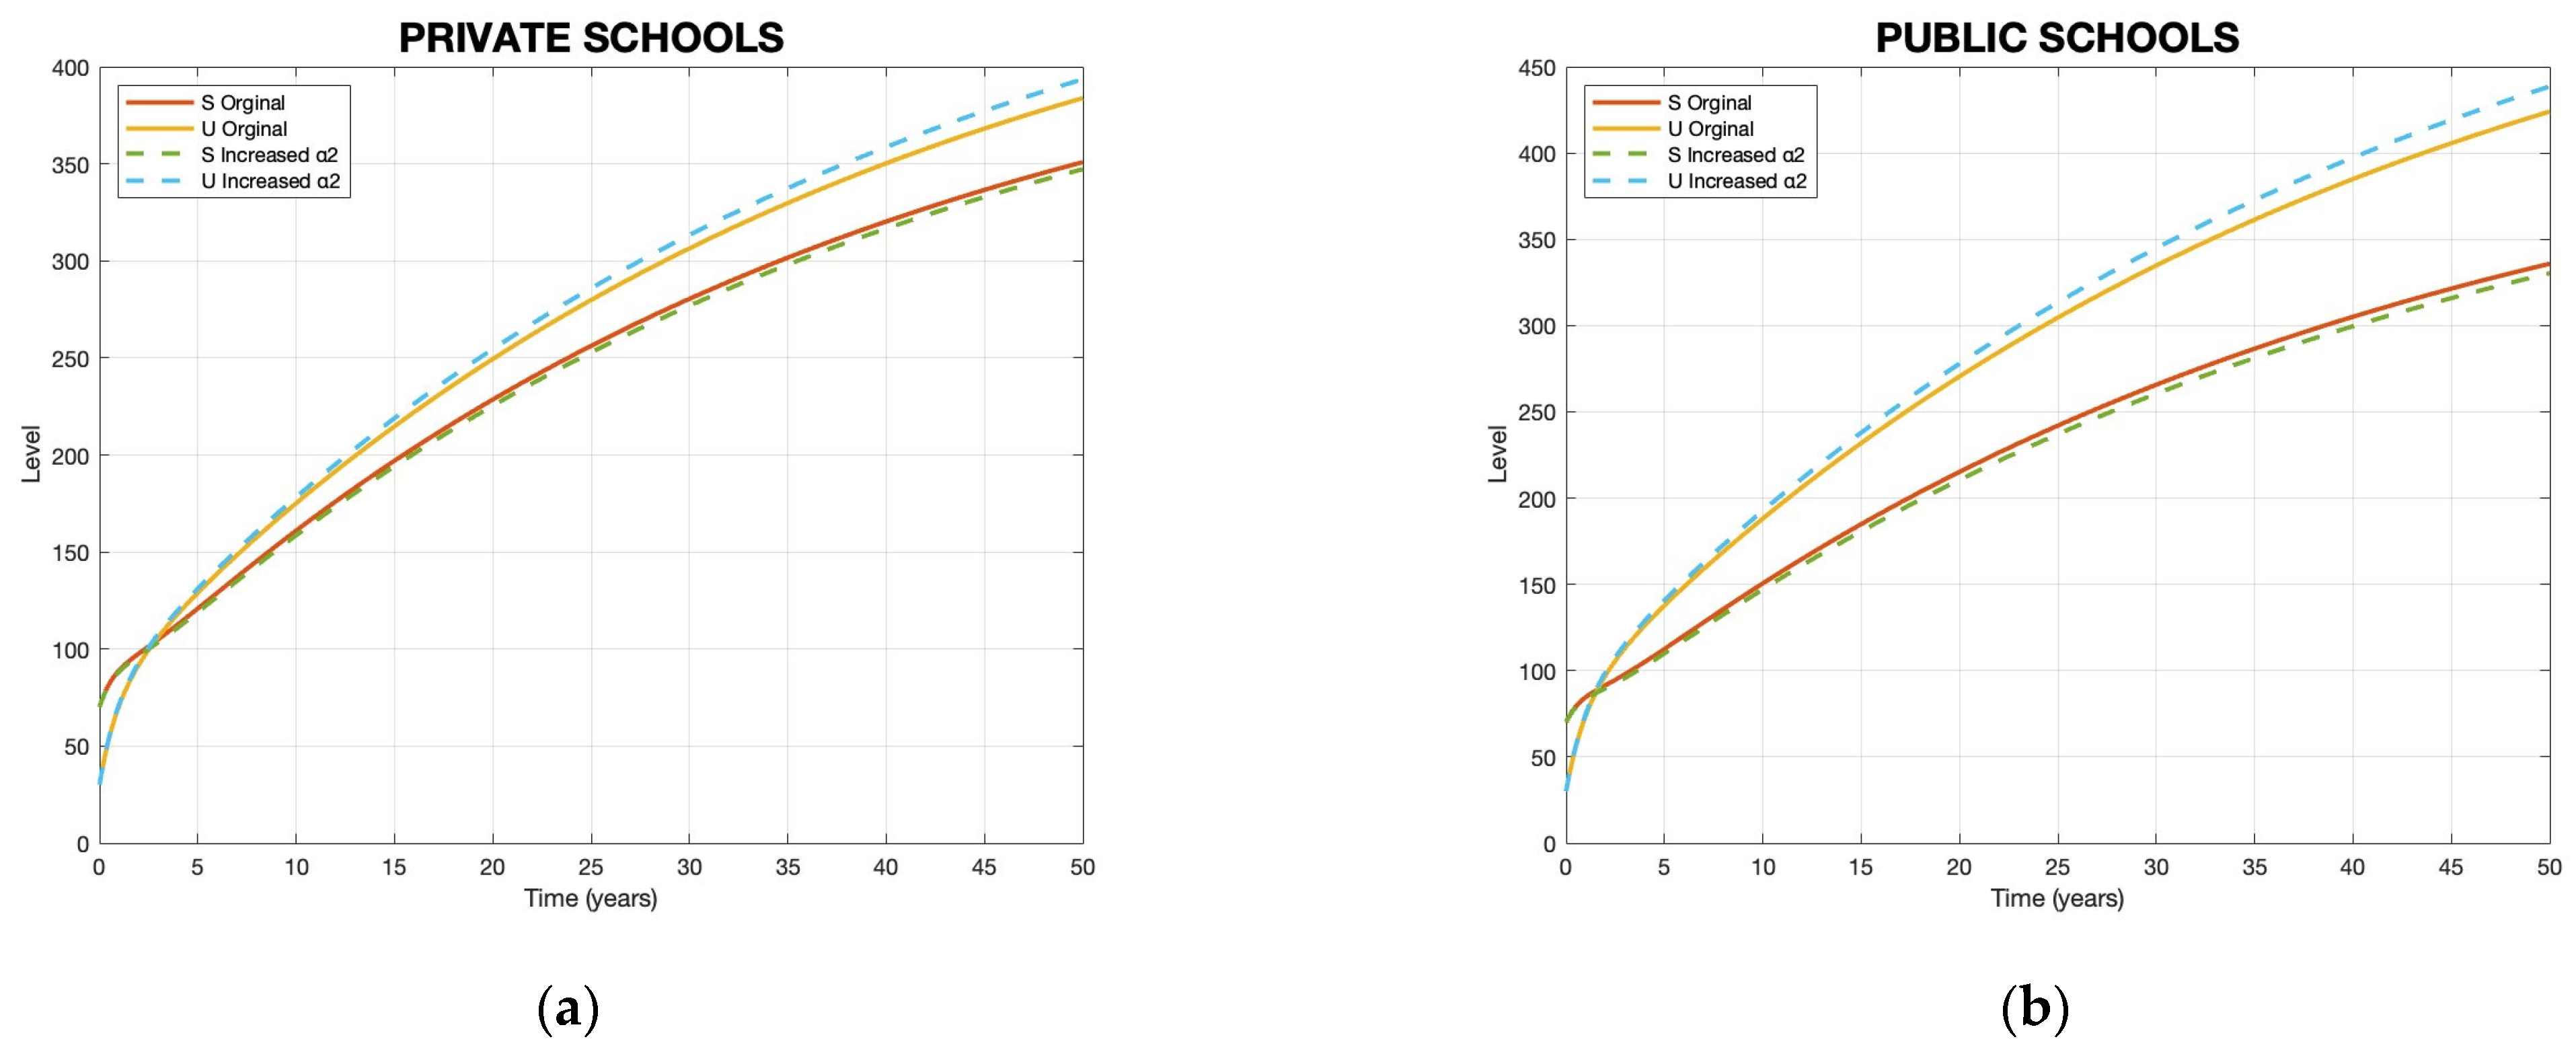
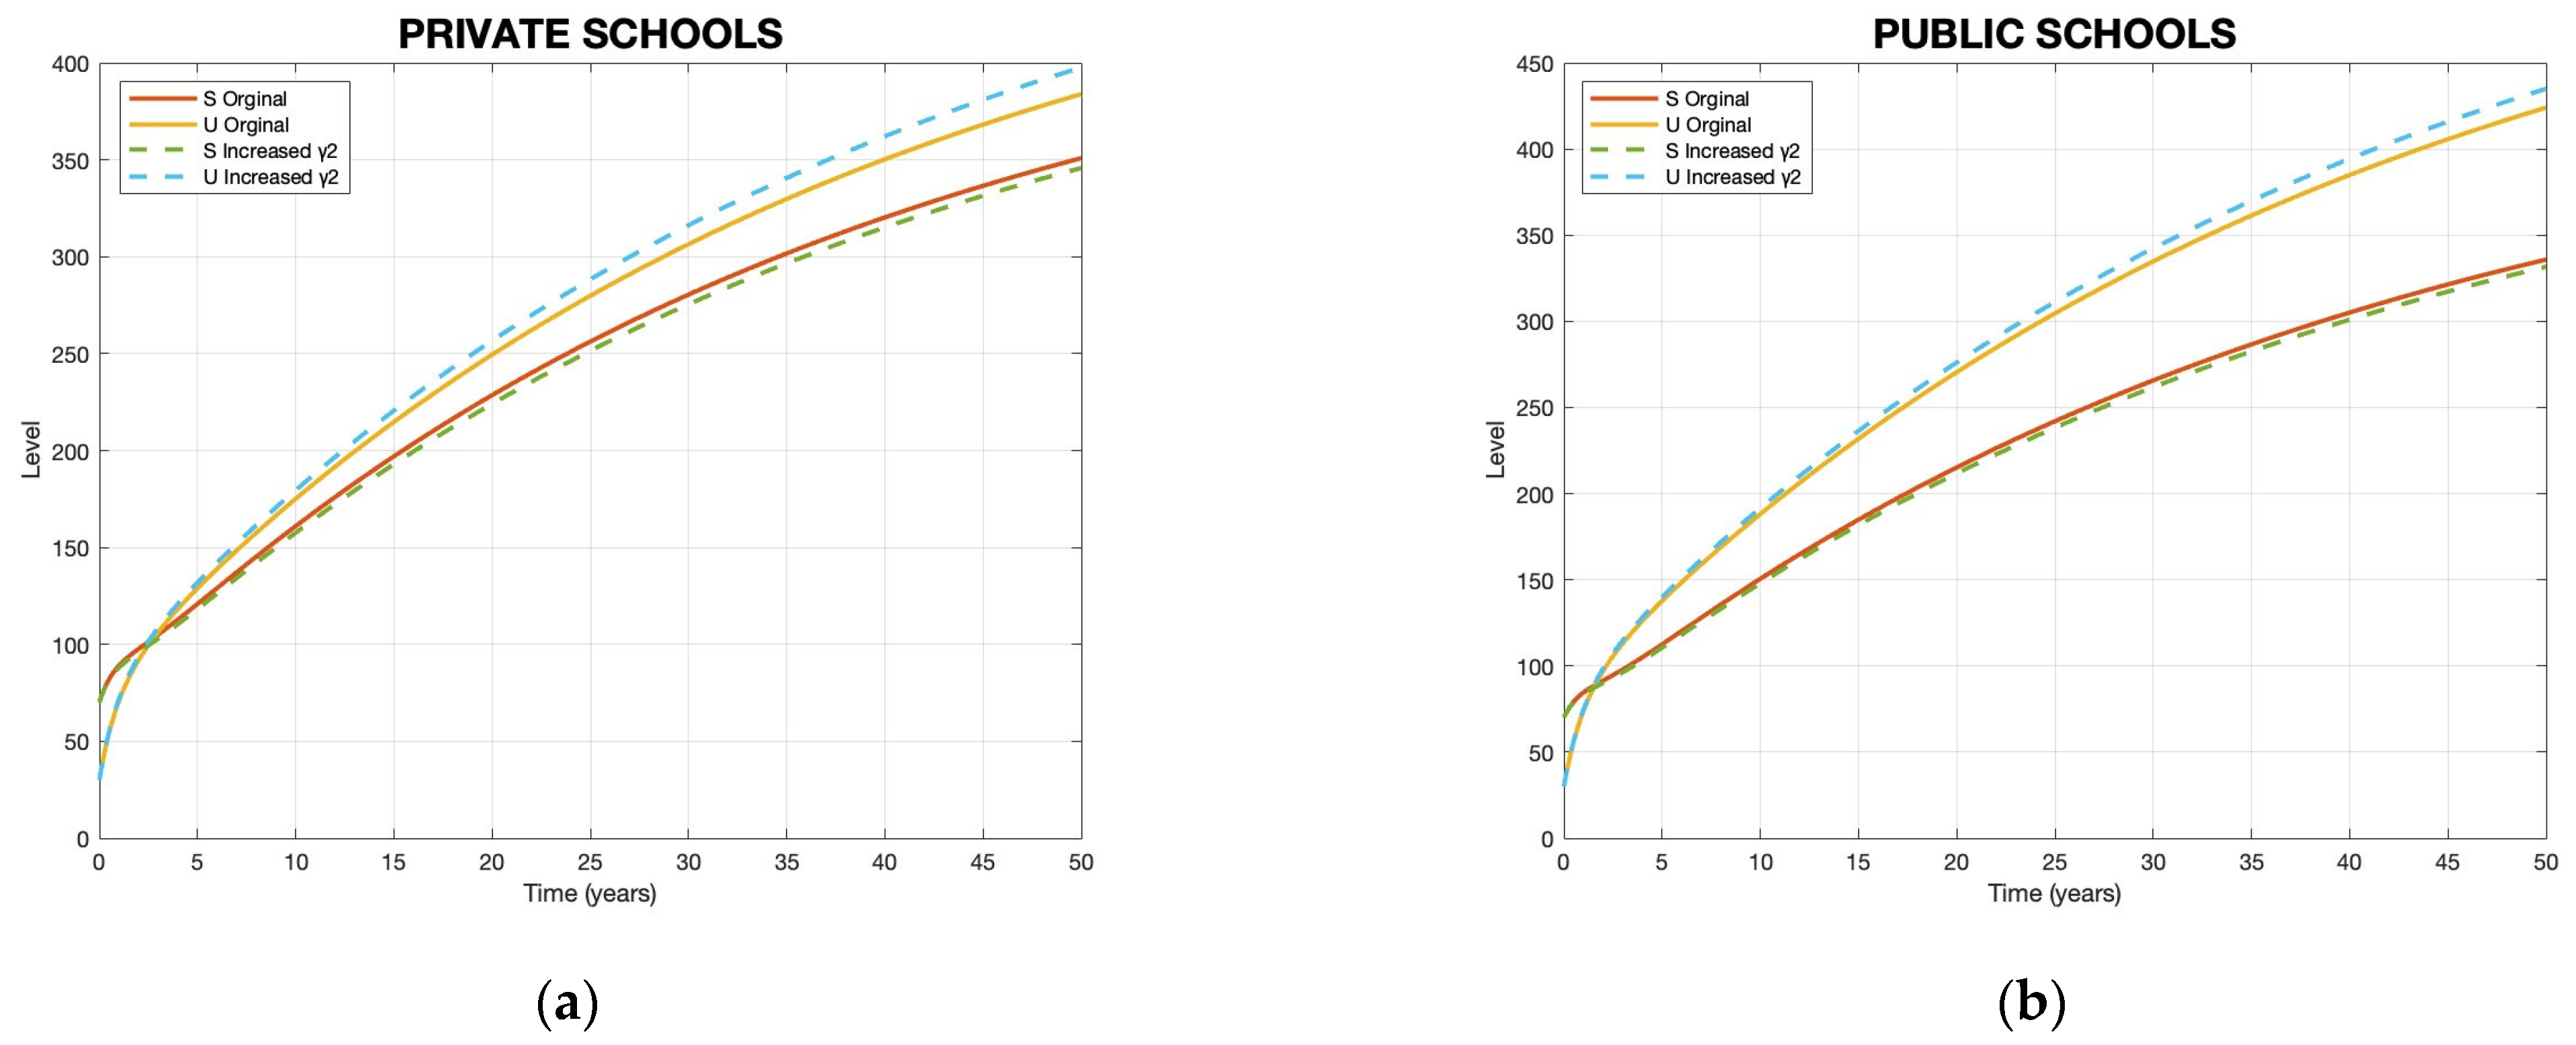
Table 3 illustrates that in private schools, a 10% increase (or decrease) in β2 results in an 8% rise (or drop) in R0, while a similar change in δ2 leads to a 7% variation in R0. Likewise, modifying α2 by 10% reduces (or raises) R0 by approximately 3%, and adjusting γ2 by the same percentage decreases (or increases) R0 by about 4%.
For public schools, a 10% increase (or decrease) in β2 leads to a 4% rise (or drop) in R0, whereas a corresponding change in δ2 affects R0 by 9%. Additionally, altering α2 by 10% reduces (or raises) R0 by around 4%, and modifying γ2 by the same percentage decreases (or increases) R0 by roughly 3%. Graphical depictions of the parameters are shown in Figure 5, Figure 6, Figure 7 and Figure 8.
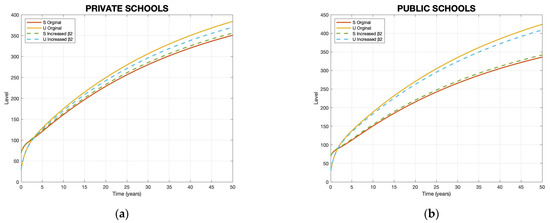
Figure 5.
Table 4 presents the predicted success (S) and unsuccessful (U) levels based on the model, both with the original parameter values and with a 10% increase in the specific parameter β2. In (a) and (b), respectively, the effect of the modification of on the number of private and public schools is displayed. “Level” on the vertical axis represents a dimensionless indicator of relative success in mathematics education based on model outputs. Time is measured in years.
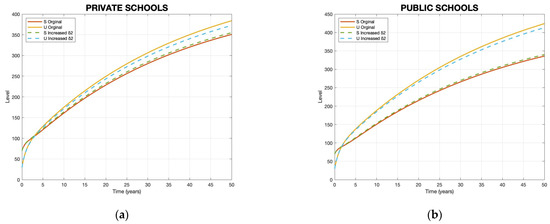
Figure 6.
Predicted success (S) and unsuccessful (U) levels by the model with the original parameter values in Table 4 and with a 10% increase in the specific parameter . In (a) and (b), respectively, the effect of the modification of on the number of private and public schools is displayed. “Level” on the vertical axis represents a dimensionless indicator of relative success in mathematics education based on model outputs. Time is measured in years.
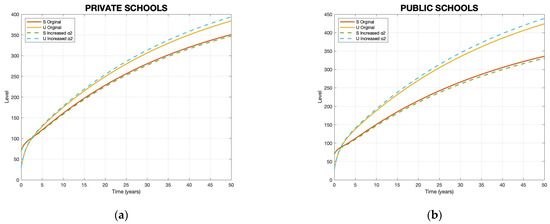
Figure 7.
Success (S) and unsuccessful (U) levels predicted by the model with the original parameter values in Table 4 and with a 10% increase in the specific parameter . In (a) and (b), respectively, the effect of the modification of on the number of private and public schools is displayed. “Level” on the vertical axis represents a dimensionless indicator of relative success in mathematics education based on model outputs. Time is measured in years.
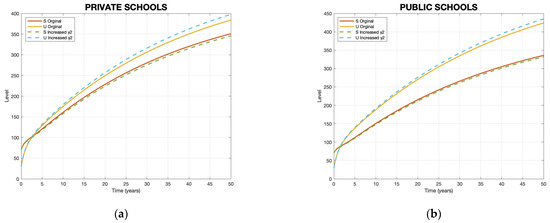
Figure 8.
Table 4 presents the predicted success (S) and unsuccessful (U) levels based on the model, both with the original parameter values and with a 10% increase in the specific parameter γ2. In (a) and (b), respectively, the effect of the modification of on the number of private and public schools is displayed. “Level” on the vertical axis represents a dimensionless indicator of relative success in mathematics education based on model outputs. Time is measured in years.
4.3. A Statistical Look at How Engaged Students Are in Different Types of Schools
We used an independent samples t-test to see if there was a statistically significant difference in how math teachers in private and public schools thought their students were engaged throughout the pandemic.
The average engagement score for private school teachers was 3.03, and the average score for public school teachers was 2.78. The t-test gave a t-value of 2.71 and a p-value of 0.0068.
The difference is statistically significant at the 95% confidence level because the p-value is smaller than 0.05. This means that the private school math teachers thought their students were much more interested in math during the pandemic than the public school math teachers did.
5. Discussion
This study sought to evaluate the rates of success and failure in mathematics education outcomes in secondary and high schools in the aftermath of the epidemic. A comparison was made between the outcomes of private and public schools. A compartment model was developed for this purpose, and the threshold parameter R0 was calculated using the next-generation matrix method. Furthermore, local sensitivity analysis was conducted to demonstrate the effect of each model parameter on R0.
The threshold parameter (R0) measures the potential for success in educational outcomes. Generally, when R0 ≥ 1, it indicates a likelihood of success in educational outcomes. Conversely, if R0 < 1, it suggests a propensity towards unsuccessful educational outcomes. This analysis offers valuable insights into the factors that influence the trajectory of educational success during crises. It provides crucial implications for educational policy and intervention strategies.
Based on the model parameters calculated from data collected from mathematics teachers in both private and public secondary and high schools, R0 was found to be approximately 0.735 for private schools and 0.753 for public schools. Both R0 < 1, indicating that during the pandemic, mathematics education was perceived as unsuccessful. The value of R0 is slightly higher in private schools compared to public schools. This could be due to differences in technological infrastructure between the two types of schools [36]. Additionally, students in private schools had better opportunities to attend online classes compared to students in public schools, who faced economic barriers to accessing online classes.
Although the private R0 value is higher than the public R0 value, it is still considered low according to the R0 threshold parameter, which is greater than or equal to one. If the current situation persists, there is a high risk of an increase in unsuccessful outcomes and a decrease in successful outcomes.
The numerical results were derived by simulating the model using real data collected from mathematics teachers in private and public secondary and high schools during the 2023–2024 academic year. Figure 4 illustrates the dynamics of successful and unsuccessful educational outcomes. As per the table, the successful education outcomes decreased, and the unsuccessful education outcomes increased during the pandemic. Currently, three years after the pandemic, the levels of successful and unsuccessful education outcomes are almost equal. However, over time, the rate of unsuccessful education outcomes increases while that of successful education outcomes decreases. Eventually, the gap between the two will widen.
A study investigated the digital transition of teaching and learning in a mathematics curricular unit during the pandemic. It examined the changes and challenges faced by educators during this time. The analysis of previous years’ outputs and a comparison with the latest assessment outputs led to the conclusion that the implementation helped to mitigate an unfavorable scenario for educational success [37].
To determine the most effective parameter and magnitude for increasing the R0 value in the case of unsuccessful education outcomes, sensitivity analysis was employed. Increases of 10% were applied to all parameters in this study for the sensitivity analysis of the model.
Increasing the value of β2 resulted in an 8% increase in R0 for private schools and a 4% increase for public schools. To cultivate a helpful learning environment that supports efficient teaching and learning, student engagement is essential. The level of student engagement has a significant impact on both their participation and academic achievement in courses like mathematics [38].
The results indicate that students from private schools are more engaged in lectures compared to those in public schools. This may be due to private school students having the opportunity to attend live lessons during the pandemic, while public school students did not. Public school lessons were recorded instead [39].
Increasing δ2 appeared to increase the value of R0 by 7% for private schools and by 9% for public schools. Job satisfaction is crucial in promoting teachers’ well-being and mental health, which in turn impacts their effectiveness in the classroom. According to the framework, teachers’ instructional quality can be influenced by their well-being. For example, elevated levels of stress or burnout among teachers may lead to decreased engagement and motivation. Additionally, compromised well-being can affect teachers’ classroom management skills, as they may struggle to effectively address challenging student behavior when feeling overwhelmed [12]. As the results are similar, it can be concluded that the level of job satisfaction for private- and public-school teachers is comparable. Throughout the pandemic, public school teachers had more opportunities for rest compared to their counterparts in private schools. However, private school teachers are compensated with a higher salary than public school teachers. These two factors have almost equalized the level of job satisfaction.
Increasing the value of α2 appeared to decrease R0 by 3% for private schools and 4% for public schools. Continuing professional development (CPD) often facilitates professional collaboration and networking among teachers, which is essential for sharing best practices and resources in mathematics education. The lack of continuous professional development opportunities diminishes the opportunities for peer learning and support, hindering teacher growth and development [40]. It can be inferred from this result that teachers in private schools have more opportunities for professional development and a more conducive environment for sharing information compared to teachers in public schools.
Increasing the value of γ2 appeared to decrease R0 by 4% for private schools and 3% for public schools. A lack of experience can pose challenges in classroom management, leading to disruptions and reduced learning opportunities for students. Inexperienced teachers may face difficulties in establishing and maintaining a conducive learning environment, which can affect student engagement and behavior [41]. Based on the collected data, it appears that private school mathematics teachers have less teaching experience than their public-school counterparts.
R0, the basic reproduction number, tells us what factors have the biggest impact on how well students perform in school. The most useful thing for R0 was β2 (how engaged the students were). In private schools, an increase of 10% in engagement led to an 8% rise in R0, while in public schools, a 10% rise in engagement led to a 4% rise in R0. This means that providing students easy access to live lessons, interactive channels, and online materials can actually help them learn, especially in public schools that do not have sufficient facilities.
Furthermore, δ2 (job satisfaction) had a big impact; it rose up 7% for private schools and 9% for public schools. It also illustrates how crucial it is to assist instructors stay healthy, avoid a burn out, and get paid equally. Your kids will perform better in math if you pay attention to their working conditions and motivation. Happy teachers teach better.
Conversely, α2 (Lack of teachers’ professional development and support) has a negative impact on R0. When α2 went up by 10%, R0 went down by 3% in private schools and 4% in public schools. This reveals that teachers are not as good at their jobs when they do not have continuing professional development (CPD). Giving mathematics teachers frequent opportunities to gain advice, understand new things, and work together would help them teach better and stay enthusiastic about their career.
Similarly, γ2 (not having enough teaching experiences) also had a small but clear negative impact on R0, with a decrease of 4% in private schools and a 3% drop in public schools. This means that novice instructors might not be able to run online classes well, which could make students lose interest. Putting money into courses that train new teachers how to run a classroom and how to teach could help with this problem.
The results clearly show that student engagement (β2) and instructor job satisfaction (δ2) are the two most important and sensitive factors for improving math learning outcomes in online or hybrid settings. These factors not only reveal how people act, but they also show how the system functions, like the policy support, school leadership, and infrastructure.
Similarly, γ2 (not having enough teaching experiences) also had a small but clear negative impact on R0, with a decrease of 4% in private schools and a 3% drop in public schools. This means that novice instructors might not be able to run online classes well, which could make students lose interest. Putting money into courses that train new teachers how to run a classroom and how to teach could help with this problem.
The results highlight student engagement (β2) and job satisfaction (δ2) as the most critical factors for improving math learning outcomes in online or hybrid settings. These factors reflect not only individual behaviors but also systemic elements like policy support, school leadership, and infrastructure.
Because of these results, specific suggestions need to be made for both public and private schools. Public schools should fix problems with access, make more learning chances available (β2), and improve training (α2). In the meantime, private schools should put an emphasis on making teachers happy (δ2) and helping teachers who are new to their jobs (γ2).
The sensitivity analysis gives us useful information that we can use. To make up for lost learning and make sure everyone has equal access to good math teaching after the pandemic, changes to education should focus on getting students involved, providing teachers with professional development, and helping teachers.
These results show how important it is to use focused teaching methods to stop the drop in math success that happened after the pandemic. Even though both private and public institutions report R0 < 1, the causes that affect each sector are different, so policy responses need to be tailored to each sector.
To improve digital infrastructure in public schools, money needs to be spent on internet access, technology training for teachers, and giving students tablets and computers. Even though it costs a lot at first, the long-term benefits include more fairness, the ability to keep learning online, and the ability to handle future problems.
Project-based tasks, math games, and smaller virtual classes that are more interactive can help make students more interested in learning. When used with current platforms, these methods are cost-effective and lead to lower dropout rates and better learning outcomes, especially in private schools that already have the right infrastructure in place.
Improving teachers’ job satisfaction and health by giving them fair pay, less work, and easy access to mental health tools, especially in public schools, can help keep teachers, make the classroom a better place to learn, and improve performance. This link is made clear by the fact that δ2 is sensitive in both areas.
Increasing access to CPD by working with local schools and NGOs can help fix the problems caused by limited CPD, especially in public organizations. Regular professional development makes teachers better at their jobs, boosts their confidence, and helps them work together better.
In private schools, the lack of experience can be fixed by mentoring programs that pair new teachers with more experienced mentors and offer incentives to stay with the school. This is a cheaper option than hiring and firing people all the time, and it will improve long-term educational performance.
When relief funds are distributed fairly, they should go to public schools that serve low-income communities first. This kind of funding that is based on fairness can help close the achievement gap between school types. This will improve the education system as a whole and help social and economic stability in the long run.
6. Conclusions
In conclusion, this study illuminates the crucial dynamics of mathematics education outcomes during the pandemic from a post-pandemic perspective. The calculated threshold parameter, R0, serves as a compass for understanding the potential for educational success. When R0 exceeds 1, there is hope for success; conversely, when R0 falls below 1, the trajectory leans towards unsuccessful outcomes.
The findings indicate that both private and public schools encountered challenges. Despite minor variations, R0 remained below the critical threshold, suggesting that teachers perceived mathematics education as unsuccessful. This perception was influenced by technological disparities between school types and economic barriers for students, which directly answers Research Questions 1 and 2 and supports the ideas that students in public schools had more problems because they did not have enough tools and resources, while students in private schools had better access to technology.
The global pandemic has precipitated a rapid shift toward online learning, which has affected student engagement and teachers’ job satisfaction—factors linked to Research Question 3.
These results help answer Research Question 4 because they show how mathematical modeling can be used to find and improve the important parts of good online math education. The gap between public and private schools grew when R0 values and base conditions were compared. This answers Research Question 5 and supports the idea that educational inequality will continue and become worse if nothing is done. To change these results and make math education more successful, educational policies need to focus on providing students with reliable internet access, electronic devices, and the creation of interactive online content in Kurdish that is important to their culture. It will also be important to improve teachers’ health by making sure that public and private school teachers get paid the same, lowering their workloads, and providing mental health and flexible teaching support. Results will be even better if professional development is strengthened through local training centers and foreign partnerships, and new teachers are helped through mentoring and structured induction programs. These planned actions will help the education system in Erbil, Duhok, and Sulaymaniyah be stronger, fairer, and better able to adapt to the changing needs of teachers and students during normal times and times of disaster.
Author Contributions
Conceptualization, S.I.G., B.K., A.K. and M.T.; methodology, S.I.G., B.K. and M.T.; validation, B.K. and S.I.G.; formal analysis, S.I.G. and A.K.; investigation, S.I.G.; resources, S.I.G., B.K., A.K. and M.T.; data curation, S.I.G.; writing—original draft preparation, S.I.G., B.K. and M.T.; writing—review and editing, S.I.G., B.K., A.K. and M.T.; visualization, S.I.G. and A.K.; supervision, B.K. and A.K. All authors have read and agreed to the published version of the manuscript.
Funding
This research received no external funding.
Institutional Review Board Statement
The Senate of the Faculty of Arts and Sciences at the Near East University approved DECISION C015 2025/4 of the Commission for Research Ethics; the Commission for Research Ethics at the Near East University and Arts and Sciences Faculty at the Near East University establishes that the research poses no risk to participants and issues a positive opinion regarding the ethical aspects of the research.
Informed Consent Statement
Informed consent was obtained from all subjects involved in the study.
Data Availability Statement
Dataset available on request from the authors.
Conflicts of Interest
The authors declare no conflicts of interest.
References
- Alper, A. Pandemī Sürecīnde K-12 Düzeyīnde Uzaktan Eğītīm: Durum Çalişmasi. Milli Eğitim Derg. 2020, 49, 45–67. [Google Scholar] [CrossRef]
- Middleton, K.V. The longer-term impact of COVID-19 on K–12 student learning and assessment. Educ. Meas. Issues Pract. 2020, 39, 41–44. [Google Scholar] [CrossRef]
- Özdoğan, A.Ç.; Berkant, H.G. Covid-19 pandemi dönemindeki uzaktan eğitime ilişkin paydaş görüşlerinin incelenmesi. Milli Eğitim Derg. 2020, 49, 13–43. [Google Scholar] [CrossRef]
- Andrew, A.; Cattan, S.; Costa Dias, M.; Farquharson, C.; Kraftman, L.; Krutikova, S.; Phimister, A.; Sevilla, A. Inequalities in children’s experiences of home learning during the COVID-19 lockdown in England. Fisc. Stud. 2020, 41, 653–683. [Google Scholar] [CrossRef]
- eLearning Inside. How Does Online Learning Affect Educational Inequality? eLearning Inside. Available online: https://news.elearninginside.com/how-does-online-learning-affect-educational-inequality/#google_vignette (accessed on 3 June 2021).
- Harlen, W.; Qualter, A. The Teaching of Science in Primary Schools; David Fulton Publishers: London, UK, 2004. [Google Scholar]
- Chetty, R.; Friedman, J.; Rockoff, J. Measuring the impacts of teachers II: Teacher value-added and student outcomes in adulthood. Am. Econ. Rev. 2014, 104, 2633–2679. [Google Scholar] [CrossRef]
- Hamre, B.; Pianta, R. Can instructional and emotional support in the first-grade classroom make a difference for children at risk of school failure? Child Dev. 2005, 76, 949–967. [Google Scholar] [CrossRef]
- Slater, H.; Davies, N.; Burgess, S. Do teachers matter? Measuring the variation in teacher effectiveness in England. Oxf. Bull. Econ. Stat. 2012, 74, 629–645. [Google Scholar] [CrossRef]
- Ermeling, B.A.; Gallimore, R. Close-to-practice learning. Educ. Leadersh. 2014, 72, 4. [Google Scholar]
- Sacré, M.; Ries, N.; Wolf, K.; Kunter, M. Teachers’ well-being and their teaching quality during the COVID-19 pandemic: A retrospective study. Front. Educ. 2023, 8, 1136940. [Google Scholar] [CrossRef]
- Lee, J.; Kwon, K.H. Promoting Sustainable Learning inthe Post-Pandemic Era: Focused onthe Role of Motivation, GrowthMindset, Self-Regulated Learning, Well-Being, and Smart DeviceUtilization. Sustainability 2023, 15, 13247. [Google Scholar] [CrossRef]
- Darling-Hammond, L. Strengthening Clinical Preparation: The Holy Grail of Teacher Education. Peabody J. Educ. 2014, 89, 547–561. [Google Scholar] [CrossRef]
- Kaymakamzade, B.; Cumhur, M. The effects of maths anxiety on mathematical modelling. In AIP Conference Proceedings; AIP Publishing: Melville, NY, USA, 2021; Volume 2325. [Google Scholar]
- Gokbulut, N.; Hincal, E.; Besim, H.; Kaymakamzade, B. Reducing the Range of Cancer Risk on BI-RADS 4 Subcategories via Mathematical Modelling. CMES-Comput. Model. Eng. Sci. 2022, 133. [Google Scholar] [CrossRef]
- Bagkur, C.; Guler, E.; Kaymakamzade, B.; Hincal, E.; Suer, K. Near future perspective of ESBL-Producing Klebsiella pneumoniae strains using mathematical modeling. CMES 2022, 130, 111–132. [Google Scholar] [CrossRef]
- Hincal, E.; Alzadjali, A.H. Dynamical Model to Optimize Student’s Academic Performance. CMES-Comput. Model. Eng. Sci. 2022, 132, 393–411. [Google Scholar] [CrossRef]
- Abrahamson, D.; Sánchez-García, R. Learning Is Moving in New Ways: The Ecological Dynamics of Mathematics Education. J. Learn. Sci. 2016, 25, 203–239. [Google Scholar] [CrossRef]
- Büyüköztürk, Ş.; Kılıç-Çakmak, E.; Akgün, Ö.; Karadeniz, Ş.; Demirel, F. Bilimsel Araştırma Yöntemleri, 31st ed.; Pegem Akademi Yayınları: Ankara, Türkiye, 2018. [Google Scholar]
- Kermack, W.O.; McKendrick, A.G. A Contribution to the Mathematical Theory of Epidemics. Proc. R. Soc. A Math. Phys. Eng. Sci. 1927, 115, 700–721. [Google Scholar] [CrossRef]
- Başaran, Y.K. Sosyal Bilimlerde Örnekleme Kurami. J. Acad. Soc. Sci. 2024, 47, 480–495. [Google Scholar]
- Miller, R.L.; Butler, J.M. Outcomes associated with student engagement. Promot. Stud. Engagem. 2011, 1, 18–19. [Google Scholar]
- Dinham, S. Principal leadership for outstanding educational outcomes. J. Educ. Adm. 2005, 43, 338–356. [Google Scholar] [CrossRef]
- Trust, T.; Whalen, J. Emergency remote teaching with technology during the COVID-19 pandemic: Using the whole teacher lens to examine educator’s experiences and insights. Educ. Media Int. 2021, 58, 145–160. [Google Scholar] [CrossRef]
- Ingersoll, R.M.; Strong, M. The impact of induction and mentoring programs for beginning teachers: A critical review of the research. Rev. Educ. Res. 2011, 81, 201–233. [Google Scholar] [CrossRef]
- Kember, D.; Leung, D.Y.P. Development of a questionnaire for assessing students’ perceptions of the teaching and learning environment and its use in quality assurance. Learn. Environ. Res. 2009, 12, 15–29. [Google Scholar] [CrossRef]
- Kahn, J.H. Factor analysis in counseling psychology research, training, and practice: Principles, advances, and applications. Couns. Psychol. 2006, 34, 684–718. [Google Scholar] [CrossRef]
- Büyüköztürk, Ş. Sosyal bilimler için veri analizi el kitabı: İstatistik, araştırma deseni, SPSS uygulamaları ve yorum, 24th ed.; Pegem Akademi: Ankara, Turkey, 2018; pp. 18–19. [Google Scholar] [CrossRef]
- Hutcheson, G.D.; Sofroniou, N. The Multivariate Social Scientist: Introductory Statistics Using Generalized Linear Models; Sage: Thousand Oaks, CA, USA, 1999. [Google Scholar]
- Kaiser, H.F. The application of electronic computers to factor analysis. Educ. Psychol. Meas. 1960, 20, 141–151. [Google Scholar] [CrossRef]
- Kim, J.O.; Mueller, C.W. Factor Analysis: Statistical Methods and Practical Issues; Sage: Beverly Hills, CA, USA, 1978. [Google Scholar]
- Özdamlı, F.; Aydoğan, Ş.K. Validity and reliability of the “Gamification Applications in Education” scale. Folklor/edebiyat 2019, 25, 64–76. [Google Scholar]
- Schreiber, J.B. Issues and recommendations for exploratory factor analysis and principal component analysis. Res. Soc. Adm. Pharm. 2021, 17, 1004–1011. [Google Scholar] [CrossRef]
- Çokluk, Ö.; Şekercioğlu, G.; Büyüköztürk, Ş. Sosyal Bilimler Için Çok Değişkenli Istatistik: SPSS ve LISREL Uygulamaları; Pegem akademi: Ankara, Türkiye, 2012; Volume 2. [Google Scholar]
- Pieters, Z.; Strong, M.; Pitzer, V.E.; Beutels, P.; Bilcke, J. A computationally efficient method for probabilistic parameter threshold analysis for health economic evaluations. Med. Decis. Mak. 2020, 40, 669–679. [Google Scholar] [CrossRef]
- Viamonte, A.J.; Sousa, A.; Roque, L.; Ferreira, M. The Impact of the COVID-19 Pandemic in a Mathematics Subject. In Proceedings of the 2021 4th International Conference of the Portuguese Society for Engineering Education (CISPEE), Lisboa, Portugal, 21–23 June 2021; pp. 1–6. [Google Scholar]
- Wang, M.T.; Holcombe, R. Adolescents’ perceptions of school environment, engagement, and academic achievement in middle school. Am. Educ. Res. J. 2010, 47, 633–662. [Google Scholar] [CrossRef]
- Department for Education. Remote Education Research. Available online: https://www.gov.uk/government/publications/remote-education-research/remote-education-research (accessed on 18 February 2021).
- Mutch-Jones, K.; Hicks, J.; Sorge, B. Elementary science professional development to impact learning across the curriculum. Teach. Teach. Educ. 2022, 112, 103625. [Google Scholar] [CrossRef]
- Scherzinger, M.; Wettstein, A. Classroom disruptions, the teacher–student relationship and classroom management from the perspective of teachers, students and external observers: A multimethod approach. Learn. Environ. Res. 2019, 22, 101–116. [Google Scholar] [CrossRef]
- Thompson, H.W. An Analysis of Teacher Years of Inexperience and Student Discipline Placements in Grades 9–12 at Texas High School Campuses by Student Enrollment Size. Ph.D. Thesis, Sam Houston State University, Huntsville, TX, USA, 2024. [Google Scholar]

Disclaimer/Publisher’s Note: The statements, opinions and data contained in all publications are solely those of the individual author(s) and contributor(s) and not of MDPI and/or the editor(s). MDPI and/or the editor(s) disclaim responsibility for any injury to people or property resulting from any ideas, methods, instructions or products referred to in the content. |
© 2025 by the authors. Licensee MDPI, Basel, Switzerland. This article is an open access article distributed under the terms and conditions of the Creative Commons Attribution (CC BY) license (https://creativecommons.org/licenses/by/4.0/).