
Using Digital Twin Technology to Improve the Organization of the Supply Chain in Piece Type of Production


Abstract
1. Introduction
2. Literature Review
3. Materials and Methods
- Sheet metal for Type_N and Type_B
- Insulation fabric for Type_N and Type_B
- Glue
- Van: with a capacity of 2000 kits or 6 EU pallets of finished products, the van is used for smaller shipments. The average fuel consumption of the van is 11 L of diesel per 100 km and the average transportation cost per trip is €42 (the cost include all expenses incurred during transport, such as fuel, depreciation of the vehicle, drivers’ wages, etc.).
- Lorry: The lorry has a capacity of 6000 kits or 18 EU pallets of finished products. Its average fuel consumption is 18 L of diesel per 100 km and the average transportation cost per trip is €68 (the cost include all expenses incurred during transport, such as fuel, depreciation of the vehicle, drivers’ wages, etc.).
- Lorry with trailer: The lorry with trailer is used for larger shipments and has a capacity of 10,000 kits or 28 EU pallets of finished products. Its average fuel consumption is 29 L of diesel per 100 km and the average transportation cost per trip is €108 (the cost include all expenses incurred during transport, such as fuel, depreciation of the vehicle, drivers’ wages, etc.).
4. Digital Twin for Testing System
4.1. Input Parts Delivery Segment in Digital Twin
4.2. Shipment of Finished Products Segment in Digital Twin
- An algorithm for autonomous tracking of order completion
- An algorithm for the automatic monitoring of unshipped stock quantities
- An algorithm for the autonomous execution of shipments and the loading of transporters
- A trigger mechanism for an embedded control program that checks transporter capacity and shipment quantities
4.2.1. Algorithm for Autonomous Tracking of Order Completion
| Algorithm 1. Part of the algorithm for autonomous tracking of order completion |
| var sto_501, sto_503, sto_504, sto_511 : integer; var sto_502 : string; var sto_505, sto_507, sto_509 : datetime; var sto_506, sto_508, sto_510 : time; … vrsta := str_to_num(.Models.Model.DISP.Label); sto_502 := @.getAttrValue(2); sto_503 := @.getAttrValue(3); sto_504 := .Models.Model.DT_Flow [3,vrsta]; sto_505 := @.getAttrValue(5); sto_506 := @.getAttrValue(6); sto_507 := @.getAttrValue(7); sto_508 := @.getAttrValue(8); sto_509 := @.getAttrValue(9); sto_510 := @.getAttrValue(10); sto_501 := vrsta; .Models.Model.Ship_Seq[1,vrsta] := num_to_str(sto_501); .Models.Model.Ship_Seq[2,vrsta] := sto_502; .Models.Model.Ship_Seq[3,vrsta] := num_to_str(sto_503); .Models.Model.Ship_Seq[4,vrsta] := num_to_str(sto_504); .Models.Model.Ship_Seq[5,vrsta] := datetime_to_str(sto_505); .Models.Model.Ship_Seq[6,vrsta] := time_to_str(sto_506); .Models.Model.Ship_Seq[7,vrsta] := datetime_to_str(sto_507); .Models.Model.Ship_Seq[8,vrsta] := time_to_str(sto_508); .Models.Model.Ship_Seq[9,vrsta] := datetime_to_str(sto_509); .Models.Model.Ship_Seq[10,vrsta] := time_to_str(sto_510); sto_511 := (sto_503 div 400) + 1; .Models.Model.Ship_Seq[11,vrsta] := num_to_str(sto_511); @.setAttrValue(4,sto_504); @.setAttrValue(11,sto_511); .Models.Model.DISP.Label := num_to_str(vrsta + 1); // print of actual state of pieces and palletes in output storage if B_N_G.occupied then ASK_N := B_N_G.numMU; ASP_N := (B_N_G.numMU div 400) + 1; else ASK_N := 0; ASP_N := 0; end; if B_B_G.occupied then ASK_B := B_B_G.numMU; ASP_B := (B_B_G.numMU div 400) + 1; else ASK_B := 0; ASP_B := 0; end; stanje_prej := str_to_num(Deliveries.Label); stanje_aktual := stanje_prej + sto_503 + ASK_N + ASK_B; -- actual state of pieces pal_prej := str_to_num(S_Act_Stat.Label); pal_aktual := pal_prej + sto_511 + ASP_N + ASP_B; -- actual state of pallets Comment2.Text := “Actual_stock in DISP: “ + num_to_str(stanje_aktual); Comment3.Text := “Actual_Num_Pall in DISP: “ + num_to_str(pal_aktual); Deliveries.Label := num_to_str(stanje_aktual); S_Act_Stat.Label := num_to_str(pal_aktual); // end of actual state of pieces and palletes in output storage |
4.2.2. Algorithm for Automatic Stock Tracking of Unshipped Quantities
4.2.3. Algorithm for the Autonomous Execution of Shipments and the Loading of Transporters
4.2.4. Control Function for Verifying Transporter Capacities and the Quantities to Be Shipped
4.3. Validation and Verification
5. Results
- TEST_1: Focuses on the transport of materials and the shipment of finished products using vans only.
- TEST_2: Focuses on the transport of materials and the shipment of finished products using lorries only.
- TEST_3: Focuses on the transportation of materials and shipment of finished products using only lorries with trailer.
- TEST_4: Focuses on transporting materials and shipping finished products using a mix of all three types of transport vehicles (vans, lorries and lorries with trailer).
- Order 1 requires the production of 800 units of Type_N and 800 units of Type_B.
- Order 2 requires the production of 6300 units of Type_N and 6300 units of Type_B.
- Order 3 requires 10,500 units of Type_N and 10,500 units of Type_B.
- Order 4 requires 14,000 units of Type_N and 14,000 units of Type_B.
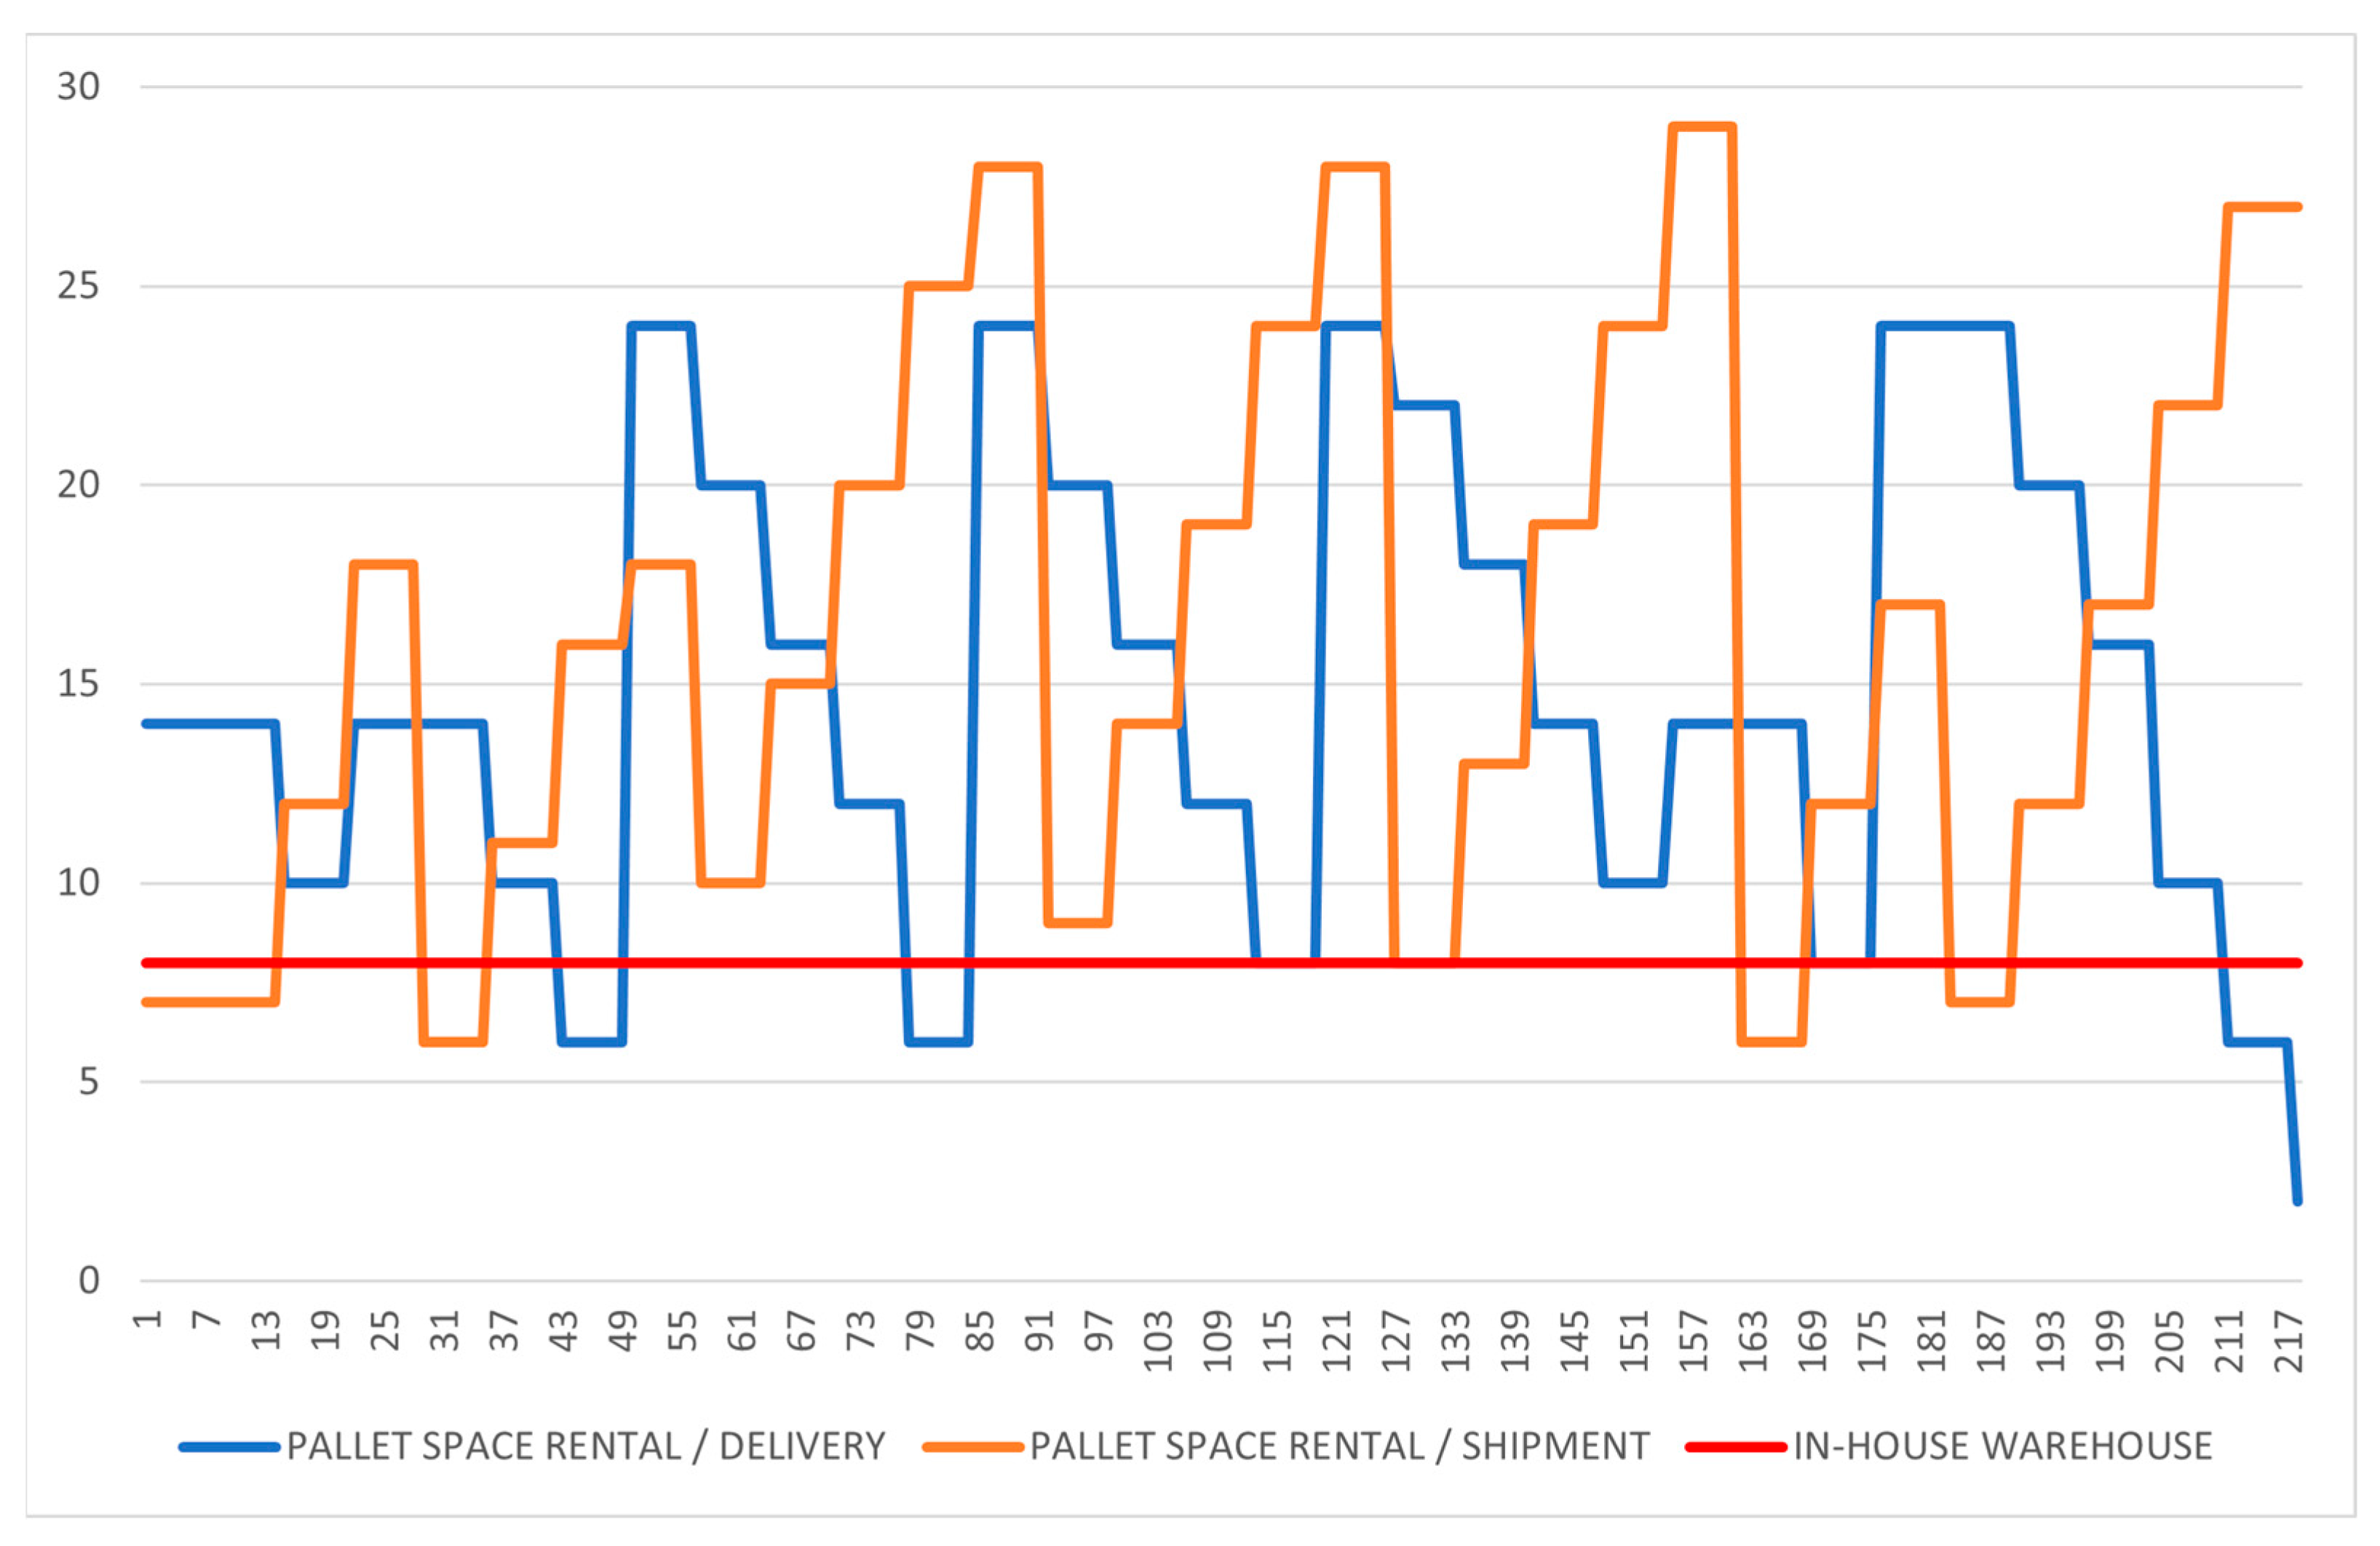
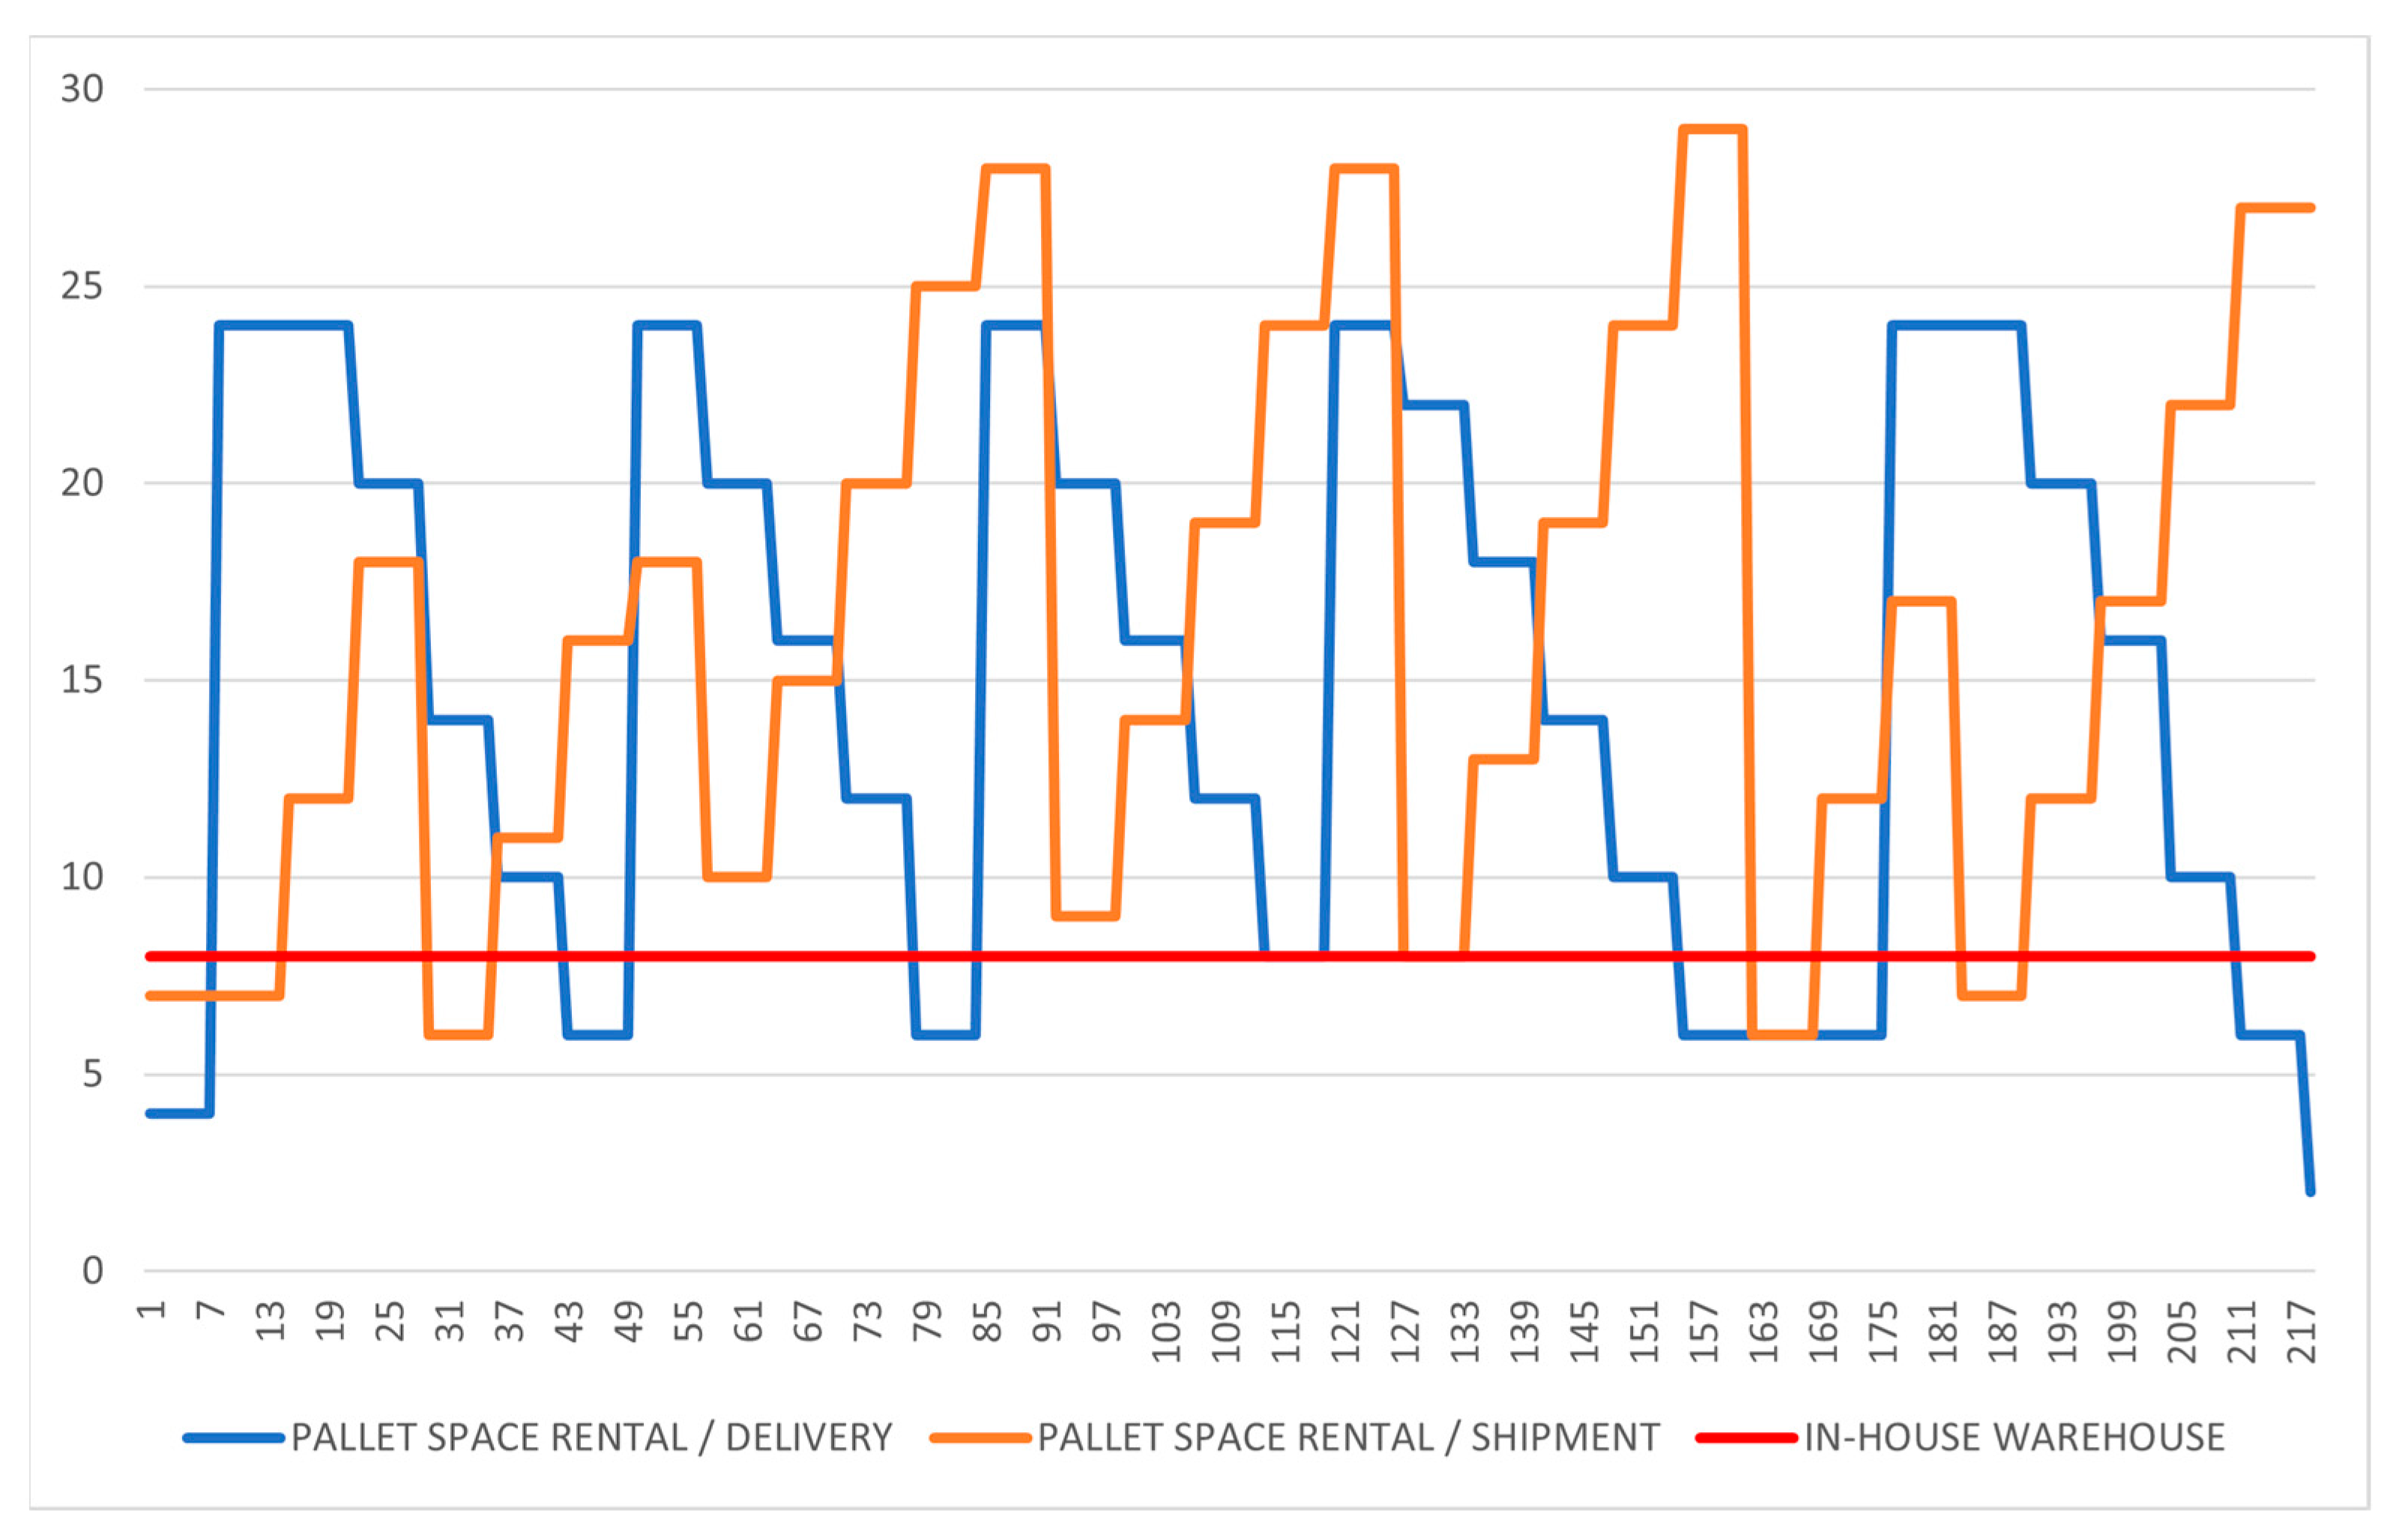
5.1. Analysis of Incoming and Outgoing Logistics and Warehouse Utilization
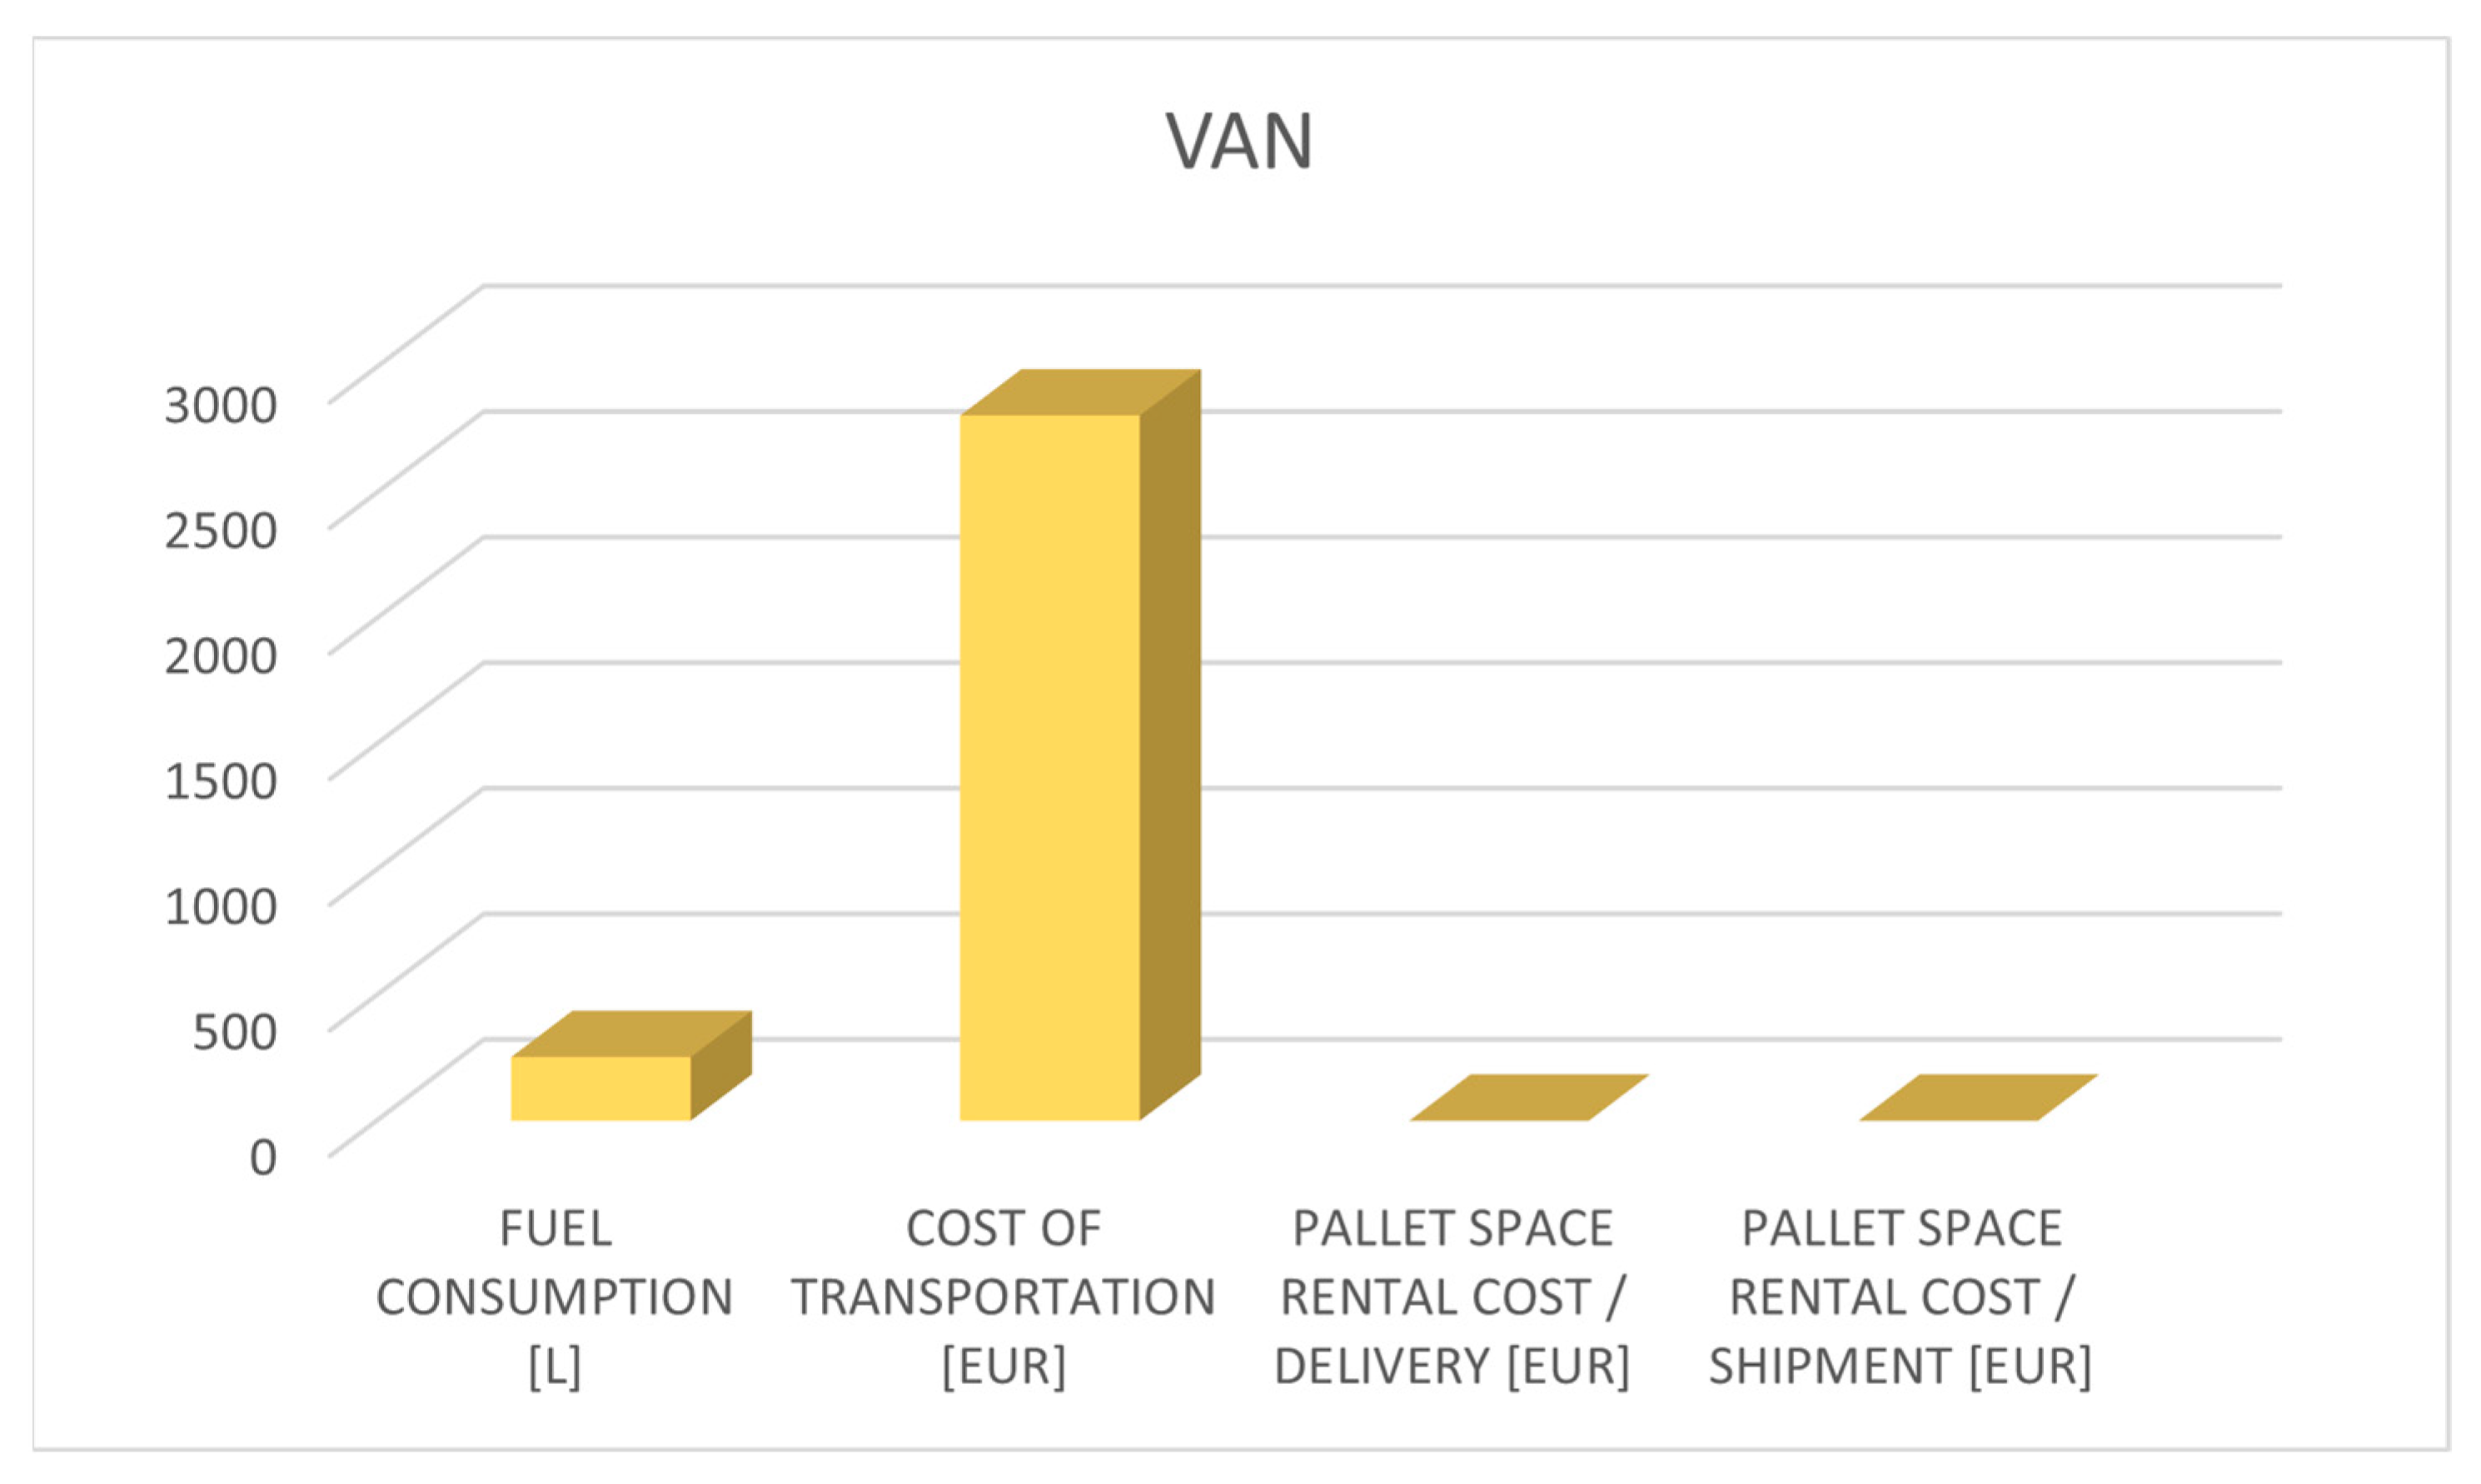
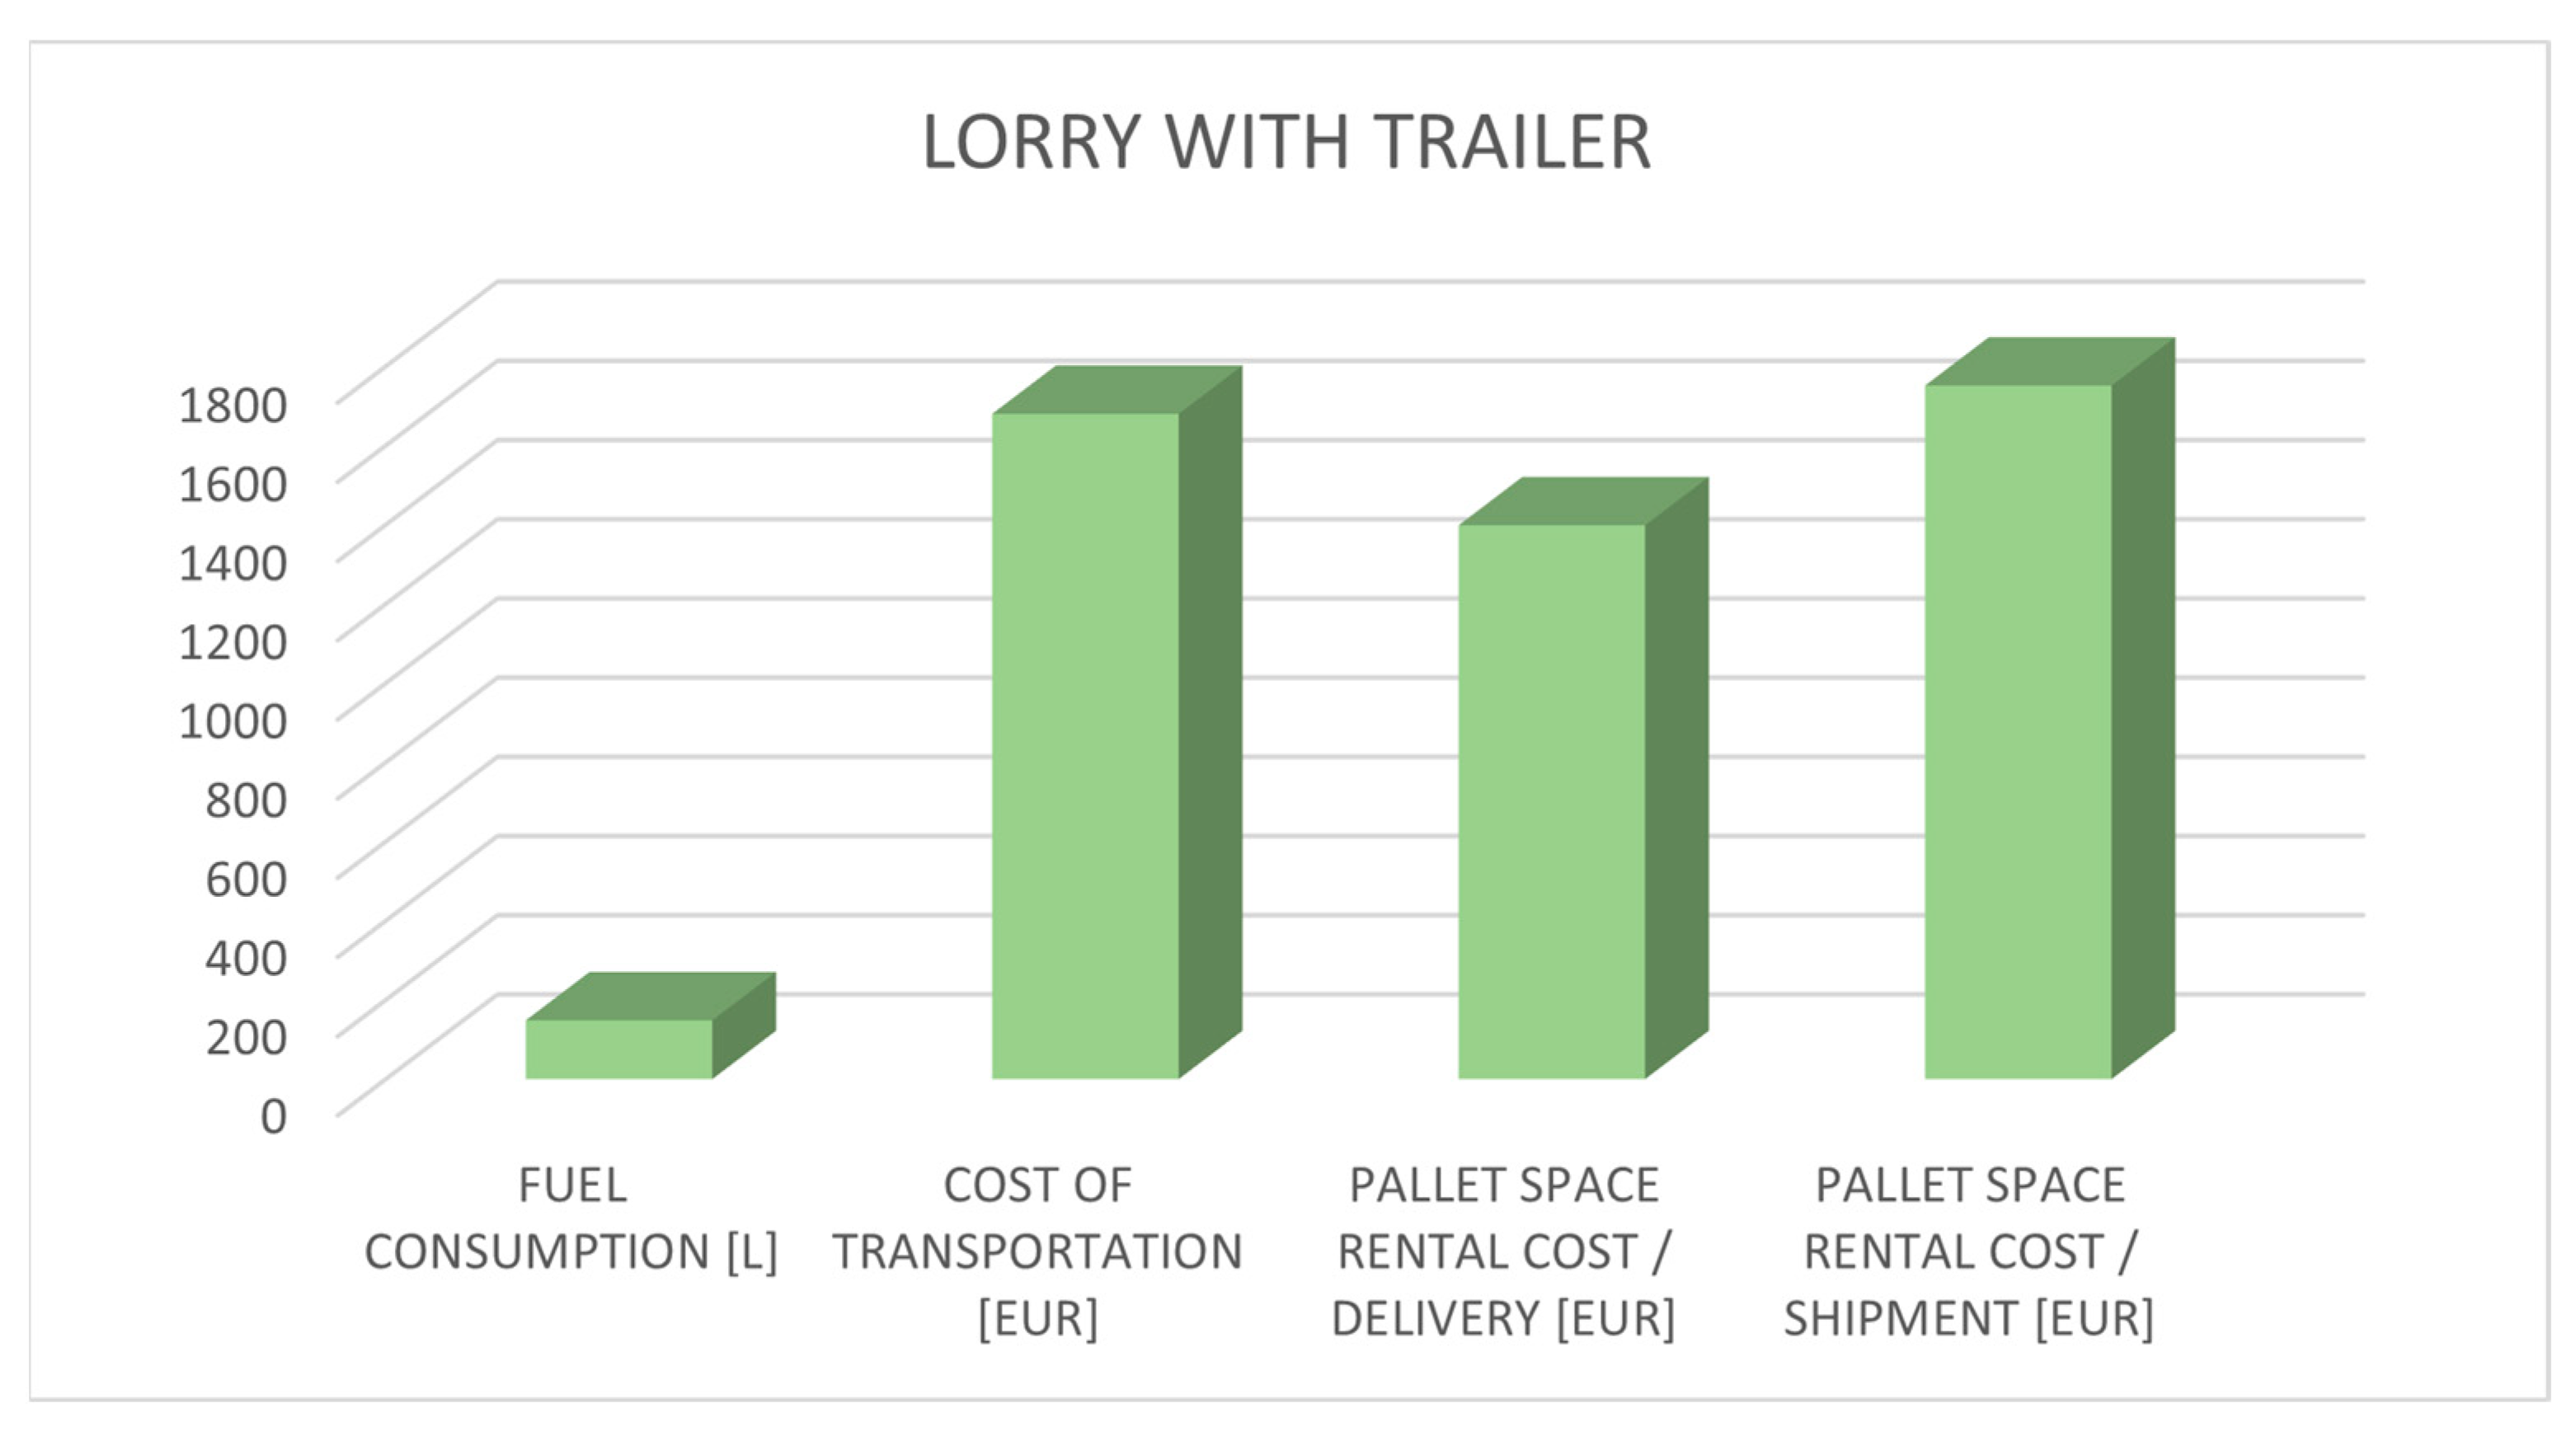
5.2. Cost Analysis of Transportation and Warehousing
6. Discussion
7. Conclusions and Future Work
Author Contributions
Funding
Data Availability Statement
Acknowledgments
Conflicts of Interest
References
- Akpan, I.J.; Offodile, O.F. The role of virtual reality simulation in manufacturing in Industry 4.0. Systems 2024, 12, 26. [Google Scholar] [CrossRef]
- Pandhare, V.; Negri, E.; Ragazzini, L.; Cattaneo, L.; Macchi, M.; Lee, J. Digital twin-enabled robust production scheduling for equipment in degraded state. J. Manuf. Syst. 2024, 74, 841–857. [Google Scholar] [CrossRef]
- Malega, P.; Daneshjo, N. Increasing the production capacity of business processes using Plant simulation. Int. J. Simul. Model. 2024, 23, 41–52. [Google Scholar] [CrossRef]
- Weng, L.L. Dynamic scheduling for manufacturing workshops using Digital Twins, Competitive Particle Swarm Optimization, and Siamese Neural Networks. Adv. Prod. Eng. Manag. 2024, 19, 301–314. [Google Scholar] [CrossRef]
- Marc, I.; Berlec, T. Inventory risk decision-making techniques using customer behaviour analysis. Stroj. Vestn. J. Mech. Eng. 2023, 69, 317–325. [Google Scholar] [CrossRef]
- Debevec, M.; Simic, M.; Jovanovic, V.; Herakovic, N. Virtual factory as a useful tool for improving production processes. J. Manuf. Syst. 2020, 57, 379–389. [Google Scholar] [CrossRef]
- Su, S.; Nassehi, A.; McMlenaghan, A.; Langridge, A.; Hicks, B. A methodology for estimating the cost of a digital twin. J. Manuf. Syst. 2025, 80, 841–858. [Google Scholar] [CrossRef]
- Grieves, M.; Vickers, J. Digital twin: Mitigating unpredictable, undesirable emergent behavior in complex systems. In Transdisciplinary Perspectives on Complex Systems—New Findings and Approaches; Kahlen, F.J., Flumerfelt, S., Alves, A., Eds.; Springer: Berlin/Heidelberg, Germany, 2016; pp. 85–113. [Google Scholar]
- Vrabič, R.; Erkoyuncu, J.A.; Butala, P.; Roy, R. Digital twins: Understanding the added value of integrated models for through-life engineering services. Procedia Manuf. 2018, 16, 139–146. [Google Scholar] [CrossRef]
- Loaiza, J.H.; Cloutier, R.J. Analyzing the implementation of a digital twin manufacturing system: Using a systems thinking approach. Systems 2022, 10, 22. [Google Scholar] [CrossRef]
- Wu, H.; Ji, P.; Ma, H.; Xing, L. A comprehensive review of digital twin from the perspective of total process : Data, models, networks and applications. Sensors 2023, 23, 8306. [Google Scholar] [CrossRef]
- Iliuţă, M.E.; Moisescu, M.A.; Pop, E.; Ionita, A.D.; Caramihai, S.I.; Mitulescu, T.C. Digital Twin—A review of the evolution from concept to technology and its analytical perspectives on applications in various fields. Appl. Sci. 2024, 14, 5454. [Google Scholar] [CrossRef]
- Ojsteršek, R.; Javernik, A.; Buchmeister, B. Optimizing smart manufacturing systems using digital twin. Adv. Prod. Eng. Manag. 2023, 18, 475–485. [Google Scholar] [CrossRef]
- Rosen, R.; Von Wichert, G.; Lo, G.; Bettenhausen, K.D. About the importance of autonomy and digital twins for the future of manufacturing. IFAC-PapersOnLine 2015, 28, 567–572. [Google Scholar] [CrossRef]
- Materials, Structures, Mechanical Systems, and Manufacturing. Available online: https://ntrs.nasa.gov/api/citations/20240002901/downloads/Jan%202011%20RoadMapPresentation.pdf (accessed on 14 January 2025).
- Ma, S.; Ding, W.; Liu, Y.; Zhang, Y.; Ren, S.; Kong, X.; Leng, J. Industry 4.0 and cleaner production: A comprehensive review of sustainable and intelligent manufacturing for energy-intensive manufacturing industries. J. Clean. Prod. 2024, 467, 142879. [Google Scholar] [CrossRef]
- Rojek, I.; Mikołajewski, D.; Dostatni, E. Digital twins in product lifecycle for sustainability in manufacturing and maintenance. Appl. Sci. 2021, 11, 31. [Google Scholar] [CrossRef]
- Mügge, J.; Seegrün, A.; Hoyer, T.K.; Riedelsheimer, T.; Lindow, K. Digital twins within the circular economy: Literature review and concept presentation. Sustainability 2024, 16, 2748. [Google Scholar] [CrossRef]
- Warke, V.; Kumar, S.; Bongale, A.; Kotecha, K. Sustainable development of smart manufacturing driven by the digital twin framework: A statistical analysis. Sustainability 2021, 13, 10139. [Google Scholar] [CrossRef]
- Wang, Y.L.; Song, M.L.; Yang, L.; Chen, J.H.; Li, P. Financing green innovation: A simulation approach for manufacturing enterprises. Int. J. Simul. Model. 2024, 23, 347–358. [Google Scholar] [CrossRef]
- Ojstersek, R.; Javernik, A.; Buchmeister, B. Integrating simulation modelling for sustainable, human-centred Industry 5.0: ESG-based evaluation in collaborative workplaces. Adv. Prod. Eng. Manag. 2024, 19, 527–538. [Google Scholar] [CrossRef]
- Linnéusson, G.; Boldt, S. Towards assessing the economic sustainability of reconfigurable modularization in semi-automatic assembly systems: A system dynamics perspective. Systems 2024, 12, 218. [Google Scholar] [CrossRef]
- Psarommatis, F.; Azamfirei, V. Zero defect manufacturing: A complete guide for advanced and sustainable quality management. J. Manuf. Syst. 2024, 77, 764–779. [Google Scholar] [CrossRef]
- Le, T.T.; Ferraris, A.; Dhar, B.K. The contribution of circular economy practices on the resilience of production systems: Eco-innovation and cleaner production’s mediation role for sustainable development. J. Clean. Prod. 2023, 424, 138806. [Google Scholar] [CrossRef]
- Xu, G.; Zhang, J.; Wang, S. How digitalization and sustainability promote digital green innovation for Industry 5.0 through capability reconfiguration: Strategically oriented insights. Systems 2024, 12, 341. [Google Scholar] [CrossRef]
- Klumpp, M.; Meisel, F.; Thies, C.; Buscher, U. A multi-perspective framework to address manufacturing and transportation challenges in green hydrogen supply chains. Procedia Comput. Sci. 2025, 253, 673–682. [Google Scholar] [CrossRef]
- Dulia, E.F.; Shihab, S.A.M. An integrated supply chain network design for advanced air mobility aircraft manufacturing using stochastic optimization. Supply Chain Anal. 2024, 8, 100083. [Google Scholar] [CrossRef]
- Salehi, N.; Amir, S.; Roci, M.; Shoaib-ul-Hasan, S.; Asif, F.M.A.; Mihelič, A.; Sweet, S.; Rashid, A. Towards circular manufacturing systems implementation: An integrated analysis framework for circular supply chains. Sustain. Prod. Consum. 2024, 51, 169–198. [Google Scholar] [CrossRef]
- Liu, J.; Jiang, P.; Zhang, J. A blockchain-enabled and event-driven tracking framework for SMEs to improve cooperation transparency in manufacturing supply chain. Comput. Ind. Eng. 2024, 191, 110150. [Google Scholar] [CrossRef]
- Cimino, A.; Longo, F.; Nicoletti, L.; Veltri, P. Automated simulation modeling: Ensuring resilience and flexibility in Industry 4.0 manufacturing systems. Procedia Comput. Sci. 2024, 232, 1011–1024. [Google Scholar] [CrossRef]
- Kritzinger, W.; Karner, M.; Traar, G.; Henjes, J.; Sihn, W. Digital Twin in manufacturing: A categorical literature review and classification. IFAC-PapersOnLine 2018, 51, 1016–1022. [Google Scholar] [CrossRef]
- Singh, G.; Singh, S.; Daultani, Y.; Chouhan, M. Measuring the influence of digital twins on the sustainability of manufacturing supply chain: A mediating role of supply chain resilience and performance. Comput. Ind. Eng. 2023, 186, 109711. [Google Scholar] [CrossRef]
- Weinbin, N.; Hongyi, S. The effect of sustainable supply chain management on business performance: Implications for integrating the entire supply chain in the Chinese manufacturing. J. Clean. Prod. 2019, 232, 1176–1186. [Google Scholar] [CrossRef]
- Guo, D.; Mantravadi, S. The role of digital twins in lean supply chain management: Review and research directions. Int. J. Prod. Res. 2025, 63, 1851–1872. [Google Scholar] [CrossRef]
- Bandara, L.V.; Buics, L. Digital Twins in Sustainable Supply Chains: A Comprehensive Review of Current Applications and Enablers for Successful Adoption. Eng. Proc. 2024, 79, 64. [Google Scholar] [CrossRef]
- Hezam, I.M.; Ali, A.M.; Sallam, K.; Hameed, I.A.; Abdel-Basset, M. Digital twin and fuzzy framework for supply chain sustainability risk assessment and management in supplier selection. Sci. Rep. 2024, 14, 17718. [Google Scholar] [CrossRef]
- Roman, E.-A.; Stere, A.-S.; Roșca, E.; Radu, A.-V.; Codroiu, D.; Anamaria, I. State of the Art of Digital Twins in Improving Supply Chain Resilience. Logistics 2025, 9, 22. [Google Scholar] [CrossRef]
- Shen, Y.C.; Xiang, H.C.; Li, J.; Chen, Z.Y. Supply Chain Production Planning and Scheduling Coordination Using Discrete Event Simulation. Int. J. Simul. Model. 2025, 24, 147–158. [Google Scholar] [CrossRef]
- Zaidi, S.A.H.; Khan, S.A.; Chaabane, A. Unlocking the potential of digital twins in supply chains: A systematic review. Supply Chain Anal. 2024, 7, 100075. [Google Scholar] [CrossRef]
- Perez, H.D.; Wassick, J.M.; Grossmann, I.E. A digital twin framework for online optimization of supply chain business processes. Comput. Chem. Eng. 2022, 166, 107972. [Google Scholar] [CrossRef]
- Sethia, S.; Alok, S. Smart Supply Chains : Leveraging AI and Digital Transformation for Route and Distance Optimization. Int. J. Intell. Syst. Appl. Eng. 2024, 12, 1929–1955. [Google Scholar]
- Cimino, A.; Longo, F.; Mirabelli, B.; Solina, V.; Veltri, P. Enhancing internal supply chain management in manufacturing through a simulation-based digital twin platform. Comput. Ind. Eng. 2024, 198, 110670. [Google Scholar] [CrossRef]
- Maheshwari, P.; Kamble, S.; Belhadi, A.; Venkatesh, M.; Abedin, M.Z. Digital twin-driven real-time planning, monitoring, and controlling in food supply chains. Technol. Forecast. Soc. Change 2023, 195, 122799. [Google Scholar] [CrossRef]
- Zhang, J.; Brintrup, A.; Calinescu, A.; Kosasih, E.E.; Sharma, A. Supply Chain Digital Twin Framework Design: An Approach of Supply Chain Operations Reference Model and System of Systems. Available online: https://www.researchgate.net/publication/353354581_Supply_Chain_Digital_Twin_Framework_Design_An_Approach_of_Supply_Chain_Operations_Reference_Model_and_System_of_Systems (accessed on 28 April 2025).
- Ivanov, D.; Dolgui, A. A digital supply chain twin for managing the disruption risks and resilience in the era of Industry 4.0. Prod. Plan. Control 2020, 32, 775–788. [Google Scholar] [CrossRef]
- Wang, L.; Deng, T.; Shen, Z.J.M.; Hu, H.; Qi, Y. Digital twin-driven smart supply chain. Front. Eng. Manag. 2022, 9, 56–70. [Google Scholar] [CrossRef]
- Kamble, S.S.; Gunasekaran, A.; Parekh, H.; Mani, V.; Belhadi, A.; Sharma, R. Digital twin for sustainable manufacturing supply chains: Current trends, future perspectives, and an implementation framework. Technol. Forecast. Soc. Change 2022, 176, 121448. [Google Scholar] [CrossRef]
- Srai, J.S.; Settanni, E.; Tsolakis, N.; Parminder, K.A. Supply Chain Digital Twins: Opportunities and Challenges Beyond the Hype. In Proceedings of the 23rd Cambridge International Manufacturing Symposium, Cambridge, UK, 26–27 September 2019. [Google Scholar]
- Wei, Q.; Liu, Y.; Dong, Y.; Li, T.; Li, W. A digital twin framework for real-time ship routing considering decarbonization regulatory compliance. Ocean Eng. 2023, 278, 114407. [Google Scholar] [CrossRef]
- Kajba, M.; Obrecht, M.; Cvahte Ojsteršek, T. Digital Twins for Sustainability Purposes in Logistics Industry: A Literature Review. Logforum 2023, 19, 611–625. [Google Scholar] [CrossRef]
- Kajba, M.; Jereb, B.; Cvahte Ojsteršek, T. Exploring Digital Twins in the Transport and Energy Fields: A Bibliometrics and Literature Review Approach. Energies 2023, 16, 3922. [Google Scholar] [CrossRef]
- Royo, B.; Politaki, D.; Gonzalez, J.N.; Batalla, A. Digital Twin opportunities and benefits in last-mile logistics for Madrid value case. Transp. Res. Procedia 2023, 72, 1693–1699. [Google Scholar] [CrossRef]
- Schneider, M.; Hinde, C.; West, A. Digital twin concept in last mile delivery and passenger transport—A systematic literature review. Enterp. Interoperability X 2024, 11, 135–145. [Google Scholar]
- Xu, L.; Mak, S.; Schoepf, S.; Ostroumov, M.; Brintrup, A. Multi-agent digital twinning for collaborative logistics: Framework and implementation. J. Ind. Inf. Integr. 2025, 45, 100799. [Google Scholar] [CrossRef]
- Vijayalakshmi, N.; Roopa, Y.M.; Ashreetha, B.; Ramesh, J.V.N.; Rao, E.G.; Sundararajan, P.N. Development of Digital Twin with External Data Resources in Manufacturing with Complex Algorithms. SN Comput. Sci. 2023, 4, 611. [Google Scholar] [CrossRef]
- Savolainen, J.; Urbani, M. Maintenance optimization for a multi-unit system with digital twin simulation: Example from the mining industry. J. Intell. Manuf. 2021, 32, 1953–1973. [Google Scholar] [CrossRef]
- Fink, C.; Bodin, U.; Schelen, O. Why decision support systems are needed for addressing the theory-practice gap in assembly line balancing. J. Manuf. Syst. 2025, 79, 515–527. [Google Scholar] [CrossRef]
- Resman, M.; Protner, J.; Simic, M.; Herakovič, N. A Five-Step Approach to Planning Data-Driven Digital Twins for Discrete Manufacturing Systems. Appl. Sci. 2021, 11, 3639. [Google Scholar] [CrossRef]
- Resman, M. Methodology for Design and Planning of Smart Factories Based on Digital Models. Ph.D. Thesis, University of Ljubljana, Ljubljana, Slovenia, 2022. [Google Scholar]
- Resman, M.; Herakovič, N.; Debevec, M. Integrating Digital Twin Technology to Achieve Higher Operational Effi ciency and Sustainability in Manufacturing Systems. Systems 2025, 13, 180. [Google Scholar] [CrossRef]
- Bangsow, S. Tecnomatix Plant Simulation—Modeling and Programming by Means of Examples, 2nd ed.; Springer: Berlin/Heidelberg, Germany, 2020. [Google Scholar]


| Icon in Figure 3 | Description |
|---|---|
 | table type objects: DT_Flow: the table with the schedule Ship_Seq: the table with the expected shipping schedule S_Shipm_Seq: the table with the transportation plan Ship_Ord: the table with the data on executed shipments |
 | EventController is the object for controlling the simulation process |
   | process type objects: SheetAssembly (sub-frame): object represent a group of operations Station-type objects represent working processes or objects for decision making Buffer-type objects represent logical element of working process for intermediate storage |
 | ShiftCalendar type object is used to manage the working calendar and shifts |
 | Method type object contains programs for performing logical actions |
 | Method type object named Reset delete all movable units in the model and prepare output tables for simulation run |
 | Method type object Init sets all necessary initial parameters in the model |
 | Chart type objects are used to display the efficiency of a manufacturing unit |
 | Interface objects are used for logical connections between objects from the main frame and the subframe. The entire SheetAssembly process is modelled in subframe. |
| The remaining objects are required to represent all the features of a real production system in the model |
| Delivery Time | MU | Number | ID_Order | |
|---|---|---|---|---|
| 1 | 5:30:00.0000 | .UserObjects.Type_N | 866 | N202503_0101 |
| 2 | 5:30:01.0000 | .UserObjects.Type_B | 864 | B202503_0102 |
| 3 | 3:05:30:00.0000 | .UserObjects.Type_B | 967 | B202503_0201 |
| 4 | 3:05:30:01.0000 | .UserObjects.Type_N | 974 | N202503_0202 |
| 5 | 10:05:30:00.0000 | .UserObjects.Type_N | 6000 | N202503_0203 |
| … | … | … | … | … |
| Seq_n | ID_Order | N_Good | N_All | Start_Pr | Start_Pr_Rel | Finish_Pr | Finish_Pr_Rel | Duration_Pr_Rel | No_Of_Pall | Ship_Time | Ship_Time_Rel |
|---|---|---|---|---|---|---|---|---|---|---|---|
| 1 | N202503_0101 | 802 | 866 | 3 March 2025 06:00:00.0000 | 5:59:59.0000 | 4 March 2025 10:35:06.5012 | 1:10:35:05.5012 | 1:04:35:06.5012 | 3 | 7 March 2025 05:40:01.0000 | 4:05:40:00.0000 |
| 2 | B202503_0102 | 801 | 864 | 4 March 2025 10:34:03.8482 | 1:10:34:02.8482 | 6 March 2025 10:29:12.6428 | 3:10:29:11.6428 | 1:23:55:08.7946 | 3 | 7 March 2025 05:40:01.0000 | 4:05:40:00.0000 |
| 3 | B202503_0201 | 895 | 967 | 6 March 2025 10:28:03.2907 | 3:10:28:02.2907 | 11 March 2025 06:54:44.2916 | 8:06:54:43.2916 | 4:20:26:41.0009 | 3 | 14 March 2025 05:40:01.0000 | 11:05:40:00.0000 |
| 4 | N202503_0202 | 902 | 974 | 11 March 2025 06:53:42.7257 | 8:06:53:41.7257 | 13 March 2025 07:46:44.8440 | 10:07:46:43.8440 | 2:00:53:02.1183 | 3 | 14 March 2025 05:40:01.0000 | 11:05:40:00.0000 |
| 5 | N202503_0203 | 5557 | 6000 | 13 March 2025 07:45:11.6516 | 10:07:45:10.6516 | 2 April 2025 06:22:36.6155 | 30:06:22:35.6155 | 19:22:37:24.9639 | 14 | 22 April 2025 05:40:01.0000 | 50:05:40:00.0000 |
| 6 | B202503_0204 | 5558 | 6000 | 2 April 2025 06:21:15.1634 | 30:06:21:14.1634 | 21 April 2025 09:19:54.0805 | 49:09:19:53.0805 | 19:02:58:38.9171 | 14 | 22 April 2025 05:40:01.0000 | 50:05:40:00.0000 |
| 7 | B202503_0301 | 10,504 | 11,340 | 21 April 2025 09:18:23.3504 | 49:09:18:22.3504 | 27 May 2025 08:05:14.9252 | 85:08:05:13.9252 | 35:22:46:51.5748 | 27 | 28 May 2025 05:40:01.0000 | 86:05:40:00.0000 |
| 8 | N202503_0302 | 10,503 | 11,340 | 27 May 2025 08:03:54.8970 | 85:08:03:53.8970 | 2 July 2025 07:17:56.6591 | 121:07:17:55.6591 | 35:23:14:01.7621 | 27 | 3 July 2025 05:40:01.0000 | 122:05:40:00.0000 |
| 9 | N202503_0401 | 11,115 | 12,000 | 2 July 2025 07:16:38.4819 | 121:07:16:37.4819 | 8 August 2025 08:43:12.8392 | 158:08:43:11.8392 | 37:01:26:34.3573 | 28 | 9 August 2025 05:40:01.0000 | 159:05:40:00.0000 |
| 10 | N202503_0402 | 2890 | 3120 | 8 August 2025 08:41:36.7969 | 158:08:41:35.7969 | 19 August 2025 09:04:05.1601 | 169:09:04:04.1601 | 11:00:22:28.3632 | 8 | 20 August 2025 05:40:01.0000 | 170:05:40:00.0000 |
| 11 | B202503_0403 | 2890 | 3120 | 19 August 2025 09:02:40.9537 | 169:09:02:39.9537 | 28 August 2025 09:22:50.1726 | 178:09:22:49.1726 | 9:00:20:09.2189 | 8 | 29 August 2025 05:40:01.0000 | 179:05:40:00.0000 |
| … | … | … | … | … | … | … | … | … | … | … |
| Order ID | Quantity of Good Products | Type_N Components | Type_B Components | Delivery Time [DD:HH:SS] | Type of Vehicle for Delivery | Shipping Time [DD:HH:SS] | Type of Vehicle for Shipping |
|---|---|---|---|---|---|---|---|
| 202503_01 | 800 Type N 800 Type B | 866 | 864 | 00:05:30:00 | Van | 4:05:40:00.00 | Van |
| 202503_02 | 6300 Type N 6300 Type B | 2000 | 0 | 03:05:30:00 | Van | 11:05:40:00.0000 | Van |
| 2000 | 0 | 10:05:30:00 | Van | 18:05:40:00.0000 | Van | ||
| 2000 | 0 | 17:05:30:00 | Van | 24:05:40:00.0000 | Van | ||
| 967 | 974 | 23:05:30:00 | Van | 31:05:40:00.0000 | Van | ||
| 0 | 2000 | 30:05:30:00 | Van | 37:05:40:00.0000 | Van | ||
| 0 | 2000 | 36:05:30:00 | Van | 44:05:40:00.0000 | Van | ||
| 0 | 2000 | 43:05:30:00 | Van | 50:05:40:00.0000 | Van | ||
| 202503_03 | 10,500 Type N 10,500 Type B | 0 | 2000 | 49:05:30:00 | Van | 57:05:40:00.0000 | Van |
| 0 | 2000 | 56:05:30:00 | Van | 61:05:40:00.0000 | Van | ||
| 0 | 2000 | 60:05:30:00 | Van | 68:05: 40:00.0000 | Van | ||
| 0 | 2000 | 67:05:30:00 | Van | 74:05: 40:00.0000 | Van | ||
| 0 | 2000 | 73:05:30:00 | Van | 81:05: 40:00.0000 | Van | ||
| 0 | 1340 | 80:05:30:00 | Van | 86:05: 40:00.0000 | Van | ||
| 2000 | 0 | 85:05:30:00 | Van | 92:05: 40:00.0000 | Van | ||
| 2000 | 0 | 91:05:30:00 | Van | 99:05: 40:00.0000 | Van | ||
| 2000 | 0 | 98:05:30:00 | Van | 106:05:40:00.0000 | Van | ||
| 2000 | 0 | 105:05:30:00 | Van | 110:05:40:00.0000 | Van | ||
| 2000 | 0 | 109:05:30:00 | Van | 117:05:40:00.0000 | Van | ||
| 1340 | 0 | 116:05:30:00 | Van | 122:05:40:00.0000 | Van | ||
| 202503_04 | 14,000 Type N 14,000 Type B | 2000 | 0 | 121:05:30:00 | Van | 128:05:40:00.0000 | Van |
| 2000 | 0 | 127:05:30:00 | Van | 135:05:40:00.0000 | Van | ||
| 2000 | 0 | 134:05:30:00 | Van | 141:05:40:00.0000 | Van | ||
| 2000 | 0 | 140:05:30:00 | Van | 148:05:40:00.0000 | Van | ||
| 2000 | 0 | 147:05:30:00 | Van | 152:05:40:00.0000 | Van | ||
| 2000 | 0 | 151:05:30:00 | Van | 159:05:40:00.0000 | Van | ||
| 2000 | 0 | 158:05:30:00 | Van | 166:05:40:00.0000 | Van | ||
| 1120 | 0 | 165:05:30:00 | Van | 170:05:40:00.0000 | Van | ||
| 0 | 2000 | 169:05:30:00 | Van | 177:05:40:00.0000 | Van | ||
| 0 | 2000 | 176:05:30:00 | Van | 183:05:40:00.0000 | Van | ||
| 0 | 2000 | 182:05:30:00 | Van | 190:05:40:00.0000 | Van | ||
| 0 | 2000 | 189:05:30:00 | Van | 194:05:40:00.0000 | Van | ||
| 0 | 2000 | 193:05:30:00 | Van | 201:05:40:00.0000 | Van | ||
| 0 | 2000 | 200:05:30:00 | Van | 207:05:40:00.0000 | Van | ||
| 0 | 2000 | 206:05:30:00 | Van | 214:05:40:00.0000 | Van | ||
| 0 | 1120 | 213:05:30:00 | Van | 218:05:40:00.0000 | Van |
| Order ID | Quantity of Good Products | Type_N Components | Type_B Components | Delivery Time [DD:HH:SS] | Type of Vehicle for Delivery | Shipping Time [DD:HH:SS] | Type of Vehicle for Shipping |
|---|---|---|---|---|---|---|---|
| 202503_01 | 800 Type N 800 Type B | 866 | 864 | 00:05:30:00 | Lor | 04:05:40:00 | Lor |
| 202503_02 | 6300 Type N 6300 Type B | 6000 | 0 | 03:05:30:00 | Lor | 24:05:40:00 | Lor |
| 967 | 974 | 23:05:30:00 | Lor | 31:05:40:00 | Lor | ||
| 0 | 6000 | 30:05:30:00 | Lor | 50:05:40:00 | Lor | ||
| 202503_03 | 10,500 Type N 10,500 Type B | 0 | 6000 | 49:05:30:00 | Lor | 68:05:40:00 | Lor |
| 0 | 5340 | 67:05:30:00 | Lor | 86:05:40:00 | Lor | ||
| 6000 | 0 | 85:05:30:00 | Lor | 106:05:40:00 | Lor | ||
| 5340 | 0 | 105:05:30:00 | Lor | 122:05:40:00 | Lor | ||
| 202503_04 | 14,000 Type N 14,000 Type B | 6000 | 0 | 121:05:30:00 | Lor | 141:05:40:00 | Lor |
| 6000 | 0 | 140:05:30:00 | Lor | 159:05:40:00 | Lor | ||
| 3120 | 0 | 158:05:30:00 | Lor | 170:05:40:00 | Lor | ||
| 0 | 3120 | 169:05:30:00 | Lor | 179:05:40:00 | Lor | ||
| 0 | 6000 | 178:05:30:00 | Lor | 199:05:40:00 | Lor | ||
| 0 | 6000 | 198:05:30:00 | Lor | 218:05:40:00 | Lor |
| Order ID | Quantity of Good Products | Type_N Components | Type_B Components | Delivery Time [DD:HH:SS] | Type of Vehicle for Delivery | Shipping Time [DD:HH:SS] | Type of Vehicle for Shipping |
|---|---|---|---|---|---|---|---|
| 202503_01 | 800 Type N 800 Type B | 866 | 864 | 00:05:30:00 | Lor_T | 04:05:40:00 | Lor_T |
| 202503_02 | 6300 Type N 6300 Type B | 6967 | 0 | 03:05:30:00 | Lor_T | 26:05:40:00 | Lor_T |
| 0 | 6974 | 25:05:30:00 | Lor_T | 50:05:40:00 | Lor_T | ||
| 202503_03 | 10,500 Type N 10,500 Type B | 0 | 11,340 | 49:05:30:00 | Lor_T | 86:05:40:00 | Lor_T |
| 11,340 | 0 | 85:05:30:00 | Lor_T | 122:05:40:00 | Lor_T | ||
| 202503_04 | 14,000 Type N 14,000 Type B | 12,000 | 0 | 121:05:30:00 | Lor_T | 159:05:40:00 | Lor_T |
| 3120 | 3120 | 158:05:30:00 | Lor_T | 179:05:40:00 | Lor_T | ||
| 0 | 12,000 | 158:05:30:01 | Lor_T | 218:05:40:00 | Lor_T |
| Order ID | Quantity of Good Products | Type_N Components | Type_B Components | Delivery Time [DD:HH:SS] | Type of Vehicle for Delivery | Shipping Time [DD:HH:SS] | Type of Vehicle for Shipping |
|---|---|---|---|---|---|---|---|
| 202503_01 | 800 Type N 800 Type B | 866 | 864 | 00:05:30:00 | Van | 04:05:40:00 | Van |
| 202503_02 | 6300 Type N 6300 Type B | 967 | 974 | 03:05:30:00 | Van | 11:05:40:00 | Lor_T |
| 6000 | 6000 | 10:05:30:00 | Lor_T | 50:05:40:00 | Lor_T | ||
| 202503_03 | 10,500 Type N 10,500 Type B | 0 | 11,340 | 49:05:30:00 | Lor_T | 86:05:40:00 | Lor_T |
| 11,340 | 0 | 85:05:30:00 | Lor_T | 122:05:40:00 | Lor_T | ||
| 202503_04 | 14,000 Type N 14,000 Type B | 12,000 | 0 | 121:05:30:00 | Lor_T | 159:05:40:00 | Lor_T |
| 3120 | 0 | 158:05:30:00 | Lor | 170:05:40:00 | Lor_T | ||
| 0 | 3120 | 169:05:30:00 | Lor | 179:05:40:00 | Lor | ||
| 0 | 12,000 | 178:05:30:00 | Lor_T | 218:05:40:00 | Lor_T |
| TEST_1 | TEST_2 | TEST_3 | TEST_4 | |
|---|---|---|---|---|
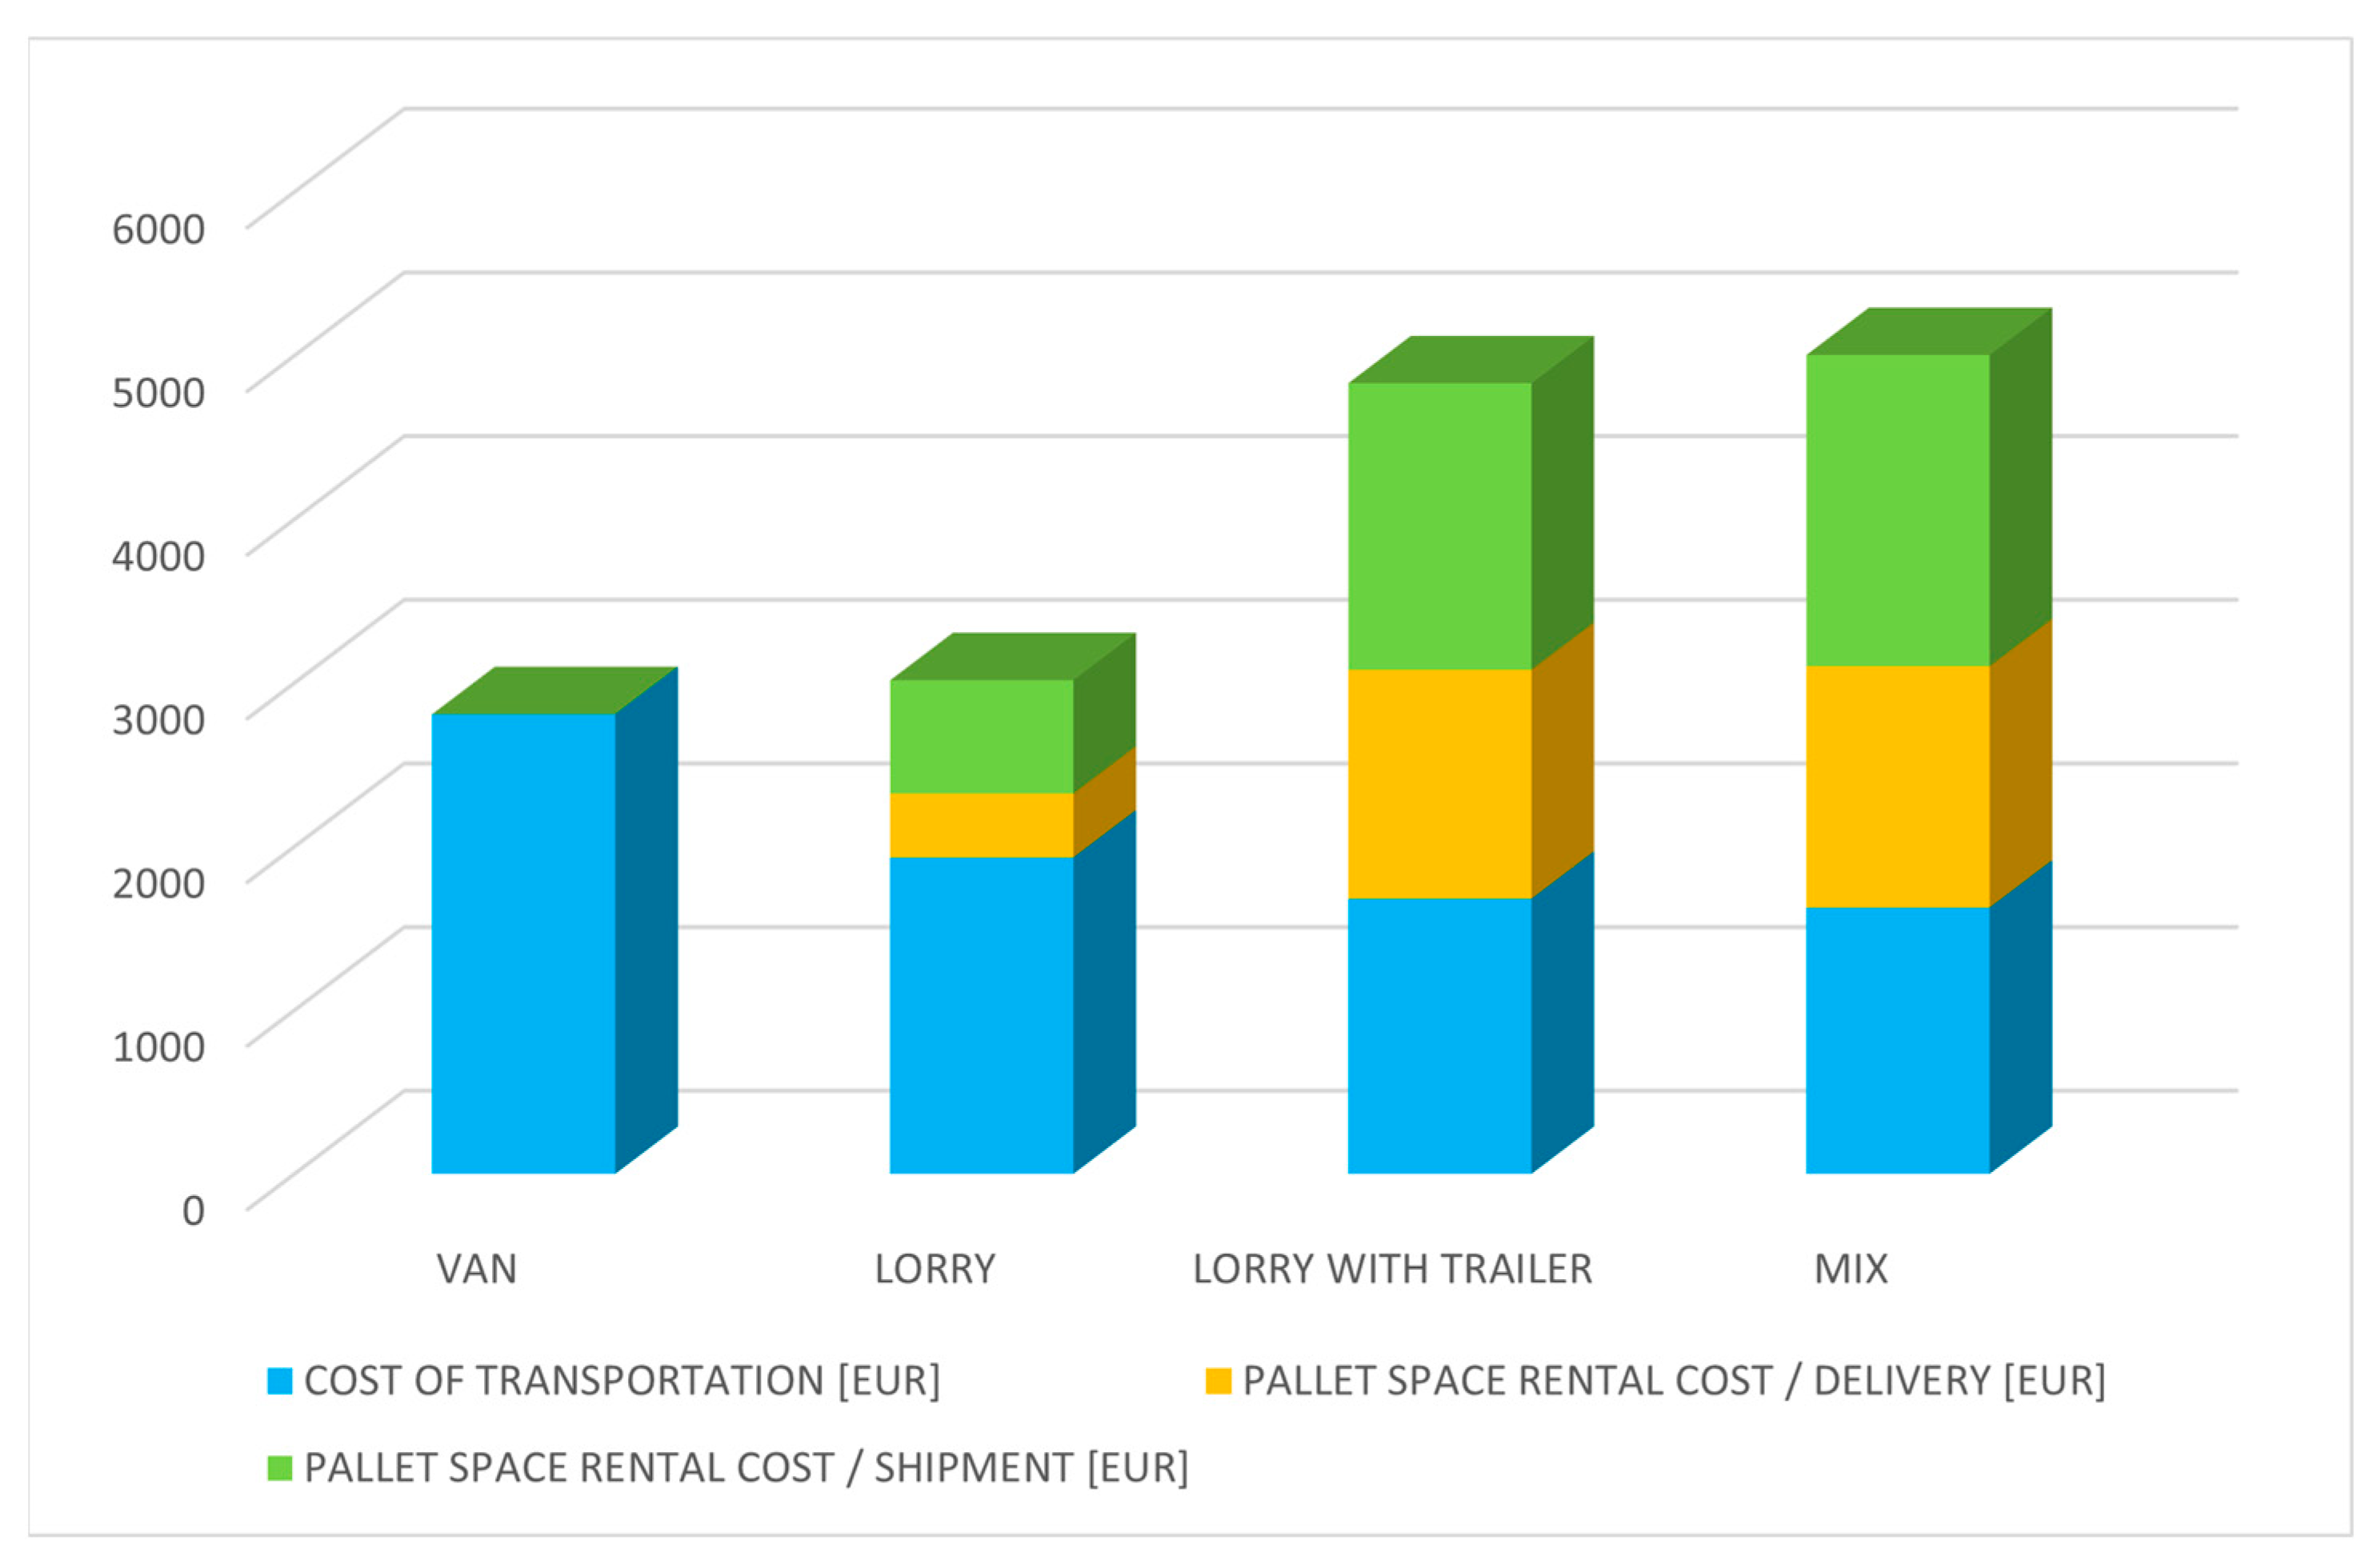
| Cost of transportation [EUR] | 2808 | 1932 | 1680 | 1626 |
| Pallet space rental cost/delivery [EUR] | 0 | 390.6 | 1398.6 | 1474.2 |
| Pallet space rental cost/shipment [EUR] | 0 | 693 | 1751.4 | 1902.6 |
| Overall costs [EUR] | 2808 | 3015.6 | 4830 | 5002.8 |
| Reduction of transportation costs [/] | 1.73 | 1.19 | 1.03 | 1 |
| Reduction of overall costs [/] | 0.56 | 0.60 | 0.97 | 1 |
| Overall fuel consumption [L] | 253.44 | 161.28 | 148.8 | 139.2 |
| Overall fuel consumption efficiency [/] | 1.82 | 1.16 | 1.07 | 1 |
Disclaimer/Publisher’s Note: The statements, opinions and data contained in all publications are solely those of the individual author(s) and contributor(s) and not of MDPI and/or the editor(s). MDPI and/or the editor(s) disclaim responsibility for any injury to people or property resulting from any ideas, methods, instructions or products referred to in the content. |
© 2025 by the authors. Licensee MDPI, Basel, Switzerland. This article is an open access article distributed under the terms and conditions of the Creative Commons Attribution (CC BY) license (https://creativecommons.org/licenses/by/4.0/).
Share and Cite
Resman, M.; Debevec, M.; Herakovič, N. Using Digital Twin Technology to Improve the Organization of the Supply Chain in Piece Type of Production. Systems 2025, 13, 505. https://doi.org/10.3390/systems13070505
Resman M, Debevec M, Herakovič N. Using Digital Twin Technology to Improve the Organization of the Supply Chain in Piece Type of Production. Systems. 2025; 13(7):505. https://doi.org/10.3390/systems13070505
Chicago/Turabian StyleResman, Matevž, Mihael Debevec, and Niko Herakovič. 2025. "Using Digital Twin Technology to Improve the Organization of the Supply Chain in Piece Type of Production" Systems 13, no. 7: 505. https://doi.org/10.3390/systems13070505
APA StyleResman, M., Debevec, M., & Herakovič, N. (2025). Using Digital Twin Technology to Improve the Organization of the Supply Chain in Piece Type of Production. Systems, 13(7), 505. https://doi.org/10.3390/systems13070505