
Forecasting Demand for Emergency Material Classification Based on Casualty Population

Abstract
1. Introduction
2. Literature Review
3. Prediction of Emergency Material Demand
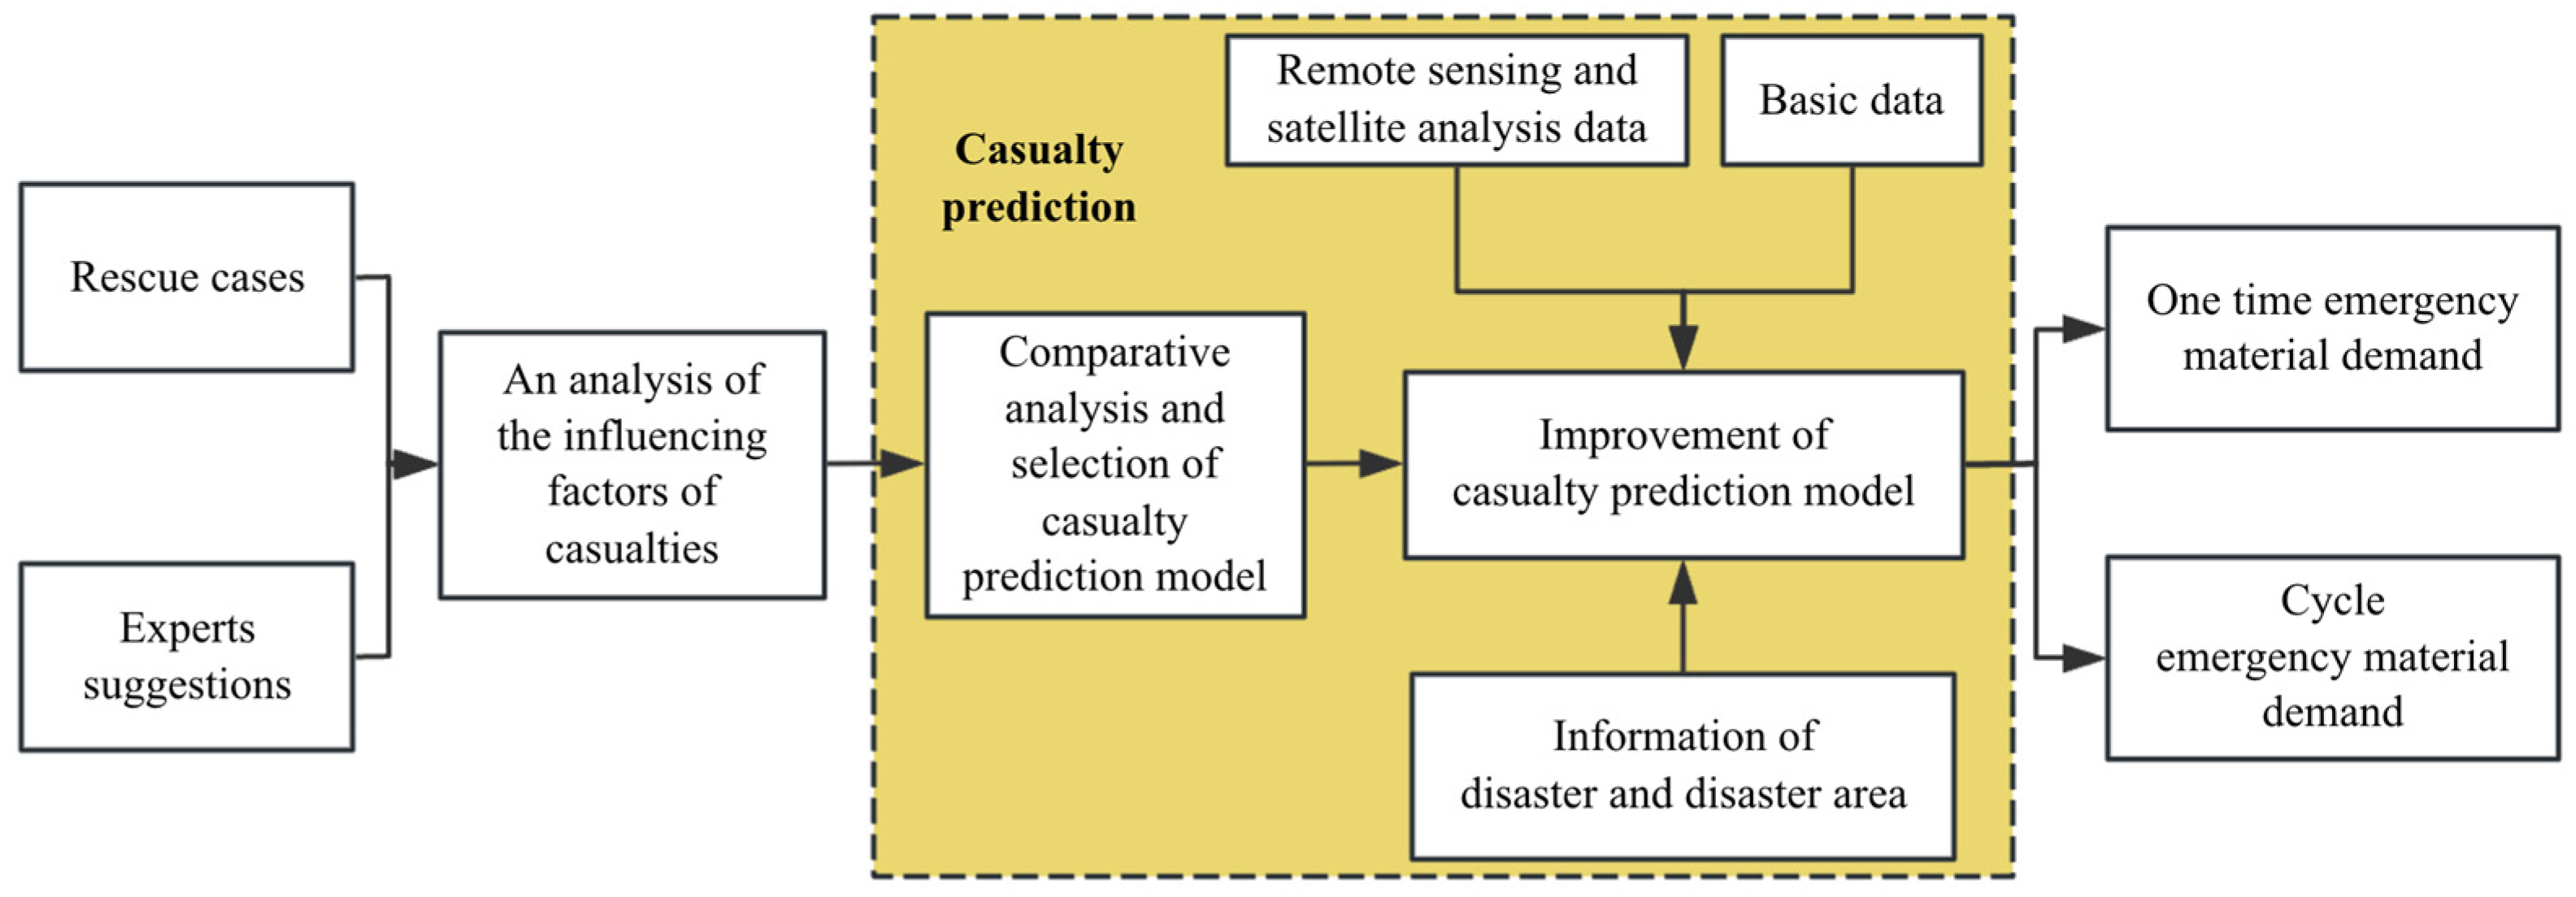
4. Casualty Forecast
4.1. Analysis of the Influencing Factors of Casualties
- (1)
- Disaster source
- (2)
- Disaster-bearing body
- (3)
- Prevention and reduction measures
4.2. Selection of the Casualty Prediction Model
- (1)
- Comparative analysis of methods for predicting casualties
- (2)
- Selection of nonlinear regression model
4.3. Improvement of Casualty Prediction Model
5. Construction of a Classified Demand Forecasting Model for Emergency Materials Based on Casualties
5.1. Analysis of the Influencing Factors of Emergency Material Demand Forecast
- (1)
- Number of casualties
- (2)
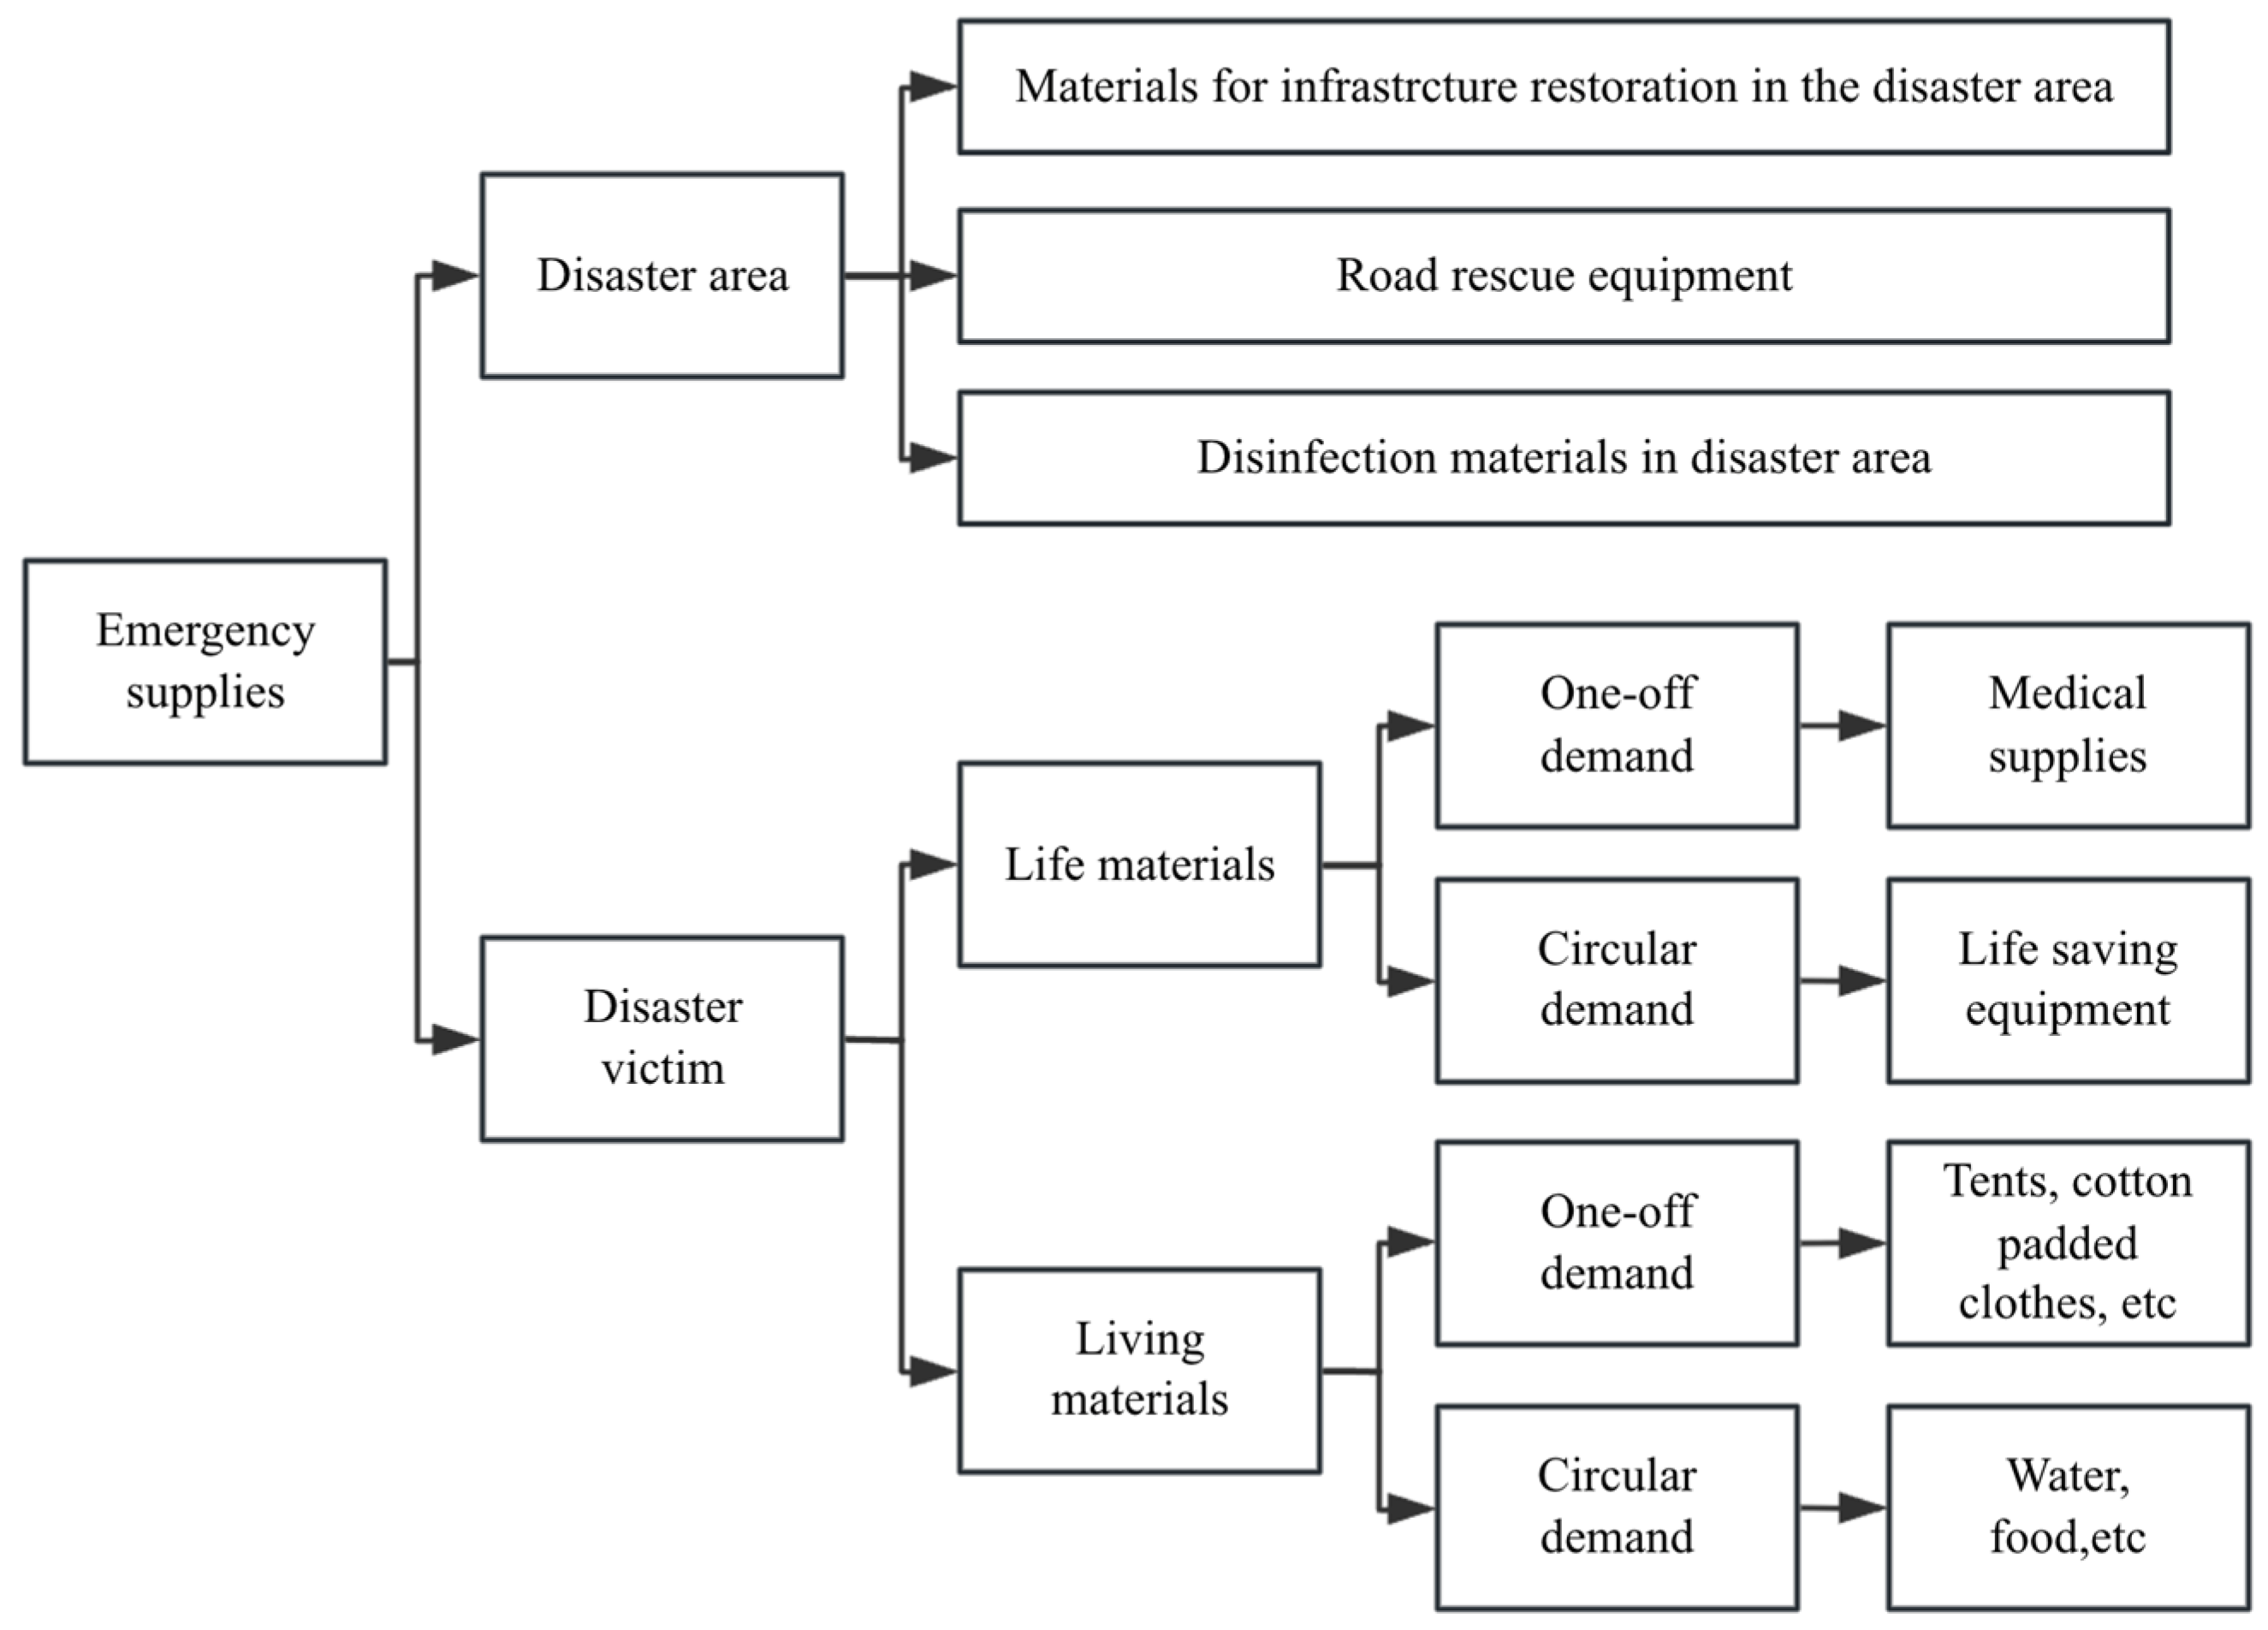
- Classification of emergency materials
- (3)
- Seasonal demand
- (4)
- Regional disparity
5.2. Forecast Model of Classified Demand for Emergency Materials
- (1)
- Life-saving supplies demand
- refers to the demand for the k-th material at the j-th disaster site;
- refers to the unit demand for primary life-saving supplies for a single injured population;
- refers to the seasonal coefficient of the emergency supplies;
- refers to the regional coefficient of the emergency supplies; and
- SS refers to the number of injured in the disaster area.
- (2)
- Daily necessities demand
- refers to the unit demand for primary daily necessities of a single living population;
- ZS is the total number of people in the disaster area; and
- SW is the number of deaths in the disaster area.
- refers to the unit demand for primary life-saving supplies for a single injured population;
- refers to the unit demand for life cycle materials of a single injured population;
- refers to the unit demand for primary daily necessities of a single living population;
- represents the unit demand of living cycle materials for a single living population;
- refers to the demand for the k-th material at the j-th disaster site;
- refers to the seasonal coefficient of the emergency supplies;
- refers to the regional coefficient of the emergency supplies;
- T refers to time of emergency material demand;
- SW is the number of deaths in the disaster area;
- SS refers to the number of injured in the disaster area; and
- ZS is the total number of people in the disaster area.
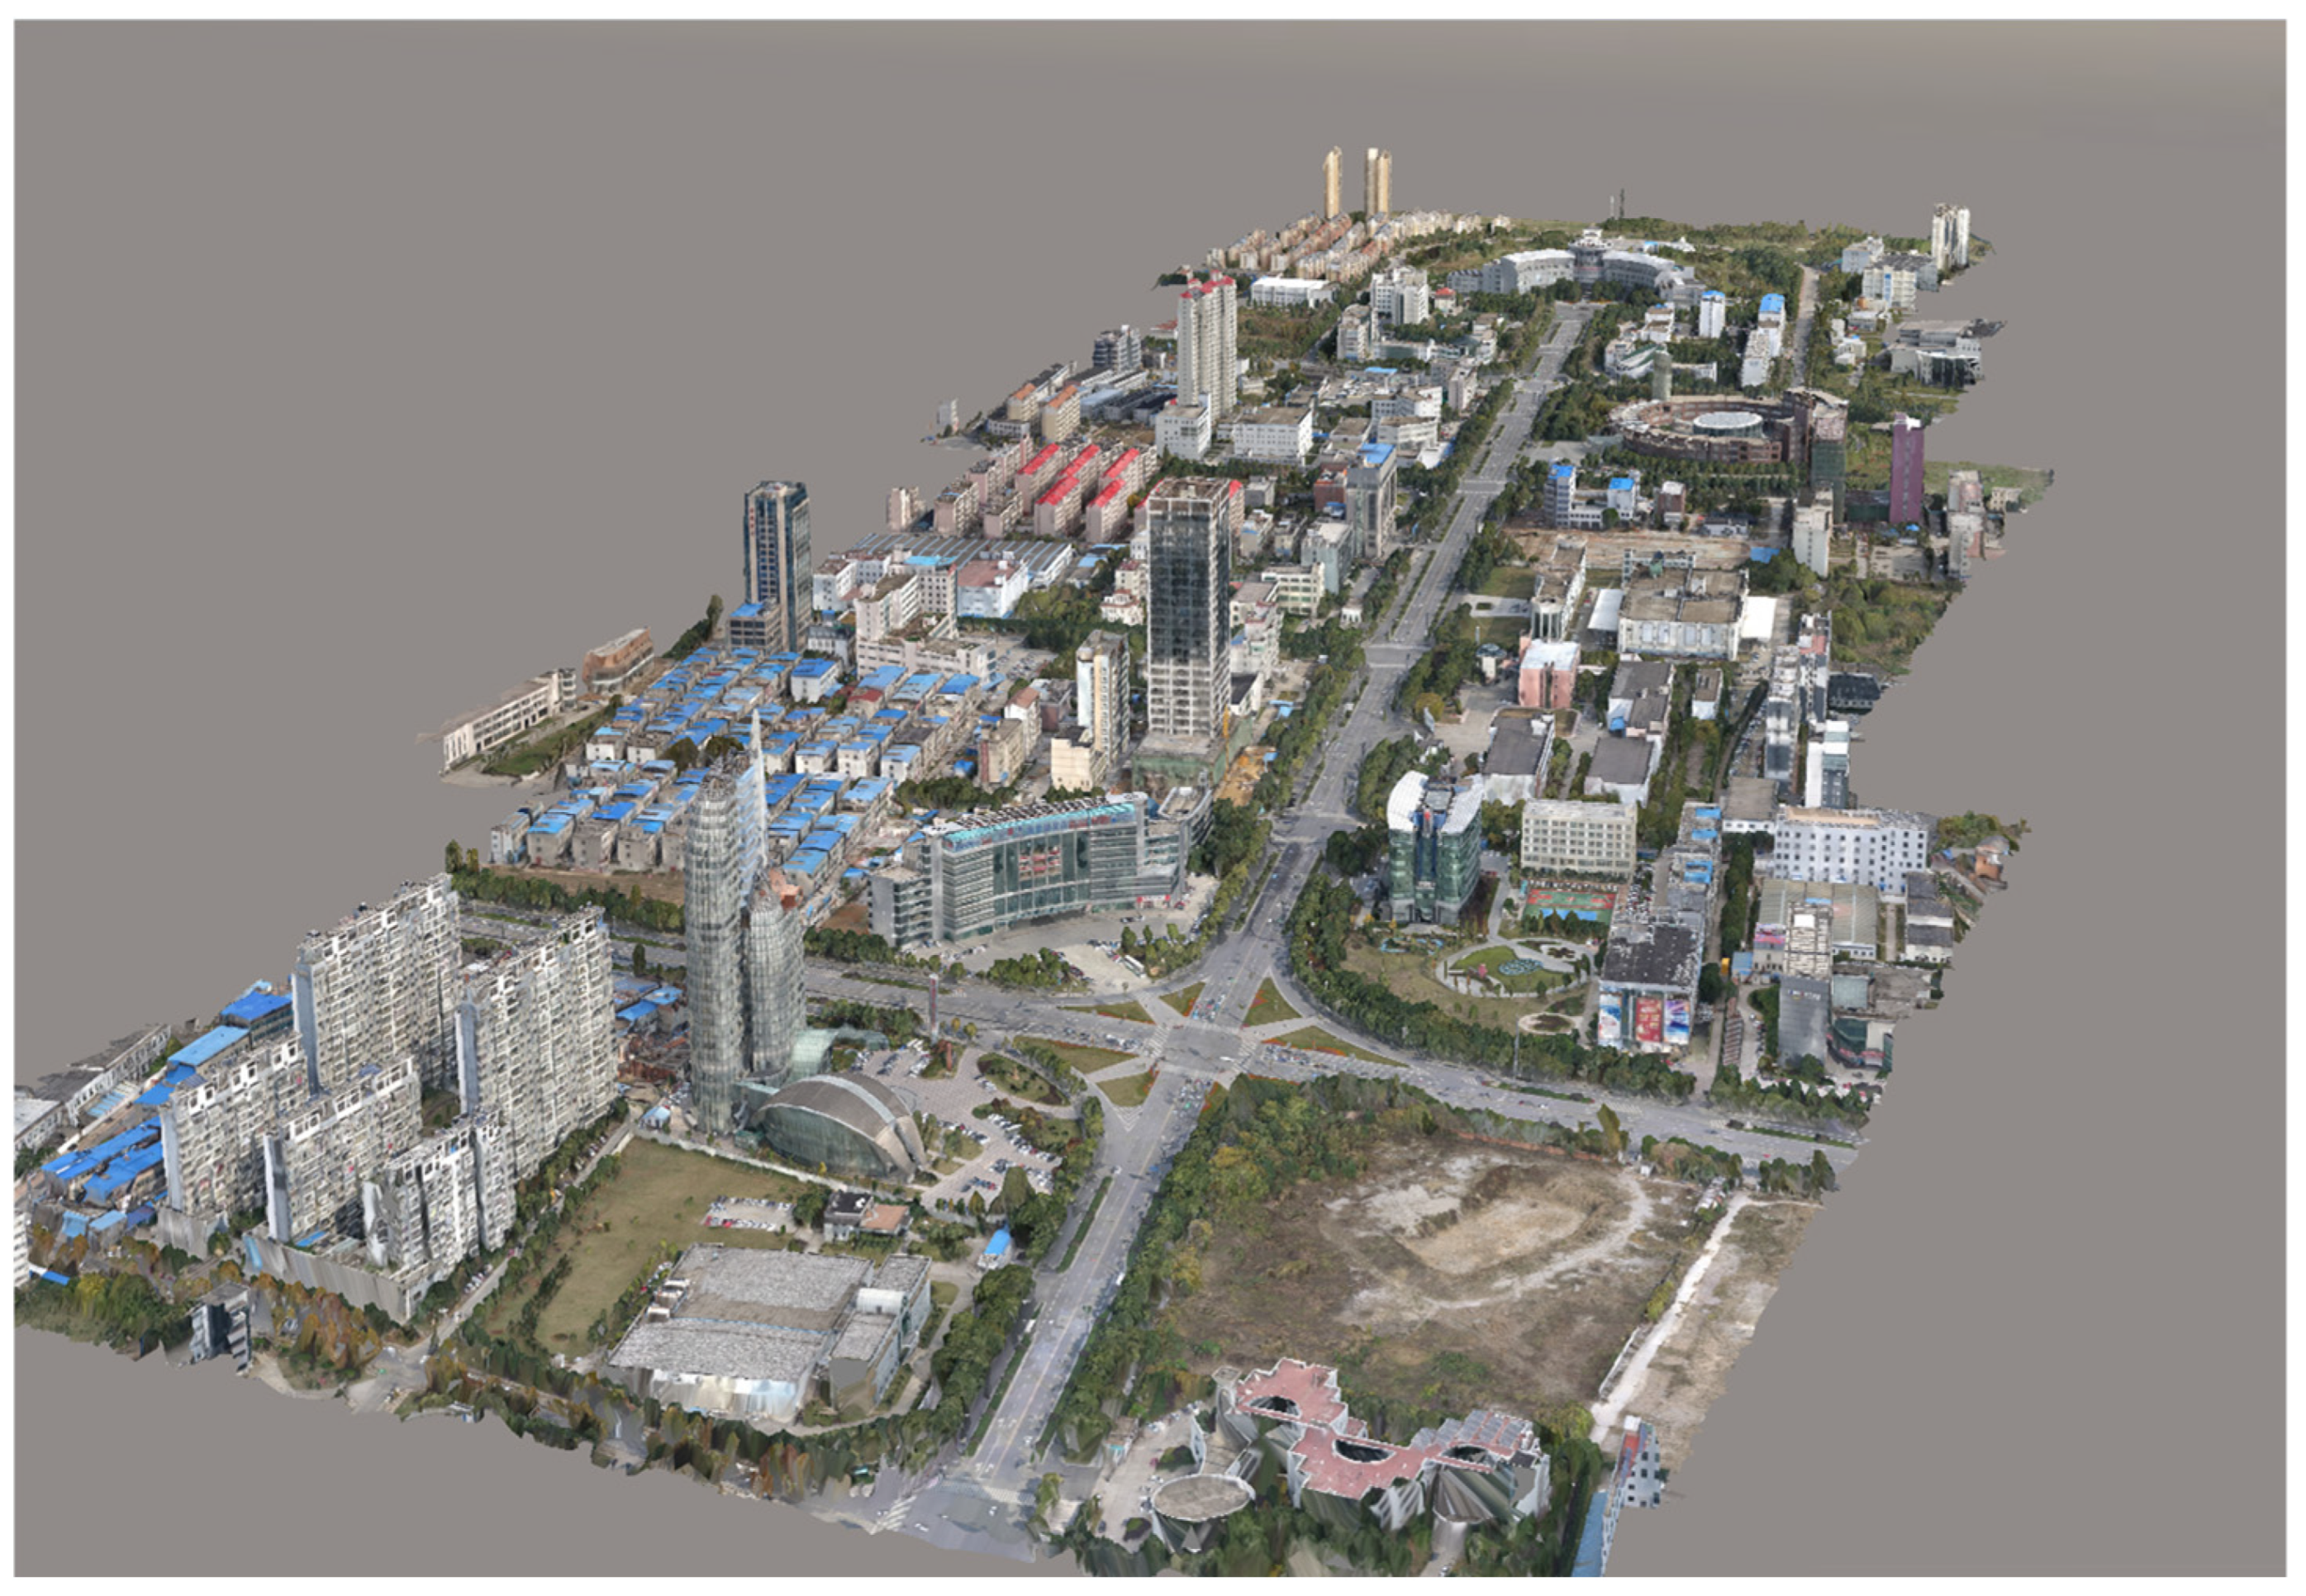
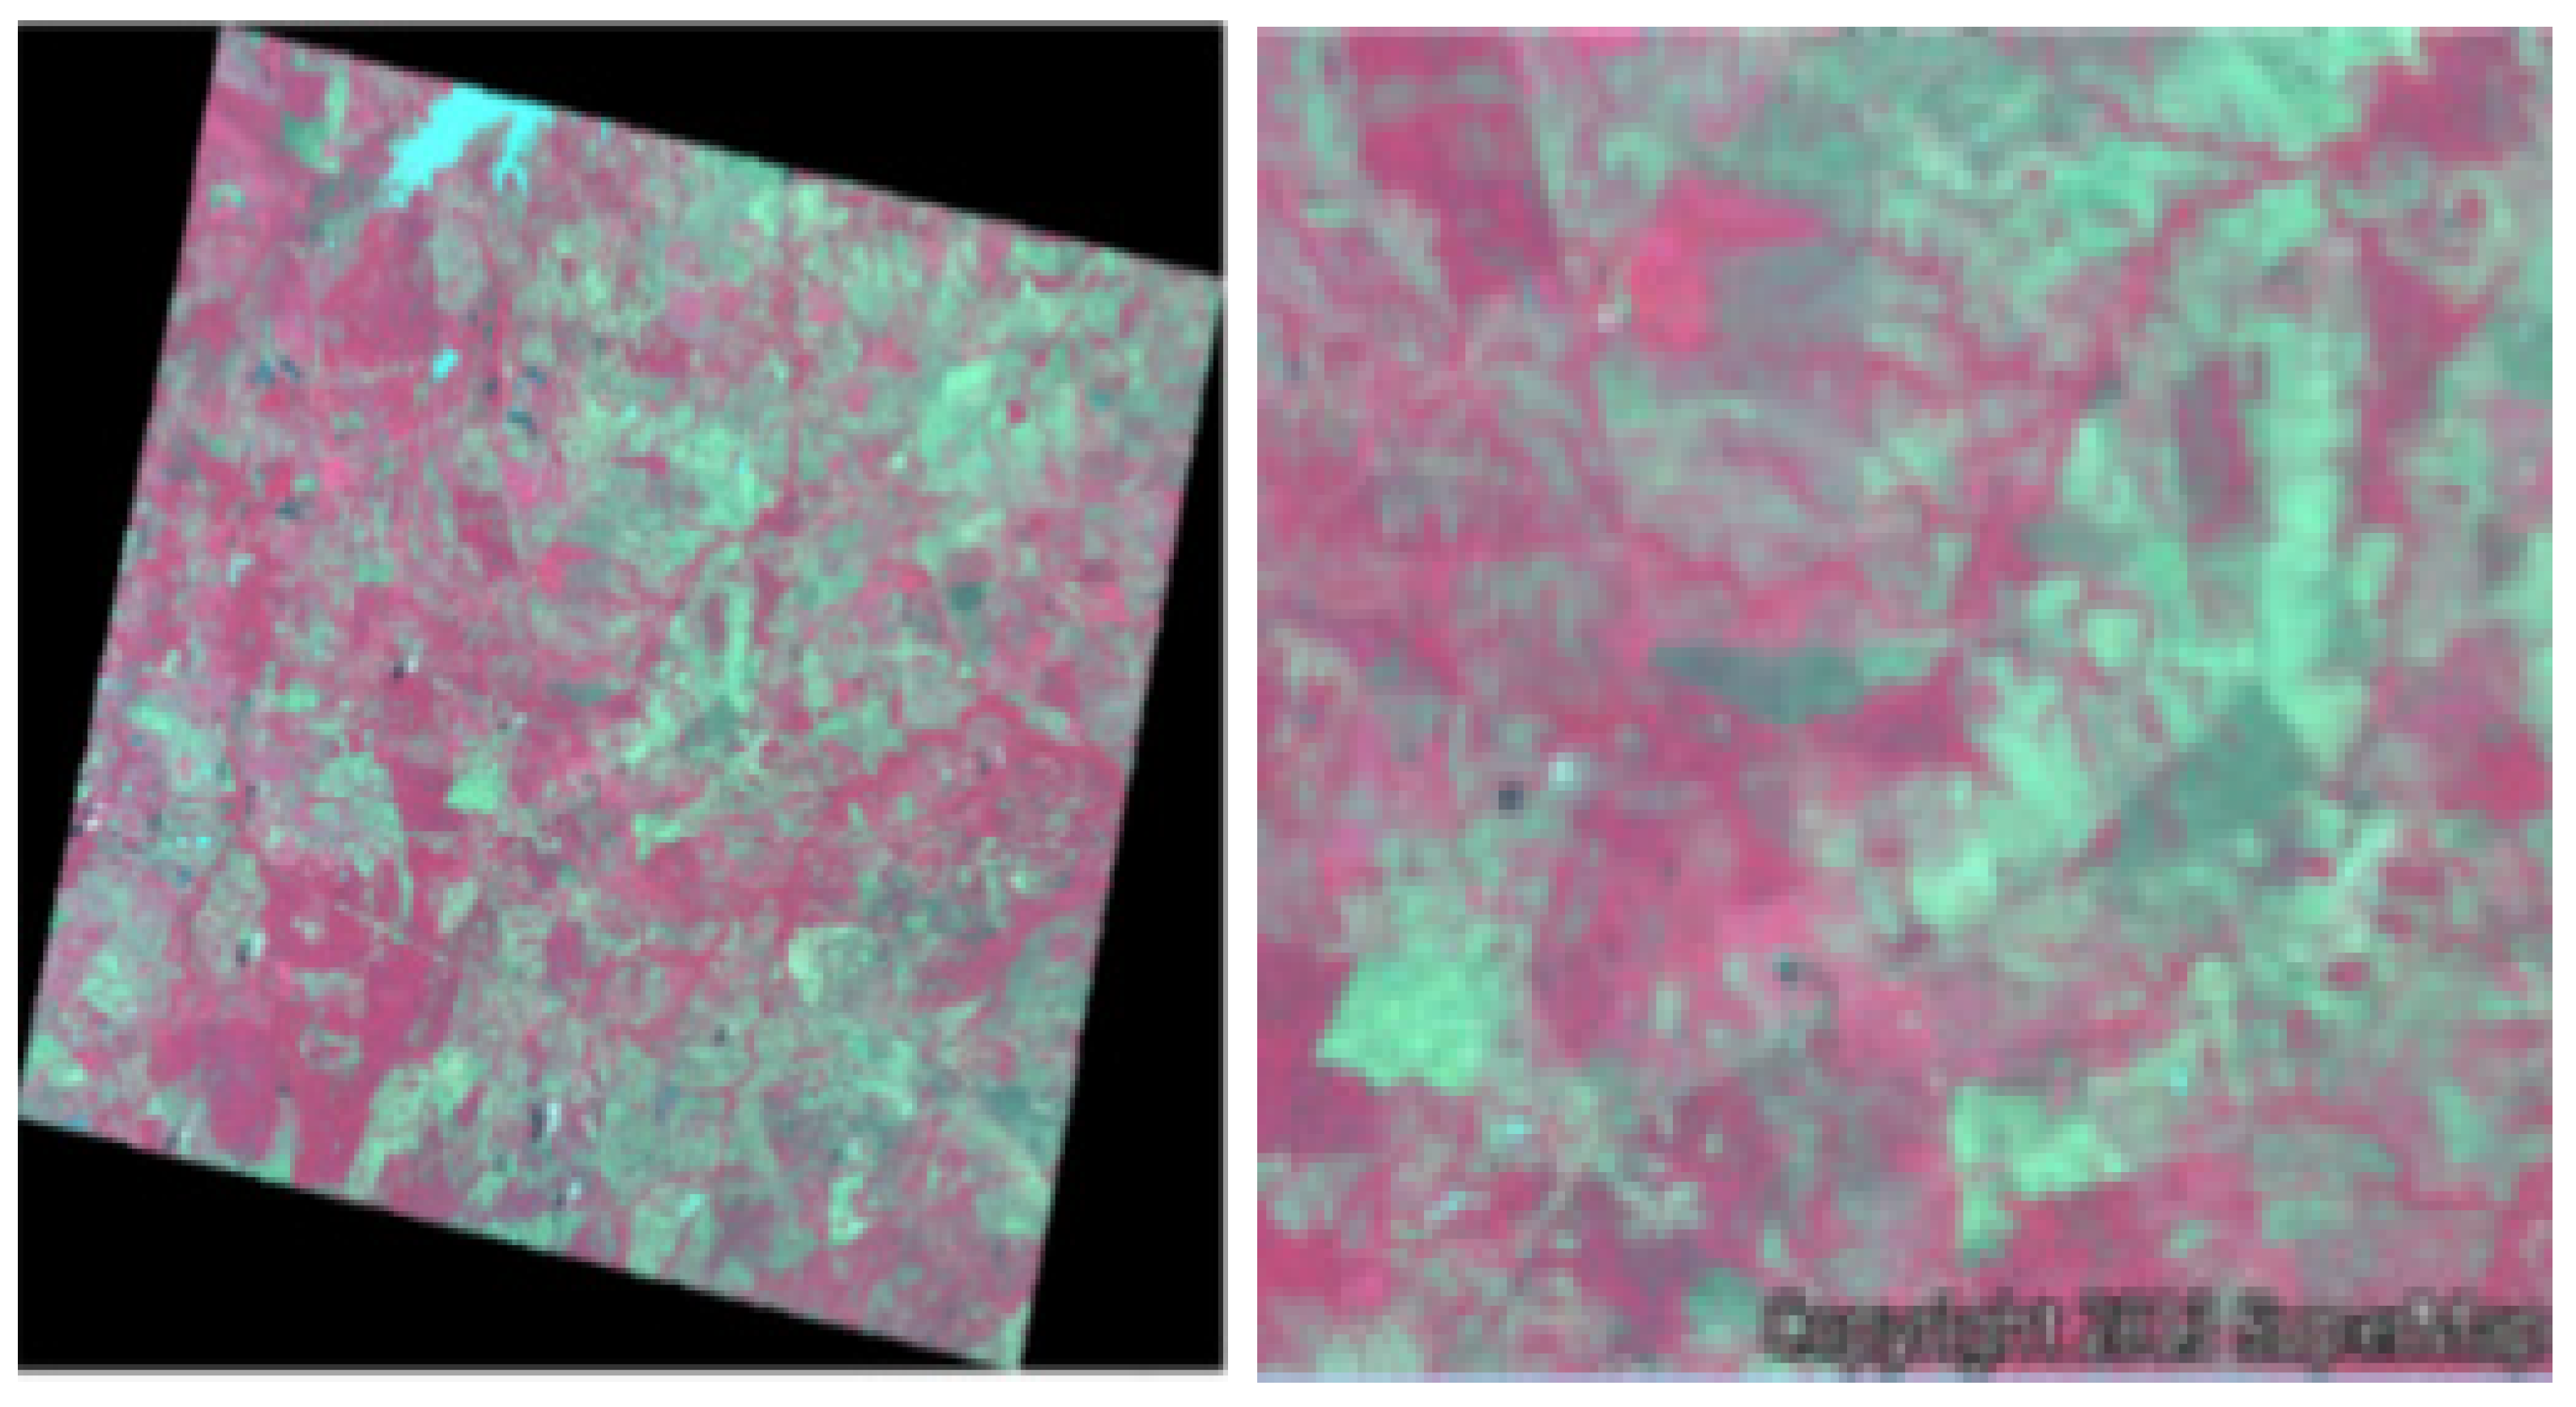
6. Case Analysis
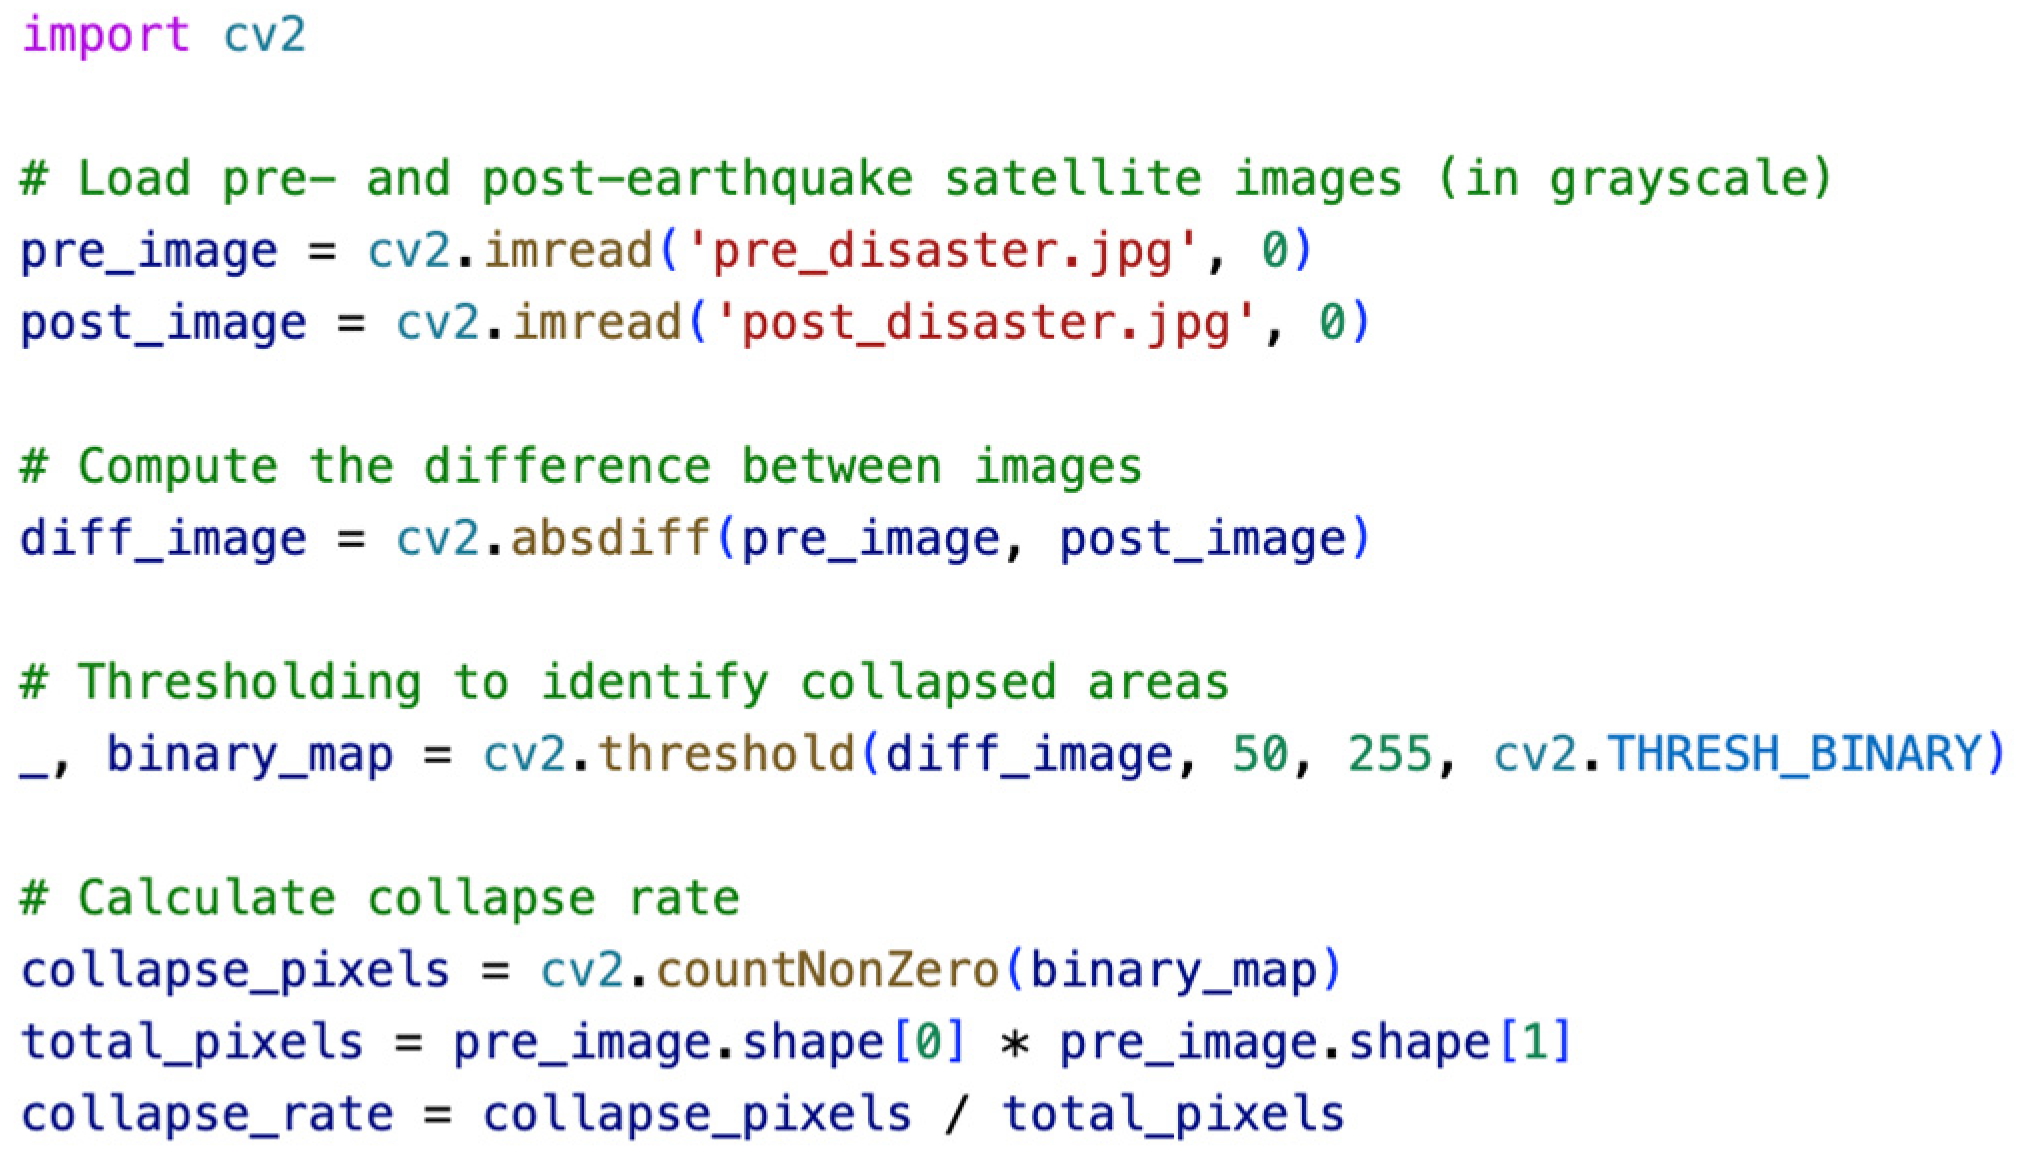
- (1)
- Intelligent Analysis Based on Satellite Imagery
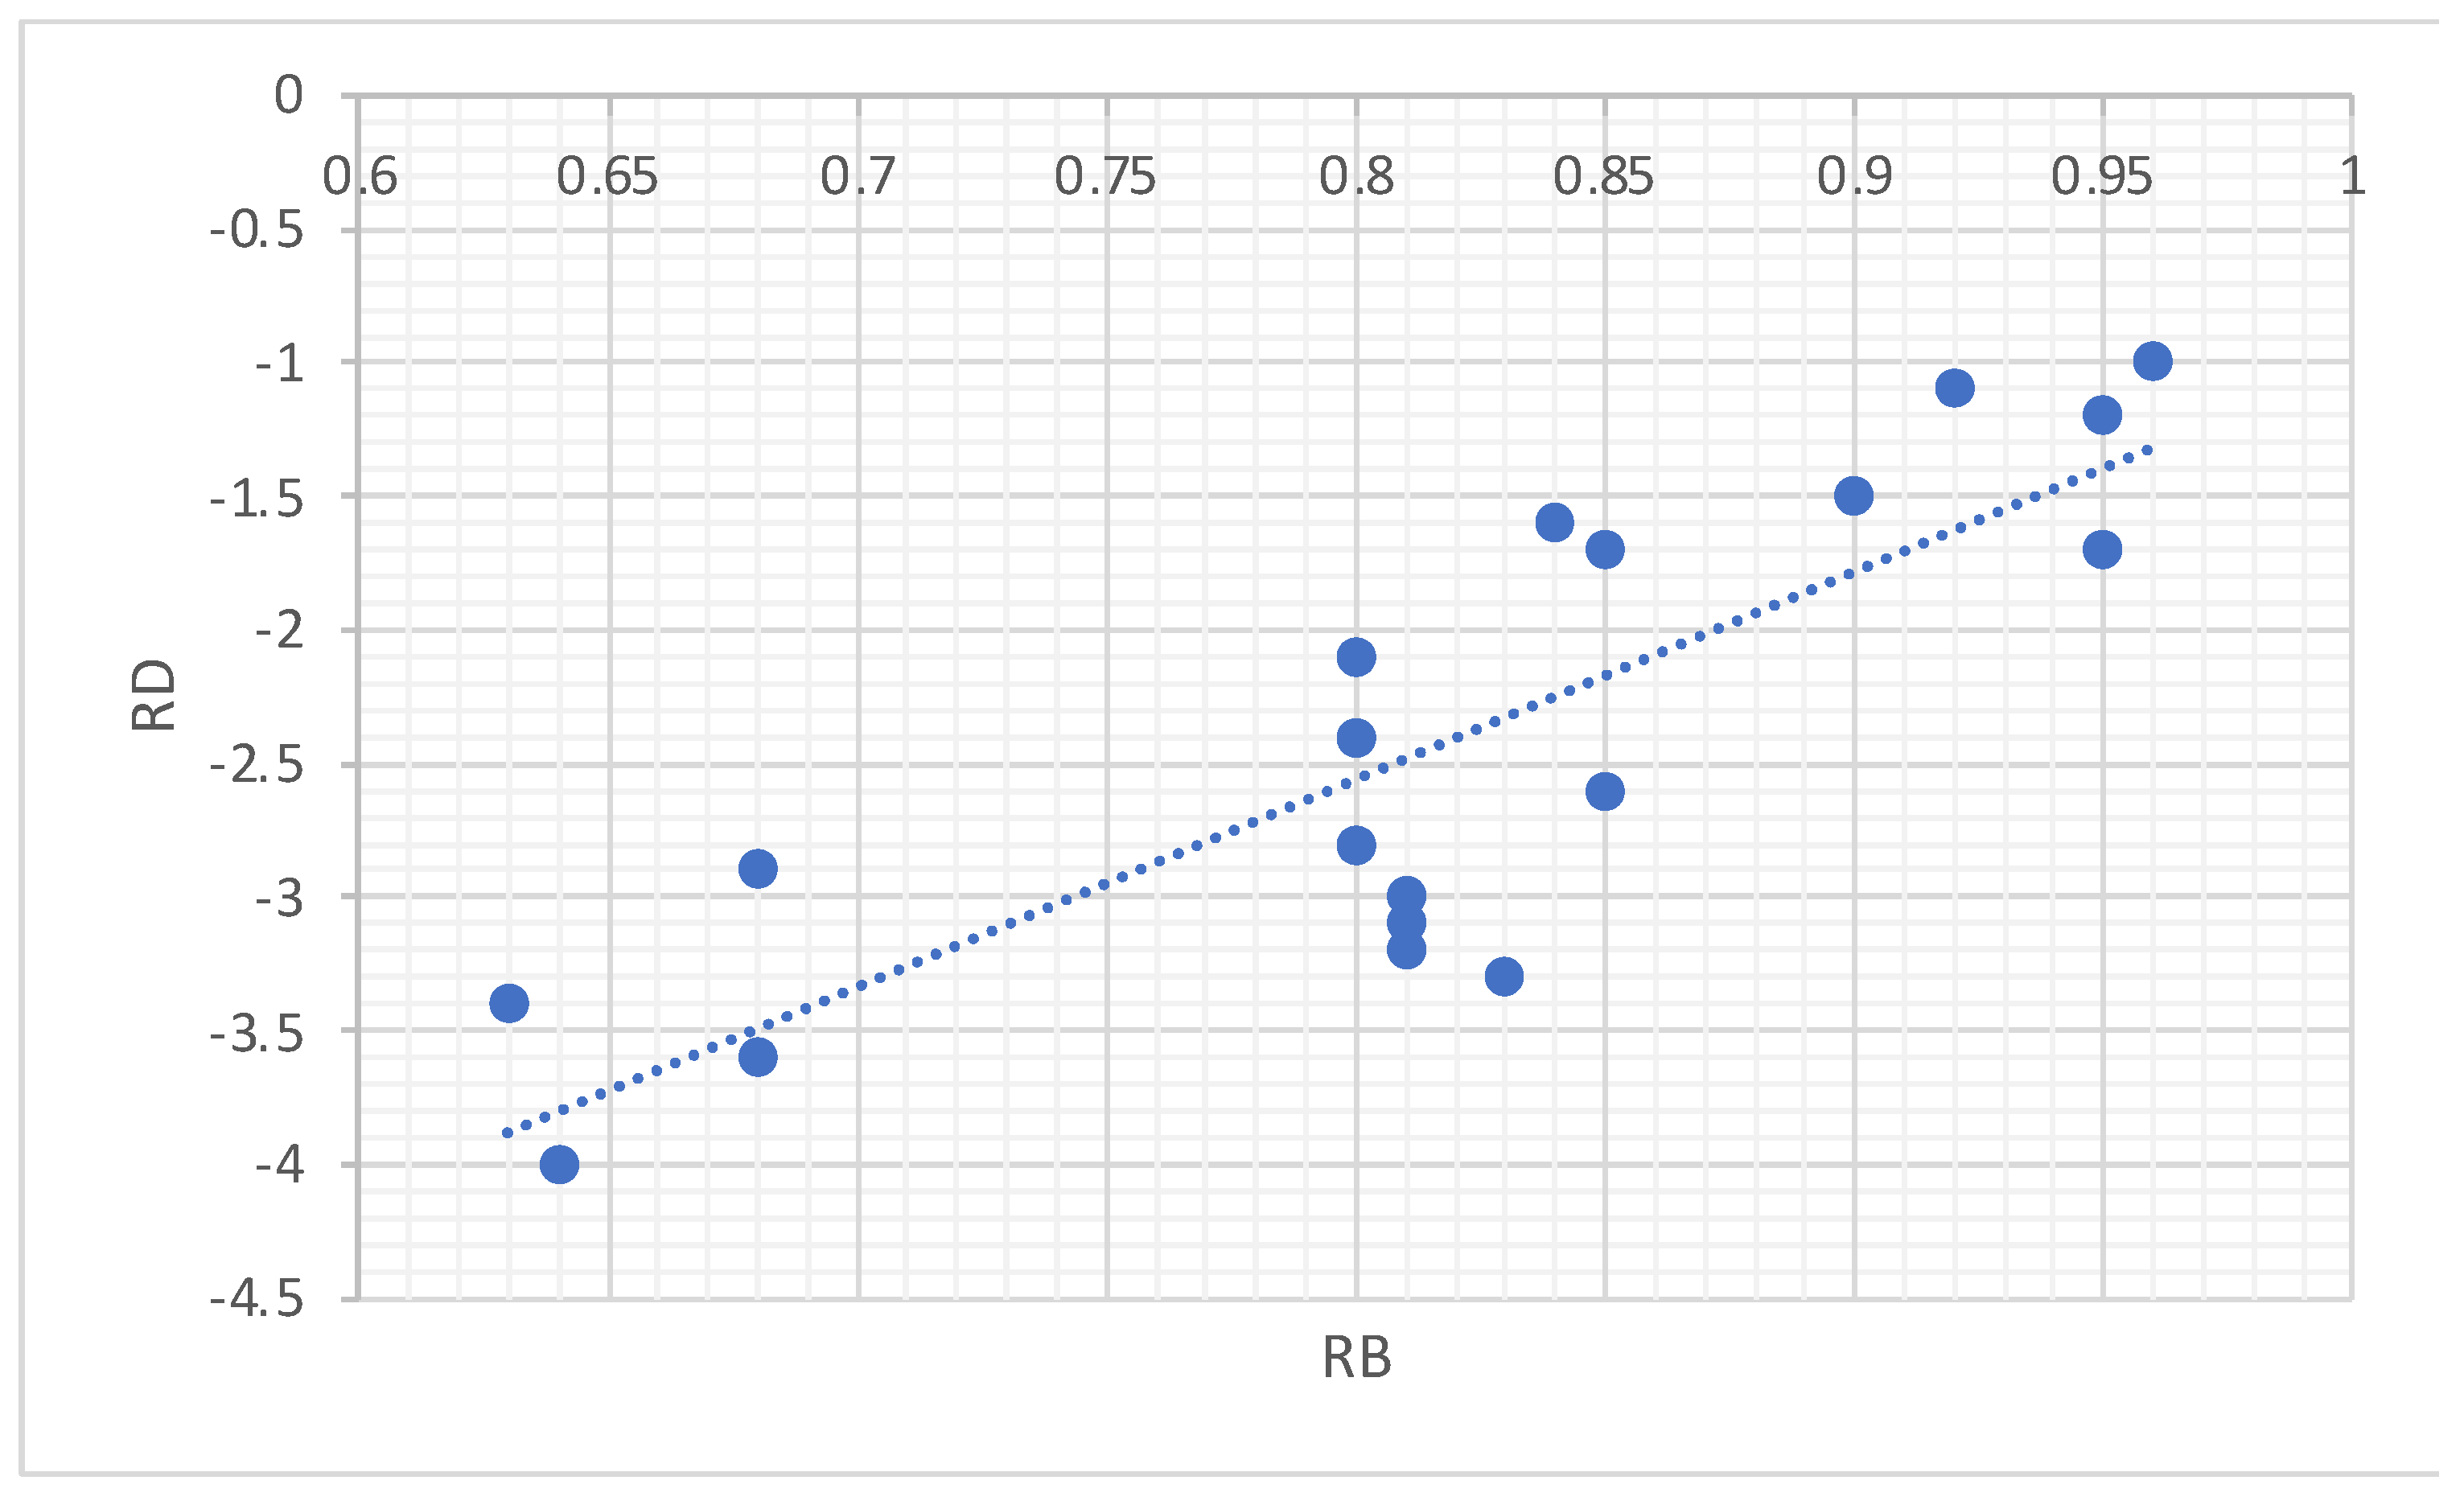
- (2)
- Statistical Regression Model Using the Least Squares Method
- (3)
- Integration and Advantages of the Hybrid Method
7. Conclusions
Supplementary Materials
Author Contributions
Funding
Data Availability Statement
Conflicts of Interest
References
- Ghaffarian, S.; Taghikhah, F.R.; Maier, H.R. Explainable artificial intelligence in disaster risk management: Achievements and prospective futures. Int. J. Disaster Risk Reduct. 2023, 98, 104123. [Google Scholar] [CrossRef]
- Apley, D.W.; Zhu, J. Visualizing the Effects of Predictor Variables in Black Box Supervised Learning Models. J. R. Stat. Soc. Ser. B Stat. Methodol. 2020, 82, 1059–1086. [Google Scholar] [CrossRef]
- Goldstein, A.; Kapelner, A.; Bleich, J.; Pitkin, E. Peeking Inside the Black Box: Visualizing Statistical Learning With Plots of Individual Conditional Expectation. J. Comput. Graph. Stat. 2015, 24, 44–65. [Google Scholar] [CrossRef]
- Khoda Bakhshi, A.; Ahmed, M.M. Utilizing black-box visualization tools to interpret non-parametric real-time risk assessment models. Transp. A Transp. Sci. 2020, 17, 739–765. [Google Scholar] [CrossRef]
- Yang, J.L.; Hou, H.P.; Geng, S.Q.; Qiao, S.B.; Wang, Y.; Tang, F.C.; Wang, X. Research on natural disaster emergency monitoring system. Int. J. Sens. Netw. 2020, 3, 218–229. [Google Scholar] [CrossRef]
- Anderson, A.; Compton, D.; Mason, T. Managing in a dangerous world—The national critical incident management system. Eng. Manag. J. 2004, 16, 3–9. [Google Scholar]
- Feng, Y.; Cui, S. A review of emergency response in disasters: Present and future perspectives. Nat. Hazards 2021, 105, 1109–1138. [Google Scholar] [CrossRef]
- Hou, H.; Zhang, K.; Zhang, X. Multi-scenario flexible contract coordination for determining the quantity of emergency medical suppliers in public health events. Front. Public Health 2024, 12, 1334583. [Google Scholar] [CrossRef]
- Pradhananga, R.; Mutlu, F.; Pokharel, S.; Holguín-Veras, J.; Seth, D. An integrated resource allocation and distribution model for pre-disaster planning. Comput. Ind. Eng. 2016, 91, 229–238. [Google Scholar] [CrossRef]
- Wang, Z.X. A genetic algorithm-based grey method for forecasting food demand after snow disasters: An empirical study. Nat. Hazards 2013, 68, 675–686. [Google Scholar] [CrossRef]
- Li, P.; Zhu, J.; Liu, S. Intuitionistic fuzzy decision-making method based on case reasoning. China Manag. Sci. 2015, 23, 113–118. [Google Scholar]
- Chen, A.; Blue, J. Performance analysis of demand planning approaches for aggregating, forecasting and disaggregating interrelated demands. Int. J. Prod. Econ. 2010, 128, 586–602. [Google Scholar] [CrossRef]
- Qian, F.; Cui, J. Application of BP neural network model in emergency demand prediction—Taking earthquake casualties prediction as an example. Chin. J. Saf. Sci. 2013, 23, 20–25. [Google Scholar]
- Sun, B.; Ma, W.; Zhao, H. A fuzzy rough set approach to emergency material demand prediction over two universes. Appl. Math. Model. 2013, 37, 7062–7070. [Google Scholar] [CrossRef]
- Su, Y.; Rong, G.; Ma, Y.; Chi, J.; Liu, X.; Zhang, J.; Li, T. Hazard Assessment of Earthquake Disaster Chains Based on Deep Learning—A Case Study of Mao County, Sichuan Province. Front. Earth Sci. 2022, 9, 683903. [Google Scholar] [CrossRef]
- Karimzadeh, S.; Matsuoka, M. A Preliminary Damage Assessment Using Dual Path Synthetic Aperture Radar Analysis for the M 6.4 Petrinja Earthquake (2020), Croatia. Remote Sens. 2021, 13, 2267. [Google Scholar] [CrossRef]
- Sheu, J.B. Dynamic relief-demand management for emergency logistics operations under large-scale disasters. Transp. Res. Part E Logist. Transp. Rev. 2010, 46, 1–17. [Google Scholar] [CrossRef]
- Feng, Y.; Wang, D.; Yin, Y.; Li, Z.; Hu, Z. An XGBoost-based casualty prediction method for terrorist attacks. Complex Intell. Syst. 2020, 6, 721–740. [Google Scholar] [CrossRef]
- Feng, Y.; Liu, T.; Hu, Z.; Wang, D.; Cheng, T.; Yin, Y. Casualty transport scheduling considering survival probability and injury classification. Comput. Ind. Eng. 2021, 161, 107655. [Google Scholar] [CrossRef]
- Margus, C.; Hertelendy, A.; Tao, Y.; Coltey, E.; Chen, S.-C.; Luis, S.; Shyu, M.-L.; Ciottone, G.R. United States Federal Emergency Management Agency regional clustering by disaster exposure: A new paradigm for disaster response. Nat. Hazards 2023, 116, 3427–3445. [Google Scholar] [CrossRef]
- Ryan, B.J.; Kako, M.; Garner, S.; Fink, R.; Tayfur, I.; Abrahams, J.; Bhatia, S.; Campelo, A.; Fendt, M.; Fontenot, A.; et al. Prioritizing Strategies for Building the Resilience of Public Health Systems to Disasters Across Multiple Communities and Countries. Int. J. Disaster Risk Sci. 2024, 15, 1–17. [Google Scholar] [CrossRef]
- Wu, Z.; Liu, C.; Yao, Z.; Zhang, Y. Research on Optimizing the Location and Layout of National Emergency Material Reserve. Sustainability 2022, 14, 15922. [Google Scholar] [CrossRef]
- Turkeš, R.; Cuervo, D.P.; Sörensen, K. Pre-positioning of emergency supplies: Does putting a price on human life help to save lives? Ann. Oper. Res. 2019, 283, 865–895. [Google Scholar] [CrossRef]
- Huang, C.-H.; Chang, K.-H.; Liu, C.-H.; Chang, T.-Y.; Lin, Y.-K. Network reliability analysis on casualty rescue for natural disaster evaluation. Ann. Oper. Res. 2025, 348, 399–419. [Google Scholar] [CrossRef]
- Hugelius, K.; Becker, J.; Adolfsson, A. Five Challenges When Managing Mass Casualty or Disaster Situations: A Review Study. Int. J. Environ. Res. Public Health 2020, 17, 3068. [Google Scholar] [CrossRef]
- Fei, L.; Wang, Y. Demand prediction of emergency materials using case-based reasoning extended by the Dempster-Shafer theory. Socio-Econ. Plan. Sci. 2022, 84, 101386. [Google Scholar] [CrossRef]
- Wang, C.-Y.; Guo, J.; Kuo, M.-F. The building of social resilience in Sichuan after the Wenchuan earthquake: A perspective of the socio-government interactions. Saf. Sci. 2020, 126, 104662. [Google Scholar] [CrossRef]
- Harding, J.; Jellyman, P. Earthquakes, catastrophic sediment additions and the response of urban stream communities. New Zealand J. Mar. Freshw. Res. 2015, 49, 346–355. [Google Scholar] [CrossRef]
- Xian, X.; Ye, H.; Wang, X.; Liu, K. Spatiotemporal Modeling and Real-Time Prediction of Origin-Destination Traffic Demand. Technometrics 2020, 63, 77–89. [Google Scholar] [CrossRef]
- Wang, Q.; Wang, S.; Deng, X. Application of high resolution satellite remote sensing technology in environmental monitoring. J. Environ. Prot. Ecol. 2022, 23, 2158–2164. [Google Scholar]
- Deng, M.; Yang, W.; Liu, Q.; Zhang, Y. A divide-and-conquer method for space–time series prediction. J. Geogr. Syst. 2017, 19, 1–19. [Google Scholar] [CrossRef]
- Bosnić, Z.; Kononenko, I. Estimation of individual prediction reliability using the local sensitivity analysis. Appl. Intell. 2008, 29, 187–203. [Google Scholar] [CrossRef]
- Zhang, Y.; Li, P.; Li, H.; Zu, W.; Zhang, H.; Fu, X. Short-Term Power Prediction of Wind Power Generation System Based on Logistic Chaos Atom Search Optimization BP Neural Network. Int. Trans. Electr. Energy Syst. 2023, 2023, 6328119. [Google Scholar] [CrossRef]
- Kang, Y.; Tan, Y.; Zhao, J.; Yang, K.; Liu, W.; Yue, S. End-point carbon content correction in converter steelmaking based on the Kalman filter and CBR model. Ironmak. Steelmak. 2024. [Google Scholar] [CrossRef]
- Yu, Q.; Hou, Q.; Chen, X. Scattering characteristics modeling and imaging of blast furnace burden surface in dusty environment. Syst. Eng. Electron. 2023, 45, 1277–1285. [Google Scholar]
- Shafi, M.A.; Rusiman, M.S.; Jacob, K.; Musa, A.N. A New Intelligent Modelling Two-stage of Hybrid Fuzzy Prediction Approach by Using Computation Software. J. Intell. Fuzzy Syst. 2023, 45, 11013–11019. [Google Scholar] [CrossRef]
- Nguyen, H.D.; Dang, D.K.; Nguyen, N.Y.; Van, C.P.; Van Nguyen, T.T.; Nguyen, Q.-H.; Nguyen, X.L.; Pham, L.T.; Pham, V.T.; Bui, Q.-T. Quang-Thanh Bui; Integration of machine learning and hydrodynamic modeling to solve the extrapolation problem in flood depth estimation. J. Water Clim. Chang. 2024, 15, 284–304. [Google Scholar] [CrossRef]
- Furukawa, A.; Spence, R.; Ohta, Y.; So, E. Analytical study on vulnerability functions for casualty estimation in the collapse of adobe buildings induced by earthquake. Bull. Earthq. Eng. 2010, 8, 451–479. [Google Scholar] [CrossRef]
- Martel, L.D.; Mueller, C.W. The Effect of Anticipated Service Interruptions on Disaster Preparedness Intentions1. J. Appl. Soc. Psychol. 2011, 41, 298–311. [Google Scholar] [CrossRef]
- French, M.; Duray, R.; Fan, Y. Impact of disasters on routine emergency service response performance. J. Contingencies Crisis Manag. 2021, 29, 303–320. [Google Scholar] [CrossRef]
- Chung, Y.-L.; Nagae, T.; Matsumiya, T.; Nakashima, M. Seismic resistance capacity of beam–column connections in high-rise buildings: E-Defense shaking table test. Earthq. Engng. Struct. Dyn. 2011, 40, 605–622. [Google Scholar] [CrossRef]
- Yang, H.; Zhang, P.; Zhang, P.; Zhang, C.; Yan, X. Optimization of a two-stage emergency logistics system considering public psychological risk perception under earthquake disaster. Sci. Rep. 2024, 14, 31983. [Google Scholar] [CrossRef] [PubMed]
- Lin, Y.; Yan, W.; Zhang, Y.; Zhang, H.; Zhang, H.; Wang, D. Emergency Drug Demand Forecasting in Earthquakes with XGBoost and AFT-LSTM. Sustainability 2025, 17, 1910. [Google Scholar] [CrossRef]
- Shing, E.Z.; Jayawickreme, E.; Waugh, C.E. Contextual Positive Coping as a Factor Contributing to Resilience After Disasters. J. Clin. Psychol. 2016, 72, 1287–1306. [Google Scholar] [CrossRef]
- Zhang, K.; Hou, H.; Dong, Z.; Liu, Z. Research on integrated inventory transportation optimization of inbound logistics via a VMI-TPL model of an existing enterprise. Math. Biosci. Eng. 2023, 20, 16212–16235. [Google Scholar] [CrossRef]
- Modarresi, S.A.; Maleki, M.R. Integrating pre and post-disaster activities for designing an equitable humanitarian relief supply chain. Comput. Ind. Eng. 2023, 181, 109342. [Google Scholar] [CrossRef]
- Huang, H.; Zhang, W.; Zhen, Z.; Shi, H.; Zhao, M. Network invulnerability modeling of daily necessity supply based on cascading failure considering emergencies and dynamic demands. Int. J. Appl. Earth Obs. Geoinf. 2024, 134, 104225. [Google Scholar] [CrossRef]

| Method | Implication | Advantages | Disadvantages |
|---|---|---|---|
| Time series smoothing prediction [31] | According to the relevant historical data, only the change rule with time is considered to predict the future time | Simple mathematical statistics prediction speed is faster | ① Not suitable for complex data prediction ②The calculation process is complex and time-consuming ③ The history and data of dependent variables are needed as the basis of prediction |
| Regression analysis prediction [32] | Based on historical data, the causal and adjoint relationships between dependent and independent variables are established, and the unknown situation is predicted by analyzing the change of relevant factors | ① Simple calculation and fast speed ② Applicable to short-term forecast | ① Collect past historical data for correlation analysis and determine the prediction model ② There are some errors in the prediction |
| Neural network prediction [33] | By analyzing and determining the main factors affecting the casualties, and these factors as input neurons, casualties as output neurons, through network training and simulation, build a prediction model of casualties, and carry out dynamic prediction of casualties | ① Applicable to prediction of nonlinearity and uncertainty ② Focus on input and output | ① It needs to go through many drills and requires fast operation speed ② There are some errors in the prediction |
| Case-based reasoning prediction [34] | According to the analogy principle, through the analysis and summary of the past disasters, the rescue case database is established. When new disasters occur, the most similar cases are found by comparing against the case database to predict the emergency rescue demand | ① Use short-term forecasts ② The prediction results are obtained directly through comparison, and the speed is relatively fast | ① A large amount of case data need to be accumulated. Without data, there will be a lack of comparison objects, which will affect the accuracy of prediction ② It is difficult to find cases with high similarity, which affects the accuracy of prediction ③ It is possible to eliminate valuable information from other cases besides similar cases |
| Grey system model prediction [35] | According to the principle of inertia, through the correlation analysis of known and unknown information, the original data are processed, and the strong regular data series are generated by looking for the rules, and the future development trend is predicted by the differential equation model | Less forecast information required | ① The speed of obtaining information about the disaster area determines the speed of prediction ② Prediction of time series limited to exponential form ③ Forecast must be based on previous data ④ Not applicable to the prediction of golden rescue period |
| Intelligent analysis and prediction [36] | Through the intelligent comparative analysis of the images before and after the disaster by computer, the disaster information of the disaster area can be obtained quickly, and the demand of emergency materials can be predicted according to the disaster information | ① Direct comparison of image information of disaster area ② Fast operation speed | ① The speed of obtaining information of disaster area determines the speed of prediction ② Higher requirements on the processing speed of the impact |
| Extrapolation [37] | It involves estimating future values based on existing data, assuming that current trends continue. Its implications include the risk of inaccuracy due to unforeseen changes, sensitivity to outliers, and the necessity for cautious interpretation and validation of results. | Fast analogy | ① Only by collecting more data can we obtain the scatter diagram ②Low prediction accuracy |
| Population density ρ (per/km3) | ˂50 | 50–200 | 200–500 | ˃500 |
| Correction coefficient | 0.8 | 1.0 | 1.1 | 1.2 |
| Earthquake intensity | VI | VII | VIII | IX | X |
| Correction coefficient (night) | 17 | 8 | 4 | 2 | 1.5 |
| Score of pre-disaster preparation | 0 | 10 | 20 | 30 | 40 | 50 | 60 | 70 | 80 | 90 | 100 |
| Correction coefficient | 1.5 | 1.4 | 1.3 | 1.2 | 1.1 | 1 | 0.9 | 0.8 | 0.7 | 0.6 | 0.5 |
| Emergency capacity after disaster | 0–12 | 12–24 | 24–36 | 36–48 | 48–60 | 60–72 | >72 h |
| Correction coefficient | 0.4 | 0.5 | 0.6 | 0.7 | 0.8 | 0.9 | 1 |
| Village | N1 | N2 | N3 | N4 | N5 |
|---|---|---|---|---|---|
| Collapse rate (%) | 0.4 | 0.5 | 0.4 | 0.65 | 0.6 |
| Village | N1 | N2 | N3 | N4 | N5 |
|---|---|---|---|---|---|
| Population mortality (%) | 0.0139 | 0.0212 | 0.0139 | 0.0355 | 0.0303 |
| Village | N1 | N2 | N3 | N4 | N5 |
|---|---|---|---|---|---|
| Total population | 750 | 860 | 1100 | 820 | 730 |
| Population density (per/km3) | 40 | 50 | 36 | 30 | 60 |
| Correction coefficient fp | 0.8 | 1 | 0.8 | 0.8 | 1 |
| Village | N1 | N2 | N3 | N4 | N5 |
|---|---|---|---|---|---|
| Pre disaster preparation score | 30 | 80 | 20 | 50 | 90 |
| Correction coefficient fz | 1.2 | 0.7 | 1.3 | 1 | 0.6 |
| Village | N1 | N2 | N3 | N4 | N5 |
|---|---|---|---|---|---|
| Post disaster emergency capacity | 0–12 | 0–12 | 0–12 | 0–12 | 0–12 |
| Correction coefficient fn | 0.4 | 0.4 | 0.4 | 0.4 | 0.4 |
| Village | N1 | N2 | N3 | N4 | N5 |
|---|---|---|---|---|---|
| Earthquake intensity | X | X | IX | X | IX |
| Correction coefficient ft (night) | 1.5 | 1.5 | 2 | 1.5 | 2 |
| Village | N1 | N2 | N3 | N4 | N5 |
|---|---|---|---|---|---|
| Death toll (person) | 6 | 8 | 13 | 14 | 11 |
| Number of injured | 30 | 38 | 63 | 70 | 53 |
| Number of victims | 744 | 852 | 1087 | 806 | 719 |
| Disaster Point1 | Disaster Point2 | Disaster Point3 | Disaster Point4 | Disaster Point5 | |
|---|---|---|---|---|---|
| Food | 298 | 341 | 435 | 322 | 288 |
| Medicine | 15 | 19 | 32 | 35 | 27 |
| Water | 248 | 284 | 362 | 269 | 240 |
| Tent | 372 | 426 | 544 | 403 | 360 |
Disclaimer/Publisher’s Note: The statements, opinions and data contained in all publications are solely those of the individual author(s) and contributor(s) and not of MDPI and/or the editor(s). MDPI and/or the editor(s) disclaim responsibility for any injury to people or property resulting from any ideas, methods, instructions or products referred to in the content. |
© 2025 by the authors. Licensee MDPI, Basel, Switzerland. This article is an open access article distributed under the terms and conditions of the Creative Commons Attribution (CC BY) license (https://creativecommons.org/licenses/by/4.0/).
Share and Cite
Yang, J.; Zhang, K.; Hou, H.; Li, N. Forecasting Demand for Emergency Material Classification Based on Casualty Population. Systems 2025, 13, 478. https://doi.org/10.3390/systems13060478
Yang J, Zhang K, Hou H, Li N. Forecasting Demand for Emergency Material Classification Based on Casualty Population. Systems. 2025; 13(6):478. https://doi.org/10.3390/systems13060478
Chicago/Turabian StyleYang, Jianliang, Kun Zhang, Hanping Hou, and Na Li. 2025. "Forecasting Demand for Emergency Material Classification Based on Casualty Population" Systems 13, no. 6: 478. https://doi.org/10.3390/systems13060478
APA StyleYang, J., Zhang, K., Hou, H., & Li, N. (2025). Forecasting Demand for Emergency Material Classification Based on Casualty Population. Systems, 13(6), 478. https://doi.org/10.3390/systems13060478