Article

Quantitative Evaluation of Value for Money in Sponge City Construction Public–Private Partnership Projects Through a System Dynamics Model

1
School of Mechanics and Civil Engineering, China University of Mining and Technology, Xuzhou 221116, China
2
School of Management Science and Engineering, Anhui University of Finance and Economics, Bengbu 233030, China
3
School of Architecture and Design, China University of Mining and Technology, Xuzhou 221116, China
4
Business School, Hohai University, Changzhou 213200, China
*
Author to whom correspondence should be addressed.
Systems 2025, 13(6), 471; https://doi.org/10.3390/systems13060471 (registering DOI)
Submission received: 15 April 2025 / Revised: 10 June 2025 / Accepted: 12 June 2025 / Published: 14 June 2025
(This article belongs to the Section Systems Engineering)

Abstract

:
The public–private partnerships (PPP) mode is very popular in public infrastructure projects. The PPP model for sponge city construction (SCC) provides an effective way to curb and manage the increasingly serious ecological water problems in China. The quantitative evaluation of value for money (VFM) is an evaluation method that obtains quantitative values through a certain calculation process. However, the current studies lack a dynamic quantitative evaluation of VFM for the entire life cycle of SCC PPP projects, and cannot observe the impact of key factors on the VFM value. By constructing a system dynamics (SD) model for the VFM quantitative evaluation of SCC PPP projects from the perspective of the whole life cycle, this study can intuitively and transparently observe the impact of key factors (such as discount rate and profit margin) on the evaluation results and feasibility of adopting a PPP model in the project, offering policymakers a tool to mitigate the risks of “Pseudo-PPP” projects. After collecting cases in Anhui province from the China PPP Center, this study constructed a life cycle VFM quantitative evaluation system dynamics model suitable for SCC PPP projects that consist of the public sector comparison (PSC) value and PPP value. The results indicate that the system dynamics model can be effectively applied to the dynamic quantitative evaluation of SCC PPP projects and clarify the influence degree on and sensitivity of various factors to the VFM value. Specifically, when the discount rate increases, the decrease in the PPP value is greater than that in the PSC value, leading to an increase in the VFM value. Moreover, a reasonable profit margin is more sensitive to the VFM value and decreases as the reasonable profit margin increases. In addition, choosing different availability service fee calculation methods will result in varying the adjustment range to a reasonable profit margin that drives the adoption of VFM quantitative evaluation. These research findings have provided a viable dynamic research methodology for the quantitative VFM evaluation of SCC PPP projects. This methodology enables the dynamic visualization and easy determination of the acceptable ranges for relevant factors, offers rational policy recommendations for the quantitative evaluation of key factor values, and thereby effectively prevents PPP project violations, promoting fair and reasonable cooperation between governments and private enterprises.

1. Introduction

Sponge city construction (SCC), a concept of urban sustainable development reducing rainwater runoff, reducing rainwater pollution, improving the urban water ecological environment, and ameliorating the urban greening environment, has been proposed to solve the contradiction between water shortages and urban waterlogging [1,2,3]. However, investment and financing channels are some of the main obstacles restricting the sustainable development of SCC [4]. The public–private partnerships (PPP) model refers to the commercial operation mode of providing high-quality public goods and services to the public through cooperation between the public sector and private capital [5,6,7]. The “General Office of the State Council on the Guidance of Promoting Sponge City Construction” released in 2015 required the application of the PPP model to SCC. The “Interim Measures for the Special Management of Investment in the Central Budget of Drainage Facilities Construction” issued in 2020 showed that great emphasis was attached to the investment and financing mode of PPP projects in SCC. Thus, the PPP mode of SCC became a new mode of urban construction in the process of urbanization in China [8]. According to the existing literature research and the data from the China Public–Private Partnerships Center (CPPPC), the PPP mode of SCC changed from the high-speed expansion stage to the standardized development stage. The main reason for this was that the contradiction and opposition between the rapidly expanding PPP projects in practice and the seriously lagging PPP theoretical research were becoming more and more serious. This led to the emergence of some “Pseudo-PPP” projects, making it difficult to implement PPP projects. “Pseudo-PPP” projects refer to infrastructure projects that are not suitable for PPP mode construction by local governments in response to national policies, or to reduce short-term government financial burden, improve political performance, etc. Through some extreme measures to make them pass the value for money evaluation, the PPP mode has been adopted. However, it has not achieved the effect of reducing government construction costs and improving project efficiency; instead, a large number of disputes and defaults have occurred in the follow-up contract performance. Therefore, there was an urgent need to standardize the PPP mode for SCC to scientifically and reasonably use it.
Value for money (VFM) evaluation is the principle used to determine whether a new infrastructure project is suitable for the PPP model [9]. VFM evaluation refers to the structural comparison between the traditional model and the PPP model conducted by the government according to the determined method. Therefore, VFM evaluation is a benchmark cost for government-provided projects developed by the government regarding similar projects, and the whole-life cost under the PPP mode is compared with this benchmark cost to make project decisions [10,11]. In December 2015, the Ministry of Finance issued the “PPP Value for Money Evaluation Guidelines (Trial)”, which was divided into qualitative and quantitative evaluation [12]. The qualitative evaluation mainly relies on expert scoring to determine whether the project is suitable for the PPP model. The quantitative evaluation compares the total costs of project construction under the PPP mode and the traditional government procurement mode, to see whether it can achieve VFM. However, many practical problems and operational dilemmas have been revealed in the implementation of VFM evaluation by various local governments [13]. The qualitative evaluation conclusion and quantitative evaluation value are the decision criteria for choosing between traditional procurement and PPP. There are no integral or standardized evaluation methods or processes of this method in the Evaluation Guidelines (Trial). Therefore, while VFM evaluation is widely adopted to justify PPP procurement, existing methods—particularly in China’s SCC PPP projects—rely heavily on static frameworks such as the PSC method. These approaches fail to account for dynamic interactions between fiscal parameters (e.g., escalating availability payments) and long-term project risks, often leading to biased approvals of “Pseudo-PPP” projects.
Therefore, comprehensive and effective VFM quantitative evaluation needs to be conducted to judge PPP’s efficiency in SCC, which can improve governments’ decision-making levels, achieve VFM during sponge cities’ life cycle, and is also necessary for practice. On the one hand, the quantification and the present value of various unknown risks, government supervision costs, and other factors make it difficult to operate VFM quantitative evaluation in practice [14]. On the other hand, VFM evaluation in China lacks the accumulation of basic project data and evaluation experience, and the influencing factor selection is random (e.g., discount rate, reasonable profit margin). The reliability of VFM quantitative evaluation results is thus low. Therefore, there is an urgent need to analyze and summarize the existing quantitative evaluation methods and practice data of PPP projects with a view to providing a scientific and reasonable evaluation model. Based on this background, this study aims to address the following research questions: (1) How can an entire life cycle model be effectively constructed to evaluate the VFM of SCC PPP projects? (2) How do key influencing factors (e.g., discount rate, reasonable profit margin) dynamically affect the sensitivity of VFM values? (3) How do different availability service fee calculation methods adjust the acceptable range of reasonable profit margin in VFM evaluation?
In order to solve the above problems, this research on the VFM quantitative evaluation of SCC as the research object uses a system dynamics (SDs) method, in which the VFM quantitative evaluation of SCC PPP projects and the whole life cycle dynamic mode of the VFM value are used as the criteria to construct an investment decision model for SCC PPP projects. Firstly, the data of relevant SCC projects in Anhui Province in the CPPCC are relatively complete, can meet some parameter data required in the SD model, and are conducive to the validation of this study. Therefore, this study takes the case data of the SCC projects in Anhui Province as an example to build a SD model for the quantitative evaluation of VFM. Secondly, by introducing the basic concept of VFM and the basic theory, the SD model is used to build a dynamic evaluation model of the PPP projects and explore key influencing factors for VFM quantitative evaluation, using the Vensim PLE 7.3.5 software to carry on the simulation experiments based on cases from Anhui Province, determine the key influencing factors in each stage of the whole life cycle and the influence mechanism of each system through sensitivity analysis, and simulate the results of different sensitivity effects to the VFM value. Thirdly, this paper also compared the sensitivity of the reasonable profit margin of investment under three different calculation methods in order to put forward some suggestions for SCC PPP projects in the future. The purpose of this research is to generally explore the impact of the key influencing factors on the VFM quantitative evaluation results, so as to standardize the scientific construction of PPP projects and promote the sustainable development of the SCC PPP investment model.

2. Literature Review
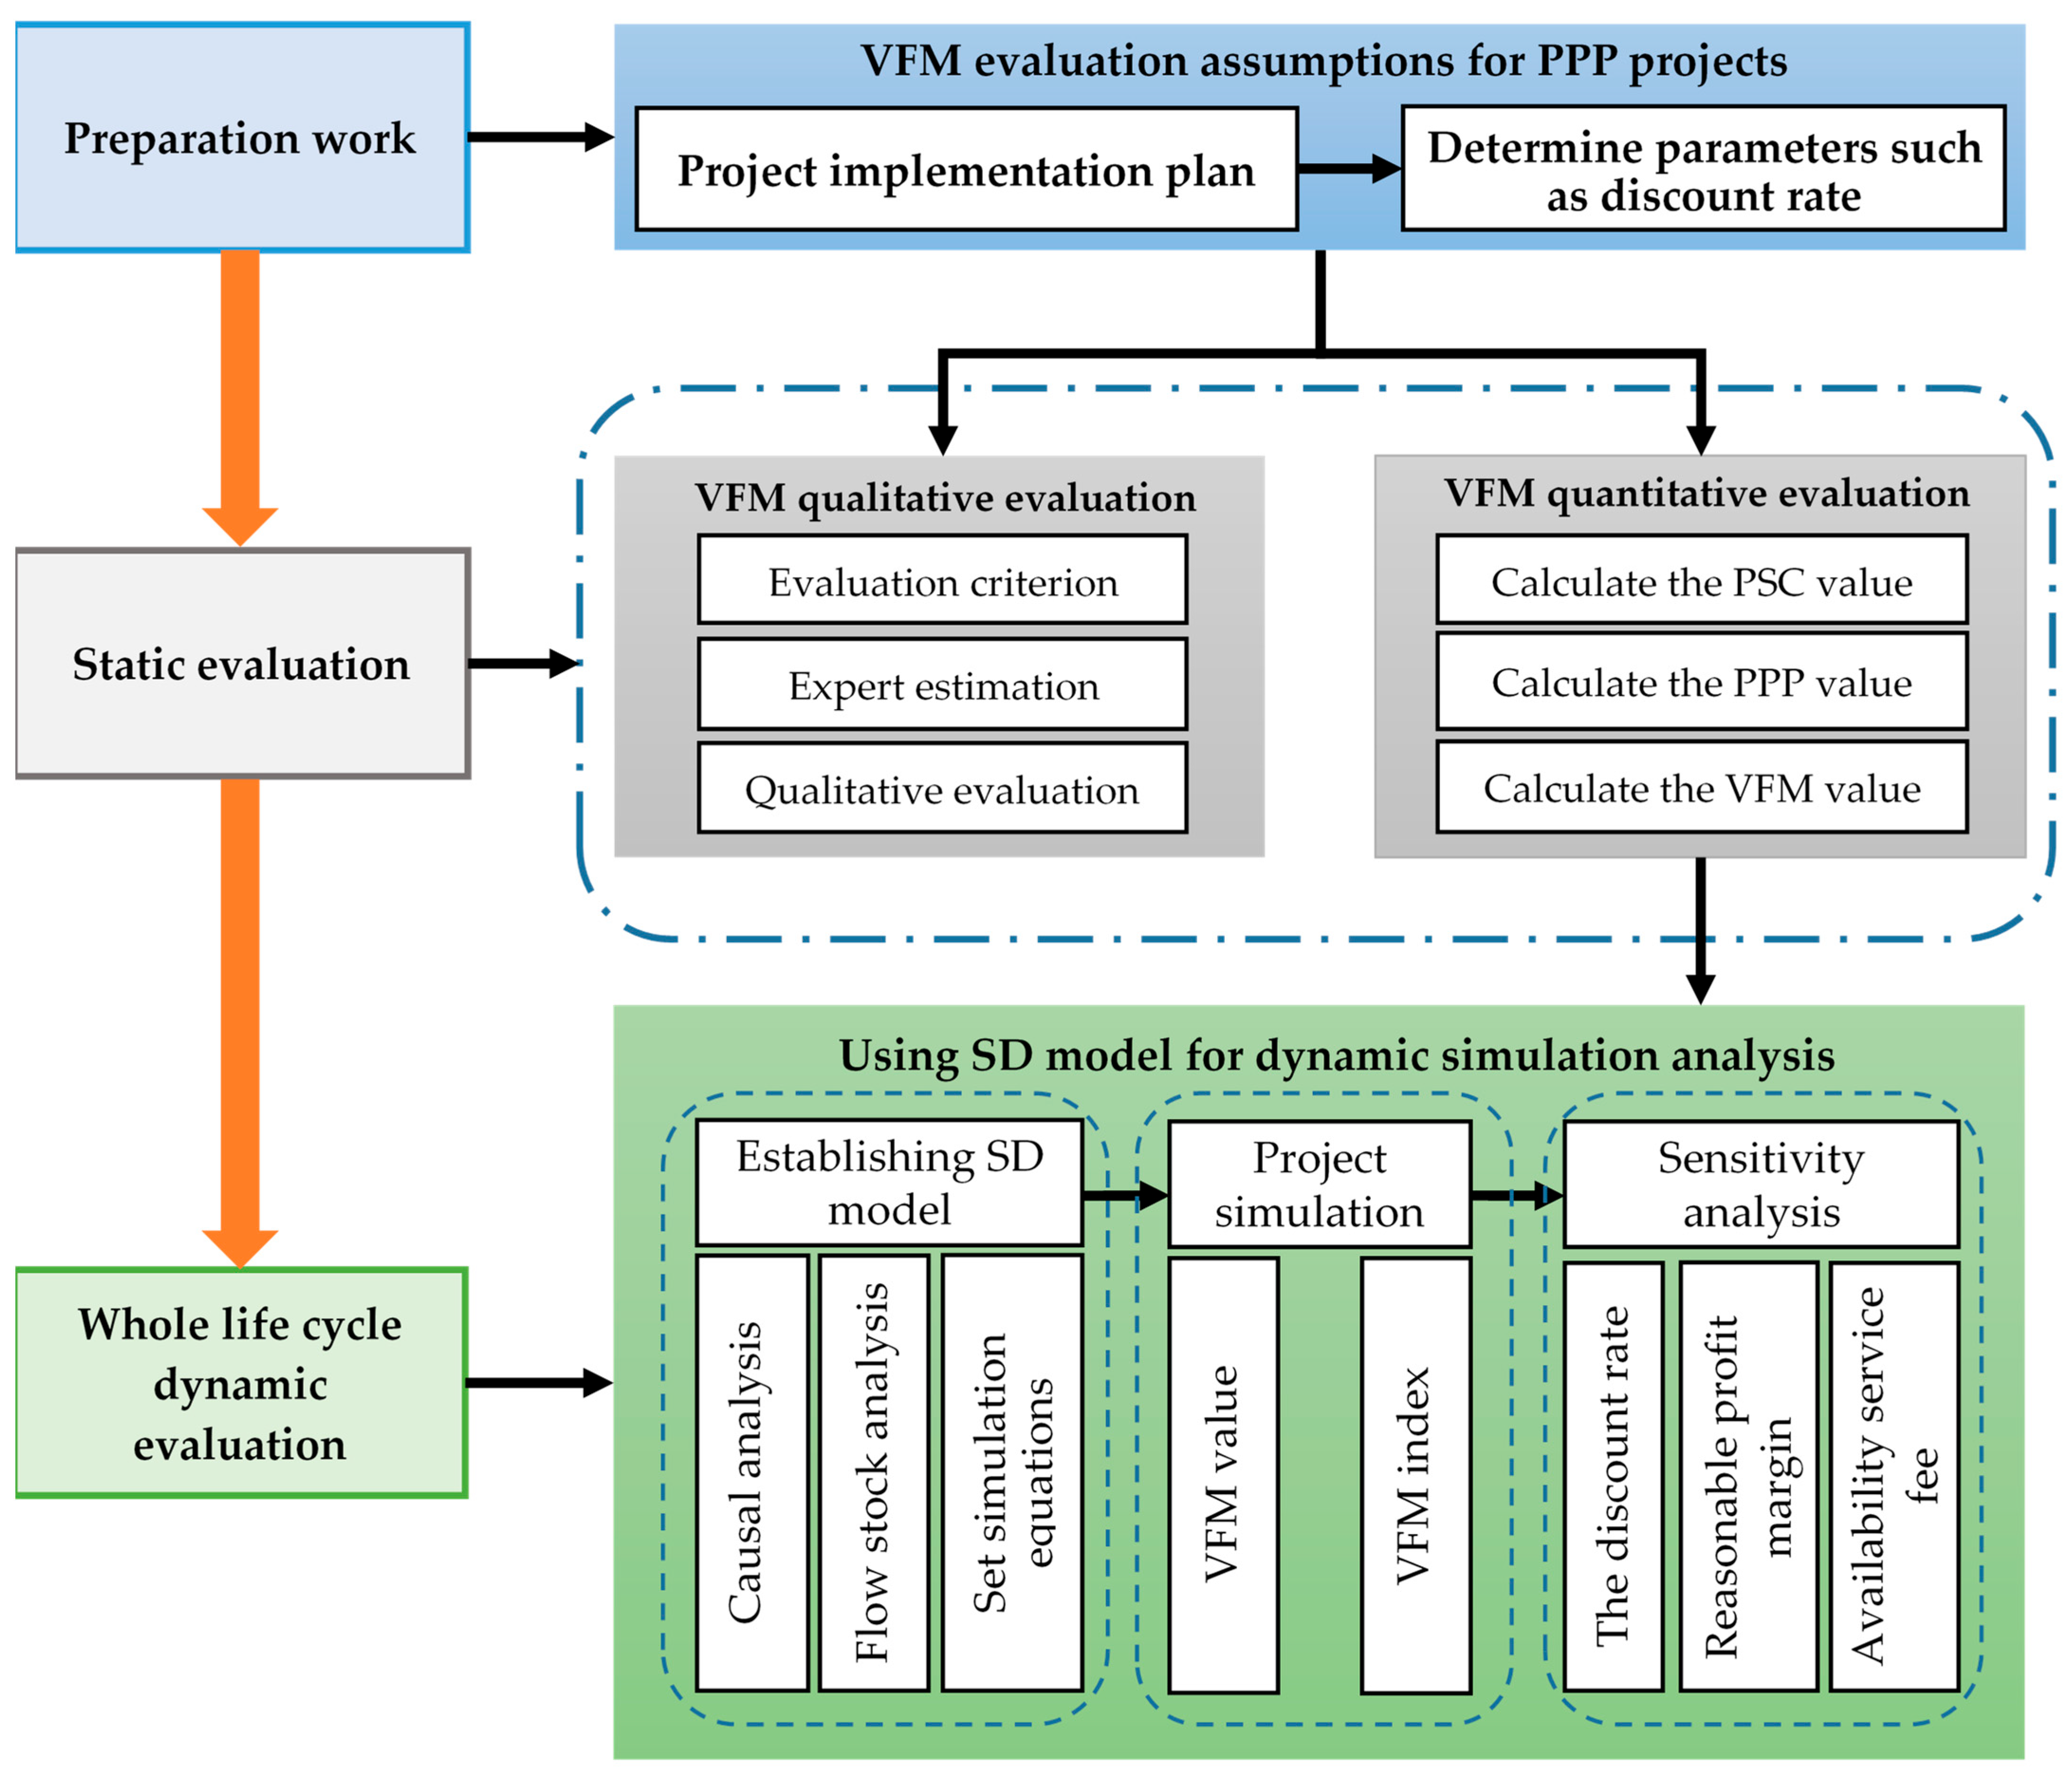
The current domestic and international research on VFM evaluation focuses on improvements in evaluation methods, the analysis of key impact elements of VFM evaluation, and the construction of VFM evaluation models for PPP projects in different fields.
(1) In the field of improvements in the VFM evaluation method, Boardman and Hellowell described how VFM analysis should be conducted, and compared the procurement route appraisal methodologies applied in a variety of jurisdictions with documented VFM procedures [15]. McKevitt and Davis have pointed out that the ambiguity and ethical controversies surrounding the concept of VFM have exacerbated its practical difficulties. Through literature analysis and survey research, a qualitative description of the conceptual framework of VFM has been provided [16]. However, it remains theoretical, lacking operational tools to quantify how parameters like discount rate reshape these boundaries. Christina and Gary established a framework for evaluating VFM across the dimensions of economy, effectiveness, efficiency, and equity in response to the limitations of the traditional economic evaluation [17]. Grimsey and Lewis provided an overview of VFM assessment in PPP, focusing in particular on the role played by the Public Sector Comparator (PSC), trying to put matters into a broader, comparative context by considering approaches to VFM tests in over twenty countries [18]. Zhang constructed a process and program for VFM evaluation within the period of the total life of the PPP project, and then the principle and the basic method of dynamic regulation were put forward [19]. The above studies mostly improved the VFM evaluation method from different perspectives, and considered less the dynamic evaluation from the perspective of the whole life cycle. Unlike static frameworks, the SD model for the VFM quantitative evaluation captures time-dependent interactions between fiscal parameters (e.g., discount rate) and risk allocation.
(2) In the field of analyzing the key factors affecting VFM evaluation, Almarri and Boussabaine investigated the contribution of the PPP critical success factors to VFM viability analysis and established the PPP critical success factors and VFM success criteria [20]. Cui et al. explored the potential interrelationships among VFM drivers via a questionnaire survey and structural equation modeling [21,22]. Based on British VFM evaluation, and combined with the current conditions in China, Lin and Wang broke down the PSC index into the PSC value, competition neutral adjustment, transfer of risk, and retention risk [23]. Maleka and Gundaliyab identified and evaluated perceptions of VFM factors affecting PPP projects and grouped these into three categories: financial implications, the expertise of the private sector, and contract efficiency using factor analysis [24]. Magalhães et al. performed a systematic literature review combining bibliometric analysis and content analysis to identify the critical success factors for PPP project management [25]. Opara explored the issues around the development, evaluation, and political contexts of VFM in infrastructure projects, and analyzed risk relationships and risk transfer mechanisms in PPP projects [26]. The above studies mostly discussed the factors affecting the success of PPP projects or VFM evaluation, and few studies paid attention to the impact of VFM’s own parameters on VFM evaluation results. This creates “Pseudo-PPP” projects that prioritize short-term fiscal relief over long-term sustainability.
(3) In the field of the VFM evaluation of PPP projects in different industries and countries, Jílek et al. introduced a new original methodology using a selection of qualitative and quantitative methods for evaluating investments based on the PSC and determinants of VFM in the Czech Republic [27]. Wibowo and Sundermeier conducted a novel method that considered the risk mitigation capability of the public and private sectors to evaluate VFM under the performance-based annuity scheme and assessed the VFM of an Indonesian public road [28]. Soomro and Zhang investigated the actions and decisions of private sector partners by evaluating 35 failed transportation PPP projects around the world, and finally evaluated a set of failure mechanisms initiated by private sector partners [29]. Moro Visconti et al. investigated the differences in what VFM means to the public and private sectors for healthcare infrastructure and analyzed the VFM quantitative key drivers with empirical evidence from an Italian Project Finance healthcare model [30,31]. Zhao et al. established a system dynamic model of VFM evaluation and calculated the VFM of a new industrial waste disposal PPP project in China [32]. Bi et al. utilized the public sector comparator method to make a VFM quantitative evaluation via an empirical study of a cultural and creative industrial park PPP project [33]. Based on research in the field of SCC PPP projects, Sang and Zhang established a VFM evaluation model to analyze the PSC value and PPP value of the SCC PPP project, and validated the feasibility of the VFM evaluation model in SCC through a case study of the Jinan Daming Lake Xinglong area [34]. Zhang et al. constructed a VFM quantitative evaluation SD model of an SCC PPP project and used a project in Tianjin for simulation [35]. Li and Zhao put forward the quantitative evaluation model of VFM in the whole life cycle and verified the practical feasibility of the model via the Xi’an XIAOZHAI SCC PPP project [36]. Based on the above studies, it can be found that existing VFM evaluation methods for PPP projects in different industries predominantly use static models, lacking dynamic life cycle analysis and sector-specific adaptability, especially for SCC PPP projects. It is still necessary to further enrich the dynamic evaluation method of VFM evaluation to observe the impact of changes in index values on evaluation results.
Based on the above literature research, it is found that, compared with VFM evaluation in other fields, there is little research on the quantitative VFM evaluation of SCC PPP projects in China, let alone on constructing a special whole life cycle VFM quantitative evaluation model. Firstly, although SCC PPP projects have certain similarities with other fields of PPP projects, SCC PPP projects are comprehensive, government payment-oriented, urban construction projects with long construction cycles, complex processes, and many influencing factors that are difficult to control. Therefore, it is necessary to establish a standardized evaluation process and an accurate calculation basis for the quantitative evaluation model of SCC to provide a scientific, objective, and accurate basis for judging whether the SCC project is suitable for the construction and operation of the PPP mode. Secondly, the discount rate, reasonable profit margin of investment, and availability service fee, etc., are important factors that affect the calculation of the net present value in the VFM evaluation [37,38,39]. Due to the lack of comprehensive regulations on the value of factors and the adjustment of human factors, the results can be modified artificially, which will seriously affect the objectivity of the quantitative evaluation results of VFM. The existing literature studies are basically a confirmatory analysis of the quantitative evaluation results of VFM based on the existing case data, and there are few exploratory studies on the degree of influence of the dynamic trends of the value changes in these factors on the VFM results. Therefore, the sensitivity analysis of the influencing factors based on the actual case can be used to obtain the change degree of the important influencing factors on the VFM results. Thirdly, existing VFM evaluation frameworks, particularly static models like the PSC, face critical limitations. These methods dominate China’s PPP practices but are prone to parameter manipulation (e.g., inflated discount rate) due to opaque evaluation processes, fostering “Pseudo-PPP” projects that prioritize short-term fiscal relief over long-term sustainability. Furthermore, PPP projects are inherently vulnerable to risks such as information asymmetry, where private partners exploit data gaps to secure favorable terms, and political pressures that distort financial parameter selection.
The authors tried to use the SD model to evaluate the VFM of the SCC PPP projects, which mainly focused on solving whether the VFM value of a single project meets the requirements in the whole life cycle. Some scholars have begun to attempt to use the SD model for PPP project evolutionary game analysis of participations [40], risk evolution, and diversification strategies [41]. The SD method for VFM evaluation addresses the shortcomings of the static evaluation frameworks by simulating the causal relationship between fiscal parameters (e.g., discount rate), risk, and other elements. It quantifies sensitivity thresholds and intuitively observes the evaluation results, critical for transparent, sustainable decision-making in SCC PPP projects. This methodology offers policymakers a robust tool to curb “Pseudo-PPP” projects, thereby curbing opportunistic behavior and aligning stakeholder incentives with long-term government spending target goals. The results show that the SD model has significant advantages over the traditional calculation method in calculating VFM values. Therefore, on the original basis, using relatively similar accession cases from the CPPPC, a whole life cycle VFM evaluation model for SCC projects is established to elaborate on the selection and determination methods of factors. This study pays more attention to the comparison and analysis of differences in the values and calculation methods of parameters such as the discount rate, investment profit margin, and other parameters, and simulates their impact on the VFM values of different PPP projects through the SD model to obtain some rules. In summary, the research on the VFM evaluation method and evaluation data makes it difficult to support SCC projects in practice, especially due to the lack of the quantitative evaluation of VFM from the perspective of the whole life cycle. Therefore, it is necessary to evaluate the data from PPP projects and analyze the VFM evaluation reports of the CPPPC. This will lead to being able to construct a VFM quantitative evaluation model of SCC PPP projects from the perspective of the whole life cycle, to standardize their sustainable development.

3. Methodology

3.1. Calculation of VFM

Existing VFM evaluation methods include cost–benefit analysis (CBA), real options analysis (ROA), and the PSC method. The PSC method was chosen due to its alignment with China’s PPP Value for Money Evaluation Guidelines and its widespread adoption in domestic PPP projects. Compared to CBA, the PSC framework provides a clearer cost comparison between traditional procurement and PPP models [42,43]. Unlike ROA, which requires extensive historical data, the PSC method is better suited to emerging fields like SCC PPP projects with limited data availability. Furthermore, the PSC method’s standardized workflow ensures compatibility with the CPPPC case database, enhancing data comparability. Therefore, the PSC method is the most widely used in the VFM quantitative evaluation of various PPP projects in China. Many scholars have studied and analyzed the PSC method in PPP projects such as underground composite pipe galleries [44], urban rail transit [45,46], road engineering [42,47,48], and public hospitals [30], and have achieved good application results [49]. This method is used to determine whether the use of the PPP model is sufficient to reduce the government’s input costs under the PPP model and the traditional government procurement model, by calculating the difference between the PSC value and the PPP value [50]. The PSC value is composed of the PSC benchmark value (PSC0), the competitive neutral adjustment value (AVc), and the total risk expenditure costs (Crisk) [50,51]. The PPP value is composed of the net present value of government equity investment costs (NPVgc), the net present value of government operating subsidy costs (NPVos), the net present value of government risks (NPVrisk), and the net present value of government other costs (NPVgoc) [32,52]. Through the above, the calculation formula of the VFM value can be obtained as follows.
PSC = PSC 0 + AV c + C risk
PPP = NPV gc + NPV os + NPV risk + NPV goc
V F M = P S C P P P
VFM   index = VFM PSC × 100 %
If VFM ≥ 0, it means that the PPP project realizes the VFM and is feasible. If VFM < 0, it means that the PPP project has not passed the VFM evaluation. The VFM index can also reflect the VFM degree of the PPP project from the other side. The greater the VFM value and the VFM index, the greater the value of the PPP mode replacing the traditional mode.

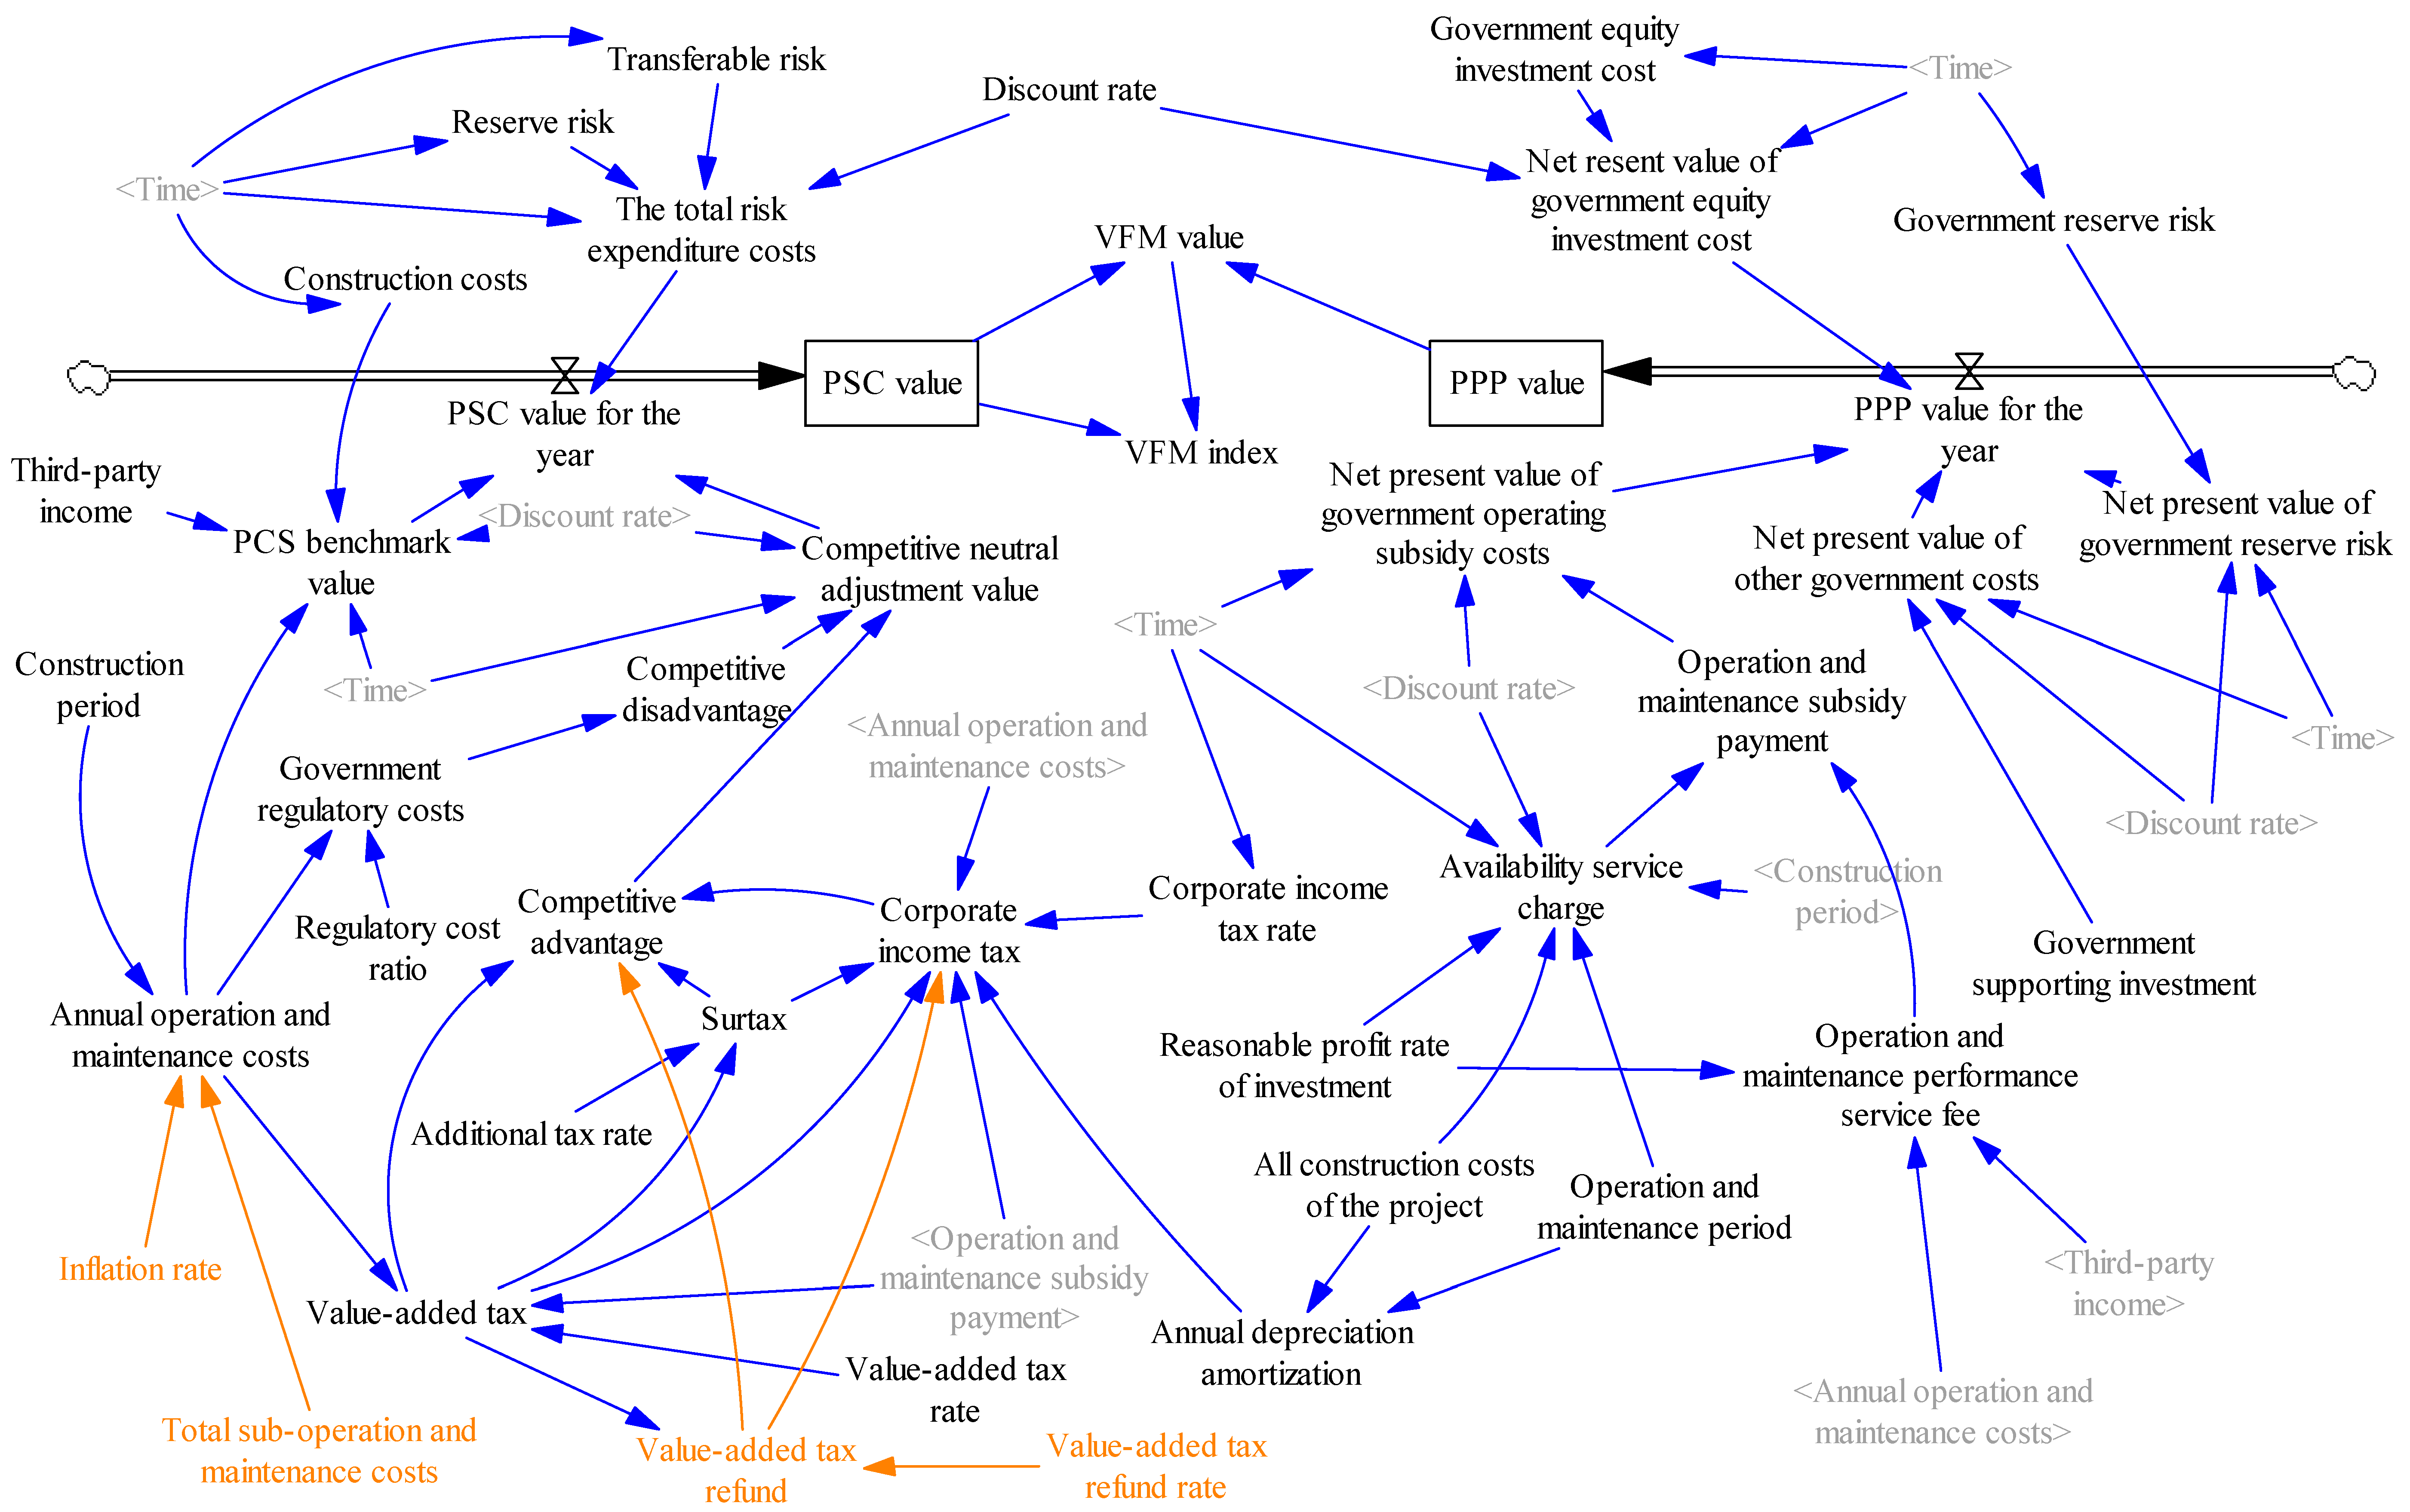
3.2. Simulation Method of VFM

The SD model enables the paths and key nodes between internal elements to be intuitively obtained and trends in influencing factors to be dynamically captured [53]. There have been many successful cases of applying the SD model for SCC or PPP projects to solve complex problems [54], e.g., waterlogging data of Tianjin in China, collected to analyze coupling mechanisms among waterlogging risk factors of urban drainage systems by using system dynamics theory and Vensim PLE software [55]. The sustainable urban water management in Ebbsfleet Garden City was investigated via a participatory process and potential sustainable solutions using an SD model [56]. A charge pricing model using the SD model for an electric vehicle charging infrastructure PPP project was developed based on charge pricing parameters, and an ongoing project in Anqing was selected to verify the applicability and effectiveness of the SD model [57]. The investment decision model for the wastewater treatment PPP project was created using the SD model [14]. The dynamic risk evaluation system in SCC was established by taking the actual PPP project data from the SD model [58]. The VFM quantitative evaluation of SCC PPP projects is affected by the mutual restriction and coordination of many factors, such as the discount rate, fees, and risk sharing. The SD model can be used to clarify the relationship between the key factors and their influencing laws more intuitively. Based on the above-mentioned VFM quantitative evaluation method, this paper used the SD model to analyze causality and sensitivity. The application process is shown in Figure 1.

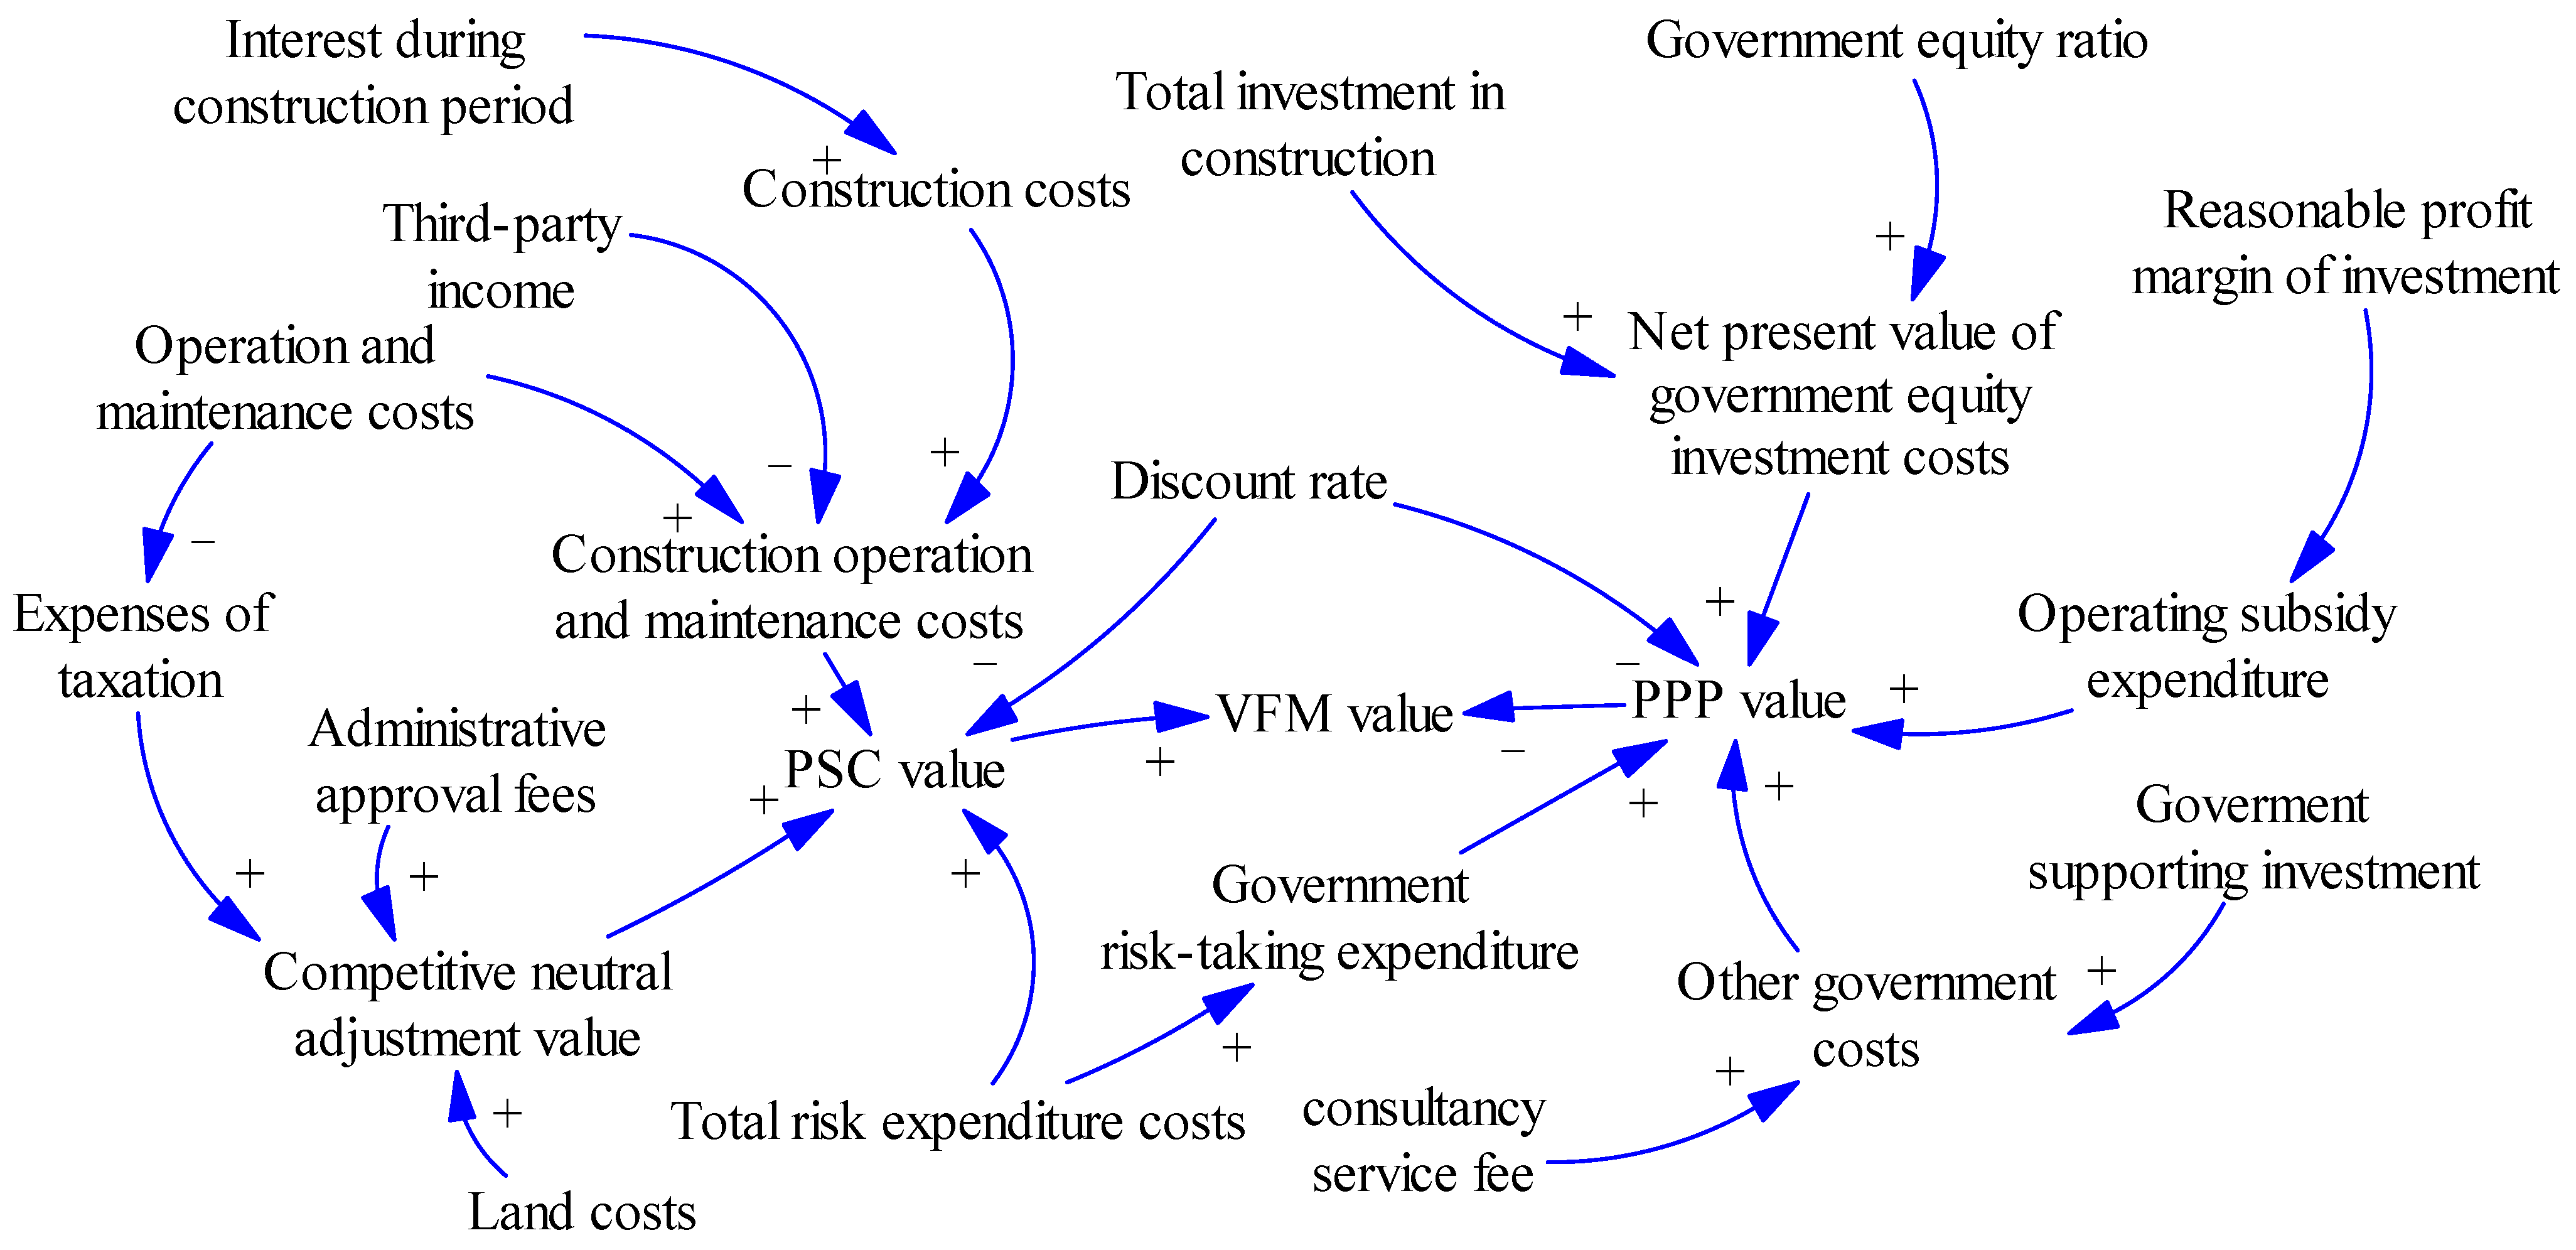
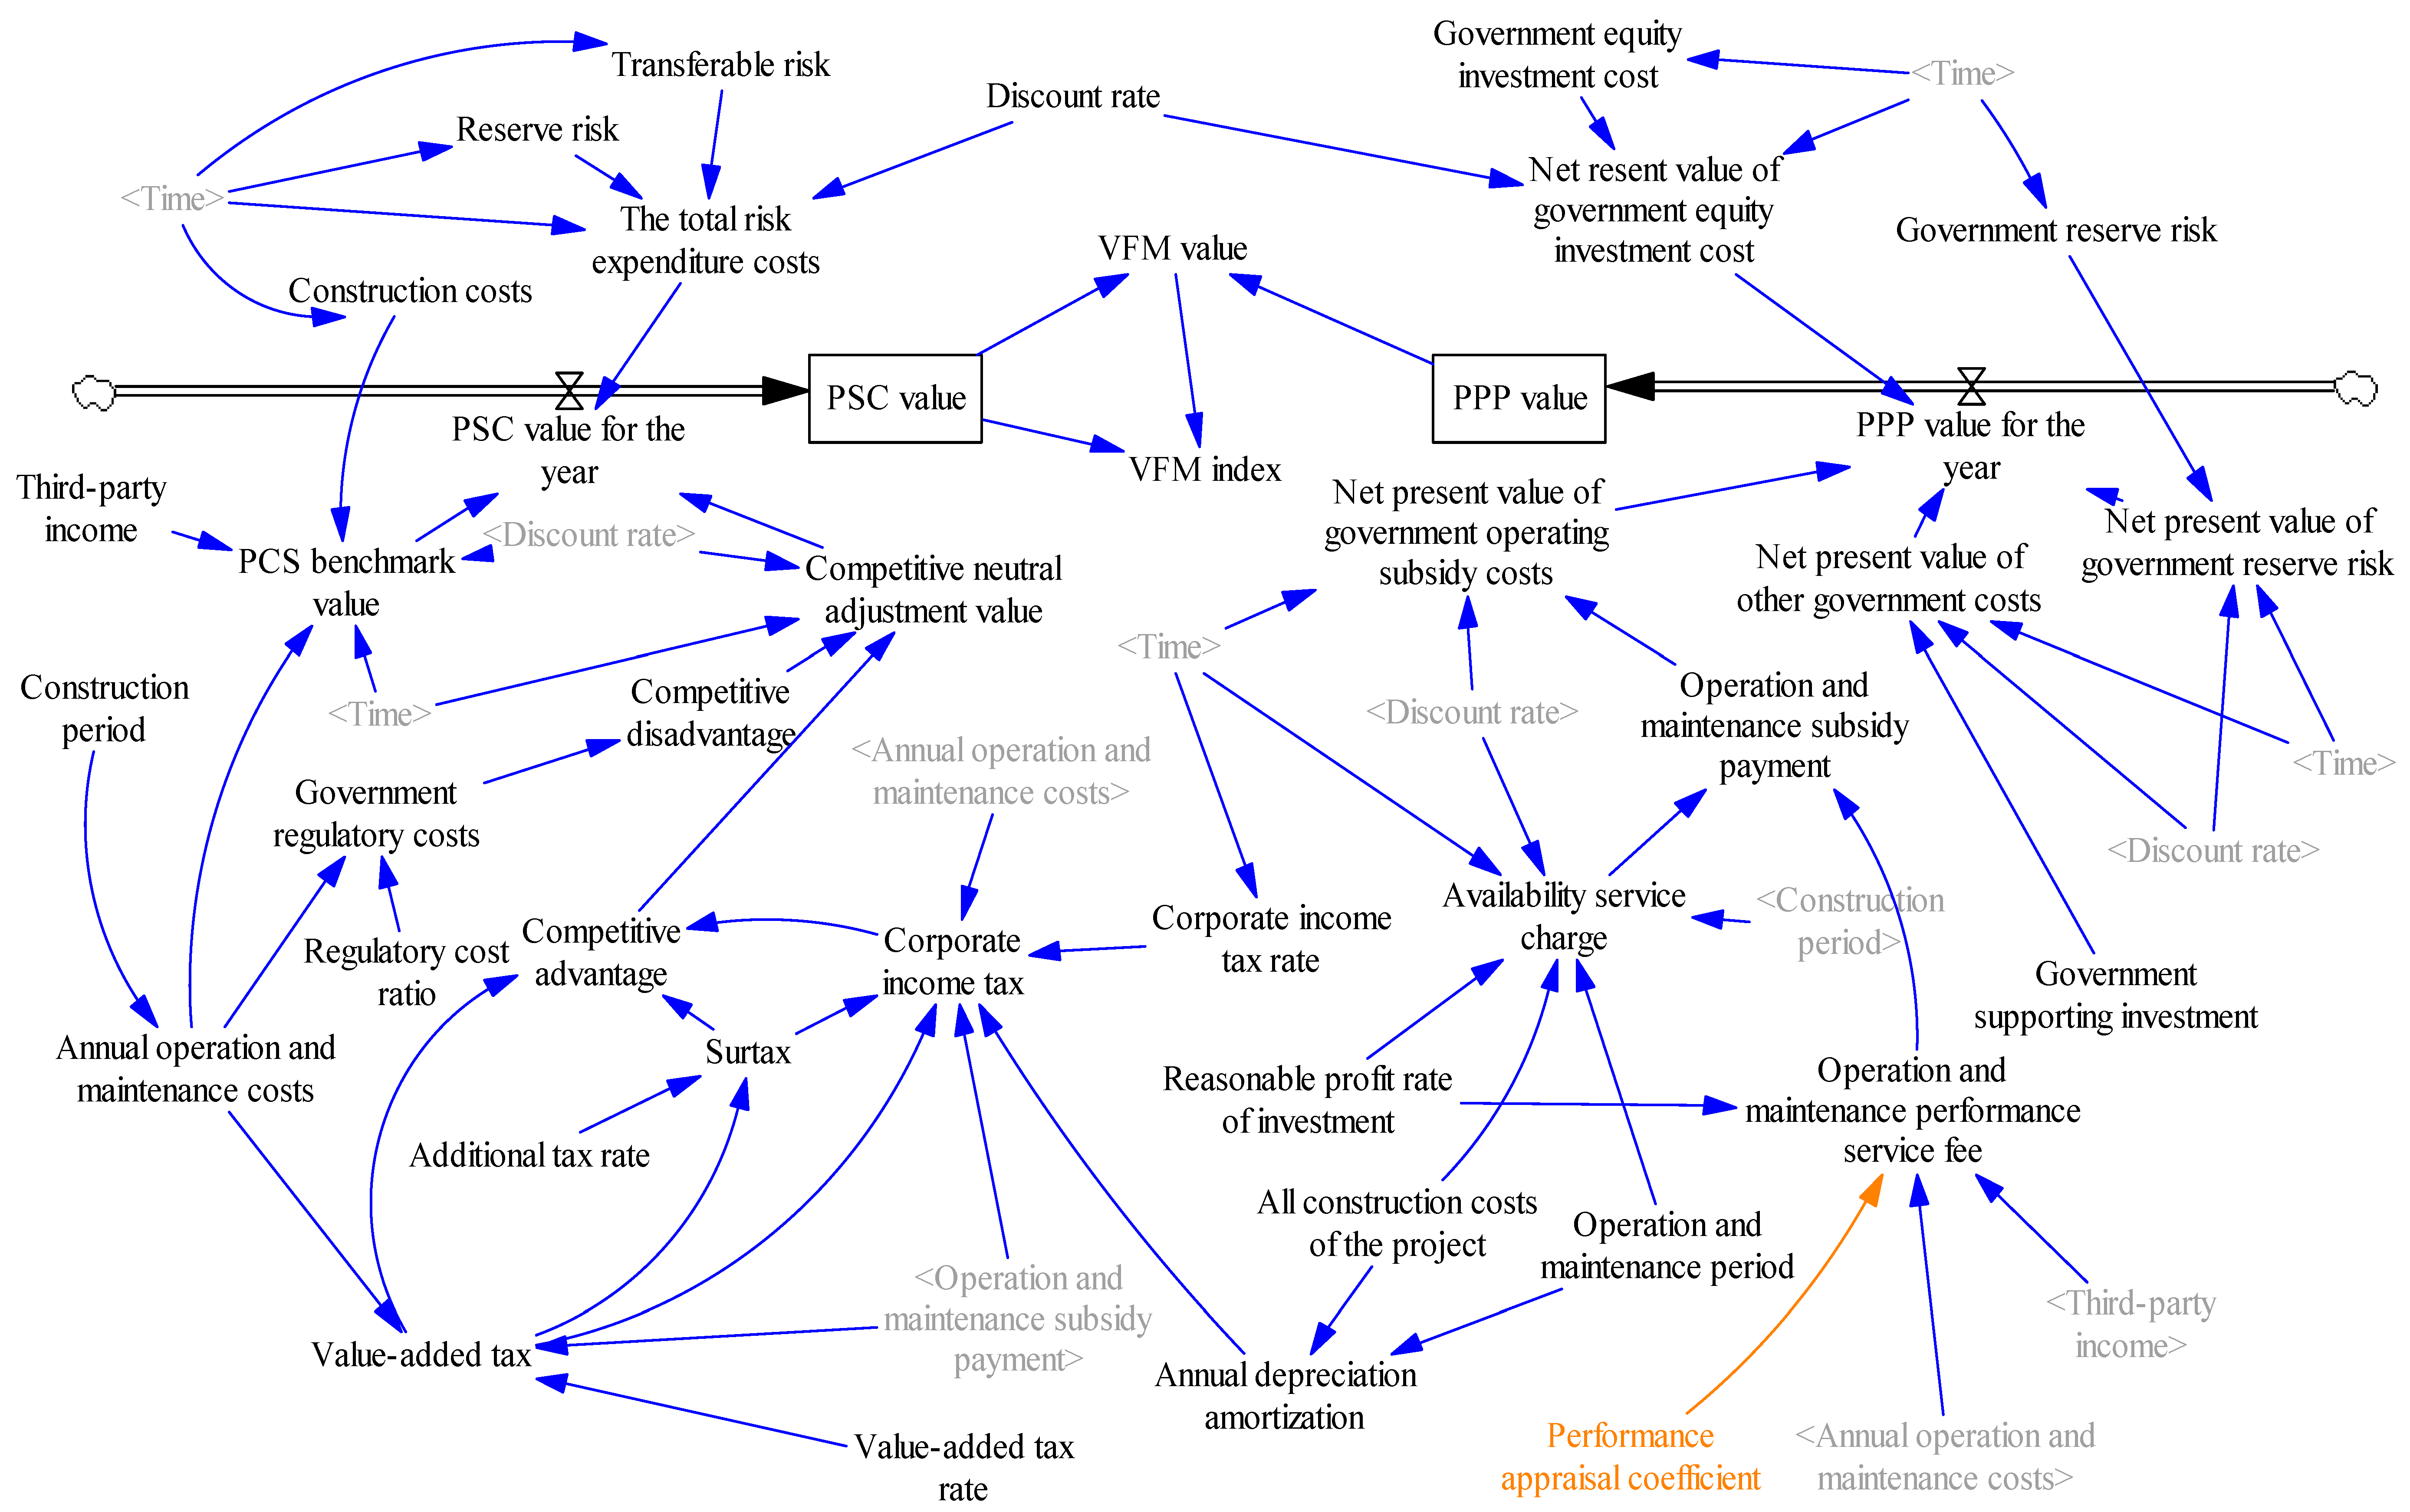
3.3. Construction System Causality of VFM

Based on the SD model, this paper analyzed the causality of VFM value calculation by using the Vensim PLE software to analyze the causality of the PSC and PPP values. A complete VFM value calculation causality diagram is shown in Figure 2 [32,35]. The SD model employs causal path mechanisms where (+) denotes positive paths and (−) denotes negative paths [14,32,56]. For example, an increase in the discount rate leads to a reduction in the PPP value. However, since VFM evaluation emphasizes achieving public goals at lower costs, the reduction in the PPP value may be interpreted as a decrease in the public sector’s risk exposure, thereby driving an increase in the VFM value. A rise in the reasonable profit margin demanded by the private sector incentivizes governments to increase operational subsidy expenditure to maintain project attractiveness. Yet, expanding subsidy scales directly consumes more public resources, weakening the cost-effectiveness ratio and ultimately causing the VFM value to decline.

3.4. Analysis of the Key Influencing Factors

According to the related research findings of previous scholars [15,17,18,20,51], the discount rate, reasonable profit margin of investment, availability service fee, and other factors have a great impact on the quantitative evaluation of VFM [24,35,36,48]. Moreover, the reasonable value range of these factors is not clearly specified in the “PPP Value for Money Evaluation Guidelines (Trial)”. Therefore, this article focused on the degree and trends of influence of these key factors on the VFM quantitative evaluation of PPP projects for SCC, to provide a theoretical basis and model reference for the scientific rationality of the quantitative evaluation and correctness of the indicator value in the later stage.

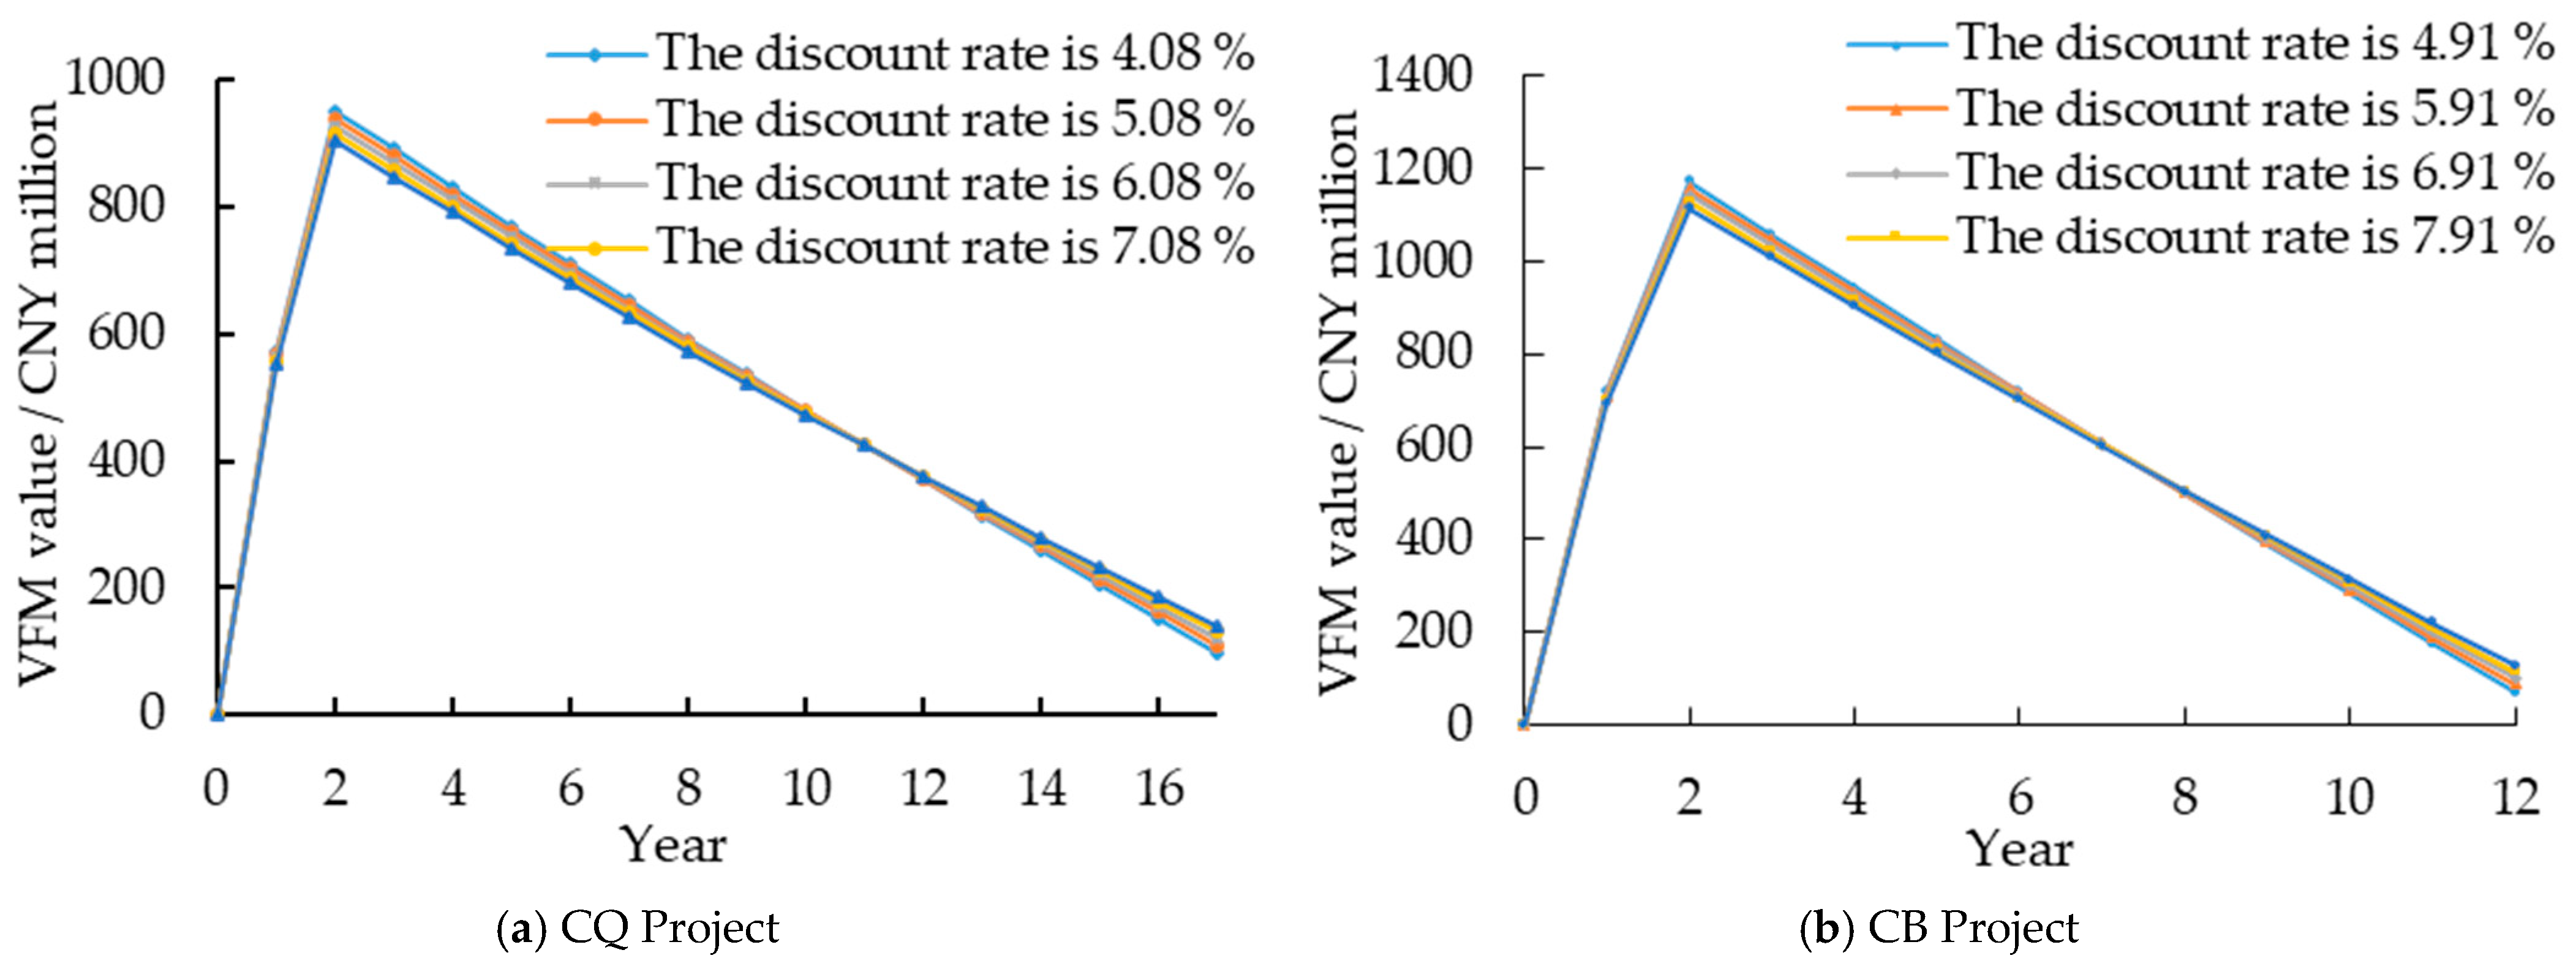
3.4.1. Discount Rate

The most important aspect of a PPP project for SCC is the value of time, that is, to lengthen the government’s spending years, thereby reducing the government’s huge investment in the short term. The cooperation period and discount rate are the main factors that affect the time value. The discount rate is the ratio of the expected future earnings discounted to the present value, which is the basis for calculating the VFM value by discounting the cash inflows and cash outflows of each year to the base date [59,60]. Therefore, the selection of the discount rate has a direct impact on whether the PPP project can pass the VFM quantitative evaluation and whether VFM has actually been achieved [61].

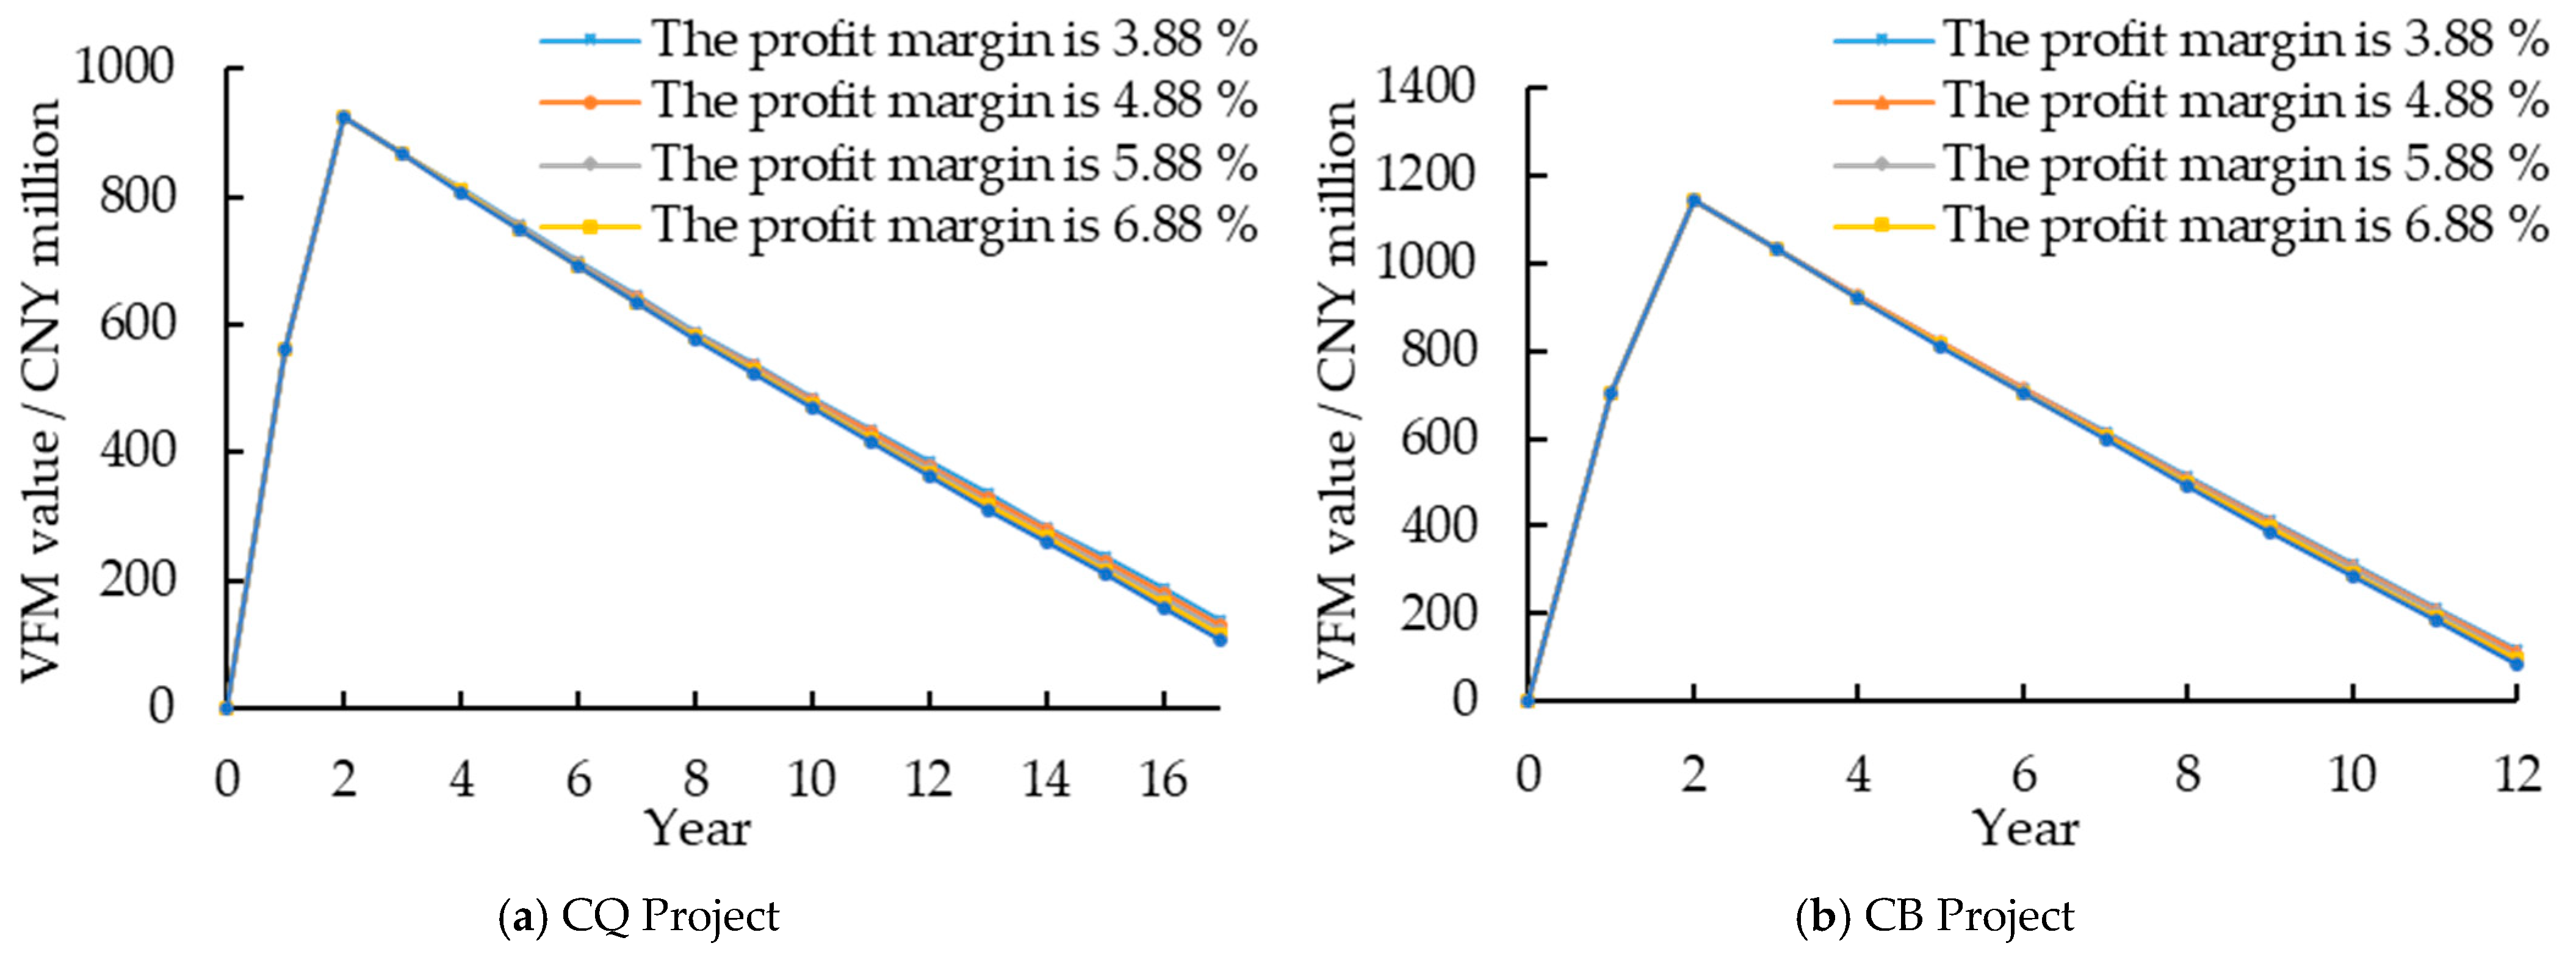
3.4.2. Reasonable Profit Margin of Investment

Most SCC PPP projects still have difficulty in meeting the conditions of relying entirely on user fees to generate revenue. Therefore, the main return mechanism of current SCC PPP projects is still the government payment model and the feasibility gap subsidy model. Availability service fees also become a major financial expense for the government sector. The reasonable profit margin of investment is the main factor in determining the availability of service fees [14]. It is mentioned in the Guidelines on Financial Affordability of Public–Private Partnership Projects (CJ (2015) No. 21) that the reasonable profit margin of investment should be determined by taking the level of medium and long-term loan interest rates of commercial banks as the benchmark, fully considering different scenarios of availability payment, usage payment, performance payment, risk, and other factors. Therefore, a wide range of variations can exist. If the setting value is too low, the project benefit is small, which is not conducive to attracting private capital participation, and if the setting value is too high, it will increase the financial subsidy pressure on the local government during operation [62].

3.4.3. Availability Service Fee

In the practice of the financial calculation of the availability service fee, the government generally chooses a third-party agency to assist. The availability service fee is the fee paid by the nail party (generally refers to the government or government-authorized department) for purchasing the availability of the PPP project from the special purpose vehicle (SPV). A third-party agency refers to third-party PPP professional institutions, i.e., PPP consulting companies (at present, none of the domestic PPP projects have clearly defined qualification requirements for PPP consulting services, resulting in the uneven professional capabilities of consulting services). It needs to provide intellectual support services related to PPP projects, including but not limited to construction, operation, finance, legal relationships, and other aspects of the business. The professional services of traditional engineering consulting institutions and PPP professional consulting institutions are very different. There are many different practices and disputes in the selection of financial calculation models and parameters, resulting in a lack of comparability of the calculation results. For the calculation method of the availability service fee in the government operating subsidy expenditure of the PPP model, there are three frequently used calculation models [14,63]: (1) the calculation model based on the “CJ (2015) No. 21”; (2) the calculation model based on the ordinary annuity method; and (3) the calculation model based on the average capital method. In the practice of PPP projects, the first step in measuring the operating subsidy expenditure is to choose a suitable financial measurement model for the availability service fee, which is the basis for the measurement.

4. Case Study

SCC PPP projects usually include municipal roads, urban water supply, drainage engineering, urban sewage treatment, urban black and odorous water body treatment, and other industrial projects. Central and local governments vigorously advocate for and support the application and implementation of the PPP model for infrastructure construction. However, the high-quality development of PPP projects needs to be supported by standardized VFM evaluation methods and indicators. Based on the VFM reports of typical SCC PPP projects in Anhui Province in the CPPPC, this paper conducted modeling and quantitative research using Vensim PLE software.

4.1. Case Overview

Based on the Project Management Database of the National PPP Information Platform of the CPPPC, a total of six SCC PPP projects with typical industry representativeness and full VFM evaluation reports in Anhui Province were selected. The quantitative evaluation calculation processes in the VFM reports of the FJ Project, FL Project, BD Project, and AI Project were relatively brief. In particular, the PPP value calculation process was not detailed in the calculation method or the calculated parameters data. It is also a common problem that those PPP projects have irregular VFM evaluation reports, which makes it difficult to truly implement PPP projects and achieve VFM in the later stage. The VFM reports of the CQ Project and CB Project were compiled by the same consulting company and had many similarities. The process of calculating the data for each component of these two PPP projects was illustrated in relevant tables, which were useful for assessment and reference by the government and other relevant parties. However, the same consulting firm may choose to use different values for the same parameter when preparing VFM reports for different projects. For example, the inflation rate and discount rate for the CQ Project and CB Project were different. The key parameters and calculation results of the VFM value calculation of the above six PPP projects are listed in Table 1.
The relationship between the VFM value, VFM index, and the total investment amount is shown in Figure 3. The total investment amount of a PPP project is generally positively correlated with the VFM value and the VFM index. If the total investment in PPP projects is higher, there may be a slight change in the key influencing factors, which may have a greater impact on the VFM results, resulting in excessive government payments or difficulty for private capital to make profits. Therefore, we need to observe the influencing laws of key factors that affect the differences in VFM evaluation results. In addition, the authors note that the AI Project and the BD Project started construction on similar dates, with a small investment scale and a VFM index of less than 1%. When the VFM index is small, there is a high risk that the VFM value will become negative when the parameter value changes slightly during the quantitative evaluation of VFM; as a result, the PPP project cannot pass the quantitative evaluation of VFM. Therefore, we have more reason to question the possibility of the existence of “Pseudo-PPP projects” at the beginning of the rise and burst of the PPP mode; in other words, there are some outstanding problems exposed in the quantitative evaluation process of the existing VFM reports of some SCC PPP projects in Anhui Province: (1) the VFM report is not standardized, (2) the description of parameter values is not detailed, and (3) the calculation process is abbreviated. Therefore, there is a possibility of adjusting the parameter values to make the project pass the VFM evaluation. This is the reason why a sensitivity analysis should be conducted. Based on this, it is very important to have a good mathematical model that can study the change in the VFM values affected by key parameters.

4.2. Data Collection

The VFM quantitative evaluation process announced by the CQ Project and CB Project is relatively clear, but the data disclosure and calculation processes of the other four PPP projects are less so, making it difficult to model quantitative research using the Vensim PLE software. Therefore, this study mainly analyzed the stock flow and key influencing factors of the quantitative evaluation of VFM of the two SCC PPP projects in Chizhou. The main data required for the SD model in the VFM quantitative evaluation of the two PPP projects are shown in Table 2.

4.3. Case Simulation

The stock flow diagrams and simulation equations for the CQ Project and CB Project are roughly the same, but also different. For example, the risk calculation of the two projects was input via the table function of the data in the original scheme. In the estimation of the inflation rate, the CQ Project takes the inflation rate into account in the estimation of the annual operation and maintenance costs, while the CB Project only estimated the inflation rate as a transferable risk. In the estimation of the competitive neutral adjustment value, the CQ Project clearly stated that the preferential policies of “Three Exemptions and Three Halvings” were considered in the collection of corporate income tax, while the tax estimation of the CB Project did not mention any preferential policies. After quantifying each variable according to the relevant calculation rules, the stock flow diagrams of the CQ Project and CB Project were obtained, as shown in Figure 4 and Figure 5. The simulation equations of important parameters in the software are set as follows [35]:
  • PSC value in the current year = PSC benchmark value + total risk expenditure + competitive neutral adjustment value;
  • PSC benchmark value = (construction cost + annual operation and maintenance cost − third-party income)/POWER (discount rate + 1, Time + 1);
  • Annual operation and maintenance cost = STEP ((PPP projects) × POWER (1 + inflation rate, Time construction period), construction period);
  • Competitive neutral adjustment value = (competitive advantage competitive disadvantage)/POWER (1 + discount rate, Time + 1);
  • Corporate income tax = IF THEN ELSE (operating subsidy payment + VAT refund − VAT − annual depreciation and amortization – annual operation and maintenance cost – surtax > 0, (operating subsidy payment + VAT refund – VAT – annual depreciation and amortization – annual operation and maintenance cost – surtax) × corporate income tax rate, 0);
  • Total risk expenditure = (reserved risk + transferable risk)/POWER (1 + discount rate, Time + 1);
  • PPP value in the current year = government retained risk present value + government other cost present value + government equity investment present value + operation subsidy present value;
  • Present value of government equity investment = government equity investment/POWER (1 + discount rate, Time + 1);
  • Availability service fee = STEP (total construction cost of the project × (1 + reasonable profit rate of investment) × POWER (1 + discount rate, Time – 1)/transportation and nutrition protection period, construction period). (The calculation of availability service fee refers to the calculation method in the Guidelines for Demonstration of Financial Affordability of Government and Social Capital Cooperation Projects ([2015] No. 21) issued by the Ministry of Finance.);
  • Operation and maintenance performance service fee = annual operation and maintenance cost × (1 + reasonable profit margin of investment) × performance appraisal coefficient – third-party income;
  • Present value of government retained risk = government retained risk cost/POWER (1 + discount rate, Time + 1);
  • Present value of other government costs = government supporting investment/POWER (1 + discount rate, Time).
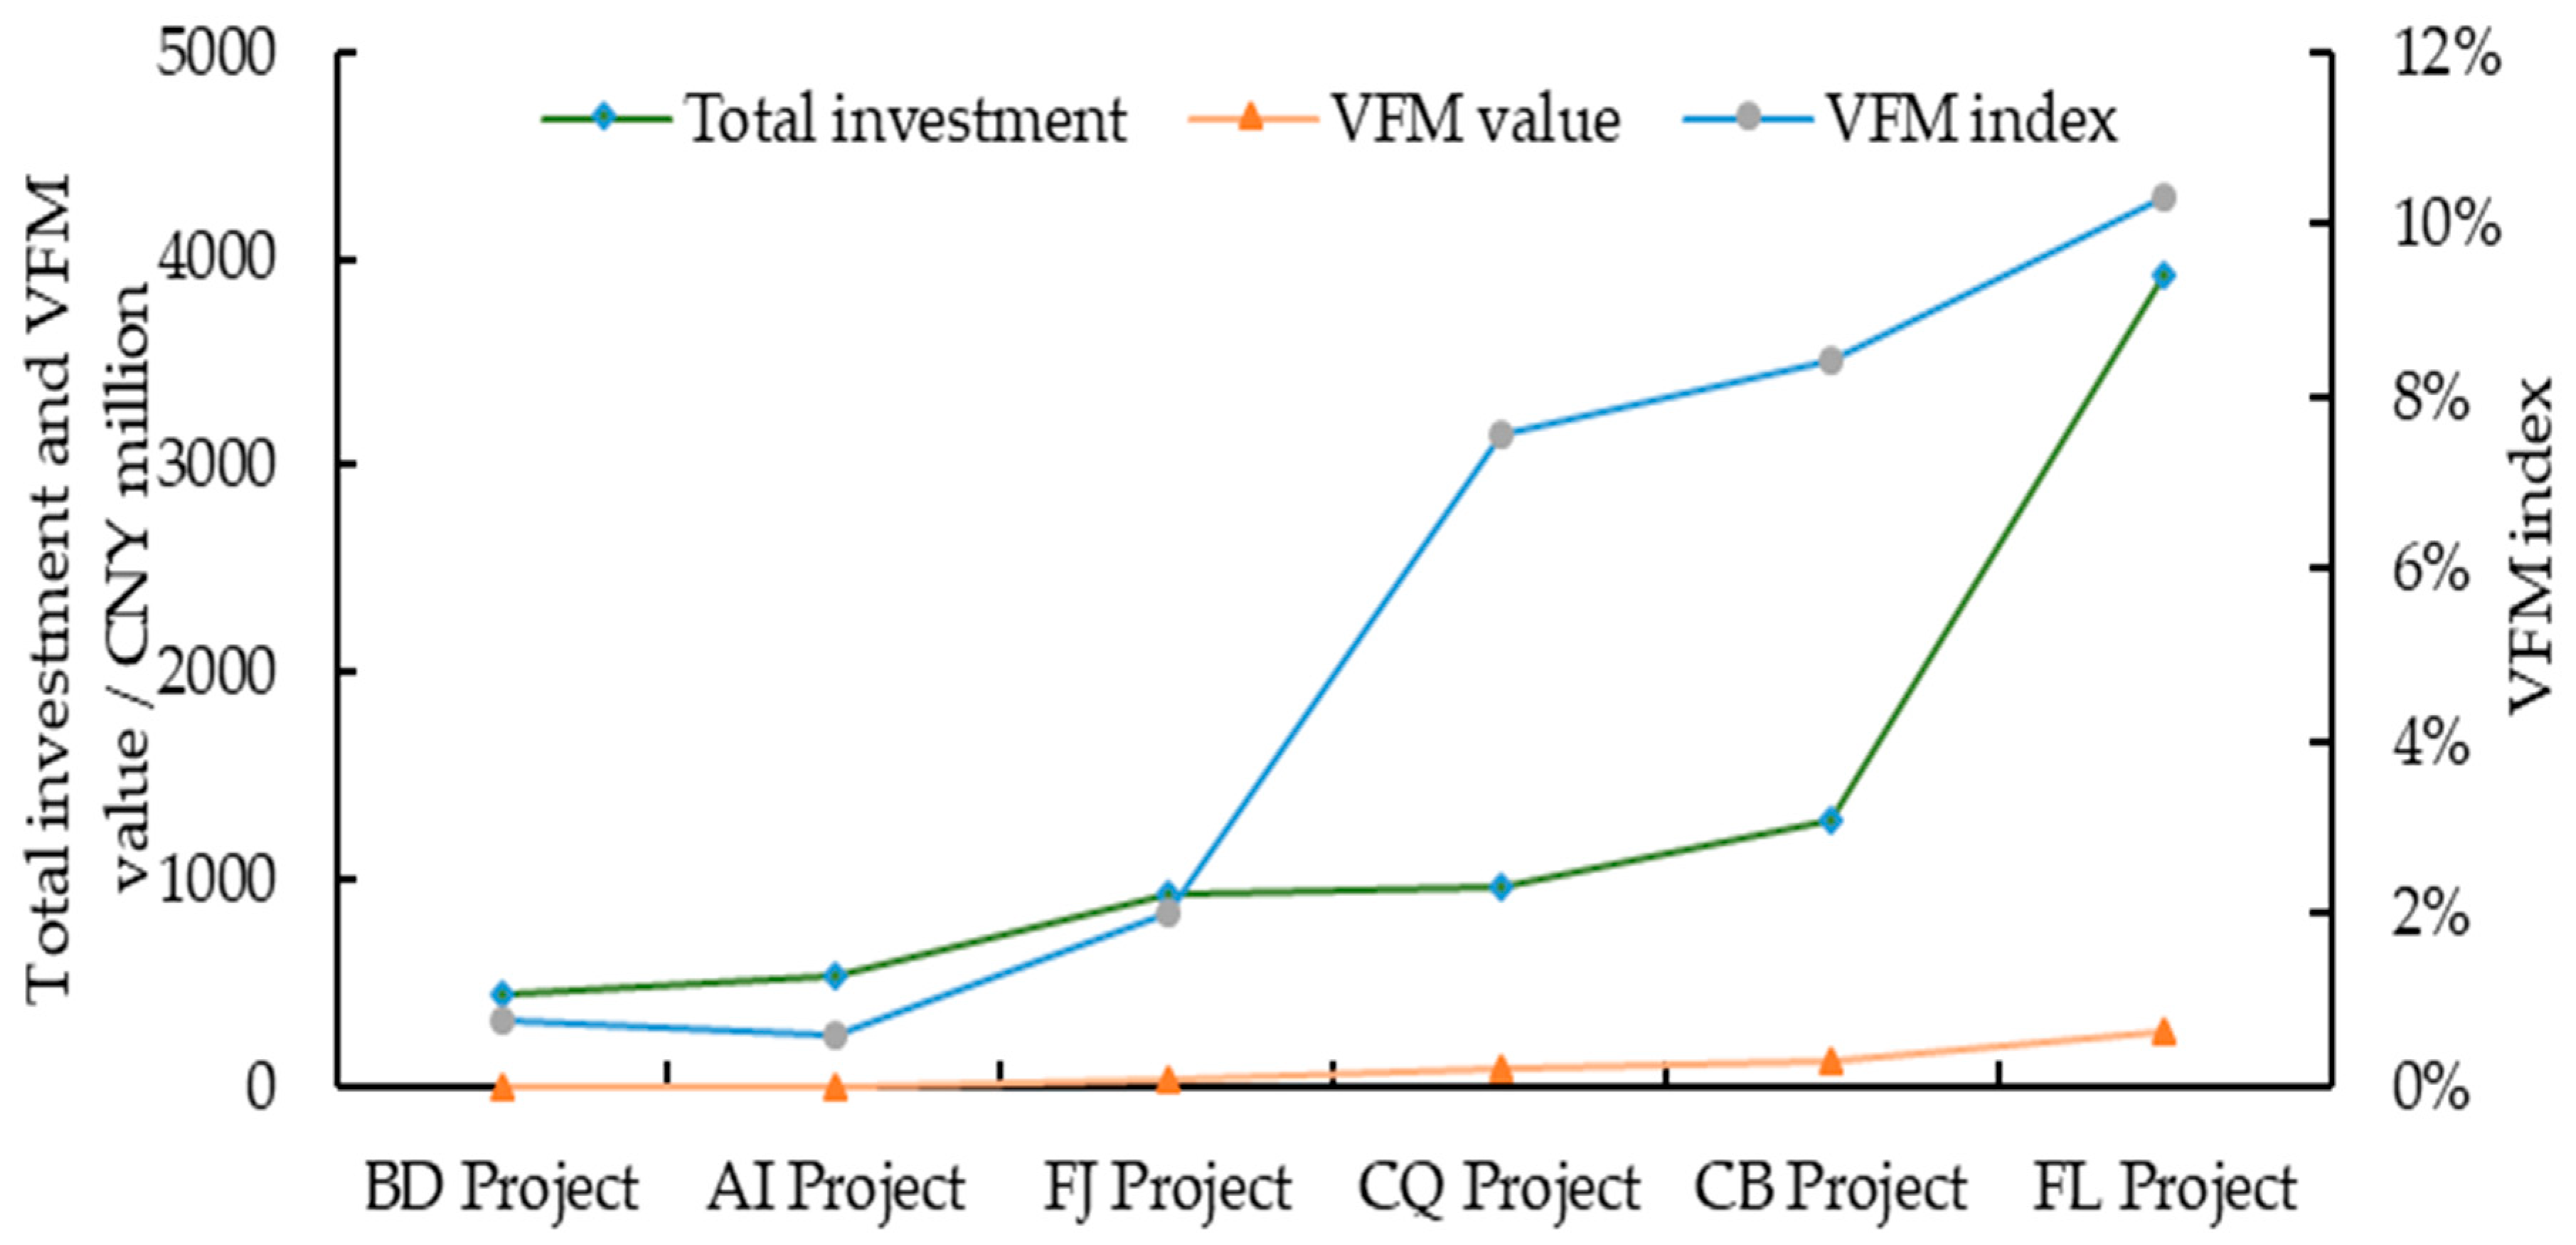
5. Results

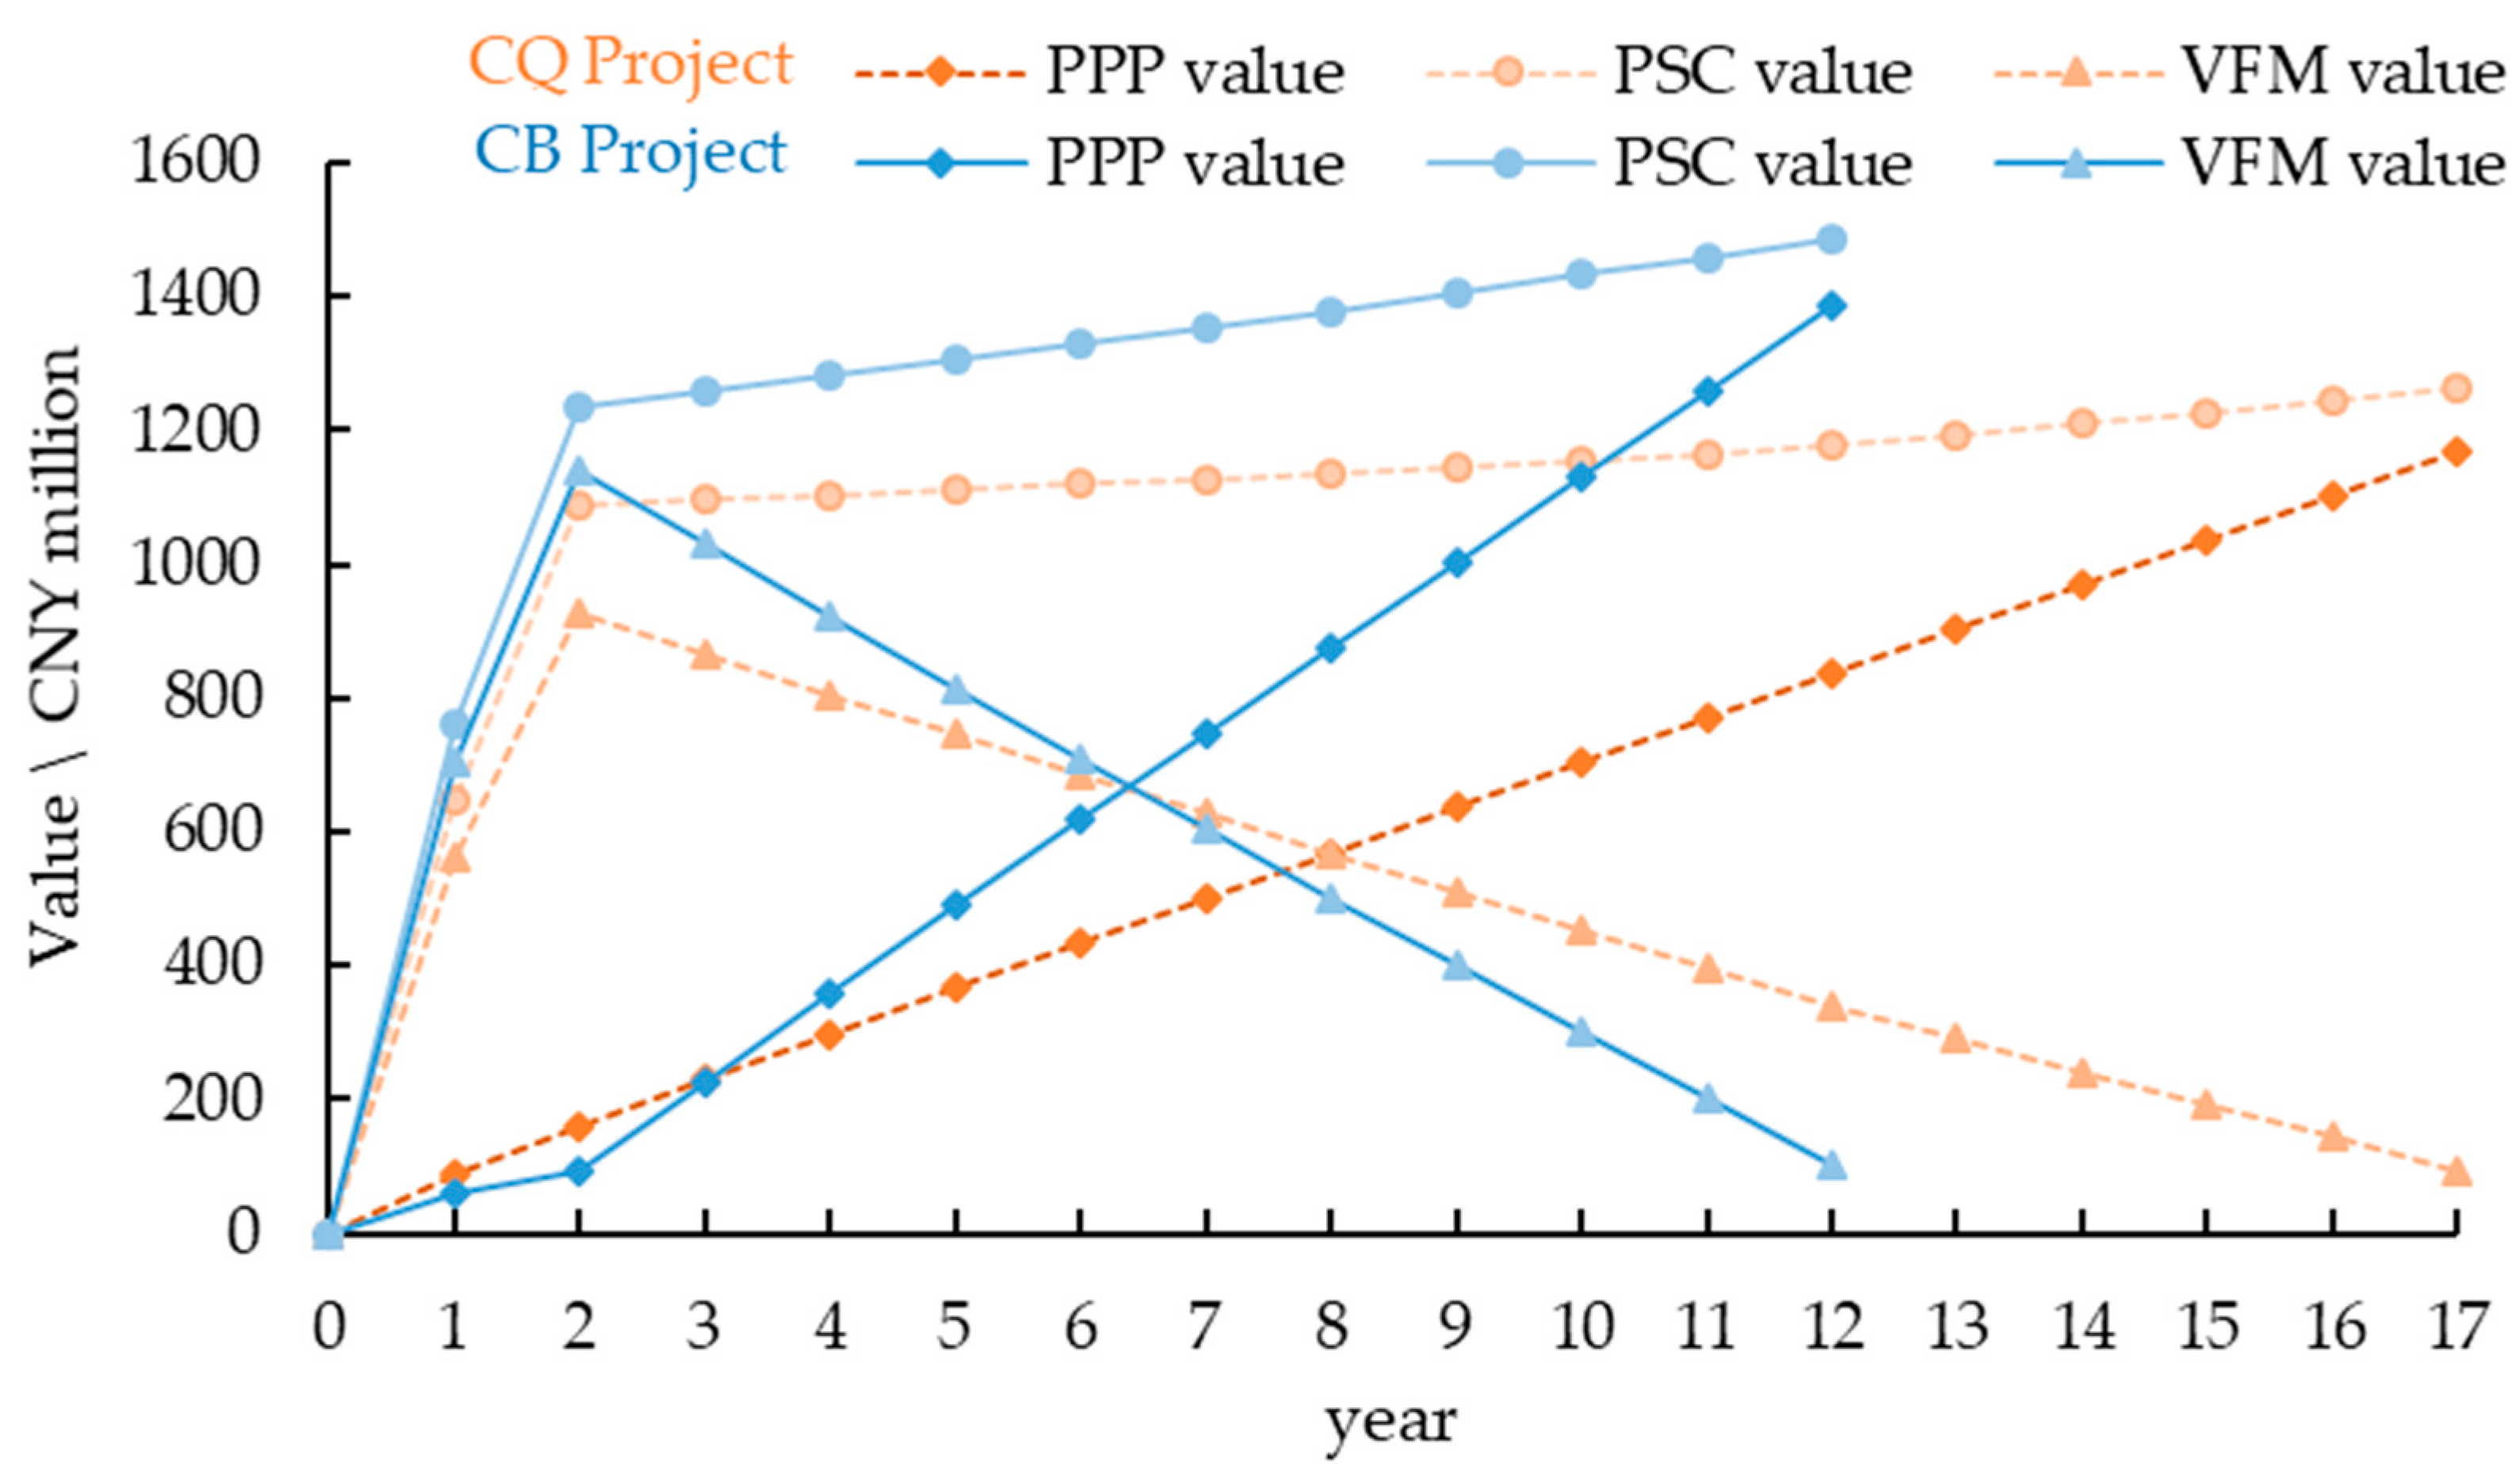
5.1. General Findings

The VFM value of the CQ Project at the end of 17 years obtained via software simulation is CNY 121.698 million, and the VFM index is 9.44%. Compared with the VFM value (CNY 95.338 9 million) and VFM index (7.55%) in the original VFM report, the model simulation results are too large. The main reason is that the calculation process of the competitive advantage part of the original VFM report is unclear, and there may be unknown tax incentives. If the competitive advantage part is input with the original plan value via the table function, the VFM value is CNY 94.935 million and the VFM index is 7.52%. These results are very close to the original scheme, within an acceptable error range. The VFM value of the CB Project at the end of 12 years, obtained via software simulation, is CNY 102.282 million, and the VFM index is 6.87%. Compared with the VFM value (CNY 126.5352 million) and VFM index (8.42%) in the original VFM report, the value of the simulation results is small. The main reason is that the reasonable profit margin of investment is assumed to be 5.88%, so the calculated annual government payment value is too large in the calculation process of the availability service fee. Furthermore, there is also the issue of different tax calculations in the competitive advantage calculation process. If the competitive advantage part and availability service fee are input with the original plan value via the table function, the obtained VFM value is CNY 127.804 million and the VFM index is 8.5%. These results are very close to the original scheme, within an acceptable error range. Therefore, the SD calculation model of the CQ Project and CB Project is reliable. The change trends in the PSC, PPP, and VFM values simulated by the Vensim PLE software are shown in Figure 6.
It can be seen from Figure 6 that both the PSC and PPP values increase with the extension of the cooperation period in the whole life cycle. During the construction period, the PSC value increases rapidly with the annual construction cost investment, while the PPP value increases slowly with the government equity investment. The VFM value at this stage reaches the maximum at the end of the construction period with the extension of the cooperation period. The increase in the PSC value is much smaller than in the PPP value during the operation period, which makes the VFM value gradually decrease with the extension of the cooperation period; it reaches the minimum value at the end of the operation period. The VFM value in the whole life cycle is greater than 0, i.e., the use of the PPP model saves the present value of government funds. Therefore, the two PPP projects passed the quantitative evaluation of VFM.

5.2. Sensitivity Effects

5.2.1. Sensitivity Effects of Discount Rate

The initial discount rate of the CQ Project is 6.08%, and the initial discount rate of the CB Project is 6.91%. The simulation was carried out after adjusting according to the interval of 1%. The changing trends of the VFM values are shown in Figure 7.
It can be seen from Figure 7 that, when the discount rate is adjusted from small to large, the VFM value increases at the end of the operation period. A longer time from the discount point leads to a smaller discount value of cash flow. This means that when the discount rate increases, although both the PSC and PPP values decrease, the PPP value decreases more than the PSC value, causing the VFM value to increase. Therefore, the PPP value is more sensitive to the discount rate in the calculation process. The operating cycle of the CB Project is 5 years longer than that of the CQ Project, so the CQ Project is more sensitive to discount rates than the CB Project.

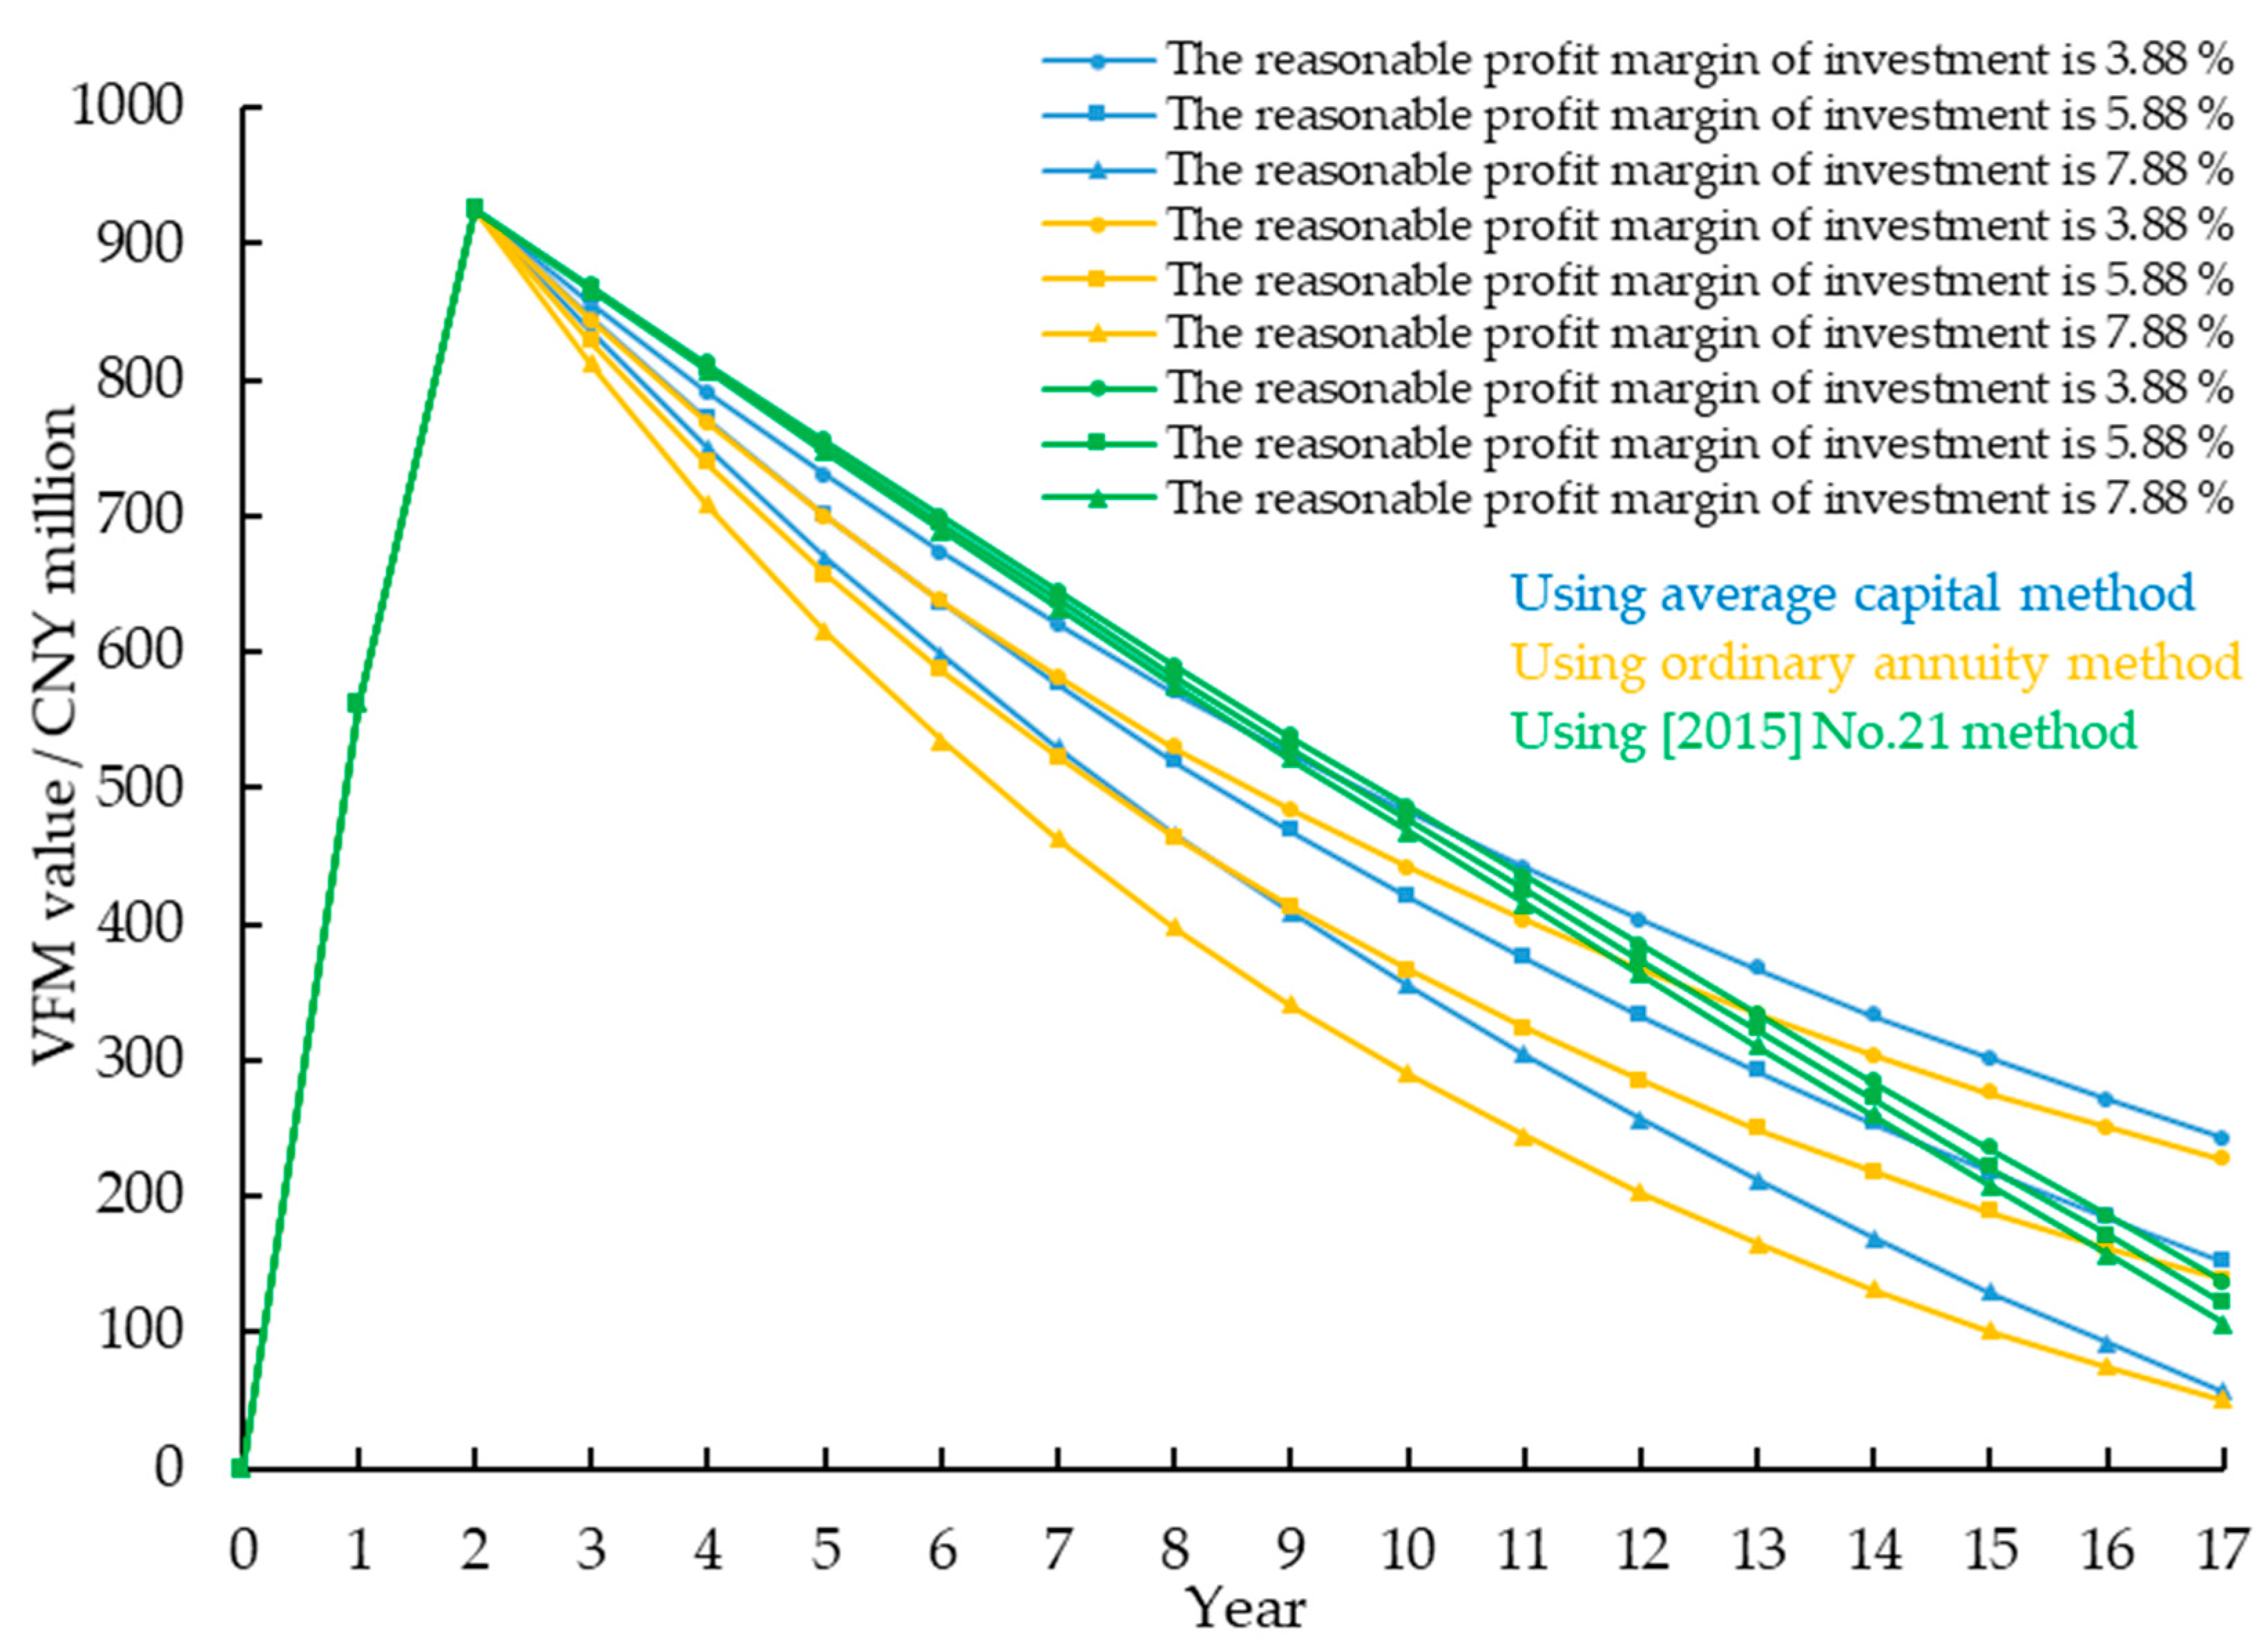
5.2.2. Sensitivity Effects of Reasonable Profit Margin of Investment

The reasonable profit margin of investment for the CQ Project and CB Project is 5.88%. The simulation was carried out after adjusting the interval according to 1%, and the changing trends of the VFM values for the two projects are shown in Figure 8 under the five conditions.
It can be seen from Figure 8 that the reasonable profit margin is more sensitive to the VFM value, and that it decreases with the increase in the reasonable profit margin. When the reasonable profit margin of the two PPP projects was adjusted from 3.88% to 7.88%, the VFM value of the CQ Project dropped from CNY 136.965 million to CNY 106.432 million, and the VFM value of the CB Project dropped from CNY 119.246 million to CNY 85.3183 million. The pressure on government operating subsidies for both projects increased significantly at this time, and the VFM values were at their minimum. The CQ Project has a longer operating cycle and is more sensitive to the reasonable profit margins of investment.

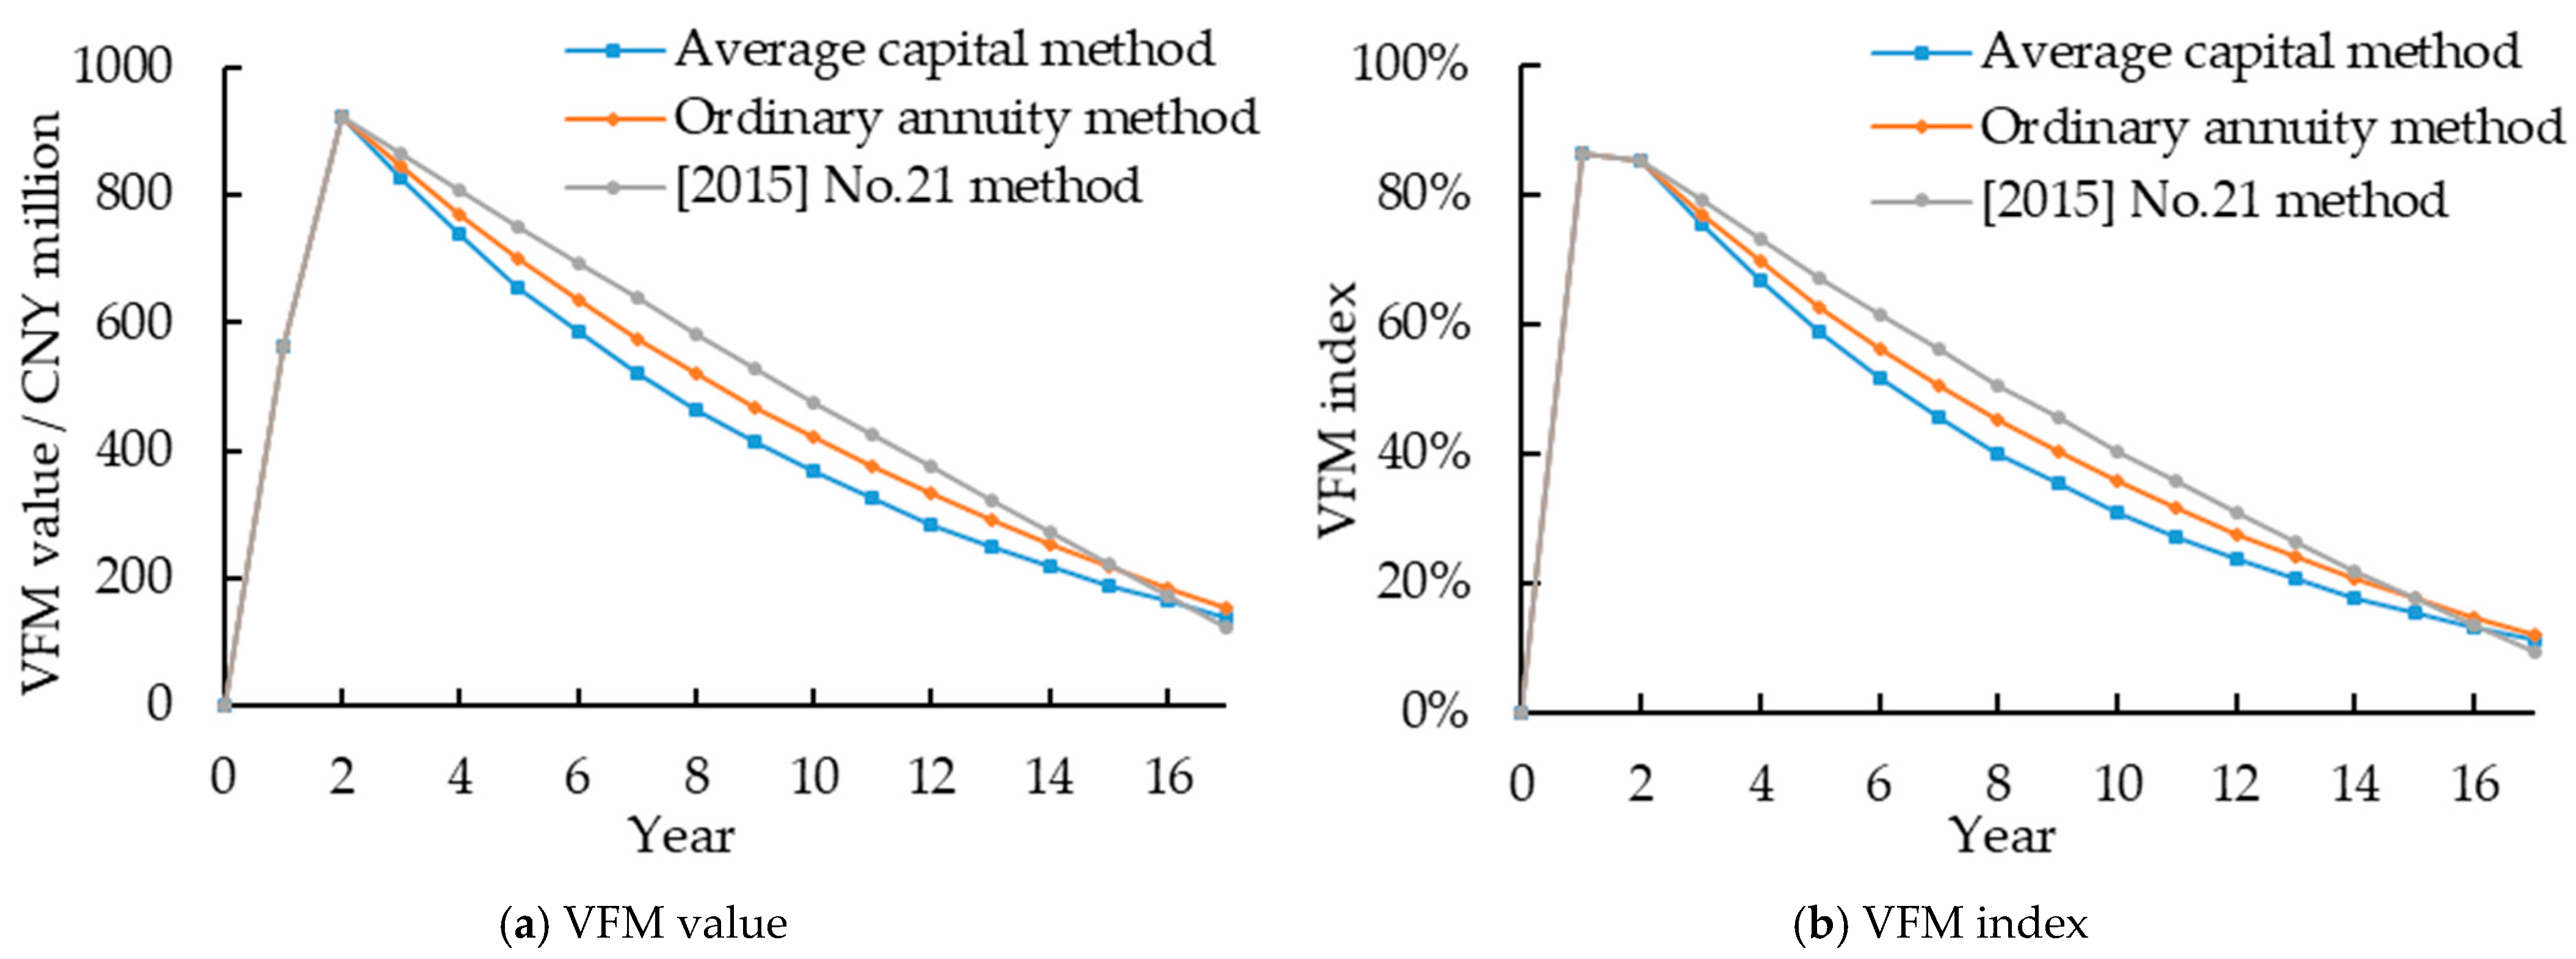
5.2.3. Sensitivity Effects of Availability Service Fee

The actual operation and maintenance performance service fee in the two projects is much smaller than the expenditure of the availability service fee, so the change in the availability service fee becomes the main factor affecting the government operation subsidy expenditure of the PPP projects. Taking the CQ Project as an example, this study selected two commonly used calculation models to replace the availability service fee in the original SD model. The equation in the SD model is as follows. The authors used the Vensim PLE software to simulate changes in the VFM value and VFM index under three different models (see Table 3), as shown in Figure 9.
As shown in Figure 9, although the VFM value and VFM index measured using the three calculation methods are not very different and can meet the requirements of VFM, there are still certain differences. Based on the calculation of availability service fees in the (2015) No. 21 method, the VFM value and VFM index for both projects are the smallest at the end of the operating period, but the largest in the middle of the operating period. Under the other two calculation methods, the VFM value at the end of the operation period is small, but the government expenditure is smooth, which can strengthen the government’s financial capacity. In addition, the discount rate is not involved in the other two calculation methods. When considering the influence of the discount rate on the VFM value, the sensitivity obtained using these two methods is bound to be smaller than that of the original project calculation method.
In addition, this paper also compared the sensitivity of the reasonable profit margin of investment under three different calculation methods. The changes in the VFM value are shown in Figure 10. As shown in Figure 10, the reasonable profit margin calculated using the availability service fee method based on (2015) No. 21 has the least sensitivity to the change in the VFM value, and the sensitivity based on the equal principal method is the greatest. When choosing different calculation methods, the range of the reasonable profit margin of investment that can be adjusted to meet the VFM is also different. Therefore, we must combine the characteristics of the corresponding calculation model and select the appropriate calculation model according to the characteristics of the actual PPP projects.

6. Discussions

(1) Theoretical contribution to VFM quantitative evaluation. This paper took the reality of SCC PPP projects in Anhui province, published VFM reports as the research objects, and used the SD model to analyze the VFM over the whole life cycle. The SD model could dynamically display the influence of factor changes on each variable in the system at each stage, and it was easy to determine the acceptable range of relevant factors under the condition of achieving VFM. Therefore, this study proves the feasibility and applicability of the model by integrating system dynamics into the VFM quantitative evaluation of SCC PPP projects, a methodology previously underutilized in SCC PPP projects. Unlike static models, the SD model approach enables the dynamic visualization of how parameters like discount rates evolve over time, aligning with Grimsey & Lewis’s (2019) [18] call for context-sensitive VFM frameworks in infrastructure PPP projects. However, the model’s reliance on scenario analysis for risk quantification highlights the need for standardized risk assessment protocols to enhance cross-project comparability. Therefore, the construction of a framework for VFM quantitative evaluation using the SD model can intuitively perceive the impact of influencing factors on the evaluation results. Traditional VFM evaluation methods are relatively static and fail to reflect the dynamic changes in projects at different stages and under various conditions. In contrast, the SD model can simulate the dynamic behavior of projects at different time points and under the influence of various factors. This provides more intuitive and comprehensive evaluation results, allowing decision-makers to better understand the value change trends throughout their entire life cycle. Through the SD model, key factors that significantly influence the VFM evaluation results can be identified, and the dynamic impact of these factors can be quantified. This helps to enrich and perfect the theoretical system of VFM evaluation, making it more scientific and rational, and provides theoretical support and methodological guidance for reforming the current evaluation methods.
(2) International relevance and policy implications. Internationally, the findings resonate with debates on discount rate standardization (Zwalf et al., 2017) [59] and profit margin regulation (Visconti, 2014) [61]. For instance, China’s lack of explicit discount rate ceilings contrasts with practices in the UK and Australia, where such thresholds mitigate manipulation risks. The SD model’s ability to simulate fiscal pressures under varying profit margins offers policymakers a tool for balancing private sector incentives and public financial sustainability—a challenge also noted in Indonesian and Italian PPP contexts (Wibowo & Sundermeier, 2020; Moro Visconti et al., 2014) [28,30,31]. In addition, the SD model’s risk quantification module suggests reallocating construction-phase risks to private partners while keeping operation-phase regulatory risks with governments—a strategy aligned with Indonesia’s annuity-based PPP projects [28]. Therefore, the VFM quantitative evaluation method based on the SD model is more in line with the international principles of benefit and risk sharing. The reasonable allocation of benefits and risks is an important principle to ensure the successful implementation of PPP projects. This method can clarify the rights and obligations of all parties involved in the project, in line with the international requirements for PPP project management. It can further clarify the threshold range of key parameters such as risk allocation principles, discount rate ceilings, and reasonable profit margins. In traditional evaluation methods, the determination of these parameters may be somewhat arbitrary and random, leading to inaccurate evaluation results. However, the SD model can provide a scientific basis for the determination of these key parameters through simulation and analysis, avoiding subjectivity and arbitrariness in their determination. This makes the formulation of concession agreements and contractual relationships between parties more transparent and clear, reducing the disputes and risks caused by unreasonable parameters.
(3) Practical guidance for mitigating “Pseudo-PPP” risks. By quantifying the impact of parameter adjustments (e.g., inflating the discount rate to pass the VFM evaluation), this study exposes the vulnerabilities in the current evaluation practices that enable “Pseudo-PPP” projects. The SD model’s sensitivity thresholds (e.g., setting the threshold of the VFM value and index to be placed in case of risk occurrence) provide actionable criteria for auditors to flag questionable projects. Some studies only focused on the system dynamics model for the VFM evaluation of a single project, and the lack of discussion on the sensitivity and thresholds of influencing factors, whereas our work establishes generalizable sensitivity thresholds applicable across SCC PPP projects [14,35]. This aligns with Zhao et al.’s (2020) [32] emphasis on transparent data reporting in the National PPP Platform to curb opportunistic behaviors, while also addressing the “black box” criticism of expert-driven qualitative evaluations (McKevitt & Davis, 2016) [16]. Therefore, the SD model can sensitively capture the impact of key factor adjustment on evaluation results in the whole life cycle, and provide a quantifiable feasibility threshold range for PPP projects. With a clear feasibility threshold range, proactive intervention can be carried out during project implementation for the timely identification of potential issues and risks, preventing the occurrence of Pseudo-PPP projects and project failures. It should be noted that there are many factors that affect the VFM evaluation results, and further exploration and clarification of the sensitivity and impact of other factors are needed to more completely reveal the feasibility and scientific nature of PPP projects. A large amount of basic parameter data is required for factor sensitivity analysis and model tuning. Government management departments should further open up data on PPP projects and VFM reports in the industry. Only with transparent data can strong support be provided for subsequent research, allowing evaluation methods and models to be continuously optimized and improved, and better serve the decision-making and management of PPP projects.

7. Conclusions and Recommendations

7.1. Conclusions

This study developed a life cycle quantitative evaluation model for the VFM of SCC PPP projects based on the SD model. The data simulation combined with the SD method was carried out by the CQ Project and CB Project, and a VFM value for the two projects was obtained. The results of sensitivity analysis on the discount rate and reasonable profit margin of investment showed that the quantitative evaluation method of VFM based on the SD mode could intuitively display the change trend of the VFM value in the whole life cycle. This clarified the process and degree of influence of various factors on the VFM value and provided a scientific and feasible dynamic research method for the quantitative evaluation of VFM in SCC PPP projects. However, there are still some shortcomings in this study. The model’s risk quantification was derived using scenario analysis, as the exact quantification formula was not known, and a table function was used as the input in the software simulation. Therefore, it was difficult to carry out a sensitivity analysis of risk changes in the SD model. The risk quantification needs to be analyzed separately in subsequent studies [4,59,64]. Additionally, the current SD model prioritizes causal relationship dissection over iterative feedback loops, and future studies will close this gap. The specific research conclusions are as follows:
(1) Construction of dynamic life cycle VFM qualitative evaluation model. The SD model developed in this study effectively captures the dynamic interactions among key factors (e.g., the discount rate, the profit margins, and the availability service fee) across the entire life cycle of SCC PPP projects. It provides a robust framework for quantifying VFM values, addressing the limitations of the static evaluation methods in the existing guidelines.
(2) Sensitivity analysis of critical factors. Sensitivity analysis reveals that the discount rate and reasonable profit margin significantly influence the VFM values. Notably, the PPP value exhibits greater sensitivity to the discount rate fluctuations than the PSC value, and the higher profit margin disproportionately reduces the VFM viability, particularly in long-term projects.
(3) Methodological recommendations for practice. The selection of the availability service fee calculation methods directly impacts the stability of the VFM value. The Ministry of Finance (2015) No. 21 method demonstrates the lowest sensitivity to parameter changes and is recommended for PPP projects requiring long-term financial predictability, while the average capital method suits scenarios prioritizing short-term fiscal flexibility.

7.2. Recommendations

It is necessary to pay attention to the process of the quantitative evaluation of VFM and enrich the practical data and experience in the National PPP Information Platform of the CPPPC. The PPP model has been developed in China over nearly 30 years [65]. The Chinese government has promoted the rapid development of PPP projects in recent years, and the scope and fields of and investment in projects have also been increasing [66,67]. However, VFM evaluation has only recently been introduced, and there is a lack of practical project experience and necessary data accumulation to form a quantitative calculation model that fits with the actual situation in China. Governments at all levels should pay attention to the value range and value basis of quantitative evaluation index data. The standardized evaluation process and complete evaluation reports of the practical PPP projects in the National PPP Information Platform of the CPPPC should be provided. Quantitative evaluation needs to be highlighted as a key part of VFM evaluation.
It is suggested that government departments should develop detailed guidelines and handbooks for the VFM evaluation of PPP projects. Important calculation processes and parameters should be clearly stated in the project’s VFM report, which can greatly prevent the occurrence of Pseudo-PPP projects and increase the sustainability of PPP projects. Based on the published quantitative evaluation sections of the VFM reports for each project, it could be seen that different consulting firms have different emphases in the preparation process. The calculation process of the VFM value in some reports prepared by some consulting companies was detailed, and the annexes were complete. However, the quantitative evaluation processes prepared by some consulting companies were simple, with only VFM measurement results, which are difficult to use for reference and evaluation by the government and other relevant institutions in later stages.
It is suggested to increase the relevant provisions of the discount rate and strictly regulate the value. Transparent SD simulation for VFM evaluation can align expectations between governments, private investors, and communities, reducing contract renegotiation risks. Both the PSC and PPP values involved in the quantitative evaluation of VFM require a present value, and the discount rate plays a key role in the overall calculation as a discount indicator. It was found that the level of the discount rate is positively correlated with the difficulty of passing the quantitative evaluation of VFM in the PPP projects. The discount rate is continuously and unreasonably fine-tuned in some SCC PPP projects in order to pass the VFM evaluation. This will inevitably affect the sustainable development of China’s PPP projects in the long run. By setting an upper limit on the discount rate, the reasonableness of the selection of the discount rate is ensured to a certain extent. This can thus avoid some PPP projects deliberately increasing the discount rate to adopt the PPP model. In addition, long-term projects (e.g., case of FL project, 18-year cooperation) should adopt the Ministry of Finance (2015) No. 21 method for availability payments to minimize fiscal sensitivity.

Author Contributions

Conceptualization, H.Z. and J.C.; methodology, H.Z. and T.L.; software, T.L.; validation, H.Z., J.C., and T.L.; formal analysis, H.Z.; investigation, H.Z. and T.L.; data curation, T.L.; writing—original draft preparation, H.Z. and T.L.; writing—review and editing, H.Z. and J.C.; visualization, H.Z. and J.C.; supervision, H.Z. and J.C.; project administration, H.Z.; funding acquisition, H.Z. All authors have read and agreed to the published version of the manuscript.

Funding

This research was funded by China University of Mining and Technology Research Center for Transformation Development of Resource-Based Cities and Rural Revitalization (grant number 2021-11158).

Data Availability Statement

The authors confirm that the data supporting the findings of this study are available within the article.

Acknowledgments

The authors would like to express their sincere gratitude to the editor and the anonymous reviewers for their insightful and constructive comments.

Conflicts of Interest

The authors declare no conflicts of interest.

References

  1. Chan, F.K.S.; Griffiths, J.A.; Higgitt, D.; Xu, S.; Zhu, F.; Tang, Y.-T.; Xu, Y.; Thorne, C.R. “Sponge City” in China—A breakthrough of planning and flood risk management in the urban context. Land Use Policy 2018, 76, 772–778. [Google Scholar] [CrossRef]
  2. Li, Q.; Wang, F.; Yu, Y.; Huang, Z.; Li, M.; Guan, Y. Comprehensive performance evaluation of LID practices for the sponge city construction: A case study in Guangxi, China. J. Environ. Manag. 2019, 231, 10–20. [Google Scholar] [CrossRef] [PubMed]
  3. Yu, K.; Li, D.; Yuan, H.; Fu, W.; Qiao, Q.; Wang, S. “Sponge City”: Theory and Practice. City Plan. Rev. 2015, 39, 26–36. [Google Scholar] [CrossRef]
  4. Zhao, H.; Ma, S.; Bu, Z.; Zhang, Y. Constructing a Risk-Sharing Framework for Sponge City PPP Projects from the Perspective of the Individual Participant. Adv. Civ. Eng. 2020, 2020, 8832664. [Google Scholar] [CrossRef]
  5. Li, W.; Guo, J.; Yuan, J.; Liu, H.J.; Edwards, D.J. Exploring the Key Indicators of Social Impact Assessment for Sponge City PPPs: A Sustainable Development Perspective. Buildings 2022, 12, 1329. [Google Scholar] [CrossRef]
  6. Yuan, J.; Zhang, L.; Tan, Y.; Skibniewski, M.J. Evaluating the regional social sustainability contribution of public-private partnerships in China: The development of an indicator system. Sustain. Dev. 2019, 28, 259–278. [Google Scholar] [CrossRef]
  7. Liu, B.; Li, J.; Wang, D.; Liu, H.; Wu, G.; Yuan, J. Public–private partnerships: A collaborative framework for ensuring project sustainable operations. Eng. Constr. Archit. Manag. 2022, 31, 264–289. [Google Scholar] [CrossRef]
  8. Cao, X.; Yu, L. Thoughts and Suggestions on the Application of Public-Private Partnership in Sponge City Project Construction: A Case Study of Sponge City Project in Cuwen Scenic District, Taian, Shandong. Urban Dev. Stud. 2018, 25, 29–36. [Google Scholar]
  9. Liu, B.; Ji, J.; Chen, J.; Qi, M.; Li, S.; Tang, L.; Zhang, K. Quantitative VfM evaluation of urban rail transit PPP projects considering social benefit. Res. Transp. Bus. Manag. 2023, 49, 101015. [Google Scholar] [CrossRef]
  10. Zhao, J.; Liu, H.J.; Love, P.E.D.; Greenwood, D.; Sing, M.C.P. Value for Money assessments for Public-Private Partnerships: Characteristics, research directions, and policy implications. Dev. Built Environ. 2023, 16, 100246. [Google Scholar] [CrossRef]
  11. Zhao, J. Addressing the elephant in the room: How do we understand value for money in transport Public Private Partnerships? Cities 2024, 154, 105401. [Google Scholar] [CrossRef]
  12. Chen, S.; Wang, M. Research on VFM Evaluation System of PPP Projects. Fisc. Sci. 2016, 8, 65–71. [Google Scholar] [CrossRef]
  13. Jia, H.; Zhang, S. Research on the Application of VFM Evaluation Method in PPP Model: From the Perspective of Literature Review. Constr. Econ. 2019, 40, 46–50. [Google Scholar] [CrossRef]
  14. Yu, S.; Dai, T.; Yu, Y.; Zhang, J. Investment decision model of wastewater treatment public–private partnership projects based on value for money. Water Environ. J. 2020, 35, 322–334. [Google Scholar] [CrossRef]
  15. Boardman, A.; Hellowell, M. A Comparative Analysis and Evaluation of Specialist PPP Units’ Methodologies for Conducting Value for Money Appraisals. J. Comp. Policy Anal. Res. Pract. 2016, 19, 191–206. [Google Scholar] [CrossRef]
  16. McKevitt, D.; Davis, P. Value for money: A broken piñata? Public Money Manag. 2016, 36, 257–264. [Google Scholar] [CrossRef]
  17. Christina, P.; Gary, S. Value for money: A utilization-focused approach to extending the foundation and contribution of economic evaluation. Eval. Program Plan. 2020, 80, 101799. [Google Scholar] [CrossRef]
  18. Grimsey, D.; Lewis, M.K. Are Public Private Partnerships value for money? Account. Forum 2019, 29, 345–378. [Google Scholar] [CrossRef]
  19. Zhang, Z. The Process and Program of the VFM Evaluating and the Method of Dynamic Regulation for PPP Project. Manag. Rev. 2018, 30, 270–278. [Google Scholar] [CrossRef]
  20. Almarri, K.; Boussabaine, H. The Influence of Critical Success Factors on Value for Money Viability Analysis in Public–Private Partnership Projects. Proj. Manag. J. 2017, 48, 93–106. [Google Scholar] [CrossRef]
  21. Cui, C.; Wang, J.; Liu, Y.; Coffey, V. Relationships among Value-for-Money Drivers of Public–Private Partnership Infrastructure Projects. J. Infrastruct. Syst. 2019, 25, 04019007. [Google Scholar] [CrossRef]
  22. Cui, C.; Wang, J.; Liu, Y.; Li, H. Importance of VFM drivers in PPP projects using AHP-DEMATEL. J. Huaqiao Univ. (Nat. Sci.) 2018, 39, 682–688. [Google Scholar]
  23. Lin, X.; Wang, M. The Improvement and Application of PPP Performance Evaluation in China. J. Beijing Jiaotong Univ. (Soc. Sci. Ed.) 2019, 18, 19–29. [Google Scholar] [CrossRef]
  24. Malek, M.; Gundaliya, P. Value for money factors in Indian public-private partnership road projects: An exploratory approach. J. Proj. Manag. 2021, 6, 23–32. [Google Scholar] [CrossRef]
  25. Magalhães, L.; Figueiredo, L.B.; Jesus, L.T.D. Project management in public-private partnerships: A conceptual framework based on a systematic literature review. Gestão Produção 2020, 27, e3772. [Google Scholar] [CrossRef]
  26. Opara, M. Value for Money and Risk Relationships in Public-Private Partnerships: Evaluating Program-based Evidence. Aust. Account. Rev. 2018, 28, 391–404. [Google Scholar] [CrossRef]
  27. Jílek, P.; Černá Silovská, H.; Kolařík, P.; Lukavec, M. Selection of Quantitative and Qualitative Methods for Comprehensive Evaluation of PPP Projects Focusing on the Czech Republic. Transylv. Rev. Adm. Sci. 2018, 14, 38–54. [Google Scholar] [CrossRef]
  28. Wibowo, A.; Sundermeier, M. Developing a Fuzzy Value-for-Money Analysis Model for Annuity-Based Public-Private Partnership Infrastructure Projects under Consideration of Risk Mitigation Capability. J. Constr. Eng. Manag. 2020, 146, 04020081. [Google Scholar] [CrossRef]
  29. Soomro, M.A.; Zhang, X. Roles of Private-Sector Partners in Transportation Public-Private Partnership Failures. J. Manag. Eng. 2015, 31, 04014056. [Google Scholar] [CrossRef]
  30. Moro Visconti, R. Multidimensional principal–agent value for money in healthcare project financing. Public Money Manag. 2014, 34, 259–264. [Google Scholar] [CrossRef]
  31. Moro Visconti, R.; Monda, B.; Giorgino, M. Improving Value for Money in Italian Project Finance. Manag. Financ. 2014, 40, 1058–1077. [Google Scholar] [CrossRef]
  32. Zhao, Z.; Yuan, S.; Dai, T.; Bao, G. Application of System Dynamics Model for VFM Evaluation of PPP Project. J. Huaqiao Univ. (Nat. Sci.) 2020, 41, 765–771. [Google Scholar]
  33. Bi, W.; Du, J.; Li, Q. Research on VFM Evaluation of PPP Model: Taking A Cultural and Creative Industrial Park as an Example. J. Eng. Manag. 2019, 33, 51–56. [Google Scholar] [CrossRef]
  34. Sang, P.; Zhang, P. An Evaluation of PPP Model in Sponge City Project Based on VFM. J. Eng. Manag. 2017, 31, 61–65. [Google Scholar] [CrossRef]
  35. Zhang, H.; Lin, T.; Zheng, B.; Tang, G. Study on System Dynamics Model of VFM Quantitative Evaluation of Sponge City PPP Project —Taking S Sponge City Project in Tianjin as an Example. J. Tianjin Univ. (Soc. Sci.) 2022, 24, 212–222. [Google Scholar]
  36. Li, J.; Zhao, J. Quantitative Evaluation of Value for Money of PPP Project in Sponge City. Financ. Account. Mon. 2019, 7, 101–108. [Google Scholar]
  37. Liu, H.J.; Love, P.E.D.; Smith, J.; Sing, M.C.P.; Matthews, J. Evaluation of public–private partnerships: A life-cycle Performance Prism for ensuring value for money. Environ. Plan. C Politics Space 2018, 36, 1133–1153. [Google Scholar] [CrossRef]
  38. Luo, L.; Zou, Z.; Chen, S. Discounting for public-private partnership projects in China. Econ. Model. 2021, 98, 218–226. [Google Scholar] [CrossRef]
  39. Zhao, J.; Liu, H.J.; Love, P.E.D.; Greenwood, D.J.; Sing, M.C.P. Public-private partnerships: A dynamic discrete choice model for road projects. Socio-Econ. Plan. Sci. 2022, 82, 101227. [Google Scholar] [CrossRef]
  40. Wang, S.; Yu, L.; Qiu, R. Evolutionary Game Analysis of Participations in Museum Public–Private Partnership Projects Based on System Dynamics. Systems 2022, 11, 7. [Google Scholar] [CrossRef]
  41. Lai, R.; Liu, S.; Wang, Y. Sustainable Operations: Risk Evolution and Diversification Strategies Throughout the Lifecycle of Wind Energy Public–Private Partnership Projects. Systems 2025, 13, 237. [Google Scholar] [CrossRef]
  42. Park, H.; Lee, S.; Kim, J. Do public private partnership projects deliver value for money? An ex post Value for Money (VfM) Test on three road projects in Korea. Int. J. Urban Sci. 2018, 22, 579–591. [Google Scholar] [CrossRef]
  43. Ren, G.; Li, H.; Zhang, J. A BIM-Based Value for Money Assessment in Public-Private Partnership: An Overall Review. Appl. Sci. 2020, 10, 6483. [Google Scholar] [CrossRef]
  44. Liu, H.; Sun, J.; Li, F. Evaluation of PPP Model in Utility Tunnel Project Based on VFM. J. Civ. Eng. Manag. 2016, 33, 122–126. [Google Scholar] [CrossRef]
  45. Jiang, Y.; Li, A.; Bao, X. A Study on the Qualitative VFM-Evaluation of Rail Transit PPP Projects Based on Matter Element Analysis. J. Eng. Manag. 2018, 32, 69–74. [Google Scholar] [CrossRef]
  46. Liu, F.; Liu, J.; Yan, X. Quantifying the Decision-Making of PPPs in China by the Entropy-Weighted Pareto Front: A URT Case from Guizhou. Sustainability 2018, 10, 1753. [Google Scholar] [CrossRef]
  47. Zhang, Y.; Wang, H. Research on Method Improvement of Value for Money Evaluation of PPP Mode. Eng. Econ. 2020, 30, 9–13. [Google Scholar] [CrossRef]
  48. Kweun, J.Y.; Wheeler, P.K.; Gifford, J.L. Evaluating highway public-private partnerships: Evidence from U.S. value for money studies. Transp. Policy 2018, 62, 12–20. [Google Scholar] [CrossRef]
  49. Cui, C.; Liu, Y.; Hope, A.; Wang, J. Review of studies on the public–private partnerships (PPP) for infrastructure projects. Int. J. Proj. Manag. 2018, 36, 773–794. [Google Scholar] [CrossRef]
  50. Yuan, J.; Wang, F.; Li, Q.; Deng, X. Research and Application of VFM Evaluation Method for the PPP Projects in Infrastructure. Mod. Manag. Sci. 2012, 1, 27–30. [Google Scholar]
  51. Carpintero, S.; Siemiatycki, M. PPP projects in local infrastructure: Evidence from schools in the Madrid region, Spain. Public Money Manag. 2015, 35, 439–446. [Google Scholar] [CrossRef]
  52. Liang, L.; Han, F.; Zhou, F.; Jing, Z. Comparison at Home and Abroad on Value for Money Assessment of PPP Projects. J. Civ. Eng. Manag. 2018, 35, 182–188. [Google Scholar] [CrossRef]
  53. Wang, H.; Zhang, K.; Chen, J.; Wang, Z.; Li, G.; Yang, Y. System dynamics model of taxi management in metropolises: Economic and environmental implications for Beijing. J. Environ. Manag. 2018, 213, 555–565. [Google Scholar] [CrossRef] [PubMed]
  54. Zhang, L.; Nie, Q.; Chen, B.; Chai, J.; Zhao, Z. Multi-scale evaluation and multi-scenario simulation analysis of regional energy carrying capacity-Case study: China. Sci. Total Environ. 2020, 734, 139440. [Google Scholar] [CrossRef] [PubMed]
  55. Chen, W.; Dong, J.; Yan, C.; Dong, H.; Liu, P. What Causes Waterlogging?—Explore the Urban Waterlogging Control Scheme through System Dynamics Simulation. Sustainability 2021, 13, 8546. [Google Scholar] [CrossRef]
  56. Pluchinotta, I.; Pagano, A.; Vilcan, T.; Ahilan, S.; Kapetas, L.; Maskrey, S.; Krivtsov, V.; Thorne, C.; O’Donnell, E. A participatory system dynamics model to investigate sustainable urban water management in Ebbsfleet Garden City. Sustain. Cities Soc. 2021, 67, 102709. [Google Scholar] [CrossRef]
  57. Zhang, L.; Zhao, Z.; Xin, H.; Chai, J.; Wang, G. Charge pricing model for electric vehicle charging infrastructure public-private partnership projects in China: A system dynamics analysis. J. Clean. Prod. 2018, 199, 321–333. [Google Scholar] [CrossRef]
  58. Wang, S.; Hao, S. A Risk Dynamic Evaluation of PPP Projects in Sponge City Based on System Dynamics. J. Eng. Manag. 2019, 33, 63–68. [Google Scholar] [CrossRef]
  59. Zwalf, S.; Hodge, G.; Alam, Q. Choose Your Own Adventure: Finding a Suitable Discount Rate for Evaluating Value for Money in Public-Private Partnership Proposals*. Aust. J. Public Adm. 2017, 76, 301–315. [Google Scholar] [CrossRef]
  60. Cruz, C.O.; Marques, R.C. Theoretical Considerations on Quantitative PPP Viability Analysis. J. Manag. Eng. 2014, 30, 122–126. [Google Scholar] [CrossRef]
  61. Visconti, R.M. Evaluating a Project Finance SPV: Combining Operating Leverage with Debt Service, Shadow Dividends and Discounted Cash Flows. Int. J. Econ. Financ. Manag. Sci. 2013, 1, 9–20. [Google Scholar] [CrossRef]
  62. Qiu, P.; Sorourkhah, A.; Kausar, N.; Cagin, T.; Edalatpanah, S.A. Simplifying the Complexity in the Problem of Choosing the Best Private-Sector Partner. Systems 2023, 11, 80. [Google Scholar] [CrossRef]
  63. Lu, X. Calculation of Operating Subsidy Expenditure under the Government Payment Model. Financ. Account. Mon. 2018, 22, 102–110. [Google Scholar]
  64. Siemiatycki, M.; Farooqi, N. Value for Money and Risk in Public–Private Partnerships. J. Am. Plan. Assoc. 2012, 78, 286–299. [Google Scholar] [CrossRef]
  65. Zhao, J.Z.; Su, G.; Li, D. Financing China’s unprecedented infrastructure boom: The evolution of capital structure from 1978 to 2015. Public Money Manag. 2019, 39, 581–589. [Google Scholar] [CrossRef]
  66. Liang, Q.; Hu, H. Challenges and Countermeasures for the Application of Value for Money Appraisal in Infrastructure PPP Projects. Contemp. Econ. Manag. 2018, 40, 54–59. [Google Scholar] [CrossRef]
  67. Zhang, L.; Sun, X.; Xue, H. Identifying critical risks in Sponge City PPP projects using DEMATEL method: A case study of China. J. Clean. Prod. 2019, 226, 949–958. [Google Scholar] [CrossRef]
Figure 1. VFM evaluation framework under the SD model.
Systems 13 00471 g001
Figure 2. SD causality diagram for VFM value.
Systems 13 00471 g002
Figure 3. The relationship between VFM value, VFM index, and total investment.
Systems 13 00471 g003
Figure 4. The stock flow diagram of the CQ Project.
Systems 13 00471 g004
Figure 5. The stock flow diagram of the CB Project.
Systems 13 00471 g005
Figure 6. Variation trends of the VFM values.
Systems 13 00471 g006
Figure 7. Variation trends of VFM values under different discount rates.
Systems 13 00471 g007
Figure 8. Variation trends of VFM values under different reasonable profit margins.
Systems 13 00471 g008
Figure 9. Changing patterns in VFM value and VFM index under different availability service fee calculation methods.
Systems 13 00471 g009
Figure 10. Sensitivity of VFM value under different availability service fee calculation methods.
Systems 13 00471 g010
Table 1. Values of key parameters for VFM calculation of typical SCC PPP projects.
ProjectTotal Investment (CNY Million) Years of Cooperation (Construction) Operation ModeDiscount RateRisk Quantification MethodReasonable Profit RatePSC Value (CNY Million)PPP Value
(CNY Million)
VFM Value
(CNY Million)
VFM Index
CQ959.7617 (2)BOT6.08%Probability method5.88%1262.45581167.115995.33897.55%
FJ92812 (2)BOT4.90%Scenario analysis7%1245.97531220.764125.21122.02%
CB1 28012 (2)BOT6.91%Probability method-1502.61481376.0797126.53528.42%
AI53012 (2)BOT TOT4.90%Scenario analysis8%637.6038633.81243.79140.59%
BD454.7315 (3)BOT5.88%Scenario analysis8%537.0029532.86594.1370.77%
FL3930.7218 (3)BOT TOT6.37%Scenario analysis8%2530.142269.11261.0310.32%
Table 2. Main data for the VFM quantitative evaluation of CQ Project and CB Project.
IndexCQ ProjectCB Project
First year construction cost/CNY million575.856770.7047
Second year construction cost/CNY million383.904513.8031
First year government equity investment/CNY million23.03430.8282
Second year government equity investment/CNY million15.35620.5521
Inflation rate/%3%-
Total sub-operation and maintenance costs/CNY million921.54-
Corporate income tax rate/%25%25%
Value-added tax rate/%6%6%
Additional tax rate/%12%12%
Performance appraisal coefficient/%-118.53
Proportion of capital to total investment/%20%20%
Proportion of government equity investment/%20%20%
Discount rate6.08%6.91%
Reasonable profit margin of investment5.88%5.88%
Table 3. Three calculation models of availability service fee using Vensim PLE software.
ModelCalculation Procedure
[2015] No. 21 methodSTEP (all costs of project construction × (1 + reasonable profit margin of investment) × POWER (1 + discount rate, Time − 1)/operation and maintenance period, construction period)
Ordinary annuity methodSTEP (all costs of project construction × reasonable profit margin of investment × POWER (1 + reasonable profit margin of investment, operation and maintenance period)/(POWER (1 + reasonable profit margin of investment, operation and maintenance period) − 1), construction period)
Average capital methodSTEP (all costs of project construction/operation and maintenance period + (all costs of project construction − (cost of full construction of the project/operation and maintenance period) × (Time − 2)) × reasonable profit margin of investment, construction period)
Disclaimer/Publisher’s Note: The statements, opinions and data contained in all publications are solely those of the individual author(s) and contributor(s) and not of MDPI and/or the editor(s). MDPI and/or the editor(s) disclaim responsibility for any injury to people or property resulting from any ideas, methods, instructions or products referred to in the content.

