Abstract
As ESG practices become increasingly embedded in global capital markets, their impact on firm financing costs remains an open question in emerging economies, where regulatory divergence and rating inconsistency complicate investor perceptions, particularly in China’s rapidly evolving financial environment. This study examines the impact of Environmental, Social, and Governance (ESG) performance on financing costs among Chinese non-financial listed firms, with a focus on the moderating roles of financial regulation and ESG rating divergence. Using a panel dataset of 4493 firms across 33,773 firm–year observations from 2011 to 2022, we employ a two-way fixed effects model, along with Propensity Score Matching and Difference-in-Differences (PSM-DID) techniques, to address endogeneity concerns and enhance causal inference. The findings reveal that improvements in ESG performance significantly reduce financing costs, substantially affecting debt relative to equity. Moreover, the cost-saving benefits of ESG are amplified in industries with stronger regulatory oversight, while high ESG rating divergence undermines these benefits by increasing uncertainty. These results highlight the importance of standardizing ESG rating systems and enhancing regulatory consistency. Such efforts can lower capital costs and improve financial access for firms, particularly in capital-intensive and environmentally sensitive sectors, offering actionable guidance for policymakers shaping disclosure frameworks and corporate managers optimizing ESG investment strategies.
1. Introduction
Environmental, social, and governance-related factors (ESG) have become crucial in influencing corporate financing approaches, marking a global shift toward sustainable development. By 2024, ESG-related investments are expected to account for half of all professionally managed assets worldwide, reflecting the increasing integration of sustainability into corporate governance [1]. In the Chinese context, this trend is closely tied to the nation’s “dual carbon” goals and its commitment to achieving carbon neutrality by 2060. Listed firms in China place significant importance on ESG performance, which serves as a vital measure of corporate responsibility and plays a crucial role in securing capital access and enhancing market competitiveness [2,3]. Robust ESG practices are often associated with superior risk management capabilities and improved corporate reputation, which help firms secure greater opportunities in the capital markets [3]. However, the linkage between ESG performance and financing costs in China remains underexplored, marked by regulatory challenges and inconsistencies in rating methodologies [4,5]. These gaps are exacerbated by the nation’s evolving regulatory framework and significant divergence in ESG ratings. For instance, while the energy and manufacturing industries face stricter ESG disclosure mandates, other sectors operate under less unified standards, resulting in substantial variability in disclosure practices [6]. This fragmentation complicates investors’ ability to evaluate corporate risks and returns, introducing ambiguity into the financial benefits of ESG adoption [7,8]. Compounding this challenge, ESG rating divergence—arising from discrepancies in assessment criteria among rating agencies—intensifies informational uncertainty, weakening the presumed financial advantages of robust ESG performance [9,10].
The existing literature predominantly focuses on developed markets, such as the United States and the European Union, where mature regulatory systems and standardized disclosure requirements underpin ESG frameworks. In contrast, emerging markets like China present a distinct institutional context in which ESG-financing linkages are shaped by fragmented regulatory oversight and heterogeneous enforcement. China’s ESG landscape is characterized by notable sectoral and regional disparities, stemming from uneven regulatory intensity, differentiated policy mandates, and variations in local institutional capacity. For instance, high-emission industries such as energy and heavy manufacturing are subject to stricter ESG disclosure requirements under state-led environmental targets. At the same time, service-oriented sectors often operate under weaker or voluntary guidelines [11]. Regionally, first-tier cities such as Beijing and Shanghai benefit from more comprehensive regulatory enforcement and ESG infrastructure, whereas inland provinces lag in disclosure quality and third-party ESG verification mechanisms [12]. These disparities introduce significant information asymmetry and rating inconsistency, complicating capital providers’ ability to assess firm-level ESG risks and returns.
While these studies suggest that strong ESG performance can lower financing costs through improved risk management and enhanced investor confidence [13,14], they often assume unified rating systems and stable regulatory environments. Few have examined how ESG-financing relationships evolve under conditions of regulatory fragmentation or rating inconsistency, particularly in emerging markets. This study aims to fill this gap by providing empirical evidence from China’s institutional context, where disclosure regimes and ESG scoring systems vary substantially.
Against this backdrop, understanding the financial consequences of ESG performance in China becomes critical. Clarifying these relationships holds important implications for capital market development, as it may guide regulatory improvements in ESG disclosure, reduce information asymmetry for investors, and encourage the strategic allocation of capital toward more sustainable and transparent firms. Figure 1 illustrates how ESG performance affects financing costs. Based on MSCI ESG Research, the figure compares monthly capital costs across quintiles of firms ranked by their ESG ratings from 2015 to 2024. Firms in the top quintile consistently demonstrate lower financing costs than those in the bottom quintile, with a statistically significant disparity (Mann–Whitney U test, p < 0.01). These findings highlight the potential financial benefits of superior ESG performance, particularly in emerging markets such as China, where regulatory frameworks and rating methodologies are still in development.
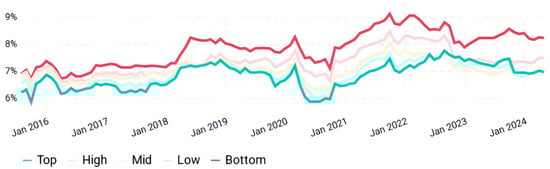
Figure 1.
Monthly cost of capital differences across MSCI ESG rating quintiles (2015–2024). Source: MSCI ESG Research.
This research examines the relationship between ESG performance and financing costs among Chinese publicly listed companies, aiming to bridge existing gaps in the literature. It analyzes data from A-share firms collected between 2011 and 2022, using a two-way fixed effects model to assess the influence of ESG practices on the costs of debt and equity financing. The study also examines how financial regulations and variations in ESG ratings influence these relationships. Advanced econometric techniques, such as Propensity Score Matching (PSM), Difference-in-Differences (DID), and instrumental variable methods, are employed to ensure robust results.
This study makes a significant contribution to the literature in three key ways. First, it provides one of the first large-scale empirical investigations of how ESG performance affects both debt and equity financing costs in China, incorporating institutional fragmentation into the analysis. Second, it develops a novel divergence-based framework to quantify inconsistencies across ESG rating agencies and examines the moderating effects of these inconsistencies. Third, it applies a robust econometric design that combines PSM, DID, and IV approaches to address potential endogeneity and enhance causal inference. The paper is structured as follows: Section 2 reviews the literature and theoretical framework; Section 3 details the dataset and methodology; Section 4 presents the findings; and Section 5 offers conclusions and policy suggestions.
2. Literature Review and Hypothesis Development
Existing research on the link between ESG performance and corporate financing costs falls into three main streams: (i) studies examining whether ESG performance reduces firms’ debt or equity financing costs, conducted mainly in developed markets with stable regulatory environments; (ii) analyses exploring underlying mechanisms such as reduced information asymmetry, enhanced governance, and stakeholder signaling effects; and (iii) investigations into ESG rating divergence and regulatory fragmentation, which primarily focus on their influence on ESG adoption or disclosure. However, few studies integrate these institutional factors into empirical models of financing outcomes. In transitional markets like China, ESG regulations are fragmented, and rating methodologies vary significantly across agencies, creating noise in ESG signals [15]. These structural frictions are rarely taken into account in financing cost analyses. To address this gap, our study examines how ESG performance influences both debt and equity financing costs in Chinese listed firms while explicitly considering the effects of regulatory divergence and rating inconsistencies. The following sections review the theoretical foundations and empirical findings to guide hypothesis development.
2.1. ESG Performance and Firms’ Financing Costs
ESG performance reflects a firm’s effectiveness in managing environmental, social, and governance matters, serving as a forward-looking indicator of corporate sustainability and risk management. Robust ESG practices have been associated with superior risk mitigation [16], operational efficiency [17], and reputational resilience [18], thereby enhancing investor confidence and reducing capital costs [19]. Consequently, firms with high ESG performance often enjoy favorable financing conditions, including lower interest rates, improved loan terms, and reduced equity risk premiums [20]. However, the relationship between ESG performance and financing costs in emerging markets, such as China, is more heterogeneous and context-dependent due to the evolving institutional infrastructure. Specifically, (1) the absence of a unified ESG disclosure regime leads to voluntary and inconsistent reporting across firms and industries [21]; (2) ESG rating agencies employ divergent methodologies and weighting schemes, producing inconsistent evaluations for the same firm [22]; and (3) regulatory enforcement varies widely across sectors and regions, resulting in disparate expectations for ESG compliance [23]. These institutional and informational frictions jointly undermine the credibility and comparability of ESG disclosures, reducing the consistency with which ESG improvements translate into financing cost advantages.
From the perspective of information asymmetry theory [24], strong ESG performance reduces informational gaps between firms and their investors, signaling a decrease in operational and reputational risks [25]. This signaling mechanism is well supported in developed markets with established ESG ecosystems [19,26]. In China, this effect is substantially weakened by ESG rating fragmentation. The lack of standardization enables rating agencies to adopt conflicting assessment criteria and disclosure requirements [24], resulting in considerable dispersion in ESG scores for the same firm [27]. These inconsistencies generate conflicting signals, impair investor comparability, and weaken the reliability of ESG as a pricing instrument. As a result, firms may fail to convert superior ESG performance into measurable reductions in financing costs. In many cases, investors discount ESG ratings or require additional due diligence, which increases transaction costs and delays capital access [28].
While information asymmetry theory captures ESG’s external signaling function, agency theory [29] highlights its role in improving internal governance. Strong ESG performance can align managerial decisions with shareholder interests, curb overinvestment, and reduce agency costs, lowering debt and equity financing costs [30,31]. However, the effectiveness of this governance-enhancing role in China is constrained by uneven corporate governance practices. In particular, small and medium-sized enterprises (SMEs) and firms in less-regulated sectors often lack the internal oversight infrastructure necessary to implement ESG frameworks fully, thereby limiting their ability to translate ESG efforts into credible governance improvements. Complementing these perspectives, sustainable development theory [32] argues that integrating environmental and social objectives into business strategy enhances long-term financial resilience. Firms internalizing ESG goals tend to be more adaptable, socially responsible, and stakeholder-aligned, contributing to stable financing conditions. While such benefits are well documented in developed economies, empirical evidence in emerging markets remains limited. In China, a small but growing body of research has begun to explore the ESG–finance nexus. For instance, Liu (2024) investigates the impact of firm ESG performance on bond financing costs in the Chinese bond market and finds that better ESG performance significantly reduces debt costs [33]. However, existing studies tend to focus primarily on debt channels and often overlook the moderating role of institutional fragmentation, as well as the role of equity financing. In particular, few studies have integrated regulatory quality, rating divergence, and enforcement heterogeneity into a unified framework when analyzing the financial consequences of ESG.
This study addresses this gap by examining whether and how ESG performance affects debt and equity financing costs in China while accounting for regulatory divergence and institutional complexity. Accordingly, we propose the following hypotheses:
H1a:
Enhanced ESG performance reduces debt financing costs.
H1b:
Enhanced ESG performance reduces equity financing costs.
2.2. Impact of ESG Rating Divergence on the Relationship Between ESG and Financing Costs
Divergence in ESG ratings arises from differences in methodologies, data sources, and weighting systems among various rating agencies [34]. This issue is particularly pronounced in China, where ESG disclosure standards are evolving, resulting in substantial discrepancies in ESG ratings. This disparity undermines the trustworthiness of ESG scores as reliable measures of corporate performance, leading to uncertainty for investors and lenders, which in turn increases financing costs. Firms experiencing substantial ESG rating divergence are often viewed as higher risk, contributing to stock price fluctuations and elevated costs of both debt and equity [35]. Conversely, consistent ESG ratings enhance investor confidence, often resulting in lower financing costs and increased trust in a firm’s sustainability initiatives [36].
Theoretically, ESG performance should act as a positive signal that mitigates information asymmetry and enhances access to capital. However, when ESG ratings are inconsistent across agencies, this signal becomes noisy or ambiguous. Drawing from information asymmetry theory and stakeholder uncertainty literature, inconsistent ESG evaluations are likely to increase investor skepticism, elevate risk premiums, and weaken the expected financial benefits of ESG efforts. In China’s transitioning financial landscape, these inconsistencies erode the economic benefits of strong ESG performance. When ESG ratings exhibit significant divergence, they lose their signaling effectiveness, heightening risk perceptions among investors and lenders [36]. This effect undermines the financial benefits associated with robust ESG performance, increasing perceived risks and reducing cost advantages [35,37]. Such dynamics highlight the importance of signal clarity in capital markets and underscore the moderating role of ESG rating divergence in the relationship between ESG and financing costs. These challenges underscore broader systemic issues in aligning ESG principles with financial strategies in emerging markets, such as China, highlighting the urgent need for more standardized and transparent ESG evaluation mechanisms.
To quantify ESG rating divergence across firms, we construct rank-based measures that capture inconsistencies among third-party ESG assessments. Given the heterogeneity of ESG scoring systems across rating agencies—each with distinct criteria, weighting schemes, and varying reliance on disclosure—we transform raw ESG scores into ordinal ranks to ensure cross-agency comparability. Each firm’s ESG score is assigned a rank from 1 (lowest) to 6 (highest) when six agencies are available, or from 1 to 4 when only domestic agencies are present. This standardized ranking approach eliminates differences in scale and preserves relative evaluation.
Two primary indicators are derived to measure divergence:
Standard Deviation of Ranks (ESGdif):
where is the rank assigned by each agency, is the rank for the firm, and is the number of agencies (6 for ESGdif6, or 4 for ESGdif4). This measure captures the dispersion of agency assessments around the average score, indicating how much individual agency ratings deviate from consensus.
Range (ESGrange6 or ESGrange4):
This metric reflects the extent of disagreement among agencies by calculating the difference between the highest and lowest ranks. A higher value indicates greater inconsistency in ESG assessments.
These measures are computed using ESG evaluations from six prominent agencies, comprising four domestic and two international ones. Their methodological characteristics and inclusion rationale are presented in Table 1.

Table 1.
Overview of ESG rating agencies used in ESG divergence measurement.
If a firm receives fewer than two valid ESG scores in a given year, both ESGdif and ESGrange are set to zero. This ensures consistent treatment across firms and avoids imputation bias. Table 2 summarizes the operationalization of the four ESG rating divergence variables used in the analysis.
Table 2.
Measurement of ESG rating divergence variables.
Based on the preceding analysis, this study formulates the following hypotheses:
H2a:
ESG rating divergence weakens the negative relationship between ESG performance and debt financing costs.
H2b:
ESG rating divergence weakens the negative relationship between ESG performance and equity financing costs.
2.3. Influence of Financial Regulation on the ESG–Financing Cost Relationship
Financial regulation refers to institutional policies designed to enhance market transparency, reduce information asymmetry, and improve investor protection [38]. In the ESG context, well-designed regulatory frameworks enforce standardized disclosures, thereby increasing the credibility of sustainability claims and shaping firms’ access to external capital [39,40]. In China, regulatory initiatives such as the China Securities Regulatory Commission’s (CSRC) Basic Norms for Internal Control of Enterprises have been introduced to improve ESG-related risk reporting, particularly for listed firms. However, the effectiveness of these regulations varies across sectors and regions. For example, financial institutions and state-owned enterprises (SOEs) are subject to increasingly stringent ESG mandates. In contrast, ESG reporting remains largely voluntary among private-sector firms, particularly in emerging sectors such as technology and e-commerce [41]. Regionally, pilot ESG frameworks have been explored in state-owned enterprises, while many inland provinces still lack consistent regulatory enforcement [42].
Debt financing is particularly sensitive to financial regulation, as creditors depend heavily on verifiable disclosures to evaluate firm-specific environmental and social risks. In China, sectors such as energy, chemicals, and heavy manufacturing are subject to mandatory ESG reporting and strict environmental audits enforced by the Ministry of Ecology and Environment (MEE) and local regulatory authorities [43]. These mechanisms reduce information asymmetry by compelling firms to disclose pollution levels, carbon intensity, and regulatory compliance, thereby enabling lenders to assess default probabilities and environmental liabilities more accurately. Consequently, firms operating in these industries often benefit from lower borrowing costs. Empirical studies further confirm that firms in highly regulated sectors experience more pronounced reductions in debt financing costs compared to those in loosely regulated industries, such as retail or light manufacturing [44].
Financial regulation also plays a critical role in shaping equity financing outcomes. By improving the transparency and credibility of ESG disclosures, particularly for publicly listed firms, robust enforcement reduces equity risk premiums by enhancing investor trust and aligning corporate behavior with market expectations [45]. Investors with sustainability mandates or long-term environmental concerns are more likely to allocate capital to firms with consistent and audited ESG reports. In contrast, weak or non-binding ESG disclosure requirements—standard in parts of the digital economy or among small private enterprises—result in inconsistent reporting practices, which generate skepticism, elevate perceived risk, and increase the cost of equity [14]. Thus, financial regulation serves as a critical transmission channel through which ESG performance influences debt and equity financing.
These disparities underscore the importance of establishing consistent and enforceable regulatory frameworks that effectively translate ESG practices into tangible financial benefits [46]. Firms operating in highly regulated industries, such as energy or manufacturing, are more likely to convert ESG engagement into lower financing costs. In contrast, those in weakly regulated environments may struggle to realize comparable benefits. Unequal regulatory enforcement thus contributes to fragmented ESG outcomes and capital accessibility. Thus, this study hypothesizes:
H3a:
Financial regulation strengthens the relationship between ESG practices and debt financing costs.
H3b:
Financial regulation strengthens the relationship between ESG practices and equity financing costs.
3. Methodology
This research investigates the influence of ESG ratings on financing costs, as well as the moderating effects of ESG rating divergence and financial regulations on this relationship. The methodology includes sample selection, data collection, variable definition, and model construction. The conceptual framework and research design are illustrated in Figure 2, which visually represents the relationships among ESG ratings, financing costs, and moderating factors, as well as the validation techniques employed.
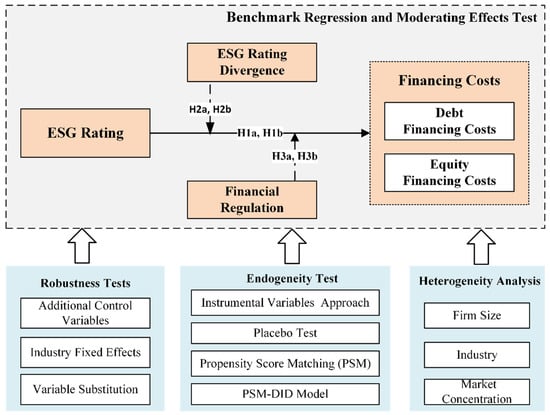
Figure 2.
Conceptual framework and methodological approach.
3.1. Sample Selection and Data Collection
This research examines A-share companies listed on the Shanghai and Shenzhen Stock Exchanges from 2011 to 2022, constituting a significant segment of China’s publicly listed corporations. These companies comply with the ESG disclosure standards established by the China Securities Regulatory Commission (CSRC). The focus on A-shares underscores the growing integration of ESG practices into domestic investment strategies. The sample excludes firms labeled with special treatment (ST and ST*), financial institutions, and those lacking complete data to ensure precision and reduce bias. These exclusions mitigate potential distortions arising from regulatory and structural inconsistencies [47]. The final dataset comprises 33,833 observations spanning multiple years for various firms. Continuous variables are adjusted at the 1% and 99% levels to account for outliers and improve reliability.
To improve transparency, we report the temporal and industry distributions of firm–year observations. Appendix A Table A1 shows a relatively balanced sample from 2011 to 2021, with growth after 2015 reflecting the rise of ESG disclosures in China. Appendix A Table A2 presents industry-level coverage based on CSRC codes. Manufacturing firms (code C) dominate the sample, representing approximately 66% of the observations. Other key sectors include information technology (I), construction (E), wholesale and retail (F), and real estate (K). This broad distribution highlights the representativeness of the dataset and supports robust empirical analysis of ESG-financing dynamics across diverse industrial and temporal settings.
3.2. Definition of Main Variables
Dependent Variables:
Debt Financing Cost (De_cost): The ratio of total interest expenses to total liabilities reflects borrowing costs [48]. This accounting-based measure is widely used in empirical studies [49,50] and ensures consistent coverage across firms and periods. Due to the limited availability of firm-level market-priced debt data in China, this proxy remains the most practical and comparable indicator for large-sample panel analysis.
Equity Financing Cost (Eq_cost): Calculated using the Capital Asset Pricing Model (CAPM):, where is the risk-free rate, reflects the stock’s sensitivity to market risk and represents the equity risk premium [49,50]. We adopt the standard Sharpe-Lintner CAPM framework in line with mainstream practice in ESG-finance research, particularly in emerging markets. This approach enables robust theoretical interpretation and comparability with prior studies while reflecting the long-term risk-adjusted cost of capital.
Explanatory Variables:
ESG Rating (ESG): Firms are evaluated based on environmental, social, and governance dimensions using scores from the Huazheng Index, which range from AAA (9) to C (1). These ratings adhere to national and international standards [51].
Moderating Variables:
ESG rating divergence (ESG_dis): Calculated using the standard deviation (ESGdif) and range (ESGrange) of ESG ratings provided by six agencies: Wind, Huazheng, Bloomberg, FTSE Russell, SynTao Green Finance, and MiLiang. This measure captures inconsistencies in evaluation across agencies [34,52].
Financial regulation (FRI): Expressed as the proportion of regulatory spending by local government to the financial industry’s added value, reflecting the strength of regional regulatory oversight [53].
Control Variables:
Control variables include various firm-specific attributes, such as asset liquidity (Liquid), operational cash flow (Cashflow), firm size (Size), board size (Board), leverage (Lev), firm age (FirmAge), return on equity (ROE), revenue growth (Growth), and the proportion of independent directors (Indep) [54]. These variables control external factors influencing financing costs beyond ESG performance.
Table 3 provides a comprehensive overview of each variable’s classification, definition, measurement method, and data source.
Table 3.
Variable definition.
3.3. Model Construction
A two-way fixed effects model examines how ESG performance affects financing costs while controlling for firm-specific characteristics and temporal variations. This approach mitigates potential biases from unobserved heterogeneity related to firm characteristics (e.g., governance) and ESG performance [55]. The model is specified as:
where represents financing costs (De_cost or Eq_cost). is the ESG score for firm at time . includes the control variables. and account for firm-specific and time-fixed effects. is the error term clustered at the firm level to address biases in standard errors.
To strengthen causal identification, we employ a multi-method approach that combines two-way fixed effects, propensity score matching with difference-in-differences (PSM-DID), and instrumental variable (IV) estimation. Compared to conventional OLS or standalone DiD models, this approach offers several advantages: fixed effects control for unobserved heterogeneity; PSM enhances group comparability and mitigates selection bias; and IV addresses potential endogeneity between ESG and financing costs. While PSM-DID depends on the parallel trend assumption and IV relies on instrument validity, we conduct robustness checks to verify both. This integrated framework is particularly suitable for examining ESG-financing linkages in transitional regulatory environments, such as China, where institutional and rating fragmentation pose significant econometric challenges.
4. Results
4.1. Descriptive Statistics of Variables
Table 4 presents statistical descriptions of the primary variables. The mean cost of debt financing (De_cost) is 0.00523 (0.523% of liabilities), ranging from −0.170 to 0.070. This wide range reflects the diverse fiscal incentives and financial conditions across firms, indicating substantial variation in borrowing costs. The equity financing cost (Eq_cost) averages 9.09%, ranging from −0.589 to 0.379, highlighting market volatility and firm-specific risks. The mean ESG score of 4.139 (range: 1–8) indicates significant variability, providing a robust basis for analyzing the impact of ESG on financing costs under different regulatory and market conditions.
Table 4.
Descriptive statistics analysis.
4.2. Multiple Covariate Analysis
Table 5 presents the Pearson and Spearman correlation matrices to examine the relationships between key variables, with a focus on potential multicollinearity. Significant correlations are observed, such as the debt financing cost (De_cost) with ESG ratings (−0.173 ***) and Leverage (Lev) (0.511 ***). While some variables exhibit correlations, they do not exceed the threshold, indicating the absence of multicollinearity. To further confirm this, a Variance Inflation Factor (VIF) test was performed, and all VIF values were significantly below the limit of 10 (Appendix A Table A3). These results verify the absence of multicollinearity, supporting the reliability of the regression estimates.
Table 5.
Multiple covariate analysis.
4.3. Benchmark Regression Analysis
The findings from the two-way fixed effects model, detailed in Table 6, highlight the substantial impact of ESG performance on financing costs. Specifically, for debt financing costs (De_cost), a one-point enhancement in ESG scores results in a 1.3% decrease (β = −0.013 ***), which adjusts to −0.005 *** after including additional control variables. These results underscore the significant cost-saving benefits of robust ESG practices for debt financing. For equity financing costs (Eq_cost), the relationship shifts from positive to slightly negative (β = −0.002 **) after controlling for other variables, indicating that enhanced ESG performance strengthens investor confidence, albeit with a minor effect on debt financing. Overall, the analysis confirms that higher ESG performance is associated with lower financing costs, particularly in the debt market, underscoring the financial benefits of sustainability. Firms with superior ESG scores, especially those operating under stringent regulatory conditions, achieve notable cost savings in debt and equity financing.
Table 6.
Benchmark regression results.
4.4. Robustness Tests
Multiple robustness checks were performed to confirm the dependability of the findings (Table 7). (1) Two additional control variables were introduced: ownership concentration (Top1), reflecting the influence of large shareholders, and market valuation (TobinQ), capturing growth opportunities and firm value. The findings presented in Table 7 (Columns 1 and 2) strengthen the reliability of the results, suggesting that a one-point increase in the ESG score reduces both debt costs (De_Cost = −0.005 ***) and equity costs (Eq_Cost = −0.001 **). This further underscores the negative correlation between ESG performance and financing costs. (2) A three-way fixed effects model was utilized to account for unobserved variations related to firms, industries, and time. As illustrated in Columns (3) and (4), the substantial negative association between ESG and financing costs persists (De_Cost = −0.006 *** and Eq_Cost = −0.001 **), suggesting that industry-related elements do not influence the outcomes. (3) Alternative indicators of financing costs (De_Cost2 and Eq_Cost2) were used to mitigate measurement inaccuracies. Columns (5) and (6) show consistent findings, with decreases in debt costs (De_Cost2 = −0.003 ***) and equity costs (Eq_Cost2 = −0.007 ***), further affirming the robustness of the results. In summary, the consistent outcomes across all assessments underscore the practical importance of ESG performance in reducing financing costs and enhancing firms’ financial flexibility and access to capital.
Table 7.
Robustness test results.
4.5. Endogeneity Test
- (1)
- Instrumental Variables (IV) Approach
To tackle possible endogeneity concerns, a two-stage least squares (2SLS) regression analysis was performed, employing two instrumental variables: (1) the mean ESG score of comparable firms situated in the same city (IV1) and (2) the firm’s earliest recorded ESG score (IV2). The first-stage results (IV1 = 0.078 ***, IV2 = 0.113 ***, shown in Table 8, Columns (1 and 3), confirm the vital relevance of the chosen instruments. In the second stage, ESG performance significantly lowered debt financing costs (De_Cost = −0.014 ***) and equity financing costs (Eq_Cost = −0.008 ***), as shown in columns 2 and 4. Instrument validity was further corroborated through the Kleibergen-Paap rk LM statistic (3934.024 ***) and the Cragg-Donald Wald F statistic (2225.555), providing robust evidence. These findings highlight the consistent financial advantages of ESG performance, even after accounting for endogeneity, underscoring its critical role in reducing financing costs.
Table 8.
Instrumental variables method.
- (2)
- Placebo Test
To confirm that the outcomes were not affected by random variation, a placebo test was conducted [56,57]. This involved generating a “pseudo-policy dummy variable” using 500 randomly selected samples for regression analysis. Figure 3 illustrates the distribution of coefficients, with averages near zero and the majority of p-values exceeding 0.10. These findings demonstrate that the impact of ESG on financing costs is not attributable to random variation, providing strong support for the model’s validity.
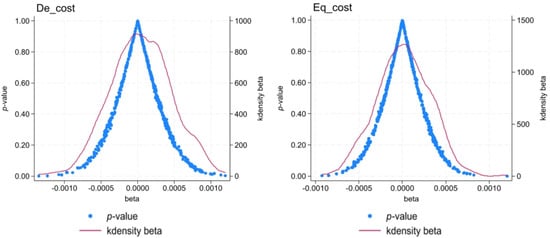
Figure 3.
Placebo test.
- (3)
- Propensity Score Matching (PSM)
Propensity Score Matching (PSM) was applied to mitigate endogeneity caused by sample selection bias [58,59]. Firms were classified into the treatment group (subject to green credit policies) and the control group (not subject). Key covariates for matching include firm size, leverage, return on equity (ROE), and board structure. Nearest neighbors ensure covariate balance. Table 9 shows that, before matching, significant differences exist between the groups (high t-values). Standardized differences decreased by over 75% post-matching, with most t-values becoming insignificant, confirming balance. Kernel density plots (Appendix A Figure A1) further validate this, showing aligned propensity score distributions post-matching. These results attribute differences in financing costs to ESG performance rather than firm characteristics.
Table 9.
Balance test.
- (4)
- Propensity Score Matching–Difference-in-Differences (PSM-DID) Model
To address endogeneity and selection bias, this study applies the Propensity Score Matching–Difference-in-Differences (PSM-DID) approach [60,61]. Firms from industries affected by green credit restrictions (treatment group) are matched with comparable firms from unaffected industries (control group), using characteristics including size, leverage, and return on equity (ROE) for matching. Following the matching process, a Difference-in-Differences (DID) analysis assesses the effects of the 2018 ESG disclosure reform enacted by the China Securities Regulatory Commission (CSRC). The model is specified as:
where represents financing costs, is a dummy variable for firms restricted by green credit policies, represents the post-2018 policy period, and includes firm characteristics such as size, leverage, and firm age.
Figure 4 illustrates the parallel trends test based on the PSM-DID framework, verifying the key identifying assumption of the model. Before the 2018 CSRC ESG disclosure reform, the financing cost trends of treated and control firms were statistically indistinguishable, supporting the assumption of parallel trends. Post-policy, debt financing costs (De_cost) declined consistently, while equity financing costs (Eq_cost) dropped sharply in the first year after implementation and continued downward. These dynamic effects suggest that the policy had a sustained impact on debt financing and a strong, albeit slightly diminishing, effect on equity costs. The confidence intervals exclude zero post-event, reinforcing the significance of the treatment effect. Overall, the plots confirm policy exogeneity and provide visual validation for the causal interpretation of subsequent DID results.
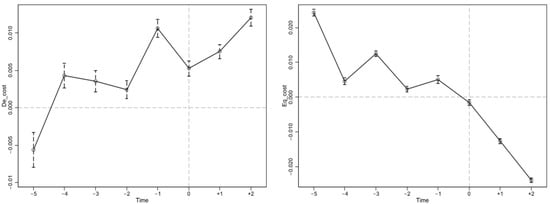
Figure 4.
Parallel trends in the impact of ESG disclosure reform on financing costs. Note: This figure presents event-study estimates of the 2018 ESG disclosure policy’s effects on debt and equity financing costs. The left panel plots the impact on debt cost (De_cost), and the right panel shows the effect on equity cost (Eq_cost). Both panels are based on a PSM-DID model. The vertical line at time 0 indicates the year of policy implementation. Pre-treatment coefficients are statistically insignificant, supporting the parallel trends assumption.
Table 10 shows that the 2018 policy significantly reduced debt costs by 0.3% (−0.003, p < 0.05) in column 1 and equity costs by 0.6% (−0.006, p < 0.01) in column 2. Further analysis reveals that the reduction in debt costs persisted in one-year post-policy (−0.005, p < 0.01), while the effect on equity costs diminished slightly in columns 3 and 4. Excluding post-2020 data, as shown in columns 5 and 6, confirms the robustness of these findings, highlighting ESG transparency’s role in reducing financing costs and improving financial flexibility.
Table 10.
Endogeneity tests.
5. Moderation and Heterogeneity Analysis
5.1. Moderating Role of Financial Regulation and ESG Rating Divergence
The significance of financial regulatory intensity (FRI) and ESG rating divergence (ESG_dis) is crucial in examining the relationship between ESG performance and financing costs, underscoring how external factors influence financing outcomes. While previous analyses have shown that higher ESG performance generally leads to lower financing costs, the financial environment may alter the strength and direction of this effect.
To test the moderating effects, the following model is used:
where is the moderating variable, either FRI or ESG_dis.
Table 11 presents the role of financial regulation intensity (FRI) and ESG rating divergence (ESG_dis) on the relationship between ESG performance and financing costs (debt and equity). The findings indicate a negative relationship between ESG performance and the costs of debt financing (De_Cost) and equity financing (Eq_Cost). Specifically, a one-unit increase in ESG performance leads to a reduction in debt financing costs by 0.005 (as shown in column 1) and equity financing costs by 0.001 (indicated in column 2). In column 3, FRI amplifies the negative effect of ESG performance on debt financing costs (−0.008 ***), suggesting that more stringent financial regulations enhance the cost-saving advantages of ESG practices for debt financing. However, in column 4, FRI increases equity financing costs (0.004 ***), suggesting that while financial regulation helps reduce debt financing costs, it may also slightly raise equity financing costs. The interplay between ESG performance and ESG rating divergence (ESG_dis), detailed in columns 5 and 6, demonstrates that a higher level of ESG rating divergence diminishes the effect of ESG performance on debt financing costs (−0.008 ***) and raises equity financing costs (0.005 ***). The results emphasize the importance of consistent ESG ratings to fully capture the financial benefits of strong ESG practices.
Table 11.
Moderating effect analysis.
Notably, in the moderation tests (columns 4 and 6), after introducing financial regulation and ESG rating divergence, the effect of ESG performance on equity financing costs shifts from negative to positive. This suggests that the combined effects of these factors offset the beneficial impact of ESG performance on equity financing costs. The models exhibit substantial explanatory power, with R-squared values ranging from 0.186 (column 2) to 0.593 (column 4), thereby reinforcing the reliability of the results.
5.2. Heterogeneity Analysis
In Figure 5, this research examines how ESG performance influences debt and equity financing costs, considering firm characteristics such as size, industry pollution levels, and market concentration (as measured by the Herfindahl–Hirschman Index, or HHI). This analysis helps refine our understanding of how ESG performance affects financing costs in different contexts.
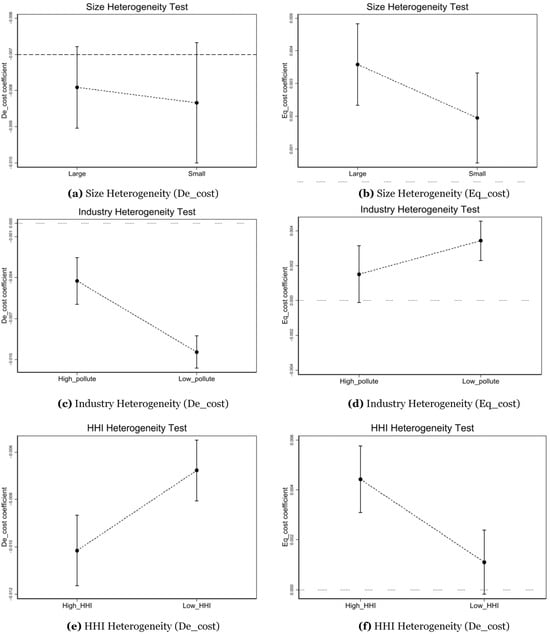
Figure 5.
Heterogeneity analysis.
- (1)
- Firm Size Heterogeneity
Figure 5a,b illustrate that smaller firms significantly reduce debt financing costs with improved ESG performance compared to their larger counterparts. For smaller firms, the coefficient for debt costs is more negative, indicating that ESG improvements help mitigate higher perceived credit risks. Larger firms, however, show a less pronounced impact. Similarly, smaller firms benefit more from ESG improvements in equity financing, with a noticeable reduction in equity costs. In contrast, larger firms might face a slight rise in equity costs, potentially driven by increased compliance expenses associated with ESG practices.
- (2)
- Industry Heterogeneity
Figure 5c,d display results for high- and low-pollution industries. Firms in high-pollution industries, such as energy, heavy manufacturing, and materials, benefit more from ESG improvements, with significant reductions in debt financing costs (Figure 5c). This suggests that firms in industries facing higher environmental risks and regulatory scrutiny derive greater benefits from strong ESG performance. For equity costs, high-pollution industries also experience a modest reduction, while low-pollution industries incur slightly higher equity costs as their ESG performance improves (Figure 5d). This may reflect lower regulatory pressure in low-pollution industries, where investors value ESG improvements less.
- (3)
- Market Concentration (HHI) Heterogeneity
Figure 5e,f analyze the effect of market concentration based on the Herfindahl–Hirschman Index (HHI). Firms operating in competitive industries (with a low HHI) experience more significant reductions in debt and equity financing costs as their ESG performance improves. Conversely, firms in concentrated industries (characterized by a high Herfindahl–Hirschman Index, or HHI) exhibit a positive relationship, implying that ESG compliance generates higher expenses in such markets. This may result from reduced market competition in concentrated industries, where capital providers prioritize ESG enhancements less.
The heterogeneity analysis indicates that smaller firms, high-pollution industries, and competitive markets tend to benefit the most from strong ESG performance. These findings align with information asymmetry and agency theory, which suggest that ESG performance signals lower risks, thereby reducing financing costs. The findings provide vital information for investors and policymakers, highlighting the various advantages of ESG practices to different firm characteristics and market environments.
6. Discussion and Conclusions
6.1. Findings
This study examines the impact of Environmental, Social, and Governance (ESG) performance on financing costs within China’s evolving regulatory framework. Using firm-level panel data from 2011–2022, we find that higher ESG performance is generally associated with lower debt financing costs, particularly among smaller firms and those in pollution-intensive sectors. These results suggest ESG is a credible signal of reduced credit risk, improving firms’ access to debt capital. In contrast, the effect on equity financing is more nuanced. While firms in competitive markets or with limited capital resources tend to benefit from ESG improvement, larger firms in concentrated industries may face higher equity costs due to compliance demands and intensified investor scrutiny. These findings reveal the heterogeneous financial implications of ESG, shaped by firm attributes and institutional frictions in a transitional market setting. Overall, the empirical findings provide consistent support for all six proposed hypotheses, confirming both the core effects and contextual contingencies theorized in this study.
6.2. Discussions and Implications
Our findings on debt financing align with prior research, which indicates that ESG enhances creditworthiness by reducing perceived default risk and strengthening risk management [20,62]. We expand this literature by showing that such cost-reducing effects are more pronounced in Chinese firms with high environmental exposure or smaller market capitalization. These results refine the conclusions of Liang and Renneboog (2020), emphasizing that ESG benefits are conditional on financial vulnerability and external financing dependence [52,63]. For equity financing, our results contrast with the prevailing view in developed markets, which typically finds a negative relationship between ESG performance and equity costs [64,65]. In China, we find the relationship to be context dependent. Compliance intensity, investor expectations, and market structure moderate the impact of ESG on equity costs. These findings align with those of Raimo et al. (2021), who report that institutional maturity and firm adaptability are critical determinants of ESG’s financial payoff in emerging markets [66].
Financial regulation and ESG rating divergence significantly moderate the relationship between ESG and financing costs. In sectors with strong regulatory oversight, such as energy, manufacturing, and state-owned financial institutions, ESG disclosures are more effective in reducing financing costs. Conversely, in lightly regulated sectors or underdeveloped regions, ESG initiatives deliver fewer financial benefits due to weak monitoring, voluntary reporting, or inconsistent enforcement. Moreover, rating divergence undermines the effectiveness of ESG as a financial signal. Variations in scoring methodologies and data inputs across agencies create inconsistency, which increases investor uncertainty. This supports the findings by Berg et al. (2022) and Christensen et al. (2022), and this research further demonstrates that such divergence has measurable consequences on firms’ debt and equity costs in regulatory contexts lacking standardized ESG benchmarks [52,67].
Our findings contribute to the literature by highlighting the conditional nature of ESG’s financial value. ESG is not inherently rewarded across all contexts—it depends critically on regulatory strength, rating consistency, and firm-specific factors. This insight is significant for emerging economies where ESG infrastructure remains fragmented. From a policy perspective, our results suggest that regulatory agencies should not only mandate consistent ESG disclosure but also integrate ESG performance into capital allocation mechanisms. For instance, firms with higher ESG ratings could be eligible for preferential interest rates under green credit policies or be prioritized for green bond issuance. Such mechanisms can effectively incentivize ESG investment by lowering firms’ cost of capital through transparent regulatory design.
Moreover, ESG initiatives can enhance governance practices by improving the transparency of information, fostering stakeholder engagement, and strengthening internal control systems. Firms that invest in ESG often exhibit stronger board oversight and disclosure quality, which in turn reduce agency costs and promote long-term investor confidence. These improvements in governance serve as indirect channels through which ESG lowers financing frictions. Therefore, ESG not only functions as a reputational signal but also acts as a governance-enhancing tool with financial implications. For corporate managers, especially in SMEs and risk-prone industries, investing in ESG capabilities under a coherent regulatory framework offers a viable strategy to reduce capital costs and improve competitive advantage in increasingly sustainability-oriented capital markets.
6.3. Limitations and Future Research
This study has limitations. First, it relies on publicly available ESG ratings, which may lack comparability across time and providers. Future research could incorporate alternative ESG measures, including analyst-based scores or text-based indicators. Second, while we control for firm size and industry type, factors such as governance quality, ownership structure, and investor sentiment remain unexplored. Including these variables could enhance understanding of ESG’s financial effects. Finally, our focus on Chinese A-share firms may limit the generalizability of our findings. Future work could examine cross-listed firms or comparative studies across other emerging markets to assess ESG–financing linkages in broader institutional contexts.
Author Contributions
Conceptualization, D.Z.; Methodology, D.Z.; Software, D.Z.; Validation, D.Z.; Formal analysis, D.Z.; Investigation, D.Z.; Data curation, D.Z.; Writing—review & editing, D.Z., S.L.N. and A.H.J.; Visualization, D.Z.; Supervision, S.L.N. and A.H.J.; Project administration, S.L.N. and A.H.J.; Funding acquisition, S.L.N. and A.H.J. All authors have read and agreed to the published version of the manuscript.
Funding
This research was funded by Graduate School of Business, National University of Malaysia: GSB-2025-023.
Data Availability Statement
Data are contained within the article
Conflicts of Interest
The authors declare no conflict of interest.
Appendix A
Table A1.
Frequency distribution of firm–year.
Table A1.
Frequency distribution of firm–year.
| Year | Obs (n) | Percent (%) | Cumulative (%) |
|---|---|---|---|
| 2011 | 1556 | 7.72 | 7.72 |
| 2012 | 1541 | 7.64 | 15.36 |
| 2013 | 1444 | 7.16 | 22.52 |
| 2014 | 1605 | 7.96 | 30.48 |
| 2015 | 1843 | 9.14 | 39.62 |
| 2016 | 2107 | 10.45 | 50.07 |
| 2017 | 2233 | 11.07 | 61.14 |
| 2018 | 1806 | 8.96 | 70.1 |
| 2019 | 1867 | 9.26 | 79.36 |
| 2020 | 1962 | 9.73 | 89.09 |
| 2021 | 2201 | 10.91 | 100 |
| Total | 20,165 | 100 |
Table A2.
Industry distribution of firm–year observations based on CSRC classification (2011–2021).
Table A2.
Industry distribution of firm–year observations based on CSRC classification (2011–2021).
| Industry Code | Industry Name | Obs (n) | Percent (%) | Cumulative (%) |
|---|---|---|---|---|
| A | Agriculture, Forestry, Animal Husbandry, and Fishery | 199 | 0.99 | 0.99 |
| B | Mining | 539 | 2.67 | 3.66 |
| C | Manufacturing | 13296 | 65.94 | 69.6 |
| D | Electricity, Heat, Gas, and Water Production and Supply | 566 | 2.81 | 72.41 |
| E | Construction | 541 | 2.68 | 75.09 |
| F | Wholesale and Retail Trade | 906 | 4.49 | 79.58 |
| G | Transport, Storage, and Post | 578 | 2.87 | 82.45 |
| H | Accommodation and Catering | 61 | 0.3 | 82.75 |
| I | Information Transmission, Software, and IT Services | 1534 | 7.61 | 90.36 |
| K | Real Estate | 700 | 3.47 | 93.83 |
| L | Leasing and Commercial Services | 237 | 1.18 | 95.01 |
| M | Scientific Research and Technical Services | 243 | 1.21 | 96.22 |
| N | Water Conservancy, Environment, and Public Facilities | 310 | 1.54 | 97.76 |
| O | Resident Services, Repair, and Other Services | 6 | 0.03 | 97.79 |
| P | Education | 21 | 0.1 | 97.89 |
| Q | Health and Social Work | 60 | 0.3 | 98.19 |
| R | Culture, Sports, and Entertainment | 302 | 1.5 | 99.69 |
| S | Public Administration, Social Security, and Social Organizations | 66 | 0.33 | 100.02 |
Note: Industry classification follows the CSRC taxonomy. The table reports the number and percentage of firm–year observations in each industry over the study period.
Table A3.
Variance Inflation Factor (VIF) test.
Table A3.
Variance Inflation Factor (VIF) test.
| Variable | VIF | 1/VIF |
|---|---|---|
| Lev | 3.220 | 0.310 |
| Cashflow | 1.800 | 0.557 |
| Size | 1.770 | 0.567 |
| Liquid | 1.730 | 0.576 |
| Board | 1.600 | 0.624 |
| Indep | 1.490 | 0.669 |
| ROE | 1.380 | 0.727 |
| ESG | 1.150 | 0.870 |
| FirmAge | 1.150 | 0.873 |
| Eq cost | 1.140 | 0.875 |
| Growth | 1.110 | 0.904 |
| Mean VIF | 1.730 | |
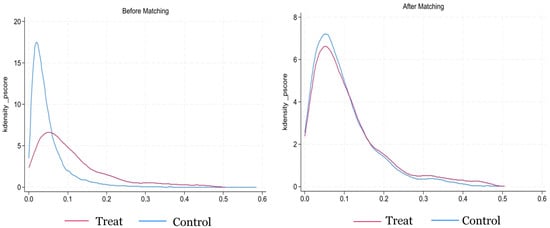
Figure A1.
Kernel density plots.
References
- Deloitte Insights. The Next Era of ESG Investing: Ingraining Sustainability into Value Creation. Deloitte Center for Financial Services, 2022. Available online: https://www2.deloitte.com/us/en/pages/consulting/articles/dedicated-sustainable-investing-trends.html (accessed on 27 May 2025).
- Wang, H.; Jiao, S.; Ma, C. The impact of ESG responsibility performance on corporate resilience. Int. Rev. Econ. Financ. 2024, 93, 1115–1129. [Google Scholar] [CrossRef]
- Donghui, Z.; Yusoff, W.S.; Salleh, M.F.M.; Lin, N.S.; Jamil, A.H.; Abd Rani, M.J.; Shaari, M.S. The impact of ESG and the institutional environment on investment efficiency in China through the mediators of agency costs and financial constraints. Soc. Sci. Humanit. Open 2025, 11, 101323. [Google Scholar] [CrossRef]
- Li, W.; Hu, H.; Hong, Z. Green finance policy, ESG rating, and cost of debt—Evidence from China. Int. Rev. Financ. Anal. 2024, 92, 103051. [Google Scholar] [CrossRef]
- Yang, Y.; Du, Z.; Zhang, Z.; Tong, G.; Zhou, R. Does ESG Disclosure Affect Corporate-Bond Credit Spreads? Evidence from China. Sustainability 2021, 13, 8500. [Google Scholar] [CrossRef]
- Deberdt, R.; DiCarlo, J.; Park, H. Standardizing “green” extractivism: Chinese & Western environmental, social, and governance instruments in the critical mineral sector. Extr. Ind. Soc. 2024, 19, 101516. [Google Scholar]
- Pham, H.; Ha, V.; Le, H.-H.; Ramiah, V.; Frino, A. The effects of polluting behaviour, dirty energy and electricity consumption on firm performance: Evidence from the recent crises. Energy Econ. 2024, 129, 107247. [Google Scholar] [CrossRef]
- Biswas, M.K.; Azad, A.K.; Datta, A.; Dutta, S.; Roy, S.; Chopra, S.S. Navigating Sustainability through Greenhouse Gas Emission Inventory: ESG Practices and Energy Shift in Bangladesh’s Textile and Readymade Garment Industries. Environ. Pollut. 2024, 345, 123392. [Google Scholar] [CrossRef]
- Zhang, D.; Rong, Z.; Ji, Q. Green innovation and firm performance: Evidence from listed companies in China. Resour. Conserv. Recycl. 2019, 144, 48–55. [Google Scholar] [CrossRef]
- Li, Y.; Zhao, Y.; Ye, C.; Li, X.; Tao, Y. ESG ratings and the cost of equity capital in China. Energy Econ. 2024, 136, 107685. [Google Scholar] [CrossRef]
- Ma, D.; He, Y.; Zeng, L. Can green finance improve the ESG performance? Evidence from green credit policy in China. Energy Econ. 2024, 137, 107772. [Google Scholar] [CrossRef]
- Tian, Y. Will Informal Institutions Affect ESG Rating Divergence? Evidence from Chinese Confucian Culture. Sustainability 2024, 16, 9951. [Google Scholar] [CrossRef]
- Baek, S.; Kang, M. Does ESG enhance asset quality and funding cost management in banking diversification? Financ. Res. Lett. 2025, 73, 106542. [Google Scholar] [CrossRef]
- Chen, Z.; Xie, G. ESG disclosure and financial performance: Moderating role of ESG investors. Int. Rev. Financ. Anal. 2022, 83, 102291. [Google Scholar] [CrossRef]
- Shi, Y.; Yao, T. ESG Rating Divergence: Existence, Driving Factors, and Impact Effects. Sustainability 2025, 17, 4717. [Google Scholar] [CrossRef]
- Thompson, E.K. ESG and stock price crash risk mitigation: Evidence from Korea. Humanit. Soc. Sci. Commun. 2025, 12, 278. [Google Scholar] [CrossRef]
- Wang, B.; Wei, C.; Shi, L.; Cheng, X.; Shi, X. ESG and firm operational efficiency: Evidence from Chinese listed companies. Environ. Dev. Sustain. 2025, 27, 681–714. [Google Scholar] [CrossRef]
- Jin, S.; Xiong, R.; Peng, H.; Tang, S. ESG performance and private enterprise resilience: Evidence from Chinese financial markets. Int. Rev. Financ. Anal. 2025, 98, 103884. [Google Scholar] [CrossRef]
- Chen, Y.; Li, T.; Zeng, Q.; Zhu, B. Effect of ESG performance on the cost of equity capital: Evidence from China. Int. Rev. Econ. Financ. 2023, 83, 348–364. [Google Scholar] [CrossRef]
- Maaloul, A.; Zéghal, D.; Ben Amar, W.; Mansour, S. The Effect of Environmental, Social, and Governance (ESG) Performance and Disclosure on Cost of Debt: The Mediating Effect of Corporate Reputation. Corp. Reput. Rev. 2023, 26, 1–18. [Google Scholar] [CrossRef]
- Darnall, N.; Ji, H.; Iwata, K.; Arimura, T.H. Do ESG reporting guidelines and verifications enhance firms’ information disclosure? Corp. Soc. Responsib. Environ. Manag. 2022, 29, 1214–1230. [Google Scholar] [CrossRef]
- Mao, Z.; Wang, S.; Lin, Y.-E. ESG, ESG rating divergence and earnings management: Evidence from China. Corp. Soc. Responsib. Environ. Manag. 2024, 31, 3328–3347. [Google Scholar] [CrossRef]
- Handoyo, S.; Anas, S. The effect of environmental, social, and governance (ESG) on firm performance: The moderating role of country regulatory quality and government effectiveness in ASEAN. Cogent Bus. Manag. 2024, 11, 2371071. [Google Scholar] [CrossRef]
- Akerlof, G.A. The Market for “Lemons”: Quality Uncertainty and the Market Mechanism. Q. J. Econ. 1970, 84, 488–500. [Google Scholar] [CrossRef]
- Frankel, R.; Li, X. Characteristics of a firm’s information environment and the information asymmetry between insiders and outsiders. J. Account. Econ. 2004, 37, 229–259. [Google Scholar] [CrossRef]
- Bilyay-Erdogan, S.; Danisman, G.O.; Demir, E. ESG performance and investment efficiency: The impact of information asymmetry. J. Int. Financ. Mark. Inst. Money 2024, 91, 101919. [Google Scholar] [CrossRef]
- Zhou, H.; Ma, Y. The implied risks caused by ESG rating divergence: A test based on the cost of equity capital. Appl. Econ. 2024, 1–18. [Google Scholar] [CrossRef]
- Gillan, S.L.; Koch, A.; Starks, L.T. Firms and social responsibility: A review of ESG and CSR research in corporate finance. J. Corp. Financ. 2021, 66, 101889. [Google Scholar] [CrossRef]
- Jensen, M.C.; Meckling, W.H. Theory of the Firm: Managerial Behavior, Agency Costs, and Ownership Structure. In Economics Social Institutions: Insights from the Conferences on Analysis & Ideology; Brunner, K., Ed.; Springer: Dordrecht, The Netherlands, 1979; pp. 163–231. [Google Scholar]
- Alves, C.F.; Meneses, L.L. ESG scores and debt costs: Exploring indebtedness, agency costs, and financial system impact. Int. Rev. Financ. Anal. 2024, 94, 103240. [Google Scholar] [CrossRef]
- Del Gesso, C.; Lodhi, R.N. Theories underlying environmental, social and governance (ESG) disclosure: A systematic review of accounting studies. J. Account. Lit. 2024. ahead of print. [Google Scholar] [CrossRef]
- Elkington, J. The triple bottom line. In Environmental Management: Readings and Cases; Sage Publishing: New York, NY, USA, 1997; Volume 2, pp. 49–66. [Google Scholar]
- Liu, L. Impact of firm ESG performance on cost of debt: Insights from the Chinese Bond Market. Macroecon. Financ. Emerg. Mark. Econ. 2024, 1–20. [Google Scholar] [CrossRef]
- Cheng, Z.; Su, Y. ESG and Chinese corporate OFDI. Res. Int. Bus. Financ. 2024, 72, 102522. [Google Scholar] [CrossRef]
- Avramov, D.; Cheng, S.; Lioui, A.; Tarelli, A. Sustainable investing with ESG rating uncertainty. J. Financ. Econ. 2022, 145, 642–664. [Google Scholar] [CrossRef]
- Zarzycka, E.; Krasodomska, J. Non-financial key performance indicators: What determines the differences in the quality and quantity of the disclosures? J. Appl. Account. Res. 2022, 23, 139–162. [Google Scholar] [CrossRef]
- Serafeim, G.; Yoon, A. Stock price reactions to ESG news: The role of ESG ratings and disagreement. Rev. Account. Stud. 2023, 28, 1500–1530. [Google Scholar] [CrossRef]
- Chen, Y.; Zhang, Y.; Wang, M. Green credit, financial regulation and corporate green innovation: Evidence from China. Financ. Res. Lett. 2024, 59, 104768. [Google Scholar] [CrossRef]
- Jin, X.; Qi, H.; Huang, X. Green financial regulation and corporate strategic ESG behavior: Evidence from China. Financ. Res. Lett. 2024, 65, 105581. [Google Scholar] [CrossRef]
- Zhang, D. Green financial system regulation shock and greenwashing behaviors: Evidence from Chinese firms. Energy Econ. 2022, 111, 106064. [Google Scholar] [CrossRef]
- Jamaani, F.; Alidarous, M. Does voluntary environmental, social, and governance disclosure impact initial public offer withdrawal risk? Bus. Ethics Environ. Responsib. 2024, 1–38. [Google Scholar] [CrossRef]
- Li, J.; Wang, K.; Mei, Y. State-Owned Capital Participation and Corporate Environmental, Social, and Governance Performance: Evidence from Chinese Private Firms. J. Knowl. Econ. 2024, 1–28. [Google Scholar] [CrossRef]
- Zhou, X.; Nian, S. Sustainable Pathways: ESG Disclosure Performance and Optimization in China. Sustainability 2024, 16, 4630. [Google Scholar] [CrossRef]
- Wang, W.; Sun, Z.; Dong, Y.; Zhang, L. Cost of debt financing, stock returns, and corporate strategic ESG disclosure: Evidence from China. Bus. Ethics Environ. Responsib. 2024. [Google Scholar] [CrossRef]
- Amiraslani, H.; Lins, K.V.; Servaes, H.; Tamayo, A. Trust, social capital, and the bond market benefits of ESG performance. Rev. Account. Stud. 2023, 28, 421–462. [Google Scholar] [CrossRef]
- Dell’Erba, M.; Gomtsyan, S. Regulatory and investor demands to use ESG performance metrics in executive compensation: Right instrument, wrong method. J. Corp. Law Stud. 2024, 24, 1–40. [Google Scholar] [CrossRef]
- Al-Shaer, B.; Aldboush, H.H.H.; Alnajjar, A.H.H. Corporate governance and firm performance: In Qatari non-financial firms. J. Islam. Account. Bus. Res. 2024. ahead of print. [Google Scholar] [CrossRef]
- Ren, Y.-S.; Boubaker, S.; Liu, P.-Z.; Weber, O. How does carbon regulatory policy affect debt financing costs? Empirical evidence from China. Q. Rev. Econ. Financ. 2023, 90, 77–90. [Google Scholar] [CrossRef]
- Hu, D.; Li, X.; Xiang, G.; Zhou, Q. Asset pricing models in the presence of higher moments: Theory and evidence from the U.S. and China stock market. Pac.-Basin Financ. J. 2023, 79, 102053. [Google Scholar] [CrossRef]
- Zhang, Y.; He, M.; Liao, C.; Wang, Y. Climate risk exposure and the cross-section of Chinese stock returns. Financ. Res. Lett. 2023, 55, 103987. [Google Scholar] [CrossRef]
- Li, P.; Wang, K.; Zhang, J. Does the inclusion of Chinese A-shares in the MSCI EM index promote ESG performance? Financ. Res. Lett. 2023, 58, 104444. [Google Scholar] [CrossRef]
- Berg, F.; Kölbel, J.F.; Rigobon, R. Aggregate Confusion: The Divergence of ESG Ratings*. Rev. Financ. 2022, 26, 1315–1344. [Google Scholar] [CrossRef]
- Zhang, L.; Chen, J.; Liu, Z.; Hao, Z. Digital Inclusive Finance, Financing Constraints, and Technological Innovation of SMEs—Differences in the Effects of Financial Regulation and Government Subsidies. Sustainability 2023, 15, 7144. [Google Scholar] [CrossRef]
- Ahamed, F.T.; Houqe, M.N.; van Zijl, T.J.A. Meta-analysis of the impact of financial constraints on firm performance. Account. Financ. 2023, 63, 1671–1707. [Google Scholar] [CrossRef]
- Joshi, R.; Wooldridge, J.M. Correlated Random Effects Models with Endogenous Explanatory Variables and Unbalanced Panels. Ann. Econ. Stat. 2019, 243–268. [Google Scholar] [CrossRef]
- La Ferrara, E.; Chong, A.; Duryea, S. Soap Operas and Fertility: Evidence from Brazil. Am. Econ. J. Appl. Econ. 2012, 4, 1–31. [Google Scholar] [CrossRef]
- Liu, S.; Wang, Y. Green innovation effect of pilot zones for green finance reform: Evidence of quasi natural experiment. Technol. Forecast. Soc. Change 2023, 186, 122079. [Google Scholar] [CrossRef]
- Caliendo, M.; Kopeinig, S. Some practical guidance for the implementation of propensity score matching. J. Econ. Surv. 2008, 22, 31–72. [Google Scholar] [CrossRef]
- Alshahrani, F.; Eulaiwi, B.; Duong, L.; Taylor, G. Climate change performance and financial distress. Bus. Strategy Environ. 2023, 32, 3249–3271. [Google Scholar] [CrossRef]
- Yao, S.; Pan, Y.; Sensoy, A.; Uddin, G.S.; Cheng, F. Green credit policy and firm performance: What we learn from China. Energy Econ. 2021, 101, 105415. [Google Scholar] [CrossRef]
- Guo, S.; Zhang, Z. Green credit policy and total factor productivity: Evidence from Chinese listed companies. Energy Econ. 2023, 128, 107115. [Google Scholar] [CrossRef]
- Goss, A.; Roberts, G.S. The impact of corporate social responsibility on the cost of bank loans. J. Bank. Financ. 2011, 35, 1794–1810. [Google Scholar] [CrossRef]
- Liang, H.; Renneboog, L.J. Corporate Social Responsibility and Sustainable Finance: A Review of the Literature; European Corporate Governance Institute: Brussels, Belgium, 2020. [Google Scholar]
- Albuquerque, R.; Koskinen, Y.; Yang, S.; Zhang, C. Resiliency of Environmental and Social Stocks: An Analysis of the Exogenous COVID-19 Market Crash. Rev. Corp. Financ. Stud. 2020, 9, 593–621. [Google Scholar] [CrossRef]
- Flammer, C. Corporate green bonds. J. Financ. Econ. 2021, 142, 499–516. [Google Scholar] [CrossRef]
- Raimo, N.; Caragnano, A.; Zito, M.; Vitolla, F.; Mariani, M. Extending the benefits of ESG disclosure: The effect on the cost of debt financing. Corp. Soc. Responsib. Environ. Manag. 2021, 28, 1412–1421. [Google Scholar] [CrossRef]
- Christensen, D.M.; Serafeim, G.; Sikochi, A. Why is Corporate Virtue in the Eye of The Beholder? The Case of ESG Ratings. Account. Rev. 2022, 97, 147–175. [Google Scholar] [CrossRef]
Disclaimer/Publisher’s Note: The statements, opinions and data contained in all publications are solely those of the individual author(s) and contributor(s) and not of MDPI and/or the editor(s). MDPI and/or the editor(s) disclaim responsibility for any injury to people or property resulting from any ideas, methods, instructions or products referred to in the content. |
© 2025 by the authors. Licensee MDPI, Basel, Switzerland. This article is an open access article distributed under the terms and conditions of the Creative Commons Attribution (CC BY) license (https://creativecommons.org/licenses/by/4.0/).