Abstract
Mobile payment technology (MPT) has emerged as a tool with the potential to advance financial inclusion and sustainable development. However, the existing literature inadequately explains how sustainability factors influence user behavior toward MPT adoption and how this behavior translates into financial inclusion especially under the influence of mobile transaction tax policies in African countries. This study addresses this gap by examining the antecedents of sustainable usage behaviors of MPT and their implications for digital financial inclusion in Ghana. Specifically, it integrates the triple bottom line (TBL) dimensions (economic, social, and environmental impact) with constructs from the theory of planned behavior (TPB) (attitude, perceived behavioral control, and subjective norms) into a unified sustainability-TPB framework. This study further investigates the moderating role of a mobile transaction tax policy (MTTP) on the relationship between sustainable usage behaviors and financial inclusion. The PLS-SEM method was utilized to analyze the theoretical model using the cross-sectional data of 320 respondents. The findings of this study supported that all TBL dimensions and TPB constructs influence behavioral intention and adoption through the usage of mobile payment technology and consequently financial inclusion. Notably, the mobile transaction tax policy negatively impacts the adoption of sustainable behaviors and financial inclusion. This study contributes to the current theoretical discourse on sustainable consumer behaviors and positions it on the broader sustainable development framework through financial inclusion by providing a shred of empirical evidence in the Ghanaian mobile payment industry perspective. The practical and policy implications are also suggested.
1. Introduction
Achieving sustainable development has become paramount given the current sustainability crises globally. Among the sustainability crises is the lack of financial access, which exacerbates poverty and inequality and slows the pace of economic activities in both developed and developing countries. The innovation in digital finance has emerged as a critical driver of Sustainable Development Goals (SDGs) through universal financial inclusion, which holds significant promise for both developed and developing economies [1], making digital finance especially the mobile money industry of utmost importance to development practitioners and policymakers. The emergence, adoption growth, and continuance usage of MPT in emerging economies, particularly Ghana has positioned the industry as a viable alternative to generate revenue as the mobile transaction value has increased by about $81 billion [2]. Rapid mobile device penetration has fueled mobile payment growth, positioning Ghana as a leading mobile money market. As of 2022, Ghana recorded 55.3 million mobile money accounts, with active transactions totaling GHS 122 billion [3].
While there has been growing interest in mobile payment technology and several studies have been conducted, there remain significant gaps in the extant literature. Firstly, the literature connecting TBL dimensions (economic and social environmental impact) on perceived behavioral control, subjective norms, and attitudes for behavioral intention and the adoption of sustainable behaviors through the usage of mobile payment technology (MPT) is limited. Past studies concentrate on only TPB and other dominant adoption theories [4,5,6,7]. Also, there is fragmented evidence on the intention and adoption of a sustainable behavior gap [8,9]. Some past studies have demonstrated that not all intentions lead to actual behaviors [10], a gap this study seeks to fill. Therefore, moving beyond psychological behavioral factors affecting behavioral intentions and adoption, this study makes a significant contribution to extending TBL dimensions for sustainable behaviors.
Secondly, some scholars have argued that the adoption of MPT does not always translate into financial inclusion and, hence, presents contradictory findings [11,12], and its contribution to sustainable development through financial inclusion may be unclear. Thus, the argument is centered on the high cost of transaction charges, and soft loan accessibility traps users into perpetual indebtedness which may potentially have a negative impact on financial inclusion when users make trade-off decisions between continuance usage and discontinuance usage. This uncertainty calls for further research, although there has been a significant positive relationship obtained by past studies on this subject matter [13,14].
Presently, the mediation role of perceived behavioral control, subjective norms, and attitude are scarce in past studies [15], making this study novel in this direction. Thus, individuals’ behavioral intentions can be greatly impacted by the economic, social, and environmental impact of MPT and not merely perceived behavioral, subjective norms, and attitudes. Past studies have demonstrated the possible mediation effects of perceived behavioral, subjective norms, and attitudes on the beliefs and behavioral intention for mobile payment through beliefs [16]. Supporting this is the claim by Ajzen that other factors might influence behavioral intention through TBP constructs [17]. Again, Altawallbeh et al. [18] argued in their study that there exists a mediation effect of TPB constructs, salient beliefs, and e-learning intention. The growing consumer awareness of sustainability issues triggers how consumers make adoption decisions.
Furthermore, it is unclear whether the taxation policies by African governments in the mobile payment industry moderate the relationship between the adoption of sustainable usage behaviors and financial inclusion. Research has investigated the consumers’ perception of MTTP for mobile money uptake [19], the adoption factors of MTTP in advancing continuance usage [20,21], MTTP on price value and customer satisfaction [22], the impact of MTTP on informal workers [23], and MTTP as a moderator between financial well-being and usage [19]. While some of these studies relied on only qualitative approaches [19], little is known about its moderation effects on the relationship between adoption and financial inclusion. Several calls to remove MTTP have been made because its negative externalities on usage and financial inclusion reflect its potential to drive adoption decisions and financial inclusion [24,25].
Additionally, there is a lack of theoretical grounding on the nexus of MTTP, the adoption of sustainable usage behaviors, and financial inclusion due to the predominance of previous study reports and literature reviews [19,26,27,28]. Again, there are no well-established theories that have built a conceptual framework in previous studies regarding this relationship. Additionally, the current literature emphasizes the direct effect of MTTP on the continuance usage of MPT [29,30]. Hence, by filling this gap, this study applies a PLS-SEM approach to provide empirical evidence on the subject matter. Also, the sustainability TPB was used to develop a conceptual framework to investigate the nexus of MTTP, the adoption of sustainable usage behaviors, and financial inclusion.
Notwithstanding the gains to financial inclusion that are attributed to the mobile payment technology in Ghana, many fear MTTP, the issue of fraud, and the other challenges that have marred the industry and made the usage of the MPT unpopular; hence, appropriate strategies must be adopted to sustain the industry; among these strategies is the role of consumer behavior. As consumers are increasingly aware of prevailing sustainability issues and align their adoption decision in that regard, this study is significant in uncovering the antecedents of behavioral intention, the adoption of sustainable usage behaviors of the MPT, its implication on financial inclusion, and how MTTP moderates the nexus of the adoption of sustainable usage behaviors of the MPT and financial inclusion. Given the unique socioeconomic and cultural landscape of Ghana’s mobile payment industry, this would provide valuable insights to stakeholders and service providers with the impetus of translating behavioral intention into financial inclusion. From the viewpoint of development partners and policymakers’ efforts to achieve the UN Sustainable Development Goals by 2030, the mobile payment industry’s contributions could be promoted and sustained by utilizing the findings of this study.
The rest of the paper is organized as follows: Section 2 presents the literature and hypothesis development; Section 3 details the research methodology, and Section 4 and Section 5 present the results and discussion, respectively. The last section, Section 6, contains the conclusion, theoretical contribution, practical implication and limitation, and suggestions for further research.
2. Literature Review
2.1. Perceived Behavioral Control, Subjective Norm, and Attitude
Building from the theory of reason action (TRA) proposed in 1975 by Fishbein and Ajzen, attitudes are formed as a result of cognitive information that eventually affects how an individual behaves. The theory posits that human beings are rational, and when exposed to various sources of information, they synthesize this information to consider the consequences before acting [31]. It was further extended to add a concept known as perceived behavioral control (PBC) because Ajzen found that attitudes can be affected by the external environment. This brought about a new behavioral model termed the theory of planned behavior (TPB) [32].
The main objective of TPB is to understand and predict the intentions behind people’s engagement in a particular behavior [33], which states that a person’s likelihood of engaging in an activity depends on how strongly they intend to do so [34]. Attitudes, subjective norms, perceived behavioral control, and behavioral intention make up the major constructs of TPB [34]. A person’s attitude toward an action is determined by their perceptions of the conduct’s results and how valuable or desirable they find those results to be; also, a subjective norm refers to the perceived social pressure or impact from close friends or family members to engage or not to engage in a particular action; additionally, perceived behavioral control refers to the individual’s view of their capacity to carry out a behavior successfully; while the behavioral intention is influence by subjective norms, attitudes, perceived behavioral control.
Behavioral intention acts as a direct influence on actual behavior. In the context of sustainable behaviors, the principal factor identified by the TPB is the individual’s intention to participate in sustainable activities. The other three significant factors play an important function in TPB: the individual’s attitude toward sustainability, the prevailing SN, and their PBC [35]. Scholars have advocated that TPB can be refined and validated across different contexts [4,36,37]. Given our present study, we incorporated a novel extension using the three TBL dimensions (economic, social, and environmental) as a factor affecting intentions and sustainable adoption behaviors. This extension helped us to effectively contribute to the literature on consumer behavior and sustainable development. In extant studies of sustainable behaviors, all the constructs of TPB have been confirmed to influence behavior by first influencing intentions [38,39].
2.2. Triple Bottom Line Dimensions
The triple bottom line theory is drawn from the concept of sustainable development (SD). The triple bottom line (TBL) was first introduced by John Elkington in 1997 [39,40,41], who extended the traditional measure of business success for financial profitability to include social and environmental performance. TBL challenges businesses to broaden their focus from solely generating financial returns to considering the broader impacts of their operations and advocating for a balanced approach to SD. SD gained significant prominence after the Brundtland Report in 1987 titled “Our Common Future” [42] and has since become a discourse and global policy agenda. There, SD was defined as a development that meets the needs of the present without compromising the ability of future generations to meet their own needs [42]. The key main themes in the TBL are “People, Planet, and Profit”, where “Profit” focuses on achieving economic performance, “People” focuses on social and political performance, and “Planet” focuses on environmental sustainability.
The economically sustainable dimension demonstrates how a business or organization’s operations impact the economic system and its sustainable practices by ensuring that resources meant for future generations are not depleted [41]. Concerning our current study, the economic impact criteria assessment explores its direct impacts on TPB constructs and indirect impact on behavioral intention to adopt sustainable behaviors through MPT. The environmentally sustainable dimension assesses how a company’s operations affect the natural environment. It includes considerations like resource efficiency, waste management, the carbon footprint, and the overall environmental impact. The goal is to reduce harm to the environment and ensure the sustainability of natural resources [41]. Prior studies have highlighted the relevance of MPT in enhancing environmental sustainability [43,44,45]. The social impact dimension of the TBL examines how a company’s actions affect the people involved or impacted by its operations, including employees, customers, suppliers, and the broader community. The social impact dimension is used in this study to investigate its direct impact on TPB constructs and its indirect impact on behavioral intention to adopt sustainable behaviors through MPT.
2.3. Financial Inclusion
The financial inclusion concept has been widely accepted and received great attention in academia, financial discourse, policy, and development since the 2008 financial crisis. Governments, policymakers, and development partners such as the G20, the World Bank (WB), the International Monetary Fund (IMF), and the AFDB have recognized financial inclusion as an important determinant in achieving sustainable development. There have been several attempts to define and conceptualize financial inclusion, hence leading to diversity in perspectives without a commonly accepted definition [46]. These divergent views stem from the fact that the financial inclusion concept is multidimensional and has led to the complexity and vagueness of the financial inclusion concept in attaining sustainable development [2]. However, financial inclusion practices vary from country to country [47]. There has been a consensus in the scholarly literature from different schools of thought that the core of financial inclusion involves integrating the weaker and more vulnerable segments of society into the formal financial system, ensuring that they have access to timely and sufficient credit along with other financial services at an affordable cost. According to Olaniyi and Adeoye, financial inclusion refers to the provision of financial services to a significant portion of the population, ensuring widespread access [48].
Financial inclusion indicators are measurable factors used to assess the accessibility, usage, and quality of financial services within a population, otherwise known as determinants. These indicators help evaluate the extent to which financial systems include marginalized or underserved groups [49]. Financial inclusion indicators are commonly categorized into three main dimensions, namely access, usage, and quality [50]. Burkett and Sheehan identified five key indicators of financial inclusion, which are also known as the ‘five A’s of financial inclusion’, including availability, access, awareness, appropriateness, and affordability [51]. Financial inclusion not only provides access but also involves an important aspect in assisting people to manage their finances effectively and in achieving overall societal financial capabilities [52]. Financial inclusion is positioned as a crucial developmental strategy that is geared toward economic growth [53].
The access indicators measure the availability and physical reach of the MPT. This implies how easily individuals and businesses can access mobile payment services. It considers the penetration rate of adults with access to the service. It measures service points, the number of branches, and mobile money agents per 1000 people or per square kilometer. It also looks at the availability of digital financial services, including mobile payments and account ownership, and the proportion of adults with a mobile money account [54].
The usage indicators measure how frequently and effectively people use mobile payment services while taking note of the transaction volume, value, and in-person transactions. It also relates to the measurement of savings and credit activity, that is, the percentage of adults using savings accounts, credit facilities, or borrowing from mobile payment operating services. Additionally, it considers the frequency of using electronic payments for bills, wages, and remittances and the proportion of the population with access to formal insurance products [54].
Relatedly, the quality indicators evaluate the suitability and customer satisfaction levels of the MPT services. It also evaluates the affordability of the MPT in terms of cost relative to income levels, including transaction fees and interest rates. It clarifies consumer protection such as the availability of regulatory safeguards, dispute resolution mechanisms, and data privacy policies. Also, a quality indicator measures the proportion of the population with knowledge and an understanding of financial services and lastly the range of financial products tailored to different consumer needs [55]. Finally, financial inclusion indicators also account for demographic and socioeconomic indicators in the literature. It captures financial inclusion across different population groups and social classes, the difference in financial access between men and women, an income level that includes MPT usage across different economic strata (low-income vs. high-income), disparities in service availability between urban and rural areas, education, etc. [56].
Regarding the factors of financial inclusion, the extant literature from the international and domestic levels has focused on either the microeconomic perspective [57,58] or the macroeconomic perspective [48,59,60]. Previous studies have identified market opportunities, collateral requirements, and demand-side and supply-side factors affecting financial inclusion [61,62,63]. The microeconomic approach has been widely applied in the literature using demand-side factors, resulting in a paucity of empirical evidence using cross-sectional data or panel data [53]. In our study, we conceptualize finances in terms of availability, quality, and continuance usage.
2.4. Mobile Transaction Tax Policy
The fast growth in MPT as an alternative means of financial access to fill in the financial infrastructure gap created by the traditional financial institutions in most developing countries over the past decade has made it an ideal platform for government revenue mobilization.
As a new approach to revenue mobilization, there have been a lot of controversies regarding mobile taxation acceptance, its impact on achieving universal financial inclusion, and the sustainability of the industry in sub-Saharan countries. A sound tax system according to the principles of taxation should consider equity, efficiency, certainty, the economy, and convenience, among others, in its formulation. A tax system that follows these principles is often seen as acceptable by the populace, hence stimulating economic growth and minimizing distortions in the market. MPT is a key driver of financial inclusion; therefore, a poorly designed MTTP can negatively influence the achievement of sustainable development through financial inclusion. Researchers view MTTP as a regressive form of multiple taxations common in Africa, raising concerns about equity. The widespread rejection of mobile money taxes highlights flaws in the current tax system [64].
Table 1 shows some selected Sub-Saharan countries that implemented mobile tax levies. In the table, even though the structure is different, the similarity among them is that they are all applied in the mobile money sector, apart from the Zimbabwean tax, which is also applied to bank transfers and swiping transactions with bank cards. Kenya’s situation is unique compared to other sub-Saharan countries where an earlier 10 percent was charged on the transaction fees of telecommunication and was later revised to 12%. In Malawi and Uganda, the implementation of the one (1) percent mobile money tax was welcomed by several public demonstrations but was later abolished, while it was revised downwards for other countries like Ghana.
According to previous studies, for example, ref. [65] assessed mobile tax incidence on the adoption of electronic money and the advancement of financial inclusion in the mobile network industry. The author found that mobile tax increases the transaction fees which positively increases the demand for the use of cash in sub-Saharan countries. He then proposed that authorities eliminate mobile taxes to achieve the full adoption and usage of mobile money services. Similarly, an opinion-based survey on the mobile money tax showed reductions in usage by 47 percent and 44 percent compared to before [66]. Similar results have been obtained by [29,67], and the mobile money tax will force people to resort to the use of cash instead of mobile payment and therefore call for its complete withdrawal. The mobile money tax increases the transaction cost per transaction above the minimum threshold. Stakeholders are of the view that the mobile tax is regressive and also forces the poor back into poverty. Specifically, MTTP can impede continuous usage and consequently financial inclusion. Translating sustainable usage behaviors into financial inclusion may demand sound policies both externally and within the institutional environment of the mobile payment industry. Accordingly, we examine the moderation effects of MTTP on the adoption of sustainable usage behaviors and financial inclusion.

Table 1.
Mobile money transaction tax in some selected African countries.
Table 1.
Mobile money transaction tax in some selected African countries.
| Countries | Introductory Rate/Date | Current Rate | Incidence | Reference |
|---|---|---|---|---|
| Ghana | 1.5 | 1 | Mobile money, electronic, bank transfers, and remittances | [68] |
| Kenya | 10.0 | 12.0 | On transaction fees | [2,65,69,70] |
| Cote d’Ivoire | 0.5/January 2018 | 0.54 | Payment and cash transfers | [2,65] |
| Uganda | 1.0/June 2018 | 0.5 | Withdrawals only | [2,71] |
| Zimbabwe | 2.0/October 2018 | 2.0 | Mobile money, electronic and bank transfers | [2,65,71] |
| Malawi | 1.0/September 2019 | 0.0 | - | [2,65] |
| Tanzania | 3.0/July 2021 | 2.0 | Transfer, sending, withdrawal | [2,65,71] |
| Cameroon | 0.2/January 2022 | 0.2 | Mobile money, electronic and bank transfers | [2,65,71] |
2.5. Development of Hypotheses
2.5.1. TPB Constructs
The Influence of Perceived Behavioral Control on Behavioral Intention to Use Mobile Money Payment Technology
Perceived behavioral control, which refers to a person’s subjective assessment of their ability to successfully carry out a particular action, is one of the constructs in TPB that impacts behavioral intentions [34]. For example, given two people with similar intentions to adopt a particular behavior, the one with strong confidence about his or her abilities or behavioral control is more likely to perform that behavior.
PBC is made up of internal control which is also referred to as self-efficacy and external control [72]. With regard to using mobile payment technology, if a person’s self-efficacy is positive, then the person feels positive about their behavioral control, which in turn leads to the intention to adopt sustainable behaviors. This means that the more a person feels he or she is in control of adopting sustainable behaviors, the more he or she is likely to adopt them. Evidence shows that perceived behavioral control impacts intention [73,74,75]. Hence, the study proposes the following hypothesis.
H1.
Perceived behavioral control has a positive effect on the behavioral intention to adopt sustainable behaviors through the usage of MPT.
The Influence of Subjective Norms on Behavioral Intention to Use Mobile Money Payment Technology
A subjective norm refers to the perceived social pressure or impact from significant others to engage or not engage in a particular action [34]. It has been established that SN alongside the intention to adopt a behavior should lead to the adoption of that behavior. Individuals are more likely to engage in a behavior when societal norms require participation in that behavior. On the other hand, individuals are less likely to engage in the behavior in question if social norms forbid it. For people to adopt sustainable behaviors through the use of mobile payment services, sustainable behaviors shown as desirable behavior by their significant others will, in turn, generate acceptance by the individual in question; however, SN is often seen as a weaker predictor of intention [76,77,78,79]. No correlation was found at all in the study by [80]. These varied conclusions might be on the narrow conceptualization of SN as argued by [79]. To increase the predictive power of SN in this study, we conceptualized SN in two ways, that is, social norms and descriptive norms. Social norms refer to the perception of a significant other’s opinion on how an individual should behave, while descriptive norms describe the actual or real actions and behaviors others are performing.
Most studies do not measure both components but rely mainly on what others think I should do (injunctive question), which is an example of a social norm, and none or less of what their significant others actually do (descriptive norm questions). Descriptive norms have been argued to correlate with intentions [81], and the inclusion of both social norms and descriptive norms from the study by Ham M. et al. [81] confirmed the increased in variance explained in intentions. On the flip side, some studies have found no significant influence between subjective norms and behavioral intention because of its flaws and complexity [82] and limited capacity to explain consumer behavior [83]. The above details do not differ from adoption behaviors through the use of mobile payment services. Our formulated hypothesis is as follows.
H2.
Subjective norms (social and descriptive norms) have a positive and significant effect on the behavioral intention to use MPT.
The Influence of Attitude on Behavioral Intention to Use Mobile Money Payment Technology
Attitude refers to the individual’s overall evaluation or perception of a favorable or unfavorable judgment about a particular behavior question [34]. A person’s attitude toward an action is determined by their perceptions of the conduct’s results and how valuable or desirable they find those results to be [84]. Otherwise, attitude is the mental state of consumers resulting in their reaction to objects, people, and situations [85]. Attitude has a stronger relationship with intention than intentions and actual behavior [86]. Regarding MPT usage behaviors, a person’s value judgment is the cognitive assessment of their behaviors. The attitude towards behaviors is observed to be positively related to the intention to adopt such behaviors [87,88,89,90]. However, Wang, Lei, et al. [91] study regarding the intention to stay in green hostels found that attitude does not affect intention. The hypothesis is formulated as follows.
H3.
The attitude towards sustainable usage has a positive influence on the behavioral intention to use MPT.
The Influence of Behavioral Intention on Sustainable Usage Behaviors Through Mobile Payment Technology
Behavioral intention is a crucial indicator of people’s behavior, as it influences their propensity to engage in a particular activity [92]. Consumers decide whether to accept or reject a product, and their motivation can be understood through their intention [93,94,95]. Recent research on technological adoption highlights the importance of intention in influencing real behavior [96,97,98,99,100]. Similarly, the TPB model has confirmed that intention leads to actual behavior [101]. Nevertheless, it is argued that intentions do not always reflect actual adoption behaviors [102]. This implies that the intention to perform a behavior may or may not lead to that behavior. The intention–behavior gap is often associated with its dynamic nature. Based on the discussion in the literature regarding intention and adoption, we propose the following hypothesis.
H4.
The behavioral intention to use MPT has a positive effect on the sustainable usage behavior through MPT.
The Influence of Sustainable Usage Behaviors Through Mobile Payment Technology on Financial Inclusion
Sustainable behavior through MPT is defined as conscious and recurring patterns of mobile payment use that yield desirable benefits across environmental, social, and economic domains [103]. Hence, our study conceptualizes the adoption of sustainable behaviors in terms of environmental (e.g., reduction in paper-based transactions), social (e.g., inclusion of underserved populations in formal financial systems), and economic (e.g., cost savings and transparency in budgeting) dimensions.
Financial inclusion, on the other hand, is a growing topic and involves providing accessible, affordable, and usable financial services to individuals and businesses [54]. According to the World Bank (2017), financial inclusion refers to providing financial services to underserved populations. It is essential for poverty reduction and economic growth. Mobile payment systems help achieve financial inclusion by overcoming geographic limitations and high transaction costs [104]. Despite progress through digital innovations, 1.4 billion adults remained unbanked globally as of 2021 [54].
Economically, sustainable behaviors through MPT usage enhance security by minimizing transactions and cash-handling risks [105]. Similarly, inefficiencies in cash payments are eliminated with the sustainable use of MPT. For example, in Rwanda, digital payments drastically reduced revenue linkages in public institutions [106]. Again, it promotes economic participation by facilitating micro-transactions and credit access. The authors found that M-Pesa in Kenya lifted 194,000 households out of poverty by improving financial access.
In the environmental domain, Sustainable Development Goal 7, which is to provide affordable and clean energy, contribute benefits from digital financial inclusion to reduce cost, boost the environment, and expand access to energy, has been made possible because of the sustainable use of MPT. Projections suggest a continued shift from cash-based to mobile-based payment transactions globally, highlighting the increasing role of mobile payment in promoting sustainability [107]. This transformation is especially relevant in reducing carbon emissions related to physical commuting for cash transactions and energy consumption in traditional banking, as mobile payment systems eliminate physical infrastructure needs, thereby lowering carbon footprints. Given the environmental implications of digital payment adoption, the existing literature increasingly recognizes the importance of consumer behavior in shaping sustainable mobile payment practices. Studies on consumer behavior demonstrate an evolving awareness of the environmental impact, spurred partly by the COVID-19 pandemic, which influenced 58% of adults across 24 countries to adopt more environmentally conscious lifestyles [108].
Socially, sustainable behavior through the use of MPT enhances financial inclusion through accessibility and affordability by providing a variety of mobile payment options to reduce barriers to access to financial services [104]. Additionally, for Sustainable Development Goal 8, which is decent work and economic growth, MPT helps workers save money, reduce transaction costs, and enhance logistics in service delivery. Also, Sustainable Development Goal 9 helps empower small businesses, mobile agents, merchants, and MNOs to reach out to new markets and bring consumers who were originally excluded into the digital economy. Additionally, Sustainable Development Goal 11, that is, sustainable cities and communities, benefits from the sustainable usage of MPT since it provides inclusive finance, as well as reduces the cost of transportation.
The extant literature has established a positive relationship between sustainable behavior with the usage of MPT and financial inclusion [2,11,13,109]. It is evident that the increasing adoption and maintenance of a sustainable usage behavior of MPT significantly influence financial inclusion; however, its impact requires proper assessment. In this study, financial inclusion is conceptualized using a reflective model tailored to country-specific determinants linked to financial inclusion. This model encompasses three key dimensions: accessibility, availability, and the utilization of financial services, as outlined by Sarma [55,110]. We propose the following hypothesis.
H5.
The actual adoption of sustainable behaviors through the usage of MPT has a positive influence on financial inclusion.
2.5.2. Triple Bottom Line Dimensions Influence on TPB Constructs
The Influence of the Perceived Economic Impact on Perceived Behavioral Control, Subjective Norms, and Attitude
The perceived economic impact denotes the perceived cost or financial gains from the usage of a service or the adoption of a technology like mobile payment [111]. The impact on transaction cost, efficiency, convenience, and security impacts one’s attitude regarding mobile payment technology. An individual will be motivated to act if their attitude toward using a product or service supports economic sustainability [112]. Digital payment has made a substantial contribution on the economic and social front, making it a useful subject for examining consumer acceptance [112]. Qu et al. [113] noted that as the economy expands, the adoption of non-cash payment spreads.
Existing research suggests that when consumers perceive mobile payment systems as beneficial for saving money or improving their financial awareness, they develop a favorable attitude toward this payment system [114]. As a result, this positive perception strengthens their intention to adopt cashless payment methods [115]. Additionally, financial considerations shape perceived behavioral control, as users who believe that cashless systems enable better money management and savings tend to feel more confident in using them [116]. This heightened sense of control increases their likelihood of adopting various cashless payment options.
Moreover, economic benefits contribute to the perceived social influence that affects both individual and collective decision-making [117]. If users view cashless payments as not only convenient but also financially advantageous, they may experience social pressure to adopt them, especially when their peers and society at large regard mobile transactions as a financially rational choice [118,119]. Consequently, attitude, perceived behavioral control, and subjective norms play a crucial role in shaping perceptions of the economic impact of mobile payments, ultimately driving higher adoption rates in Ghana’s mobile payment industry.
Empirical evidence further shows that the constructs of the TPB are influenced by an individual economic choice [120]. Supporting this assertion is the research by Li et al. [121] that the perceived economic impact influences subjective norms and perceived behavioral control when external factors and individual internal factors affect consumers. Based on the above discussion, we hypothesized the following hypotheses:
H6a.
The perceived economic impact has a direct positive effect on perceived behavioral control and consequently the behavioral intention of MPT usage.
H6b.
The perceived economic impact has a direct positive effect on the subjective norm and consequently the behavioral intention of MPT usage.
H6c.
The perceived economic impact has a direct positive effect on attitude and consequently the behavioral intention of MPT usage.
The Influence of the Perceived Social Impact on Perceived Behavioral Control, Subjective Norms, and Attitude
Perceived social impact refers to an individual’s belief that their actions positively affect others or contribute to the greater social good [122]. This perception is a powerful motivator, enhancing feelings of purpose and responsibility. Research suggests that individuals who perceive their actions as socially impactful are more likely to engage in behaviors aligned with societal welfare and personal values [123]. Perceived social impact focuses on the personal belief that one’s actions make a difference. Perceived social impact is conceptualized focusing on the impact of the MPT on different social groups, especially low-income individuals who rely on MPT for daily transactions [124]. Promoting MPT helps vulnerable groups in society to access safe, fast, and convenient financial infrastructure. MPT is very crucial to the growth and development of every economy.
Furthermore, the perceived social advantages play a role in shaping subjective norms by amplifying societal pressure to conform. As digital payment solutions gain broader acceptance and become more commonplace, individuals may experience an increasing sense of responsibility to adopt these systems to align with the behaviors of their peers, family members, or the wider community. This aligns with TPB where subjective norms play a critical role in behavioral intention [125]. Again, perceived social impact on community standards and social validation from peers and society reinforces perceived social obligations [126]. For example, individuals who recognize the social value of sustainable practices experience greater pressure from social networks to engage in environmentally friendly behaviors [109].
Perceived social value aligns an individual’s personal and societal values, reinforcing positive attitude [127] and positive affect. That is, the perceived social advantages can significantly impact individuals’ attitudes toward mobile payment systems, as people may choose to adopt these methods not only for their convenience but also to strengthen their social reputation.
Finally, perceived social impact can also increase perceived behavioral control by enhancing self-efficacy and access to resources. When individuals believe their actions have meaningful social outcomes, they feel more capable and empowered to perform those actions [128]. Overall, the perception of social impact strengthens the connections between attitude, subjective norms, and perceived behavioral control, leading to a higher behavioral tendency to adopt mobile payments in the Ghanaian market. Recognizing the impact of social influences in driving mobile payment adoption is essential for fostering wider acceptance among socially aware consumers. Empirical studies confirm the relationship between perceived social impact and TPB constructs [109,122,129]. Based on the aforementioned argument. The hypotheses are formulated as follows,
H7a.
Perceived social impact has a direct positive effect on perceived behavioral control and consequently the behavioral intention of MPT usage.
H7b.
Perceived social impact has a direct positive effect on subjective norms and consequently the behavioral intention of MPT usage.
H7c.
Perceived social impact has a direct positive effect on attitude and consequently the behavioral intention of MPT usage.
The Influence of the Perceived Environmental Impact on Perceived Behavioral Control, Subjective Norms, and Attitude
The perceived environmental impact (PENI) in the context of this study is conceptualized as perceived environmental concern which reflects the degree to which consumers are aware of environmental issues [130]. Environmental beliefs, such as reducing paper waste or lowering carbon emissions, contribute to attitude formation by aligning the behavior with moral and ecological values [131]. Perceived behavioral control is established with PENI, in line with findings by Bandura [132] and Stern [133], who show that when individuals believe that using MPT enables them to act in environmentally responsible ways with little effort, their sense of perceived behavioral control is enhanced based on self-efficacy and moral agency. The aspiration to be perceived as environmentally responsible due to pressure from one’s significant others can contribute to a more positive effect on intention. Bamberg and Rees asserted that perceived environmental impact influences attitude [134]. Again, the previous literature has established that PENI heavily influences subjective norms and perceived behavioral control [135].
PENI is considered for this analysis because projections suggest a continued shift from cash-based to mobile-based payment transactions globally, highlighting the increasing role of mobile payment in promoting sustainability [108]. This transformation is especially relevant in reducing carbon emissions related to physical commuting for cash transactions and energy consumption in traditional banking, as mobile payment systems eliminate physical infrastructure needs, thereby lowering carbon footprints.
Given the environmental implications of digital payment adoption, the existing literature increasingly recognizes the importance of consumer behavior in shaping sustainable mobile payment practices. Studies on consumer behavior demonstrate an evolving awareness of the environmental impact, spurred partly by the COVID-19 pandemic, which influenced 58% of adults across 24 countries to adopt more environmentally conscious lifestyles [109], thereby increasing the adoption of digital payment systems to eliminate climate change issues. This study, therefore, considered the perceived environmental impact influence on behavioral intention through TPB constructs since the past literature has established a relationship [96]. Following the above argument, the hypotheses are formulated as follows:
H8a.
The perceived environmental impact has a direct positive effect on perceived behavioral control and consequently the behavioral intention of MPT usage.
H8b.
The perceived environmental impact has a direct positive effect on subjective norms and consequently the behavioral intention of MPT usage.
H8c.
The perceived environmental impact has a direct positive effect on attitude and consequently the behavioral intention of MPT usage.
2.5.3. The Moderating Role of a Mobile Transaction Tax Policy on the Relationship Between the Adoption of Sustainable Behaviors Through MPT Usage and Financial Inclusion
The current literature espouses the increasing rate of mobile taxation in Africa and its consequences on continued usage and financial inclusion [69,136]. Stakeholders including consumers have responded negatively to MTTP implementation on financial inclusion. There are mixed opinions regarding mobile payment taxation in Africa. While some scholars see it as an innovative way to generate revenue, administer taxes, and enhance tax compliance [137], others argue that its negative externalities, such as high transaction costs on continuance usage [138] and increased income inequality, would subsequently negatively affect the achievement of the SDGs. We included MTTP for a comprehensive analysis to capture the intention and actual adoption of sustainable behaviors. Taxes increase transaction costs and burden consumers’ ability to choose sustainable options and usage [139].
Ndungu suggests that taxes on digital transactions like mobile money can significantly influence user behavior toward adopting such innovations [70]. The extant literature argues that tax exemptions on mobile money services can further financial inclusion by facilitating more efficient transactions for goods and services [140].
Notably, the authors of ref. [2] also examined whether transaction tax exemption promotes mobile money services for financial inclusion in developing countries using a semi-structured questionnaire. Their findings were that transaction tax exemption on MPT had a positive impact on adoption and usage. They also found a positive moderation role of mobile money transaction tax exemption in the relationship between usage and financial inclusion.
The current literature found a direct negative effect of MTTP on mobile usage [19,141]. Similarly, a recent study using logistic regression found that the MTTP caused more than 50% deterioration in the cost-effectiveness of mobile payment transactions and thus concluded that the implementation of the new tax system in the mobile payment industry is regressive, leading to worsening economic conditions for low transaction subscribers, which affects the achievement of financial inclusion. The authors made a strong recommendation that the MTTP should be withdrawn to make the mobile payment service effective to promote financial inclusion in Ghana [136]. The hypothesis is therefore formulated as follows:
H9.
The mobile transaction tax policy has a negative moderation effect on the adoption behaviors of MPT and financial inclusion.
2.5.4. Mediation Effects of TPB Constructs
This study posits that attitude, perceived behavioral control, and subjective norms mediate the TBL dimensions and behavioral intention. The current literature has demonstrated a growing interest in consumer demand in promoting sustainable practices, especially after the COVID-19 pandemic [142]. These new priorities by consumers not only affect their consumption patterns but also influence their behaviors toward digital payments, with the potential of promoting sustainable behaviors [143]. The TPB constructs have been established in the literature on their positive effects on behavioral intention. Past studies have demonstrated the mediation effects of TPB constructs on the relationship between beliefs and behavioral intention for mobile payment [16,144]. In line with this, Altawallbeh et al. argued in their study that there exists a mediation effect of TPB constructs, salient beliefs, and e-learning intention [18]. Supporting this is the claim of Ajzen that other factors might affect behavioral intention through TBP constructs [17]. This is particularly relevant as the extant literature has not exhausted all the factors affecting one’s intention to engage or not to engage in a particular behavior [18].
While previous studies have used TPB to evaluate sustainable behaviors including the environmental context, the majority of these studies are applied in domestic settings [145,146]. Other studies have applied TPB constructs in isolation to determine their account for variance in behavioral intention; examining the impact of values in terms of the economic, social, and environmental dimensions on the TPB constructs helps to understand their relationship [34]. This supports a recent call for action on promoting sustainable behaviors through the use of digital payments [147]. Based on this discussion, the hypotheses are formulated as follows:
H10a–H10c.
TBL dimensions derive perceived behavioral control, which in turn affects the behavioral intention of mobile payment technology.
H11a–H11c.
TBL dimensions derive subjective norms, which in turn affect the behavioral intention of mobile payment technology.
H12a–H12c.
TBL dimensions derive attitude, which in turn affects the behavioral intention of mobile payment technology.
2.6. Conceptual Framework
The study used the sustainability TPB, which includes the perceived economic impact, the perceived environmental impact, and the perceived social impact as independent variables; on the other hand, perceived behavioral control, subjective norms, and attitude, were both independent and mediating variables. Also, behavioral intention and sustainable behavior through usage of MPT were considered both dependent and independent variables. MTTP was used as a moderating variable. Finally, financial inclusion is a dependent variable. The diagram below depicts the conceptual framework. The rationale for sustainability TPB aligns with recent theoretical calls to merge normative sustainability models with behavioral intention models to capture the full chain of sustainability-oriented behavior [109,148]. The integration of TBL and TPB answers this call by enabling the empirical testing of sustainability’s influence on behavior- and theory-driven intervention design that considers not just what people do but why they feel empowered, socially expected, or positively disposed to act sustainably. Additionally, by integrating TBL with TPB, researchers can trace how perceptions of sustainability impacts (TBL dimensions) influence individual cognition and intention via TPB’s constructs. Again, while TPB effectively predicts intentions and behaviors, it does not inherently consider sustainability (i.e., economic, environmental, or social implications). This limits its ability to explain why individuals adopt behaviors that are explicitly sustainability-oriented [131]. On the other hand, TBL does not specify how these dimensions (values) influence individual behavioral choices. This research benefits from integrating in this regard to provide a robust analysis. Figure 1 below represent the conceptual framework for the study.
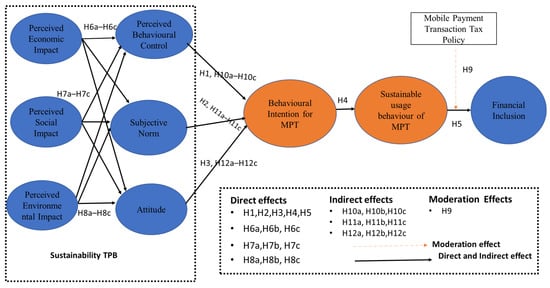
Figure 1.
Conceptual Model.
3. Materials and Methods
3.1. Data Collection
This study collected data on consumers who utilize mobile payment services in all parts of Ghana for both males and females from age 19 and above using a cross-section approach. The cross-sectional approach was employed because it is useful in the generalization of the sample and for generating hypotheses whose outcomes serve as a foundation for further research and new theories [149,150]. A total of 334 sample sizes were used for this study, which is in line with the threshold suggested by [151]. A pilot test with 10 respondents was conducted to validate the questionnaire. The questionnaire was adopted from the previous literature with clear, neutral, and culturally appropriate questions to prevent misrepresentation. The online questionnaire was further designed with an editable option, enabling stakeholders to save and submit their responses later in case of internet connectivity interruptions. Additionally, the authors implemented monitoring and data validation techniques during the data collection phase. These measures ensured data accuracy and consistency, addressing potential challenges and enhancing the reliability of the online process. So, a Google form with a questionnaire was designed in July–August to obtain responses. After the data were collected, 14 of the respondents who indicated they were not using mobile payment services were eliminated from the sample. A final sample of 320 was used for the study.
3.2. Sample Size
In quantitative social research, large sample sizes are typically preferred to ensure representativeness and reliability. Cooper and Schindler recommend that a sample size of 10% of the target population is generally appropriate for such studies. However, for structural modeling, approaches like partial least squares structural equation modeling (PLS-SEM) are recommended. For this study, the G*Power test was employed to determine the appropriate sample size, given the model’s inclusion of up to five independent variables. The analysis revealed that a sample size between 55 and 85 would be sufficient to achieve statistical power ranging from 0.80 to 0.90. To ensure robustness, a minimum of 100 observations was deemed appropriate for the PLS-SEM analysis, providing adequate statistical reliability to detect the desired effect size.
3.3. Instrument Development
The study adopted existing scales from past studies to measure the constructs in the conceptual model. On a 7-point Likert scale, four items each were used as a measure of the TBL dimensions and TPB constructs, and lastly, financial inclusions were adapted from previously published articles. However, a pilot study was carried out prior to the main survey to assess the questionnaire’s validity and reliability. The positive outcomes from this preliminary test confirmed the instrument’s suitability for full-scale data collection. Table A1 in Appendix A represents the measurement items of the construct.
4. Results
This part of the data analysis presents the PLS-SEM result; it evaluates the research hypotheses concerning the antecedents of sustainable behaviors toward financial inclusions and the moderation role of the mobile transaction tax policy. It also details the findings of the measurement and the structural model.
4.1. Common Method Bias
Common method bias (CMB) is often a challenge in survey research because both independent and dependent variables are measured by the same survey using the same response technique [152], making the reliability and validity of the empirical findings questionable, so methods to identify it, avoid it, and control it are essential [153,154]. CMB control is grouped into two ways, that is, procedural and statistical control [152].
For procedural controls, the study designed a clear questionnaire by conducting a pilot study to test the questionnaire. Ambiguous and unclear wording was revised before the main study. Also, the constructs in our conceptual model were categorized in distinct sections using varied scales to maintain a proper sequence of the indicators. Additionally, all the questions designed as measures of the constructs maintained their unique terminologies identified in the literature. Thus, there was no compatibility in the questions asked on TBL dimensions, TPB constructs, and financial inclusion.
For the procedural control of CMB, Harman’s single-factor test was employed to determine the degree of the measurement error in the constructs under study that is caused by the measurement method. It determines whether a single factor accounts for the majority of the variance. The result obtained from the first unrooted factor revealed multiple factors. A single factor explained up to 27.9 percent of the variance which is below the threshold of 50% [155]. This signifies the absence of CMB issues in this study.
4.2. Respondents’ Demographic Profile
This section of the study reports the demographic characteristics of the respondents. The data obtained are used for the PLS-SEM analysis presented in Table 2. A total of 320 responses were received from consumers of MPT from Accra and Tamale. Of this sample, the majority of the respondents are males and well educated, with nearly half having a bachelor’s degree. Most earn between GHS 3001 and 4000 monthly and use mobile payment services frequently, with 78.8% engaging 10–14 times per week. MTN Mobile Money is the preferred platform (78.8%), aligning with broader trends in mobile payment adoption among middle-income, educated demographics in Ghana [156,157].
Table 2.
Respondents’ demographic profile.
4.3. The Measurement Model
The research explored several steps to ensure the accuracy of the study findings. First, the pilot study helped refine the measurement scale. Additionally, experts were recruited to verify the research instruments alongside carefully selecting the instruments from previous studies published in high-quality journals. Finally, we performed confirmatory factor analysis (CFA) and exploratory factor analysis (EFA) to establish the reliability and validity of the measurement model. Thus, the EFA measures consist of the values of the various indicators’ loadings and Cronbach’s alpha, and composite reliability was used to determine convergent reliability, internal consistency, and reliability.
Table 3 below shows the various indicators’ outer loadings, varying from 0.644 to 0.934. Also, for internal consistency, the composite reliability values fall within the acceptable range of 0.831 to 0.978. The latent variable average variance explained (AVE) has values ranging from 0.636 to 0.938, which is above the recommended level [158,159]. It also confirms that the variables observed present good convergent validity. The Cronbach’s alpha coefficients which were also used to assess the internal consistency fall within the threshold of 0.735 and 0.967 [160]. Table 4 also consists of the cross loadings.
Table 3.
Reliability and validity of the research construct.
Table 4.
Cross-loadings.
Additionally, confirmatory factor analysis was used to determine discriminant and convergent validity. As such, the average variance extracted (AVE) and cross-loading evaluated convergent validity, while the Fornell and Larcker criterion and the Hetrotrait–Monotrait Ratio (HTMT) were employed to assess discriminant reliability, which is the robustness of the empirical distinctiveness.
Table 5 presents the Fornell and Larker criterion which shows that all the indicators’ square root of their AVE was higher than their correlation with other variables and demonstrates the required discriminant validity. On the other hand, HTMT compares average correlations between different constructs (heterotrait) to those within the same construct (monotrait); that is, it uses the geometric correlations between the items used to assess a given construct, and the results are shown in Table 6. All the values were below the threshold of <0.9 [161]. Consequently, the analysis of the measurement model showed the quality of the latent constructs and measurement items.
Table 5.
Discriminant validity (Fornell–Larker criterion).
Table 6.
Discriminant validity (HTMT).
4.4. The Structural Model
After analyzing the measurement model and reliability and validity have been established, the structural model analysis was conducted to evaluate the relationships of the formulated hypotheses using the coefficient of determination (R2), predictive relevance (Q2), and the statistical significance of the path coefficients. However, we first determine the variance inflation factor (VIF). A variance inflation factor (VIF) value exceeding 3.3 may indicate potential multicollinearity issues and could be a sign of common method bias (CMB). Thus, if all VIF values in the inner model are 3.3 or lower, the model is generally considered free from CMB concerns. Table 7 shows that the variance inflation factor (VIF) met the recommended guidelines by Hair et al. [161]. Constructs with VIF values lower than 3.3 were considered free from multicollinearity issues. All constructs in the study exhibited VIF values between 1.0 and 1.609, meeting the recommended threshold [162].
Table 7.
Variance inflation factor.
For the predictive relevance of the structural model, the values of the Q2 were used. According to Hair et al. [162], Q2 values should significantly exceed zero to indicate that the exogenous structure predicts the endogenous structure. Our results to achieve the dependent variable and the financial inclusion of mobile payment technology showed cross-validation values exceeding zero, as presented in Table 8. These values indicate that the test results were good, signifying the predictive relevance of the framework. Again, the study assessed the predictive power of the model, where out-of-sample prediction is resolved using PLSpredict on the SmartPLS software version 4. [163]. Accordingly, the mean absolute error (MAE) and root mean squared error (RMSE) for each indicator were evaluated against a baseline linear regression (LM) model. As presented in Table 8, the PLS-SEM model demonstrates strong predictive capability, with all indicators showing lower RMSE values compared to the naïve LM benchmark [163].
Table 8.
Constructs’ predictive power and relevance.
Finally, the strength and significance of the correlation between variables were assessed using the R2 value, indicating a substantial, moderate, or weak relationship if the R2 value surpassed 0.67, 0.33, or 0.19, respectively [164]. In our analysis, the R2 value demonstrated a high and moderate relationship. For example, perceived behavioral control explains up to 45.5%, subjective norm up to 56%, attitude up to 33%, intention to adopt behavioral behavior up to 66%, the adoption of sustainable usage behaviors up to 33.1%, and financial inclusion up to 59.2%. Therefore, all criteria were considered met for the structural model. A bootstrapping method was further conducted to test the formulated research hypotheses through the significance of the path coefficients. We conducted bootstrapping using 5000 subsamples randomly extracted from the data set at a 95% confidence interval. This was used to assess the statistical significance and magnitude of the interrelationships between the constructs within the model using SmartPLS 4 [165]. The results of the bootstrap subsamples are presented in Table 9 in the form of significance levels, t-values, and the path coefficients for each model parameter.
Table 9.
Direct effects: path coefficients and statistical significance.
4.5. Hypotheses Testing and Path Coefficients
4.5.1. Direct Effects
All the hypotheses formulated from the TPB and its extended constructs effectively explained the intention, the adoption of sustainable behaviors, and financial inclusion. Firstly, concerning the influence of TPB constructs on the intention to adopt sustainable behaviors through the usage of MPT, our findings showed that perceived behavioral control (β = 0.210, t = 4.517, and p = 0.000) and attitude (β = 0.231, t = 3.30, and p = 0.001) were statistically significant with positive coefficients, except for subjective norms (β = 0.088, t = 1.229, p = 0.219). Thus, hypotheses H1 and H3 were supported, while H2 was not supported.
Secondly, the relationship between behavioral intention to adopt and the actual adoption of sustainable usage behaviors through MPT revealed a positive and statistically significant relationship (β = 0.223, t = 4.728, and p = 0.000). Hence, hypothesis H4 was supported. To test the relationship between sustainable usage behavior and financial inclusion, the empirical result was positive and statistically significant (β = 0.567, t = 8.956, and p = 0.000). Thus, hypothesis H5 was supported.
Thirdly, for the influence of the TBL dimensions on TPB constructs, the results of the perceived economic impact effect on perceived behavioral control, subjective norms, and attitude consisting of hypotheses H6a, H6b, and H6c were all positive and statistically significant at (β = 0.366, t = 4.421, and p = 0.000), (β = 0.556, t = 8.038, and p = 0.000), and (β = 0.224, t = 2.795, and p = 0.003), respectively. The findings on the perceived social impact relationship on perceived behavioral control, subjective norms, and attitude consisting of hypotheses H7a, H7b, and H7c are (β = 0.132, t = 1.680, and p = 0.093), (β = 0.187, t = 2.357, and p = 0.018), and (β = 0.249, t = 2.823, and p = 0.005). Additionally, the results of the perceived environmental impact influence on perceived behavioral control, subjective norms, and attitude consisting of hypotheses H8a, H8b, and H8c are (β = 0.132, t = 2.360, and p = 0.019), (β = 0.133, t = 3.530, and p = 0.000), and (β = 0.498, t = 7.601, and p = 0.000). All triple bottom line constructs on TPB constructs are positive and showed statistical significance. Therefore, all hypotheses are supported. Again, the path diagram of the study model, consisting of the path coefficients and the statistical significance, is presented in Table 9 and Figure 2.
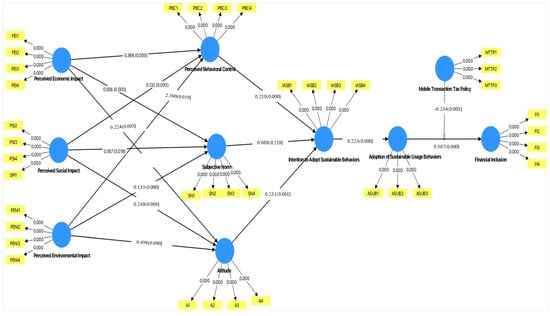
Figure 2.
Research model with p-values and path coefficients.
4.5.2. Mediation Analysis (Indirect Effects)
The mediation analysis was conducted to establish whether the triple bottom line dimension affects the TPB constructs and translates into the behavioral intention to adopt the sustainable usage of MPT. With this, the influence of a mediating variable can determine how behavioral intention behaves and relates to independent variables, that is, the triple bottom line dimensions. The results obtained are presented in Table 10. It shows that the TPB constructs mediate the relationship between the triple bottom line dimensions and the intention to adopt sustainable usage behaviors.
Table 10.
Indirect effects: path coefficients and statistical significance.
The findings of the perceived economic impact effect on TPB constructs, which in turn influence behavioral intention to adopt sustainable behaviors through MPT, consisting of hypotheses H10a, H10b, and H10c were all positive and statistically significant at (β = 0.132, t = 1.680, and p = 0.093, (β = 0.366, t = 4.421, and p = 0.000), and (β = 0.223, t = 4.727, and p = 0.000), respectively. The results of the impact of perceived social impact on TPB constructs, which in turn derive behavioral intention to adopt sustainable behaviors, with hypotheses H11a, H11b, and H11c showed positive and statistically significant values of (β = 0.113, t = 2.159, and p = 0.031), (β = 0.368, t = 4.422, and p = 0.000), and (β = 0.234, t = 2.975, and p = 0.003), respectively. Additionally, regarding the perceived environmental impact influence on TPB constructs, the hypotheses H12a, H12b, and H12c with (β = 0.132, t = 0.352, and p = 0.0019), (β = 0.210, t = 4.517, and p = 0.000), and (β = 0.234, t = 2.975, and p = 0.003) were all positive and statistically significant. All TPB constructs effectively mediate the relationship between TBL dimensions and the behavioral intention to adopt the sustainable behaviors of MPT.
4.5.3. Moderation Analysis
Finally, we performed a moderation analysis to determine how the mobile transaction tax policy affects the relationship between adopting sustainable usage behaviors and financial inclusion through MPT using a 2-stage approach since our moderator is a formative construct [166]. The findings of the interaction between the mobile transaction tax policy and sustainable usage behaviors had a significant negative effect on financial inclusion, with values of (β = −0.234, t = 2.975, and p = 0.003), as shown in Table 11.
Table 11.
Moderation effects: path coefficients and statistical significance.
5. Discussion
5.1. Antecedents of Sustainable Usage Intention and Behaviors Toward Financial Inclusion
The findings of this study are consistent with the previous literature that the TBL dimensions, namely the perceived economic impact, the perceived social impact, and the perceived environmental impact, influence the TPB constructs (perceived behavioral, subjective norm, and attitude) [134]. Empirical studies confirm the relationship between the perceived social impact and TPB constructs [85,122]. This study strengthens earlier findings and the current literature on the need for sustainable measures in the mobile payment industry.
Furthermore, consistent with the consensus in many empirical studies, the findings reveal that perceived behavioral control and attitude impact behavioral intention [73,88,89,91], except for subjective norm, which is consistent with the literature on its limited capacity to explain behavioral intention [84]. Subjective norm was not supported in our study context and is, however, generally argued as a weaker predictor of intention [76,79], and no relationship with behavioral intention has been established in some studies [83]. This study highlights the importance of attitude as a stronger predictor in influencing behavioral intention to adopt sustainable behaviors, the actual adoption of sustainable behaviors [79], and consequently financial inclusion. More effort should be channeled into shaping people’s attitudes toward MPT. Mobile payment service providers in Ghana can shape individuals’ attitudes and perceived behavioral control by creating awareness of the benefits of usage of their services as well as providing an easy mobile payment interface, incentives, and discounts.
Again, the hypothesis between the actual adoption of sustainable usage behaviors and financial inclusion was supported. This study supports past empirical studies [13,138,167]. Many previous studies have emphasized the importance of mobile payment continuance usage, access, availability, and quality on financial inclusion, especially for the most vulnerable in developing countries [55,110]. By using MPT, people can save, receive, and purchase easily and more securely. The results also reinforce the vital role of stakeholders in the mobile payment industry to adopt sustainable strategies to encourage usage, thereby promoting financial inclusion.
5.2. Mediation Effect of TPB Constructs on the Relationship Between TBL Dimensions and the Adoption of Sustainable Usage Behaviors
This section of the study is novel since previous studies investigating the possible mediation is limited in the literature [15]. The results of this study confirm the mediation role of perceived behavioral, subjective norms, and attitudes between TBL dimensions and behavioral control. This means that individuals’ behavioral intentions are greatly impacted by the economic, social, and environmental impact of MPT and not merely perceived behavioral, subjective norms, and attitudes. The past literature has demonstrated the possible mediation effects of perceived behavioral, subjective norms, and attitudes on beliefs and behavioral intention for mobile payment [16]. Altawallbeh et al. [18] argued in their study that there exists a mediation effect of TPB constructs, salient beliefs, and e-learning intention. Thus, environmental concerns and economic and social inclusion can be utilized to design sound, sustainable mobile features and practices along with innovative mobile payment technologies to boost behavioral intention to use and adopt MPT and subsequently financial inclusion.
5.3. Moderation Effect of the Mobile Payment Transaction Tax Policy on the Relationship Between Sustainable Usage Behaviors and Financial Inclusion
The data from our research affirm that the mobile transaction tax policy moderates the relationship between sustainable adoption behaviors and financial inclusion. This result is consistent with past studies [137,156].
There is no contention in the literature regarding the negative effects of the mobile money tax in the Ghanaian economy and other sub-Saharan African countries. For instance, ref. [20] found out in a quantitative survey that a wooing majority of 96.3 percent of Ghanaians disapprove of the mobile money tax. A recent report by GSMA also confirmed that the most important challenge in the mobile payment industry in Ghana and Tanzania is mobile taxation [1,168]. Hence, to sustain the gains of sustainable usage for financial inclusion, stakeholders recommend reviewing the mobile transaction tax policy to prevent its negative impact on usage and financial inclusion. Additionally, taxing mobile payments directly can disproportionately affect low-income communities, cutting off their access to digital financial inclusion.
6. Conclusions
This study contributes to knowledge in financial inclusion, consumer behavior, and sustainable development, particularly within the context of mobile payment technology. There is consensus in the literature that the emergence, adoption, growth, and continuance usage of mobile payment technology have led to the achievement of some of the SDGs [25,169,170]. However, the sustainability of the mobile payment industry is jeopardized by multiple barriers coupled with the implementation of mobile payment taxation in the industry. Accordingly, sustainable policies and behavioral strategies are needed to sustain the mobile payment industry toward financial inclusion and sustainable development.
The extant literature holds inconsistent views on the intention behavior gap and the impact of mobile payment usage on financial inclusion, especially from the lance of TBL dimensions’ influence on TPB constructs. To respond to these gaps, we sought to (1) explore the antecedents of consumers’ intention and the sustainable usage behaviors of mobile payment technology and its implication for digital financial inclusion and (2) examine the moderation role of the mobile payment transaction tax policy on the relationship between the sustainable usage of mobile payment technology and digital financial inclusion.
By using PLS-SEM to test the twelfth hypothesis, the following results were obtained. We found that all the constructs of the sustainability TPB including the perceived economic impact, the perceived social impact, the perceived environmental impact, perceived behavioral control, and attitude, intention, adoption, and financial inclusion were all supported except subjective norms. We also confirmed that MTTP negatively affects the nexus between the sustainable usage of mobile payment technology and digital financial inclusion. This study demonstrates that sustainability TPB can be employed to explain financial inclusion, especially with the use of MPT, which accounts for the large population who benefits from its usage.
6.1. Theoretical Contribution
This study makes a significant theoretical contribution to consumer behavior, taxation, financial inclusion, and the sustainability literature by addressing unexplored sustainable behaviors to ensure the sustainability of the MPT.
Accordingly, this thesis extends the adoption of the technology literature, specifically by studying the antecedents of adopting sustainable behaviors. The innovation of this part of the study lies in the integration of TPB with TBL dimensions to study the sustainable behaviors of the MPT. While TPB has been widely explored with other matured theories in extant studies, sustainability TPB serves as a foundational framework for application in the consumer behavior literature toward financial inclusion. In this subject matter, this study provides valuable insights to policymakers and guides industry practitioners and relevant stakeholders.
The lack of consensus regarding intention-adoption of sustainable behavior gab has also been examined in this study.
In addition, this study addresses the call for MTTP removal. It confirms the public outcry that MTTP in the mobile payment industry inhibits the smooth transition of sustainable behaviors to financial inclusion in developing countries where mobile payment technology is a vital part of filling in the financial access gap left by traditional banking institutions. Particularly, this study enriches the current literature by providing a comprehensive understanding of how MTTP affects sustainable usage and financial inclusion and how it can be reviewed to provide avenues for revenue generation while encouraging usage simultaneously.
This study explores the broader impacts of taxation strategies on the economic impact, environmental outcomes, political support, and social inclusion in Africa’s MTTP setting. Consequently, this study affirms the TBL dimensions in the financial literature, offering a replicable model for developing economies to design sustainable mobile taxation strategies. This research advances theoretical discourse in the MTTP frame while providing actionable insights to promote financial inclusion and equity in taxation policy development. Other studies can use this framework to study a related phenomenon in a new context.
6.2. Managerial and Practical Implication
The MPT’s sustainable performance contributes to the broader universal financial inclusion and consequently sustainable development; hence, the findings of this study are critical for service providers, as businesses are developing sustainable business models that guarantee long-term viability in terms of economic, environmental, and social inclusion that meets the needs of the growing demands of the environmentally conscious consumer. This study offers considerable managerial and practical contributions and implications of the PLS-SEM approach.
Firstly, this study provides insight into the most pertinent factors affecting the sustainable behaviors of MPT and its implication on financial inclusion. The findings confirm that sustainable behaviors significantly influence financial inclusion. It highlights the positive influence of the TBL dimensions on attitude, perceived behavioral control, and subjective norms on consumers’ decisions to continue the usage of MPT instead of conventional payment methods, aligning with sustainable principles. The importance of sustainable behaviors in the mobile payment industry is paramount for maintaining the sustainable development of the mobile payment industry, hence providing support in achieving sustainable development. Therefore, MPT service providers must be proactive in designing friendly interfaces with sustainable features that will positively influence consumers’ attitudes. They should also engage in public awareness by creating and educating consumers on the benefits and usage of MPT.
Secondly, industry players in the mobile payment industry must have a clear vision to contribute to financial inclusion, actively promote sustainable initiatives, and invest in resources necessary for attracting usage. The results show that policies implemented in the mobile payment industry such as the MTTP possess a negative externality and are disincentive to sustainable usage and financial inclusion. Hence, it is imperative for service providers to vehemently reject this tax levy by advancing their disapproval and therefore negotiate with policymakers for the best alternative means for revenue generation in the industry.
Because of these considerable implications, the results present policy implications for sustaining mobile payment technology. First, the multiple characteristics of factors of sustainable behaviors of the MPT that influence financial inclusion suggest that finding the antecedents from a sustainability perspective is essential. Specifically, the MTTP implemented in the mobile payment industry increases transaction costs, leaving consumers to opt for alternative payment methods that negatively affect financial inclusion. By eliminating mobile taxation in the mobile payment industry, governments can support at least eight UN SDGs, demonstrating the transformative potential of well-structured policies in fostering innovation, inclusivity, and sustainability in the mobile payment sector, or policymakers should consider withdrawing this policy or review it to meet the broader stakeholder needs.
6.3. Limitations and Recommendations for Further Studies
While the thesis has utilized a robust theoretical foundation and has presented valuable theoretical contributions, as well as practical and policy implications on the dynamics of sustaining the mobile payment technology in developing countries, especially in Ghana, it is not without limitations, and these limitations present opportunities for further research.
First, this study relied on data from Ghana to draw generalizations which can potentially limit the findings. Therefore, future studies can use the frameworks applied in this study to conduct comparative studies using different contexts where mobile payment technology is widely adopted to validate the findings and offer additional contextual insights on the subject matter. This will ensure a better understanding of how different geographical variations in terms of culture, national policies, or regional context might affect the sustainability of mobile payment technology and its implication on financial inclusion to broaden the scope of this concept’s applicability.
Also, our study captured only behavioral factors and TBL dimensions influencing behavioral intention for sustainable mobile payment technology and consequently financial inclusion. However, other factors could also play a role like cost, technical issues, etc. Future studies can incorporate different models to provide a comprehensive understanding of the intricate relationship between behavioral intention, the adoption of sustainable mobile payment technology, and financial inclusion
The last limitation is that the PLS-SEM applied in this study cannot account for non-linear relationships and complex dynamics. We recommend that future studies integrate MCDM methods and statistical methods using the framework examined in this study.
Lastly, the study made use of only adopters of MPT; we acknowledge this as a limitation and recommend that future studies incorporate both adopters and non-adopters to provide a robust relationship between attitudes, intentions, and behaviors.
Author Contributions
G.W. contributed to the conceptualization and drafting of the manuscript, resources, and formal analysis. J.C. contributed as the principal investigator and to the conceptualization and drafting of the manuscript, supervision, validation, review, editing, and resources. G.A. contributed to formal analysis, visualization, resources, editing, and review. E.K.A. contributed to editing and reviewing, resources, and software. B.B. and B.N.-y. contributed to data collection, review, and editing. All authors have read and agreed to the published version of the manuscript.
Funding
The study was supported by the National Natural Science Foundation of China (71872028) and the Fundamental Research Funds for Central Universities of China (ZYGX2019F001).
Institutional Review Board Statement
We obtained the consent of respondents, and the purpose of this study was duly explained. They were assured of their anonymity; hence, no information that identifies them was included in the survey. Their willingness to respond to the questionnaire showed their agreement to be a sample for the study. Also, the research was conducted in Ghana; we also obtained ethical approval from a research institution.
Data Availability Statement
The raw data supporting the conclusions of this article will be made available by the authors upon request.
Conflicts of Interest
The authors declare no conflicts of interest.
Appendix A
Table A1.
Measurement scales.
Table A1.
Measurement scales.
| Perceived Environmental Impact | Source |
|---|---|
| Mobile payment is eco-friendly and provides environmental innovativeness initiatives | [149,171] |
| Mobile payment makes me feel happy because is eco-friendly. | |
| Using mobile payment technology to support environmental conservation and sustainability efforts brings me a sense of fulfillment. | |
| A mobile money payment system would make me feel good because of its sustainable features. | |
| Perceived Social Impact | |
| I feel morally obligated to help socially disadvantaged people through the use of mobile payment technology. | [172] |
| It is an ethical responsibility to help people less fortunate than ourselves through the use of mobile payment technology. | |
| Social justice requires that we help those who are less fortunate than ourselves (social justice refers to the distribution of wealth, opportunities and privileges in the society) through the use of mobile payment technology. | |
| It is one of the principles in my country that we should help socially disadvantaged people. | |
| Perceived Economic Impact | |
| I perceive that using cashless payments reduces transaction costs mobile payment system would offer a good value for the money. | [173] |
| I believe that mobile payment technology provides a better financial management. | |
| I feel confident that the use of mobile money payment is more cost-effective than traditional methods. | |
| I perceive mobile payments technology as a financially advantageous. | |
| Perceived Behavioral Control | |
| It is possible to completely solve sustainability issues through the use of mobile payments. | [71,172,174,175,176] |
| I feel capable of helping the environment through the use of mobile payments. | |
| I believe I have sufficient knowledge to use cashless payments. | |
| I feel I can easily access and use mobile payment options when needed, and something can be done to solve sustainability issues through the use of mobile payment. | |
| Subjective Norm | |
| It is expected of my relatives, friends, and family to use mobile payment because of its sustainable features. | [172,177,178,179] |
| I believe that most of my acquaintances use mobile payment to make payments and purchases if the choice is between cash and mobile payment. | |
| I believe that using cashless payments helps them fit in with societal trends and expectations. | |
| I believe that most of my acquaintances use mobile payment to make payments and purchases instead of traveling to physical locations to reduce the carbon emissions released in the atmosphere. | |
| Attitude | |
| I like mobile payment services because it is beneficial and sustainable. | [172,180] |
| I feel positive about using mobile payment services because is good for promoting sustainability. | |
| I feel comfortable and confident when using mobile payment technology. | |
| I feel proud when I use mobile payment because its sustainable features. | |
| Behavioral Intention | |
| I intend to use mobile payment regularly because of its sustainability features. | [172,176,181,182,183] |
| I expect to use mobile payments in the future because of its sustainable features. | |
| I plan to recommend mobile payment technology because of its sustainable features. | |
| Overall, I am glad to use mobile payment because it’s because of its sustainable features. | |
| Actual Sustainable Usage Behaviors | |
| I regularly use mobile payments to avoid paper-based receipts or bank statements, and carbon emissions in the air. | [172,182,184] |
| I have switched to mobile payment technology methods because of sustainable reasons. | |
| When I have a choice between cash and mobile payment technology, I will choose mobile payment technology because I monitor and manage my spending habits using features available in my mobile payment app. | |
| Financial Inclusion | [54,116,185] |
| I have access to a mobile payment account and mobile payment agents are near to me. | |
| I use my mobile payment account regularly to make payments and transfer funds. | |
| Mobile payment technology allows me to independently manage and exercise judgment and control over my personal finances (such as fund transfers and the payment of utility bills). | |
| Mobile payment technology transaction costs for services are affordable for me compared to conventional payment methods. |
References
- GSMA. The Commercial Sustainability of Mobile Money Providers in Interoperability Initiatives: Insights From Ghana, Jordan, Pakistan, Rwanda, Tanzania and Uganda. 2024. Available online: https://www.gsma.com/solutions-and-impact/connectivity-for-good/mobile-for-development/wp-content/uploads/2024/02/The-commercial-sustainability-of-mobile-money-providers-in-interoperability-initiatives-1.pdf (accessed on 24 August 2024).
- Bongomin, G.O.C.; Yourougou, P.; Munene, J.C. Digital financial innovations in the twenty-first century. J. Econ. Adm. Sci. 2019, 36, 185–203. [Google Scholar]
- Bank of Chana. Summary of Economic and Financial Data November 2021. Bank of Ghana. 2021. Available online: https://www.bog.gov.gh/econ_fin_data/summary-of-economic-and-financial-data-november-2021/ (accessed on 20 July 2024).
- Li, G.; Sun, Q.; Dong, Z. Factors influencing car owners’ intentions of using shared cars: An extension of the theory of planned behavior in China. Transp. Res. Part F Traffic Psychol. Behav. 2025, 110, 230–246. [Google Scholar] [CrossRef]
- Shiau, W.L.; Chau, P.Y.K. Understanding behavioral intention to use a cloud computing classroom: A multiple model comparison approach. Inf. Manag. 2016, 53, 355–365. [Google Scholar] [CrossRef]
- Linh, T.T.; Huyen, N.T.T. An extension of Trust and TAM model with TPB in the adoption of digital payment: An empirical study in Vietnam. F1000Research 2025, 14, 127. [Google Scholar] [CrossRef]
- Lin, X.; Wu, R.; Lim, Y.-T.; Han, J.; Chen, S.-C. Understanding the Sustainable Usage Intention of Mobile Payment Technology in Korea: Cross-Countries Comparison of Chinese and Korean Users. Sustainability 2019, 11, 5532. [Google Scholar] [CrossRef]
- Sukumaran, L.; Majhi, R. Not all who proclaim to be green are really green: Analysis of intention behavior gap through a systematic review of literature. Manag. Rev. Q. 2024, 75, 1535–1574. [Google Scholar] [CrossRef]
- Jahari, S.A.; Hass, A.; Idris, I.B.; Joseph, M. An integrated framework examining sustainable green behavior among young consumers. J. Consum. Mark. 2022, 39, 333–344. [Google Scholar] [CrossRef]
- Nieto-García, M.; Acuti, D.; Viglia, G. Consumer hypocrisy and researcher myopia: A scrutiny of the intention-behaviour gap in sustainable tourism. Ann. Tour. Res. 2024, 104, 103678. [Google Scholar] [CrossRef]
- Mogaji, E.; Nguyen, N.P. The dark side of mobile money: Perspectives from an emerging economy. Technol. Forecast. Soc. Change 2022, 185, 122045. [Google Scholar] [CrossRef]
- Osabutey, E.L.C.; Jackson, T. Mobile money and financial inclusion in Africa: Emerging themes, challenges and policy implications. Technol. Forecast. Soc. Change 2024, 202, 123339. [Google Scholar] [CrossRef]
- Okello Candiya Bongomin, G.; Ntayi, J.M.; Munene, J.C.; Malinga, C.A. Mobile Money and Financial Inclusion in Sub-Saharan Africa: The Moderating Role of Social Networks. J. Afr. Bus. 2018, 19, 361–384. [Google Scholar] [CrossRef]
- Njele, C.C.; Phiri, J.T.J.N. Factors Affecting Usage of Mobile Money Services and Their Impact on Financial Inclusion: Case of Lusaka Province. Int. J. Bus. Manag. 2021, 16, 104. Available online: https://api.semanticscholar.org/CorpusID:235657474 (accessed on 24 August 2024). [CrossRef]
- Amoako-Gyampah, K.; Acquaah, M. Manufacturing strategy, competitive strategy and firm performance: An empirical study in a developing economy environment. Int. J. Prod. Econ. 2008, 111, 575–592. [Google Scholar] [CrossRef]
- Støle, H.S.; Nilsen, L.T.N.; Joranger, P. Beliefs, attitudes and perceptions to sun-tanning behaviour in the Norwegian population: A cross-sectional study using the health belief model. BMC Public Health 2019, 19, 1–12. [Google Scholar] [CrossRef]
- Ajzen, I. Attitudes, Personality and Behaviour; McGraw-Hill Education (UK): England, UK, 2005. [Google Scholar]
- Altawallbeh, M.; Soon, F.; Thiam, W.; Alshourah, S. Mediating role of attitude, subjective norm and perceived behavioural control in the relationships between their respective salient beliefs and behavioural intention to adopt e-Learning among instructors in Jordanian universities. J. Educ. Pract. 2015, 6, 152–159. [Google Scholar]
- Nutassey, V.; Agyei, S.; Frimpong, S.; NoKoe, K. Introducing electronic transaction levy in Ghana: A possible curse or a blessing? The public’s perception. Cogent Econ. Financ. 2023, 11, 2167361. [Google Scholar] [CrossRef]
- Agyeiwaa-Afrane, A.; Agyei-Henaku, K.A.A.O.; Badu-Prah, C.; Srofenyoh, F.; Gidiglo, F.K.; Amezi, J.K.A.; Djokoto, J.G. Drivers of Ghanaians’ approval of the electronic levy. SN Bus. Econ. 2022, 3, 19. [Google Scholar] [CrossRef]
- Mensah, I.K.; Mwakapesa, D.S.; Mensah, P.A.; Mensah, J.K. The Impact of Government Electronic Transaction Levy on the Continuous Adoption of Mobile Money Transactions in Ghana. In Proceedings of the 4th Africa-Asia Dialogue Network (AADN) International Conference on Advances in Business Management and Electronic Commerce Research, Jiangxi, China, 25–27 November 2022; pp. 17–23. [Google Scholar]
- Anabila, P.; Allan, M.M.; Doe, J.K. Assessing the impact of e-Levy on perceived value and customer satisfaction of mobile money innovation in Ghana. J. Int. Consum. Mark. 2025, 37, 129–141. [Google Scholar] [CrossRef]
- Anyidoho, N.A.; Gallien, M.; Rogan, M.; van den Boogaard, V. Mobile Money Taxation and Informal Workers: Evidence from Ghana’s E-Levy; ICTD: Brighton, UK, 2022. [Google Scholar]
- Asamoah, M.K.; Nketiah-Amponsah, E.; Danquah Ansong, J. Interview feedback from Six Educationists and Six Economists on electronic levy legislation in Ghana. Cogent Soc. Sci. 2023, 9, 2283920. [Google Scholar] [CrossRef]
- Sulemana, H. Ghana’s New E-Levy Will Weaken Its Financial System; African Liberty: Arlington, VA, USA, 2022. [Google Scholar]
- Yevu, M. Implications of the Electronic Transfer Levy Act, 2022, Act 1075 [E-Levy] on Ghana’s Cash Lite Economy Agenda. 2022. Available online: https://ghalii.org/akn/gh/act/2022/1075/eng@2022-03-31 (accessed on 24 August 2024).
- Kwarteng, K. Report of the Finance Committee on the Electronic Transfer Levy Bill; Parliament of Ghana: Accra, Ghana, 2021; pp. 1–11. [Google Scholar]
- Anokye, K. E-Levy Inimical to Financial Inclusion and Digital Transformation. 2022. Available online: https://thebftonline.com/2021/12/22/e-levy-inimical-to-financial-inclusion-and-digital-transformation/ (accessed on 24 August 2024).
- Ghana News Agency (GNA) MoMo Agents Push for GHS500 Threshold, 0.5 Per Cent Rate on E-Levy. Available online: https://gna.org.gh/2023/01/momo-agents-push-for-ghs500-threshold-0-5-per-cent-rate-on-e-levy/ (accessed on 8 August 2023).
- Ajzen, I.; Fishbein, M. A Bayesian analysis of attribution processes. Psychol. Bull. 1975, 82, 261. [Google Scholar] [CrossRef]
- Ajzen, I. From intentions to actions: A theory of planned behavior. In Action Control: From Cognition to Behavior; Springer: Berlin/Heidelberg, Germany, 1985; pp. 11–39. [Google Scholar]
- Ajzen, I. The theory of planned behavior: Frequently asked questions. Hum. Behav. Emerg. Technol. 2020, 2, 314–324. [Google Scholar] [CrossRef]
- Ajzen, I. The Theory of Planned Behavior; Elsevier: Amsterdam, The Netherlands, 1991. [Google Scholar]
- Ajzen, I. Design and evaluation guided by the theory of planned behavior. In Social Psychology and Evaluation; Guilford Publications: New York, NY, USA, 2011; pp. 74–100. [Google Scholar]
- Kamalanon, P.; Chen, J.S.; Le, T.T.Y. “Why do We Buy Green Products?” An Extended Theory of the Planned Behavior Model for Green Product Purchase Behavior. Sustainability 2022, 14, 689. [Google Scholar] [CrossRef]
- Brandão, A.; da Costa, A.G. Extending the theory of planned behaviour to understand the effects of barriers towards sustainable fashion consumption. Eur. Bus. Rev. 2021, 33, 742–774. [Google Scholar] [CrossRef]
- Heath, Y.; Gifford, R. Extending the theory of planned behavior: Predicting the use of public transportation 1. J. Appl. Soc. Psychol. 2002, 32, 2154–2189. [Google Scholar] [CrossRef]
- Han, T.-I.; Stoel, L. Explaining socially responsible consumer behavior: A meta-analytic review of theory of planned behavior. J. Int. Consum. Mark. 2017, 29, 91–103. [Google Scholar] [CrossRef]
- Elkington, J.; Rowlands, I.H. Cannibals with forks: The triple bottom line of 21st century business. Altern. J. 1999, 25, 42. [Google Scholar] [CrossRef]
- Henriques, A. CSR, sustainability and the triple bottom line. In The Triple Bottom Line; Routledge: Abingdon-on-Thames, UK, 2013; pp. 26–33. [Google Scholar]
- Hajian, M.; Kashani, S.J. Evolution of the concept of sustainability. From Brundtland Report to sustainable development goals. In Sustainable Resource Management; Elsevier: Amsterdam, The Netherlands, 2021; pp. 1–24. [Google Scholar]
- Emissions—2019 Progress Report to Parliament, R.U.K. 2019. Available online: https://www.theccc.org.uk/publication/reducing-uk-emissions-2019-progress-report-to-parliament/ (accessed on 2 August 2023).
- Kim, J.-H.; Kim, H.-J.; Yoo, S.-H. Willingness to Pay Price Premium for Smartphones Produced Using Renewable Energy. Sustainability 2019, 11, 1566. [Google Scholar] [CrossRef]
- Hopal, E.; Vayvay, Ö.; Kalender, Z.T.; Turhan, D.; Aysuna, C. How do mobile wallets improve sustainability in payment services? A comprehensive literature review. Sustainability 2022, 14, 16541. [Google Scholar] [CrossRef]
- Tita, A.F.; Aziakpono, M.J. The effect of financial inclusion on welfare in sub-Saharan Africa: Evidence from disaggregated data. Econ. Res. S. Afr. Work. Pap. 2017, 679, 1–29. [Google Scholar]
- Ozili, P.K. Theories of financial inclusion. In Uncertainty and Challenges in Contemporary Economic Behaviour; Emerald Publishing Limited: Leeds, UK, 2020; pp. 89–115. [Google Scholar]
- Olaniyi, E. Back to the land: The impact of financial inclusion on agriculture in Nigeria. Iran. Econ. Rev. 2017, 21, 885–903. [Google Scholar]
- Lal, T. Impact of financial inclusion on economic development of marginalized communities through the mediation of social and economic empowerment. Int. J. Soc. Econ. 2021, 48, 1768–1793. [Google Scholar] [CrossRef]
- Demirgüç-Kunt, A.; Klapper, L.; Singer, D.; Ansar, S.; Hess, J. The Global Findex Database 2017: Measuring financial inclusion and opportunities to expand access to and use of financial services. World Bank Econ. Rev. 2020, 34 (Suppl. 1), S2–S8. [Google Scholar] [CrossRef]
- Sheehan, G.; Burkett, I. From the Margins to the Mainstream: The Challenges for Microfinance in Australia; Brotherhood of St Laurence: Melbourne, Australia, 2009. [Google Scholar]
- Igamo, A.M.; Gustriani, G.; Maryati, S.; Azwardi, A.; Sukanto, S. Financial Deepening & Income Inequality: Evidence From Indonesia. J. Din. Ekon. Pembang. 2023, 6, 143–152. [Google Scholar]
- Baria, B.P.; Mehta, D.H. Determinants of Rural Financial Inclusion in India: A Short Note using the AIDIS 2019. Econ. Aff. 2024, 69, 437–444. [Google Scholar] [CrossRef]
- Demirgüç-Kunt, A.; Klapper, L.; Singer, D.; Ansar, S. The Global Findex Database 2021: Financial Inclusion, Digital Payments, and Resilience in the Age of COVID-19. Glob. Findex Database 2022, 101, 131. Available online: https://www.worldbank.org/en/publication/globalfindex (accessed on 24 August 2024).
- Zins, A.; Weill, L. The determinants of financial inclusion in Africa. Rev. Dev. Financ. 2016, 6, 46–57. [Google Scholar] [CrossRef]
- Sarma, M.; Pais, J. Financial inclusion and development. J. Int. Dev. 2011, 23, 613–628. [Google Scholar] [CrossRef]
- Rashdan, A.; Eissa, N. The determinants of financial inclusion in Egypt. Int. J. Financ. Res. 2020, 11, 123. [Google Scholar] [CrossRef]
- Khan, S.; Alhadi, F.A.F. Fintech and financial inclusion in Saudi Arabia. Rev. Econ. Financ. 2022, 20, 857–866. [Google Scholar] [CrossRef]
- Kuznyetsova, A.; Boiarko, I.; Khutorna, M.; Zhezherun, Y. Development of financial inclusion from the standpoint of ensuring financial stability. Public Munic. Financ. 2022, 11, 20–36. [Google Scholar] [CrossRef]
- Liu, Y.; Luan, L.; Wu, W.; Zhang, Z.; Hsu, Y. Can digital financial inclusion promote China’s economic growth? Int. Rev. Financ. Anal. 2021, 78, 101889. [Google Scholar] [CrossRef]
- Oshora, B.; Desalegn, G.; Gorgenyi-Hegyes, E.; Fekete-Farkas, M.; Zeman, Z. Determinants of financial inclusion in small and medium enterprises: Evidence from Ethiopia. J. Risk Financ. Manag. 2021, 14, 286. [Google Scholar] [CrossRef]
- Gbalam, P.E.; Dumani, M. Determinants of Financial Inclusion in Nigeria. IOSR J. Econ. Financ. 2020, 11, 14–22. [Google Scholar]
- Ozili, P.K. Measuring Financial Inclusion and Financial Exclusion. In New Challenges for Future Sustainability and Wellbeing; Emerald Publishing: Leeds, UK, 2021; pp. 411–427. [Google Scholar] [CrossRef]
- Clifford, K. The Causes and Consequences of Mobile Money Taxation An Examination of Mobile Money Transaction Taxes in Sub-Saharan Africa. 2020. Available online: https://www.ictd.ac/event/mobile-money-taxation-africa-causes-consequences/ (accessed on 6 September 2024).
- Silue, T. E-Money, Financial Inclusion and Mobile Money Tax in Sub-Saharan African Mobile Networks; CERDI: Clermont-Ferrand, France, 2021. [Google Scholar]
- Whitehead Communications Ltd. Uganda Social Media and Mobile Money Taxes Survey Report. 2018. Available online: http://www.whiteheadcommunications.com/blog/uganda-social-media-and-mobile-money-taxes-survey (accessed on 1 August 2024).
- Djokoto, J.; Afrane, A.A.; Agyei-Henaku, K.A.A.; Badu-Prah, C.; Srofenyoh, F.Y.; Gidiglo, F. Electronic Levy in Ghana—Evidence from a pre-implementation survey. Acad. Lett. 2022, 2, 1–13. [Google Scholar] [CrossRef]
- Ghana Revenue Authority Electronic Transfer Levy. 2022. Available online: https://gra.gov.gh/acts/ (accessed on 13 August 2024).
- Fehling, J. How Did the Introduction of a Mobile Money Tax in Kenya Influence the Usage of Mobile Money? Lund University: Lund, Sweden, 2019. [Google Scholar]
- Ndung’u, N. Digital Technology and State Capacity in Kenya; Center for Global Development: Washington, DC, USA, 2019; pp. 1–43. [Google Scholar]
- Lees, A.; Akol, D. There and back again: The making of Uganda’s mobile money tax. Bright. ICTD. 2021. Available online: https://www.africaportal.org/documents/22362/ICTD\_WP123.pdf (accessed on 25 April 2022).
- Ajzen, I. Perceived behavioral control, self-efficacy, locus of control, and the theory of planned behavior 1. J. Appl. Soc. Psychol. 2002, 32, 665–683. [Google Scholar] [CrossRef]
- Dajani, D.; Yaseen, S.G.; El Qirem, I.; Sa’d, H. Predictors of Intention to Use a Sustainable Cloud-Based Quality Management System among Academics in Jordan. Sustainability 2022, 14, 14253. [Google Scholar] [CrossRef]
- Chang, M.K. Predicting unethical behavior: A comparison of the theory of reasoned action and the theory of planned behavior. J. Bus. Ethics 1998, 17, 1825–1834. [Google Scholar] [CrossRef]
- Kidwell, B.; Jewell, R.D. An examination of perceived behavioral control: Internal and external influences on intention. Psychol. Mark. 2003, 20, 625–642. [Google Scholar] [CrossRef]
- De Leon, I.G.; Fuqua, R.W. The effects of public commitment and group feedback on curbside recycling. Environ. Behav. 1995, 27, 233–250. [Google Scholar] [CrossRef]
- Pickett-Baker, J.; Ozaki, R. Pro-environmental products: Marketing influence on consumer purchase decision. J. Consum. Mark. 2008, 25, 281–293. [Google Scholar] [CrossRef]
- Lee, K. Opportunities for green marketing: Young consumers. Mark. Intell. Plan. 2008, 26, 573–586. [Google Scholar] [CrossRef]
- Armitage, C.J.; Conner, M. Efficacy of the theory of planned behaviour: A meta-analytic review. Br. J. Soc. Psychol. 2001, 40, 471–499. [Google Scholar] [CrossRef] [PubMed]
- Krueger, N.F., Jr.; Reilly, M.D.; Carsrud, A.L. Competing models of entrepreneurial intentions. J. Bus. Ventur. 2000, 15, 411–432. [Google Scholar] [CrossRef]
- Rivis, A.; Sheeran, P. Descriptive norms as an additional predictor in the theory of planned behaviour: A meta-analysis. Curr. Psychol. 2003, 22, 218–233. [Google Scholar] [CrossRef]
- Ham, M.; Jeger, M.; Frajman Ivković, A. The role of subjective norms in forming the intention to purchase green food. Econ. Res. Istraživanja 2015, 28, 738–748. [Google Scholar] [CrossRef]
- Wang, L.; Fu, C.-F.; Wong, P.P.; Zhang, Q. The impact of tourists’ perceptions of space-launch tourism: An extension of the theory of planned behavior approach. J. China Tour. Res. 2022, 18, 549–568. [Google Scholar] [CrossRef]
- Yeow, P.H.P.; Loo, W.H. Antecedents of green computer purchase behavior among Malaysian consumers from the perspective of rational choice and moral norm factors. Sustain. Prod. Consum. 2022, 32, 550–561. [Google Scholar] [CrossRef]
- Albarracin, D.; Sunderrajan, A.; Dai, W.; White, B. The Social Creation of Action and Inaction 1 The Social Creation of Action and Inaction: From Concepts to Goals to Behaviors. Adv. Exp. Soc. Psychol. 2019, 60, 223–271. [Google Scholar] [CrossRef]
- Shah, R.; Modi, A.; Muduli, A.; Patel, J.D. Purchase intention for energy-efficient equipment appliances: Extending TPB with eco-labels, green trust, and environmental concern. Energy Effic. 2023, 16, 31. [Google Scholar] [CrossRef]
- Kim, M.-S.; Hunter, J.E. Relationships among attitudes, behavioral intentions, and behavior: A meta-analysis of past research, part 2. Communic. Res. 1993, 20, 331–364. [Google Scholar] [CrossRef]
- Profit, J.; Etchegaray, J.; Petersen, L.A.; Sexton, J.B.; Hysong, S.J.; Mei, M.; Thomas, E.J. The Safety Attitudes Questionnaire as a tool for benchmarking safety culture in the NICU. Arch. Dis. Child.-Fetal Neonatal Ed. 2012, 97, F127–F132. [Google Scholar] [PubMed]
- Arttachariya, P. Environmentalism and green purchasing behavior: A study on graduate students in Bangkok, Thailand. BU Acad. Rev. 2012, 11, 1–11. [Google Scholar]
- Mostafa, M.M. Gender differences in Egyptian consumers’ green purchase behaviour: The effects of environmental knowledge, concern and attitude. Int. J. Consum. Stud. 2007, 31, 220–229. [Google Scholar] [CrossRef]
- Alhaderi, S.; Ahmed, F. The effect of social characteristic in the acceptance and continue usage for information technology in the public sector. Int. J. Bus. Soc. Sci. 2015, 6, 186–192. [Google Scholar]
- Wang, L.; Zhang, Q.; Ye, M.-J.; Wong, P.P.W.; Gong, Y. Green hotels visit intention among young adults: Integrating the familiarity, novelty, trust, perceived risk, and theory of planned behaviour. Humanit. Soc. Sci. Commun. 2024, 11, 1310. [Google Scholar] [CrossRef]
- Apasrawirote, D.; Yawised, K. Factors influencing the behavioral and purchase intention on live-streaming shopping. Asian J. Bus. Res. 2022, 12, 39. [Google Scholar] [CrossRef]
- Wu, J.-H.; Wang, S.-C.; Lin, L.-M. What drives mobile health care? An empirical evaluation of technology acceptance. In Proceedings of the 38th Annual Hawaii International Conference on System Sciences, Big Island, HI, USA, 3–6 January 2005; p. 150a. [Google Scholar]
- Ong, A.K.S.; Prasetyo, Y.T.; Velasco, K.E.C.; Abad, E.D.R.; Buencille, A.L.B.; Estorninos, E.M.; Cahigas, M.M.L.; Chuenyindee, T.; Persada, S.F.; Nadlifatin, R.; et al. Utilization of random forest classifier and artificial neural network for predicting the acceptance of reopening decommissioned nuclear power plant. Ann. Nucl. Energy 2022, 175, 109188. [Google Scholar] [CrossRef]
- German, J.D.; Redi, A.A.N.P.; Prasetyo, Y.T.; Persada, S.F.; Ong, A.K.S.; Young, M.N.; Nadlifatin, R. Choosing a package carrier during COVID-19 pandemic: An integration of pro-environmental planned behavior (PEPB) theory and Service Quality (SERVQUAL). J. Clean. Prod. 2022, 346, 131123. [Google Scholar] [CrossRef]
- Al-Khaldy, D.A.W.; Hassan, T.H.; Abdou, A.H.; Abdelmoaty, M.A.; Salem, A.E. The Effects of Social Networking Services on Tourists’ Intention to Visit Mega-Events during the Riyadh Season: A Theory of Planned Behavior Model. Sustainability 2022, 14, 14481. [Google Scholar] [CrossRef]
- Ho, S.C.-H.; Yeh, Y.-J.Y.; Lin, T.M.Y. Effects of luxury perceptions on purchase intention of high-tech products. J. Int. Consum. Mark. 2022, 34, 168–183. [Google Scholar] [CrossRef]
- Al-Emran, M.; Islam, S.; Harun, A. Understanding quality factors of electronic health service in an emerging economy. Qual. Manag. J. 2022, 29, 212–231. [Google Scholar] [CrossRef]
- Nysveen, H.; Pedersen, P.E.; Thorbjørnsen, H. Explaining intention to use mobile chat services: Moderating effects of gender. J. Consum. Mark. 2005, 22, 247–256. [Google Scholar] [CrossRef]
- Luarn, P.; Lin, H.-H. Toward an understanding of the behavioral intention to use mobile banking. Comput. Hum. Behav. 2005, 21, 873–891. [Google Scholar] [CrossRef]
- Wei, C.-F.; Chiang, C.-T.; Kou, T.-C.; Lee, B.C.Y. Toward sustainable livelihoods: Investigating the drivers of purchase behavior for green products. Bus. Strateg. Environ. 2017, 26, 626–639. [Google Scholar] [CrossRef]
- Jain, A.; Behera, B.; Kochhar, K. Customer adoption of green banking: An extended theory of planned behavior. Manag. Decis. 2025. ahead of print. [Google Scholar] [CrossRef]
- Geissdoerfer, M.; Savaget, P.; Bocken, N.M.P.; Hultink, E.J. The Circular Economy–A new sustainability paradigm? J. Clean. Prod. 2017, 143, 757–768. [Google Scholar] [CrossRef]
- Evans, K. Treating financial difficulty—The missing link in mental health care? J. Ment. Health 2018, 27, 487–489. [Google Scholar] [CrossRef]
- Mas, I.; Radcliffe, D. Scaling mobile money. J. Paym. Strateg. Syst. 2011, 5, 298–315. [Google Scholar] [CrossRef]
- Deganis, I.; Haghian, P.Z.; Tagashira, M.; Alberti, A. Leveraging Digital Technologies for Social Inclusion; United Nations Department of Economic and Social Affairs: New York, NY, USA, 2021; Available online: https://digitallibrary.un.org/record/3901121?ln=en&v=pdf (accessed on 23 August 2024).
- León, C. The adoption of a mobile payment system: The user perspective. Lat. Am. J. Cent. Bank. 2021, 2, 100042. [Google Scholar] [CrossRef]
- White, K.; Habib, R.; Hardisty, D.J. How to SHIFT Consumer Behaviors to be More Sustainable: A Literature Review and Guiding Framework. J. Mark. 2019, 83, 22–49. [Google Scholar] [CrossRef]
- Kim, M.; Zoo, H.; Lee, H.; Kang, J. Mobile financial services, financial inclusion, and development: A systematic review of academic literature. Electron. J. Inf. Syst. Dev. Ctries. 2018, 84, e12044. [Google Scholar] [CrossRef]
- Sarma, M.; Pais, J. Financial Inclusion and Development: A Cross Country Analysis. Annu. Conf. Hum. Dev. Capab. Assoc. New Delhi 2008, 168, 1–30. [Google Scholar] [CrossRef]
- Van Nguyen, N.; Nguyen, T.A. Intentions to adopt contactless travel in the post-pandemic era: Adapting to a new normal. Int. J. Anal. Appl. 2024, 22, 101. [Google Scholar] [CrossRef]
- Jan, I.U.; Ji, S.; Yeo, C. Values and green product purchase behavior: The moderating effects of the role of government and media exposure. Sustainability 2019, 11, 6642. [Google Scholar] [CrossRef]
- Qu, B.; Wei, L.; Zhang, Y. Factors affecting consumer acceptance of electronic cash in China: An empirical study. Financ. Innov. 2022, 8, 9. [Google Scholar] [CrossRef]
- Al-Sabaawi, M.Y.M.; Alshaher, A.A.; Alsalem, M.A. User trends of electronic payment systems adoption in developing countries: An empirical analysis. J. Sci. Technol. Policy Manag. 2023, 14, 246–270. [Google Scholar] [CrossRef]
- Neves, C.; Oliveira, T.; de Oliveira Santini, F.; Ladeira, W.J. A digital payment generalisation model: A meta-analytic structural equation modelling (MASEM) research. Electron. Commer. Res. 2024, 1–30. [Google Scholar] [CrossRef]
- Ajouz, M.; Abuamria, F.; Hammad, J. Factors influencing mobile payment adoption and its role in promoting financial inclusion: An integrated reflective model with theory of planned behavior. In Proceedings of the International Conference on Business and Technology, Istanbul, Turkey, 6–7 November 2021; pp. 563–581. [Google Scholar]
- Dzandu, M.D.; Hanu, C.; Amegbe, H. Gamification of mobile money payment for generating customer value in emerging economies: The social impact theory perspective. Technol. Forecast. Soc. Change 2022, 185, 122049. [Google Scholar] [CrossRef]
- Al-Okaily, M.; Lutfi, A.; Alsaad, A.; Taamneh, A.; Alsyouf, A. The determinants of digital payment systems’ acceptance under cultural orientation differences: The case of uncertainty avoidance. Technol. Soc. 2020, 63, 101367. [Google Scholar] [CrossRef]
- Duh, H.I.; Akasreku, F. Socio-demographic, consumer and product related drivers of mobile payment use and reuse: Four theories’ explanations. Int. J. Technol. Mark. 2024, 18, 137–161. [Google Scholar] [CrossRef]
- Soseco, T. Effect of E-Money to economic Performance (a Comparative Study of Selected countries). In Proceedings of the International Conference of Management Sciences, Kasihan, Indonesia, 10 March 2016; pp. 9–12. [Google Scholar]
- Tian, Z.; Sun, X.; Wang, J.; Su, W.; Li, G. Factors Affecting Green Purchase Intention: A Perspective of Ethical Decision Making. Int. J. Environ. Res. Public Health 2022, 19, 11151. [Google Scholar] [CrossRef] [PubMed]
- Grant, A.M. Does intrinsic motivation fuel the prosocial fire? Motivational synergy in predicting persistence, performance, and productivity. J. Appl. Psychol. 2008, 93, 48. [Google Scholar] [CrossRef] [PubMed]
- Grant, A.M.; Campbell, E.M. Doing good, doing harm, being well and burning out: The interactions of perceived prosocial and antisocial impact in service work. J. Occup. Organ. Psychol. 2007, 80, 665–691. [Google Scholar] [CrossRef]
- Grant, A.M. Leading with meaning: Beneficiary contact, prosocial impact, and the performance effects of transformational leadership. Acad. Manag. J. 2012, 55, 458–476. [Google Scholar] [CrossRef]
- Manrai, R.; Goel, U.; Yadav, P.D. Factors affecting adoption of digital payments by semi-rural Indian women: Extension of UTAUT-2 with self-determination theory and perceived credibility. Aslib J. Inf. Manag. 2021, 73, 814–838. [Google Scholar] [CrossRef]
- Cialdini, R.B.; Goldstein, N.J. Social influence: Compliance and conformity. Annu. Rev. Psychol. 2004, 55, 591–621. [Google Scholar] [CrossRef]
- Schwartz, S.H. Universals in the content and structure of values: Theoretical advances and empirical tests in 20 countries. In Advances in Experimental Social Psychology; Elsevier: Amsterdam, The Netherlands, 1992; Volume 25, pp. 1–65. [Google Scholar]
- Bandura, A.; Wessels, S. Self-Efficacy; Cambridge University Press: Cambridge, UK, 1997. [Google Scholar]
- Snyder, M.; Omoto, A.M. Volunteerism: Social issues perspectives and social policy implications. Soc. Issues Policy Rev. 2008, 2, 1–36. [Google Scholar] [CrossRef]
- Zheng, G.-W.; Siddik, A.B.; Masukujjaman, M.; Alam, S.S.; Akter, A. Perceived environmental responsibilities and green buying behavior: The mediating effect of attitude. Sustainability 2020, 13, 35. [Google Scholar] [CrossRef]
- Bamberg, S.; Möser, G. Twenty years after Hines, Hungerford, and Tomera: A new meta-analysis of psycho-social determinants of pro-environmental behaviour. J. Environ. Psychol. 2007, 27, 14–25. [Google Scholar] [CrossRef]
- Bandura, A. Human agency in social cognitive theory. Am. Psychol. 1989, 44, 1175. [Google Scholar] [CrossRef]
- Stern, P.C.; Dietz, T.; Kalof, L. Value orientations, gender, and environmental concern. Environ. Behav. 1993, 25, 322–348. [Google Scholar] [CrossRef]
- Bamberg, S.; Rees, J.; Seebauer, S. Collective climate action: Determinants of participation intention in community-based pro-environmental initiatives. J. Environ. Psychol. 2015, 43, 155–165. [Google Scholar] [CrossRef]
- Lin, S.-C.; Nadlifatin, R.; Amna, A.R.; Persada, S.F.; Razif, M. Investigating citizen behavior intention on mandatory and voluntary pro-environmental programs through a pro-environmental planned behavior model. Sustainability 2017, 9, 1289. [Google Scholar] [CrossRef]
- Quartey, J.D.; Nyarko, L.G. Economic Sustainability of Mobile Money Payments in Ghana: Does a Tax on Transactions Matter? Afr. J. Econ. Rev. 2022, 10, 112–131. [Google Scholar]
- Ofosu-Ampong, K. New policies, new behaviors: How digital taxation shapes mobile money use in Ghana. Eng. Rep. 2024, 6, e12860. [Google Scholar] [CrossRef]
- Bongomin, G.O.C.; Munene, J.C.; Ntayi, J.M.; Malinga, C.A. Collective action among rural poor: Does it enhance financial intermediation by banks for financial inclusion in developing economies? Int. J. Bank Mark. 2019, 37, 20–43. [Google Scholar] [CrossRef]
- The E-levy in Ghana: Economic Impact Assessment. 2023. Available online: www.gsma.com (accessed on 24 August 2024).
- Muthiora, B.; Raithatha, R. Rethinking Mobile Money Taxation: Taxation and Mobile Money in Tanzania 2017; GSMA: London, UK, 2017. [Google Scholar]
- Guermond, V. Whose money? Digital remittances, mobile money and fintech in Ghana. J. Cult. Econ. 2022, 15, 436–451. [Google Scholar] [CrossRef]
- Chang, C.C. Factors Affecting m-learning Continuance: From the Perspectives of flow Theory and Stimulus-Organism-Response Theory. Proc. Eur. Conf. Knowl. Manag. ECKM 2022, 23, 1396–1402. [Google Scholar] [CrossRef]
- Unmasking the Environmental Impact of Digital Payments: The Carbon Footprint Hidden in Every Transaction. Available online: https://www.linkedin.com/pulse/unmasking-environmental-impact-digital-payments-carbon-dwivedi (accessed on 10 August 2023).
- Tan, K.-L.; Memon, M.A.; Sim, P.-L.; Leong, C.-M.; Soetrisno, F.K.; Hussain, K. Intention to use mobile payment system by ethnicity: A partial least squares multi-group approach. Asian J. Bus. Res. 2019, 9, 36–59. [Google Scholar] [CrossRef]
- Knussen, C.; Yule, F. “I’m Not in the Habit of Recycling” The Role of Habitual Behavior in the Disposal of Household Waste. Environ. Behav. 2008, 40, 683–702. [Google Scholar] [CrossRef]
- Trumbo, C.W.; O’Keefe, G.J. Intention to conserve water: Environmental values, planned behavior, and information effects. A comparison of three communities sharing a watershed. Soc. Nat. Resour. 2001, 14, 889–899. [Google Scholar]
- Anshari, M.; Almunawar, M.N.; Masri, M.; Hamdan, M.; Fithriyah, M.; Fitri, A. Digital wallet in supporting green FinTech sustainability. In Proceedings of the 2021 Third International Sustainability and Resilience Conference: Climate Change, Sakheer, Bahrain, 15–16 November 2021; pp. 352–357. [Google Scholar]
- Kumar, N.; Raut, R.D.; Upreti, K.; Alam, M.S.; Shafiuddin, M.; Verma, M. Environmental concern in TPB model for sustainable IT adoption. In International Conference on Information Systems and Intelligent Applications; Springer: Cham, Switzerland, 2022; pp. 59–70. [Google Scholar]
- Xie, X.; Han, Y.; Anderson, A.; Ribeiro-Navarrete, S. Digital platforms and SMEs’ business model innovation: Exploring the mediating mechanisms of capability reconfiguration. Int. J. Inf. Manag. 2022, 65, 102513. [Google Scholar] [CrossRef]
- Ye-Eun Song, S.-H.J.; Jeon, M.-S. The Effect of Mobile Food Delivery Application Usage Factors on Customer Satisfaction and Intention to Reuse. Acad. J. Culin. Sci. Hosp. Res. 2017, 23, 37–47. [Google Scholar]
- Fornell, C.; Bookstein, F.L. Two structural equation models: LISREL and PLS applied to consumer exit-voice theory. J. Mark. Res. 1982, 19, 440–452. [Google Scholar] [CrossRef]
- Kock, F.; Berbekova, A.; Assaf, A.G. Understanding and managing the threat of common method bias: Detection, prevention and control. Tour. Manag. 2021, 86, 104330. [Google Scholar] [CrossRef]
- Podsakoff, P.M.; MacKenzie, S.B.; Podsakoff, N.P. Sources of method bias in social science research and recommendations on how to control it. Annu. Rev. Psychol. 2012, 63, 539–569. [Google Scholar] [CrossRef]
- Burton-Jones, A. Minimizing method bias through programmatic research. MIS Q. 2009, 33, 445–471. [Google Scholar] [CrossRef]
- Fuller, C.M.; Simmering, M.J.; Atinc, G.; Atinc, Y.; Babin, B.J. Common methods variance detection in business research. J. Bus. Res. 2016, 69, 3192–3198. [Google Scholar] [CrossRef]
- GSMA. The Causes and Consequences of Mobile Money Taxation. An Examinination of Mobile Money Taxation in Sub Saharan Africa. 2020. Available online: https://www.gsma.com/mobilefordevelopment/resources/the-causes-and-consequences-of-mobile-money-taxation-an-examination-of-mobile-money-transaction-taxes-in-sub-saharan-africa/ (accessed on 5 September 2024).
- Maity, S.; Sahu, T.N. Financial inclusion in north-eastern region: An investigation in the state of Assam. Vilakshan—XIMB J. Manag. 2022, 19, 206–221. [Google Scholar] [CrossRef]
- Ab Hamid, M.R.; Sami, W.; Sidek, M.H.M. Discriminant validity assessment: Use of Fornell & Larcker criterion versus HTMT criterion. Proc. J. Phys. Conf. Ser. 2017, 890, 12163. [Google Scholar]
- Anderson, J.C.; Gerbing, D.W. Structural equation modeling in practice: A review and recommended two-step approach. Psychol. Bull. 1988, 103, 411. [Google Scholar] [CrossRef]
- Henseler, J.; Ringle, C.M.; Sarstedt, M. A new criterion for assessing discriminant validity in variance-based structural equation modeling. J. Acad. Mark. Sci. 2015, 43, 115–135. [Google Scholar] [CrossRef]
- Hair, J.F.; Risher, J.J.; Sarstedt, M.; Ringle, C.M. When to use and how to report the results of PLS-SEM. Eur. Bus. Rev. 2019, 31, 2–24. [Google Scholar] [CrossRef]
- Hair, J.F., Jr.; Babin, B.J.; Krey, N. Covariance-based structural equation modeling. J. Advert. Rev. Recomm. 2017, 1, 163–177. [Google Scholar] [CrossRef]
- Shmueli, G.; Sarstedt, M.; Hair, J.F.; Cheah, J.-H.; Ting, H.; Vaithilingam, S.; Ringle, C.M. Predictive model assessment in PLS-SEM: Guidelines for using PLSpredict. Eur. J. Mark. 2019, 53, 2322–2347. [Google Scholar] [CrossRef]
- Chin, W.W. The partial least squares approach for structural equation modeling. Mod. Methods Bus. Res. 1998, 8, 295–336. [Google Scholar]
- Ringle, C.M.; Sarstedt, M. Gain more insight from your PLS-SEM results. Ind. Manag. Data Syst. 2016, 116, 1865–1886. [Google Scholar] [CrossRef]
- Henseler, J.; Chin, W.W. A comparison of approaches for the analysis of interaction effects between latent variables using partial least squares path modeling. Struct. Equ. Model. 2010, 17, 82–109. [Google Scholar] [CrossRef]
- Okello Candiya Bongomin, G.; Ntayi, J. Trust: Mediator between mobile money adoption and usage and financial inclusion. Soc. Responsib. J. 2020, 16, 1215–1237. [Google Scholar] [CrossRef]
- Andersson-Manjang, S.K.; Naghavi, N. State of the Industry Report on Mobile Money 2021; GSMA: London, UK, 2017; pp. 1–75. Available online: https://www.gsma.com/solutions-and-impact/connectivity-for-good/mobile-for-development/wp-content/uploads/2021/03/GSMA_State-of-the-Industry-Report-on-Mobile-Money-2021_Full-report.pdf (accessed on 30 August 2024).
- Koomson, I.; Martey, E.; Etwire, P.M. Mobile money and entrepreneurship in East Africa: The mediating roles of digital savings and access to digital credit. Inf. Technol. People 2023, 36, 996–1019. [Google Scholar] [CrossRef]
- Rotondi, V.; Billari, F.C. Mobile money and school participation: Evidence from Africa. Popul. Res. Policy Rev. 2021, 41, 343–362. [Google Scholar] [CrossRef]
- Taufique, K.M.R.; Vaithianathan, S. A fresh look at understanding Green consumer behavior among young urban Indian consumers through the lens of Theory of Planned Behavior. J. Clean. Prod. 2018, 183, 46–55. [Google Scholar] [CrossRef]
- Gimenez-Jimenez, D.; Harc, M. Students’ Sustainable Entrepreneurship Intentions: The Role of Sustainable Values and Culture. J. Entrep. 2024, 33, 118–154. [Google Scholar] [CrossRef]
- Van Nguyen, N.; Dang, T.L.P.; Phuong, N.T. Behavioral Intentions in Cashless: The Role of Green Finance Perception in the Vietnamese Market. Int. J. Anal. Appl. 2025, 23, 3. [Google Scholar] [CrossRef]
- Ellen, P.S.; Wiener, J.L.; Cobb-Walgren, C. The role of perceived consumer effectiveness in motivating environmentally conscious behaviors. J. Public Policy Mark. 1991, 10, 102–117. [Google Scholar] [CrossRef]
- Lee, J.A.; Holden, S.J.S. Understanding the determinants of environmentally conscious behavior. Psychol. Mark. 1999, 16, 373–392. [Google Scholar] [CrossRef]
- Yu, T.; Teoh, A.P.; Liao, J.; Wang, C. Factors influencing behavioral intention to use facial recognition payment in the restaurant industry: A comparative analysis of China and Malaysia. J. Travel Tour. Mark. 2025, 42, 222–247. [Google Scholar] [CrossRef]
- Ding, S.; Ruan, Y.; Dou, L. Rural Residents’ Digital Payment: The Use and Its Impact on Credit Availability--Evidence Using Extended UTAUT2. SAGE Open 2025, 15, 21582440251321860. [Google Scholar] [CrossRef]
- Schaalma, H.; Kok, G.; Peters, L. Determinants of consistent condom use by adolescents: The impact of experience of sexual intercourse. Health Educ. Res. 1993, 8, 255–269. [Google Scholar] [CrossRef]
- Steg, L.; Dreijerink, L.; Abrahamse, W. Factors influencing the acceptability of energy policies: A test of VBN theory. J. Environ. Psychol. 2005, 25, 415–425. [Google Scholar] [CrossRef]
- Chang, C.-H. The influence of corporate environmental ethics on competitive advantage: The mediation role of green innovation. J. Bus. Ethics 2011, 104, 361–370. [Google Scholar] [CrossRef]
- Chen, J.; Chen, X.; Broda, S.D. Trust value assignment using model-based testing. In Proceedings of the 2008 Third International Conference on Communications and Networking in China, Hangzhou, China, 25–27 August 2008. [Google Scholar]
- Chow, W.S.; Chen, Y. Intended belief and actual behavior in green computing in Hong Kong. J. Comput. Inf. Syst. 2009, 50, 136–141. [Google Scholar]
- Paul, J.; Modi, A.; Patel, J. Predicting green product consumption using theory of planned behavior and reasoned action. J. Retail. Consum. Serv. 2016, 29, 123–134. [Google Scholar] [CrossRef]
- Jaiswal, D.; Kant, R. Green purchasing behaviour: A conceptual framework and empirical investigation of Indian consumers. J. Retail. Consum. Serv. 2018, 41, 60–69. [Google Scholar] [CrossRef]
- Ardic, O.P.; Heimann, M.; Mylenko, N. Access to financial services and the financial inclusion agenda around the world: A cross-country analysis with a new data set. World Bank Policy Res. Work. Pap. 2011, 5537, 1–55. [Google Scholar]
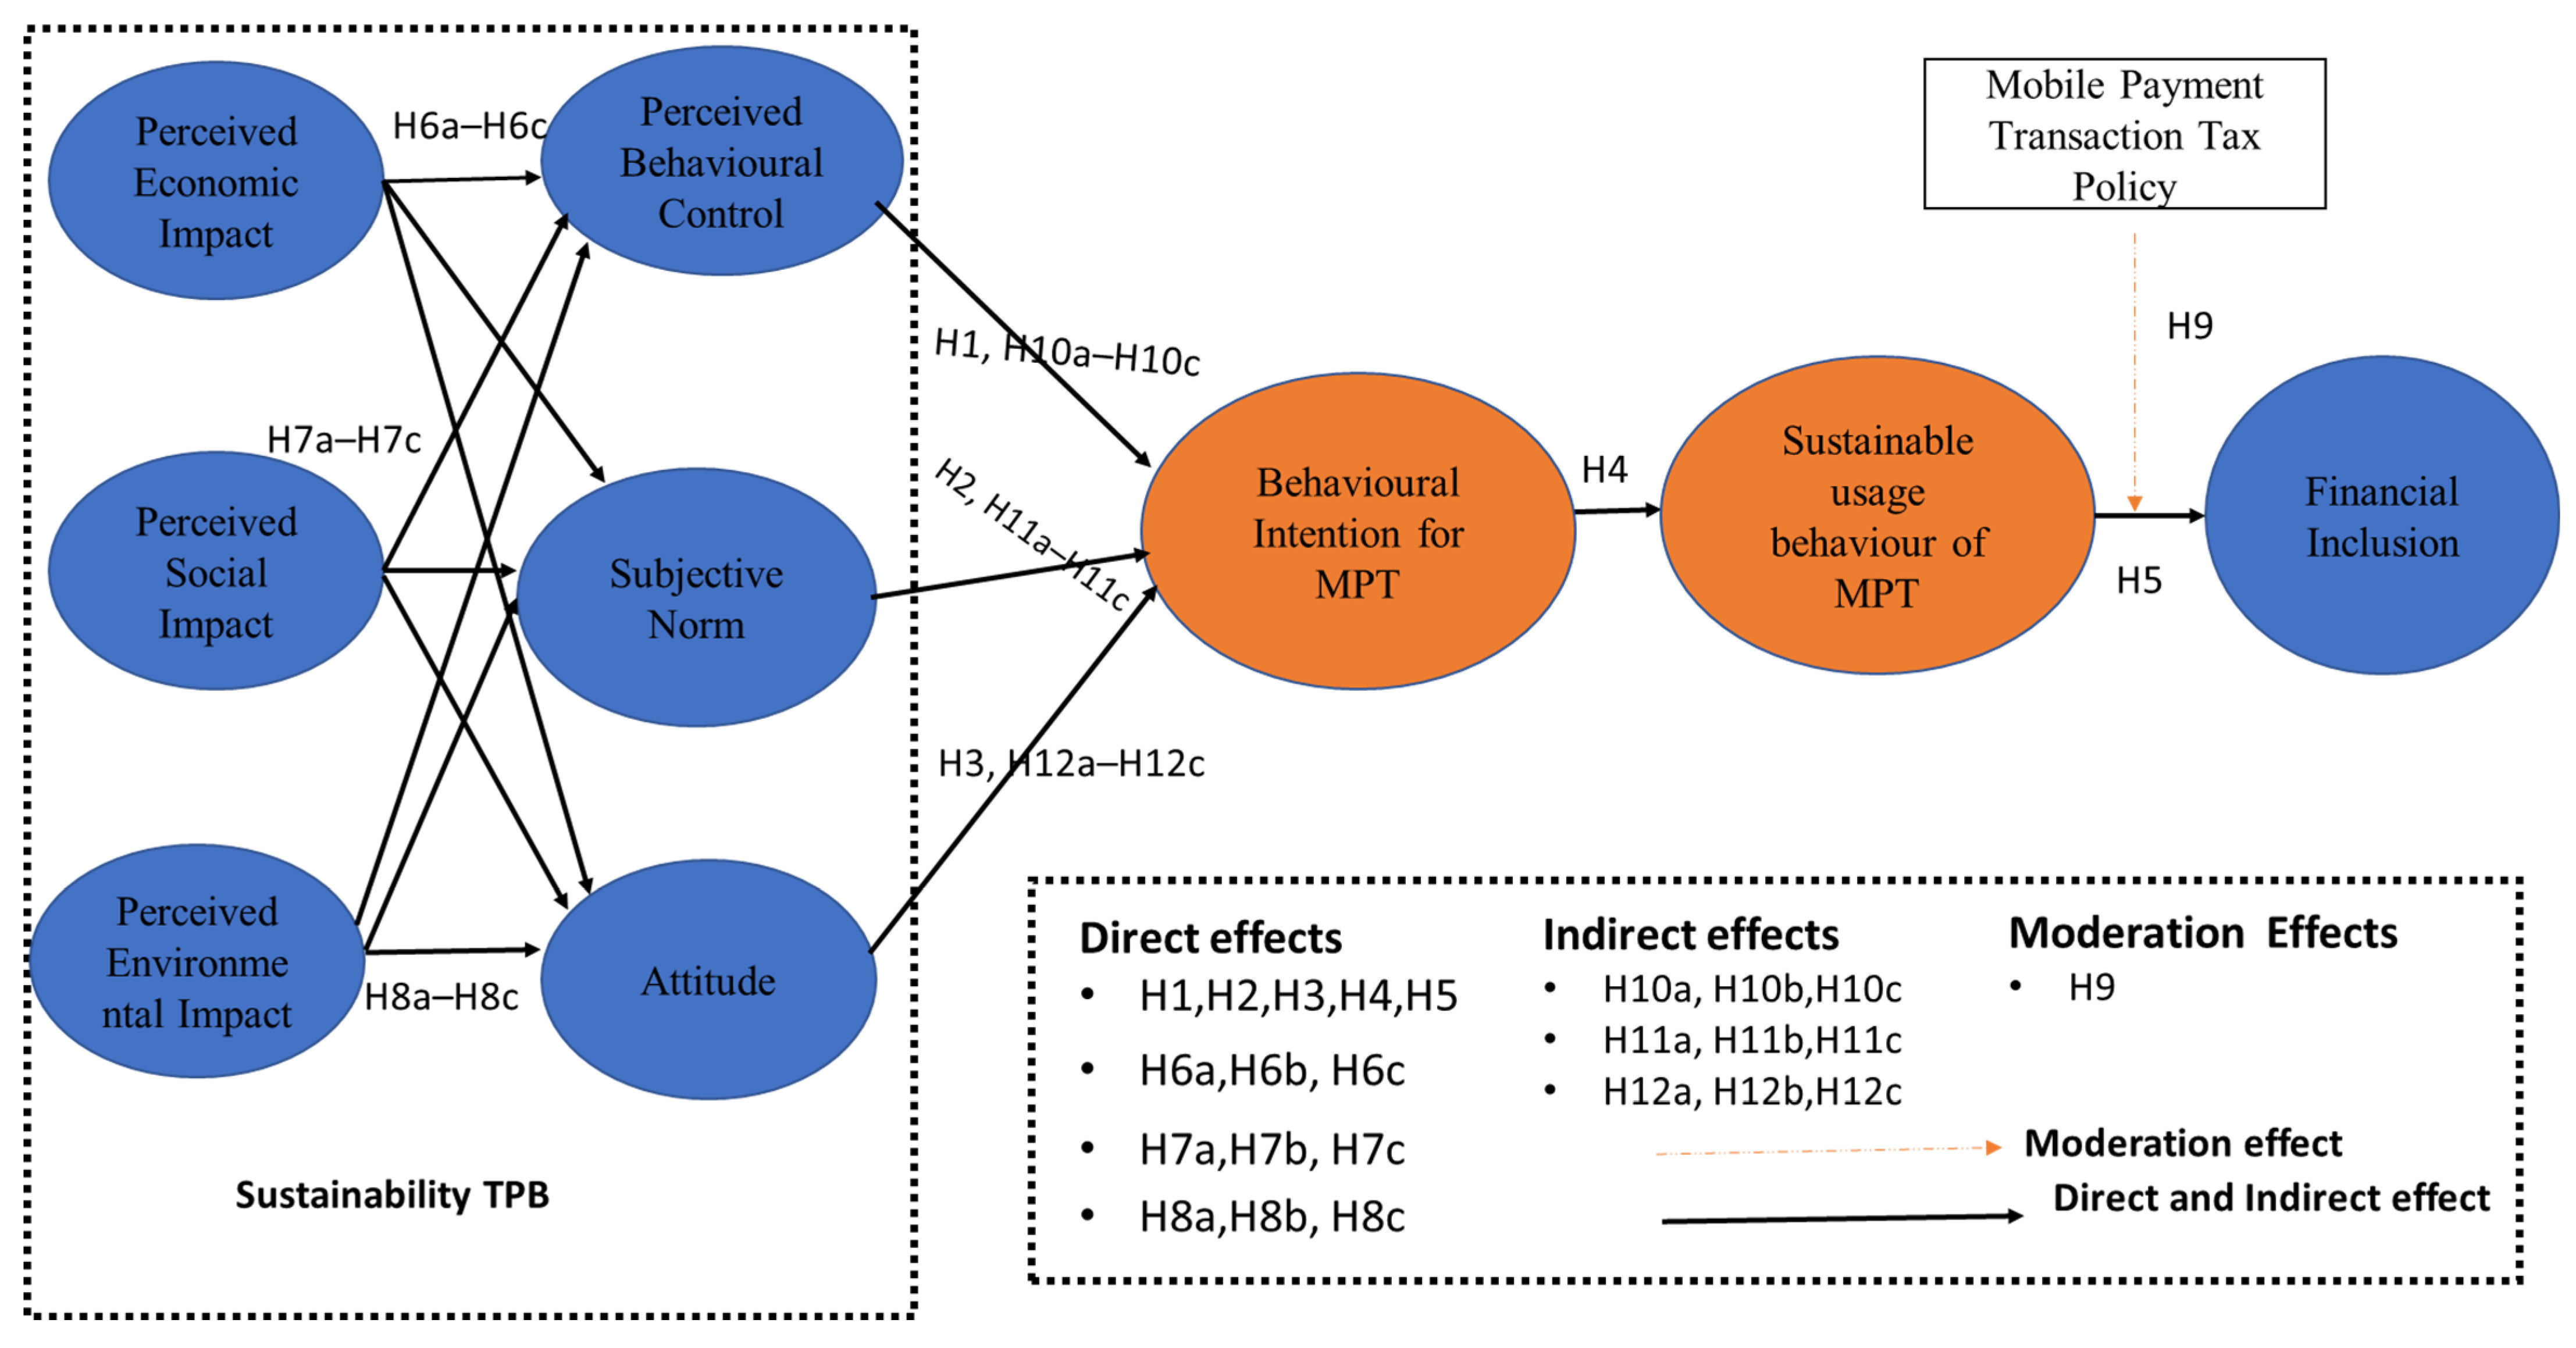
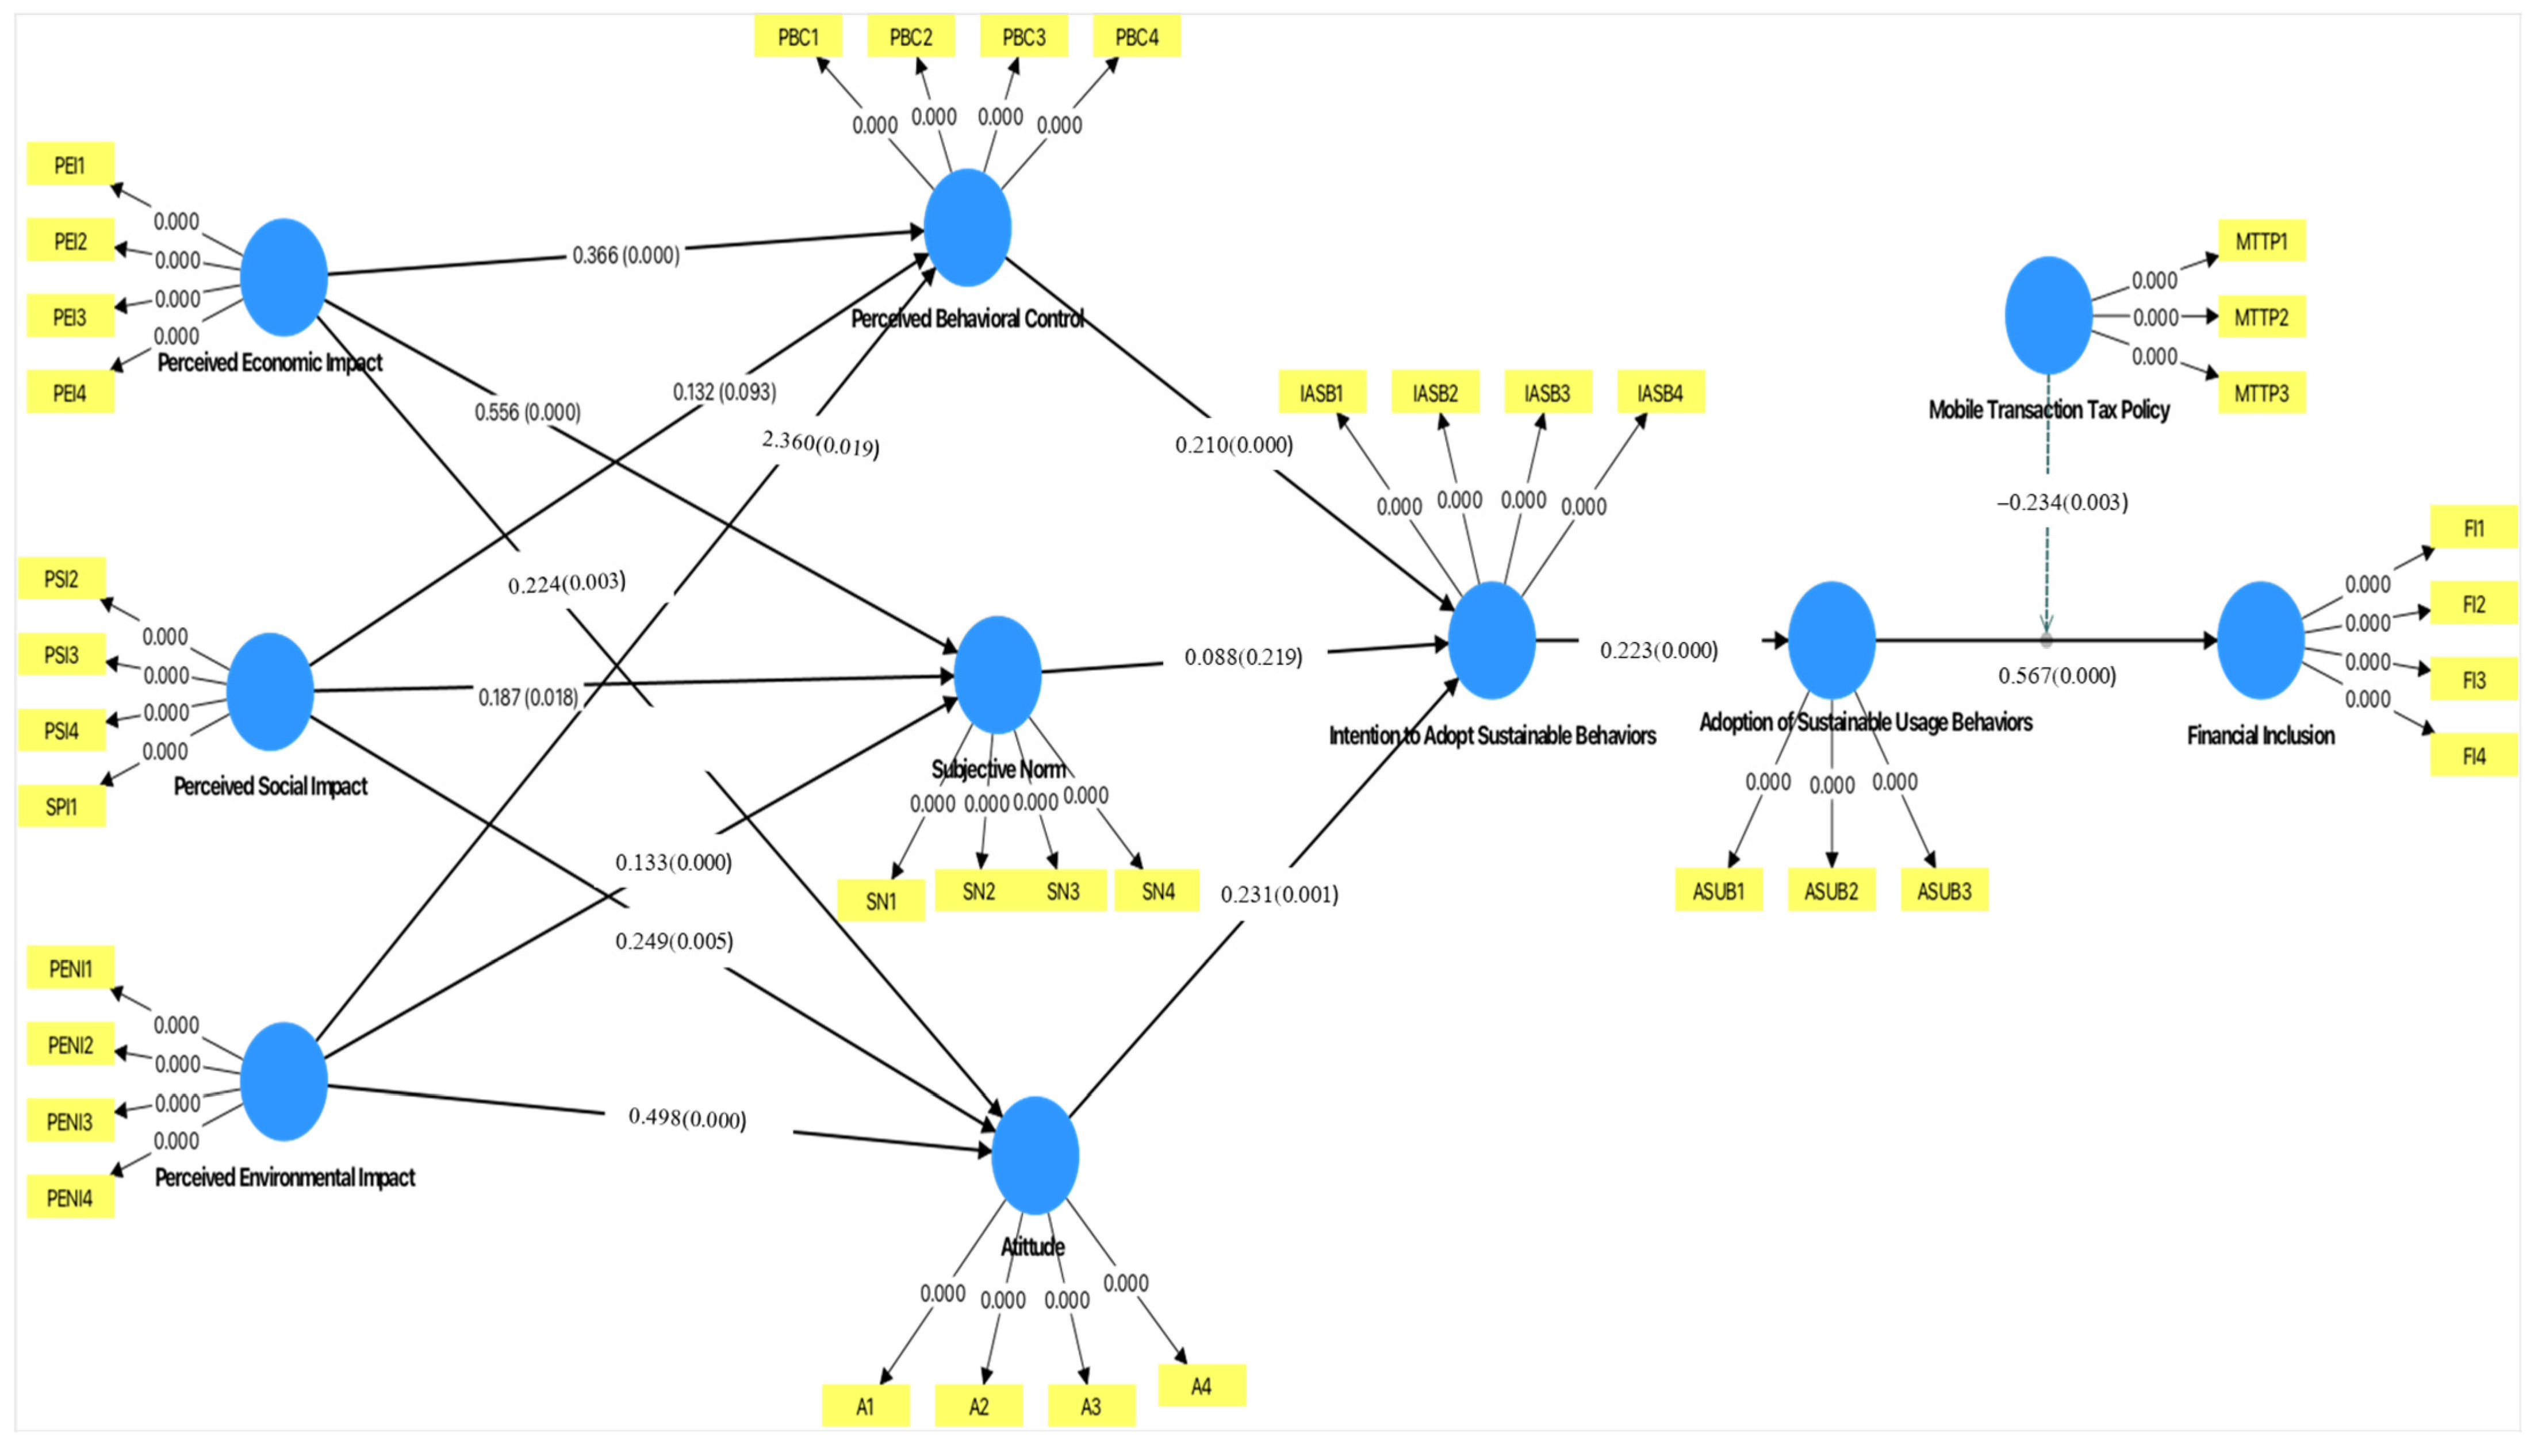
Disclaimer/Publisher’s Note: The statements, opinions and data contained in all publications are solely those of the individual author(s) and contributor(s) and not of MDPI and/or the editor(s). MDPI and/or the editor(s) disclaim responsibility for any injury to people or property resulting from any ideas, methods, instructions or products referred to in the content. |
© 2025 by the authors. Licensee MDPI, Basel, Switzerland. This article is an open access article distributed under the terms and conditions of the Creative Commons Attribution (CC BY) license (https://creativecommons.org/licenses/by/4.0/).