Article

Multi-Skilled Project Scheduling for High-End Equipment Development Considering Newcomer Cultivation and Duration Uncertainty

School of Management, Shandong University, Jinan 250100, China
*
Author to whom correspondence should be addressed.
Systems 2025, 13(6), 448; https://doi.org/10.3390/systems13060448
Submission received: 17 April 2025 / Revised: 3 June 2025 / Accepted: 5 June 2025 / Published: 6 June 2025
(This article belongs to the Section Systems Practice in Social Science)

Abstract

Traditional off-the-job training is becoming ineffective in high-end equipment research and development (R&D) projects due to the contradiction between rapid technological progress and the slow growth of newcomers, calling for “on-the-job mentoring” to enable synchronized advancement of project execution and newcomer cultivation. For this, we propose the multi-skilled project scheduling problem with newcomer cultivation under uncertain durations (MSPSP-NCU) and abstract it as a stochastic programming model. The model aims to minimize expected makespan and maximize newcomers’ skill efficiency by optimizing workforce assignment that enables experienced workers to mentor newcomers while simultaneously optimizing task scheduling. Solving the model is blocked by the inherently NP-hard nature of the project scheduling problem and the stochasticity of the durations. Therefore, we put forward an adaptive simulation–optimization approach featuring two-fold: a simulation module capable of dynamically adjusting sample sizes based on convergence feedback and evaluating solutions with improved efficiency and stable accuracy; a tailored non-dominated sorting genetic algorithm II (NSGA-II) with adaptive evolutionary operators that enhance search effectiveness and ensure the identification of a well-distributed Pareto front. By using data from an aerospace component R&D project, the proposed approach is validated for its performance in identifying Pareto-optimal solutions. Several personalized rules are designed by integrating workforce development strategies into the selection process, providing actionable guidelines for cultivating newcomers in technology-intensive projects.

1. Introduction

Nations have intensified high-end equipment research and development (R&D) in recent years to revitalize their economies and improve global competitiveness [1]. These R&D projects involve cutting-edge innovations and expertise from multiple disciplines, requiring a highly proficient workforce capable of handling diverse skills [2]. Cultivating such a workforce is particularly challenging, as conventional off-the-job training, with its standardized content, often falls short in imparting the core skills required for equipment R&D [3]. On-the-job mentoring integrating newcomer cultivation into project execution is emerging as a novel training paradigm [4]. However, under this paradigm, experienced workers are tasked with both technical problem-solving and mentoring responsibilities. This division of focus reduces the time available for their core functions and adversely impacts timely project delivery. When short-term efficiency is prioritized, newcomers are often relegated to routine tasks or left on the periphery, limiting their access to the core tasks essential for skill development. For effective on-the-job mentoring, organizations urgently call for a more scientific approach to balance newcomer cultivation with project timelines.
Many scholars have explored skill development through workforce assignments in project scheduling. Some studies have incorporated learning effects into project scheduling models, capturing how the workforce improves their skill efficiency over time as they repeatedly perform tasks [5]. However, these studies primarily focus on modeling the learning curve rather than explicitly treating skill development as an independent optimization objective. Additionally, the assumption of deterministic durations in existing studies contradicts the reality of high-end equipment R&D projects, where task durations are inherently uncertain due to complex technological iterations, frequent design modifications, and unforeseen challenges. This uncertainty complicates task scheduling and disrupts workforce assignment, as even minor timing variations can render planned assignment schemes infeasible. The interdependence between task scheduling and workforce assignment makes it increasingly difficult to establish a stable and efficient schedule.
This paper investigates the multi-skilled project scheduling problem with newcomer cultivation under uncertain durations (MSPSP-NCU). The objective is to achieve a Pareto-optimal balance between minimizing expected makespan and maximizing skill efficiency increments for newcomers by jointly optimizing task scheduling and workforce assignment. Considering the stochasticity of the durations and the high dimensionality introduced by the cross-product of these two decisions, it is impractical to search for the optimal solution within a reasonable computing effort using existing solution techniques. In response, this paper proposes an adaptive simulation–optimization approach that integrates a tailored non-dominated sorting genetic algorithm II (NSGA-II) with an adaptive simulation module. The simulation module evaluates objective functions through Monte Carlo sampling over duration distributions. An adaptive mechanism is applied to dynamically adjust the number of simulation samples based on real-time convergence feedback, thereby enhancing the computational efficiency while maintaining evaluation accuracy. Based on the evaluations, a tailored NSGA-II utilizes problem-specific genetic operators to fit multi-skilled project scheduling constraints and effectively reduce infeasible solutions. Furthermore, an adaptive evolutionary mechanism autonomously adjusts the probabilities of operators based on the characteristics of solutions, ensuring the convergence to a well-represented and evenly spread Pareto front.
This paper makes several unique contributions to theory and practice. Firstly, we propose and formalize the multi-skilled project scheduling problem with newcomer cultivation under uncertainty (MSPSP-NCU). Firstly, from a systems theory perspective, we propose and formalize the multi-skilled project scheduling problem with newcomer cultivation under uncertainty (MSPSP-NCU). This model addresses the urgent need for high-end equipment R&D projects to incorporate skill development during project execution, thereby filling a gap in existing studies, which have largely neglected newcomer cultivation under uncertain conditions. Secondly, given that the MSPSP-NCU involves uncertain durations and high-dimensional decision spaces, this paper proposes an adaptive simulation-optimization approach that integrates a simulation module to enhance efficiency and leverages a tailored NSGA-II algorithm with adaptive evolutionary operators to efficiently search for well-distributed non-dominated solutions in large-scale multi-objective spaces. In addition to solving the problem addressed in this paper, the proposed approach offers valuable methodological support for optimization under uncertainty in complex environments. Thirdly, the resulting Pareto solution set offers project managers a diverse range of trade-off options, serving as a practical reference for decision-making. Moreover, several personalized rules are provided to support the identification of final solutions based on specific managerial preferences or strategic priorities.
The remainder of this paper is structured as follows: Section 2 reviews the relevant literature and identifies the position of this paper. Section 3 introduces the MSPSP-NCU and provides its mathematical formulation. Section 4 presents the adaptive simulation–optimization approach developed to solve the problem. Section 5 investigates the performance of the proposed approach in a real-world case to validate its performance. Finally, Section 6 summarizes key points throughout the paper and provides directions for further research.

2. Literature Review

2.1. Multi-Skilled Resource-Constrained Project Scheduling Considering the Skill Development

The resource-constrained project scheduling problem (RCPSP), as an extension of the traditional project scheduling problem (PSP), aims to optimize certain objectives while adhering to precedence constraints and resource limitations. Typically, the most common precedence constraint used is the finish-to-start relation, but it can also involve more generalized precedence constraints, such as start-to-start, finish-to-finish, and start-to-finish [6]. In human resource-intensive environments, workforce capabilities are inherently diverse. Néron [7] introduced the concept of multi-skilled resources, where individuals can execute multiple tasks according to their skill types. Bellenguez and Néron [8] further extended this problem by integrating variations in skill efficiency. They recognize that workers differ not only in the types of skills they possess but also in the efficiency of their mastery. This progression led to the formal definition of the multi-skilled resource-constrained project scheduling problem (MSRCPSP), which optimizes workforce assignment considering both skill availability and efficiency matching. Subsequently, extensive studies have been devoted to advancing the MSRCPSP [9,10,11].
Recent studies have recognized that skill efficiency is not static but evolves through task execution [12]. This perspective builds upon the learning effect, initially introduced by Wright in aircraft manufacturing, suggesting that workers improve their skill efficiency through repeated task engagement [13]. Various learning curves are used in scheduling modeling to show the dynamic development of workforce skill efficiency during task advancement. Wu and Sun [14] formulated a mixed nonlinear programming model that incorporates learning effects into project scheduling and workforce assignment. The model aims to minimize outsourcing costs and is solved using a genetic algorithm. Guo et al. [15] proposed a dynamic skill-level modeling framework for software project scheduling, which incorporates both learning and forgetting effects. They developed an enhanced firework algorithm to optimize the makespan and cost. Hosseinian and Baradaran [16] investigated the MSRCPSP with generalized precedence relations, introducing a modified Pareto archived evolution strategy to optimize makespan, costs, and rework risks. Van Peteghem and Vanhoucke [5] examined the impact of learning effects on the discrete time/resource trade-off problem, quantifying the improvements in scheduling accuracy and shortened makespan when learning effects are considered. Ammar and Abdel-Maged [17] refined the line-of-balance scheduling technique by embedding a straight-line learning curve model, improving the makespan and cost for repetitive projects. Mozhdehi et al. [10] explored the MSRCPSP in a multi-project setting, where learning is modeled via two pathways: collaboration and practice. The model determines schedules while considering dexterity improvement of workforces and is solved using a modified discrete biogeography-based optimization algorithm to minimize makespan. However, the existing studies treat skill development as a passive outcome of task execution and assume that learning naturally occurs through task repetition without actively optimizing skill development. To date, only Gutjahr and Chen’s studies have considered skill efficiency increment as an optimization objective [12,18,19].

2.2. Project Scheduling Under Uncertain Duration

Most existing studies on project scheduling are based on a deterministic setting, assuming that parameters such as task durations and resource availabilities are known with certainty. Aghileh et al. [20] illustrate this trend through a literature review with quantitative analysis. However, this assumption conflicts with the unpredictability observed in real-world project execution. The schedules derived under deterministic conditions are significantly less adaptable to uncertain environments. This issue is particularly evident in the uncertainty of task durations. In response, an increasing number of studies have begun to explore the project scheduling problem with uncertain durations, and the solutions are broadly categorized into four approaches: fuzzy scheduling, proactive scheduling, reactive scheduling, and stochastic scheduling [21,22].
Fuzzy scheduling addresses uncertain task durations by relying on human expert estimates when historical data or probabilistic distributions are unavailable [23]. It employs fuzzy set theory to formalize these estimates, capturing expert judgments through linguistic variables and corresponding membership functions. Proactive scheduling strengthens baseline schedules by strategically inserting time buffers to resist anticipated delays from uncertainty [24]. Reactive scheduling does not remove uncertainty beforehand, but it quickly reschedules tasks when something goes wrong beyond acceptable limits [25]. The latest studies have integrated proactive and reactive scheduling into a unified framework. In this framework, proactive buffers absorb uncertainties within predefined tolerance ranges, while reactive scheduling addresses disruptions when these uncertainties exceed buffer capacities [26].
Stochastic scheduling addresses uncertainties by modeling task duration as random variables with known probability distributions. This approach has attracted increasing attention due to its realistic representation of execution variability and its compatibility with decision support. Sobel et al. [27] considered duration uncertainty to develop a stochastic project scheduling model for optimizing the expected present value of cash flows. Creemers [28] developed an exact procedure to minimize the expected makespan of a project with stochastic task durations under resource constraints. Unlike other studies that assume beta, uniform, or Gaussian distributions for task duration, his work employs a PH distribution to more accurately capture the stochastic behavior of tasks. Zhou et al. [29] examined RCPSP under time-varying weather conditions, introducing an improved estimation of distribution algorithm to enhance scheduling performance. Chen et al. [30] proposed a filtering genetic programming framework that simultaneously addresses stochastic task durations and the insertion of new projects in resource-constrained multi-project scheduling. While these studies demonstrate the advantages of stochastic scheduling, the computational complexity grows rapidly with problem scale due to the ‘curse of dimensionality’ in state–space exploration, requiring a balance between solution quality and runtime efficiency.

2.3. Literature Gaps

As shown in Table 1, the existing literature has made advancements in resource-constrained project scheduling problems. However, most studies on MSRCPSP assume deterministic durations, which limits their applicability in real-world scenarios where uncertainty is pervasive. Moreover, although some studies incorporate skill development into existing models through learning effects, only a limited number of studies explicitly address it as an optimization objective. Addressing uncertainty and skill development simultaneously is challenging, as uncertainty inherently affects the process of skill development. This paper aims to bridge this gap by proposing MSPSP-NCU and developing a novel simulation–optimization approach that minimizes expected makespan while maximizing skill efficiency increments for newcomers.

3. Problem Statement

3.1. Problem Description

Describing the MSPSP-NCU problem starts with defining a project network. We represent the project using an activity-on-node (AON) network N = I , E , where I is the set of nodes representing activities/tasks, and E is the set of edges corresponding to the finish-to-start zero-lag precedence relationships between tasks. For every edge i , j E , the task j starts immediately after all preceding tasks i are completed. The set I consists of tasks numbered from 1 to I , where task 1 and task I are dummy start and end tasks with zero duration and no resource requirements. Each non-dummy task i I + is associated with a specific skill s S and is executed by at least one experienced worker.
The duration is modeled as a lognormally distributed random variable d ~ i to account for task-inherent uncertainty unrelated to personnel, such as technical complexity and process immaturity in high-end equipment development. As a consequence, the start time t s ~ i and end time t e ~ i of each task are also stochastic. Therefore, the scheduling decision is represented by a task sequence u = [ a 0 , a 1 , a I ] , where a m { 0,1 , I } denotes the index of the m t h task in the execution order. All tasks are non-preemptive and have only one execution mode.
The available workforce is denoted by the set R , which consists of experienced workers ( R E ) and new workers ( R N ), such that R = R E R N . Each worker r R is a multi-skilled worker with heterogeneous skill efficiencies. The efficiency of worker r in skill s is denoted by z r s ( t )   and it evolves over time due to the effects of learning and forgetting, but this only applies to newcomers ( r R N ) . For experienced workers, skill efficiencies remain stable over time due to the plateau effect, as their skills are consolidated and retained through frequent task engagement [3]. At time t = 0 , the initial skill efficiency z r s ( 0 ) is provided. Let x i r { 0 , 1 } denote a binary decision variable indicating whether worker r is assigned to task i and y i s { 0 , 1 } representing if task i requires skill s . The average efficiency ω i of workers for task i , with respect to the required skill s , is calculated as follows:
ω i = r R s S x i r y i s z ( t ) r s r R x i r
The duration of a task is influenced not only by uncertain stochastic factors but also by the efficiency of the assigned personnel. In practice, it is commonly observed that workers with higher efficiencies complete tasks in shorter times, while those with lower efficiencies require more time to finish the same tasks. Some recent studies have begun to consider the impact of skill efficiency on task duration in modeling efforts [11,33]. Inspired by Yu et. al. [11], we calculate the adjusted task duration d ~ i a based on the average efficiency of the assigned workers, as follows:
d ~ i a = d ~ i ω i
where the ceiling function ⌈⋅⌉ ensures the duration is rounded up to the next higher integer.
As mentioned above, the skill efficiency of newcomers evolves over time. We introduce an efficiency increment z r s t to quantify the change in the current skill efficiency z r s t of worker r in skill s at time t and its previous value z r s t 1 . The value of this increment draws on the concept of learning–forgetting effects, where workers’ performance improves through practice but deteriorates when not reinforced [15]. Given that z r s t represents an efficiency increment, it is constrained to not exceed the remaining gap to the maximum efficiency. The model is formulated as follows:
z r s t = z r s t 1 + z r s t
φ r s = d ~ i a λ · ( d l + 1 ) η
z r s t = m i n   ( ( 1 e ) φ r s ,   z m a x z r s t 1 )
where we capture the dual effects of learning and forgetting through an increment factor φ r s , which incorporates the active time d ~ i a   that worker r spent on a previous task involving skill s , and the idle time d l since worker r last used skill s . The learning factor λ and forgetting factor η are derived from the learning percentage l and forgetting percentage f as λ = l n   ( l ) / l n 2 and η = l n   ( 1 f ) / l n 2 , respectively [19].
Figure 1 illustrates the relationship between skill efficiency and active and idle times under an illustrative scenario where z m a x = 2 , l = 0.9 ,   a n d   f = 0.1 , similar to parameter values reported in [19]. As shown in the surface plot, the steepest increase in skill efficiency occurs when the active time is significant and the idle time is minimal.
All notation used is summarized in Table 2.

3.2. Problem Formulation

The objective function and constraints are expressed as follows:
m i n   E t e ~ I ( u )
m a x r R N s S ( z r s T z r s 0 )
The objective function (6) minimizes the expected makespan of the project, defined as the expected end time of the final task under the execution sequence y . This expected time is denoted by T . The objective function (7) maximizes the skill efficiency increment for newcomers by summing the differences between their final and initial skill efficiencies across all skills.
  • s . t .
t s ~ i max i D i   t e ~ i ,       i I + ,   D i ,   i f D i = , t e ~ i = 0
t e ~ i = t s ~ i + d ~ i a         i I +
d ~ i a = d ~ i · r R x i r r R s S x i r y i s z ( t ) r s
x r i + x r j 1   i f   t s ~ i , t e ~ i t s ~ j , t e ~ j         r R , i , j I + ,   i j
r R E x i r 1       i I +  
r R N x i r 1       i I +
i I + x i r 1       r R
z r s T = z r s 0 + t = 1 T z r s t
z r s t = m i n   ( ( 1 e ) φ r s ,   z m a x z r s t 1 )
φ r s = d ~ i a λ · ( d l + 1 ) η
p o s i < p o s i ,       i I , i D i
x i r 0,1         i I + ,   r R
Constraint (8) enforces precedence relationships by ensuring that each task starts only after all its predecessors have been completed. Constraint (9) implies that each task continues without interruption once it has started. Constraint (10) defines the actual duration by incorporating both task-level uncertainty and the influence of assigned workers’ efficiencies. Constraint (11) ensures that a worker can only work on one task at a time. Constraint (12) requires that at least one experienced worker be assigned to each task to ensure reliable execution and facilitate effective mentorship. Constraint (13) specifies that at most one newcomer may be assigned per task to allow for focused guidance and supervision. Constraint (14) guarantees that each worker is assigned to at least one task, preventing idle workers from being included in the schedule and promoting full resource utilization. Constraint (15) states that the skill efficiency increment for newcomers is modeled as a cumulative process, where each time-step increment is determined by the remaining efficiency gap, the active time, and the idle time. Finally, Constraints (18) and (19) define the domains of the decision variables. Constraint (18) ensures that the execution sequence y satisfies the precedence relationships. To this end, the position of each task i I in the sequence is denoted by p o s i , where p o s i = m if a m = i . Constraint (19) defines the binary nature of assignment decisions.

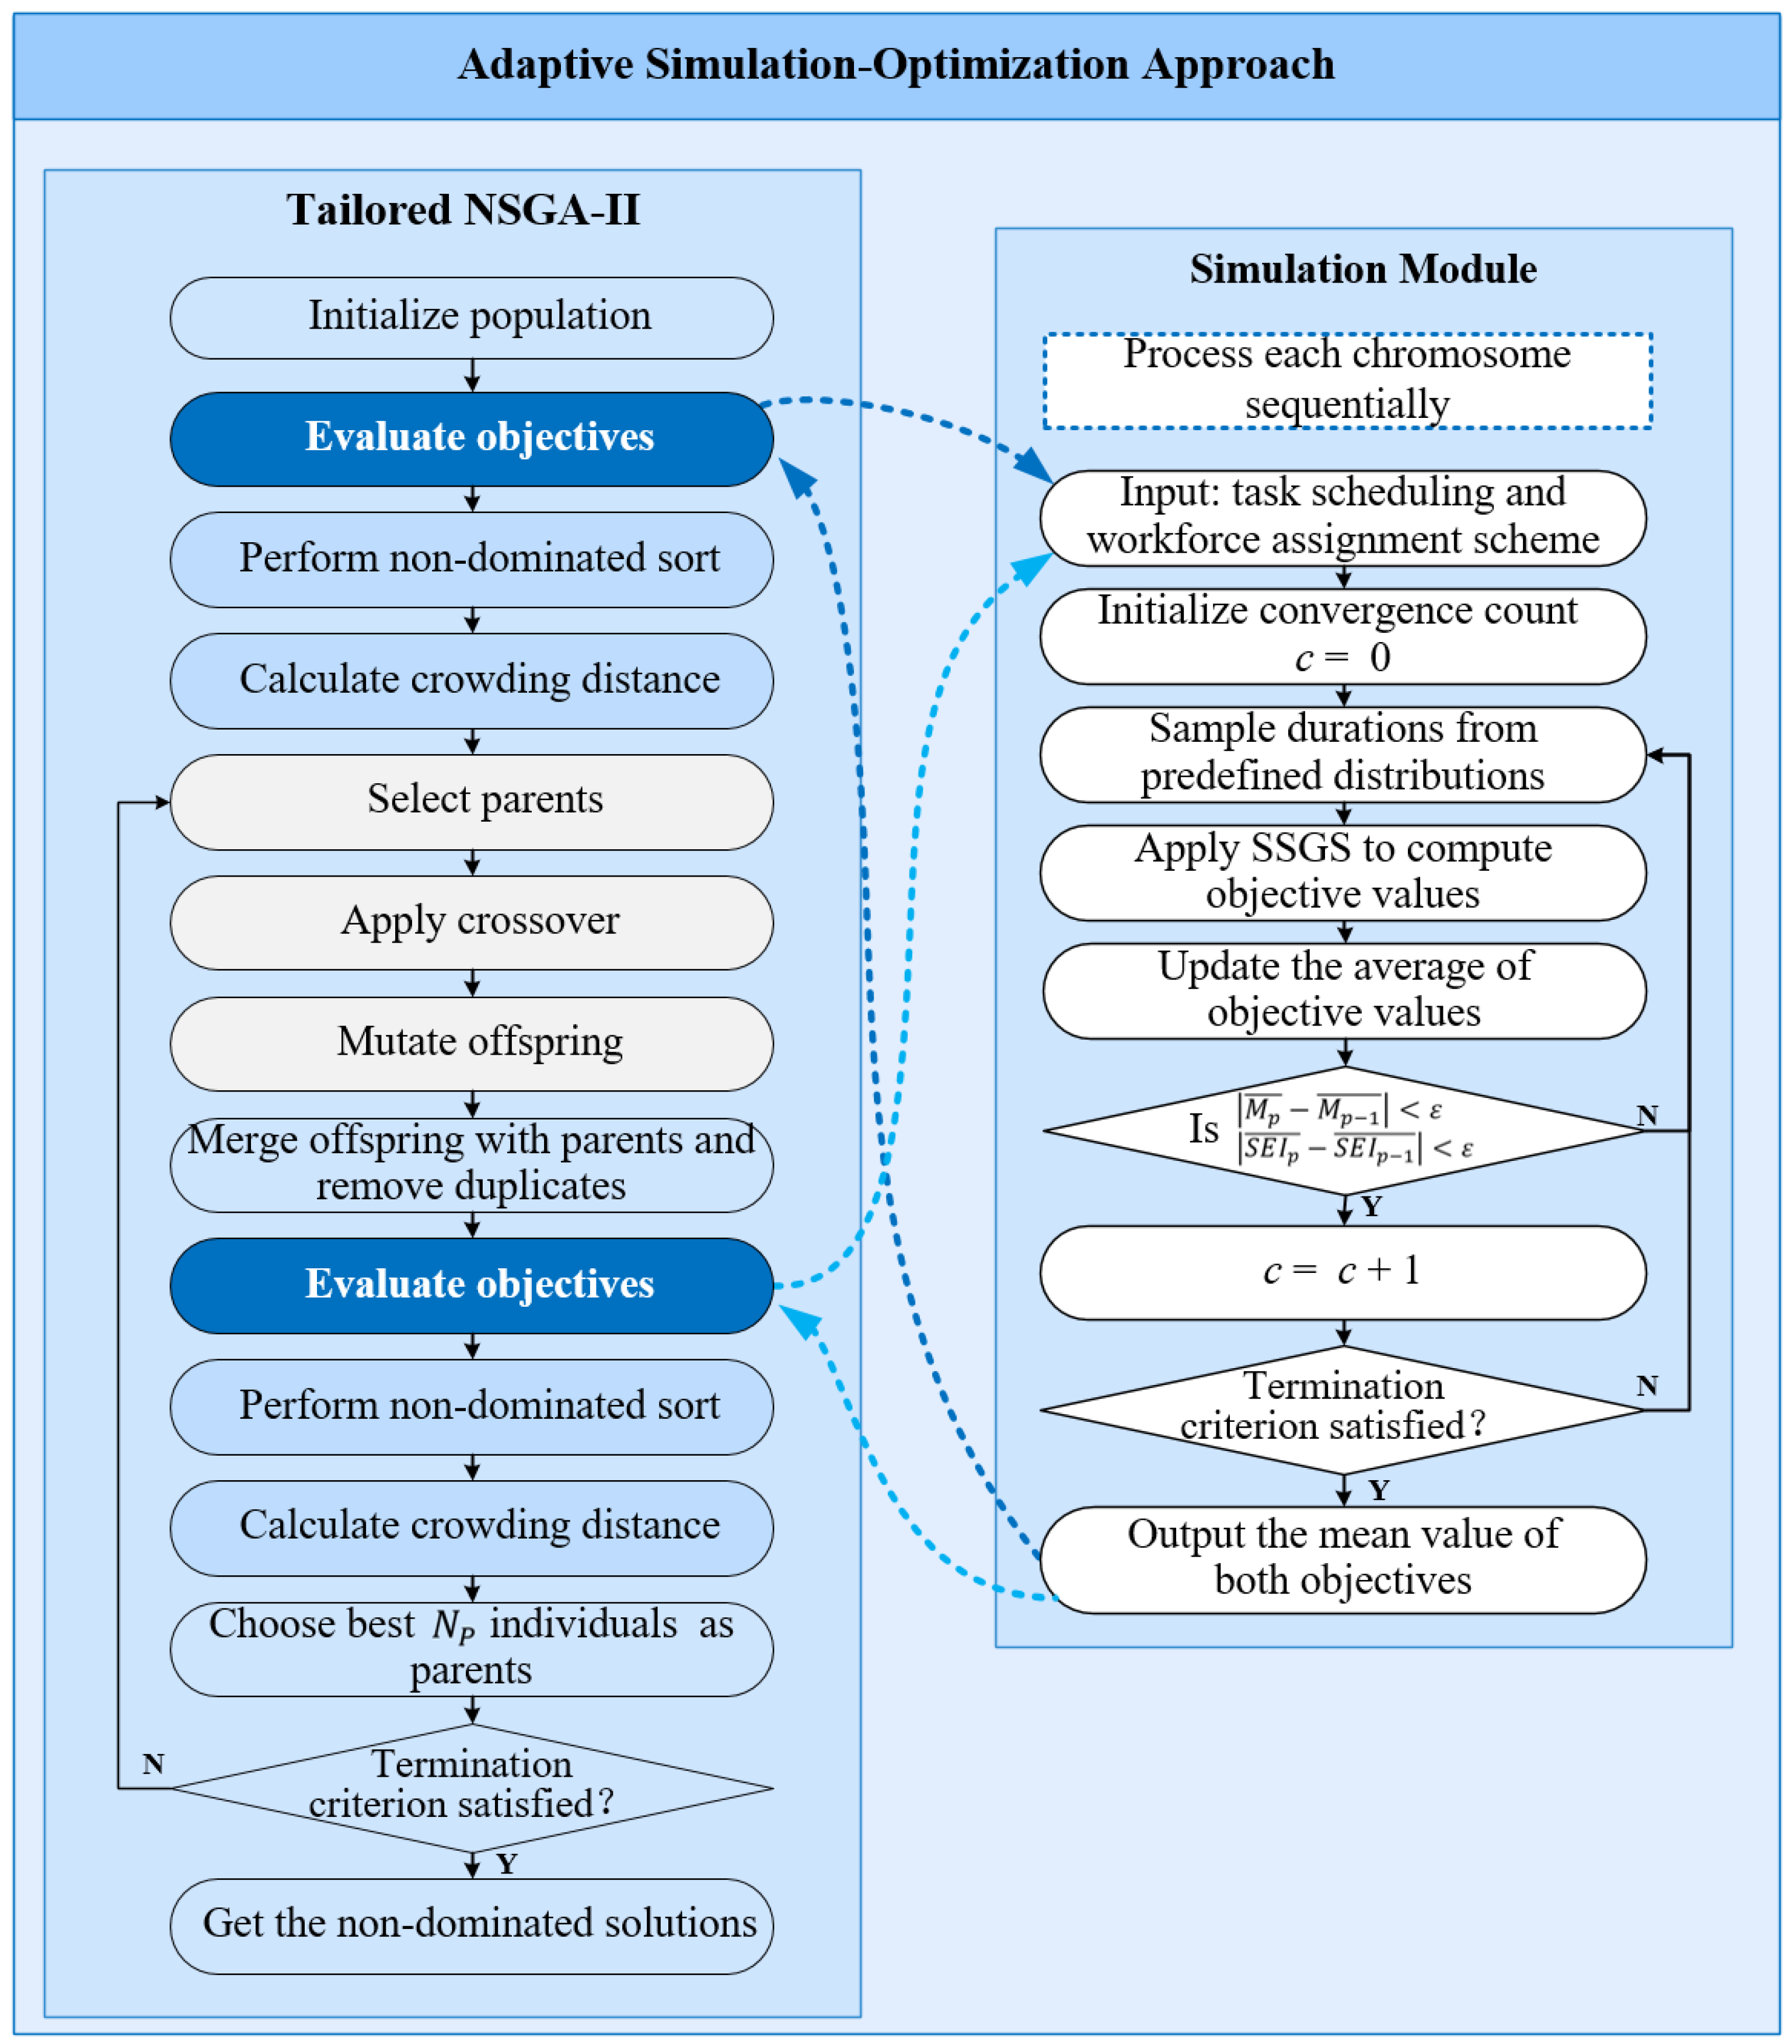
4. Proposed Approach

We propose an adaptive simulation–optimization approach (ASOA) to address two key challenges in MSPSP-NCU: the instability of expected makespan caused by uncertain durations and the high dimensionality resulting from the joint decision space of scheduling and staffing. This approach integrates a simulation module with a tailored NSGA-II to efficiently explore a wide solution space and identify Pareto-optimal solutions. As illustrated in Figure 2, the simulation module on the right employs Monte Carlo sampling to generate stable estimates of makespan and corresponding skill efficiency increment. These outcomes serve as feedback for evaluating candidate solutions. A tailored NSGA-II iteratively refines the solution set through an adaptive evolutionary mechanism. This mechanism dynamically adjusts the probabilities of genetic operators based on the diversity and distribution of current solutions. As a result, the algorithm more effectively converges toward a well-distributed Pareto front. Section 4.1 and Section 4.2 elaborate on the tailored NSGA-II and simulation module, respectively. The notation for all variables and parameters used in this section is provided in Table 3.

4.1. Tailored Non-Dominated Sorting Genetic Algorithm II

The NSGA-II, proposed by Deb et al., is a multi-objective optimization algorithm grounded in evolutionary principles of natural selection [34]. It integrates a fast non-dominated sorting mechanism and an elitist selection strategy to efficiently approximate Pareto-optimal solutions for problems involving multiple objectives. The algorithm begins by randomly initializing a population P 0 consisting of N p individuals and evaluating the objective function of each individual. Subsequently, individuals are hierarchically classified into multiple fronts ( F 1 , F 2 , ) through fast non-dominated sorting, where F 1 represents the Pareto-optimal front [34]. Within the same front, solutions are further ranked using the crowding distance metric, which estimates the density of surrounding solutions by measuring the normalized sum of the distance between neighboring individuals along each objective axis. This helps maintain a well-distributed Pareto front and preserves population diversity [35]. Boundary solutions are assigned infinite crowding distances. The population evolves in successive generations by three genetic operators: selection operator for picking superior solutions as parents, crossover operator, and mutation operator for generating offspring O g by recombining and perturbing parental genes. The parent and offspring populations are merged into a combined population C g of size 2 N p . Duplicate individuals are removed, and the resulting set undergoes another round of non-dominated sorting and crowding distance calculation. A new population P g + 1 is formed by selecting individuals from the sorted fronts of C g , starting with the highest-ranked front F 1 and continuing until the desired population size N P is reached. The algorithm terminates after reaching a predefined maximum number of generations G . The pseudocode of the tailored NSGA-II is shown in Algorithm 1.
Algorithm 1: Tailored NSGA-II
Data:  N p ,   G ,   p C b ,   p M b ,   α ,   β ,   N A , N I ,   N C , ε , N , R E ,   R N , S , d ~ i ,   μ i ,   σ ,   y i s , z r s 0 ,   l , f
Result:  Pareto   front   F *
1  Generate initial population P 0 ;
2   Calculate   fitness   f 1 x ,   f 2 ( x )   for   all   x P 0 using Algorithm 2;
3   Perform   fast   non - dominated   sort   on   P 0   to   obtain   fronts   { F 1 , F 2 , } ;
4   Sort   solutions   within   each   front   F k based on crowding distance;
5   P 1 P 0 ;
6  for  g 1   t o   G   d o
7           Select   parent   solutions   from   P g via binary tournament selection;
8           Adjust   p C b   and   p M b based on front size and crowding distance;
9           Generate   offspring   O g   through   crossover   with   probability   p C ( g ) ;
10          Apply   mutation   to   offspring   with   probability   p M ( g ) ;
11          Merge   parent   and   offspring :   C g P g O g ;
12          Remove   duplicate   solutions   in   C g ;
13          Calculate   fitness   f 1 x ,   f 2 ( x )   for   all   x C g using Algorithm 2;
14          Perform   fast   non - dominated   sort   on   C g   to   obtain   fronts   { F 1 , F 2 , } ;
15          Sort   solutions   within   each   F k based on crowding distance;
16          Truncate   to   the   best   N P   solutions   from   C g   as   new   parents   P g + 1 ;
17  end
18   Extract   F * F 1   from   P G .
In the following subsection, we provide a detailed description of the solution encoding, genetic operators, and adaptive probability.

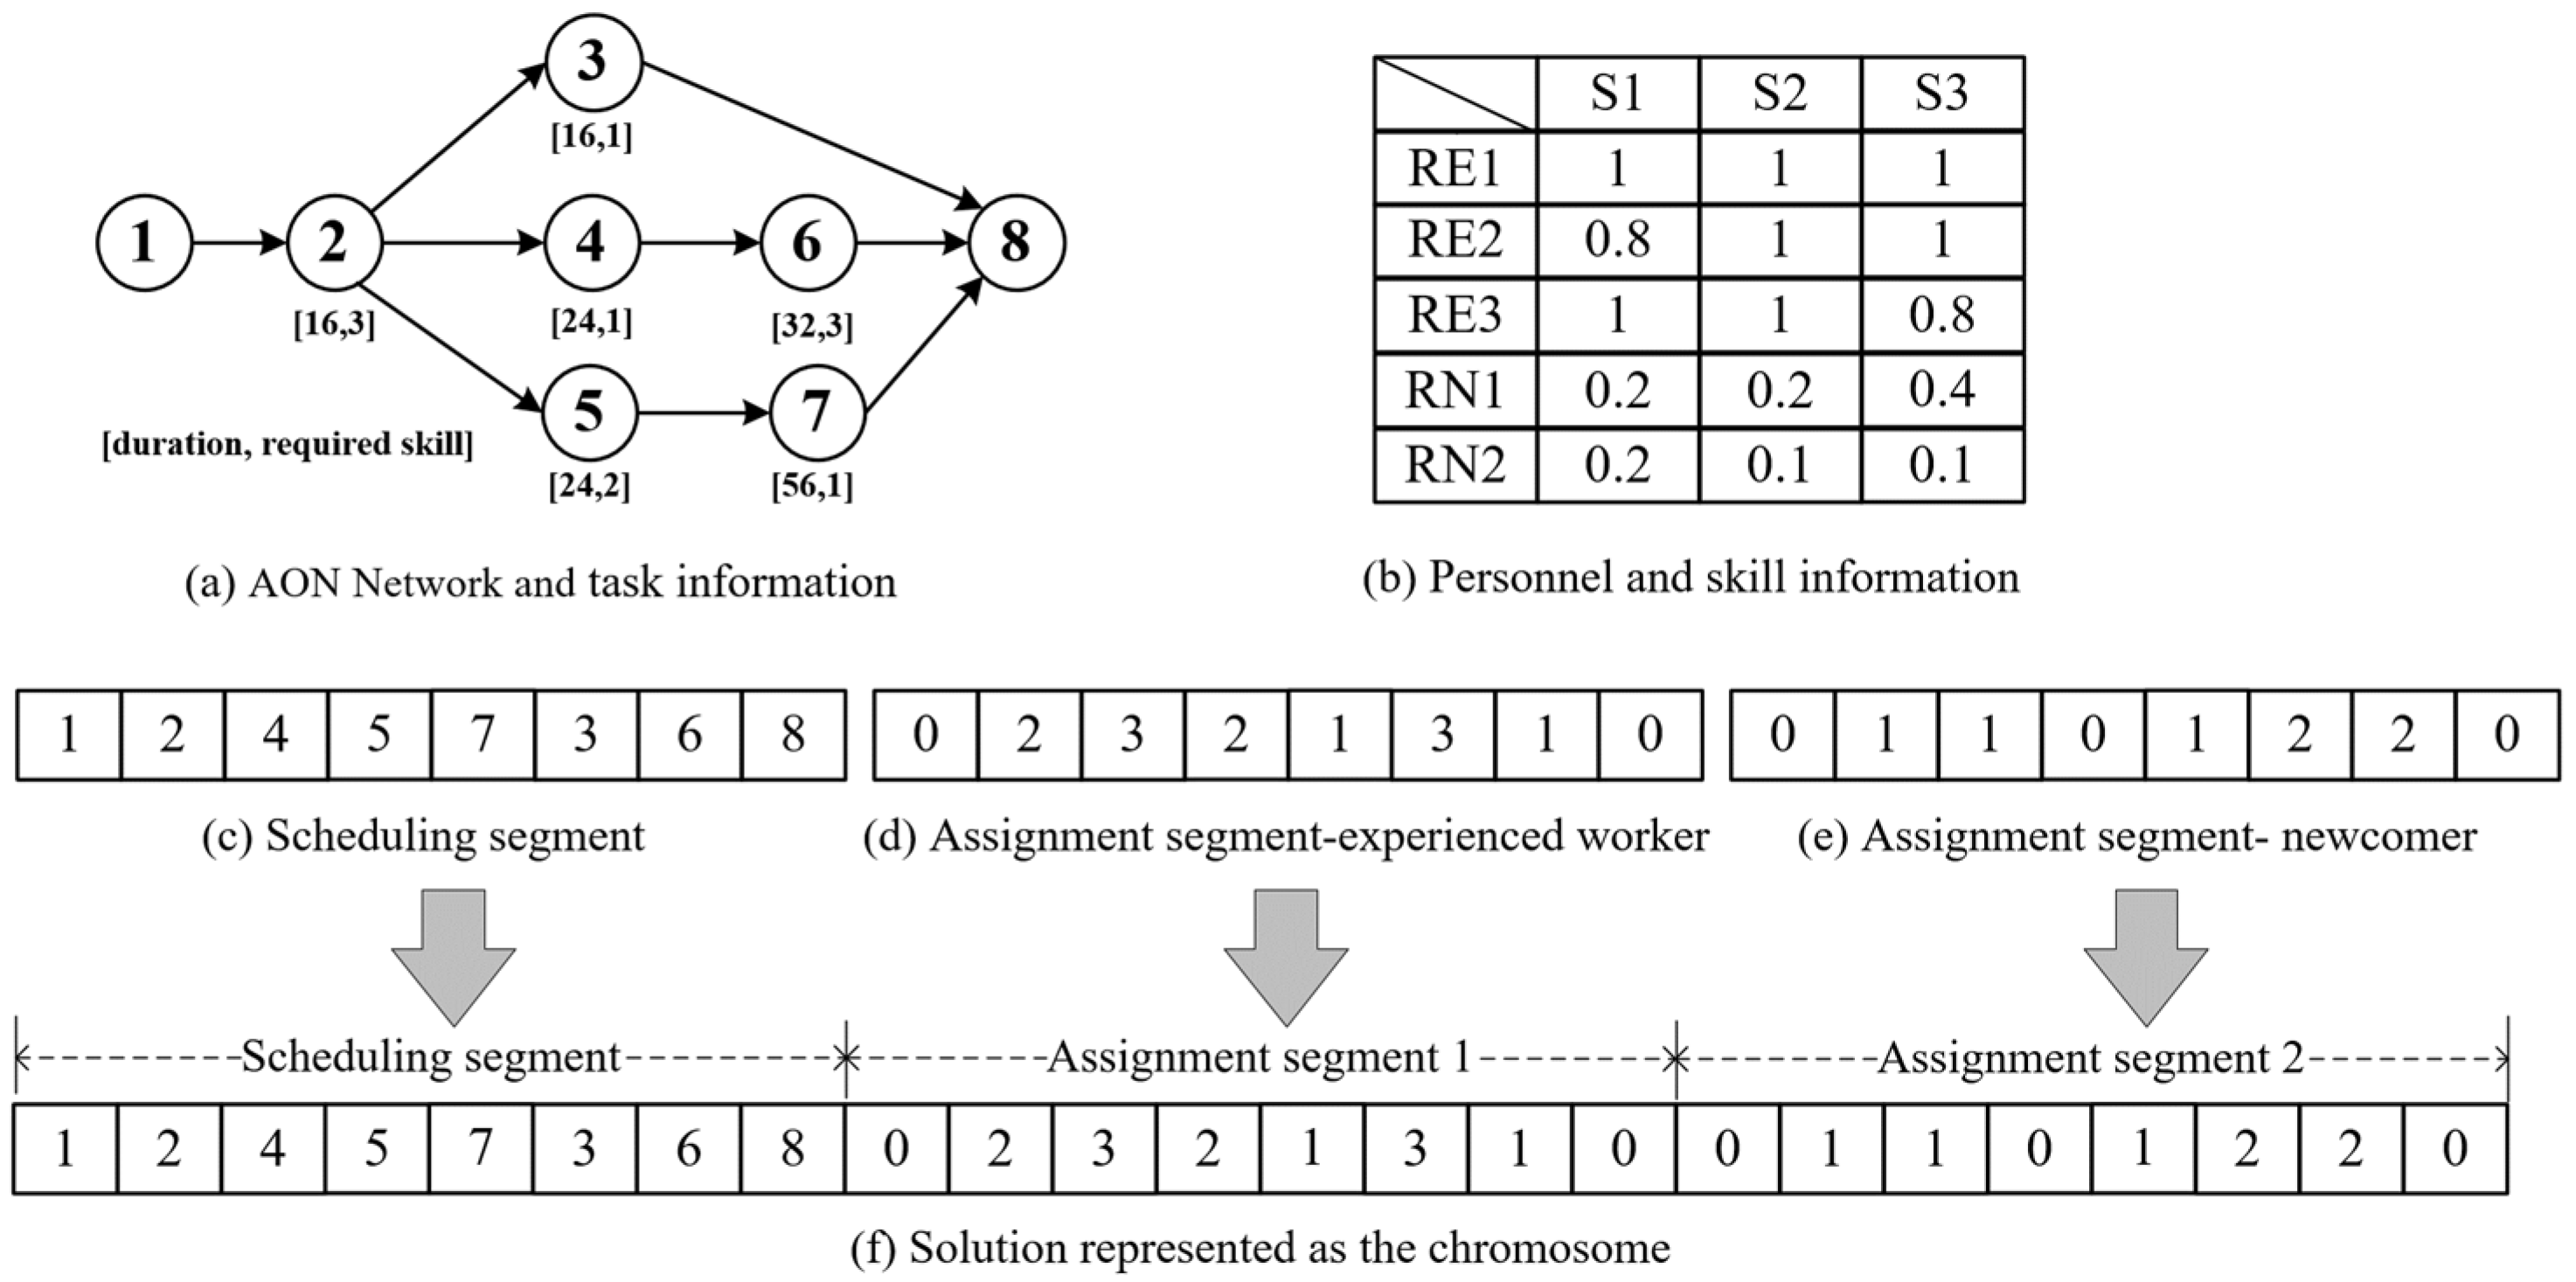
4.1.1. Solution Coding

A solution is represented as a chromosome in string form, comprising a scheduling segment and two assignment segments. The number of genes in the segment is the same as the number of project tasks, with genes encoded as integers. The scheduling segment describes the task execution sequence, ensuring that all precedence relationships are met and that each task appears only once. The task segments indicate the persons responsible for each task, with the first segment designating the experienced worker and the other segment identifying the newcomer involved in the task. An example of solution coding is shown in Figure 3.
The example illustrates a small project consisting of eight tasks. It is assumed to be executed by three experienced workers ( R E 1 ,   R E 2 ,   a n d   R E 3 ) with two newcomers ( R N 1   a n d   R N 2 ) . The start and end tasks are dummy tasks that do not require resources, so their corresponding positions in the assignment segments are encoded with zero. As depicted in Figure 3c, Task 2 is scheduled first, followed by Task 4, while Task 3 is arranged after Task 7. Figure 3d,e further illustrate that Task 2 is executed cooperatively by experienced worker RE2 alongside newcomer RN1, whereas Task 4 is undertaken solely by RE2. This multi-segment encoding structure clearly separates task scheduling from the assignment of different personnel types, enabling localized modifications without disrupting other segments.

4.1.2. Initial Population and Evaluation

The initial population comprises a predefined number of candidate solutions. In this study, solutions are randomly generated, and duplicates are removed to maintain initial population diversity and promote broad search in the early stages.
The evaluation function plays a central role in guiding the evolution process of NSGA-II by assessing the quality of each solution based on two objectives: minimizing the expected makespan and maximizing the increment in skill efficiency. Since task durations are uncertain, a simulation-based evaluation is adopted to obtain stable estimations of both objectives. The simulation process accounts for stochastic task durations and worker skill dynamics and will be elaborated on in Section 4.2.

4.1.3. Genetic Operator

The NSGA-II algorithm improves the population iteratively using three genetic operators: selection, crossover, and mutation.
The binary tournament selection method is employed to identify relatively superior chromosomes as parents [36]. Specifically, two individuals are randomly selected from the population. The selection is primarily governed by non-dominated sorting, where individuals from a superior Pareto front are preferred. If both individuals belong to the same front, the one with the larger crowding distance is chosen to maintain solution diversity. This pairwise tournament is repeated until the offspring population reaches the same size as the parent population. Notably, this method promotes diversity by prioritizing strong solutions without entirely excluding weaker ones.
The crossover operator generates offspring by integrating genetic information from parent chromosomes, allowing for the combination of favorable traits from both parents [37]. The Partially Mapped Crossover (PMX) is used in the scheduling segment to ensure that each task in the series is unique. PMX prevents duplicate tasks by imposing position-based mapping, which ensures segment legality. In contrast, the assignment segment is unrestricted and allows for a simple two-point crossover. This method exchanges gene blocks at two randomly chosen sites without requiring complicated validity checks. By customizing crossover operators to accommodate segment-specific constraints, lawful offspring are generated while computational overhead is reduced.
The mutation operator introduces a stochastic perturbation to offspring chromosomes, exploring new solution spaces and preventing premature convergence to local optima [38]. The swap mutation is applied to each segment of a chromosome with a low probability. Specifically, two genes are randomly selected within the same segment and exchanged. For the scheduling segment, an additional feasibility check is performed after the swap to ensure that precedence constraints are satisfied. The total sum of genes in each chromosome remains unchanged.

4.1.4. Adaptive Mechanism

The proposed adaptive mechanism employs real-time population state analysis to dynamically regulate crossover and mutation probabilities, achieving an optimal balance between global exploration and convergence efficiency. This self-adjusting mechanism operates through two complementary metrics: the crowding factor ( C f ) and the F1 ratio ( R F 1 ) . The crowding factor, calculated as the ratio of the average crowding distance to the maximum crowding distance (both computed after excluding boundary solutions with infinite distances), serves as a normalized indicator of solution distribution uniformity. Formally defined in Equation (20).
C f = A v g . C r o w d i n g   D i s t a n c e M a x . C r o w d i n g   D i s t a n c e
C f approaches one when solutions exhibit uniform spacing along the Pareto front, while values nearing zero signify clustered distributions. Complementing this spatial assessment, the R F 1 metric represents the proportion of solutions in the highest non-dominated rank ( F 1 ) relative to the total population size and is formulated in Equation (21).
R F 1 = N u m b e r   o f   F 1   S o l u t i o n s P o p o l a t i o n   S i z e
Building upon these two metrics, the crossover probability adapts through Equation (22), where the baseline probability p C b increases proportionally to ( 1 C f ) scaled by parameter α .
p C g = p C b + α × 1 C f
p M g = p M b + β × 1 R F 1 × C f
When both C f and R F 1 approach one—indicating a mature, well-distributed Pareto front—the mechanism strategically suppresses mutation probability to consolidate high-quality solutions. Conversely, the mutation probability is adaptively increased if either the solution quality ( R F 1 ) or the population spread ( C f ) is unsatisfactory. This allows the algorithm to detect early signs of stagnation in convergence or a decline in population diversity, enabling timely adjustments to maintain search effectiveness.
By tracking the state of the population in real time, the proposed approach adaptively increases exploration in the early stages and speeds up convergence as the population nears Pareto optimality. The dynamic adjusting mechanism overcomes the limitations of static probability and enhances performance in complex multi-objective scenarios.

4.2. Simulation Module

The simulation module assesses the fitness of a candidate solution by generating stable estimates of project makespan and skill efficiency increments through Monte Carlo sampling. The input solution x   provides a task sequence and a personnel assignment plan. Task durations are modeled as lognormally distributed random variables to reflect real-world uncertainty. In each simulation iteration, durations are independently sampled from the distribution and adjusted according to the real-time skill efficiencies of the assigned workers.
A feasible project schedule is generated using the Serial Schedule Generation Scheme (SSGS), a commonly used method in resource-constrained project scheduling problems [39]. Specifically, SSGS sequentially schedules tasks based on a predefined order. For each task, the earliest feasible start time is determined by checking the following two conditions: (i) all predecessor tasks have been completed, and (ii) the required personnel are fully available throughout the task’s duration. Once a task is scheduled, it is added to the project timeline, and resource availability is updated accordingly. In our study, we consider skill development, whereby the skill efficiency of assigned personnel is dynamically updated as tasks progress. This procedure continues until all tasks have been scheduled, resulting in a solution that satisfies all precedence relationships and resource constraints.
The termination criteria for the simulation are as follows: (i) the absolute difference between the average objective values of the first p -th and ( p 1 )-th generations is smaller than a predefined threshold ( ε ) for consecutive N C generations, and the number of samples exceeds a minimum number N I ; or (ii) a maximum number N A is reached to prevent infinite loops. The pseudocode for the simulation module is presented in Algorithm 2.
Algorithm 2: Simulation Module
Data:  x ,   N A ,   N I ,   N C ,   ε ,   N ,   R E ,   R N ,   S ,   d ~ i ,   μ i ,   σ ,   y i s ,   z r s 0 ,   l ,   f
Result:  f 1 x ,   f 2 ( x )
1  Initialize   p 0 ,   c 0 ,   M h 0 ,   S E I h 0 ;
2 while true do
3          p p + 1 ;
4         for   e a c h   t a s k   i  do
5                d ~ i l o g n r n d μ i , σ ;
6         end
7          Extract   scheduling   and   assignment   from   x ;
8          Calculate   actual   durations   d ~ i a d ~ i / ω i ;
9         Schedule via SSGS while enforcing precedence and resource constraints;
10        Update   efficiency   z r s t when task is scheduled;
11        M p max   t i e ,   M h M h M p ,   S E I h S E I h S E I p ,   M p ¯ m e a n M h , S E I p ¯ m e a n S E I h ;
12       if  M p ¯ M p 1 ¯ < ε   and   S E I p ¯ S E I p 1 ¯ < ε  then
13             c c + 1 ;
14       end
15       if  ( c > N c     and   p > N I )   or     p > N A  then
16            break;
17       end
18 end
19   f 1 x M p ¯ ,   f 2 x S E I p ¯ .

5. Case Study

5.1. Case Description

The D7N2 project is an aerospace equipment development project undertaken by X Corporation at the request of its client. Following a work breakdown structure, this project is divided into 80 tasks. The network is visualized in Figure 4, which illustrates the precedence relationships. The first and last tasks serve as dummy start and end nodes, respectively. Task durations follow a lognormal distribution, with the mean in hours provided in Table 4 and the standard deviation ( σ ) set at 0.1 based on historical data. The project involves 12 skill types, with their descriptions and associated tasks detailed in Table 5.
The project is executed by a dedicated team consisting of ten experienced multi-skilled workers and four newcomers. The skill efficiencies of workers are presented in Table 6. Experienced workers and skill efficiencies are assessed by the project manager based on their past project experience and performance. In contrast, the skill efficiencies of newcomers are evaluated based on their resumes. It is assumed that all multi-skilled workers exhibit the same learning and forgetting percentage, set at 0.9 and 0.1, respectively, as individual differences are minimal and can be considered negligible [19]. Other non-human resources in the project, such as computers and other equipment, are sufficient.

5.2. Environment and Parameter

The proposed approach for the case is performed on an Intel Core i5 processor with 16.00 GB of RAM and a 3.30 GHz CPU. All procedures are coded and solved using MATLAB R2020a. Given the numerous parameters involved, we first conduct a calibration process to ensure reliable performance. For simulation-related parameters, stable and efficient values are obtained through multiple trials, as their effects are straightforward to observe and assess. The final settings are as follows: N C = 20 , ε = 0.1 ,     N A = 2000 ,   N I = 100 . For the optimization-related parameters, which are more sensitive and have a complex influence on algorithmic performance, the Taguchi method is employed to minimize their impact on optimization efficiency. Table 7 presents the experimental design for parameter settings, L 25 with the orthogonal array used as the experimental configuration.
In multi-objective optimization parameter analysis, a single-objective value cannot directly serve as a response metric for evaluating the quality of a parameter configuration. The inverted generational distance (IGD) is widely used to evaluate multi-objective algorithms by considering both convergence and diversity [40]. IGD is adopted in this paper as the response value for each experiment, and its calculation is given as follows:
I G D ( F 1 , F 1 * ) = 1 F 1 * n F 1 d ( n , F 1 * )
where F 1 * represents the true Pareto front, F 1 denotes the Pareto front obtained from a given experiment, and d ( n , F 1 * ) is the minimum Euclidean distance between n and the elements in F 1 * . Since the true Pareto front is often unknown, an approximate front is constructed by aggregating all solutions obtained across multiple experimental runs and applying a non-dominated sorting procedure to extract the globally non-dominated solutions. Since objective values vary significantly in scale, all solutions are first normalized using min–max normalization before distance computation to ensure a fair comparison across different objectives. A lower IGD value indicates that the obtained solutions are closer to the true Pareto front, reflecting a more favorable parameter configuration.
Each experiment is repeated five times, and the average IGD serves as the response value for each experiment in the Taguchi method. The signal-to-noise (S/N) ratios for each parameter are calculated using Minitab (version 21.2.0). Table 8 and Figure 5 illustrate the S/N ratio response tables and main effects plots, respectively.
Table 8 reveals that the number of generations ( N G ) is the most influential parameter affecting project makespan, followed by the population size ( N P ). The effect of the baseline mutation probability ( p M b ) is comparatively smaller. The optimal parameter levels are identified based on the highest average S/N ratio. According to Figure 5, the optimal parameter levels are marked with an asterisk in Table 7.

5.3. Results and Discussion

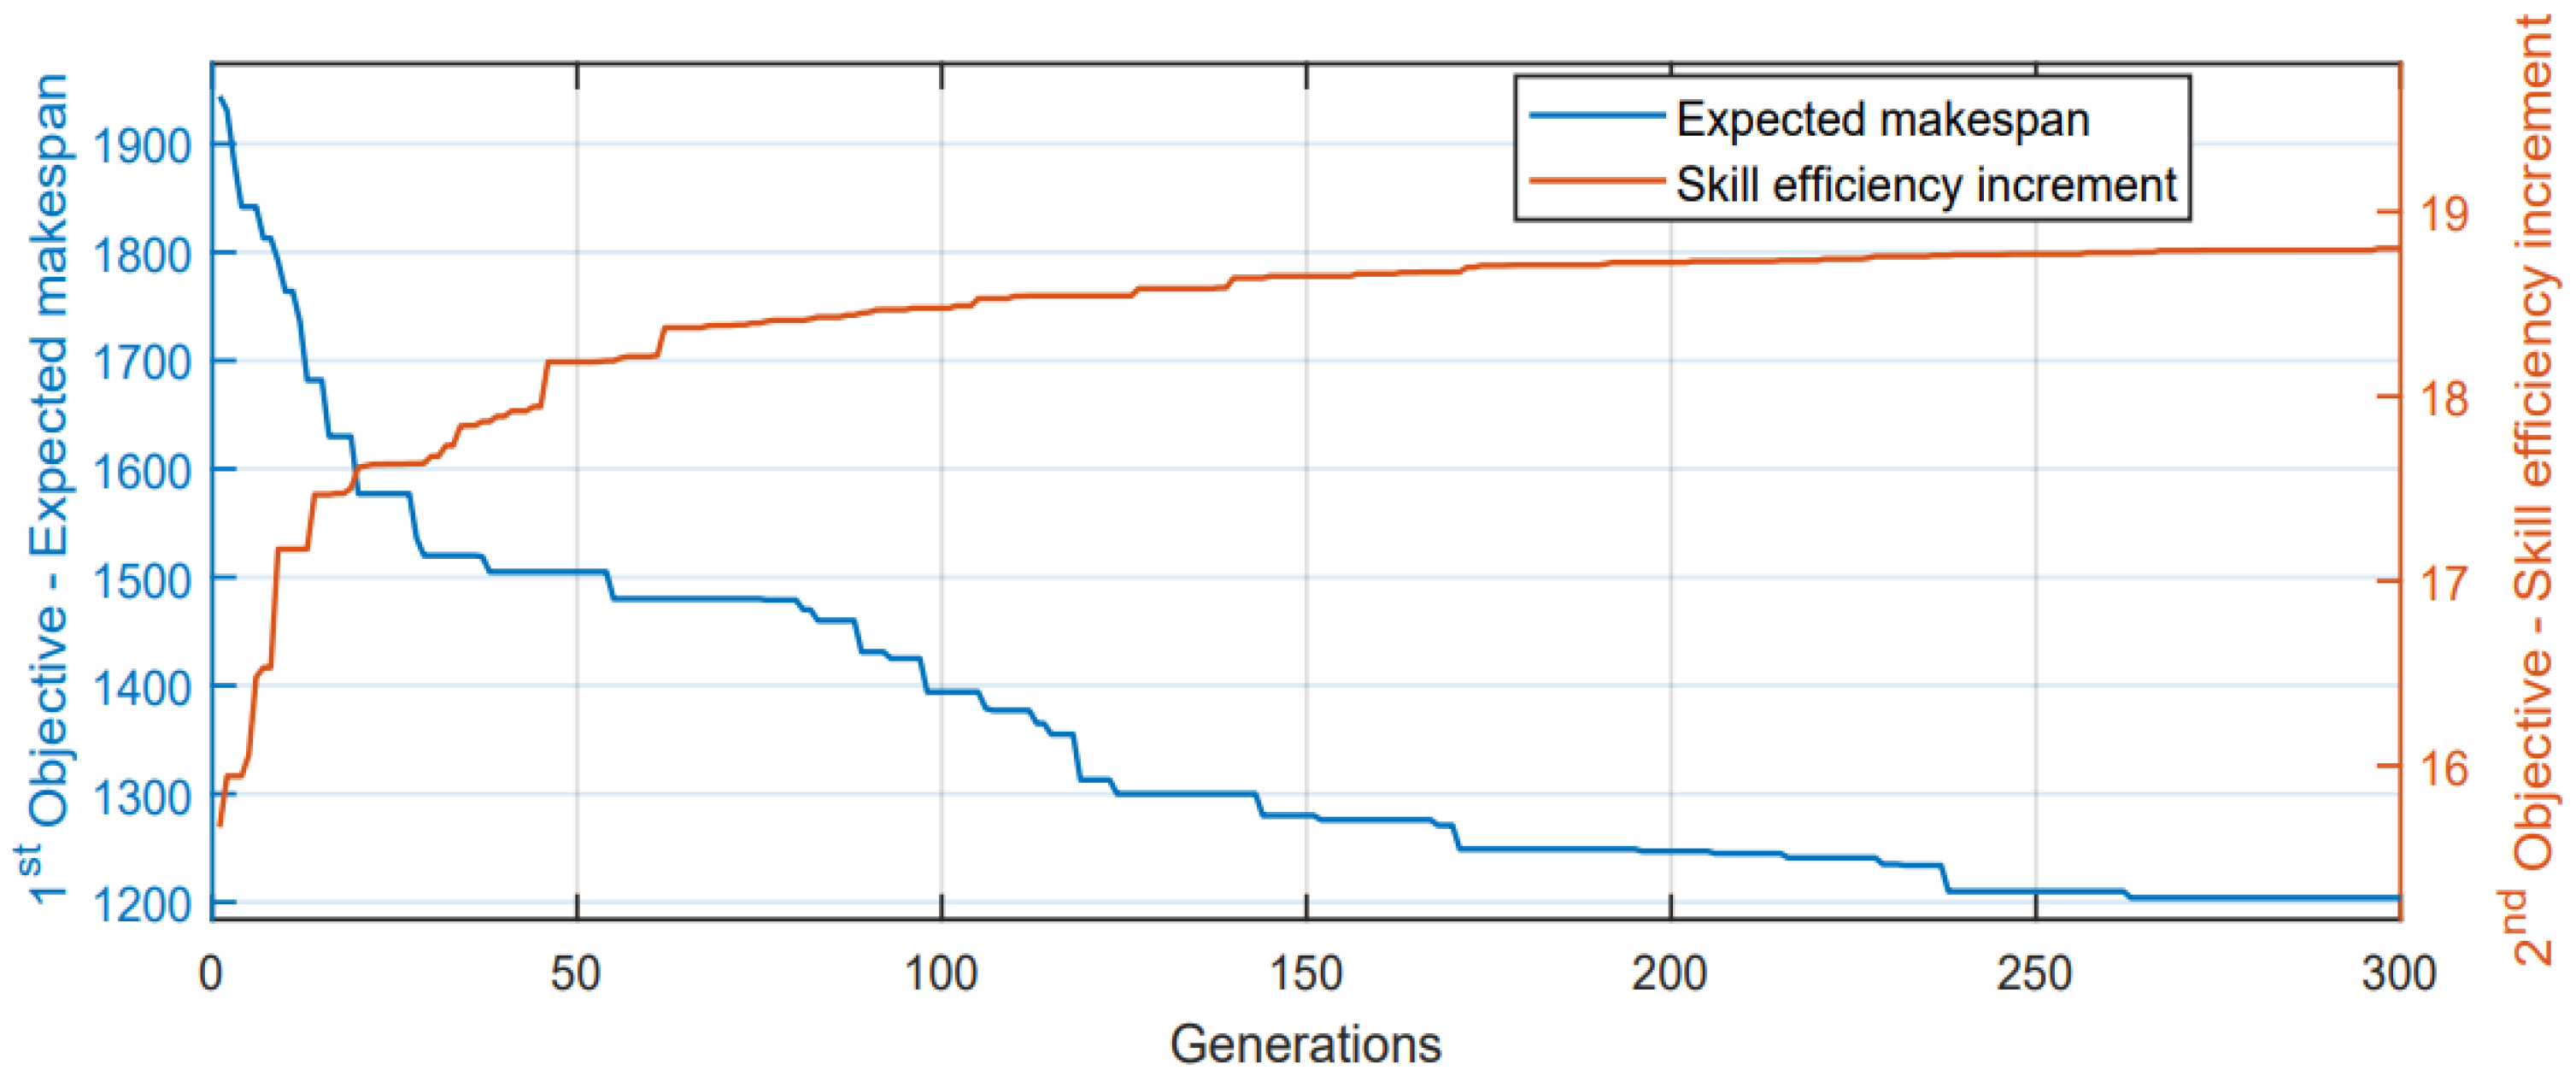
5.3.1. Pareto Solution and Front

Figure 6 presents the Pareto front of the best-performing experiment. A total of 218 distinct solutions are identified, among which 83 exhibited differences in both objective values. The color gradient of each point indicates the count of solutions that share identical objective values but correspond to different decisions. As shown in Figure 6, involving newcomers in tasks alongside experienced workers helps improve their skills but also prolongs the expected makespan. This demonstrates the conflict between workforce cultivation and project efficiency, highlighting the need for balanced decision-making in practice. The left end of the boundary corresponds to the shortest expected makespan of 1204 and a skill efficiency increment of 13.55, while the right end achieves the highest skill efficiency increment of 18.80, accompanied by an extension of the completion time by 1009 compared to the shortest duration.

5.3.2. Analysis and Validation

(1)
Effectiveness of the adaptive simulation–optimization approach
To verify the effectiveness of the proposed approach, we analyzed the performance of the solutions throughout the optimization process. Figure 7 demonstrates the progression of the best values for two objectives across generations. The expected makespan objective shows a decreasing trend, while the skill efficiency increment objective increases, highlighting the approach’s ability to improve solutions over time while balancing multiple objectives.
(2)
Stability of the adaptive simulation–optimization approach
While the proposed approach has demonstrated promising results in the case study with 80 tasks, its stability across projects of different scales remains to be verified. To address this, we conduct additional experiments using two supplementary project scales: 40 and 120 tasks. The objective is to evaluate whether the approach consistently produces reliable and diverse Pareto-optimal solutions when applied to projects of varying complexity.
The 40-task project is a representative subset extracted from the original 80-task project, retaining part of the task precedence while reducing the task volume to simulate a simple scenario. In contrast, the 120-task project is derived by duplicating and diversifying certain tasks from the original project, creating a complex instance. The number of workers is adjusted proportionally to the task volume in each case. Table 9 summarizes the characteristics of the three projects.
The proposed approach is independently executed five times for both the 40-task and 120-task project instances. The performance is assessed in terms of the diversity and uniformity of the resulting Pareto-optimal solutions. Diversity is reflected in the number of non-dominated solutions, while uniformity is quantified using the spacing metric (SP) proposed by [41]. A lower SP value indicates a more evenly distributed set of solutions, while a higher value suggests clustering or uneven spacing. The formula for calculating the SP is as follows:
S P = 1 F 1 1 n F 1 ( d n d ¯ ) 2
where F 1 denotes the obtained Pareto front and F 1 is the number of non-dominated solutions. The term d n corresponds to the Euclidean distance between two consecutive non-dominated solutions, while d ¯ is the average of these distances. Since the two objectives have different scales, we apply min–max normalization before calculating spacing metric to eliminate the impact of scale differences.
The results show that the proposed approach maintains favorable performance across different project sizes. Specifically, for the small case (40-task project), an average of 206 Pareto-optimal solutions is obtained, with a diversity index ranging from 0.004 to 0.006. For the big case (120-task project), the average number of Pareto solutions decreased to 94, but the diversity index remained stable, ranging from 0.008 to 0.012. Even as the task volume increases, the approach continues to generate a sufficient number of non-dominated solutions to support decision-making. These results demonstrate that the proposed adaptive simulation–optimization approach maintains consistent performance across different task volumes, preserving both the diversity and uniformity of the Pareto-optimal solutions.

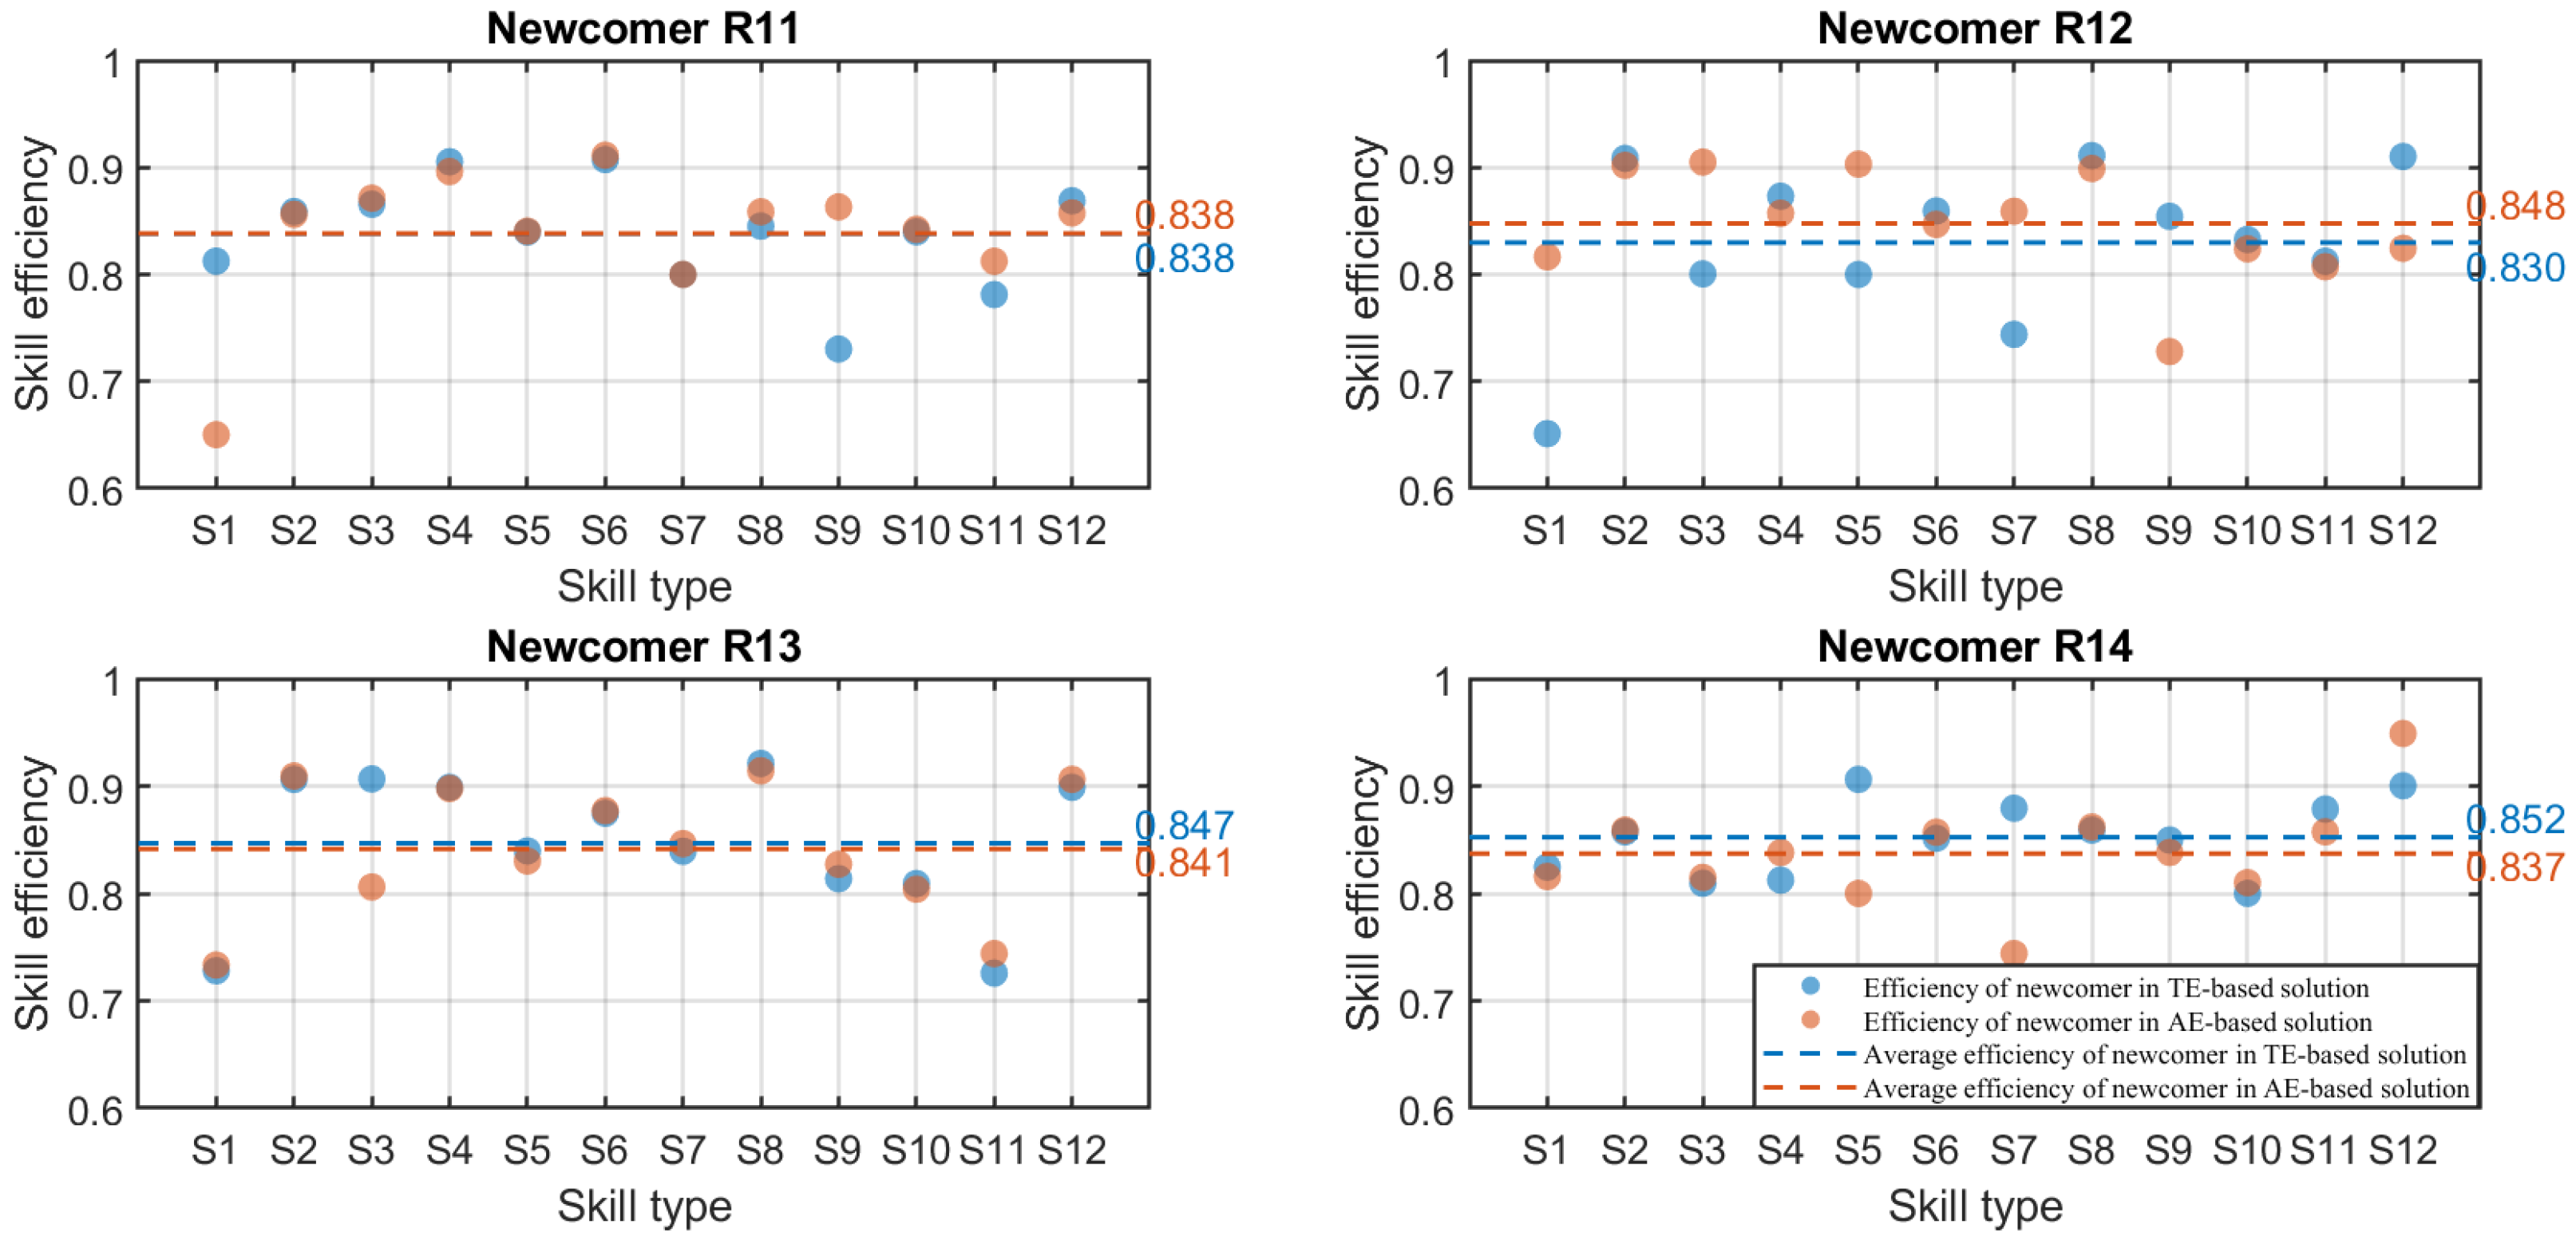
5.3.3. Personalized Solution Selection

Following the identification of Pareto-optimal solutions, the final choice is made from the solution set based on the manager’s preferences. Multi-criteria decision-making methods, such as the technique for order preference by similarity to an ideal solution (TOPSIS), are widely used for systematically evaluating trade-offs and will not be elaborated on in this paper. Instead, we propose four personalized selection rules—average efficiency (AE), skill peak (SP), fair growth (FG), and target priority (TP). These rules are designed to reflect the organization’s workforce development strategy and specific training objectives.
AE prioritizes solutions that maximize the minimum average efficiency across all newcomers. This is achieved by calculating the average efficiency for each worker and selecting the solution with the highest minimum value. Unlike total-efficiency (TE) rules, which prioritize maximizing total efficiency and may lead to imbalanced development, AE promotes balanced skill development and helps prevent the emergence of workers with significant weaknesses. A comparison of two solutions representing different rules is shown in Figure 8. Specifically, the minimum average efficiency among the four new members under the AE rule is 0.837, slightly higher than the corresponding value of 0.830 under the TE rule. It is noteworthy that while the AE rule ensures that all newcomers meet a basic level of competence, it does not guarantee that every individual excels across all skill sets. Some individuals may still have weaknesses in specific areas.
SP prioritizes solutions that maximize the efficiency of specific skills for newcomers, thereby promoting specialization. This rule aims to enhance individual proficiency in key areas. Figure 9 illustrates a Pareto-optimal solution in which each individual demonstrates distinctive strengths across specific skill types. Specifically, newcomer R11 shows significant proficiency in Skills 7 and 12, both exceeding 0.9, along with strong performance in Skills 3, 4, 5, and 6, each above 0.8. However, this improvement comes at the cost of significant shortcomings in Skills 1 and 2, both falling below 0.5. In contrast, newcomer R12 exhibits strength in Skills 1 and 2 but shows a marked deficiency in Skill 12. This distribution reflects that the SP rule is advantageous when tasks are highly specialized and require in-depth expertise. However, when the project context demands versatile team members, this rule may lead to inefficiencies due to the lack of comprehensive skill sets among newcomers. Therefore, project managers should carefully weigh the trade-off between specialization and versatility.
FG prioritizes solutions that minimize disparities in skill efficiency increment. This rule aims to ensure fairness in skill development among newcomers. Among all Pareto-optimal solutions, we identify one that yields the most balanced growth among newcomers and compare it with another solution that minimizes project makespan. Figure 10 shows the task assignments and participation schedules of newcomers under both solutions, based on a simulation result closest to the mean. Task indices are labeled within the bars to support direct comparison across the two solutions. It is evident that the fairness-oriented solution assigns more tasks to newcomers. However, it also leads to a 31.15% longer project duration compared to the makespan-oriented solution. Additionally, the fairness-oriented solution results in relatively uniform efficiency increments across newcomers, indicating balanced skill development. In contrast, the makespan-oriented solution exhibits significant disparities, with R11 achieving the lowest and R14 the highest increment.
TP prioritizes solutions that maximize the progress in specific skills, which is particularly useful when organizations need to enhance certain critical skills. In high-end equipment development, this approach allows team members to focus on developing targeted skill sets, equipping them to address complex challenges and drive innovation. By emphasizing skills that align with the latest technological advancements, the TP rule ensures that the team stays ahead of emerging technologies, providing a competitive advantage.

6. Conclusions

This paper presents a stochastic programming model to tackle the urgent need to simultaneously advance high-end equipment R&D projects and develop newcomers through on-the-job mentoring. To this end, the multi-skilled project scheduling problem with newcomer cultivation under uncertainty (MSPSP-NCU) is proposed, aiming to achieve both timely project delivery and effective skill development. This dual objective is realized by jointly optimizing task scheduling and workforce assignment. Considering the stochasticity of task durations and the high dimensionality introduced by the cross-product of these two decisions, we design an adaptive simulation optimization approach. The simulation module adaptively adjusts the sample size based on convergence feedback, enabling computational efficiency while maintaining evaluation accuracy. Meanwhile, the tailored NSGA-II with an adaptive evolutionary mechanism improves search efficiency and ensures a well-distributed Pareto front.
An aerospace component R&D project is conducted to validate the proposed approach. The results demonstrate that this approach identified a diverse and well-distributed Pareto front, offering a broad range of trade-off solutions between expected makespan and skill development. Further analysis of the Pareto-optimal solutions yields the following managerial insights for decision-makers: The solution with the highest skill development is achieved when all newcomers are assigned to the project, highlighting the potential of on-the-job mentoring in accelerating the growth of newcomers. To support more nuanced decision-making aligned with different organizational goals, we further propose four personalized selection rules. These rules enable decision-makers to select solutions that best balance operational performance with long-term human resource development.
The limitations of this paper and future research directions are outlined as follows: First, this paper models uncertain durations using predefined probability distributions, which may not fully capture the variability in the duration. Machine learning techniques offer a promising improvement by integrating real-time data and learning from past projects. Furthermore, incorporating generalized precedence relations into the model could better accommodate diverse project scheduling scenarios, allowing for more flexible task dependencies. Second, a more intelligent method for collecting and assessing individual skills should be explored for more accurate personnel evaluations. Additionally, a database should be developed to store and update personnel information, ensuring that the most up-to-date skill profiles are readily available for decision-making. Third, integrating these databases with the proposed approach through user-friendly interfaces would facilitate practical applications and improve the ease of assignment and project scheduling.

Author Contributions

Writing—original draft preparation, conceptualization, software, methodology, data curation, and formal analysis, Y.L.; writing—review and editing, supervision, and funding acquisition, R.D.; validation, supervision, and project administration, S.L.; writing—review and editing, software, and funding acquisition, L.W. All authors have read and agreed to the published version of the manuscript.

Funding

This work was supported by the National Natural Science Foundation of China (72171134, 72301159).

Data Availability Statement

The original contributions presented in this study are included in the article. Further inquiries can be directed to the corresponding author.

Acknowledgments

The authors thank the editors and anonymous reviewers for their help in improving the quality of the paper.

Conflicts of Interest

The authors declare no conflicts of interest.

References

  1. Liu, N.; Zhang, R.; Liu, B. Impact of Government Subsidy on Diagnostic Tests Decisions of Core Products in High-End Equipment Manufacturing. Comput. Ind. Eng. 2023, 177, 109042. [Google Scholar] [CrossRef]
  2. Cui, L.; Liu, X.; Lu, S.; Jia, Z. A Variable Neighborhood Search Approach for the Resource-Constrained Multi-Project Collaborative Scheduling Problem. Appl. Soft Comput. 2021, 107, 107480. [Google Scholar] [CrossRef]
  3. Chen, R.; Liang, C.; Gu, D.; Zhao, H. A Competence-Time-Quality Scheduling Model of Multi-Skilled Staff for IT Project Portfolio. Comput. Ind. Eng. 2020, 139, 106183. [Google Scholar] [CrossRef]
  4. Chen, Y.C. Enhancing Teaching Competence through Bidirectional Mentoring and Structured On-the-Job Training Model. Mentor. Tutoring Partnersh. Learn. 2018, 26, 267–288. [Google Scholar] [CrossRef]
  5. Van Peteghem, V.; Vanhoucke, M. Influence of Learning in Resource-Constrained Project Scheduling. Comput. Ind. Eng. 2015, 87, 569–579. [Google Scholar] [CrossRef]
  6. Bianco, L.; Caramia, M. An Exact Algorithm to Minimize the Makespan in Project Scheduling with Scarce Resources and Generalized Precedence Relations. Eur. J. Oper. Res. 2012, 219, 73–85. [Google Scholar] [CrossRef]
  7. Néron, E. Lower Bounds for a Multi-Skill Project Scheduling Problem. In Proceeding of the Eighth International Workshop on Project Management and Scheduling, Valencia, Spain, 3–5 April 2002; pp. 274–277. [Google Scholar]
  8. Bellenguez, O.; Néron, E. Lower Bounds for the Multi-Skill Project Scheduling Problem with Hierarchical Levels of Skills. In Proceedings of the International Conference on the Practice and Theory of Automated Timetabling, Pittsburgh, PA, USA, 18–20 August 2004; Burke, E., Trick, M., Eds.; Springer: Berlin/Heidelberg, Germany, 2004; pp. 229–243. [Google Scholar]
  9. Bahroun, Z.; As’Ad, R.; Tanash, M.; Athamneh, R. The Multi-Skilled Resource-Constrained Project Scheduling Problem: A Systematic Review and an Exploration of Future Landscapes. Manag. Syst. Prod. Eng. 2024, 32, 108–132. [Google Scholar] [CrossRef]
  10. Mozhdehi, S.; Baradaran, V.; Hosseinian, A.H. Multi-Skilled Resource-Constrained Multi-Project Scheduling Problem with Dexterity Improvement of Workforce. Autom. Constr. 2024, 162, 105360. [Google Scholar] [CrossRef]
  11. Yu, Y.; Xu, Z.; Liu, D.; Zhao, S. A Two-Stage Approach with Softmax Scoring Mechanism for a Multi-Project Scheduling Problem Sharing Multi-Skilled Staff. Expert Syst. Appl. 2022, 203, 117385. [Google Scholar] [CrossRef]
  12. Gutjahr, W.J.; Katzensteiner, S.; Reiter, P.; Stummer, C.; Denk, M. Competence-Driven Project Portfolio Selection, Scheduling and Staff Assignment. Cent. Eur. J. Oper. Res. 2008, 16, 281–306. [Google Scholar] [CrossRef]
  13. Wright, T.P. Factors Affecting the Cost of Engineering. J. Aeronaut. Sci. 1936, 3, 122–128. [Google Scholar] [CrossRef]
  14. Wu, M.C.; Sun, S.H. A Project Scheduling and Staff Assignment Model Considering Learning Effect. Int. J. Adv. Manuf. Technol. 2006, 28, 1190–1195. [Google Scholar] [CrossRef]
  15. Guo, Y.; Ji, J.; Ji, J.; Gong, D.; Cheng, J.; Shen, X. Firework-Based Software Project Scheduling Method Considering the Learning and Forgetting Effect. Soft Comput. 2019, 23, 5019–5034. [Google Scholar] [CrossRef]
  16. Hosseinian, A.H.; Baradaran, V. Modified Pareto Archived Evolution Strategy for the Multi-Skill Project Scheduling Problem with Generalized Precedence Relations. JIEMS J. Ind. Eng. Manag. Stud. 2020, 7, 59–86. [Google Scholar]
  17. Ammar, M.A.; Abdel-Maged, A.F. Modeling of LOB Scheduling with Learning Development Effect. Int. J. Constr. Manag. 2018, 18, 517–526. [Google Scholar] [CrossRef]
  18. Gutjahr, W.J.; Katzensteiner, S.; Reiter, P.; Stummer, C.; Denk, M. Multi-Objective Decision Analysis for Competence-Oriented Project Portfolio Selection. Eur. J. Oper. Res. 2010, 205, 670–679. [Google Scholar] [CrossRef]
  19. Chen, R.; Liang, C.; Gu, D.; Leung, J.Y.T. A Multi-Objective Model for Multi-Project Scheduling and Multi-Skilled Staff Assignment for IT Product Development Considering Competency Evolution. Int. J. Prod. Res. 2017, 55, 6207–6234. [Google Scholar] [CrossRef]
  20. Aghileh, M.; Tereso, A.; Alvelos, F.; Monteiro Lopes, M.O. Multi-Project Scheduling under Uncertainty and Resource Flexibility: A Systematic Literature Review. Prod. Manuf. Res. 2024, 12, 2319574. [Google Scholar] [CrossRef]
  21. Herroelen, W.; Leus, R. Project Scheduling under Uncertainty: Survey and Research Potentials. Eur. J. Oper. Res. 2005, 165, 289–306. [Google Scholar] [CrossRef]
  22. Hazır, Ö.; Ulusoy, G. A Classification and Review of Approaches and Methods for Modeling Uncertainty in Projects. Int. J. Prod. Econ. 2020, 223, 107522. [Google Scholar] [CrossRef]
  23. Slany, W. Fuzzy Scheduling; Christian Doppler Laboratory for Expert Systems: Wien, Austria, 1994. [Google Scholar]
  24. Van de Vonder, S.; Demeulemeester, E.; Herroelen, W. Proactive Heuristic Procedures for Robust Project Scheduling: An Experimental Analysis. Eur. J. Oper. Res. 2008, 189, 723–733. [Google Scholar] [CrossRef]
  25. Deblaere, F.; Demeulemeester, E.; Herroelen, W. Reactive Scheduling in the Multi-Mode RCPSP. Comput. Oper. Res. 2011, 38, 63–74. [Google Scholar] [CrossRef]
  26. Peng, W.; Lin, X.; Li, H. Critical Chain Based Proactive-Reactive Scheduling for Resource-Constrained Project Scheduling under Uncertainty. Expert Syst. Appl. 2023, 214, 119188. [Google Scholar] [CrossRef]
  27. Sobel, M.J.; Szmerekovsky, J.G.; Tilson, V. Scheduling Projects with Stochastic Activity Duration to Maximize Expected Net Present Value. Eur. J. Oper. Res. 2009, 198, 697–705. [Google Scholar] [CrossRef]
  28. Creemers, S. Minimizing the Expected Makespan of a Project with Stochastic Activity Durations under Resource Constraints. J. Sched. 2015, 18, 263–273. [Google Scholar] [CrossRef]
  29. Zhou, Y.; Miao, J.; Yan, B.; Zhang, Z. Stochastic Resource-Constrained Project Scheduling Problem with Time Varying Weather Conditions and an Improved Estimation of Distribution Algorithm. Comput. Ind. Eng. 2021, 157, 107322. [Google Scholar] [CrossRef]
  30. Chen, H.J.; Ding, G.; Zhang, J.; Li, R.; Jiang, L.; Qin, S. A Filtering Genetic Programming Framework for Stochastic Resource Constrained Multi-Project Scheduling Problem under New Project Insertions. Expert Syst. Appl. 2022, 198, 116911. [Google Scholar] [CrossRef]
  31. De Reyck, B.; Herroelen, W. A Branch-and-Bound Procedure for the Resource-Constrained Project Scheduling Problem with Generalized Precedence Relations. Eur. J. Oper. Res. 1998, 111, 152–174. [Google Scholar] [CrossRef]
  32. Alba, E.; Francisco Chicano, J. Software Project Management with GAs. Inf. Sci. 2007, 177, 2380–2401. [Google Scholar] [CrossRef]
  33. Snauwaert, J.; Vanhoucke, M. A New Algorithm for Resource-Constrained Project Scheduling with Breadth and Depth of Skills. Eur. J. Oper. Res. 2021, 292, 43–59. [Google Scholar] [CrossRef]
  34. Deb, K.; Agrawal, S.; Pratap, A.; Meyarivan, T. A Fast Elitist Non-Dominated Sorting Genetic Algorithm for Multi-Objective Optimization: NSGA-II. In Proceedings of the International Conference on Parallel Problem Solving from Nature, Paris, France, 18–20 September 2000; Volume 1917, pp. 849–858. [Google Scholar]
  35. Liu, J.; Chen, X. An Improved NSGA-II Algorithm Based on Crowding Distance Elimination Strategy. Int. J. Comput. Intell. Syst. 2019, 12, 513–518. [Google Scholar] [CrossRef]
  36. Miller, B.L.; Goldberg, D.E. Genetic Algorithms, Tournament Selection, and the Effects of Noise. Complex Syst. 1995, 9, 193–212. [Google Scholar]
  37. Mitchell, M. An Introduction to Genetic Algorithms; MIT Press: Cambridge, MA, USA, 1998. [Google Scholar]
  38. Alhijawi, B.; Awajan, A. Genetic Algorithms: Theory, Genetic Operators, Solutions, and Applications. Evol. Intell. 2024, 17, 1245–1256. [Google Scholar] [CrossRef]
  39. Kolisch, R. Serial and Parallel Resource-Constrained Project Scheduling Methods Revisited: Theory and Computation. Eur. J. Oper. Res. 1996, 90, 320–333. [Google Scholar] [CrossRef]
  40. Mashwani, W.; Salhi, A.; Jan, M.; Khanum, R.; Sulaiman, M. Impact Analysis of Crossovers in a Multi-Objective Evolutionary Algorithm. Sci. Int. 2015, 27, 4943–4956. [Google Scholar]
  41. Audet, C.; Bigeon, J.; Cartier, D.; Le Digabel, S.; Salomon, L. Performance Indicators in Multiobjective Optimization. Eur. J. Oper. Res. 2021, 292, 397–422. [Google Scholar] [CrossRef]
Figure 1. Illustration of the impact of active and idle time on skill efficiency.
Systems 13 00448 g001
Figure 2. Framework for the adaptive simulation–optimization approach.
Systems 13 00448 g002
Figure 3. Example to illustrate the solution coding.
Systems 13 00448 g003
Figure 4. Network of the D7N2 project.
Systems 13 00448 g004
Figure 5. Main effects plot of S/N ratios for project makespan.
Systems 13 00448 g005
Figure 6. Pareto front.
Systems 13 00448 g006
Figure 7. Evolution of makespan and skill efficiency improvement.
Systems 13 00448 g007
Figure 8. Comparison of average efficiencies for newcomers under two solutions.
Systems 13 00448 g008
Figure 9. Radar chart comparing skill efficiency across newcomers.
Systems 13 00448 g009
Figure 10. Comparison of newcomer task participation under two solutions.
Systems 13 00448 g010
Table 1. Overview of related literature and the position of our paper.
ReferencesScheduling Content 1Resource Attribute 2Learning
Effect
Uncertain DurationObjective 3Method 4Dataset
TSWAMSTHSE
[14] OCGAReal case
[5] MBGAUsing [31]
[17] MLOBReal case
[15] M, CMOFAUsing the generator of [32] and PSPLIB
[16] M, R, CMV-PAESPSPLIB
[10] MMBBOAiMOPSE
[12] WAEG, SEIMIP-HTReal case
[18] EG, SEINSGA-II, P-ACOReal case
[19] DT, DC, SEINSGA-IIReal case
[28] EMBSDPRPSPLIB
[29] EM, ENPVEDAPSPLIB and Real case
Our paperEM, SEIASOAReal case
1: TS = task scheduling; WA = workforce assignment. 2: MST = multiple skill types; HSE = heterogeneous skill efficiencies. 3: OC = outsourcing costs; M = makespan; C = cost; R = reworking risk; WAEG = weighted average of economic gains; SEI = skill efficiency increment; EG = economic gains; DT = development cycle time; DC = development costs; EM = expected makespan; ENPV = expected net present value. 4: GA = genetic algorithm; BGA = bi-population-based genetic algorithm; LOB = modified line-of-balance technique; MOFA = improved multi-objective firework algorithm; MV-PAES = modified Pareto archived evolution strategy; MBBOA = modified discrete variant of the biogeography-based optimization algorithm; MIP-HT = nonlinear mixed-integer program with heuristic techniques; NSGA-II = non-dominated sorting genetic algorithm II; P-ACO = Pareto ant colony optimization; BSDPR = backward stochastic dynamic programming recursion; EDA = improved estimation of distribution algorithm; ASOA = adaptive simulation–optimization approach.
Table 2. Notation.
Table 2. Notation.
CategorySymbolDescription
Indices and Sets I Set of tasks
I + Set of non-dummy tasks
E Set of edges
D i Set of precedence relations for task i , where i ' is a predecessor of i
N Directed graph representing the project network
R Set of available workers, R = R E R N
R N Set of newcomers (to be trained)
R E Set of experienced workers
S Set of skills
i , j Index of task, i = 1 ,   2 , I
r Index of worker, r = 1 ,   2 , R
s Index of skill, s = 1 ,   2 , S
t Index of time, t = 1 ,   2 , T
Parameters y i s Binary parameter to indicate if task i requires skill s , s S y i s = 1
z r s 0 Initial efficiency of worker r in skill s , z r s 0 ( 0,2 )
z m a x Upper bound of skill efficiency
l Learning percentage,   l ( 0,1 ]
f Forgetting percentage, f   [ 0,1 )
λ Learning factor calculated as l n   ( l ) / l n 2
η Forgetting factor calculated as l n   ( 1 f ) / l n 2
Auxiliary
variables
t s ~ i Start time of task i ,     t s ~ i 0
t e ~ i End time of task i ,   t e ~ i 0
d ~ i A random variable representing the uncertain duration of task i , modeled as d ~ i ~ l o g n o r m a l ( μ i ,   σ )
d ~ i a A random variable obtained by scaling d ~ i with the average efficiency of the assigned workers, d ~ i a > 0
ω i Average efficiency of workers assigned to task i , ω i ( 0,2 ]
d l Idle time since worker r last used skill s ,     d l 0
φ r s Efficiency increment factor based on the time worker r spent using skill s and idle time since last use.
z r s ( t ) Updated efficiency of worker r in skill s at time t ,     0 < z r s ( t )   z m a x
z r s t Efficiency increment of worker r in skill s at time t , 0 z r s t z m a x z r s t 1
p o s i Position of task i in the sequence, p o s i [ 1 , I ]
Decision
variables
x i r Binary variable to indicate if worker r works on the task i
u An ordered list of tasks, u = [ a 0 ,   a 1 , a I ]
Table 3. Summary of notations in the ASOA.
CategoryVariables/ParametersDescription
NSGA-II P 0 Initial population
g Generation index, g = 1 ,   2 ,   , G
P g Parents at generation g
O g Offspring at generation g
C g Combined population at generation g   (merged parent and offspring)
N P Population size
G Maximum number of generations
p C b Baseline crossover probability
p M b Baseline mutation probability
α Exploration reinforcement factor ( 0 < α 1 )
β Diversity preservation factor ( 0 < β 1 )
Simulation
Module
p Sampling index, p = 1 ,   2 ,    
c Count of consecutive samplings where the difference in means between the first p and p 1 samplings is below the threshold
ε Convergence threshold
N A Maximum number of simulations allowed
N I Minimum number of simulations is required before checking the convergence
N C The predefined number of consecutive samplings required for the mean difference to be below the threshold
M p Makespan of the schedule at the p -th sampling
M h Set of historical makespans recorded across all samplings
M p ¯ Mean makespan across the first p samplings
S E I p Skill efficiency increment at the p -th sampling
S E I h Set of historical skill efficiency increments recorded across all samplings
S E I p ¯ Mean skill efficiency increment across the first p samplings
Table 4. Expected duration of tasks.
Task
Index
Expected DurationTask
Index
Expected DurationTask
Index
Expected DurationTask
Index
Expected Duration
10216441966116
2562232421046264
396238843646364
4402448444064104
516256445406556
6802610446486624
724272447886756
856284048566848
932298049406916
1056309650807056
1188316451247132
1248328852727240
131043348538073104
14643410454247472
1516352455407572
16163616561047688
1748377257807732
1832382458967880
19104394859567940
2032403260104800
Table 5. Skill requirements for tasks.
Skill
Index
Skill TypesIndex of Tasks Requiring Such Skill Primarily
S1Engineering design 7 , 9 , 11 , 31 , 37 , 76
S2Certification and compliance 3 , 6 , 10 , 18 , 21 , 32 , 66
S3Simulation and modeling 14 , 22 , 36 , 48 , 59 , 67 , 75
S4Control systems 24 , 35 , 40 , 44 , 58 , 60 , 77
S5Fuel and combustion systems 13 , 39 , 42 , 45 , 47
S6System integration 15 , 50 , 51 , 55 , 64 , 70 , 73
S7Requirements analysis 2 , 19 , 23 , 26 , 33
S8Aerodynamic analysis 4 , 16 , 27 , 41 , 46 , 49 , 61 , 71 , 79
S9Performance testing 28 , 34 , 38 , 52 , 54 , 57 , 62
S10Material science 12 , 25 , 53 , 65 , 72 , 74
S11Manufacturing processes 8 ,   30 , 56 , 69 , 78
S12Thermodynamic analysis 5 , 17 , 20 , 29 , 43 , 63 , 68
Table 6. Skill efficiency of workers.
Skill
Index
Experienced WorkersNewcomers
R1R2R3R4R5R6R7R8R9R10R11R12R13R14
S10.81.00.82.01.81.41.00.81.01.00.20.20.40.2
S20.82.01.41.00.81.00.80.81.41.60.40.60.80.4
S31.81.60.81.00.81.02.01.40.81.60.40.60.20.6
S41.00.81.80.81.02.01.00.80.81.20.60.40.80.2
S51.60.81.41.41.61.20.60.80.82.00.20.80.20.8
S61.20.81.20.81.01.01.01.62.00.80.80.40.40.4
S70.61.21.00.82.01.41.80.80.80.80.80.40.20.4
S80.80.82.00.80.81.60.81.80.80.80.40.60.40.4
S91.81.00.61.20.80.81.01.80.82.00.40.40.20.2
S102.00.80.80.80.80.81.21.01.21.80.20.20.60.6
S111.01.20.81.81.20.81.61.41.21.20.60.60.40.4
S120.81.60.80.80.80.81.20.81.62.00.40.20.80.8
Table 7. Experimental design for parameter calibration.
Parameters *Parameter Levels
Level 1Level 2Level 3Level 4Level 5
N G 2550100200300 *
N P 20406080100 *
p C b 0.30.40.50.6 *0.7
p M b 0.050.100.15 *0.200.25
* α = 0.2; β = 0.1.
Table 8. Response table of S/N ratios for project makespan.
Level N G N P p C b p M b
18.1499.72713.23114.465
210.51812.82714.21113.774
314.11914.47114.55414.745
417.71616.00514.7313.989
520.0817.55113.85513.609
Delta11.9317.8241.4991.136
Rank1234
Table 9. Characteristics of the project.
Project
Scale
Task
Count
Network
Seriality *
Skill
Count
Worker Count
Experienced Workers Newcomers
Small case400.41252
Base case800.212104
Big case1200.212126
* The value is calculated as the ratio of the number of tasks on the longest path to the total number of tasks. The value closer to one indicates higher seriality, while the value closer to zero indicates higher parallelism.
Disclaimer/Publisher’s Note: The statements, opinions and data contained in all publications are solely those of the individual author(s) and contributor(s) and not of MDPI and/or the editor(s). MDPI and/or the editor(s) disclaim responsibility for any injury to people or property resulting from any ideas, methods, instructions or products referred to in the content.

